Olney, MD Map & Demographics
Olney Map
Olney Overview
$65,236
PER CAPITA INCOME
$186,230
AVG FAMILY INCOME
$166,541
AVG HOUSEHOLD INCOME
24.8%
WAGE / INCOME GAP [ % ]
75.2¢/ $1
WAGE / INCOME GAP [ $ ]
$11,883
FAMILY INCOME DEFICIT
0.38
INEQUALITY / GINI INDEX
35,522
TOTAL POPULATION
17,546
MALE POPULATION
17,976
FEMALE POPULATION
97.61
MALES / 100 FEMALES
102.45
FEMALES / 100 MALES
42.0
MEDIAN AGE
3.3
AVG FAMILY SIZE
3.0
AVG HOUSEHOLD SIZE
19,329
LABOR FORCE [ PEOPLE ]
69.1%
PERCENT IN LABOR FORCE
3.5%
UNEMPLOYMENT RATE
Olney Zip Codes
Olney Area Codes
Income in Olney
Income Overview in Olney
Per Capita Income in Olney is $65,236, while median incomes of families and households are $186,230 and $166,541 respectively.
| Characteristic | Number | Measure |
| Per Capita Income | 35,522 | $65,236 |
| Median Family Income | 9,745 | $186,230 |
| Mean Family Income | 9,745 | $208,683 |
| Median Household Income | 11,928 | $166,541 |
| Mean Household Income | 11,928 | $190,990 |
| Income Deficit | 9,745 | $11,883 |
| Wage / Income Gap (%) | 35,522 | 24.85% |
| Wage / Income Gap ($) | 35,522 | 75.15¢ per $1 |
| Gini / Inequality Index | 35,522 | 0.38 |
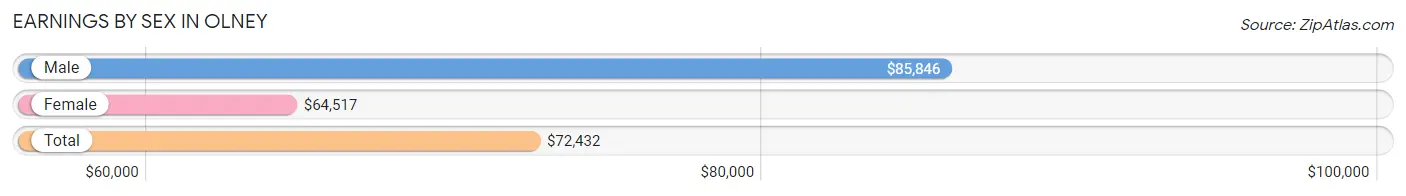
Earnings by Sex in Olney
Average Earnings in Olney are $72,432, $85,846 for men and $64,517 for women, a difference of 24.8%.
| Sex | Number | Average Earnings |
| Male | 10,091 (50.5%) | $85,846 |
| Female | 9,882 (49.5%) | $64,517 |
| Total | 19,973 (100.0%) | $72,432 |
Earnings by Sex by Income Bracket in Olney
The most common earnings brackets in Olney are $100,000+ for men (4,474 | 44.3%) and $100,000+ for women (3,101 | 31.4%).
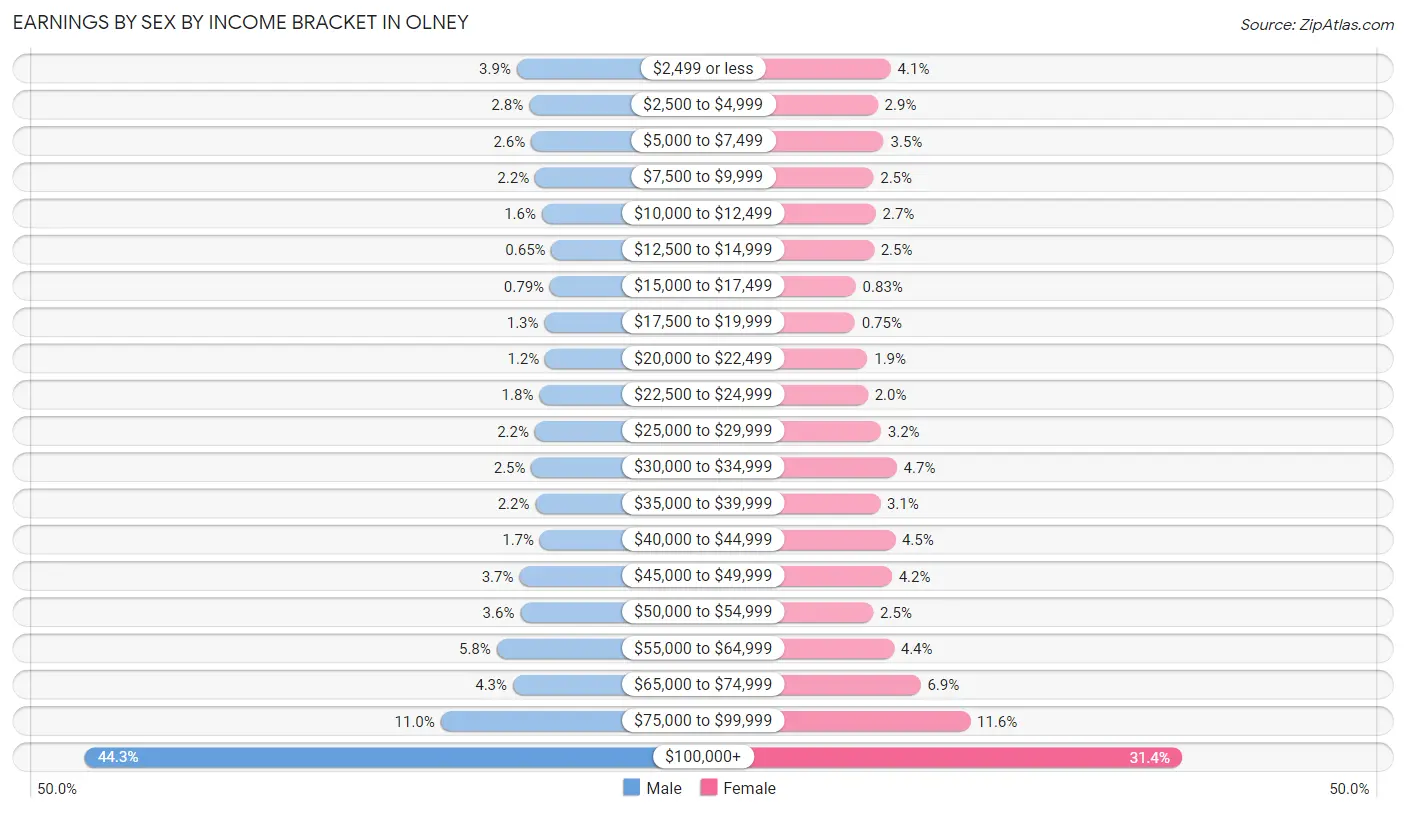
| Income | Male | Female |
| $2,499 or less | 394 (3.9%) | 406 (4.1%) |
| $2,500 to $4,999 | 278 (2.8%) | 286 (2.9%) |
| $5,000 to $7,499 | 258 (2.6%) | 341 (3.5%) |
| $7,500 to $9,999 | 221 (2.2%) | 245 (2.5%) |
| $10,000 to $12,499 | 156 (1.5%) | 267 (2.7%) |
| $12,500 to $14,999 | 66 (0.6%) | 249 (2.5%) |
| $15,000 to $17,499 | 80 (0.8%) | 82 (0.8%) |
| $17,500 to $19,999 | 132 (1.3%) | 74 (0.7%) |
| $20,000 to $22,499 | 125 (1.2%) | 190 (1.9%) |
| $22,500 to $24,999 | 181 (1.8%) | 194 (2.0%) |
| $25,000 to $29,999 | 223 (2.2%) | 315 (3.2%) |
| $30,000 to $34,999 | 255 (2.5%) | 461 (4.7%) |
| $35,000 to $39,999 | 218 (2.2%) | 307 (3.1%) |
| $40,000 to $44,999 | 175 (1.7%) | 446 (4.5%) |
| $45,000 to $49,999 | 369 (3.7%) | 416 (4.2%) |
| $50,000 to $54,999 | 360 (3.6%) | 244 (2.5%) |
| $55,000 to $64,999 | 583 (5.8%) | 435 (4.4%) |
| $65,000 to $74,999 | 430 (4.3%) | 682 (6.9%) |
| $75,000 to $99,999 | 1,113 (11.0%) | 1,141 (11.6%) |
| $100,000+ | 4,474 (44.3%) | 3,101 (31.4%) |
| Total | 10,091 (100.0%) | 9,882 (100.0%) |
Earnings by Sex by Educational Attainment in Olney
Average earnings in Olney are $100,380 for men and $70,676 for women, a difference of 29.6%. Men with an educational attainment of graduate degree enjoy the highest average annual earnings of $126,667, while those with less than high school education earn the least with $46,046. Women with an educational attainment of graduate degree earn the most with the average annual earnings of $109,464, while those with high school diploma education have the smallest earnings of $33,813.
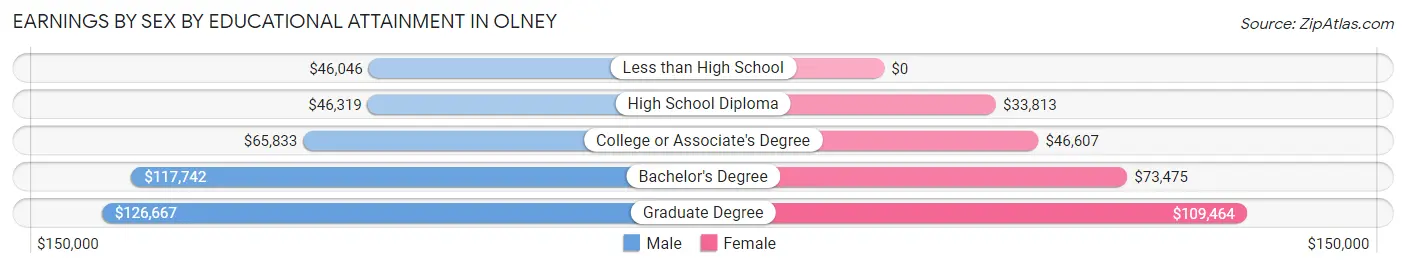
| Educational Attainment | Male Income | Female Income |
| Less than High School | $46,046 | $0 |
| High School Diploma | $46,319 | $33,813 |
| College or Associate's Degree | $65,833 | $46,607 |
| Bachelor's Degree | $117,742 | $73,475 |
| Graduate Degree | $126,667 | $109,464 |
| Total | $100,380 | $70,676 |
Family Income in Olney
Family Income Brackets in Olney
According to the Olney family income data, there are 4,424 families falling into the $200,000+ income range, which is the most common income bracket and makes up 45.4% of all families. Conversely, the $10,000 to $14,999 income bracket is the least frequent group with only 68 families (0.7%) belonging to this category.
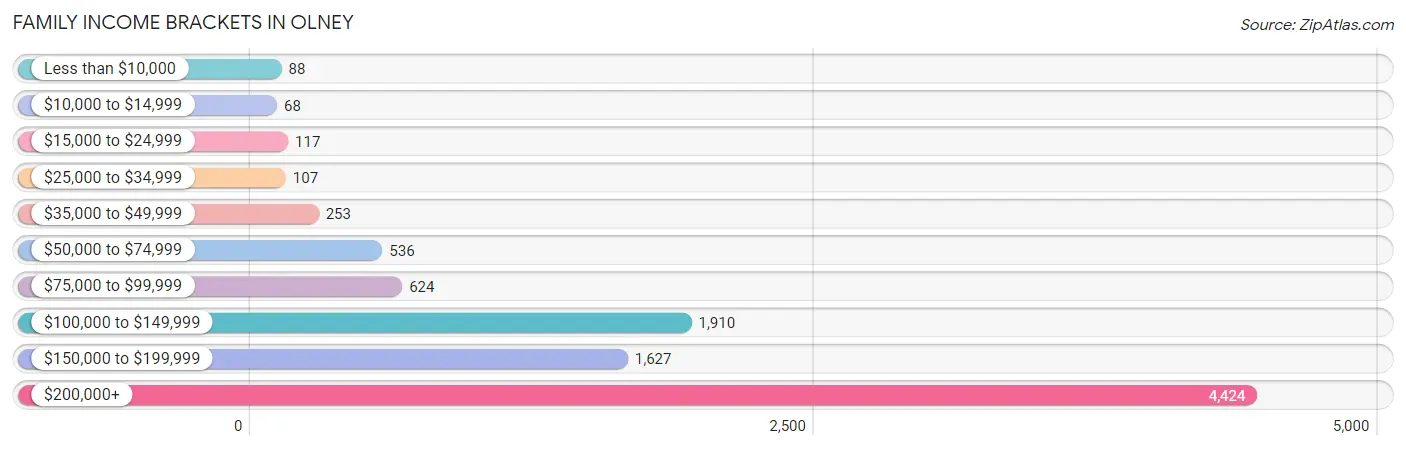
| Income Bracket | # Families | % Families |
| Less than $10,000 | 88 | 0.9% |
| $10,000 to $14,999 | 68 | 0.7% |
| $15,000 to $24,999 | 117 | 1.2% |
| $25,000 to $34,999 | 107 | 1.1% |
| $35,000 to $49,999 | 253 | 2.6% |
| $50,000 to $74,999 | 536 | 5.5% |
| $75,000 to $99,999 | 624 | 6.4% |
| $100,000 to $149,999 | 1,910 | 19.6% |
| $150,000 to $199,999 | 1,627 | 16.7% |
| $200,000+ | 4,424 | 45.4% |
Family Income by Famaliy Size in Olney
7+ person families (57 | 0.6%) account for the highest median family income in Olney with $250,001 per family, while 2-person families (3,728 | 38.3%) have the highest median income of $76,420 per family member.
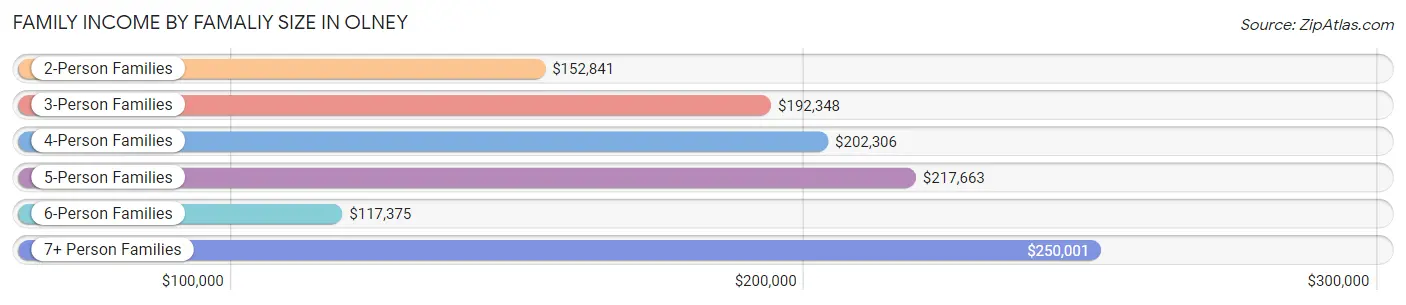
| Income Bracket | # Families | Median Income |
| 2-Person Families | 3,728 (38.3%) | $152,841 |
| 3-Person Families | 2,248 (23.1%) | $192,348 |
| 4-Person Families | 2,505 (25.7%) | $202,306 |
| 5-Person Families | 941 (9.7%) | $217,663 |
| 6-Person Families | 266 (2.7%) | $117,375 |
| 7+ Person Families | 57 (0.6%) | $250,001 |
| Total | 9,745 (100.0%) | $186,230 |
Family Income by Number of Earners in Olney
The median family income in Olney is $186,230, with families comprising 3+ earners (1,800) having the highest median family income of $221,125, while families with no earners (1,107) have the lowest median family income of $114,159, accounting for 18.5% and 11.4% of families, respectively.
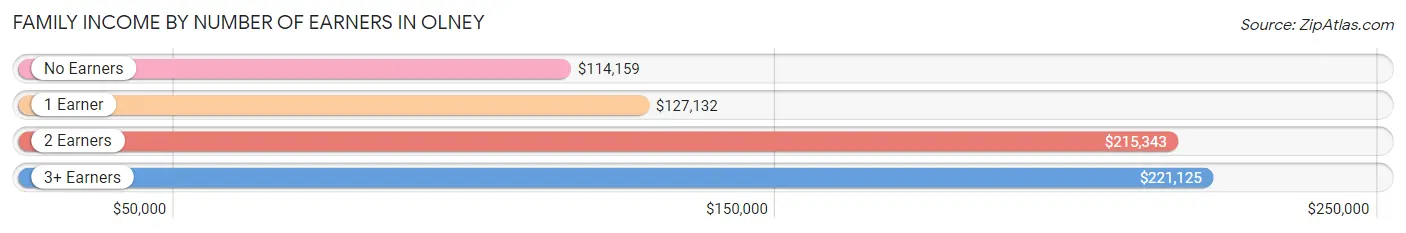
| Number of Earners | # Families | Median Income |
| No Earners | 1,107 (11.4%) | $114,159 |
| 1 Earner | 2,035 (20.9%) | $127,132 |
| 2 Earners | 4,803 (49.3%) | $215,343 |
| 3+ Earners | 1,800 (18.5%) | $221,125 |
| Total | 9,745 (100.0%) | $186,230 |
Household Income in Olney
Household Income Brackets in Olney
With 4,700 households falling in the category, the $200,000+ income range is the most frequent in Olney, accounting for 39.4% of all households. In contrast, only 155 households (1.3%) fall into the $10,000 to $14,999 income bracket, making it the least populous group.
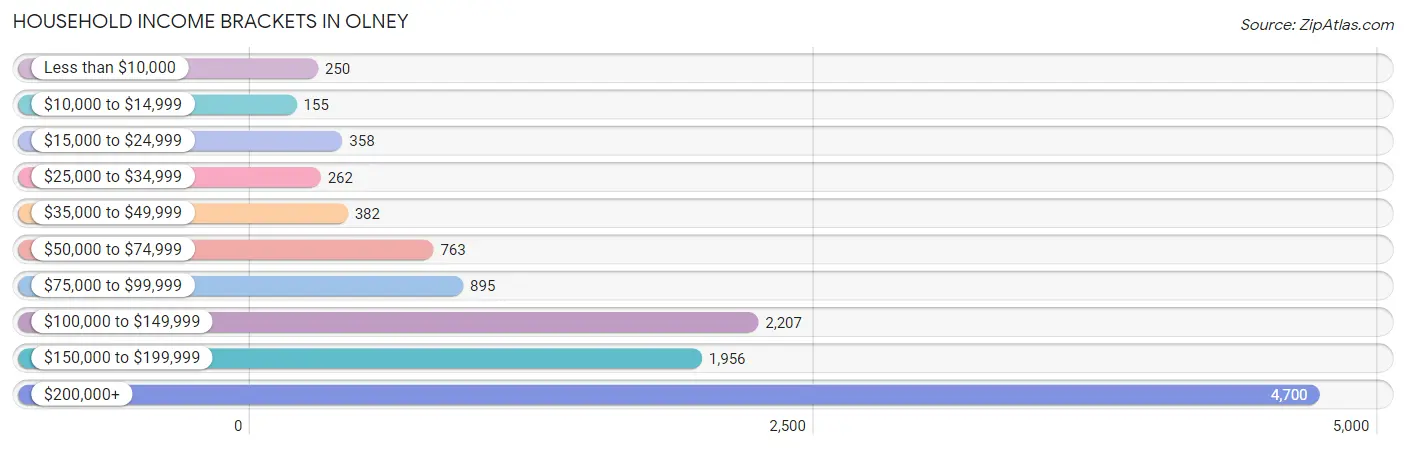
| Income Bracket | # Households | % Households |
| Less than $10,000 | 250 | 2.1% |
| $10,000 to $14,999 | 155 | 1.3% |
| $15,000 to $24,999 | 358 | 3.0% |
| $25,000 to $34,999 | 262 | 2.2% |
| $35,000 to $49,999 | 382 | 3.2% |
| $50,000 to $74,999 | 763 | 6.4% |
| $75,000 to $99,999 | 895 | 7.5% |
| $100,000 to $149,999 | 2,207 | 18.5% |
| $150,000 to $199,999 | 1,956 | 16.4% |
| $200,000+ | 4,700 | 39.4% |
Household Income by Householder Age in Olney
The median household income in Olney is $166,541, with the highest median household income of $192,459 found in the 45 to 64 years age bracket for the primary householder. A total of 5,634 households (47.2%) fall into this category. Meanwhile, the 15 to 24 years age bracket for the primary householder has the lowest median household income of $0, with 20 households (0.2%) in this group.
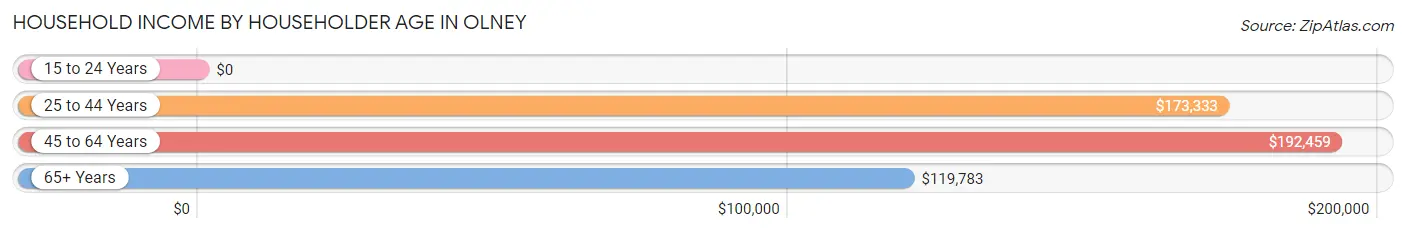
| Income Bracket | # Households | Median Income |
| 15 to 24 Years | 20 (0.2%) | $0 |
| 25 to 44 Years | 3,012 (25.3%) | $173,333 |
| 45 to 64 Years | 5,634 (47.2%) | $192,459 |
| 65+ Years | 3,262 (27.4%) | $119,783 |
| Total | 11,928 (100.0%) | $166,541 |
Poverty in Olney
Income Below Poverty by Sex and Age in Olney
With 4.1% poverty level for males and 4.0% for females among the residents of Olney, 16 and 17 year old males and 75 year old and over females are the most vulnerable to poverty, with 168 males (21.0%) and 146 females (10.3%) in their respective age groups living below the poverty level.
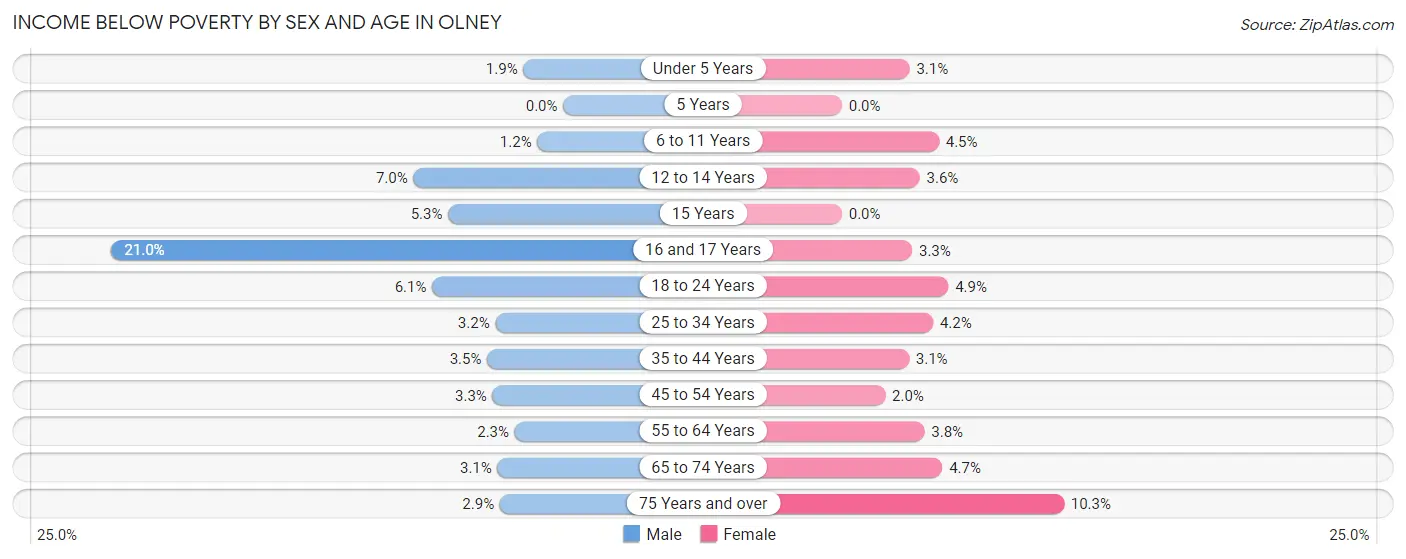
| Age Bracket | Male | Female |
| Under 5 Years | 18 (1.8%) | 33 (3.1%) |
| 5 Years | 0 (0.0%) | 0 (0.0%) |
| 6 to 11 Years | 20 (1.2%) | 54 (4.5%) |
| 12 to 14 Years | 73 (7.0%) | 24 (3.6%) |
| 15 Years | 11 (5.3%) | 0 (0.0%) |
| 16 and 17 Years | 168 (21.0%) | 19 (3.3%) |
| 18 to 24 Years | 85 (6.1%) | 58 (4.9%) |
| 25 to 34 Years | 43 (3.2%) | 72 (4.2%) |
| 35 to 44 Years | 79 (3.5%) | 71 (3.1%) |
| 45 to 54 Years | 84 (3.3%) | 54 (2.0%) |
| 55 to 64 Years | 54 (2.2%) | 105 (3.8%) |
| 65 to 74 Years | 49 (3.0%) | 87 (4.7%) |
| 75 Years and over | 31 (2.9%) | 146 (10.3%) |
| Total | 715 (4.1%) | 723 (4.0%) |
Income Above Poverty by Sex and Age in Olney
According to the poverty statistics in Olney, males aged 5 years and females aged 5 years are the age groups that are most secure financially, with 100.0% of males and 100.0% of females in these age groups living above the poverty line.
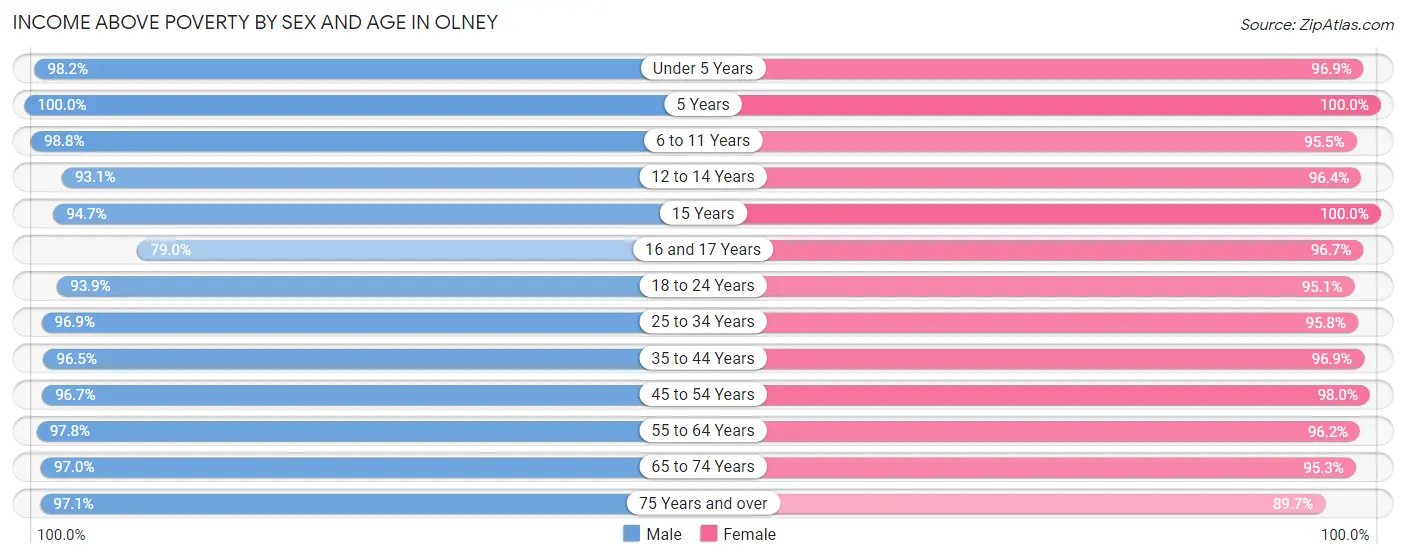
| Age Bracket | Male | Female |
| Under 5 Years | 956 (98.2%) | 1,018 (96.9%) |
| 5 Years | 150 (100.0%) | 211 (100.0%) |
| 6 to 11 Years | 1,648 (98.8%) | 1,146 (95.5%) |
| 12 to 14 Years | 978 (93.0%) | 640 (96.4%) |
| 15 Years | 195 (94.7%) | 301 (100.0%) |
| 16 and 17 Years | 633 (79.0%) | 563 (96.7%) |
| 18 to 24 Years | 1,312 (93.9%) | 1,117 (95.1%) |
| 25 to 34 Years | 1,324 (96.9%) | 1,629 (95.8%) |
| 35 to 44 Years | 2,160 (96.5%) | 2,215 (96.9%) |
| 45 to 54 Years | 2,479 (96.7%) | 2,631 (98.0%) |
| 55 to 64 Years | 2,342 (97.8%) | 2,633 (96.2%) |
| 65 to 74 Years | 1,555 (97.0%) | 1,780 (95.3%) |
| 75 Years and over | 1,025 (97.1%) | 1,272 (89.7%) |
| Total | 16,757 (95.9%) | 17,156 (96.0%) |
Income Below Poverty Among Married-Couple Families in Olney
The poverty statistics for married-couple families in Olney show that 1.6% or 135 of the total 8,252 families live below the poverty line. Families with 3 or 4 children have the highest poverty rate of 2.8%, comprising of 16 families. On the other hand, families with 5 or more children have the lowest poverty rate of 0.0%, which includes 0 families.
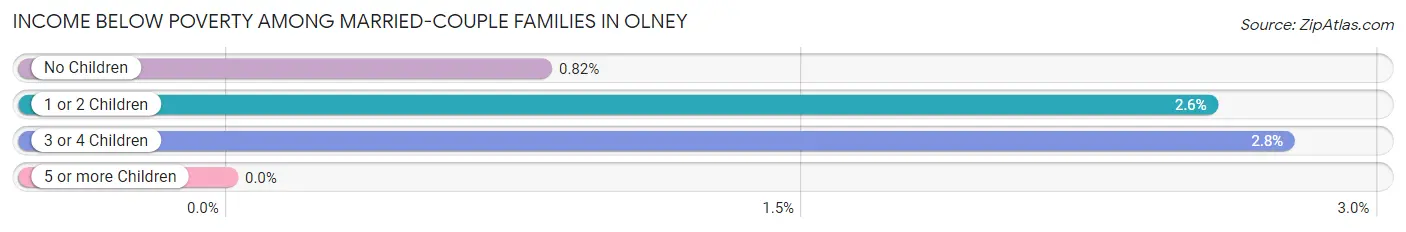
| Children | Above Poverty | Below Poverty |
| No Children | 4,349 (99.2%) | 36 (0.8%) |
| 1 or 2 Children | 3,157 (97.4%) | 83 (2.6%) |
| 3 or 4 Children | 564 (97.2%) | 16 (2.8%) |
| 5 or more Children | 47 (100.0%) | 0 (0.0%) |
| Total | 8,117 (98.4%) | 135 (1.6%) |
Income Below Poverty Among Single-Parent Households in Olney
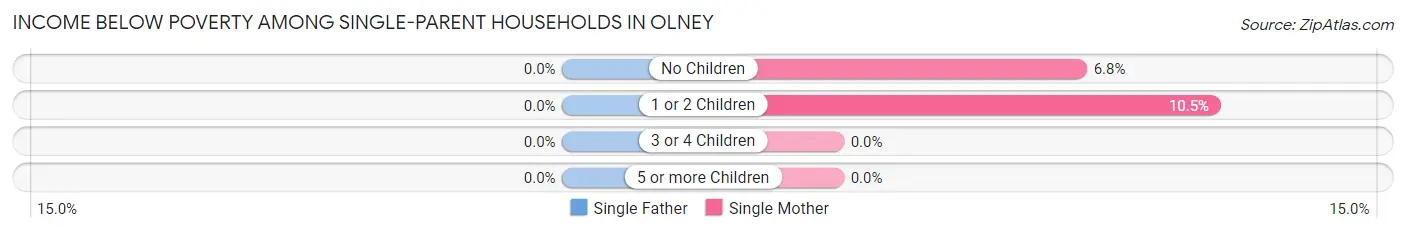
| Children | Single Father | Single Mother |
| No Children | 0 (0.0%) | 38 (6.8%) |
| 1 or 2 Children | 0 (0.0%) | 64 (10.5%) |
| 3 or 4 Children | 0 (0.0%) | 0 (0.0%) |
| 5 or more Children | 0 (0.0%) | 0 (0.0%) |
| Total | 0 (0.0%) | 102 (8.1%) |
Income Below Poverty Among Married-Couple vs Single-Parent Households in Olney
The poverty data for Olney shows that 135 of the married-couple family households (1.6%) and 102 of the single-parent households (6.8%) are living below the poverty level. Within the married-couple family households, those with 3 or 4 children have the highest poverty rate, with 16 households (2.8%) falling below the poverty line. Among the single-parent households, those with 1 or 2 children have the highest poverty rate, with 64 household (8.4%) living below poverty.
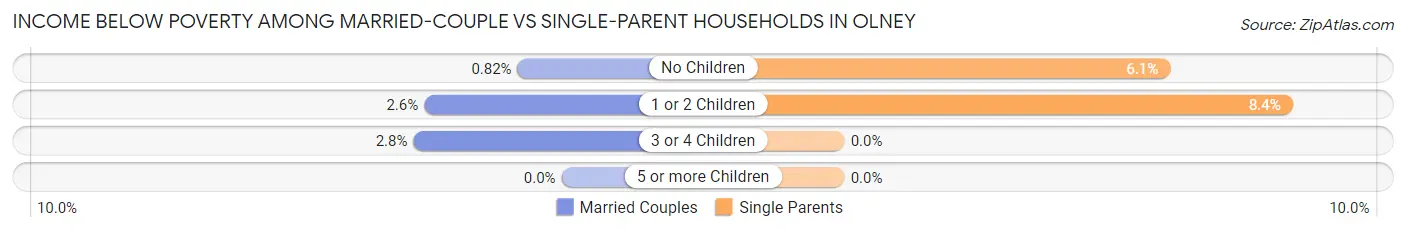
| Children | Married-Couple Families | Single-Parent Households |
| No Children | 36 (0.8%) | 38 (6.1%) |
| 1 or 2 Children | 83 (2.6%) | 64 (8.4%) |
| 3 or 4 Children | 16 (2.8%) | 0 (0.0%) |
| 5 or more Children | 0 (0.0%) | 0 (0.0%) |
| Total | 135 (1.6%) | 102 (6.8%) |
Race in Olney
The most populous races in Olney are White / Caucasian (21,475 | 60.5%), Black / African American (4,732 | 13.3%), and Asian (4,603 | 13.0%).
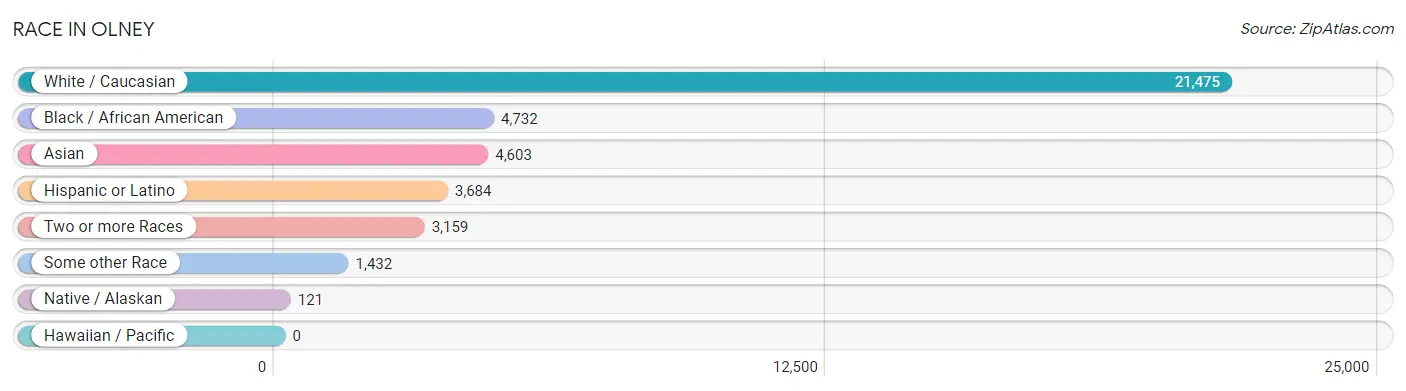
| Race | # Population | % Population |
| Asian | 4,603 | 13.0% |
| Black / African American | 4,732 | 13.3% |
| Hawaiian / Pacific | 0 | 0.0% |
| Hispanic or Latino | 3,684 | 10.4% |
| Native / Alaskan | 121 | 0.3% |
| White / Caucasian | 21,475 | 60.5% |
| Two or more Races | 3,159 | 8.9% |
| Some other Race | 1,432 | 4.0% |
| Total | 35,522 | 100.0% |
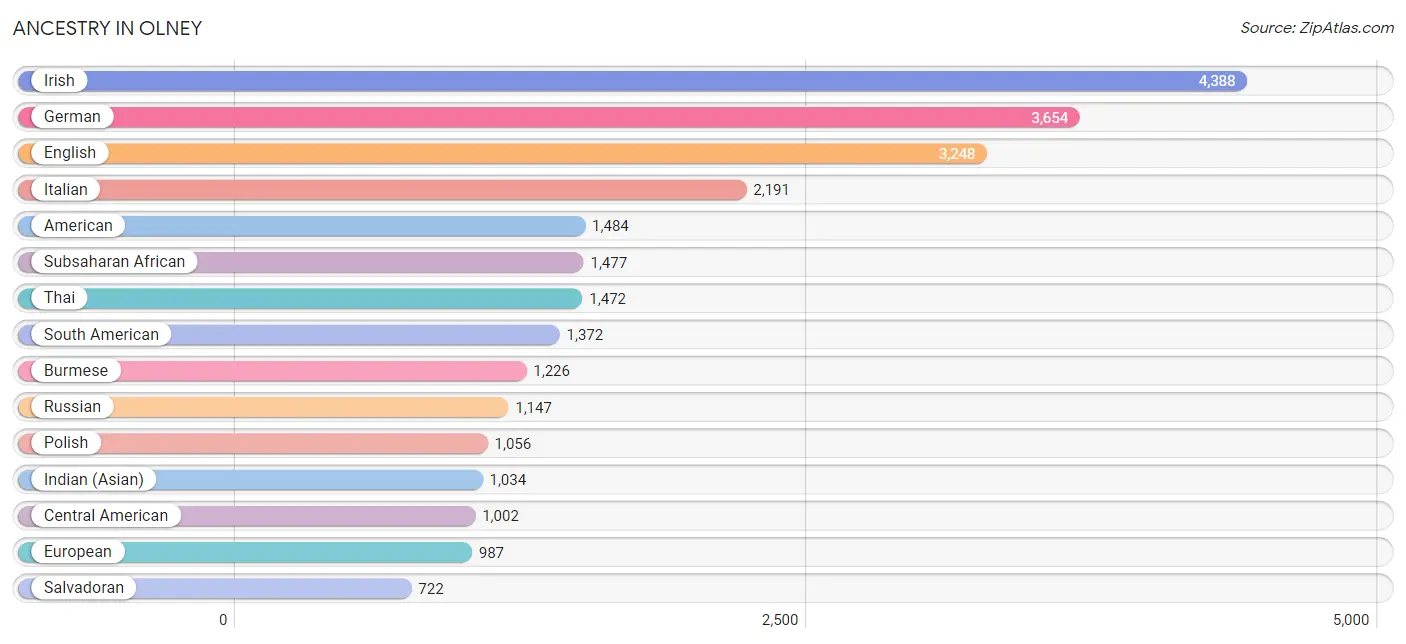
Ancestry in Olney
The most populous ancestries reported in Olney are Irish (4,388 | 12.3%), German (3,654 | 10.3%), English (3,248 | 9.1%), Italian (2,191 | 6.2%), and American (1,484 | 4.2%), together accounting for 42.1% of all Olney residents.
| Ancestry | # Population | % Population |
| Afghan | 36 | 0.1% |
| African | 516 | 1.5% |
| Alaska Native | 11 | 0.0% |
| Albanian | 42 | 0.1% |
| American | 1,484 | 4.2% |
| Arab | 355 | 1.0% |
| Argentinean | 151 | 0.4% |
| Armenian | 39 | 0.1% |
| Austrian | 60 | 0.2% |
| Bhutanese | 62 | 0.2% |
| Blackfeet | 210 | 0.6% |
| Bolivian | 115 | 0.3% |
| Brazilian | 145 | 0.4% |
| British | 182 | 0.5% |
| Burmese | 1,226 | 3.5% |
| Cajun | 12 | 0.0% |
| Canadian | 83 | 0.2% |
| Central American | 1,002 | 2.8% |
| Central American Indian | 61 | 0.2% |
| Cherokee | 8 | 0.0% |
| Chilean | 110 | 0.3% |
| Colombian | 506 | 1.4% |
| Costa Rican | 79 | 0.2% |
| Croatian | 13 | 0.0% |
| Cuban | 124 | 0.4% |
| Cypriot | 11 | 0.0% |
| Czech | 289 | 0.8% |
| Czechoslovakian | 11 | 0.0% |
| Danish | 69 | 0.2% |
| Dutch | 311 | 0.9% |
| Eastern European | 573 | 1.6% |
| Ecuadorian | 14 | 0.0% |
| Egyptian | 108 | 0.3% |
| English | 3,248 | 9.1% |
| Estonian | 14 | 0.0% |
| Ethiopian | 540 | 1.5% |
| European | 987 | 2.8% |
| Filipino | 107 | 0.3% |
| Finnish | 223 | 0.6% |
| French | 518 | 1.5% |
| French Canadian | 165 | 0.5% |
| German | 3,654 | 10.3% |
| Ghanaian | 9 | 0.0% |
| Greek | 547 | 1.5% |
| Guatemalan | 161 | 0.4% |
| Guyanese | 131 | 0.4% |
| Honduran | 5 | 0.0% |
| Hungarian | 172 | 0.5% |
| Icelander | 58 | 0.2% |
| Indian (Asian) | 1,034 | 2.9% |
| Indonesian | 266 | 0.7% |
| Iranian | 259 | 0.7% |
| Irish | 4,388 | 12.3% |
| Iroquois | 9 | 0.0% |
| Israeli | 6 | 0.0% |
| Italian | 2,191 | 6.2% |
| Jamaican | 277 | 0.8% |
| Japanese | 30 | 0.1% |
| Jordanian | 43 | 0.1% |
| Kenyan | 285 | 0.8% |
| Korean | 602 | 1.7% |
| Latvian | 21 | 0.1% |
| Lebanese | 163 | 0.5% |
| Liberian | 30 | 0.1% |
| Lithuanian | 258 | 0.7% |
| Lumbee | 11 | 0.0% |
| Mexican | 460 | 1.3% |
| Mexican American Indian | 9 | 0.0% |
| Moroccan | 13 | 0.0% |
| Nicaraguan | 35 | 0.1% |
| Nigerian | 31 | 0.1% |
| Northern European | 240 | 0.7% |
| Norwegian | 254 | 0.7% |
| Pakistani | 69 | 0.2% |
| Palestinian | 12 | 0.0% |
| Paraguayan | 7 | 0.0% |
| Peruvian | 350 | 1.0% |
| Polish | 1,056 | 3.0% |
| Portuguese | 206 | 0.6% |
| Pueblo | 21 | 0.1% |
| Puerto Rican | 217 | 0.6% |
| Romanian | 19 | 0.1% |
| Russian | 1,147 | 3.2% |
| Salvadoran | 722 | 2.0% |
| Scandinavian | 114 | 0.3% |
| Scotch-Irish | 280 | 0.8% |
| Scottish | 657 | 1.8% |
| Serbian | 48 | 0.1% |
| Sierra Leonean | 13 | 0.0% |
| Slavic | 17 | 0.1% |
| Slovak | 137 | 0.4% |
| South African | 18 | 0.1% |
| South American | 1,372 | 3.9% |
| South American Indian | 18 | 0.1% |
| Spaniard | 88 | 0.3% |
| Spanish | 139 | 0.4% |
| Sri Lankan | 366 | 1.0% |
| Subsaharan African | 1,477 | 4.2% |
| Swedish | 252 | 0.7% |
| Swiss | 121 | 0.3% |
| Syrian | 16 | 0.1% |
| Thai | 1,472 | 4.1% |
| Trinidadian and Tobagonian | 60 | 0.2% |
| Turkish | 57 | 0.2% |
| U.S. Virgin Islander | 12 | 0.0% |
| Ukrainian | 264 | 0.7% |
| Venezuelan | 32 | 0.1% |
| Vietnamese | 158 | 0.4% |
| Welsh | 238 | 0.7% |
| West Indian | 224 | 0.6% | View All 110 Rows |
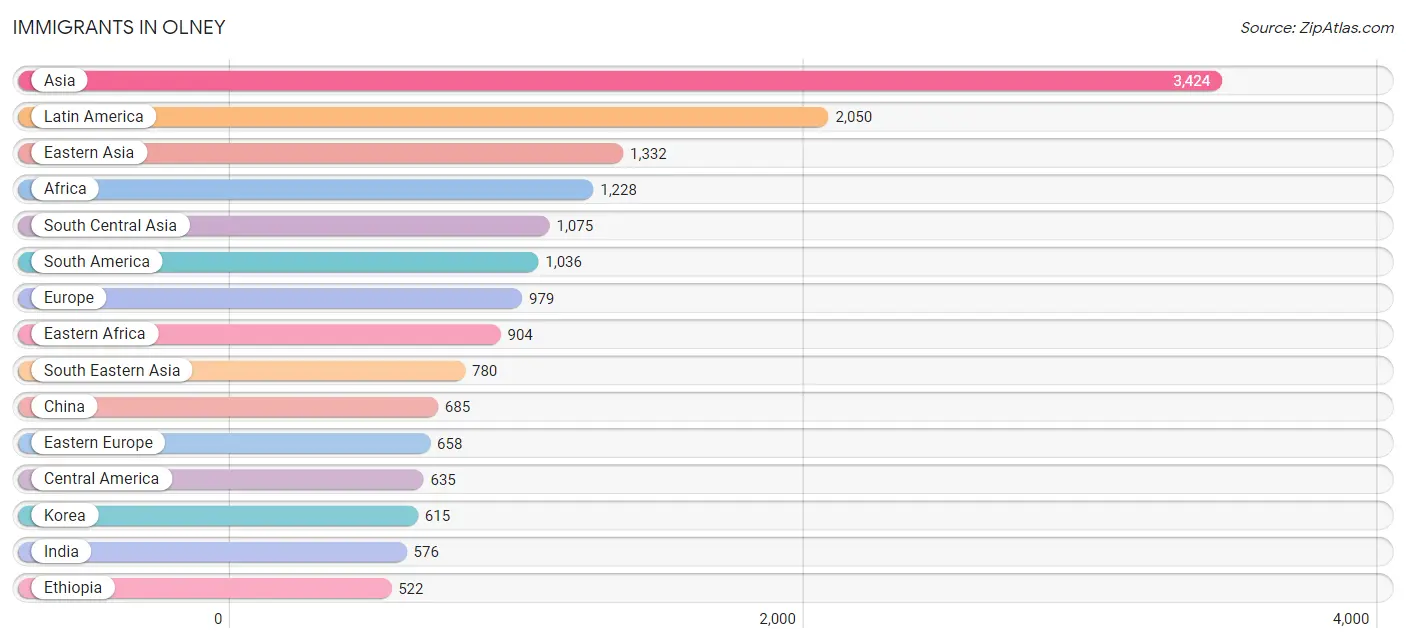
Immigrants in Olney
The most numerous immigrant groups reported in Olney came from Asia (3,424 | 9.6%), Latin America (2,050 | 5.8%), Eastern Asia (1,332 | 3.7%), Africa (1,228 | 3.5%), and South Central Asia (1,075 | 3.0%), together accounting for 25.7% of all Olney residents.
| Immigration Origin | # Population | % Population |
| Afghanistan | 35 | 0.1% |
| Africa | 1,228 | 3.5% |
| Albania | 42 | 0.1% |
| Argentina | 21 | 0.1% |
| Asia | 3,424 | 9.6% |
| Australia | 75 | 0.2% |
| Bahamas | 27 | 0.1% |
| Bangladesh | 112 | 0.3% |
| Belarus | 16 | 0.1% |
| Bolivia | 106 | 0.3% |
| Brazil | 172 | 0.5% |
| Cambodia | 24 | 0.1% |
| Cameroon | 38 | 0.1% |
| Canada | 170 | 0.5% |
| Caribbean | 379 | 1.1% |
| Central America | 635 | 1.8% |
| Chile | 105 | 0.3% |
| China | 685 | 1.9% |
| Colombia | 202 | 0.6% |
| Costa Rica | 86 | 0.2% |
| Cuba | 49 | 0.1% |
| Czechoslovakia | 7 | 0.0% |
| Eastern Africa | 904 | 2.5% |
| Eastern Asia | 1,332 | 3.7% |
| Eastern Europe | 658 | 1.8% |
| Ecuador | 7 | 0.0% |
| Egypt | 34 | 0.1% |
| El Salvador | 319 | 0.9% |
| England | 43 | 0.1% |
| Eritrea | 87 | 0.2% |
| Ethiopia | 522 | 1.5% |
| Europe | 979 | 2.8% |
| France | 13 | 0.0% |
| Germany | 37 | 0.1% |
| Greece | 10 | 0.0% |
| Guatemala | 69 | 0.2% |
| Guyana | 120 | 0.3% |
| Honduras | 9 | 0.0% |
| Hong Kong | 40 | 0.1% |
| Hungary | 8 | 0.0% |
| India | 576 | 1.6% |
| Indonesia | 6 | 0.0% |
| Iran | 152 | 0.4% |
| Ireland | 30 | 0.1% |
| Israel | 11 | 0.0% |
| Italy | 33 | 0.1% |
| Jamaica | 246 | 0.7% |
| Japan | 32 | 0.1% |
| Jordan | 40 | 0.1% |
| Kazakhstan | 14 | 0.0% |
| Kenya | 254 | 0.7% |
| Korea | 615 | 1.7% |
| Kuwait | 54 | 0.2% |
| Laos | 9 | 0.0% |
| Latin America | 2,050 | 5.8% |
| Lebanon | 14 | 0.0% |
| Liberia | 119 | 0.3% |
| Lithuania | 68 | 0.2% |
| Malaysia | 10 | 0.0% |
| Mexico | 107 | 0.3% |
| Middle Africa | 38 | 0.1% |
| Moldova | 8 | 0.0% |
| Nepal | 17 | 0.1% |
| Nicaragua | 35 | 0.1% |
| Nigeria | 64 | 0.2% |
| Northern Africa | 34 | 0.1% |
| Northern Europe | 185 | 0.5% |
| Norway | 12 | 0.0% |
| Oceania | 75 | 0.2% |
| Pakistan | 25 | 0.1% |
| Panama | 10 | 0.0% |
| Peru | 280 | 0.8% |
| Philippines | 235 | 0.7% |
| Poland | 92 | 0.3% |
| Portugal | 34 | 0.1% |
| Romania | 12 | 0.0% |
| Russia | 165 | 0.5% |
| Sierra Leone | 29 | 0.1% |
| South Africa | 26 | 0.1% |
| South America | 1,036 | 2.9% |
| South Central Asia | 1,075 | 3.0% |
| South Eastern Asia | 780 | 2.2% |
| Southern Europe | 86 | 0.2% |
| Spain | 9 | 0.0% |
| Sri Lanka | 113 | 0.3% |
| Syria | 33 | 0.1% |
| Taiwan | 226 | 0.6% |
| Thailand | 26 | 0.1% |
| Trinidad and Tobago | 18 | 0.1% |
| Turkey | 19 | 0.1% |
| Uganda | 32 | 0.1% |
| Ukraine | 99 | 0.3% |
| Uzbekistan | 31 | 0.1% |
| Venezuela | 16 | 0.1% |
| Vietnam | 228 | 0.6% |
| Western Africa | 212 | 0.6% |
| Western Asia | 217 | 0.6% |
| Western Europe | 50 | 0.1% |
| Yemen | 32 | 0.1% | View All 99 Rows |
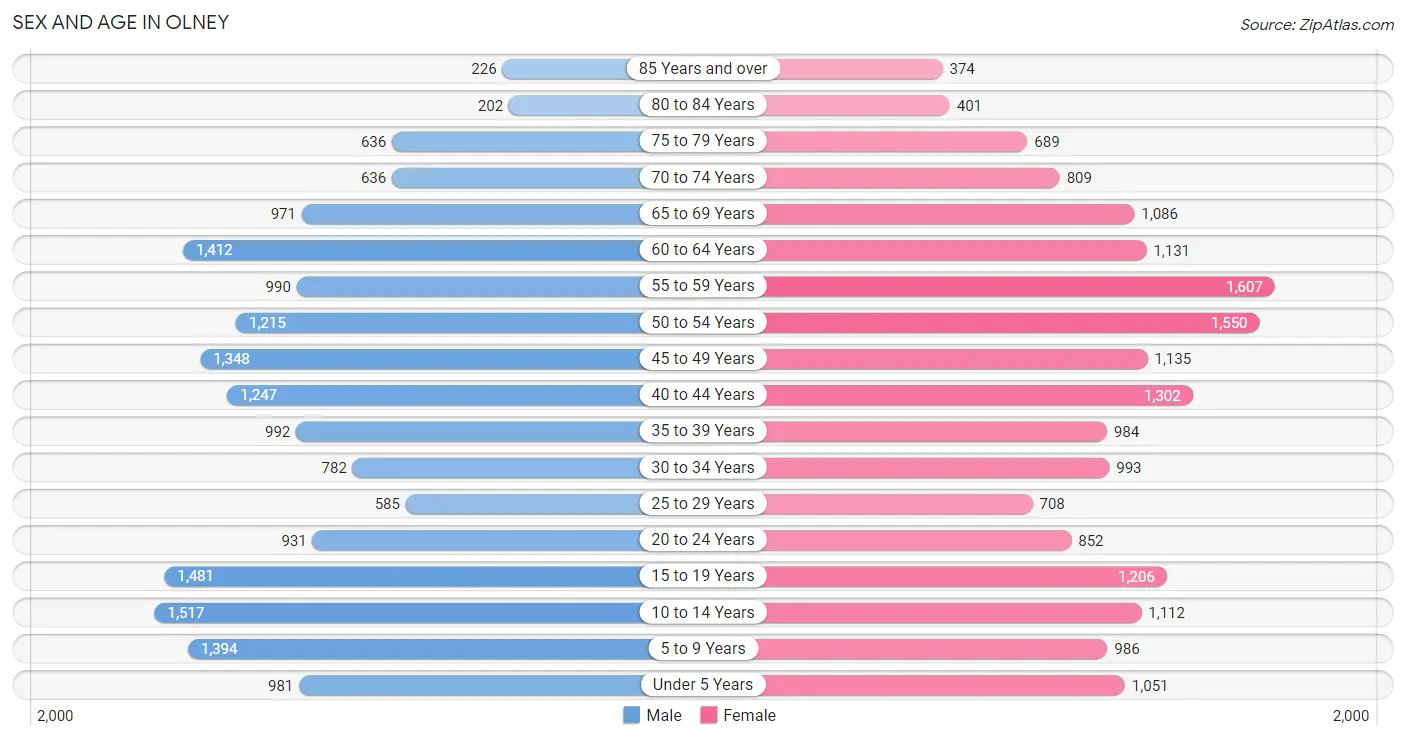
Sex and Age in Olney
Sex and Age in Olney
The most populous age groups in Olney are 10 to 14 Years (1,517 | 8.6%) for men and 55 to 59 Years (1,607 | 8.9%) for women.
| Age Bracket | Male | Female |
| Under 5 Years | 981 (5.6%) | 1,051 (5.9%) |
| 5 to 9 Years | 1,394 (7.9%) | 986 (5.5%) |
| 10 to 14 Years | 1,517 (8.6%) | 1,112 (6.2%) |
| 15 to 19 Years | 1,481 (8.4%) | 1,206 (6.7%) |
| 20 to 24 Years | 931 (5.3%) | 852 (4.7%) |
| 25 to 29 Years | 585 (3.3%) | 708 (3.9%) |
| 30 to 34 Years | 782 (4.5%) | 993 (5.5%) |
| 35 to 39 Years | 992 (5.7%) | 984 (5.5%) |
| 40 to 44 Years | 1,247 (7.1%) | 1,302 (7.2%) |
| 45 to 49 Years | 1,348 (7.7%) | 1,135 (6.3%) |
| 50 to 54 Years | 1,215 (6.9%) | 1,550 (8.6%) |
| 55 to 59 Years | 990 (5.6%) | 1,607 (8.9%) |
| 60 to 64 Years | 1,412 (8.1%) | 1,131 (6.3%) |
| 65 to 69 Years | 971 (5.5%) | 1,086 (6.0%) |
| 70 to 74 Years | 636 (3.6%) | 809 (4.5%) |
| 75 to 79 Years | 636 (3.6%) | 689 (3.8%) |
| 80 to 84 Years | 202 (1.1%) | 401 (2.2%) |
| 85 Years and over | 226 (1.3%) | 374 (2.1%) |
| Total | 17,546 (100.0%) | 17,976 (100.0%) |
Families and Households in Olney
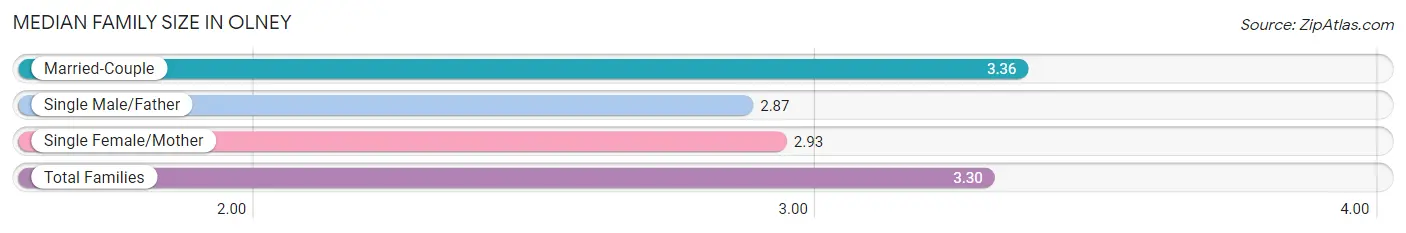
Median Family Size in Olney
The median family size in Olney is 3.30 persons per family, with married-couple families (8,252 | 84.7%) accounting for the largest median family size of 3.36 persons per family. On the other hand, single male/father families (234 | 2.4%) represent the smallest median family size with 2.87 persons per family.
| Family Type | # Families | Family Size |
| Married-Couple | 8,252 (84.7%) | 3.36 |
| Single Male/Father | 234 (2.4%) | 2.87 |
| Single Female/Mother | 1,259 (12.9%) | 2.93 |
| Total Families | 9,745 (100.0%) | 3.30 |
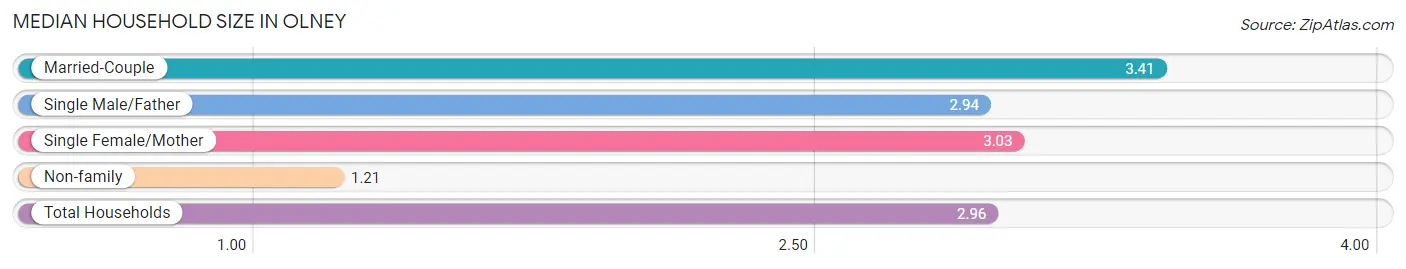
Median Household Size in Olney
The median household size in Olney is 2.96 persons per household, with married-couple households (8,252 | 69.2%) accounting for the largest median household size of 3.41 persons per household. non-family households (2,183 | 18.3%) represent the smallest median household size with 1.21 persons per household.
| Household Type | # Households | Household Size |
| Married-Couple | 8,252 (69.2%) | 3.41 |
| Single Male/Father | 234 (2.0%) | 2.94 |
| Single Female/Mother | 1,259 (10.5%) | 3.03 |
| Non-family | 2,183 (18.3%) | 1.21 |
| Total Households | 11,928 (100.0%) | 2.96 |
Household Size by Marriage Status in Olney
Out of a total of 11,928 households in Olney, 9,745 (81.7%) are family households, while 2,183 (18.3%) are nonfamily households. The most numerous type of family households are 2-person households, comprising 3,596, and the most common type of nonfamily households are 1-person households, comprising 1,740.
| Household Size | Family Households | Nonfamily Households |
| 1-Person Households | - | 1,740 (14.6%) |
| 2-Person Households | 3,596 (30.1%) | 443 (3.7%) |
| 3-Person Households | 2,093 (17.5%) | 0 (0.0%) |
| 4-Person Households | 2,721 (22.8%) | 0 (0.0%) |
| 5-Person Households | 987 (8.3%) | 0 (0.0%) |
| 6-Person Households | 281 (2.4%) | 0 (0.0%) |
| 7+ Person Households | 67 (0.6%) | 0 (0.0%) |
| Total | 9,745 (81.7%) | 2,183 (18.3%) |
Female Fertility in Olney
Fertility by Age in Olney
Average fertility rate in Olney is 39.0 births per 1,000 women. Women in the age bracket of 20 to 34 years have the highest fertility rate with 53.0 births per 1,000 women. Women in the age bracket of 35 to 50 years acount for 53.6% of all women with births.
| Age Bracket | Women with Births | Births / 1,000 Women |
| 15 to 19 years | 0 (0.0%) | 0.0 |
| 20 to 34 years | 135 (46.4%) | 53.0 |
| 35 to 50 years | 156 (53.6%) | 42.0 |
| Total | 291 (100.0%) | 39.0 |
Fertility by Age by Marriage Status in Olney
96.6% of women with births (291) in Olney are married. The highest percentage of unmarried women with births falls into 35 to 50 years age bracket with 3.8% of them unmarried at the time of birth, while the lowest percentage of unmarried women with births belong to 20 to 34 years age bracket with 3.0% of them unmarried.
| Age Bracket | Married | Unmarried |
| 15 to 19 years | 0 (0.0%) | 0 (0.0%) |
| 20 to 34 years | 131 (97.0%) | 4 (3.0%) |
| 35 to 50 years | 150 (96.2%) | 6 (3.8%) |
| Total | 281 (96.6%) | 10 (3.4%) |
Fertility by Education in Olney
| Educational Attainment | Women with Births | Births / 1,000 Women |
| Less than High School | 0 (0.0%) | 0.0 |
| High School Diploma | 11 (3.8%) | 10.0 |
| College or Associate's Degree | 0 (0.0%) | 0.0 |
| Bachelor's Degree | 130 (44.7%) | 60.0 |
| Graduate Degree | 150 (51.5%) | 76.0 |
| Total | 291 (100.0%) | 39.0 |
Fertility by Education by Marriage Status in Olney
3.4% of women with births in Olney are unmarried. Women with the educational attainment of high school diploma are most likely to be married with 100.0% of them married at childbirth, while women with the educational attainment of bachelor's degree are least likely to be married with 4.6% of them unmarried at childbirth.
| Educational Attainment | Married | Unmarried |
| Less than High School | 0 (0.0%) | 0 (0.0%) |
| High School Diploma | 11 (100.0%) | 0 (0.0%) |
| College or Associate's Degree | 0 (0.0%) | 0 (0.0%) |
| Bachelor's Degree | 124 (95.4%) | 6 (4.6%) |
| Graduate Degree | 146 (97.3%) | 4 (2.7%) |
| Total | 281 (96.6%) | 10 (3.4%) |
Employment Characteristics in Olney
Employment by Class of Employer in Olney
Among the 18,315 employed individuals in Olney, private company employees (9,762 | 53.3%), federal government employees (2,581 | 14.1%), and not-for-profit organizations (1,693 | 9.2%) make up the most common classes of employment.
| Employer Class | # Employees | % Employees |
| Private Company Employees | 9,762 | 53.3% |
| Self-Employed (Incorporated) | 861 | 4.7% |
| Self-Employed (Not Incorporated) | 956 | 5.2% |
| Not-for-profit Organizations | 1,693 | 9.2% |
| Local Government Employees | 1,644 | 9.0% |
| State Government Employees | 746 | 4.1% |
| Federal Government Employees | 2,581 | 14.1% |
| Unpaid Family Workers | 72 | 0.4% |
| Total | 18,315 | 100.0% |
Employment Status by Age in Olney
According to the labor force statistics for Olney, out of the total population over 16 years of age (27,973), 69.1% or 19,329 individuals are in the labor force, with 3.5% or 677 of them unemployed. The age group with the highest labor force participation rate is 35 to 44 years, with 93.2% or 4,217 individuals in the labor force. Within the labor force, the 20 to 24 years age range has the highest percentage of unemployed individuals, with 15.1% or 217 of them being unemployed.
| Age Bracket | In Labor Force | Unemployed |
| 16 to 19 Years | 521 (23.9%) | 69 (13.3%) |
| 20 to 24 Years | 1,435 (80.5%) | 217 (15.1%) |
| 25 to 29 Years | 1,095 (84.7%) | 32 (2.9%) |
| 30 to 34 Years | 1,500 (84.5%) | 45 (3.0%) |
| 35 to 44 Years | 4,217 (93.2%) | 72 (1.7%) |
| 45 to 54 Years | 4,734 (90.2%) | 123 (2.6%) |
| 55 to 59 Years | 2,361 (90.9%) | 64 (2.7%) |
| 60 to 64 Years | 1,915 (75.3%) | 29 (1.5%) |
| 65 to 74 Years | 1,292 (36.9%) | 23 (1.8%) |
| 75 Years and over | 268 (10.6%) | 6 (2.2%) |
| Total | 19,329 (69.1%) | 677 (3.5%) |
Employment Status by Educational Attainment in Olney
According to labor force statistics for Olney, 88.0% of individuals (15,823) out of the total population between 25 and 64 years of age (17,981) are in the labor force, with 2.3% or 364 of them being unemployed. The group with the highest labor force participation rate are those with the educational attainment of bachelor's degree or higher, with 89.7% or 11,018 individuals in the labor force. Within the labor force, individuals with high school diploma education have the highest percentage of unemployment, with 5.4% or 91 of them being unemployed.
| Educational Attainment | In Labor Force | Unemployed |
| Less than High School | 390 (64.5%) | 25 (4.1%) |
| High School Diploma | 1,680 (86.1%) | 105 (5.4%) |
| College / Associate Degree | 2,730 (86.9%) | 47 (1.5%) |
| Bachelor's Degree or higher | 11,018 (89.7%) | 246 (2.0%) |
| Total | 15,823 (88.0%) | 414 (2.3%) |
Employment Occupations by Sex in Olney
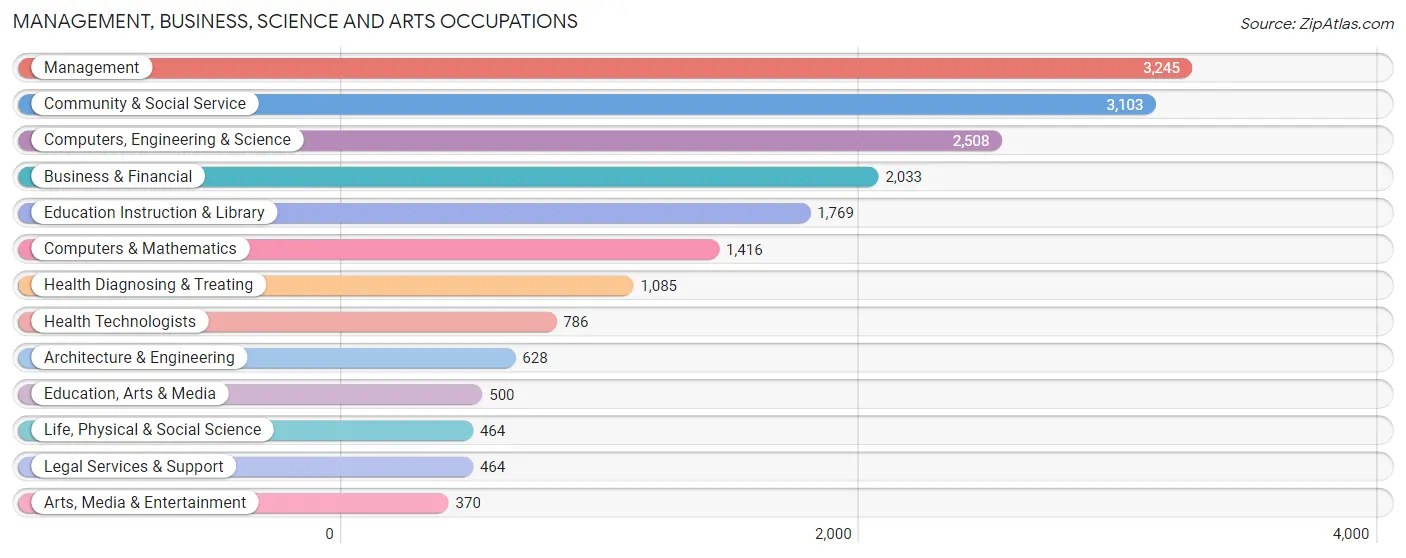
Management, Business, Science and Arts Occupations
The most common Management, Business, Science and Arts occupations in Olney are Management (3,245 | 17.4%), Community & Social Service (3,103 | 16.6%), Computers, Engineering & Science (2,508 | 13.5%), Business & Financial (2,033 | 10.9%), and Education Instruction & Library (1,769 | 9.5%).
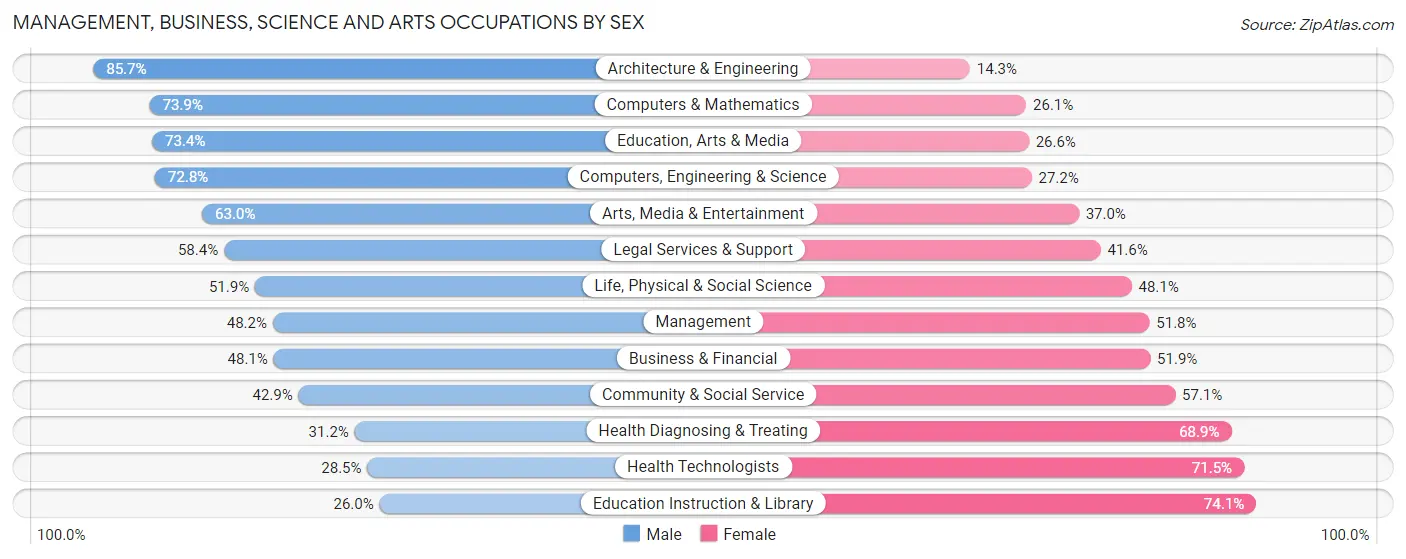
Management, Business, Science and Arts Occupations by Sex
Within the Management, Business, Science and Arts occupations in Olney, the most male-oriented occupations are Architecture & Engineering (85.7%), Computers & Mathematics (73.9%), and Education, Arts & Media (73.4%), while the most female-oriented occupations are Education Instruction & Library (74.1%), Health Technologists (71.5%), and Health Diagnosing & Treating (68.9%).
| Occupation | Male | Female |
| Management | 1,565 (48.2%) | 1,680 (51.8%) |
| Business & Financial | 977 (48.1%) | 1,056 (51.9%) |
| Computers, Engineering & Science | 1,826 (72.8%) | 682 (27.2%) |
| Computers & Mathematics | 1,047 (73.9%) | 369 (26.1%) |
| Architecture & Engineering | 538 (85.7%) | 90 (14.3%) |
| Life, Physical & Social Science | 241 (51.9%) | 223 (48.1%) |
| Community & Social Service | 1,330 (42.9%) | 1,773 (57.1%) |
| Education, Arts & Media | 367 (73.4%) | 133 (26.6%) |
| Legal Services & Support | 271 (58.4%) | 193 (41.6%) |
| Education Instruction & Library | 459 (26.0%) | 1,310 (74.1%) |
| Arts, Media & Entertainment | 233 (63.0%) | 137 (37.0%) |
| Health Diagnosing & Treating | 338 (31.1%) | 747 (68.9%) |
| Health Technologists | 224 (28.5%) | 562 (71.5%) |
| Total (Category) | 6,036 (50.4%) | 5,938 (49.6%) |
| Total (Overall) | 9,409 (50.5%) | 9,234 (49.5%) |
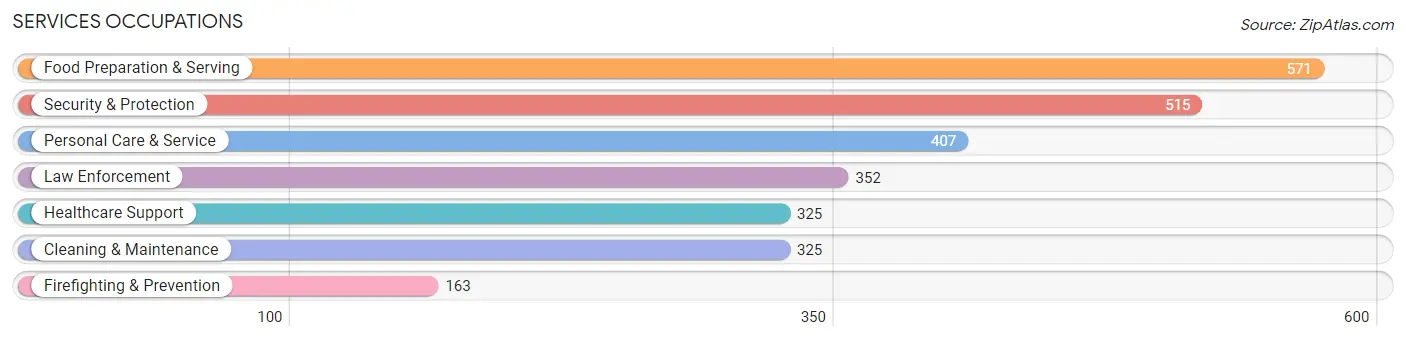
Services Occupations
The most common Services occupations in Olney are Food Preparation & Serving (571 | 3.1%), Security & Protection (515 | 2.8%), Personal Care & Service (407 | 2.2%), Law Enforcement (352 | 1.9%), and Healthcare Support (325 | 1.7%).
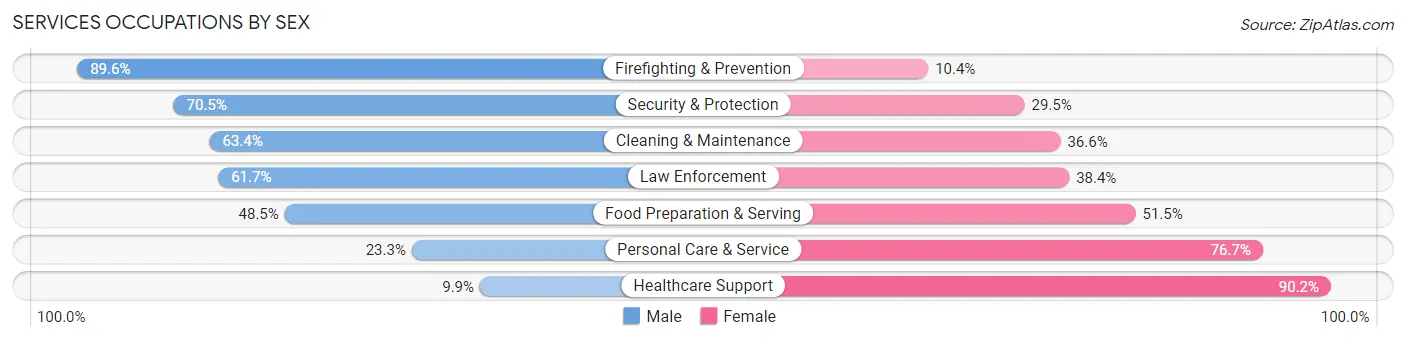
Services Occupations by Sex
Within the Services occupations in Olney, the most male-oriented occupations are Firefighting & Prevention (89.6%), Security & Protection (70.5%), and Cleaning & Maintenance (63.4%), while the most female-oriented occupations are Healthcare Support (90.1%), Personal Care & Service (76.7%), and Food Preparation & Serving (51.5%).
| Occupation | Male | Female |
| Healthcare Support | 32 (9.9%) | 293 (90.1%) |
| Security & Protection | 363 (70.5%) | 152 (29.5%) |
| Firefighting & Prevention | 146 (89.6%) | 17 (10.4%) |
| Law Enforcement | 217 (61.7%) | 135 (38.4%) |
| Food Preparation & Serving | 277 (48.5%) | 294 (51.5%) |
| Cleaning & Maintenance | 206 (63.4%) | 119 (36.6%) |
| Personal Care & Service | 95 (23.3%) | 312 (76.7%) |
| Total (Category) | 973 (45.4%) | 1,170 (54.6%) |
| Total (Overall) | 9,409 (50.5%) | 9,234 (49.5%) |
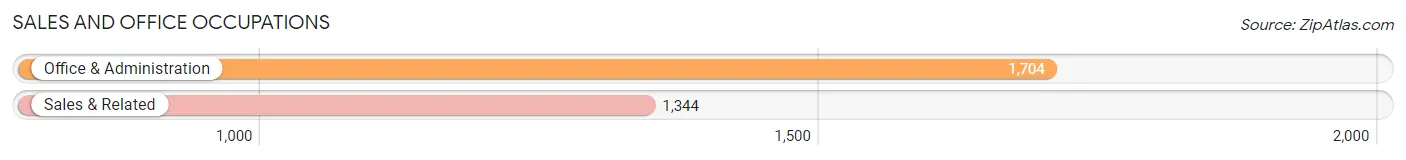
Sales and Office Occupations
The most common Sales and Office occupations in Olney are Office & Administration (1,704 | 9.1%), and Sales & Related (1,344 | 7.2%).
Sales and Office Occupations by Sex
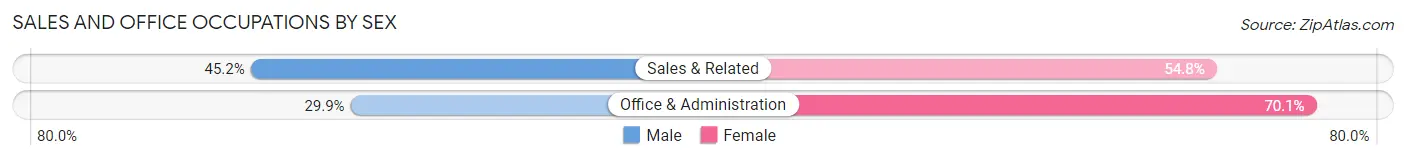
| Occupation | Male | Female |
| Sales & Related | 608 (45.2%) | 736 (54.8%) |
| Office & Administration | 509 (29.9%) | 1,195 (70.1%) |
| Total (Category) | 1,117 (36.6%) | 1,931 (63.3%) |
| Total (Overall) | 9,409 (50.5%) | 9,234 (49.5%) |
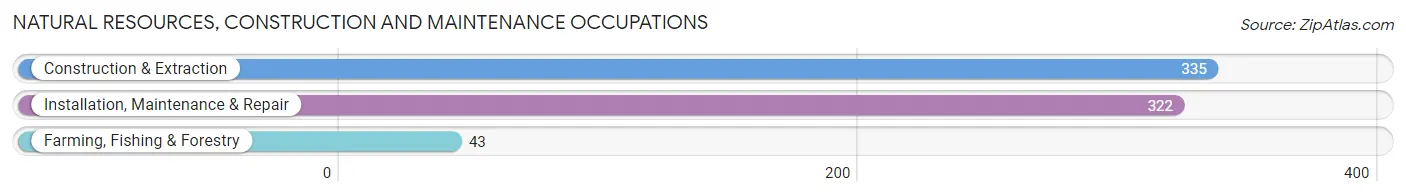
Natural Resources, Construction and Maintenance Occupations
The most common Natural Resources, Construction and Maintenance occupations in Olney are Construction & Extraction (335 | 1.8%), Installation, Maintenance & Repair (322 | 1.7%), and Farming, Fishing & Forestry (43 | 0.2%).
Natural Resources, Construction and Maintenance Occupations by Sex
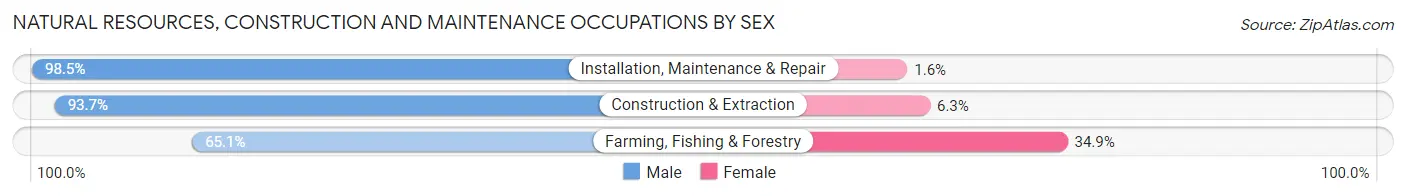
| Occupation | Male | Female |
| Farming, Fishing & Forestry | 28 (65.1%) | 15 (34.9%) |
| Construction & Extraction | 314 (93.7%) | 21 (6.3%) |
| Installation, Maintenance & Repair | 317 (98.5%) | 5 (1.5%) |
| Total (Category) | 659 (94.1%) | 41 (5.9%) |
| Total (Overall) | 9,409 (50.5%) | 9,234 (49.5%) |
Production, Transportation and Moving Occupations
The most common Production, Transportation and Moving occupations in Olney are Transportation (354 | 1.9%), Production (273 | 1.5%), and Material Moving (151 | 0.8%).
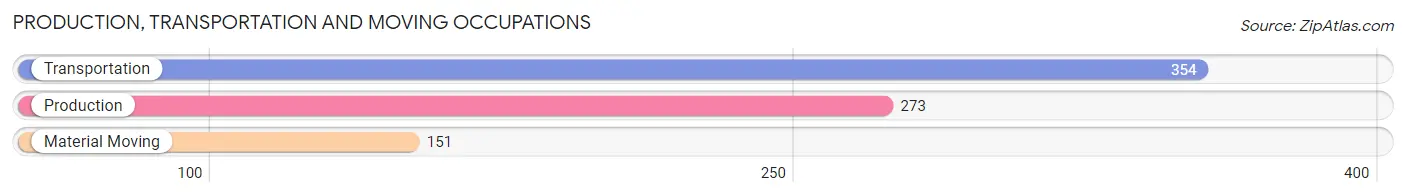
Production, Transportation and Moving Occupations by Sex
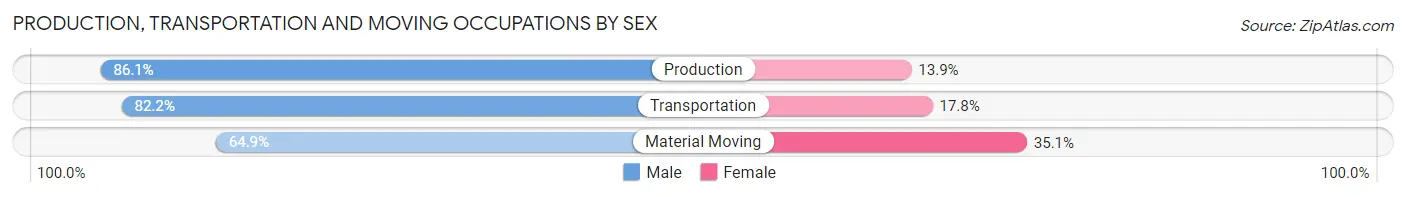
| Occupation | Male | Female |
| Production | 235 (86.1%) | 38 (13.9%) |
| Transportation | 291 (82.2%) | 63 (17.8%) |
| Material Moving | 98 (64.9%) | 53 (35.1%) |
| Total (Category) | 624 (80.2%) | 154 (19.8%) |
| Total (Overall) | 9,409 (50.5%) | 9,234 (49.5%) |
Employment Industries by Sex in Olney
Employment Industries in Olney
The major employment industries in Olney include Professional & Scientific (3,381 | 18.1%), Public Administration (2,745 | 14.7%), Health Care & Social Assistance (2,188 | 11.7%), Educational Services (2,084 | 11.2%), and Retail Trade (1,223 | 6.6%).
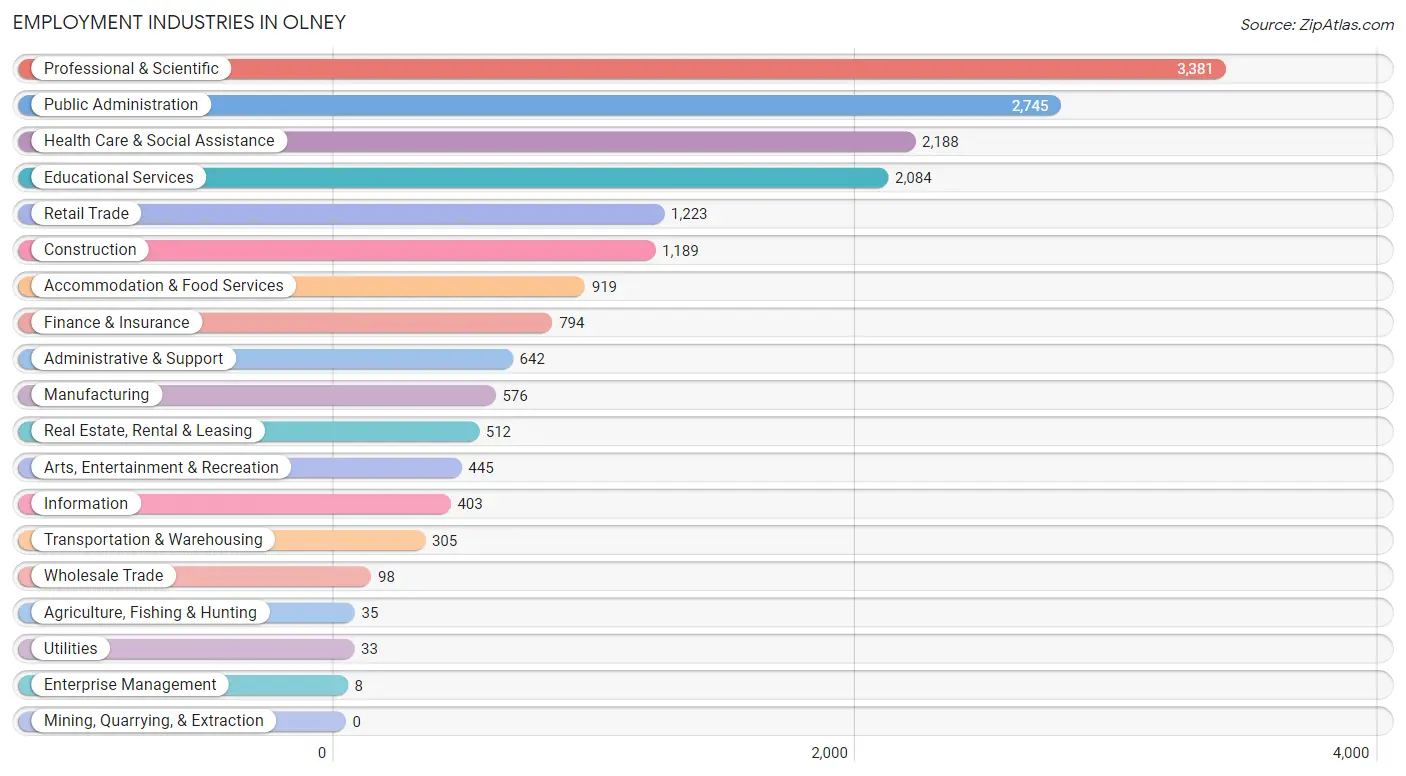
Employment Industries by Sex in Olney
The Olney industries that see more men than women are Construction (77.0%), Transportation & Warehousing (71.8%), and Agriculture, Fishing & Hunting (68.6%), whereas the industries that tend to have a higher number of women are Enterprise Management (100.0%), Educational Services (75.6%), and Health Care & Social Assistance (70.9%).
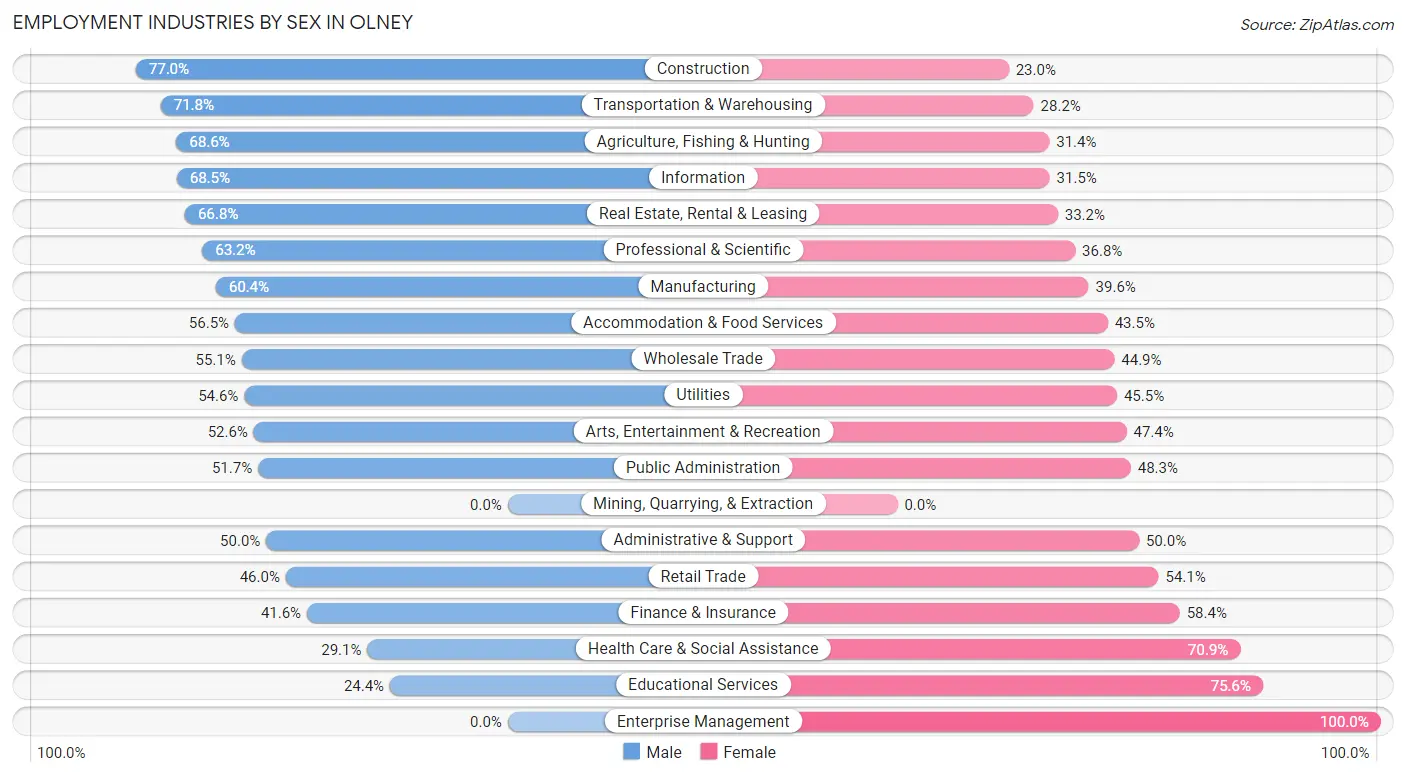
| Industry | Male | Female |
| Agriculture, Fishing & Hunting | 24 (68.6%) | 11 (31.4%) |
| Mining, Quarrying, & Extraction | 0 (0.0%) | 0 (0.0%) |
| Construction | 915 (77.0%) | 274 (23.0%) |
| Manufacturing | 348 (60.4%) | 228 (39.6%) |
| Wholesale Trade | 54 (55.1%) | 44 (44.9%) |
| Retail Trade | 562 (46.0%) | 661 (54.0%) |
| Transportation & Warehousing | 219 (71.8%) | 86 (28.2%) |
| Utilities | 18 (54.5%) | 15 (45.5%) |
| Information | 276 (68.5%) | 127 (31.5%) |
| Finance & Insurance | 330 (41.6%) | 464 (58.4%) |
| Real Estate, Rental & Leasing | 342 (66.8%) | 170 (33.2%) |
| Professional & Scientific | 2,137 (63.2%) | 1,244 (36.8%) |
| Enterprise Management | 0 (0.0%) | 8 (100.0%) |
| Administrative & Support | 321 (50.0%) | 321 (50.0%) |
| Educational Services | 508 (24.4%) | 1,576 (75.6%) |
| Health Care & Social Assistance | 636 (29.1%) | 1,552 (70.9%) |
| Arts, Entertainment & Recreation | 234 (52.6%) | 211 (47.4%) |
| Accommodation & Food Services | 519 (56.5%) | 400 (43.5%) |
| Public Administration | 1,419 (51.7%) | 1,326 (48.3%) |
| Total | 9,409 (50.5%) | 9,234 (49.5%) |
Education in Olney
School Enrollment in Olney
The most common levels of schooling among the 10,213 students in Olney are high school (2,765 | 27.1%), middle school (2,044 | 20.0%), and elementary school (1,871 | 18.3%).
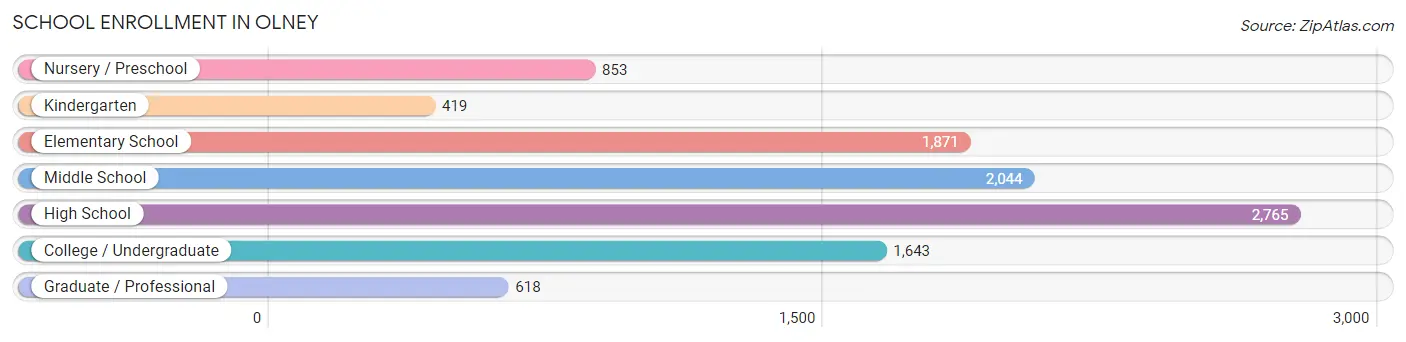
| School Level | # Students | % Students |
| Nursery / Preschool | 853 | 8.4% |
| Kindergarten | 419 | 4.1% |
| Elementary School | 1,871 | 18.3% |
| Middle School | 2,044 | 20.0% |
| High School | 2,765 | 27.1% |
| College / Undergraduate | 1,643 | 16.1% |
| Graduate / Professional | 618 | 6.0% |
| Total | 10,213 | 100.0% |
School Enrollment by Age by Funding Source in Olney
Out of a total of 10,213 students who are enrolled in schools in Olney, 2,809 (27.5%) attend a private institution, while the remaining 7,404 (72.5%) are enrolled in public schools. The age group of 3 to 4 year olds has the highest likelihood of being enrolled in private schools, with 506 (78.9% in the age bracket) enrolled. Conversely, the age group of 20 to 24 year olds has the lowest likelihood of being enrolled in a private school, with 809 (83.8% in the age bracket) attending a public institution.
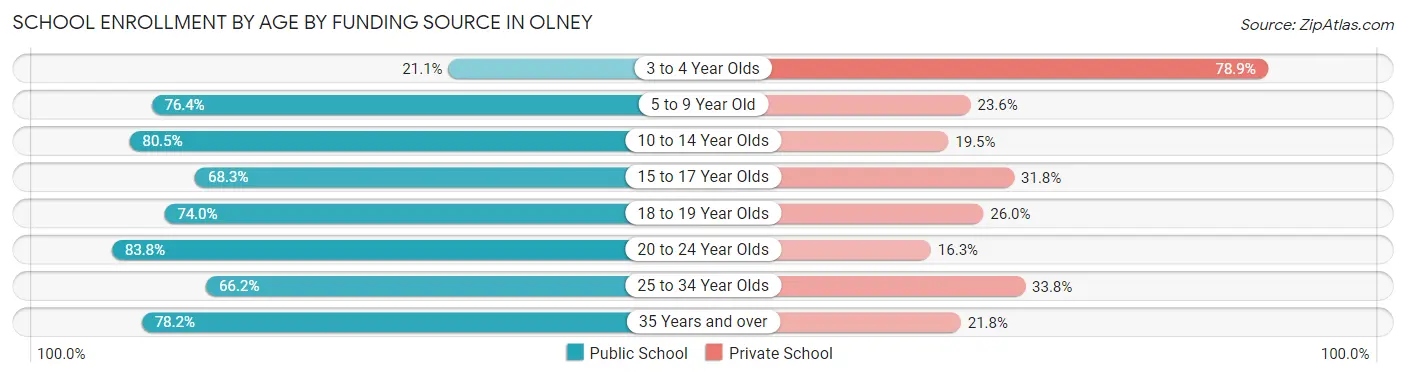
| Age Bracket | Public School | Private School |
| 3 to 4 Year Olds | 135 (21.1%) | 506 (78.9%) |
| 5 to 9 Year Old | 1,787 (76.4%) | 553 (23.6%) |
| 10 to 14 Year Olds | 2,076 (80.5%) | 503 (19.5%) |
| 15 to 17 Year Olds | 1,292 (68.2%) | 601 (31.8%) |
| 18 to 19 Year Olds | 472 (74.0%) | 166 (26.0%) |
| 20 to 24 Year Olds | 809 (83.8%) | 157 (16.3%) |
| 25 to 34 Year Olds | 386 (66.2%) | 197 (33.8%) |
| 35 Years and over | 448 (78.2%) | 125 (21.8%) |
| Total | 7,404 (72.5%) | 2,809 (27.5%) |
Educational Attainment by Field of Study in Olney
Business (3,194 | 18.8%), social sciences (1,987 | 11.7%), bio, nature & agricultural (1,664 | 9.8%), engineering (1,525 | 9.0%), and science & technology (1,521 | 8.9%) are the most common fields of study among 17,018 individuals in Olney who have obtained a bachelor's degree or higher.
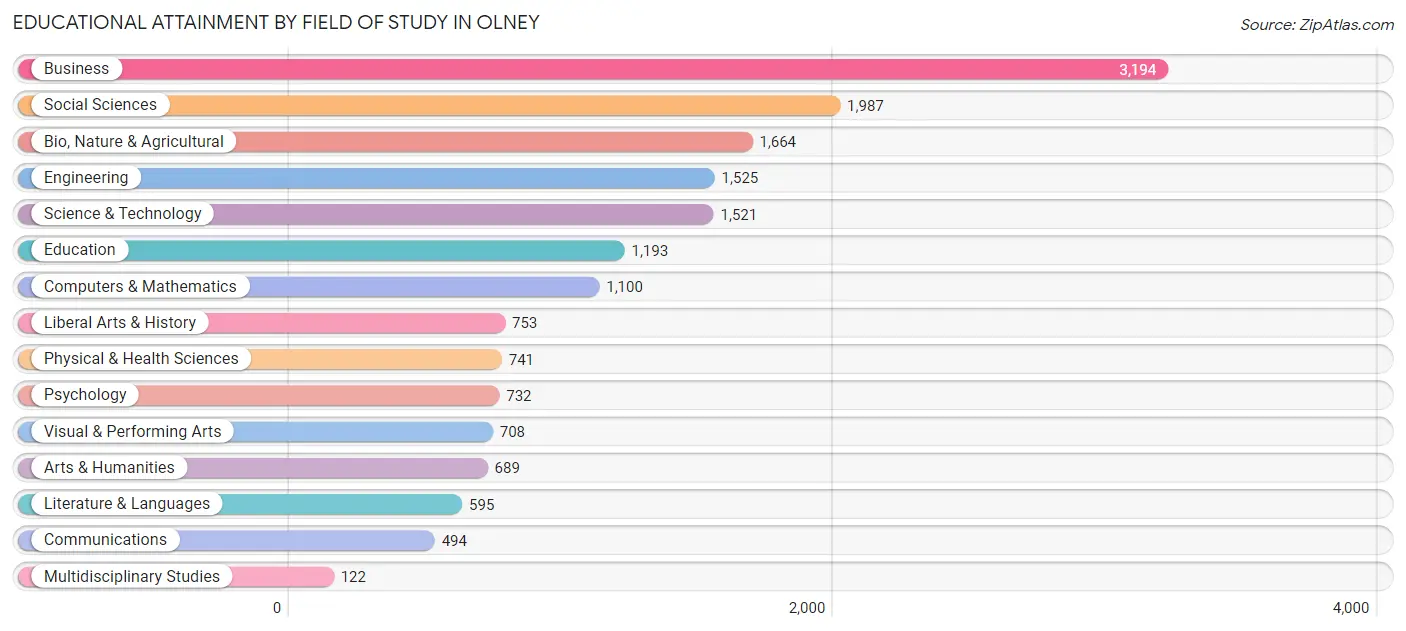
| Field of Study | # Graduates | % Graduates |
| Computers & Mathematics | 1,100 | 6.5% |
| Bio, Nature & Agricultural | 1,664 | 9.8% |
| Physical & Health Sciences | 741 | 4.3% |
| Psychology | 732 | 4.3% |
| Social Sciences | 1,987 | 11.7% |
| Engineering | 1,525 | 9.0% |
| Multidisciplinary Studies | 122 | 0.7% |
| Science & Technology | 1,521 | 8.9% |
| Business | 3,194 | 18.8% |
| Education | 1,193 | 7.0% |
| Literature & Languages | 595 | 3.5% |
| Liberal Arts & History | 753 | 4.4% |
| Visual & Performing Arts | 708 | 4.2% |
| Communications | 494 | 2.9% |
| Arts & Humanities | 689 | 4.1% |
| Total | 17,018 | 100.0% |
Transportation & Commute in Olney
Vehicle Availability by Sex in Olney
The most prevalent vehicle ownership categories in Olney are males with 2 vehicles (4,430, accounting for 47.8%) and females with 2 vehicles (4,449, making up 48.9%).
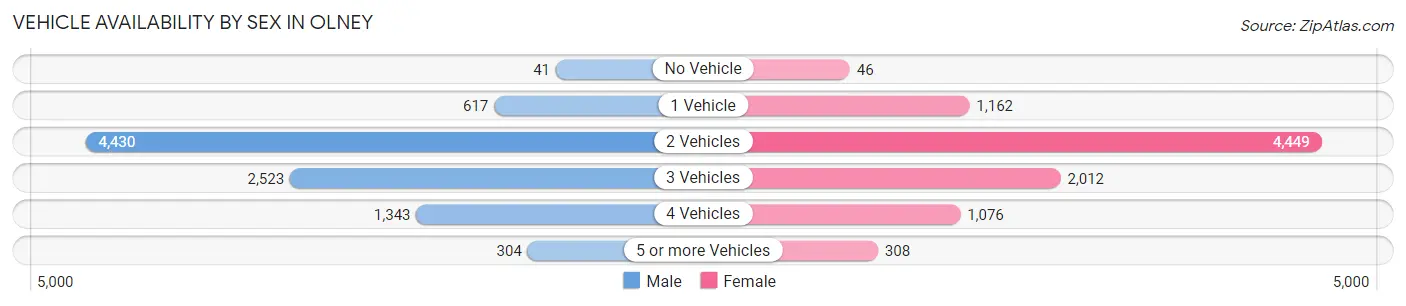
| Vehicles Available | Male | Female |
| No Vehicle | 41 (0.4%) | 46 (0.5%) |
| 1 Vehicle | 617 (6.7%) | 1,162 (12.8%) |
| 2 Vehicles | 4,430 (47.8%) | 4,449 (49.1%) |
| 3 Vehicles | 2,523 (27.3%) | 2,012 (22.2%) |
| 4 Vehicles | 1,343 (14.5%) | 1,076 (11.9%) |
| 5 or more Vehicles | 304 (3.3%) | 308 (3.4%) |
| Total | 9,258 (100.0%) | 9,053 (100.0%) |
Commute Time in Olney
The most frequently occuring commute durations in Olney are 30 to 34 minutes (2,446 commuters, 17.8%), 20 to 24 minutes (2,008 commuters, 14.6%), and 45 to 59 minutes (1,837 commuters, 13.4%).
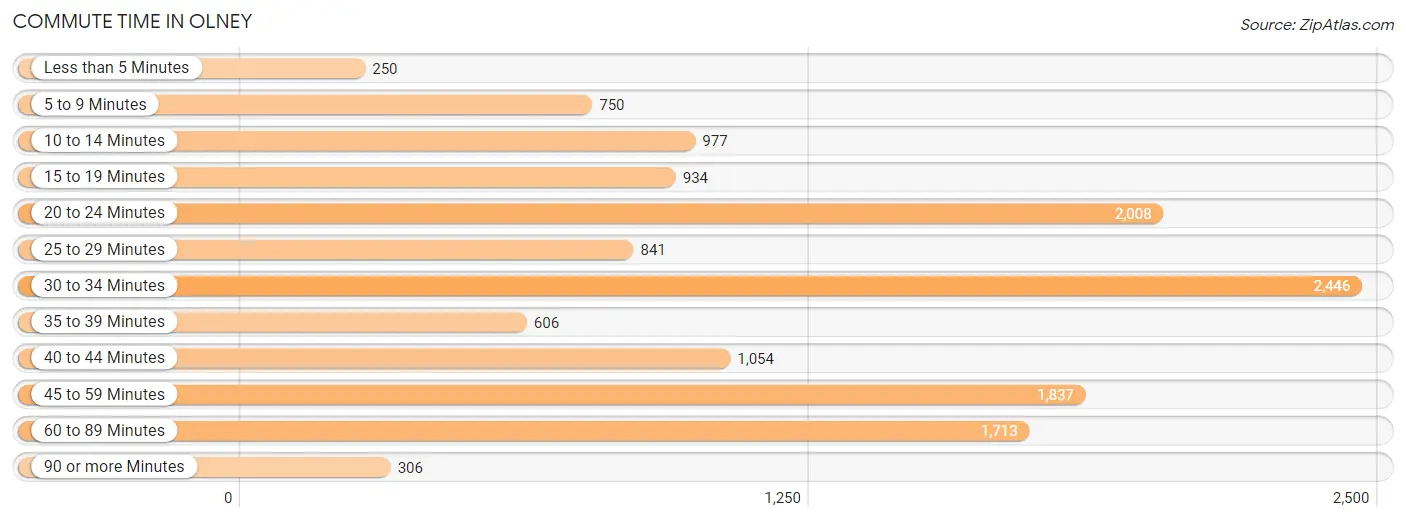
| Commute Time | # Commuters | % Commuters |
| Less than 5 Minutes | 250 | 1.8% |
| 5 to 9 Minutes | 750 | 5.5% |
| 10 to 14 Minutes | 977 | 7.1% |
| 15 to 19 Minutes | 934 | 6.8% |
| 20 to 24 Minutes | 2,008 | 14.6% |
| 25 to 29 Minutes | 841 | 6.1% |
| 30 to 34 Minutes | 2,446 | 17.8% |
| 35 to 39 Minutes | 606 | 4.4% |
| 40 to 44 Minutes | 1,054 | 7.7% |
| 45 to 59 Minutes | 1,837 | 13.4% |
| 60 to 89 Minutes | 1,713 | 12.5% |
| 90 or more Minutes | 306 | 2.2% |
Commute Time by Sex in Olney
The most common commute times in Olney are 30 to 34 minutes (1,310 commuters, 18.9%) for males and 20 to 24 minutes (1,188 commuters, 17.5%) for females.
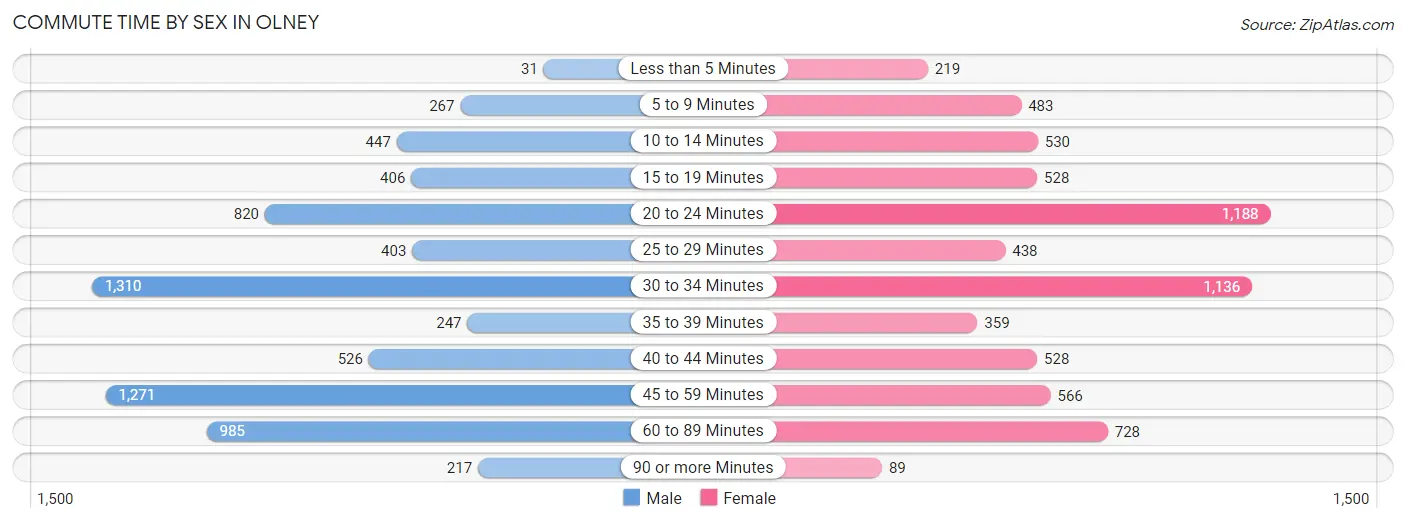
| Commute Time | Male | Female |
| Less than 5 Minutes | 31 (0.4%) | 219 (3.2%) |
| 5 to 9 Minutes | 267 (3.8%) | 483 (7.1%) |
| 10 to 14 Minutes | 447 (6.5%) | 530 (7.8%) |
| 15 to 19 Minutes | 406 (5.9%) | 528 (7.8%) |
| 20 to 24 Minutes | 820 (11.8%) | 1,188 (17.5%) |
| 25 to 29 Minutes | 403 (5.8%) | 438 (6.5%) |
| 30 to 34 Minutes | 1,310 (18.9%) | 1,136 (16.7%) |
| 35 to 39 Minutes | 247 (3.6%) | 359 (5.3%) |
| 40 to 44 Minutes | 526 (7.6%) | 528 (7.8%) |
| 45 to 59 Minutes | 1,271 (18.3%) | 566 (8.3%) |
| 60 to 89 Minutes | 985 (14.2%) | 728 (10.7%) |
| 90 or more Minutes | 217 (3.1%) | 89 (1.3%) |
Time of Departure to Work by Sex in Olney
The most frequent times of departure to work in Olney are 7:00 AM to 7:29 AM (1,102, 15.9%) for males and 8:00 AM to 8:29 AM (1,194, 17.6%) for females.
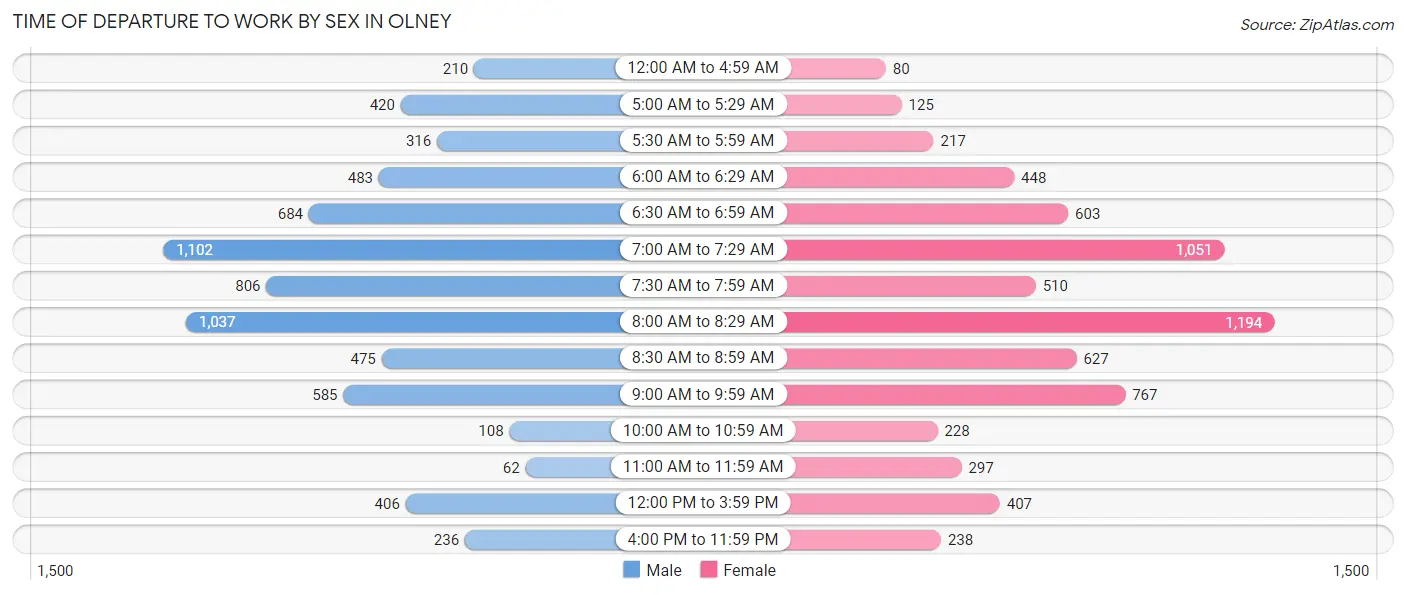
| Time of Departure | Male | Female |
| 12:00 AM to 4:59 AM | 210 (3.0%) | 80 (1.2%) |
| 5:00 AM to 5:29 AM | 420 (6.1%) | 125 (1.8%) |
| 5:30 AM to 5:59 AM | 316 (4.6%) | 217 (3.2%) |
| 6:00 AM to 6:29 AM | 483 (7.0%) | 448 (6.6%) |
| 6:30 AM to 6:59 AM | 684 (9.9%) | 603 (8.9%) |
| 7:00 AM to 7:29 AM | 1,102 (15.9%) | 1,051 (15.5%) |
| 7:30 AM to 7:59 AM | 806 (11.6%) | 510 (7.5%) |
| 8:00 AM to 8:29 AM | 1,037 (15.0%) | 1,194 (17.6%) |
| 8:30 AM to 8:59 AM | 475 (6.9%) | 627 (9.2%) |
| 9:00 AM to 9:59 AM | 585 (8.4%) | 767 (11.3%) |
| 10:00 AM to 10:59 AM | 108 (1.6%) | 228 (3.4%) |
| 11:00 AM to 11:59 AM | 62 (0.9%) | 297 (4.4%) |
| 12:00 PM to 3:59 PM | 406 (5.9%) | 407 (6.0%) |
| 4:00 PM to 11:59 PM | 236 (3.4%) | 238 (3.5%) |
| Total | 6,930 (100.0%) | 6,792 (100.0%) |
Housing Occupancy in Olney
Occupancy by Ownership in Olney
Of the total 11,928 dwellings in Olney, owner-occupied units account for 10,622 (89.0%), while renter-occupied units make up 1,306 (11.0%).
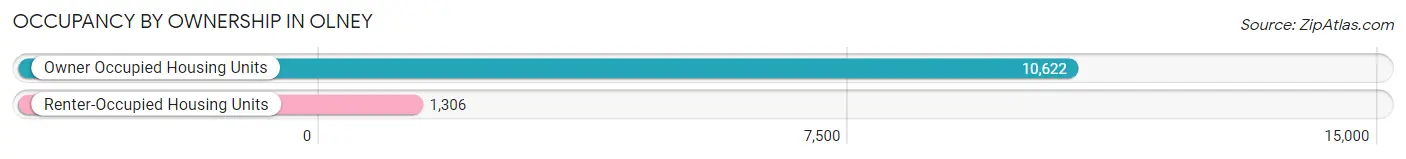
| Occupancy | # Housing Units | % Housing Units |
| Owner Occupied Housing Units | 10,622 | 89.0% |
| Renter-Occupied Housing Units | 1,306 | 11.0% |
| Total Occupied Housing Units | 11,928 | 100.0% |
Occupancy by Household Size in Olney
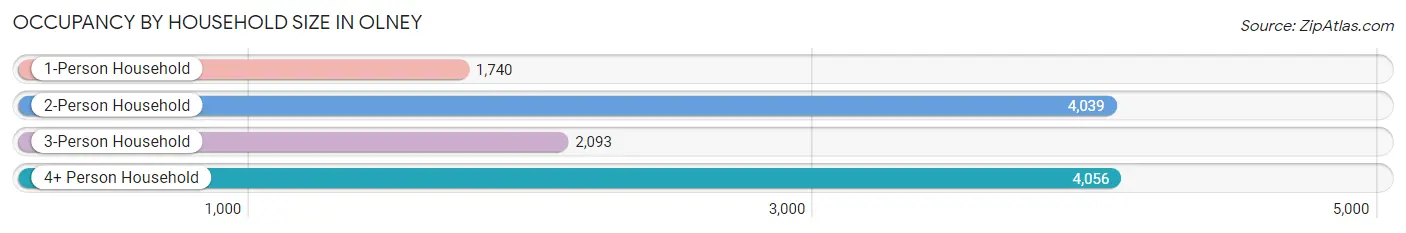
| Household Size | # Housing Units | % Housing Units |
| 1-Person Household | 1,740 | 14.6% |
| 2-Person Household | 4,039 | 33.9% |
| 3-Person Household | 2,093 | 17.5% |
| 4+ Person Household | 4,056 | 34.0% |
| Total Housing Units | 11,928 | 100.0% |
Occupancy by Ownership by Household Size in Olney
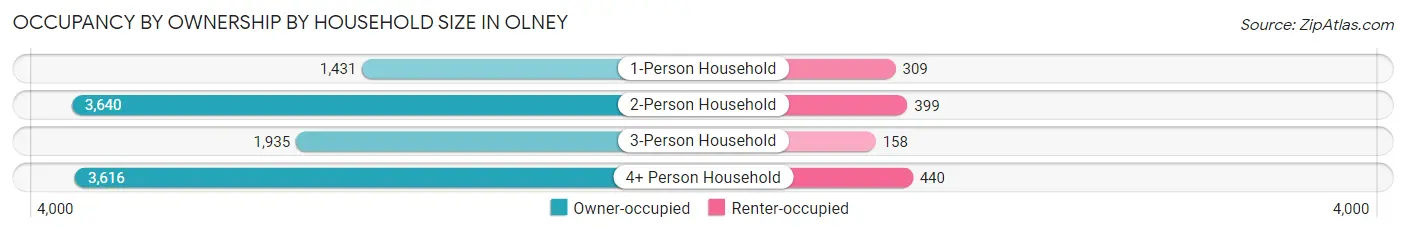
| Household Size | Owner-occupied | Renter-occupied |
| 1-Person Household | 1,431 (82.2%) | 309 (17.8%) |
| 2-Person Household | 3,640 (90.1%) | 399 (9.9%) |
| 3-Person Household | 1,935 (92.4%) | 158 (7.5%) |
| 4+ Person Household | 3,616 (89.1%) | 440 (10.8%) |
| Total Housing Units | 10,622 (89.0%) | 1,306 (11.0%) |
Occupancy by Educational Attainment in Olney
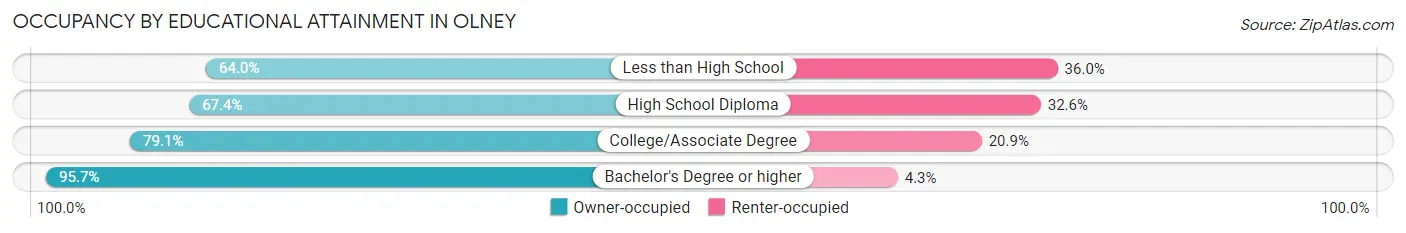
| Household Size | Owner-occupied | Renter-occupied |
| Less than High School | 153 (64.0%) | 86 (36.0%) |
| High School Diploma | 846 (67.4%) | 410 (32.6%) |
| College/Associate Degree | 1,726 (79.1%) | 457 (20.9%) |
| Bachelor's Degree or higher | 7,897 (95.7%) | 353 (4.3%) |
Occupancy by Age of Householder in Olney
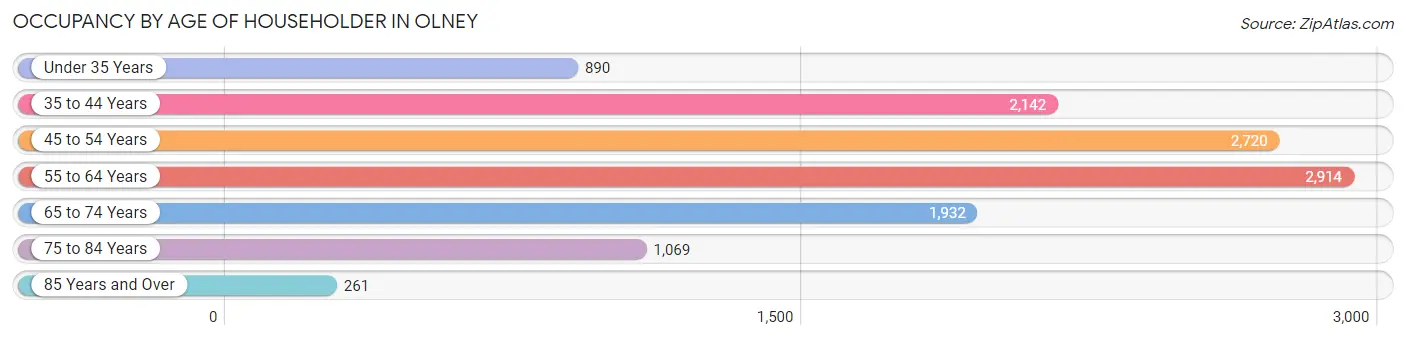
| Age Bracket | # Households | % Households |
| Under 35 Years | 890 | 7.5% |
| 35 to 44 Years | 2,142 | 18.0% |
| 45 to 54 Years | 2,720 | 22.8% |
| 55 to 64 Years | 2,914 | 24.4% |
| 65 to 74 Years | 1,932 | 16.2% |
| 75 to 84 Years | 1,069 | 9.0% |
| 85 Years and Over | 261 | 2.2% |
| Total | 11,928 | 100.0% |
Housing Finances in Olney
Median Income by Occupancy in Olney
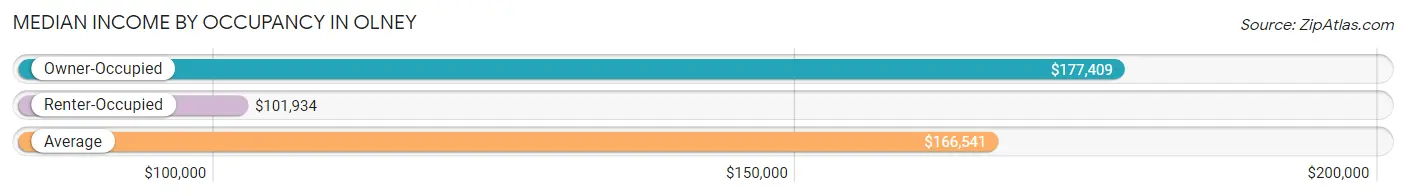
| Occupancy Type | # Households | Median Income |
| Owner-Occupied | 10,622 (89.0%) | $177,409 |
| Renter-Occupied | 1,306 (11.0%) | $101,934 |
| Average | 11,928 (100.0%) | $166,541 |
Occupancy by Householder Income Bracket in Olney
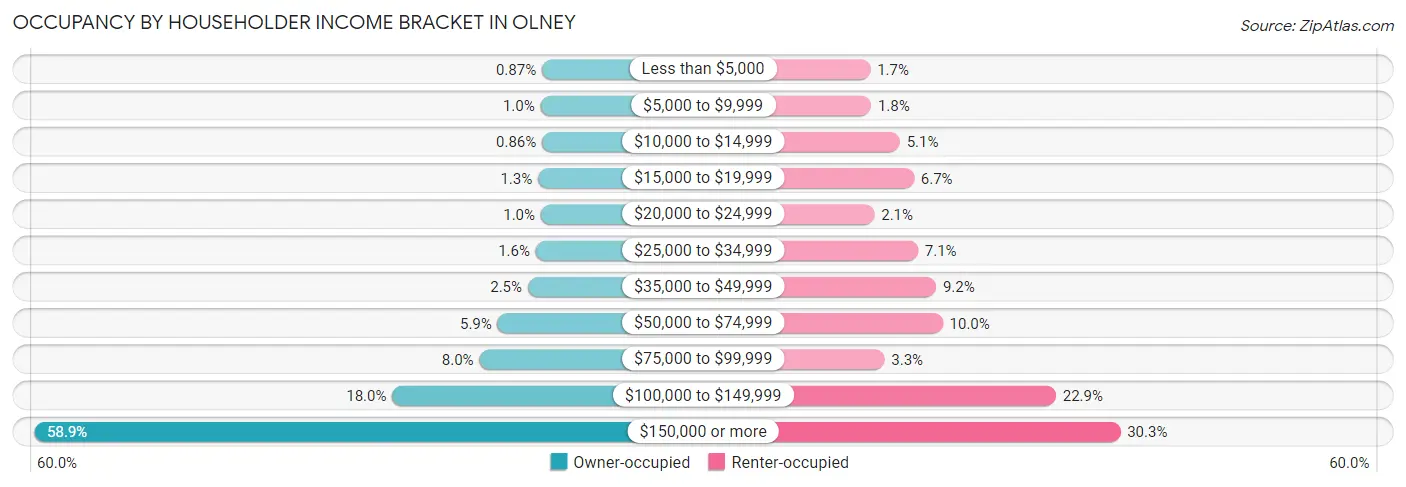
| Income Bracket | Owner-occupied | Renter-occupied |
| Less than $5,000 | 92 (0.9%) | 22 (1.7%) |
| $5,000 to $9,999 | 109 (1.0%) | 23 (1.8%) |
| $10,000 to $14,999 | 91 (0.9%) | 66 (5.1%) |
| $15,000 to $19,999 | 140 (1.3%) | 87 (6.7%) |
| $20,000 to $24,999 | 106 (1.0%) | 28 (2.1%) |
| $25,000 to $34,999 | 168 (1.6%) | 93 (7.1%) |
| $35,000 to $49,999 | 263 (2.5%) | 120 (9.2%) |
| $50,000 to $74,999 | 631 (5.9%) | 130 (10.0%) |
| $75,000 to $99,999 | 852 (8.0%) | 43 (3.3%) |
| $100,000 to $149,999 | 1,910 (18.0%) | 299 (22.9%) |
| $150,000 or more | 6,260 (58.9%) | 395 (30.2%) |
| Total | 10,622 (100.0%) | 1,306 (100.0%) |
Monthly Housing Cost Tiers in Olney
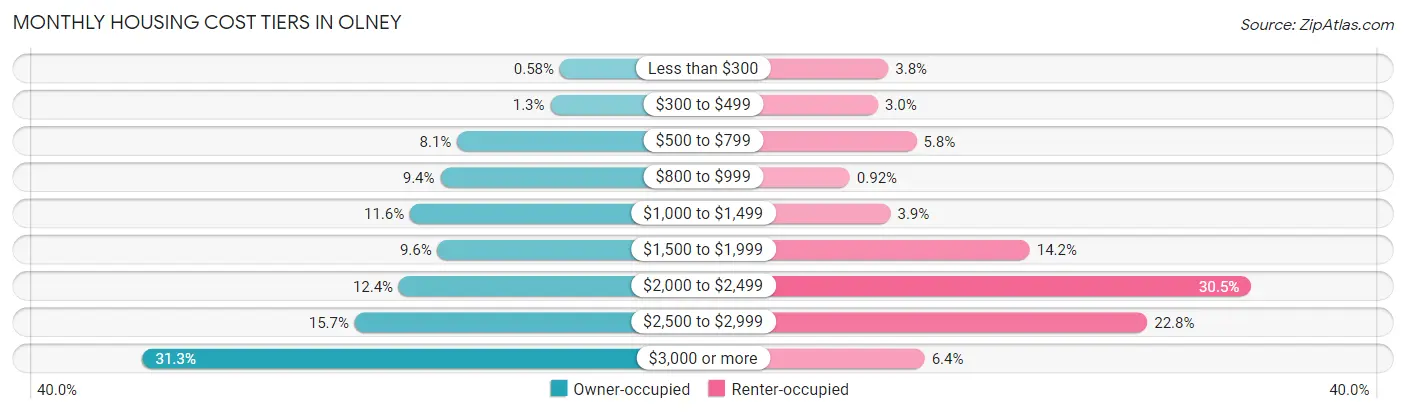
| Monthly Cost | Owner-occupied | Renter-occupied |
| Less than $300 | 62 (0.6%) | 49 (3.7%) |
| $300 to $499 | 136 (1.3%) | 39 (3.0%) |
| $500 to $799 | 865 (8.1%) | 76 (5.8%) |
| $800 to $999 | 996 (9.4%) | 12 (0.9%) |
| $1,000 to $1,499 | 1,233 (11.6%) | 51 (3.9%) |
| $1,500 to $1,999 | 1,019 (9.6%) | 185 (14.2%) |
| $2,000 to $2,499 | 1,320 (12.4%) | 398 (30.5%) |
| $2,500 to $2,999 | 1,665 (15.7%) | 298 (22.8%) |
| $3,000 or more | 3,326 (31.3%) | 84 (6.4%) |
| Total | 10,622 (100.0%) | 1,306 (100.0%) |
Physical Housing Characteristics in Olney
Housing Structures in Olney
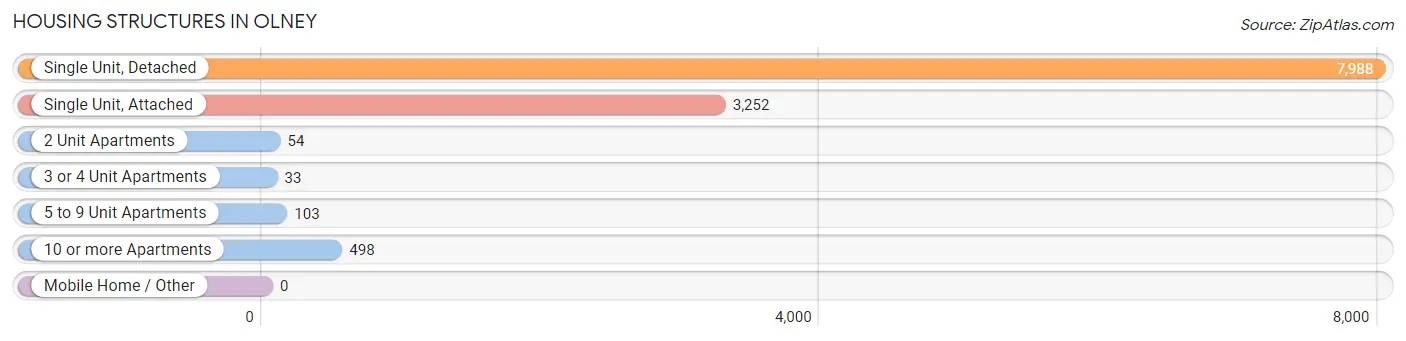
| Structure Type | # Housing Units | % Housing Units |
| Single Unit, Detached | 7,988 | 67.0% |
| Single Unit, Attached | 3,252 | 27.3% |
| 2 Unit Apartments | 54 | 0.4% |
| 3 or 4 Unit Apartments | 33 | 0.3% |
| 5 to 9 Unit Apartments | 103 | 0.9% |
| 10 or more Apartments | 498 | 4.2% |
| Mobile Home / Other | 0 | 0.0% |
| Total | 11,928 | 100.0% |
Housing Structures by Occupancy in Olney
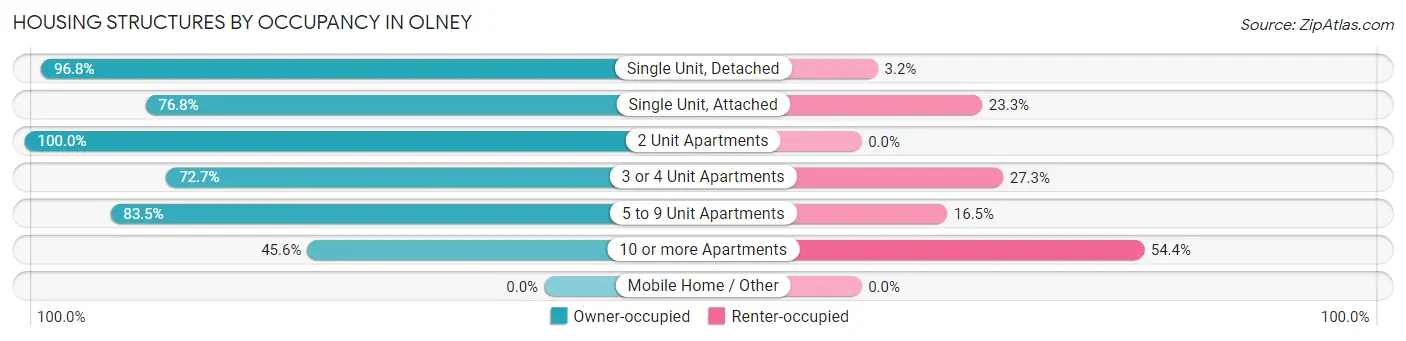
| Structure Type | Owner-occupied | Renter-occupied |
| Single Unit, Detached | 7,735 (96.8%) | 253 (3.2%) |
| Single Unit, Attached | 2,496 (76.7%) | 756 (23.3%) |
| 2 Unit Apartments | 54 (100.0%) | 0 (0.0%) |
| 3 or 4 Unit Apartments | 24 (72.7%) | 9 (27.3%) |
| 5 to 9 Unit Apartments | 86 (83.5%) | 17 (16.5%) |
| 10 or more Apartments | 227 (45.6%) | 271 (54.4%) |
| Mobile Home / Other | 0 (0.0%) | 0 (0.0%) |
| Total | 10,622 (89.0%) | 1,306 (11.0%) |
Housing Structures by Number of Rooms in Olney
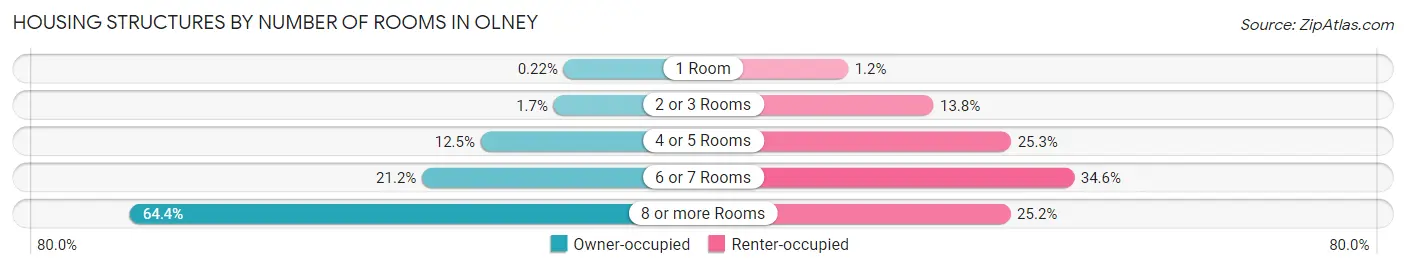
| Number of Rooms | Owner-occupied | Renter-occupied |
| 1 Room | 23 (0.2%) | 15 (1.1%) |
| 2 or 3 Rooms | 180 (1.7%) | 180 (13.8%) |
| 4 or 5 Rooms | 1,327 (12.5%) | 330 (25.3%) |
| 6 or 7 Rooms | 2,249 (21.2%) | 452 (34.6%) |
| 8 or more Rooms | 6,843 (64.4%) | 329 (25.2%) |
| Total | 10,622 (100.0%) | 1,306 (100.0%) |
Housing Structure by Heating Type in Olney
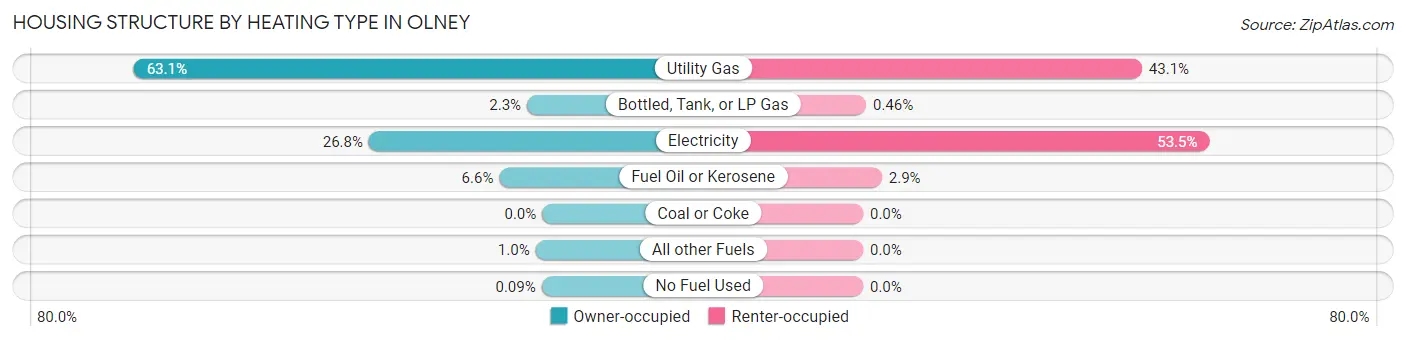
| Heating Type | Owner-occupied | Renter-occupied |
| Utility Gas | 6,705 (63.1%) | 563 (43.1%) |
| Bottled, Tank, or LP Gas | 249 (2.3%) | 6 (0.5%) |
| Electricity | 2,846 (26.8%) | 699 (53.5%) |
| Fuel Oil or Kerosene | 704 (6.6%) | 38 (2.9%) |
| Coal or Coke | 0 (0.0%) | 0 (0.0%) |
| All other Fuels | 108 (1.0%) | 0 (0.0%) |
| No Fuel Used | 10 (0.1%) | 0 (0.0%) |
| Total | 10,622 (100.0%) | 1,306 (100.0%) |
Household Vehicle Usage in Olney
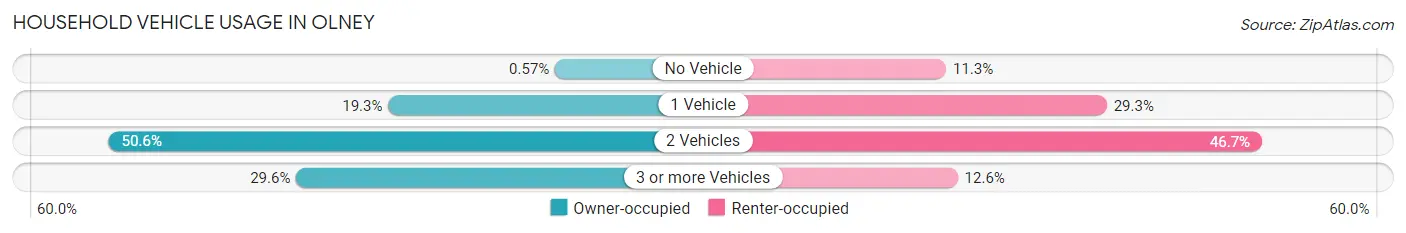
| Vehicles per Household | Owner-occupied | Renter-occupied |
| No Vehicle | 61 (0.6%) | 148 (11.3%) |
| 1 Vehicle | 2,046 (19.3%) | 383 (29.3%) |
| 2 Vehicles | 5,374 (50.6%) | 610 (46.7%) |
| 3 or more Vehicles | 3,141 (29.6%) | 165 (12.6%) |
| Total | 10,622 (100.0%) | 1,306 (100.0%) |
Real Estate & Mortgages in Olney
Real Estate and Mortgage Overview in Olney
| Characteristic | Without Mortgage | With Mortgage |
| Housing Units | 2,690 | 7,932 |
| Median Property Value | $620,700 | $613,800 |
| Median Household Income | $140,189 | $5,024 |
| Monthly Housing Costs | $885 | $3,326 |
| Real Estate Taxes | $5,564 | $101 |
Property Value by Mortgage Status in Olney
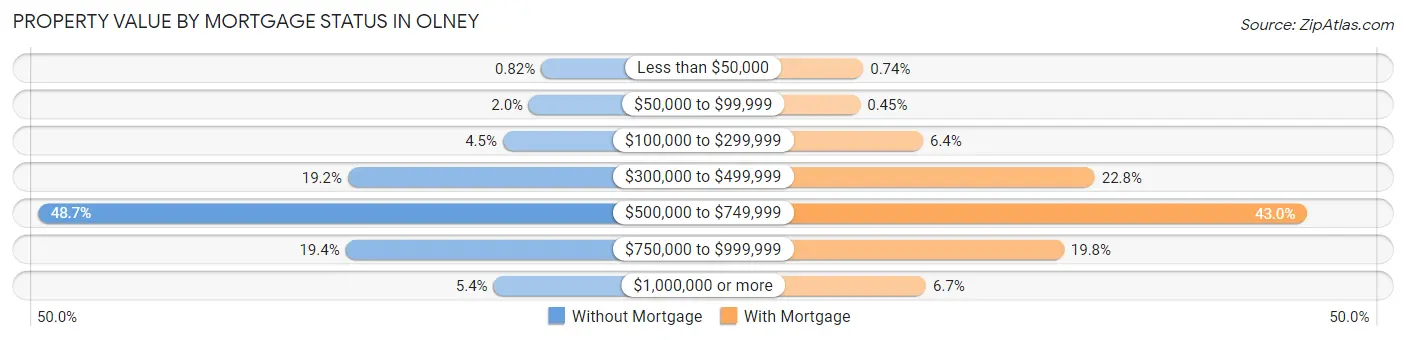
| Property Value | Without Mortgage | With Mortgage |
| Less than $50,000 | 22 (0.8%) | 59 (0.7%) |
| $50,000 to $99,999 | 53 (2.0%) | 36 (0.4%) |
| $100,000 to $299,999 | 120 (4.5%) | 510 (6.4%) |
| $300,000 to $499,999 | 517 (19.2%) | 1,808 (22.8%) |
| $500,000 to $749,999 | 1,311 (48.7%) | 3,412 (43.0%) |
| $750,000 to $999,999 | 523 (19.4%) | 1,574 (19.8%) |
| $1,000,000 or more | 144 (5.3%) | 533 (6.7%) |
| Total | 2,690 (100.0%) | 7,932 (100.0%) |
Household Income by Mortgage Status in Olney
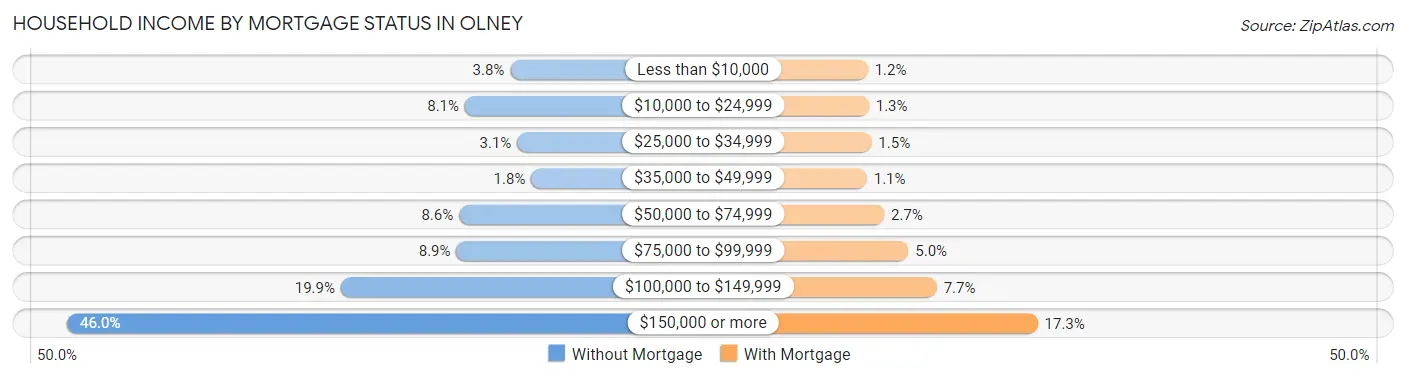
| Household Income | Without Mortgage | With Mortgage |
| Less than $10,000 | 101 (3.7%) | 92 (1.2%) |
| $10,000 to $24,999 | 217 (8.1%) | 100 (1.3%) |
| $25,000 to $34,999 | 83 (3.1%) | 120 (1.5%) |
| $35,000 to $49,999 | 47 (1.8%) | 85 (1.1%) |
| $50,000 to $74,999 | 232 (8.6%) | 216 (2.7%) |
| $75,000 to $99,999 | 239 (8.9%) | 399 (5.0%) |
| $100,000 to $149,999 | 535 (19.9%) | 613 (7.7%) |
| $150,000 or more | 1,236 (46.0%) | 1,375 (17.3%) |
| Total | 2,690 (100.0%) | 7,932 (100.0%) |
Property Value to Household Income Ratio in Olney
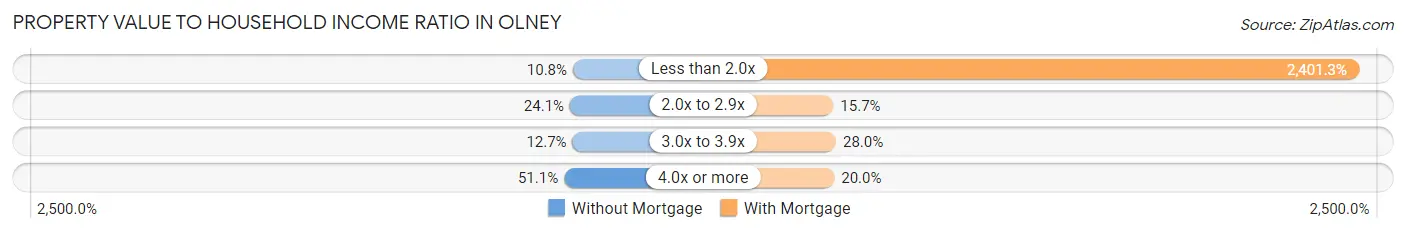
| Value-to-Income Ratio | Without Mortgage | With Mortgage |
| Less than 2.0x | 290 (10.8%) | 190,467 (2,401.2%) |
| 2.0x to 2.9x | 649 (24.1%) | 1,246 (15.7%) |
| 3.0x to 3.9x | 341 (12.7%) | 2,221 (28.0%) |
| 4.0x or more | 1,374 (51.1%) | 1,587 (20.0%) |
| Total | 2,690 (100.0%) | 7,932 (100.0%) |
Real Estate Taxes by Mortgage Status in Olney
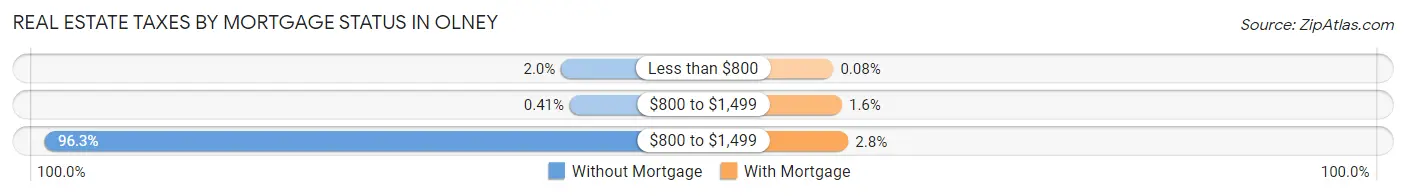
| Property Taxes | Without Mortgage | With Mortgage |
| Less than $800 | 54 (2.0%) | 6 (0.1%) |
| $800 to $1,499 | 11 (0.4%) | 130 (1.6%) |
| $800 to $1,499 | 2,589 (96.3%) | 223 (2.8%) |
| Total | 2,690 (100.0%) | 7,932 (100.0%) |
Health & Disability in Olney
Health Insurance Coverage by Age in Olney
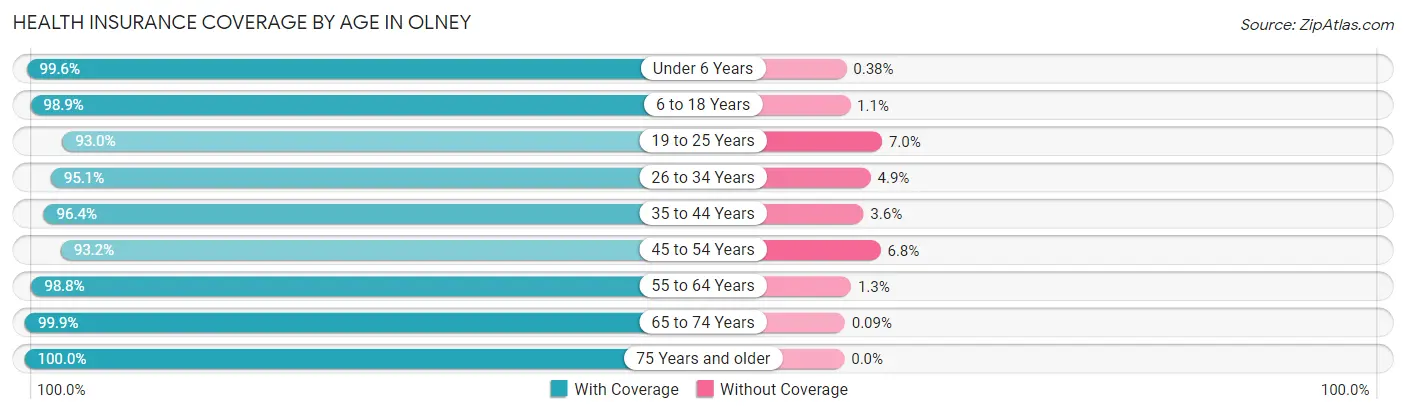
| Age Bracket | With Coverage | Without Coverage |
| Under 6 Years | 2,384 (99.6%) | 9 (0.4%) |
| 6 to 18 Years | 6,976 (98.9%) | 77 (1.1%) |
| 19 to 25 Years | 2,262 (93.0%) | 171 (7.0%) |
| 26 to 34 Years | 2,544 (95.1%) | 131 (4.9%) |
| 35 to 44 Years | 4,364 (96.4%) | 161 (3.6%) |
| 45 to 54 Years | 4,893 (93.2%) | 355 (6.8%) |
| 55 to 64 Years | 5,070 (98.8%) | 64 (1.3%) |
| 65 to 74 Years | 3,468 (99.9%) | 3 (0.1%) |
| 75 Years and older | 2,474 (100.0%) | 0 (0.0%) |
| Total | 34,435 (97.3%) | 971 (2.7%) |
Health Insurance Coverage by Citizenship Status in Olney
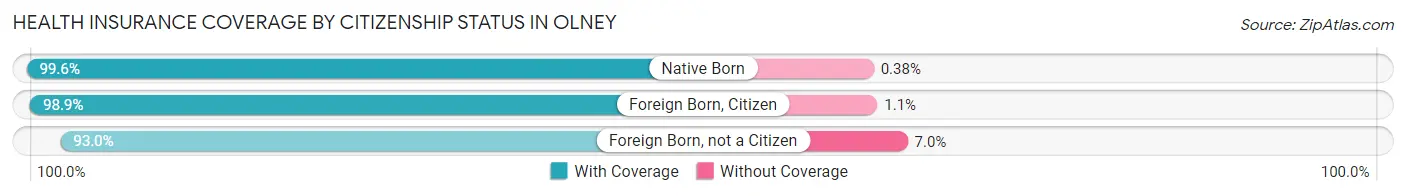
| Citizenship Status | With Coverage | Without Coverage |
| Native Born | 2,384 (99.6%) | 9 (0.4%) |
| Foreign Born, Citizen | 6,976 (98.9%) | 77 (1.1%) |
| Foreign Born, not a Citizen | 2,262 (93.0%) | 171 (7.0%) |
Health Insurance Coverage by Household Income in Olney
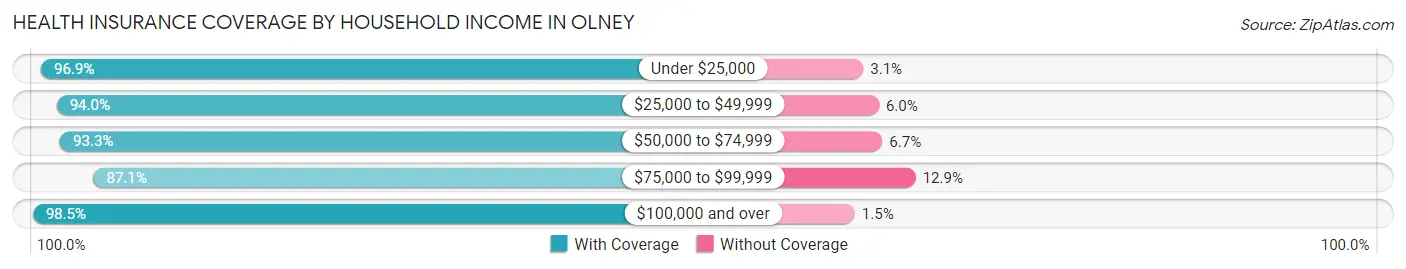
| Household Income | With Coverage | Without Coverage |
| Under $25,000 | 1,250 (96.9%) | 40 (3.1%) |
| $25,000 to $49,999 | 1,154 (94.0%) | 74 (6.0%) |
| $50,000 to $74,999 | 1,902 (93.3%) | 136 (6.7%) |
| $75,000 to $99,999 | 1,927 (87.1%) | 286 (12.9%) |
| $100,000 and over | 28,114 (98.5%) | 435 (1.5%) |
Public vs Private Health Insurance Coverage by Age in Olney
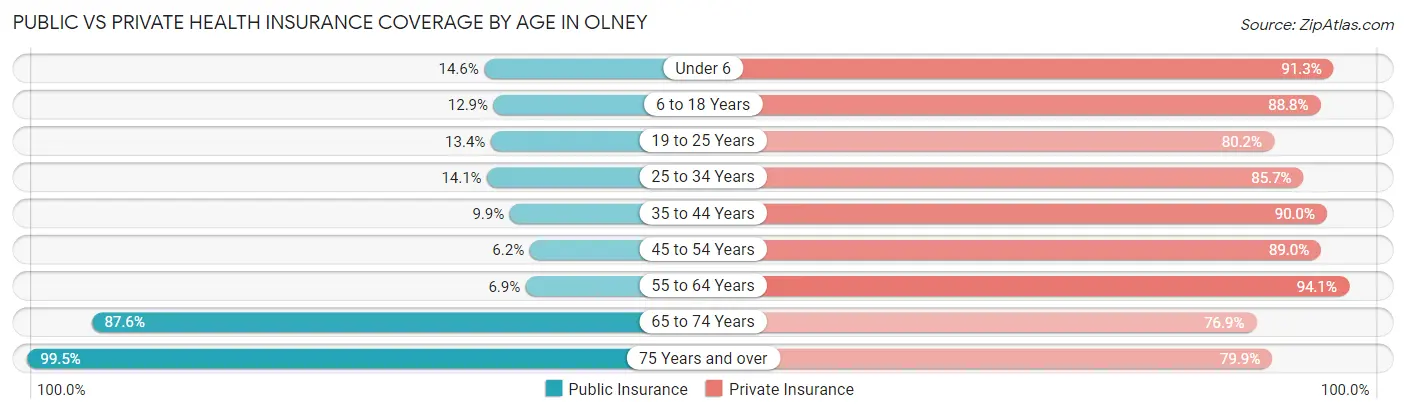
| Age Bracket | Public Insurance | Private Insurance |
| Under 6 | 350 (14.6%) | 2,184 (91.3%) |
| 6 to 18 Years | 910 (12.9%) | 6,264 (88.8%) |
| 19 to 25 Years | 326 (13.4%) | 1,951 (80.2%) |
| 25 to 34 Years | 377 (14.1%) | 2,292 (85.7%) |
| 35 to 44 Years | 448 (9.9%) | 4,073 (90.0%) |
| 45 to 54 Years | 325 (6.2%) | 4,668 (88.9%) |
| 55 to 64 Years | 356 (6.9%) | 4,831 (94.1%) |
| 65 to 74 Years | 3,040 (87.6%) | 2,670 (76.9%) |
| 75 Years and over | 2,461 (99.5%) | 1,976 (79.9%) |
| Total | 8,593 (24.3%) | 30,909 (87.3%) |
Disability Status by Sex by Age in Olney
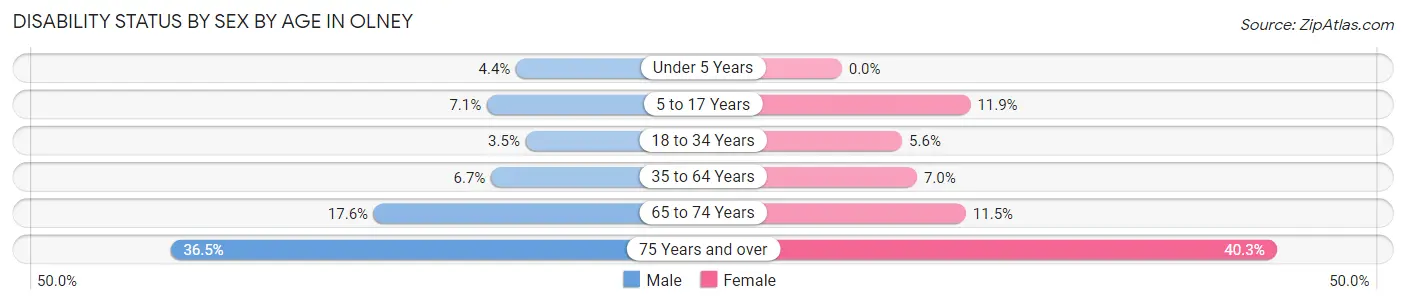
| Age Bracket | Male | Female |
| Under 5 Years | 43 (4.4%) | 0 (0.0%) |
| 5 to 17 Years | 277 (7.1%) | 356 (11.9%) |
| 18 to 34 Years | 96 (3.5%) | 161 (5.6%) |
| 35 to 64 Years | 482 (6.7%) | 538 (7.0%) |
| 65 to 74 Years | 282 (17.6%) | 215 (11.5%) |
| 75 Years and over | 385 (36.5%) | 572 (40.3%) |
Disability Class by Sex by Age in Olney
Disability Class: Hearing Difficulty
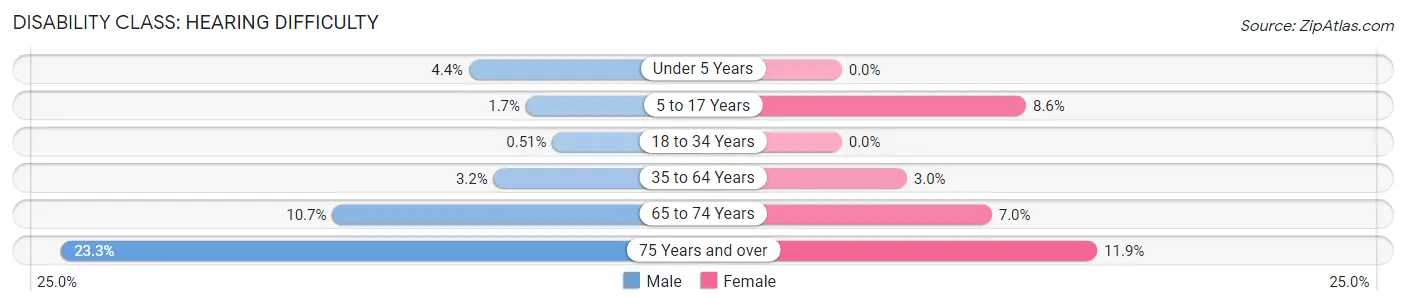
| Age Bracket | Male | Female |
| Under 5 Years | 43 (4.4%) | 0 (0.0%) |
| 5 to 17 Years | 68 (1.7%) | 255 (8.6%) |
| 18 to 34 Years | 14 (0.5%) | 0 (0.0%) |
| 35 to 64 Years | 233 (3.2%) | 233 (3.0%) |
| 65 to 74 Years | 172 (10.7%) | 130 (7.0%) |
| 75 Years and over | 246 (23.3%) | 168 (11.8%) |
Disability Class: Vision Difficulty
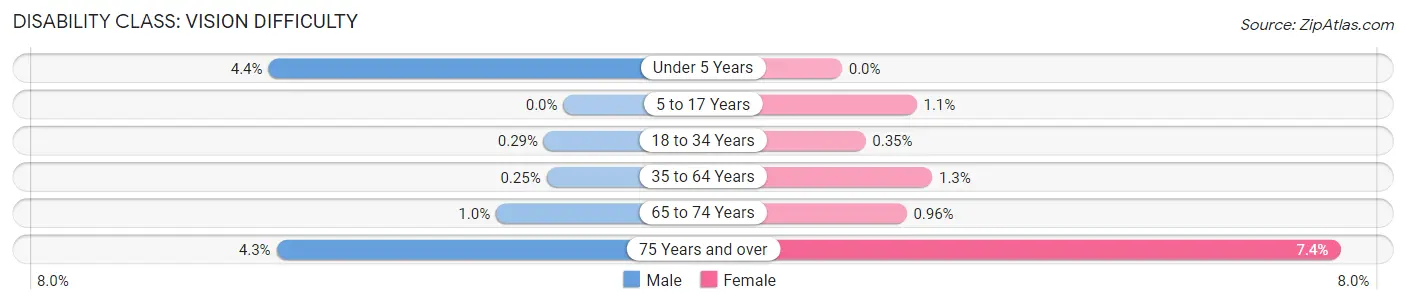
| Age Bracket | Male | Female |
| Under 5 Years | 43 (4.4%) | 0 (0.0%) |
| 5 to 17 Years | 0 (0.0%) | 33 (1.1%) |
| 18 to 34 Years | 8 (0.3%) | 10 (0.4%) |
| 35 to 64 Years | 18 (0.3%) | 103 (1.3%) |
| 65 to 74 Years | 16 (1.0%) | 18 (1.0%) |
| 75 Years and over | 45 (4.3%) | 105 (7.4%) |
Disability Class: Cognitive Difficulty
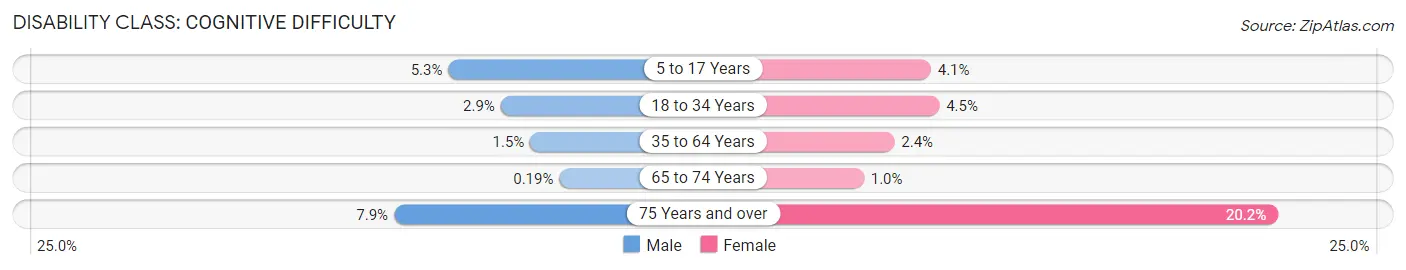
| Age Bracket | Male | Female |
| 5 to 17 Years | 209 (5.3%) | 123 (4.1%) |
| 18 to 34 Years | 80 (2.9%) | 130 (4.5%) |
| 35 to 64 Years | 111 (1.5%) | 188 (2.4%) |
| 65 to 74 Years | 3 (0.2%) | 19 (1.0%) |
| 75 Years and over | 83 (7.9%) | 287 (20.2%) |
Disability Class: Ambulatory Difficulty
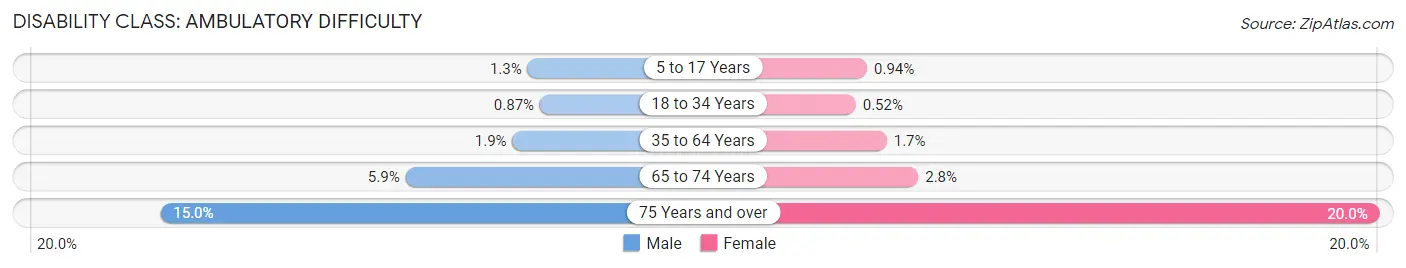
| Age Bracket | Male | Female |
| 5 to 17 Years | 52 (1.3%) | 28 (0.9%) |
| 18 to 34 Years | 24 (0.9%) | 15 (0.5%) |
| 35 to 64 Years | 136 (1.9%) | 129 (1.7%) |
| 65 to 74 Years | 94 (5.9%) | 53 (2.8%) |
| 75 Years and over | 158 (15.0%) | 283 (20.0%) |
Disability Class: Self-Care Difficulty
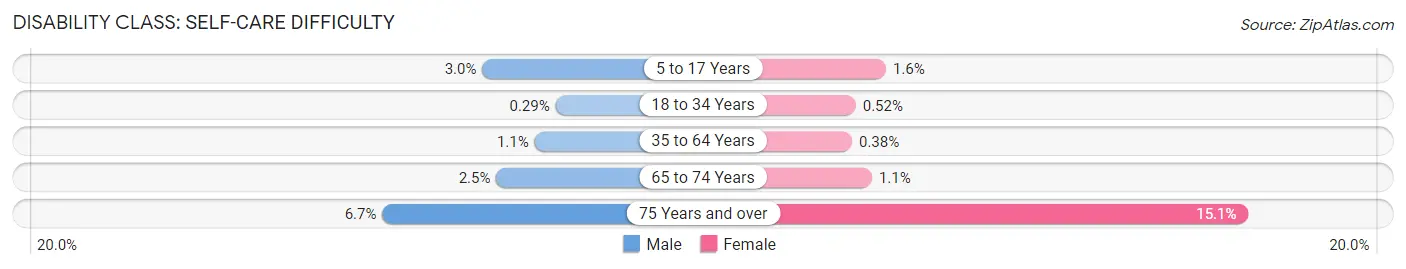
| Age Bracket | Male | Female |
| 5 to 17 Years | 118 (3.0%) | 49 (1.6%) |
| 18 to 34 Years | 8 (0.3%) | 15 (0.5%) |
| 35 to 64 Years | 77 (1.1%) | 29 (0.4%) |
| 65 to 74 Years | 40 (2.5%) | 21 (1.1%) |
| 75 Years and over | 71 (6.7%) | 214 (15.1%) |
Technology Access in Olney
Computing Device Access in Olney
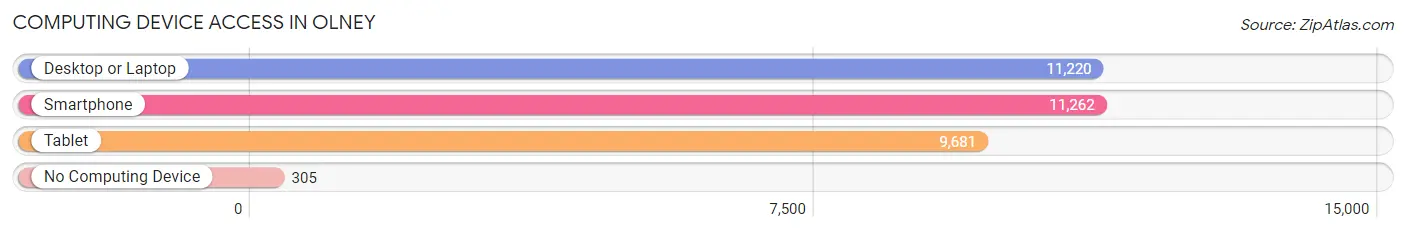
| Device Type | # Households | % Households |
| Desktop or Laptop | 11,220 | 94.1% |
| Smartphone | 11,262 | 94.4% |
| Tablet | 9,681 | 81.2% |
| No Computing Device | 305 | 2.6% |
| Total | 11,928 | 100.0% |
Internet Access in Olney
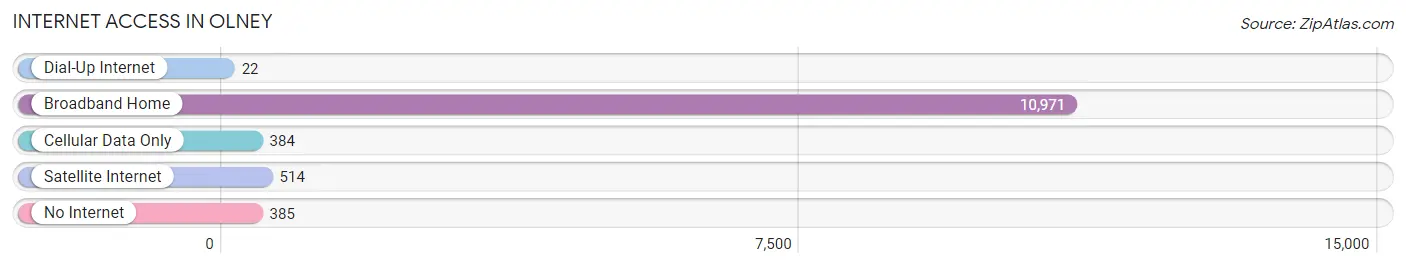
| Internet Type | # Households | % Households |
| Dial-Up Internet | 22 | 0.2% |
| Broadband Home | 10,971 | 92.0% |
| Cellular Data Only | 384 | 3.2% |
| Satellite Internet | 514 | 4.3% |
| No Internet | 385 | 3.2% |
| Total | 11,928 | 100.0% |
Olney Summary
Olney, Maryland is a census-designated place located in Montgomery County, Maryland. It is situated in the northern part of the county, approximately 20 miles north of Washington, D.C. The population of Olney was 33,844 at the 2010 census.
History
The area that is now Olney was first settled in 1740 by the family of James Olney, who had purchased the land from the local Native Americans. The area was known as “Olney’s Addition” and was part of the larger Brookeville area. In 1878, the area was officially incorporated as the Town of Olney. The town was named after James Olney, who had been a prominent local landowner.
In the late 19th century, Olney was a popular summer resort for wealthy Washingtonians. The town was known for its many large estates and its picturesque countryside. In the early 20th century, Olney began to experience a population boom as more people moved to the area. This growth was spurred by the development of the Washington Suburban Sanitary Commission, which provided water and sewer services to the area.
Geography
Olney is located at 39°10'17" North, 77°6'45" West (39.1714, -77.1124). According to the United States Census Bureau, the CDP has a total area of 11.2 square miles, of which 11.1 square miles is land and 0.1 square miles is water.
The terrain of Olney is mostly rolling hills, with some flat areas. The area is part of the Piedmont Plateau, which is characterized by its hilly terrain and rocky soil. The area is also home to several streams, including the Little Paint Branch, the Little Seneca Creek, and the Rock Creek.
Economy
Olney’s economy is largely based on the service industry. The area is home to several large employers, including the Montgomery County Public Schools, the Montgomery County Government, and the Montgomery County Public Library. Other major employers in the area include the Montgomery County Hospital, the Montgomery County Fire and Rescue Service, and the Montgomery County Police Department.
The area is also home to several retail establishments, including the Olney Town Center, which is a shopping center that features a variety of stores and restaurants. Other retail establishments in the area include the Olney Farmers Market, the Olney Antique Mall, and the Olney Shopping Center.
Demographics
As of the 2010 census, there were 33,844 people, 11,945 households, and 8,845 families residing in the CDP. The population density was 3,039.3 people per square mile. The racial makeup of the CDP was 74.2% White, 14.3% African American, 0.3% Native American, 6.2% Asian, 0.1% Pacific Islander, 2.2% from other races, and 2.9% from two or more races. Hispanic or Latino of any race were 6.2% of the population.
The median income for a household in the CDP was $107,945, and the median income for a family was $122,945. Males had a median income of $87,945 versus $60,945 for females. The per capita income for the CDP was $45,945. About 2.2% of families and 3.3% of the population were below the poverty line, including 4.2% of those under age 18 and 2.2% of those age 65 or over.
Common Questions
What is Per Capita Income in Olney?
Per Capita income in Olney is $65,236.
What is the Median Family Income in Olney?
Median Family Income in Olney is $186,230.
What is the Median Household income in Olney?
Median Household Income in Olney is $166,541.
What is Income or Wage Gap in Olney?
Income or Wage Gap in Olney is 24.8%.
Women in Olney earn 75.2 cents for every dollar earned by a man.
What is Family Income Deficit in Olney?
Family Income Deficit in Olney is $11,883.
Families that are below poverty line in Olney earn $11,883 less on average than the poverty threshold level.
What is Inequality or Gini Index in Olney?
Inequality or Gini Index in Olney is 0.38.
What is the Total Population of Olney?
Total Population of Olney is 35,522.
What is the Total Male Population of Olney?
Total Male Population of Olney is 17,546.
What is the Total Female Population of Olney?
Total Female Population of Olney is 17,976.
What is the Ratio of Males per 100 Females in Olney?
There are 97.61 Males per 100 Females in Olney.
What is the Ratio of Females per 100 Males in Olney?
There are 102.45 Females per 100 Males in Olney.
What is the Median Population Age in Olney?
Median Population Age in Olney is 42.0 Years.
What is the Average Family Size in Olney
Average Family Size in Olney is 3.3 People.
What is the Average Household Size in Olney
Average Household Size in Olney is 3.0 People.
How Large is the Labor Force in Olney?
There are 19,329 People in the Labor Forcein in Olney.
What is the Percentage of People in the Labor Force in Olney?
69.1% of People are in the Labor Force in Olney.
What is the Unemployment Rate in Olney?
Unemployment Rate in Olney is 3.5%.