Richardson, TX Map & Demographics
Richardson Map
Richardson Overview
$48,231
PER CAPITA INCOME
$114,293
AVG FAMILY INCOME
$94,362
AVG HOUSEHOLD INCOME
19.0%
WAGE / INCOME GAP [ % ]
81.0¢/ $1
WAGE / INCOME GAP [ $ ]
$10,720
FAMILY INCOME DEFICIT
0.45
INEQUALITY / GINI INDEX
118,063
TOTAL POPULATION
57,576
MALE POPULATION
60,487
FEMALE POPULATION
95.19
MALES / 100 FEMALES
105.06
FEMALES / 100 MALES
34.5
MEDIAN AGE
3.1
AVG FAMILY SIZE
2.5
AVG HOUSEHOLD SIZE
67,864
LABOR FORCE [ PEOPLE ]
70.5%
PERCENT IN LABOR FORCE
5.0%
UNEMPLOYMENT RATE
Income in Richardson
Income Overview in Richardson
Per Capita Income in Richardson is $48,231, while median incomes of families and households are $114,293 and $94,362 respectively.
| Characteristic | Number | Measure |
| Per Capita Income | 118,063 | $48,231 |
| Median Family Income | 28,717 | $114,293 |
| Mean Family Income | 28,717 | $147,948 |
| Median Household Income | 45,200 | $94,362 |
| Mean Household Income | 45,200 | $123,324 |
| Income Deficit | 28,717 | $10,720 |
| Wage / Income Gap (%) | 118,063 | 18.99% |
| Wage / Income Gap ($) | 118,063 | 81.01¢ per $1 |
| Gini / Inequality Index | 118,063 | 0.45 |
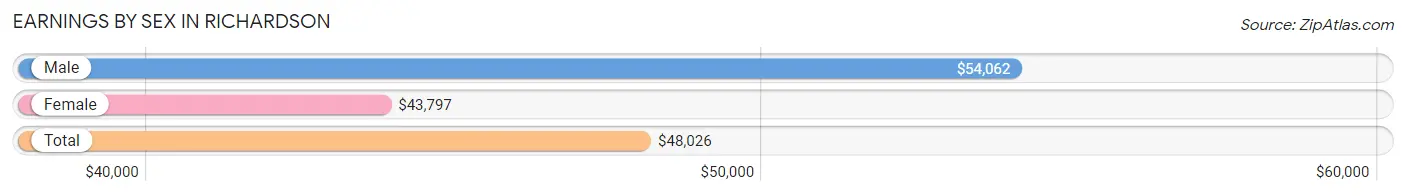
Earnings by Sex in Richardson
Average Earnings in Richardson are $48,026, $54,062 for men and $43,797 for women, a difference of 19.0%.
| Sex | Number | Average Earnings |
| Male | 37,668 (52.8%) | $54,062 |
| Female | 33,621 (47.2%) | $43,797 |
| Total | 71,289 (100.0%) | $48,026 |
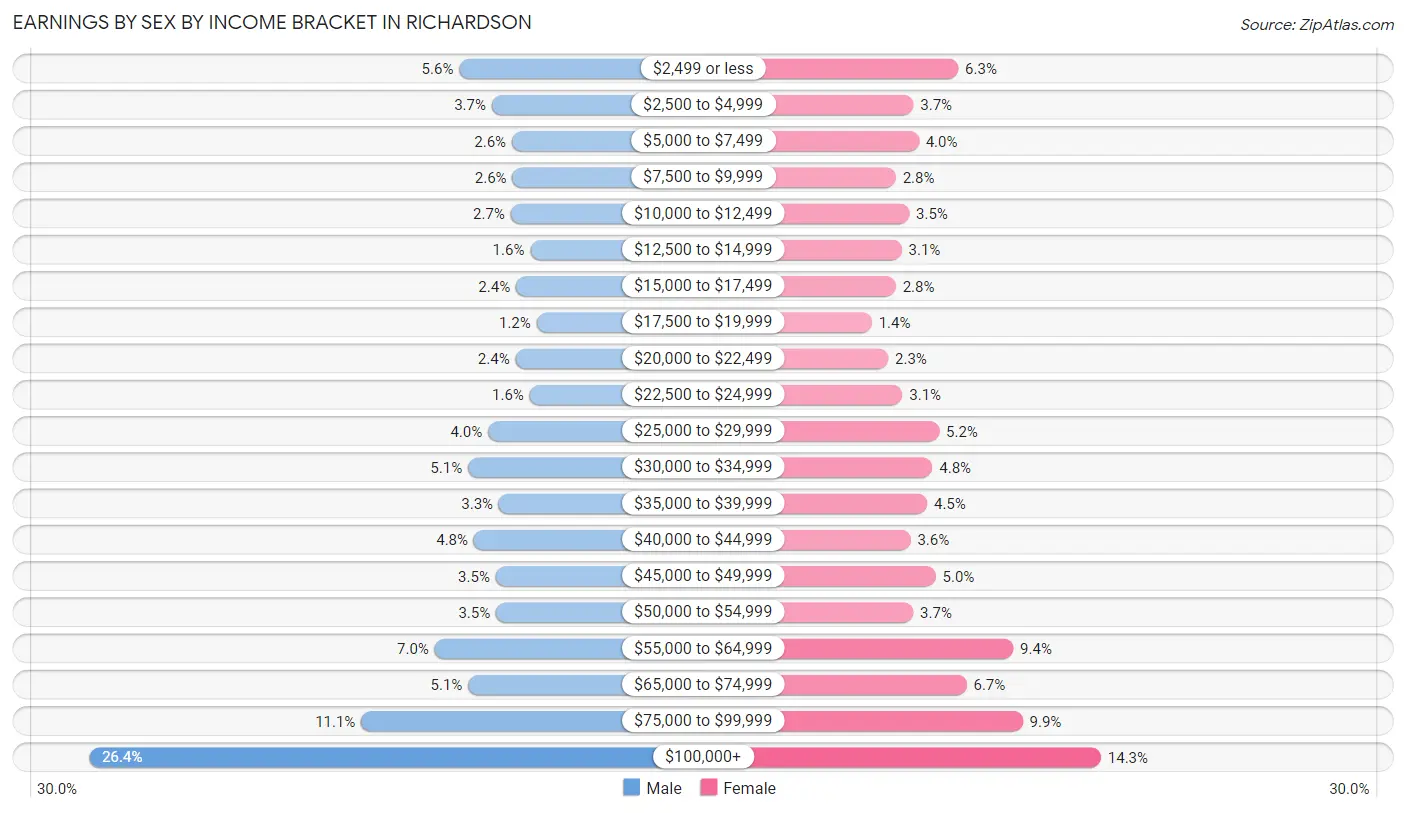
Earnings by Sex by Income Bracket in Richardson
The most common earnings brackets in Richardson are $100,000+ for men (9,937 | 26.4%) and $100,000+ for women (4,801 | 14.3%).
| Income | Male | Female |
| $2,499 or less | 2,098 (5.6%) | 2,105 (6.3%) |
| $2,500 to $4,999 | 1,410 (3.7%) | 1,256 (3.7%) |
| $5,000 to $7,499 | 985 (2.6%) | 1,359 (4.0%) |
| $7,500 to $9,999 | 972 (2.6%) | 923 (2.8%) |
| $10,000 to $12,499 | 1,011 (2.7%) | 1,176 (3.5%) |
| $12,500 to $14,999 | 596 (1.6%) | 1,036 (3.1%) |
| $15,000 to $17,499 | 896 (2.4%) | 924 (2.8%) |
| $17,500 to $19,999 | 459 (1.2%) | 472 (1.4%) |
| $20,000 to $22,499 | 906 (2.4%) | 779 (2.3%) |
| $22,500 to $24,999 | 606 (1.6%) | 1,049 (3.1%) |
| $25,000 to $29,999 | 1,487 (4.0%) | 1,744 (5.2%) |
| $30,000 to $34,999 | 1,913 (5.1%) | 1,616 (4.8%) |
| $35,000 to $39,999 | 1,258 (3.3%) | 1,517 (4.5%) |
| $40,000 to $44,999 | 1,788 (4.8%) | 1,202 (3.6%) |
| $45,000 to $49,999 | 1,326 (3.5%) | 1,677 (5.0%) |
| $50,000 to $54,999 | 1,320 (3.5%) | 1,253 (3.7%) |
| $55,000 to $64,999 | 2,619 (7.0%) | 3,145 (9.3%) |
| $65,000 to $74,999 | 1,908 (5.1%) | 2,264 (6.7%) |
| $75,000 to $99,999 | 4,173 (11.1%) | 3,323 (9.9%) |
| $100,000+ | 9,937 (26.4%) | 4,801 (14.3%) |
| Total | 37,668 (100.0%) | 33,621 (100.0%) |
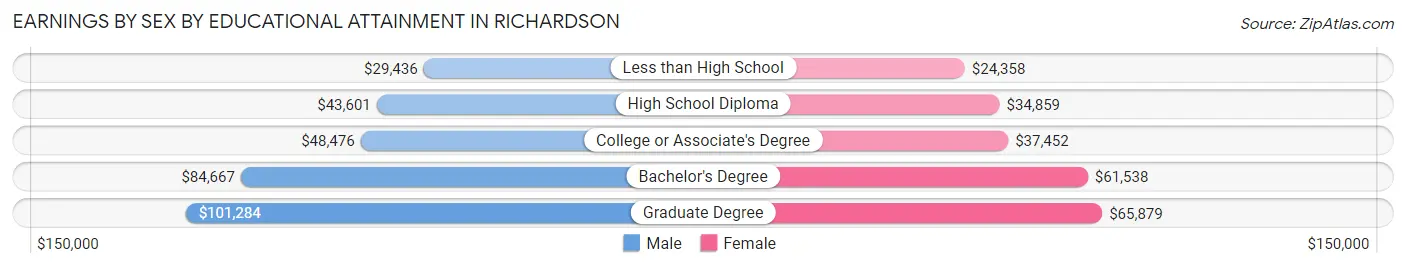
Earnings by Sex by Educational Attainment in Richardson
Average earnings in Richardson are $64,389 for men and $51,369 for women, a difference of 20.2%. Men with an educational attainment of graduate degree enjoy the highest average annual earnings of $101,284, while those with less than high school education earn the least with $29,436. Women with an educational attainment of graduate degree earn the most with the average annual earnings of $65,879, while those with less than high school education have the smallest earnings of $24,358.
| Educational Attainment | Male Income | Female Income |
| Less than High School | $29,436 | $24,358 |
| High School Diploma | $43,601 | $34,859 |
| College or Associate's Degree | $48,476 | $37,452 |
| Bachelor's Degree | $84,667 | $61,538 |
| Graduate Degree | $101,284 | $65,879 |
| Total | $64,389 | $51,369 |
Family Income in Richardson
Family Income Brackets in Richardson
According to the Richardson family income data, there are 6,433 families falling into the $100,000 to $149,999 income range, which is the most common income bracket and makes up 22.4% of all families. Conversely, the $10,000 to $14,999 income bracket is the least frequent group with only 402 families (1.4%) belonging to this category.
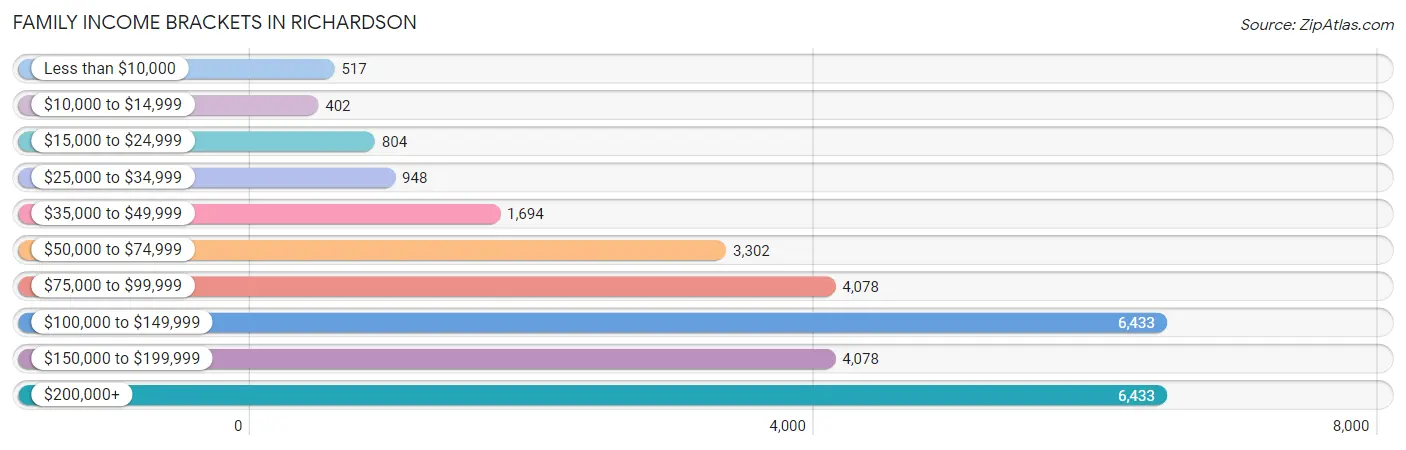
| Income Bracket | # Families | % Families |
| Less than $10,000 | 517 | 1.8% |
| $10,000 to $14,999 | 402 | 1.4% |
| $15,000 to $24,999 | 804 | 2.8% |
| $25,000 to $34,999 | 948 | 3.3% |
| $35,000 to $49,999 | 1,694 | 5.9% |
| $50,000 to $74,999 | 3,302 | 11.5% |
| $75,000 to $99,999 | 4,078 | 14.2% |
| $100,000 to $149,999 | 6,433 | 22.4% |
| $150,000 to $199,999 | 4,078 | 14.2% |
| $200,000+ | 6,433 | 22.4% |
Family Income by Famaliy Size in Richardson
7+ person families (385 | 1.3%) account for the highest median family income in Richardson with $160,076 per family, while 2-person families (13,121 | 45.7%) have the highest median income of $55,097 per family member.
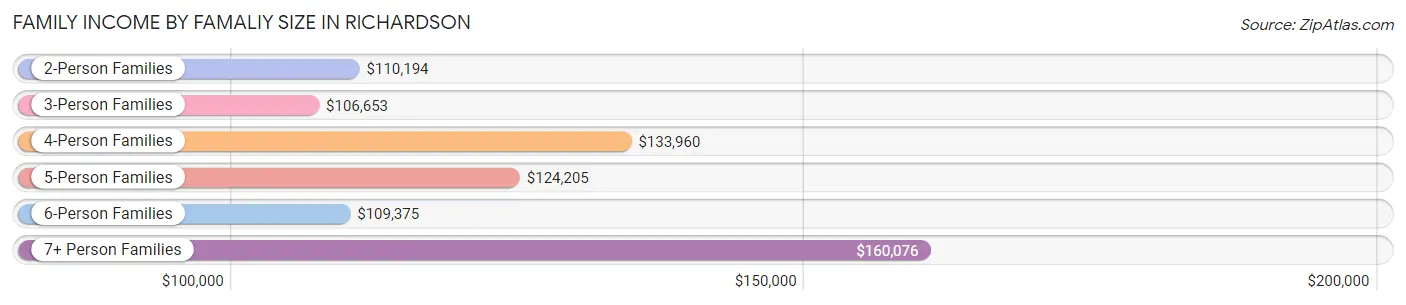
| Income Bracket | # Families | Median Income |
| 2-Person Families | 13,121 (45.7%) | $110,194 |
| 3-Person Families | 6,554 (22.8%) | $106,653 |
| 4-Person Families | 5,168 (18.0%) | $133,960 |
| 5-Person Families | 2,662 (9.3%) | $124,205 |
| 6-Person Families | 827 (2.9%) | $109,375 |
| 7+ Person Families | 385 (1.3%) | $160,076 |
| Total | 28,717 (100.0%) | $114,293 |
Family Income by Number of Earners in Richardson
The median family income in Richardson is $114,293, with families comprising 2 earners (13,312) having the highest median family income of $138,678, while families with no earners (2,381) have the lowest median family income of $59,240, accounting for 46.4% and 8.3% of families, respectively.
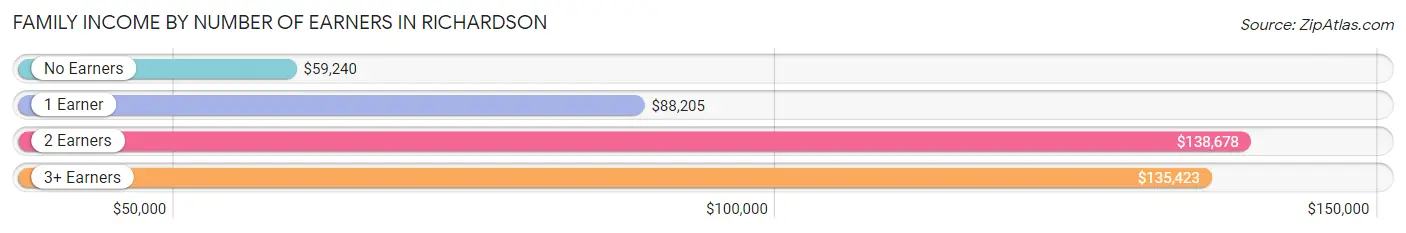
| Number of Earners | # Families | Median Income |
| No Earners | 2,381 (8.3%) | $59,240 |
| 1 Earner | 9,013 (31.4%) | $88,205 |
| 2 Earners | 13,312 (46.4%) | $138,678 |
| 3+ Earners | 4,011 (14.0%) | $135,423 |
| Total | 28,717 (100.0%) | $114,293 |
Household Income in Richardson
Household Income Brackets in Richardson
With 8,950 households falling in the category, the $100,000 to $149,999 income range is the most frequent in Richardson, accounting for 19.8% of all households. In contrast, only 768 households (1.7%) fall into the $10,000 to $14,999 income bracket, making it the least populous group.
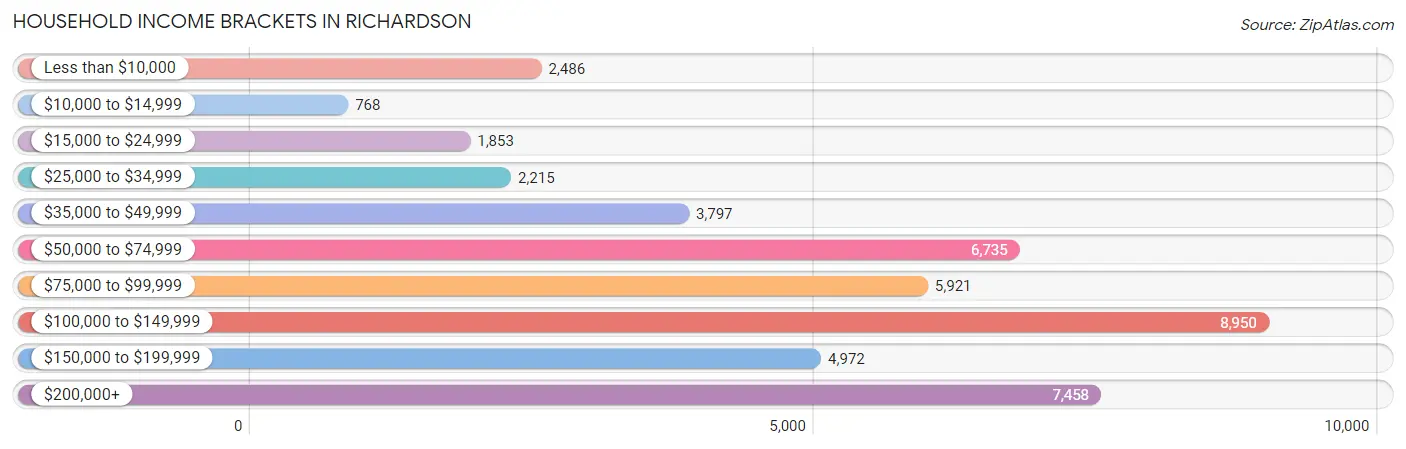
| Income Bracket | # Households | % Households |
| Less than $10,000 | 2,486 | 5.5% |
| $10,000 to $14,999 | 768 | 1.7% |
| $15,000 to $24,999 | 1,853 | 4.1% |
| $25,000 to $34,999 | 2,215 | 4.9% |
| $35,000 to $49,999 | 3,797 | 8.4% |
| $50,000 to $74,999 | 6,735 | 14.9% |
| $75,000 to $99,999 | 5,921 | 13.1% |
| $100,000 to $149,999 | 8,950 | 19.8% |
| $150,000 to $199,999 | 4,972 | 11.0% |
| $200,000+ | 7,458 | 16.5% |
Household Income by Householder Age in Richardson
The median household income in Richardson is $94,362, with the highest median household income of $116,914 found in the 45 to 64 years age bracket for the primary householder. A total of 15,539 households (34.4%) fall into this category. Meanwhile, the 15 to 24 years age bracket for the primary householder has the lowest median household income of $28,713, with 2,818 households (6.2%) in this group.
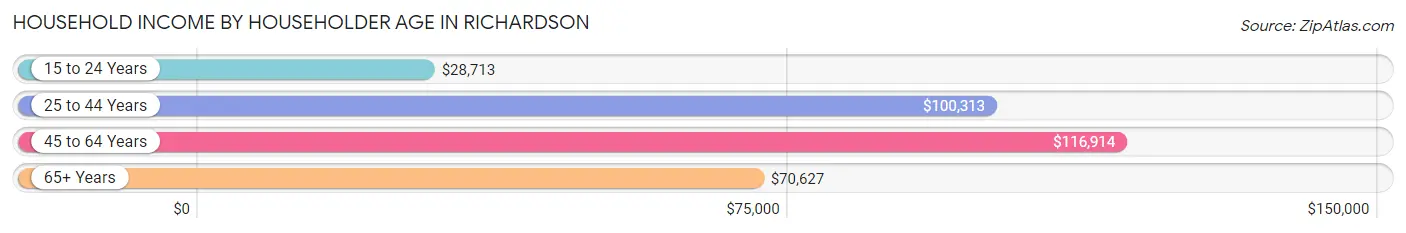
| Income Bracket | # Households | Median Income |
| 15 to 24 Years | 2,818 (6.2%) | $28,713 |
| 25 to 44 Years | 17,703 (39.2%) | $100,313 |
| 45 to 64 Years | 15,539 (34.4%) | $116,914 |
| 65+ Years | 9,140 (20.2%) | $70,627 |
| Total | 45,200 (100.0%) | $94,362 |
Poverty in Richardson
Income Below Poverty by Sex and Age in Richardson
With 9.7% poverty level for males and 11.9% for females among the residents of Richardson, 18 to 24 year old males and 15 year old females are the most vulnerable to poverty, with 2,113 males (35.5%) and 206 females (32.9%) in their respective age groups living below the poverty level.
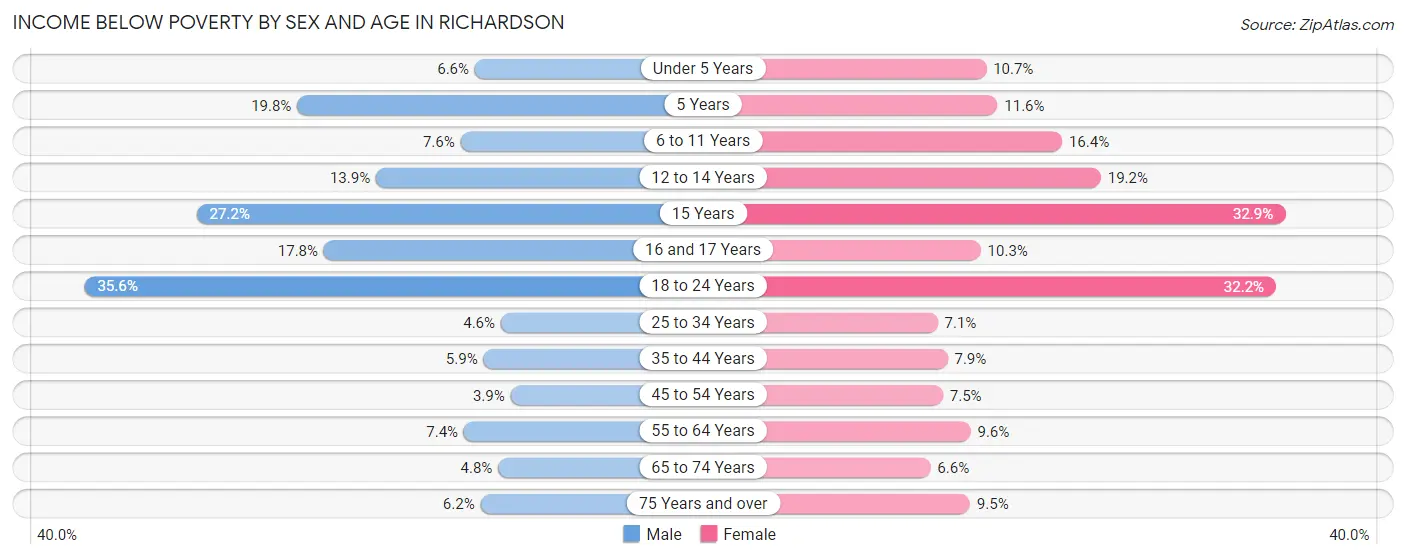
| Age Bracket | Male | Female |
| Under 5 Years | 263 (6.6%) | 374 (10.7%) |
| 5 Years | 84 (19.8%) | 84 (11.6%) |
| 6 to 11 Years | 270 (7.6%) | 662 (16.4%) |
| 12 to 14 Years | 296 (13.9%) | 442 (19.2%) |
| 15 Years | 107 (27.2%) | 206 (32.9%) |
| 16 and 17 Years | 223 (17.8%) | 178 (10.3%) |
| 18 to 24 Years | 2,113 (35.5%) | 1,902 (32.2%) |
| 25 to 34 Years | 486 (4.6%) | 699 (7.1%) |
| 35 to 44 Years | 407 (5.9%) | 639 (7.9%) |
| 45 to 54 Years | 277 (3.9%) | 594 (7.5%) |
| 55 to 64 Years | 486 (7.4%) | 615 (9.6%) |
| 65 to 74 Years | 202 (4.8%) | 309 (6.6%) |
| 75 Years and over | 156 (6.1%) | 303 (9.5%) |
| Total | 5,370 (9.7%) | 7,007 (11.9%) |
Income Above Poverty by Sex and Age in Richardson
According to the poverty statistics in Richardson, males aged 45 to 54 years and females aged 65 to 74 years are the age groups that are most secure financially, with 96.1% of males and 93.4% of females in these age groups living above the poverty line.
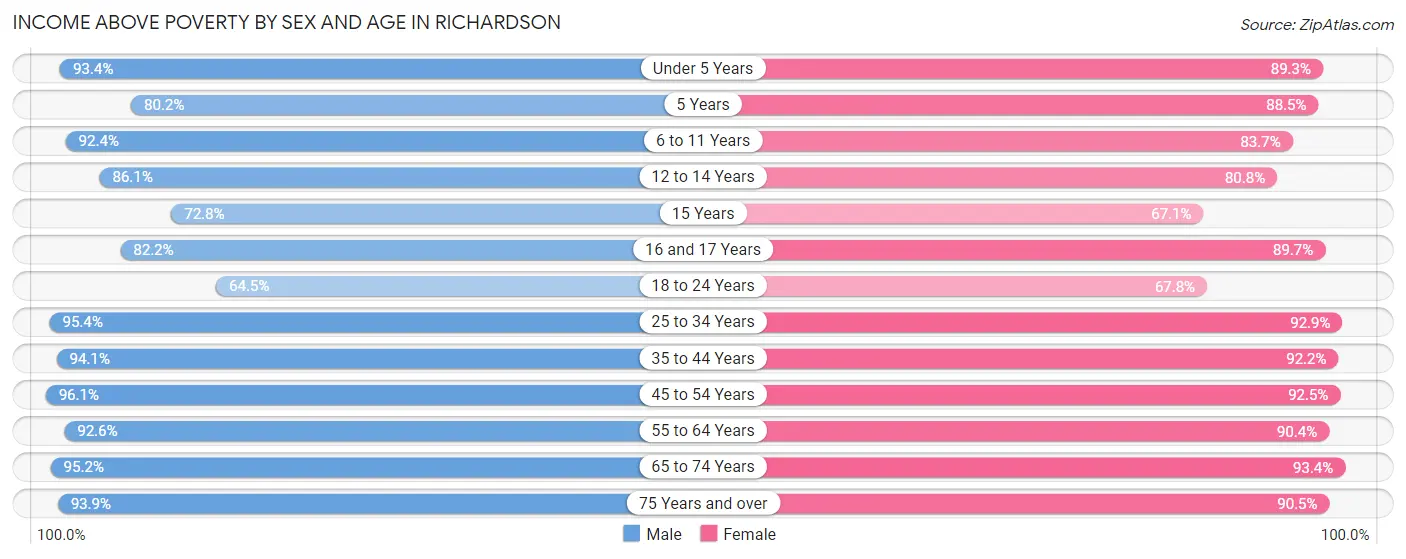
| Age Bracket | Male | Female |
| Under 5 Years | 3,739 (93.4%) | 3,114 (89.3%) |
| 5 Years | 341 (80.2%) | 643 (88.4%) |
| 6 to 11 Years | 3,269 (92.4%) | 3,386 (83.7%) |
| 12 to 14 Years | 1,832 (86.1%) | 1,857 (80.8%) |
| 15 Years | 286 (72.8%) | 420 (67.1%) |
| 16 and 17 Years | 1,031 (82.2%) | 1,548 (89.7%) |
| 18 to 24 Years | 3,830 (64.4%) | 3,999 (67.8%) |
| 25 to 34 Years | 9,992 (95.4%) | 9,134 (92.9%) |
| 35 to 44 Years | 6,454 (94.1%) | 7,500 (92.1%) |
| 45 to 54 Years | 6,781 (96.1%) | 7,328 (92.5%) |
| 55 to 64 Years | 6,103 (92.6%) | 5,815 (90.4%) |
| 65 to 74 Years | 3,971 (95.2%) | 4,384 (93.4%) |
| 75 Years and over | 2,380 (93.9%) | 2,884 (90.5%) |
| Total | 50,009 (90.3%) | 52,012 (88.1%) |
Income Below Poverty Among Married-Couple Families in Richardson
The poverty statistics for married-couple families in Richardson show that 3.3% or 724 of the total 21,955 families live below the poverty line. Families with 3 or 4 children have the highest poverty rate of 7.7%, comprising of 142 families. On the other hand, families with 5 or more children have the lowest poverty rate of 0.0%, which includes 0 families.
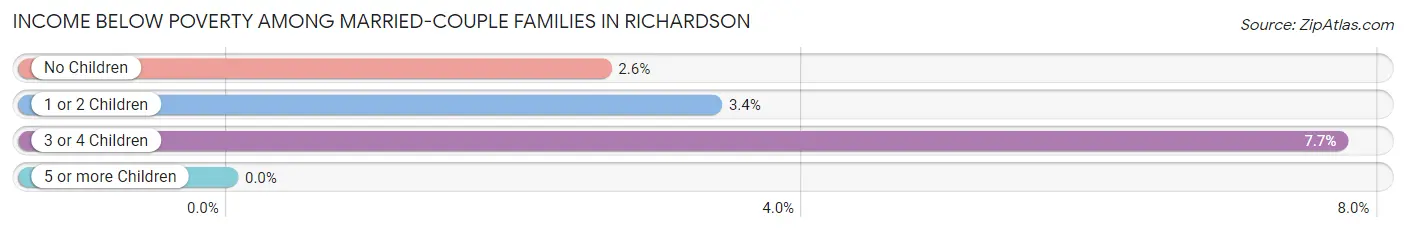
| Children | Above Poverty | Below Poverty |
| No Children | 11,857 (97.4%) | 316 (2.6%) |
| 1 or 2 Children | 7,636 (96.6%) | 266 (3.4%) |
| 3 or 4 Children | 1,696 (92.3%) | 142 (7.7%) |
| 5 or more Children | 42 (100.0%) | 0 (0.0%) |
| Total | 21,231 (96.7%) | 724 (3.3%) |
Income Below Poverty Among Single-Parent Households in Richardson
According to the poverty data in Richardson, 4.4% or 92 single-father households and 19.4% or 909 single-mother households are living below the poverty line. Among single-father households, those with 5 or more children have the highest poverty rate, with 14 households (100.0%) experiencing poverty. Likewise, among single-mother households, those with 5 or more children have the highest poverty rate, with 29 households (100.0%) falling below the poverty line.
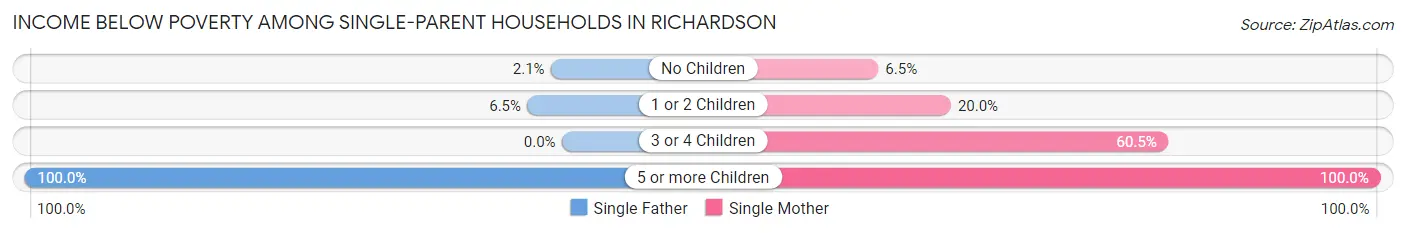
| Children | Single Father | Single Mother |
| No Children | 25 (2.1%) | 120 (6.5%) |
| 1 or 2 Children | 53 (6.5%) | 461 (20.0%) |
| 3 or 4 Children | 0 (0.0%) | 299 (60.5%) |
| 5 or more Children | 14 (100.0%) | 29 (100.0%) |
| Total | 92 (4.4%) | 909 (19.4%) |
Income Below Poverty Among Married-Couple vs Single-Parent Households in Richardson
The poverty data for Richardson shows that 724 of the married-couple family households (3.3%) and 1,001 of the single-parent households (14.8%) are living below the poverty level. Within the married-couple family households, those with 3 or 4 children have the highest poverty rate, with 142 households (7.7%) falling below the poverty line. Among the single-parent households, those with 5 or more children have the highest poverty rate, with 43 household (100.0%) living below poverty.
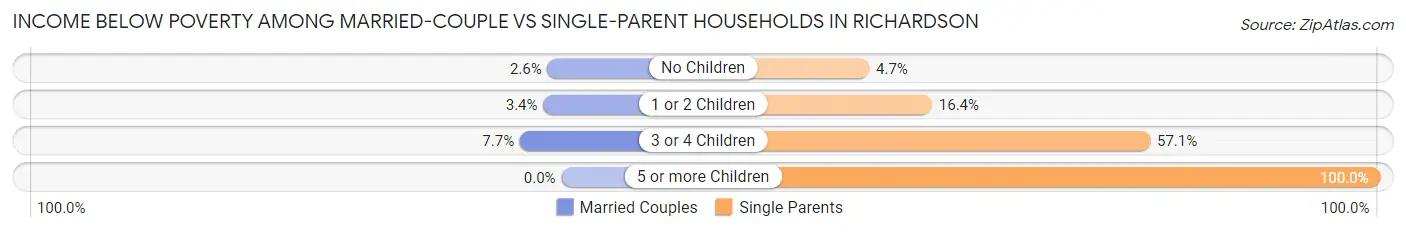
| Children | Married-Couple Families | Single-Parent Households |
| No Children | 316 (2.6%) | 145 (4.7%) |
| 1 or 2 Children | 266 (3.4%) | 514 (16.4%) |
| 3 or 4 Children | 142 (7.7%) | 299 (57.1%) |
| 5 or more Children | 0 (0.0%) | 43 (100.0%) |
| Total | 724 (3.3%) | 1,001 (14.8%) |
Race in Richardson
The most populous races in Richardson are White / Caucasian (69,662 | 59.0%), Hispanic or Latino (20,240 | 17.1%), and Asian (18,272 | 15.5%).
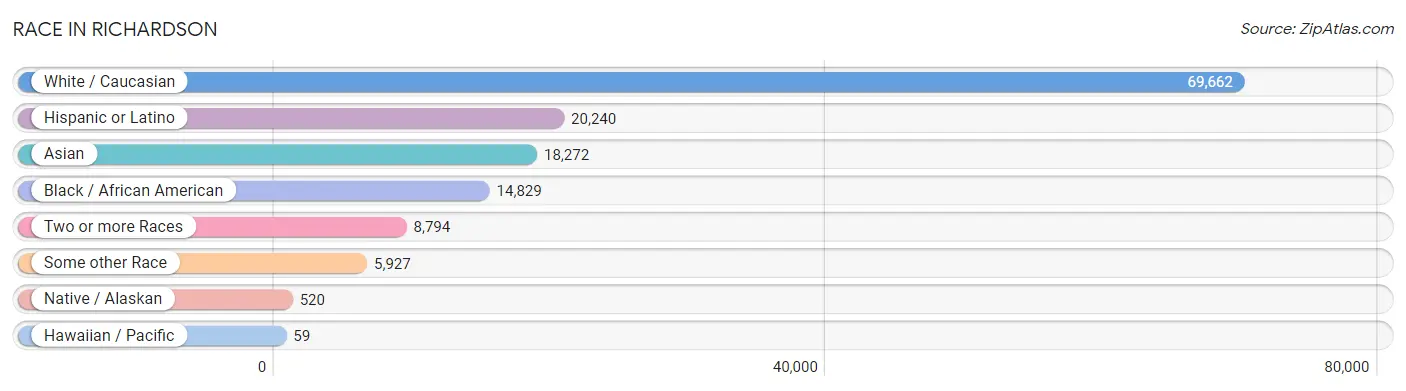
| Race | # Population | % Population |
| Asian | 18,272 | 15.5% |
| Black / African American | 14,829 | 12.6% |
| Hawaiian / Pacific | 59 | 0.1% |
| Hispanic or Latino | 20,240 | 17.1% |
| Native / Alaskan | 520 | 0.4% |
| White / Caucasian | 69,662 | 59.0% |
| Two or more Races | 8,794 | 7.4% |
| Some other Race | 5,927 | 5.0% |
| Total | 118,063 | 100.0% |
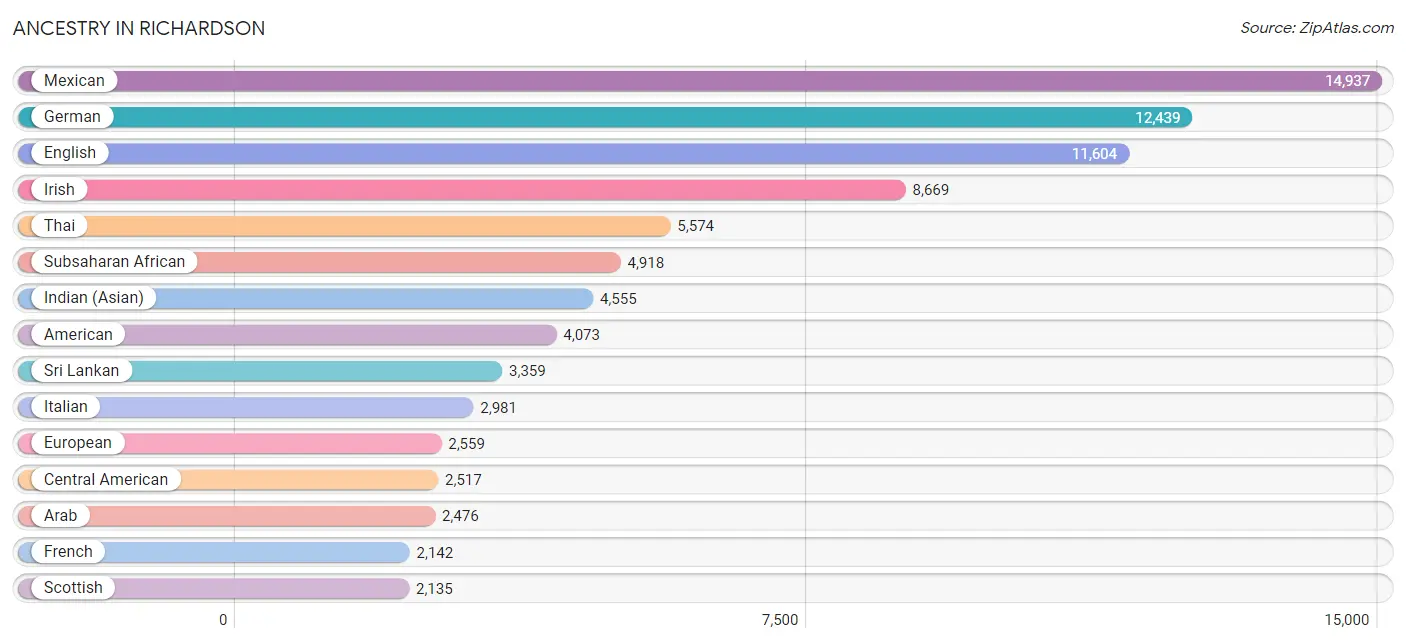
Ancestry in Richardson
The most populous ancestries reported in Richardson are Mexican (14,937 | 12.7%), German (12,439 | 10.5%), English (11,604 | 9.8%), Irish (8,669 | 7.3%), and Thai (5,574 | 4.7%), together accounting for 45.1% of all Richardson residents.
| Ancestry | # Population | % Population |
| Afghan | 161 | 0.1% |
| African | 1,410 | 1.2% |
| Alsatian | 6 | 0.0% |
| American | 4,073 | 3.5% |
| Apache | 52 | 0.0% |
| Arab | 2,476 | 2.1% |
| Argentinean | 249 | 0.2% |
| Armenian | 110 | 0.1% |
| Assyrian / Chaldean / Syriac | 66 | 0.1% |
| Austrian | 380 | 0.3% |
| Bahamian | 6 | 0.0% |
| Barbadian | 34 | 0.0% |
| Belgian | 86 | 0.1% |
| Bhutanese | 521 | 0.4% |
| Blackfeet | 26 | 0.0% |
| Brazilian | 451 | 0.4% |
| British | 678 | 0.6% |
| Bulgarian | 355 | 0.3% |
| Burmese | 1,284 | 1.1% |
| Canadian | 369 | 0.3% |
| Cape Verdean | 35 | 0.0% |
| Celtic | 27 | 0.0% |
| Central American | 2,517 | 2.1% |
| Central American Indian | 91 | 0.1% |
| Cherokee | 157 | 0.1% |
| Chickasaw | 5 | 0.0% |
| Chilean | 58 | 0.1% |
| Choctaw | 349 | 0.3% |
| Colombian | 392 | 0.3% |
| Costa Rican | 30 | 0.0% |
| Creek | 68 | 0.1% |
| Croatian | 17 | 0.0% |
| Cuban | 173 | 0.2% |
| Czech | 837 | 0.7% |
| Czechoslovakian | 70 | 0.1% |
| Danish | 248 | 0.2% |
| Dominican | 140 | 0.1% |
| Dutch | 922 | 0.8% |
| Eastern European | 182 | 0.2% |
| Ecuadorian | 23 | 0.0% |
| Egyptian | 138 | 0.1% |
| English | 11,604 | 9.8% |
| Estonian | 13 | 0.0% |
| Ethiopian | 1,158 | 1.0% |
| European | 2,559 | 2.2% |
| Filipino | 347 | 0.3% |
| Finnish | 169 | 0.1% |
| French | 2,142 | 1.8% |
| French Canadian | 342 | 0.3% |
| German | 12,439 | 10.5% |
| Ghanaian | 143 | 0.1% |
| Greek | 604 | 0.5% |
| Guamanian / Chamorro | 43 | 0.0% |
| Guatemalan | 553 | 0.5% |
| Guyanese | 15 | 0.0% |
| Haitian | 28 | 0.0% |
| Hmong | 56 | 0.1% |
| Honduran | 1,014 | 0.9% |
| Hungarian | 313 | 0.3% |
| Indian (Asian) | 4,555 | 3.9% |
| Indonesian | 493 | 0.4% |
| Iranian | 637 | 0.5% |
| Iraqi | 899 | 0.8% |
| Irish | 8,669 | 7.3% |
| Israeli | 57 | 0.1% |
| Italian | 2,981 | 2.5% |
| Jamaican | 276 | 0.2% |
| Japanese | 270 | 0.2% |
| Jordanian | 302 | 0.3% |
| Kenyan | 150 | 0.1% |
| Kiowa | 8 | 0.0% |
| Korean | 1,378 | 1.2% |
| Laotian | 120 | 0.1% |
| Latvian | 18 | 0.0% |
| Lebanese | 171 | 0.1% |
| Lithuanian | 179 | 0.2% |
| Luxembourger | 13 | 0.0% |
| Malaysian | 66 | 0.1% |
| Maltese | 23 | 0.0% |
| Mexican | 14,937 | 12.7% |
| Mexican American Indian | 149 | 0.1% |
| Mongolian | 90 | 0.1% |
| Moroccan | 131 | 0.1% |
| Native Hawaiian | 18 | 0.0% |
| Nicaraguan | 39 | 0.0% |
| Nigerian | 744 | 0.6% |
| Northern European | 593 | 0.5% |
| Norwegian | 774 | 0.7% |
| Osage | 5 | 0.0% |
| Pakistani | 128 | 0.1% |
| Palestinian | 307 | 0.3% |
| Panamanian | 191 | 0.2% |
| Paraguayan | 8 | 0.0% |
| Pennsylvania German | 9 | 0.0% |
| Peruvian | 85 | 0.1% |
| Polish | 1,399 | 1.2% |
| Portuguese | 195 | 0.2% |
| Potawatomi | 25 | 0.0% |
| Pueblo | 57 | 0.1% |
| Puerto Rican | 480 | 0.4% |
| Romanian | 82 | 0.1% |
| Russian | 604 | 0.5% |
| Salvadoran | 690 | 0.6% |
| Scandinavian | 342 | 0.3% |
| Scotch-Irish | 1,276 | 1.1% |
| Scottish | 2,135 | 1.8% |
| Serbian | 11 | 0.0% |
| Slavic | 69 | 0.1% |
| Slovak | 64 | 0.1% |
| Slovene | 62 | 0.1% |
| South African | 253 | 0.2% |
| South American | 1,033 | 0.9% |
| Spaniard | 110 | 0.1% |
| Spanish | 343 | 0.3% |
| Sri Lankan | 3,359 | 2.9% |
| Subsaharan African | 4,918 | 4.2% |
| Sudanese | 83 | 0.1% |
| Swedish | 1,407 | 1.2% |
| Swiss | 243 | 0.2% |
| Syrian | 201 | 0.2% |
| Thai | 5,574 | 4.7% |
| Trinidadian and Tobagonian | 313 | 0.3% |
| Turkish | 93 | 0.1% |
| U.S. Virgin Islander | 27 | 0.0% |
| Ukrainian | 174 | 0.2% |
| Uruguayan | 8 | 0.0% |
| Ute | 3 | 0.0% |
| Venezuelan | 210 | 0.2% |
| Vietnamese | 260 | 0.2% |
| Welsh | 577 | 0.5% |
| West Indian | 45 | 0.0% |
| Yugoslavian | 67 | 0.1% | View All 132 Rows |
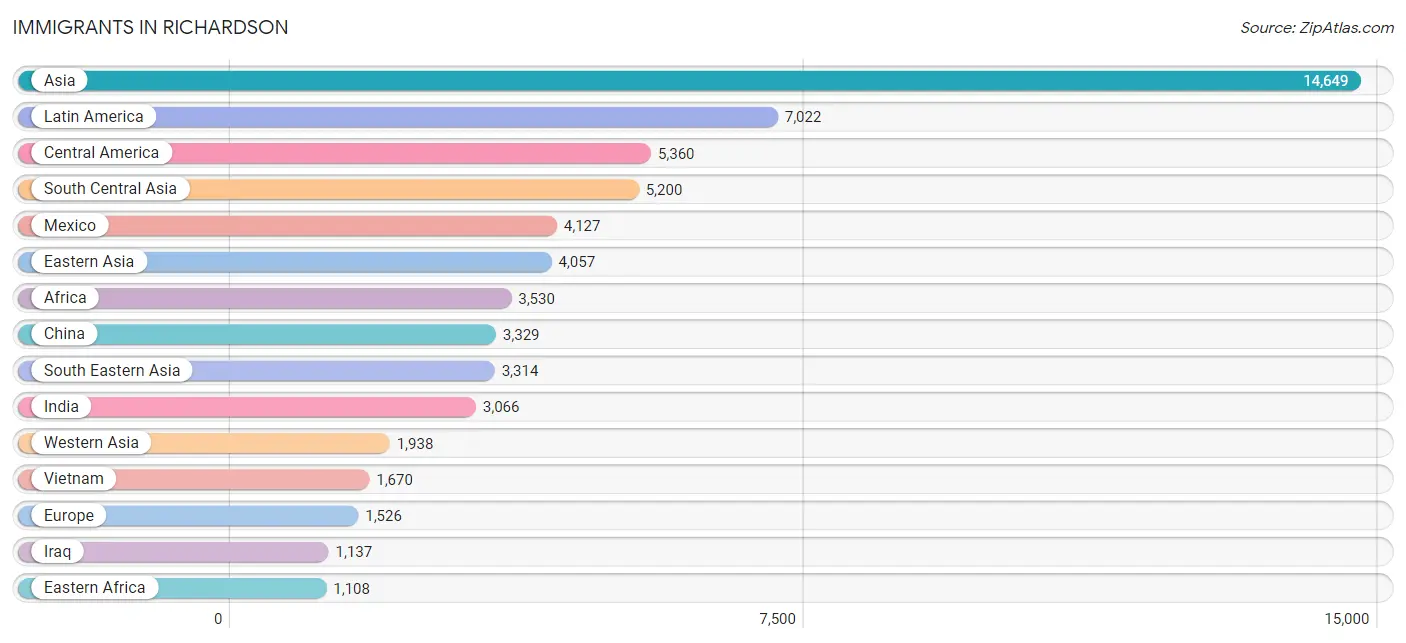
Immigrants in Richardson
The most numerous immigrant groups reported in Richardson came from Asia (14,649 | 12.4%), Latin America (7,022 | 5.9%), Central America (5,360 | 4.5%), South Central Asia (5,200 | 4.4%), and Mexico (4,127 | 3.5%), together accounting for 30.8% of all Richardson residents.
| Immigration Origin | # Population | % Population |
| Afghanistan | 126 | 0.1% |
| Africa | 3,530 | 3.0% |
| Argentina | 102 | 0.1% |
| Armenia | 6 | 0.0% |
| Asia | 14,649 | 12.4% |
| Bahamas | 6 | 0.0% |
| Bangladesh | 236 | 0.2% |
| Barbados | 44 | 0.0% |
| Belgium | 10 | 0.0% |
| Bosnia and Herzegovina | 50 | 0.0% |
| Brazil | 409 | 0.4% |
| Bulgaria | 284 | 0.2% |
| Cambodia | 190 | 0.2% |
| Cameroon | 777 | 0.7% |
| Canada | 507 | 0.4% |
| Caribbean | 635 | 0.5% |
| Central America | 5,360 | 4.5% |
| Chile | 27 | 0.0% |
| China | 3,329 | 2.8% |
| Colombia | 232 | 0.2% |
| Costa Rica | 36 | 0.0% |
| Cuba | 65 | 0.1% |
| Czechoslovakia | 7 | 0.0% |
| Dominican Republic | 9 | 0.0% |
| Eastern Africa | 1,108 | 0.9% |
| Eastern Asia | 4,057 | 3.4% |
| Eastern Europe | 740 | 0.6% |
| Ecuador | 20 | 0.0% |
| Egypt | 148 | 0.1% |
| El Salvador | 455 | 0.4% |
| England | 75 | 0.1% |
| Eritrea | 72 | 0.1% |
| Ethiopia | 859 | 0.7% |
| Europe | 1,526 | 1.3% |
| France | 6 | 0.0% |
| Germany | 217 | 0.2% |
| Ghana | 108 | 0.1% |
| Greece | 106 | 0.1% |
| Guatemala | 259 | 0.2% |
| Guyana | 10 | 0.0% |
| Haiti | 15 | 0.0% |
| Honduras | 423 | 0.4% |
| Hong Kong | 182 | 0.2% |
| Hungary | 38 | 0.0% |
| India | 3,066 | 2.6% |
| Indonesia | 71 | 0.1% |
| Iran | 335 | 0.3% |
| Iraq | 1,137 | 1.0% |
| Ireland | 8 | 0.0% |
| Israel | 68 | 0.1% |
| Italy | 28 | 0.0% |
| Jamaica | 135 | 0.1% |
| Japan | 104 | 0.1% |
| Jordan | 135 | 0.1% |
| Kenya | 177 | 0.2% |
| Korea | 624 | 0.5% |
| Kuwait | 137 | 0.1% |
| Laos | 58 | 0.1% |
| Latin America | 7,022 | 5.9% |
| Latvia | 3 | 0.0% |
| Lebanon | 24 | 0.0% |
| Malaysia | 152 | 0.1% |
| Mexico | 4,127 | 3.5% |
| Middle Africa | 889 | 0.7% |
| Morocco | 87 | 0.1% |
| Nepal | 97 | 0.1% |
| Netherlands | 14 | 0.0% |
| Nicaragua | 25 | 0.0% |
| Nigeria | 613 | 0.5% |
| Northern Africa | 257 | 0.2% |
| Northern Europe | 319 | 0.3% |
| Pakistan | 1,063 | 0.9% |
| Panama | 35 | 0.0% |
| Philippines | 695 | 0.6% |
| Poland | 71 | 0.1% |
| Portugal | 41 | 0.0% |
| Romania | 69 | 0.1% |
| Russia | 191 | 0.2% |
| Saudi Arabia | 248 | 0.2% |
| Scotland | 9 | 0.0% |
| Singapore | 20 | 0.0% |
| South Africa | 292 | 0.3% |
| South America | 1,027 | 0.9% |
| South Central Asia | 5,200 | 4.4% |
| South Eastern Asia | 3,314 | 2.8% |
| Southern Europe | 203 | 0.2% |
| Spain | 28 | 0.0% |
| Sri Lanka | 62 | 0.1% |
| St. Vincent and the Grenadines | 22 | 0.0% |
| Sudan | 14 | 0.0% |
| Sweden | 58 | 0.1% |
| Switzerland | 17 | 0.0% |
| Syria | 43 | 0.0% |
| Taiwan | 655 | 0.5% |
| Thailand | 95 | 0.1% |
| Trinidad and Tobago | 277 | 0.2% |
| Turkey | 104 | 0.1% |
| Ukraine | 21 | 0.0% |
| Uruguay | 8 | 0.0% |
| Uzbekistan | 19 | 0.0% |
| Venezuela | 211 | 0.2% |
| Vietnam | 1,670 | 1.4% |
| Western Africa | 984 | 0.8% |
| Western Asia | 1,938 | 1.6% |
| Western Europe | 264 | 0.2% |
| Zaire | 83 | 0.1% | View All 106 Rows |
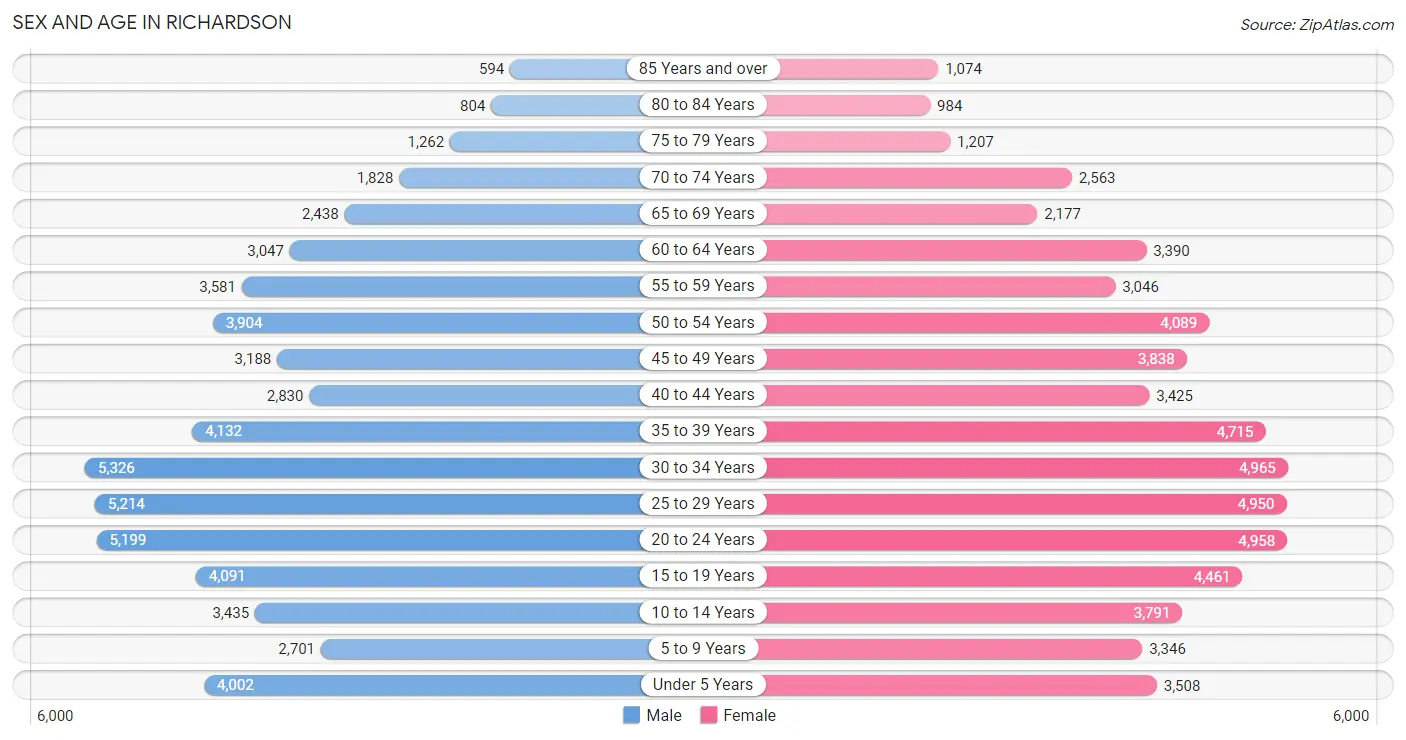
Sex and Age in Richardson
Sex and Age in Richardson
The most populous age groups in Richardson are 30 to 34 Years (5,326 | 9.2%) for men and 30 to 34 Years (4,965 | 8.2%) for women.
| Age Bracket | Male | Female |
| Under 5 Years | 4,002 (7.0%) | 3,508 (5.8%) |
| 5 to 9 Years | 2,701 (4.7%) | 3,346 (5.5%) |
| 10 to 14 Years | 3,435 (6.0%) | 3,791 (6.3%) |
| 15 to 19 Years | 4,091 (7.1%) | 4,461 (7.4%) |
| 20 to 24 Years | 5,199 (9.0%) | 4,958 (8.2%) |
| 25 to 29 Years | 5,214 (9.1%) | 4,950 (8.2%) |
| 30 to 34 Years | 5,326 (9.2%) | 4,965 (8.2%) |
| 35 to 39 Years | 4,132 (7.2%) | 4,715 (7.8%) |
| 40 to 44 Years | 2,830 (4.9%) | 3,425 (5.7%) |
| 45 to 49 Years | 3,188 (5.5%) | 3,838 (6.4%) |
| 50 to 54 Years | 3,904 (6.8%) | 4,089 (6.8%) |
| 55 to 59 Years | 3,581 (6.2%) | 3,046 (5.0%) |
| 60 to 64 Years | 3,047 (5.3%) | 3,390 (5.6%) |
| 65 to 69 Years | 2,438 (4.2%) | 2,177 (3.6%) |
| 70 to 74 Years | 1,828 (3.2%) | 2,563 (4.2%) |
| 75 to 79 Years | 1,262 (2.2%) | 1,207 (2.0%) |
| 80 to 84 Years | 804 (1.4%) | 984 (1.6%) |
| 85 Years and over | 594 (1.0%) | 1,074 (1.8%) |
| Total | 57,576 (100.0%) | 60,487 (100.0%) |
Families and Households in Richardson
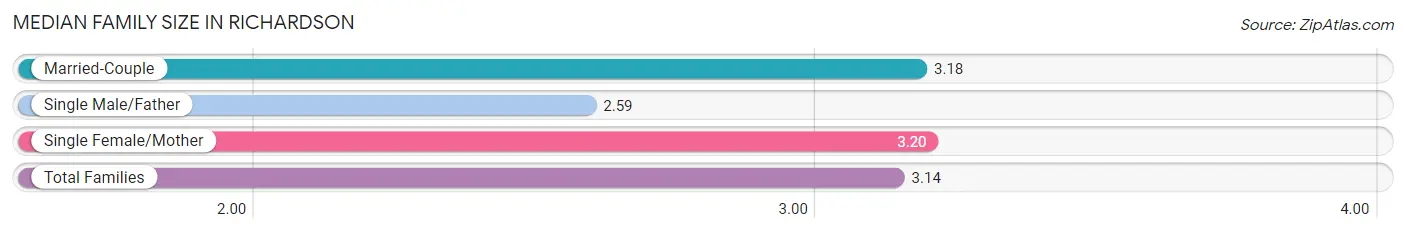
Median Family Size in Richardson
The median family size in Richardson is 3.14 persons per family, with single female/mother families (4,684 | 16.3%) accounting for the largest median family size of 3.2 persons per family. On the other hand, single male/father families (2,078 | 7.2%) represent the smallest median family size with 2.59 persons per family.
| Family Type | # Families | Family Size |
| Married-Couple | 21,955 (76.4%) | 3.18 |
| Single Male/Father | 2,078 (7.2%) | 2.59 |
| Single Female/Mother | 4,684 (16.3%) | 3.20 |
| Total Families | 28,717 (100.0%) | 3.14 |
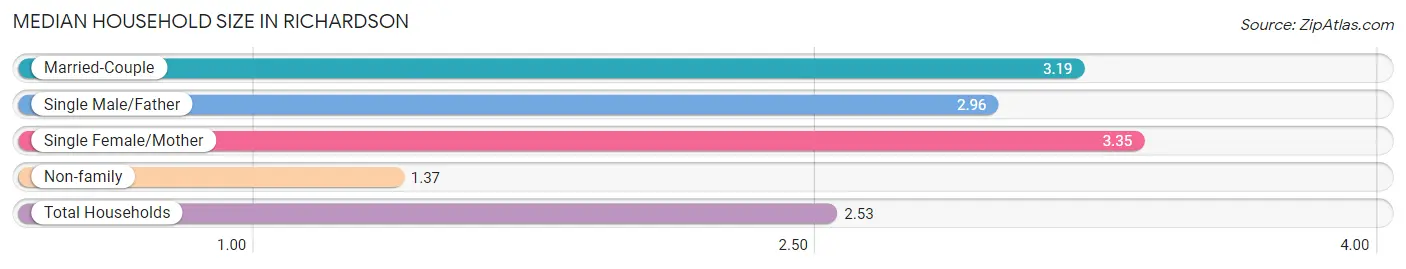
Median Household Size in Richardson
The median household size in Richardson is 2.53 persons per household, with single female/mother households (4,684 | 10.4%) accounting for the largest median household size of 3.35 persons per household. non-family households (16,483 | 36.5%) represent the smallest median household size with 1.37 persons per household.
| Household Type | # Households | Household Size |
| Married-Couple | 21,955 (48.6%) | 3.19 |
| Single Male/Father | 2,078 (4.6%) | 2.96 |
| Single Female/Mother | 4,684 (10.4%) | 3.35 |
| Non-family | 16,483 (36.5%) | 1.37 |
| Total Households | 45,200 (100.0%) | 2.53 |
Household Size by Marriage Status in Richardson
Out of a total of 45,200 households in Richardson, 28,717 (63.5%) are family households, while 16,483 (36.5%) are nonfamily households. The most numerous type of family households are 2-person households, comprising 12,284, and the most common type of nonfamily households are 1-person households, comprising 12,467.
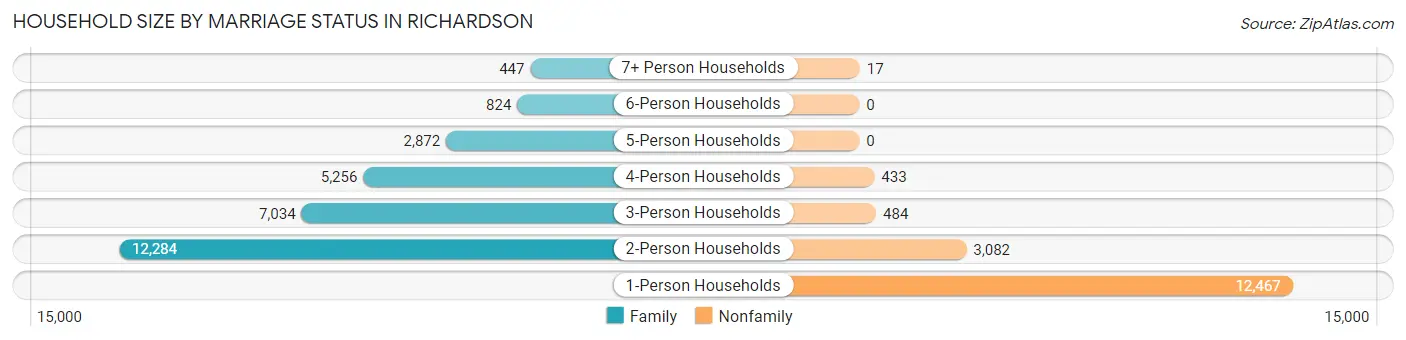
| Household Size | Family Households | Nonfamily Households |
| 1-Person Households | - | 12,467 (27.6%) |
| 2-Person Households | 12,284 (27.2%) | 3,082 (6.8%) |
| 3-Person Households | 7,034 (15.6%) | 484 (1.1%) |
| 4-Person Households | 5,256 (11.6%) | 433 (1.0%) |
| 5-Person Households | 2,872 (6.4%) | 0 (0.0%) |
| 6-Person Households | 824 (1.8%) | 0 (0.0%) |
| 7+ Person Households | 447 (1.0%) | 17 (0.0%) |
| Total | 28,717 (63.5%) | 16,483 (36.5%) |
Female Fertility in Richardson
Fertility by Age in Richardson
Average fertility rate in Richardson is 43.0 births per 1,000 women. Women in the age bracket of 20 to 34 years have the highest fertility rate with 66.0 births per 1,000 women. Women in the age bracket of 20 to 34 years acount for 70.8% of all women with births.
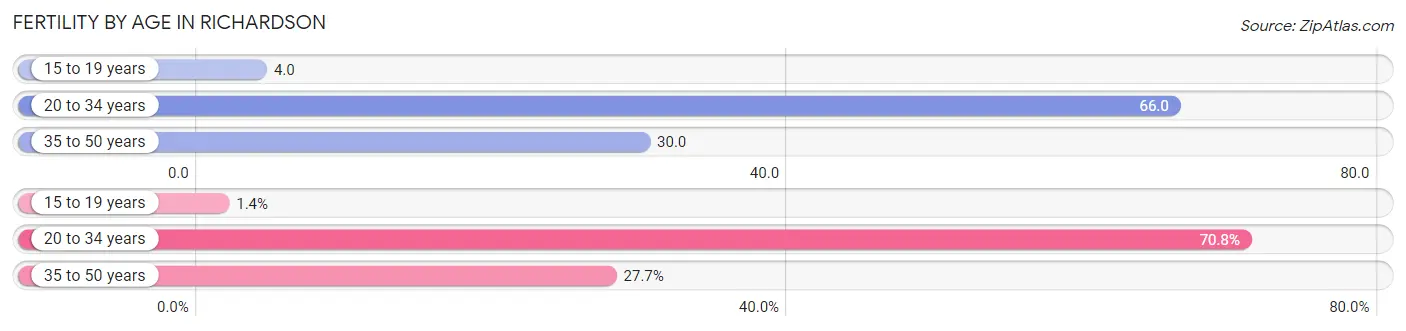
| Age Bracket | Women with Births | Births / 1,000 Women |
| 15 to 19 years | 20 (1.4%) | 4.0 |
| 20 to 34 years | 981 (70.8%) | 66.0 |
| 35 to 50 years | 384 (27.7%) | 30.0 |
| Total | 1,385 (100.0%) | 43.0 |
Fertility by Age by Marriage Status in Richardson
89.2% of women with births (1,385) in Richardson are married. The highest percentage of unmarried women with births falls into 15 to 19 years age bracket with 100.0% of them unmarried at the time of birth, while the lowest percentage of unmarried women with births belong to 35 to 50 years age bracket with 3.4% of them unmarried.
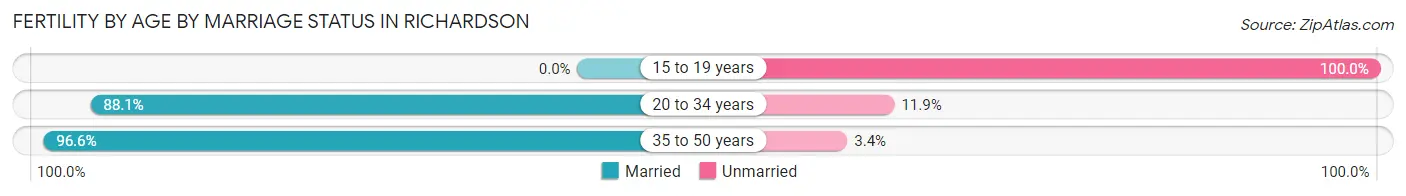
| Age Bracket | Married | Unmarried |
| 15 to 19 years | 0 (0.0%) | 20 (100.0%) |
| 20 to 34 years | 864 (88.1%) | 117 (11.9%) |
| 35 to 50 years | 371 (96.6%) | 13 (3.4%) |
| Total | 1,235 (89.2%) | 150 (10.8%) |
Fertility by Education in Richardson
Average fertility rate in Richardson is 43.0 births per 1,000 women. Women with the education attainment of bachelor's degree have the highest fertility rate of 60.0 births per 1,000 women, while women with the education attainment of less than high school have the lowest fertility at 13.0 births per 1,000 women. Women with the education attainment of bachelor's degree represent 41.9% of all women with births.
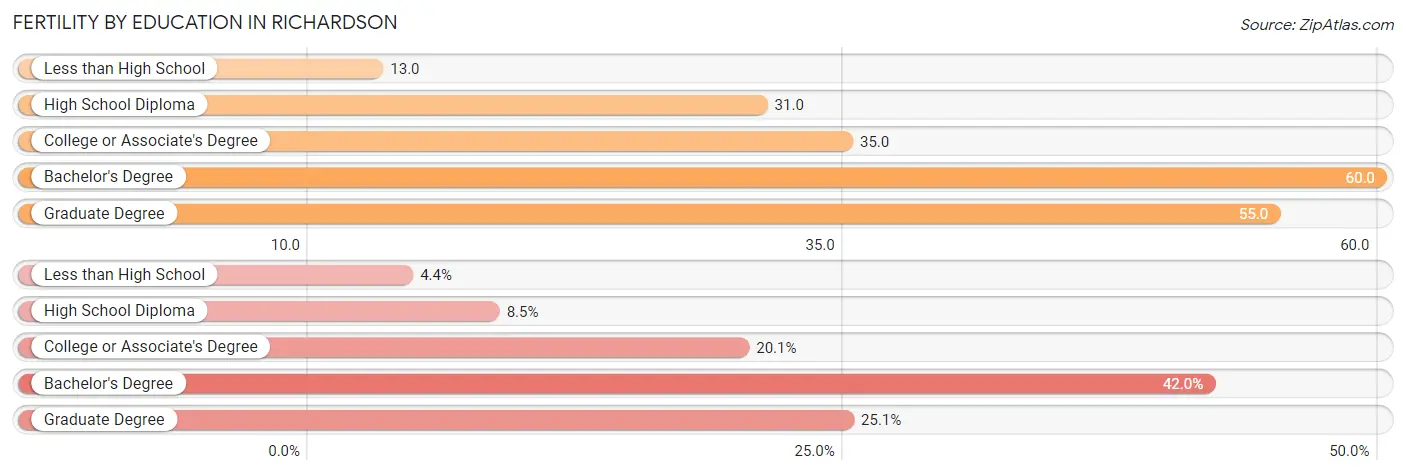
| Educational Attainment | Women with Births | Births / 1,000 Women |
| Less than High School | 61 (4.4%) | 13.0 |
| High School Diploma | 117 (8.5%) | 31.0 |
| College or Associate's Degree | 279 (20.1%) | 35.0 |
| Bachelor's Degree | 581 (41.9%) | 60.0 |
| Graduate Degree | 347 (25.1%) | 55.0 |
| Total | 1,385 (100.0%) | 43.0 |
Fertility by Education by Marriage Status in Richardson
10.8% of women with births in Richardson are unmarried. Women with the educational attainment of bachelor's degree are most likely to be married with 97.8% of them married at childbirth, while women with the educational attainment of high school diploma are least likely to be married with 67.5% of them unmarried at childbirth.
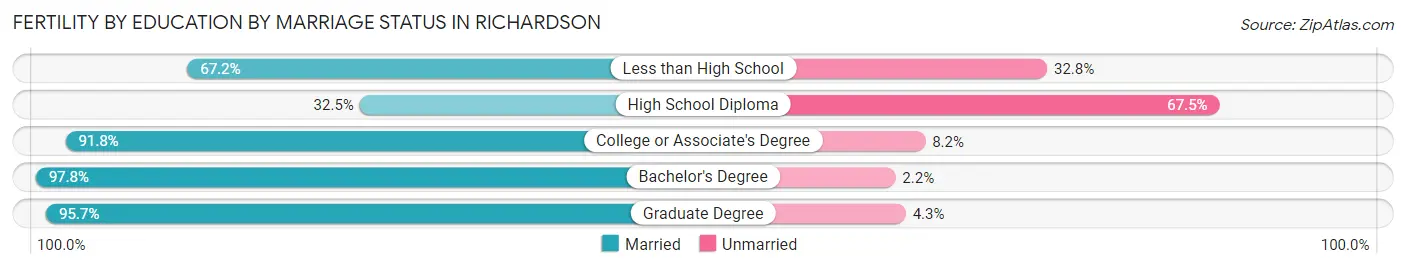
| Educational Attainment | Married | Unmarried |
| Less than High School | 41 (67.2%) | 20 (32.8%) |
| High School Diploma | 38 (32.5%) | 79 (67.5%) |
| College or Associate's Degree | 256 (91.8%) | 23 (8.2%) |
| Bachelor's Degree | 568 (97.8%) | 13 (2.2%) |
| Graduate Degree | 332 (95.7%) | 15 (4.3%) |
| Total | 1,235 (89.2%) | 150 (10.8%) |
Employment Characteristics in Richardson
Employment by Class of Employer in Richardson
Among the 63,324 employed individuals in Richardson, private company employees (45,713 | 72.2%), not-for-profit organizations (4,385 | 6.9%), and self-employed (not incorporated) (4,225 | 6.7%) make up the most common classes of employment.
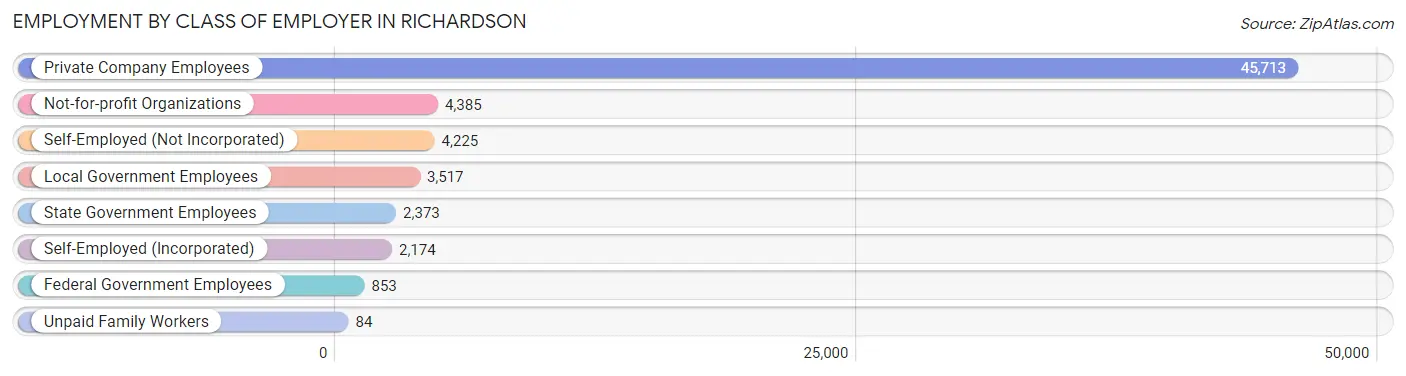
| Employer Class | # Employees | % Employees |
| Private Company Employees | 45,713 | 72.2% |
| Self-Employed (Incorporated) | 2,174 | 3.4% |
| Self-Employed (Not Incorporated) | 4,225 | 6.7% |
| Not-for-profit Organizations | 4,385 | 6.9% |
| Local Government Employees | 3,517 | 5.6% |
| State Government Employees | 2,373 | 3.7% |
| Federal Government Employees | 853 | 1.3% |
| Unpaid Family Workers | 84 | 0.1% |
| Total | 63,324 | 100.0% |
Employment Status by Age in Richardson
According to the labor force statistics for Richardson, out of the total population over 16 years of age (96,261), 70.5% or 67,864 individuals are in the labor force, with 5.0% or 3,393 of them unemployed. The age group with the highest labor force participation rate is 30 to 34 years, with 90.7% or 9,334 individuals in the labor force. Within the labor force, the 16 to 19 years age range has the highest percentage of unemployed individuals, with 14.4% or 438 of them being unemployed.
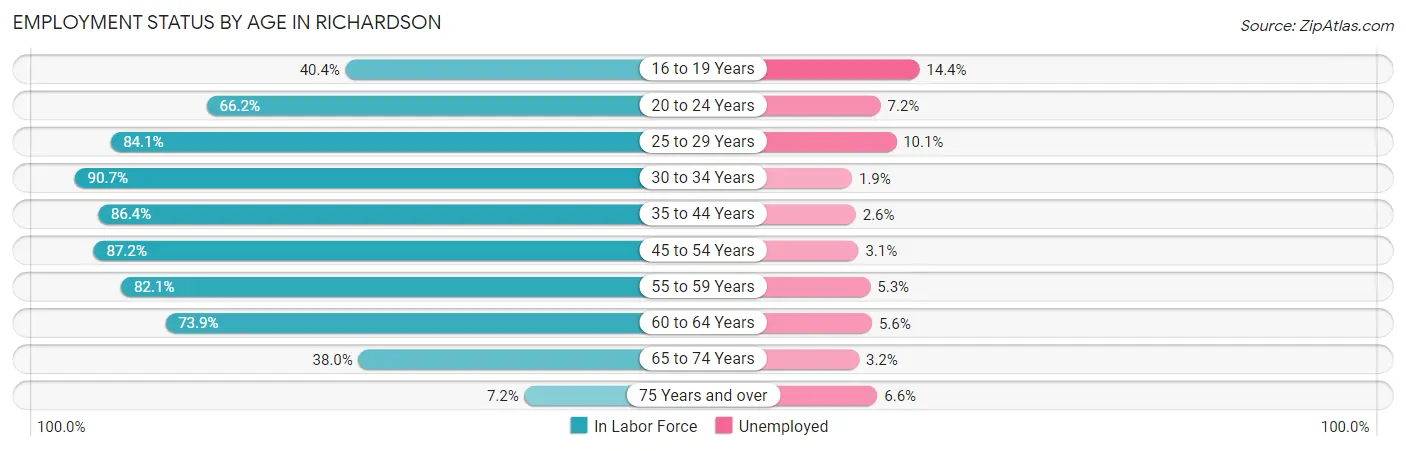
| Age Bracket | In Labor Force | Unemployed |
| 16 to 19 Years | 3,043 (40.4%) | 438 (14.4%) |
| 20 to 24 Years | 6,724 (66.2%) | 484 (7.2%) |
| 25 to 29 Years | 8,548 (84.1%) | 863 (10.1%) |
| 30 to 34 Years | 9,334 (90.7%) | 177 (1.9%) |
| 35 to 44 Years | 13,048 (86.4%) | 339 (2.6%) |
| 45 to 54 Years | 13,097 (87.2%) | 406 (3.1%) |
| 55 to 59 Years | 5,441 (82.1%) | 288 (5.3%) |
| 60 to 64 Years | 4,757 (73.9%) | 266 (5.6%) |
| 65 to 74 Years | 3,422 (38.0%) | 110 (3.2%) |
| 75 Years and over | 427 (7.2%) | 28 (6.6%) |
| Total | 67,864 (70.5%) | 3,393 (5.0%) |
Employment Status by Educational Attainment in Richardson
According to labor force statistics for Richardson, 85.2% of individuals (54,221) out of the total population between 25 and 64 years of age (63,640) are in the labor force, with 4.3% or 2,332 of them being unemployed. The group with the highest labor force participation rate are those with the educational attainment of bachelor's degree or higher, with 88.7% or 32,116 individuals in the labor force. Within the labor force, individuals with college / associate degree education have the highest percentage of unemployment, with 6.3% or 819 of them being unemployed.
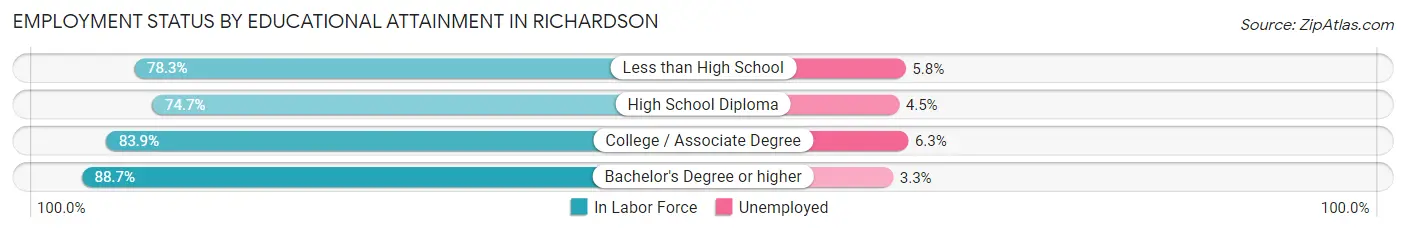
| Educational Attainment | In Labor Force | Unemployed |
| Less than High School | 3,730 (78.3%) | 276 (5.8%) |
| High School Diploma | 5,355 (74.7%) | 323 (4.5%) |
| College / Associate Degree | 13,004 (83.9%) | 976 (6.3%) |
| Bachelor's Degree or higher | 32,116 (88.7%) | 1,195 (3.3%) |
| Total | 54,221 (85.2%) | 2,737 (4.3%) |
Employment Occupations by Sex in Richardson
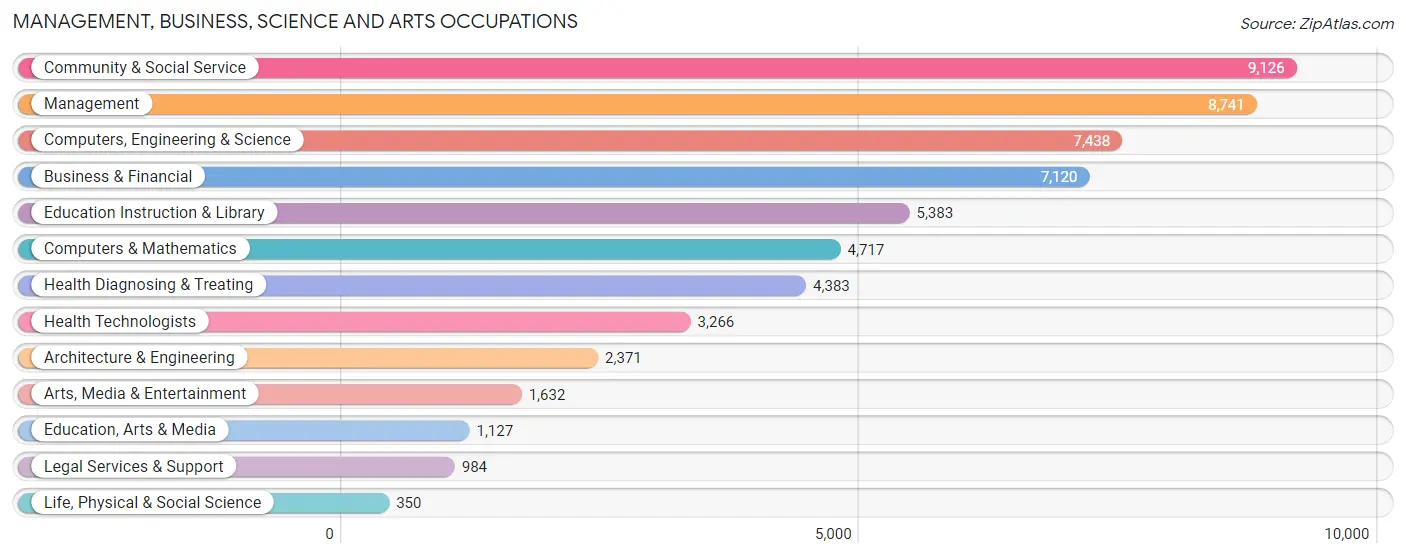
Management, Business, Science and Arts Occupations
The most common Management, Business, Science and Arts occupations in Richardson are Community & Social Service (9,126 | 14.2%), Management (8,741 | 13.6%), Computers, Engineering & Science (7,438 | 11.6%), Business & Financial (7,120 | 11.1%), and Education Instruction & Library (5,383 | 8.4%).
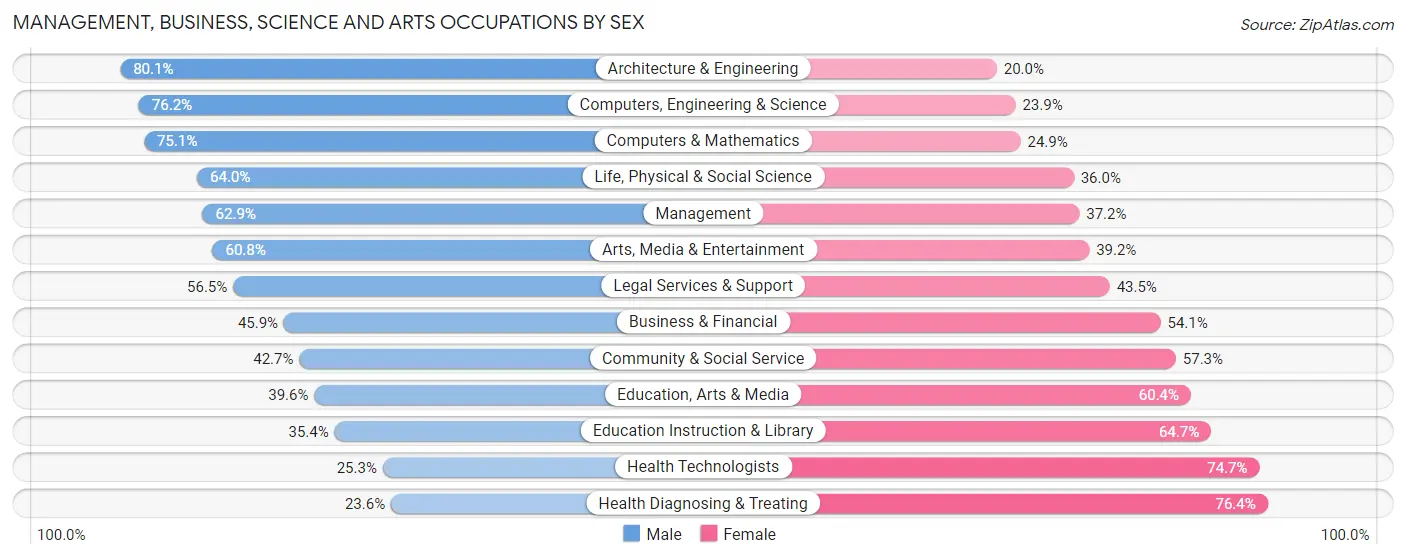
Management, Business, Science and Arts Occupations by Sex
Within the Management, Business, Science and Arts occupations in Richardson, the most male-oriented occupations are Architecture & Engineering (80.0%), Computers, Engineering & Science (76.1%), and Computers & Mathematics (75.1%), while the most female-oriented occupations are Health Diagnosing & Treating (76.4%), Health Technologists (74.7%), and Education Instruction & Library (64.6%).
| Occupation | Male | Female |
| Management | 5,494 (62.8%) | 3,247 (37.1%) |
| Business & Financial | 3,268 (45.9%) | 3,852 (54.1%) |
| Computers, Engineering & Science | 5,664 (76.1%) | 1,774 (23.8%) |
| Computers & Mathematics | 3,542 (75.1%) | 1,175 (24.9%) |
| Architecture & Engineering | 1,898 (80.0%) | 473 (20.0%) |
| Life, Physical & Social Science | 224 (64.0%) | 126 (36.0%) |
| Community & Social Service | 3,897 (42.7%) | 5,229 (57.3%) |
| Education, Arts & Media | 446 (39.6%) | 681 (60.4%) |
| Legal Services & Support | 556 (56.5%) | 428 (43.5%) |
| Education Instruction & Library | 1,903 (35.3%) | 3,480 (64.6%) |
| Arts, Media & Entertainment | 992 (60.8%) | 640 (39.2%) |
| Health Diagnosing & Treating | 1,033 (23.6%) | 3,350 (76.4%) |
| Health Technologists | 826 (25.3%) | 2,440 (74.7%) |
| Total (Category) | 19,356 (52.6%) | 17,452 (47.4%) |
| Total (Overall) | 34,029 (52.8%) | 30,394 (47.2%) |
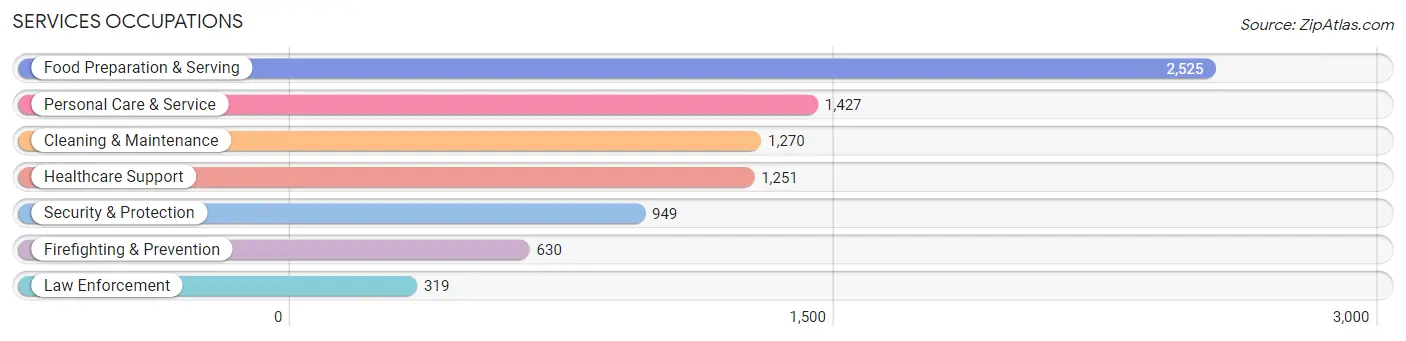
Services Occupations
The most common Services occupations in Richardson are Food Preparation & Serving (2,525 | 3.9%), Personal Care & Service (1,427 | 2.2%), Cleaning & Maintenance (1,270 | 2.0%), Healthcare Support (1,251 | 1.9%), and Security & Protection (949 | 1.5%).
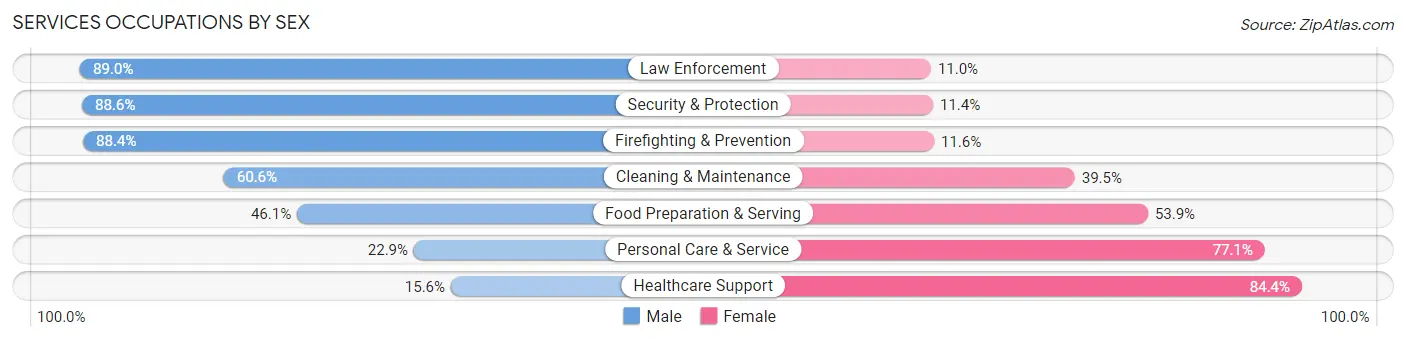
Services Occupations by Sex
Within the Services occupations in Richardson, the most male-oriented occupations are Law Enforcement (89.0%), Security & Protection (88.6%), and Firefighting & Prevention (88.4%), while the most female-oriented occupations are Healthcare Support (84.4%), Personal Care & Service (77.1%), and Food Preparation & Serving (53.9%).
| Occupation | Male | Female |
| Healthcare Support | 195 (15.6%) | 1,056 (84.4%) |
| Security & Protection | 841 (88.6%) | 108 (11.4%) |
| Firefighting & Prevention | 557 (88.4%) | 73 (11.6%) |
| Law Enforcement | 284 (89.0%) | 35 (11.0%) |
| Food Preparation & Serving | 1,163 (46.1%) | 1,362 (53.9%) |
| Cleaning & Maintenance | 769 (60.6%) | 501 (39.5%) |
| Personal Care & Service | 327 (22.9%) | 1,100 (77.1%) |
| Total (Category) | 3,295 (44.4%) | 4,127 (55.6%) |
| Total (Overall) | 34,029 (52.8%) | 30,394 (47.2%) |
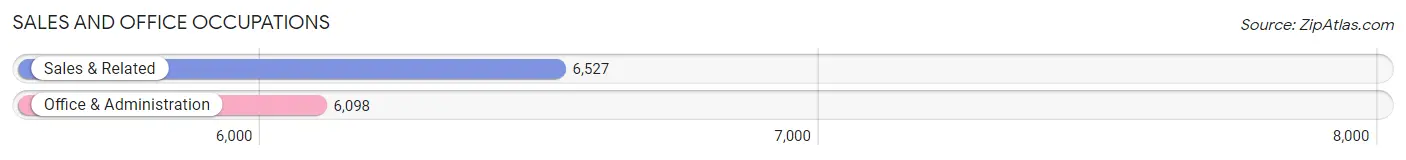
Sales and Office Occupations
The most common Sales and Office occupations in Richardson are Sales & Related (6,527 | 10.1%), and Office & Administration (6,098 | 9.5%).
Sales and Office Occupations by Sex
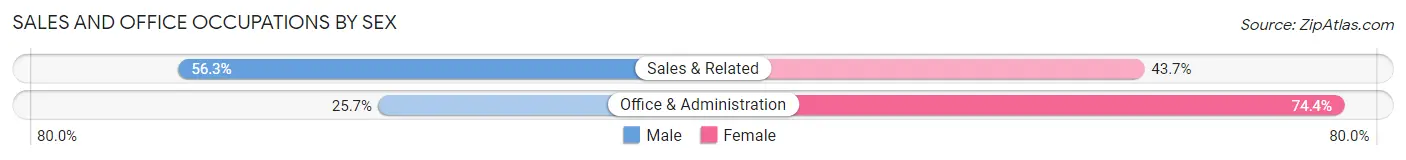
| Occupation | Male | Female |
| Sales & Related | 3,677 (56.3%) | 2,850 (43.7%) |
| Office & Administration | 1,564 (25.7%) | 4,534 (74.4%) |
| Total (Category) | 5,241 (41.5%) | 7,384 (58.5%) |
| Total (Overall) | 34,029 (52.8%) | 30,394 (47.2%) |
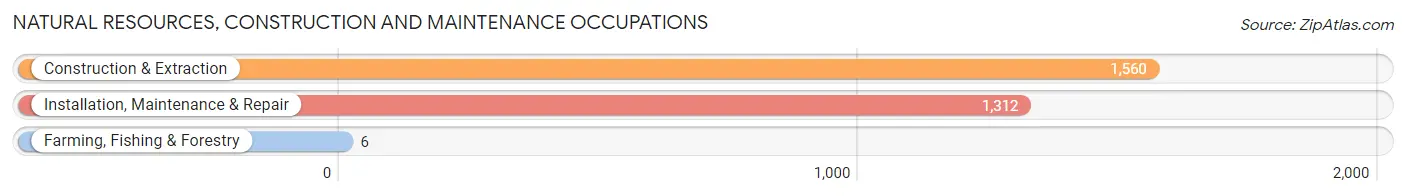
Natural Resources, Construction and Maintenance Occupations
The most common Natural Resources, Construction and Maintenance occupations in Richardson are Construction & Extraction (1,560 | 2.4%), Installation, Maintenance & Repair (1,312 | 2.0%), and Farming, Fishing & Forestry (6 | 0.0%).
Natural Resources, Construction and Maintenance Occupations by Sex
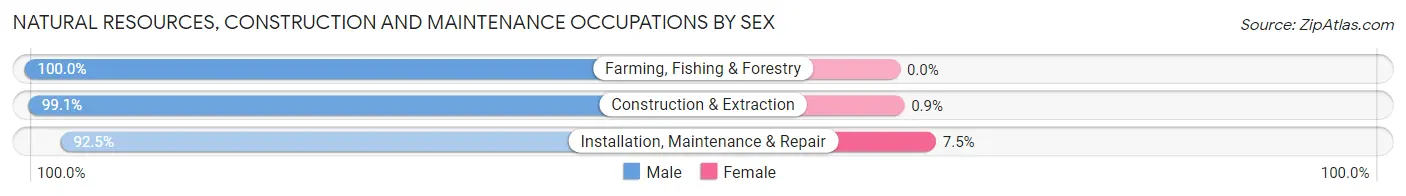
| Occupation | Male | Female |
| Farming, Fishing & Forestry | 6 (100.0%) | 0 (0.0%) |
| Construction & Extraction | 1,546 (99.1%) | 14 (0.9%) |
| Installation, Maintenance & Repair | 1,214 (92.5%) | 98 (7.5%) |
| Total (Category) | 2,766 (96.1%) | 112 (3.9%) |
| Total (Overall) | 34,029 (52.8%) | 30,394 (47.2%) |
Production, Transportation and Moving Occupations
The most common Production, Transportation and Moving occupations in Richardson are Production (1,792 | 2.8%), Material Moving (1,569 | 2.4%), and Transportation (1,329 | 2.1%).
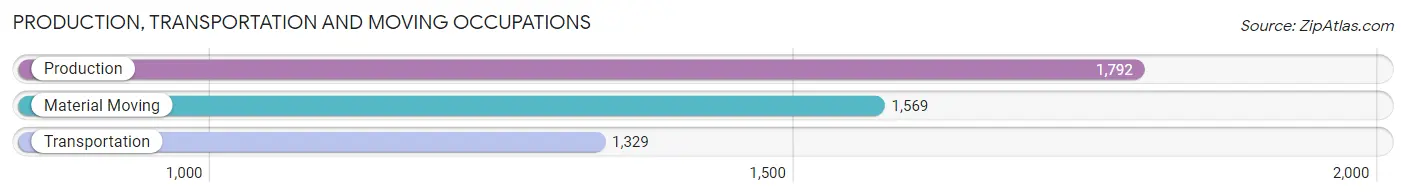
Production, Transportation and Moving Occupations by Sex
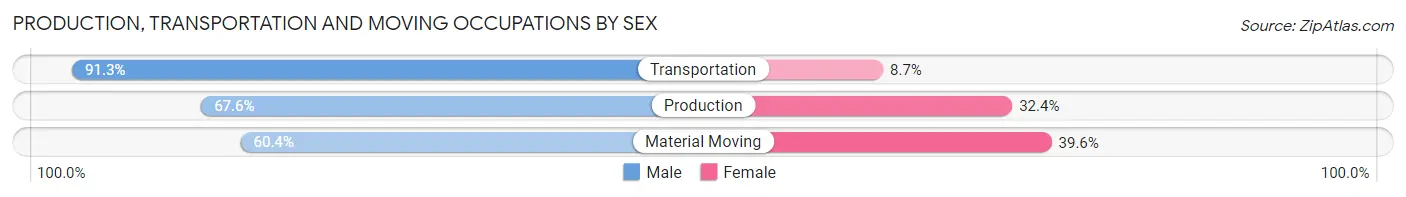
| Occupation | Male | Female |
| Production | 1,211 (67.6%) | 581 (32.4%) |
| Transportation | 1,213 (91.3%) | 116 (8.7%) |
| Material Moving | 947 (60.4%) | 622 (39.6%) |
| Total (Category) | 3,371 (71.9%) | 1,319 (28.1%) |
| Total (Overall) | 34,029 (52.8%) | 30,394 (47.2%) |
Employment Industries by Sex in Richardson
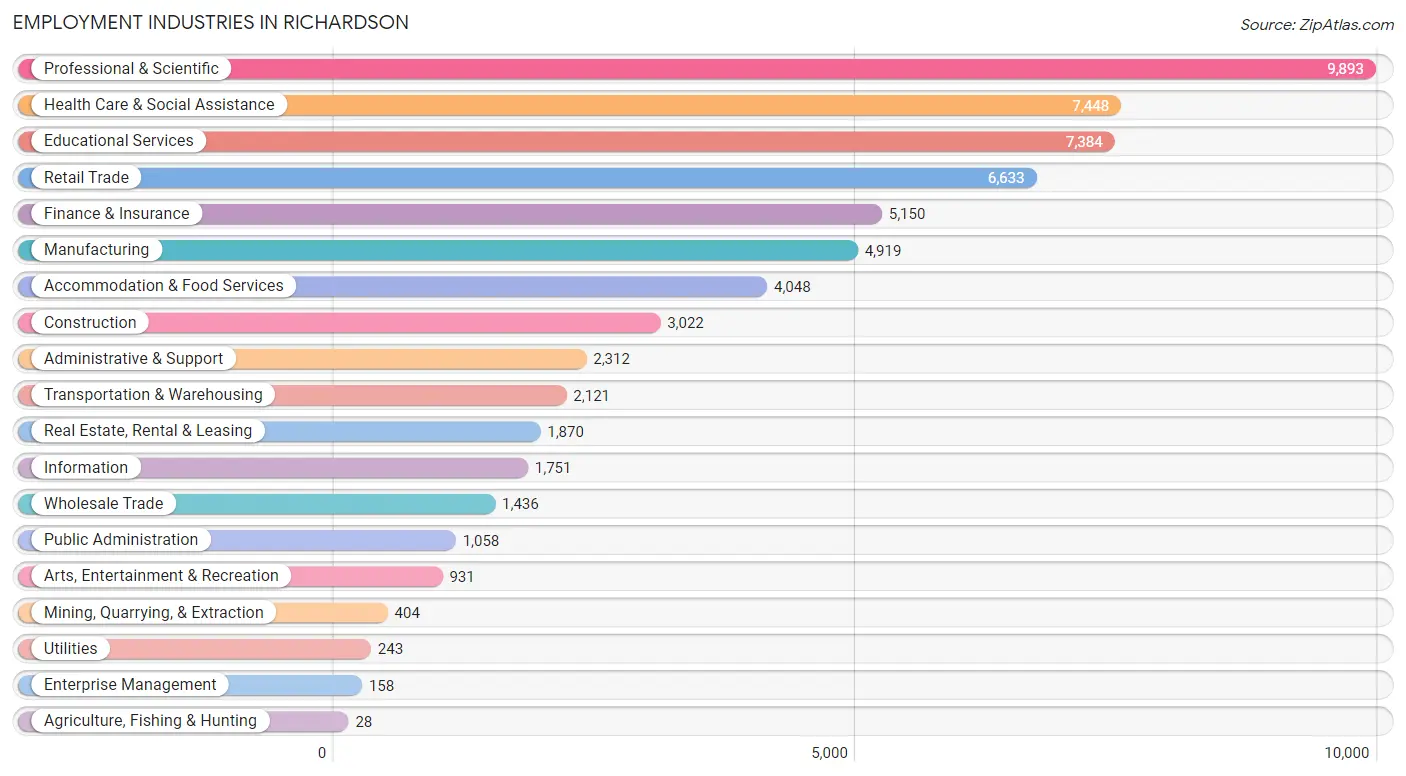
Employment Industries in Richardson
The major employment industries in Richardson include Professional & Scientific (9,893 | 15.4%), Health Care & Social Assistance (7,448 | 11.6%), Educational Services (7,384 | 11.5%), Retail Trade (6,633 | 10.3%), and Finance & Insurance (5,150 | 8.0%).
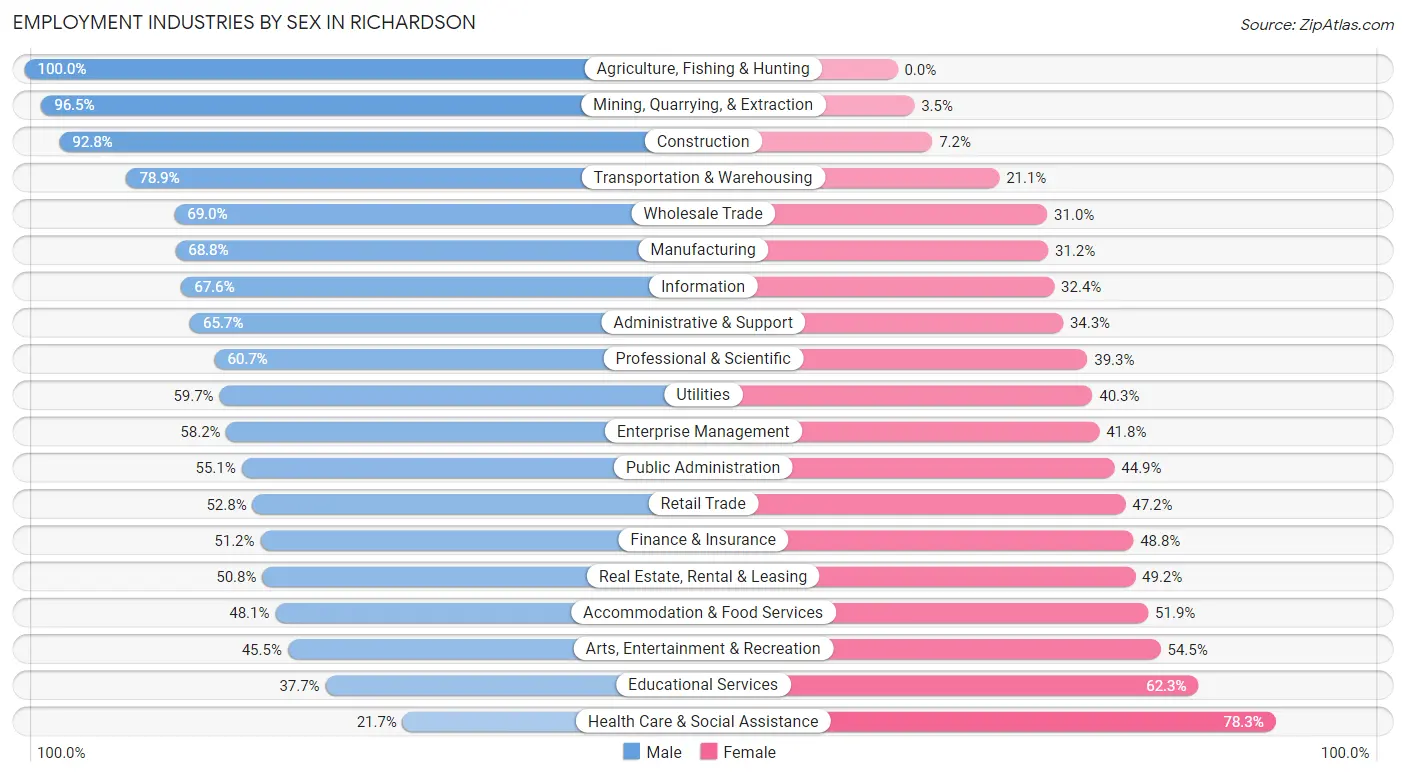
Employment Industries by Sex in Richardson
The Richardson industries that see more men than women are Agriculture, Fishing & Hunting (100.0%), Mining, Quarrying, & Extraction (96.5%), and Construction (92.8%), whereas the industries that tend to have a higher number of women are Health Care & Social Assistance (78.3%), Educational Services (62.3%), and Arts, Entertainment & Recreation (54.5%).
| Industry | Male | Female |
| Agriculture, Fishing & Hunting | 28 (100.0%) | 0 (0.0%) |
| Mining, Quarrying, & Extraction | 390 (96.5%) | 14 (3.5%) |
| Construction | 2,804 (92.8%) | 218 (7.2%) |
| Manufacturing | 3,385 (68.8%) | 1,534 (31.2%) |
| Wholesale Trade | 991 (69.0%) | 445 (31.0%) |
| Retail Trade | 3,504 (52.8%) | 3,129 (47.2%) |
| Transportation & Warehousing | 1,674 (78.9%) | 447 (21.1%) |
| Utilities | 145 (59.7%) | 98 (40.3%) |
| Information | 1,183 (67.6%) | 568 (32.4%) |
| Finance & Insurance | 2,637 (51.2%) | 2,513 (48.8%) |
| Real Estate, Rental & Leasing | 950 (50.8%) | 920 (49.2%) |
| Professional & Scientific | 6,005 (60.7%) | 3,888 (39.3%) |
| Enterprise Management | 92 (58.2%) | 66 (41.8%) |
| Administrative & Support | 1,520 (65.7%) | 792 (34.3%) |
| Educational Services | 2,786 (37.7%) | 4,598 (62.3%) |
| Health Care & Social Assistance | 1,619 (21.7%) | 5,829 (78.3%) |
| Arts, Entertainment & Recreation | 424 (45.5%) | 507 (54.5%) |
| Accommodation & Food Services | 1,947 (48.1%) | 2,101 (51.9%) |
| Public Administration | 583 (55.1%) | 475 (44.9%) |
| Total | 34,029 (52.8%) | 30,394 (47.2%) |
Education in Richardson
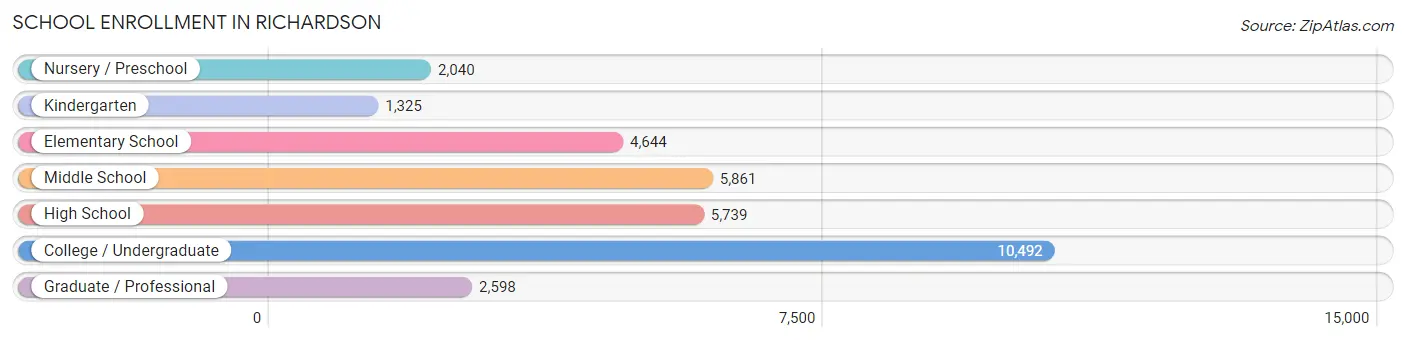
School Enrollment in Richardson
The most common levels of schooling among the 32,699 students in Richardson are college / undergraduate (10,492 | 32.1%), middle school (5,861 | 17.9%), and high school (5,739 | 17.5%).
| School Level | # Students | % Students |
| Nursery / Preschool | 2,040 | 6.2% |
| Kindergarten | 1,325 | 4.1% |
| Elementary School | 4,644 | 14.2% |
| Middle School | 5,861 | 17.9% |
| High School | 5,739 | 17.5% |
| College / Undergraduate | 10,492 | 32.1% |
| Graduate / Professional | 2,598 | 8.0% |
| Total | 32,699 | 100.0% |
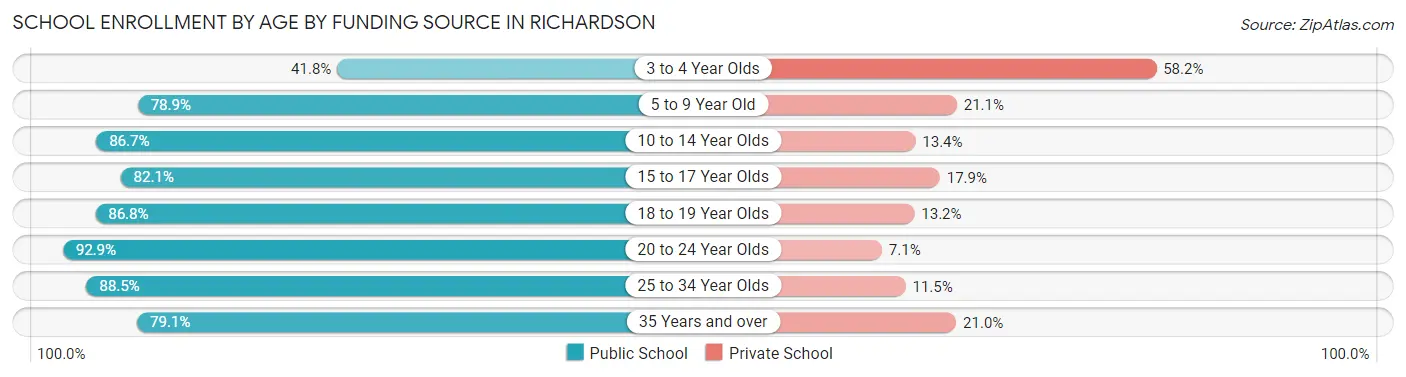
School Enrollment by Age by Funding Source in Richardson
Out of a total of 32,699 students who are enrolled in schools in Richardson, 5,461 (16.7%) attend a private institution, while the remaining 27,238 (83.3%) are enrolled in public schools. The age group of 3 to 4 year olds has the highest likelihood of being enrolled in private schools, with 992 (58.2% in the age bracket) enrolled. Conversely, the age group of 20 to 24 year olds has the lowest likelihood of being enrolled in a private school, with 5,809 (92.9% in the age bracket) attending a public institution.
| Age Bracket | Public School | Private School |
| 3 to 4 Year Olds | 712 (41.8%) | 992 (58.2%) |
| 5 to 9 Year Old | 4,489 (78.9%) | 1,198 (21.1%) |
| 10 to 14 Year Olds | 6,139 (86.7%) | 946 (13.4%) |
| 15 to 17 Year Olds | 3,252 (82.1%) | 709 (17.9%) |
| 18 to 19 Year Olds | 3,427 (86.8%) | 520 (13.2%) |
| 20 to 24 Year Olds | 5,809 (92.9%) | 445 (7.1%) |
| 25 to 34 Year Olds | 1,836 (88.5%) | 239 (11.5%) |
| 35 Years and over | 1,570 (79.0%) | 416 (20.9%) |
| Total | 27,238 (83.3%) | 5,461 (16.7%) |
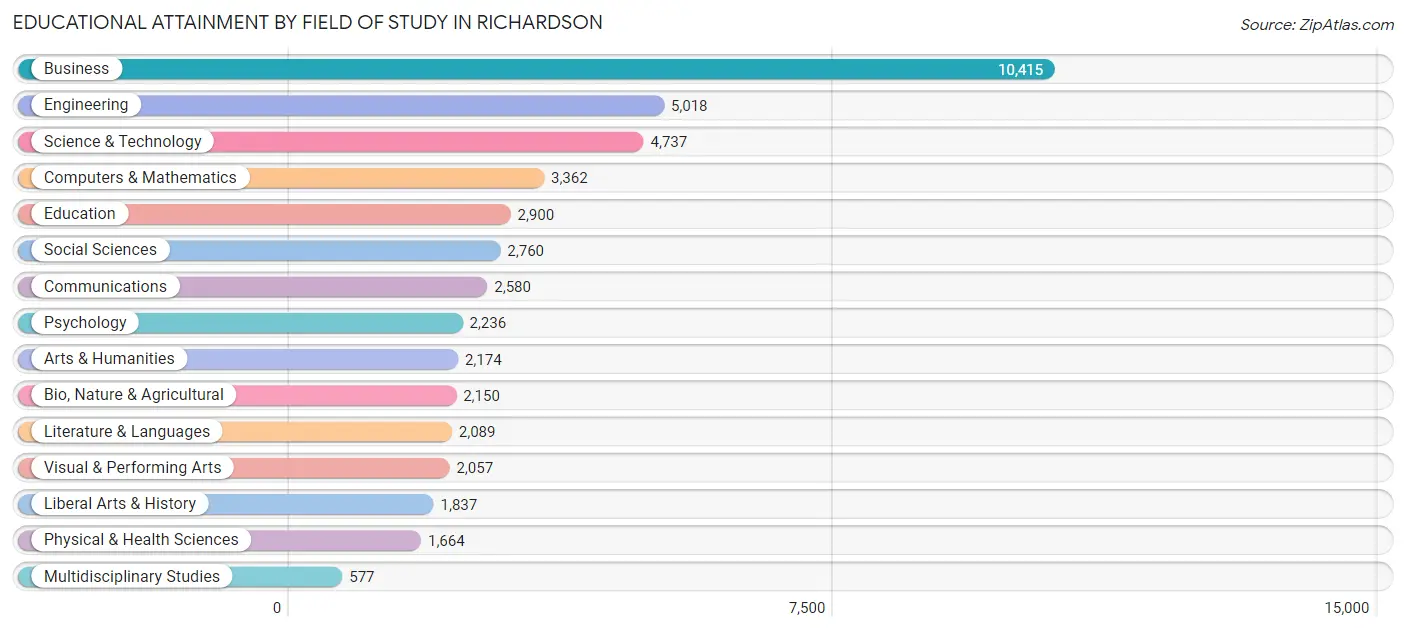
Educational Attainment by Field of Study in Richardson
Business (10,415 | 22.4%), engineering (5,018 | 10.8%), science & technology (4,737 | 10.2%), computers & mathematics (3,362 | 7.2%), and education (2,900 | 6.2%) are the most common fields of study among 46,556 individuals in Richardson who have obtained a bachelor's degree or higher.
| Field of Study | # Graduates | % Graduates |
| Computers & Mathematics | 3,362 | 7.2% |
| Bio, Nature & Agricultural | 2,150 | 4.6% |
| Physical & Health Sciences | 1,664 | 3.6% |
| Psychology | 2,236 | 4.8% |
| Social Sciences | 2,760 | 5.9% |
| Engineering | 5,018 | 10.8% |
| Multidisciplinary Studies | 577 | 1.2% |
| Science & Technology | 4,737 | 10.2% |
| Business | 10,415 | 22.4% |
| Education | 2,900 | 6.2% |
| Literature & Languages | 2,089 | 4.5% |
| Liberal Arts & History | 1,837 | 4.0% |
| Visual & Performing Arts | 2,057 | 4.4% |
| Communications | 2,580 | 5.5% |
| Arts & Humanities | 2,174 | 4.7% |
| Total | 46,556 | 100.0% |
Transportation & Commute in Richardson
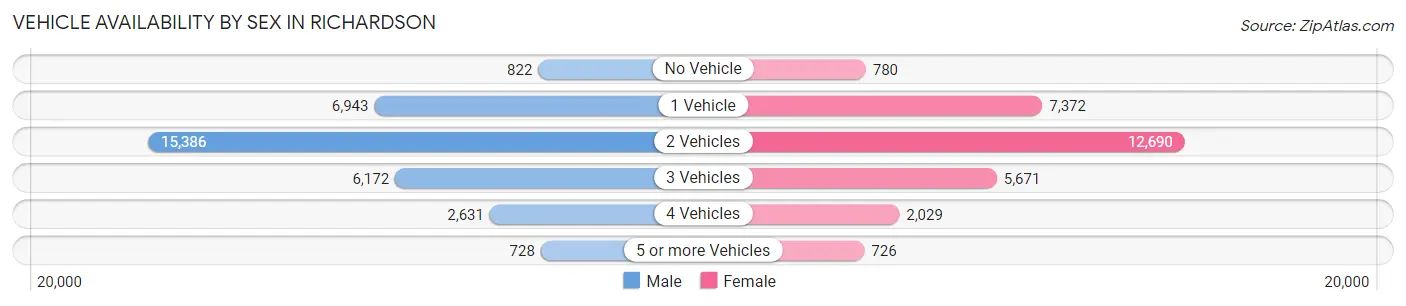
Vehicle Availability by Sex in Richardson
The most prevalent vehicle ownership categories in Richardson are males with 2 vehicles (15,386, accounting for 47.1%) and females with 2 vehicles (12,690, making up 52.6%).
| Vehicles Available | Male | Female |
| No Vehicle | 822 (2.5%) | 780 (2.7%) |
| 1 Vehicle | 6,943 (21.2%) | 7,372 (25.2%) |
| 2 Vehicles | 15,386 (47.1%) | 12,690 (43.4%) |
| 3 Vehicles | 6,172 (18.9%) | 5,671 (19.4%) |
| 4 Vehicles | 2,631 (8.1%) | 2,029 (6.9%) |
| 5 or more Vehicles | 728 (2.2%) | 726 (2.5%) |
| Total | 32,682 (100.0%) | 29,268 (100.0%) |
Commute Time in Richardson
The most frequently occuring commute durations in Richardson are 15 to 19 minutes (8,204 commuters, 16.1%), 20 to 24 minutes (8,131 commuters, 16.0%), and 30 to 34 minutes (7,859 commuters, 15.4%).
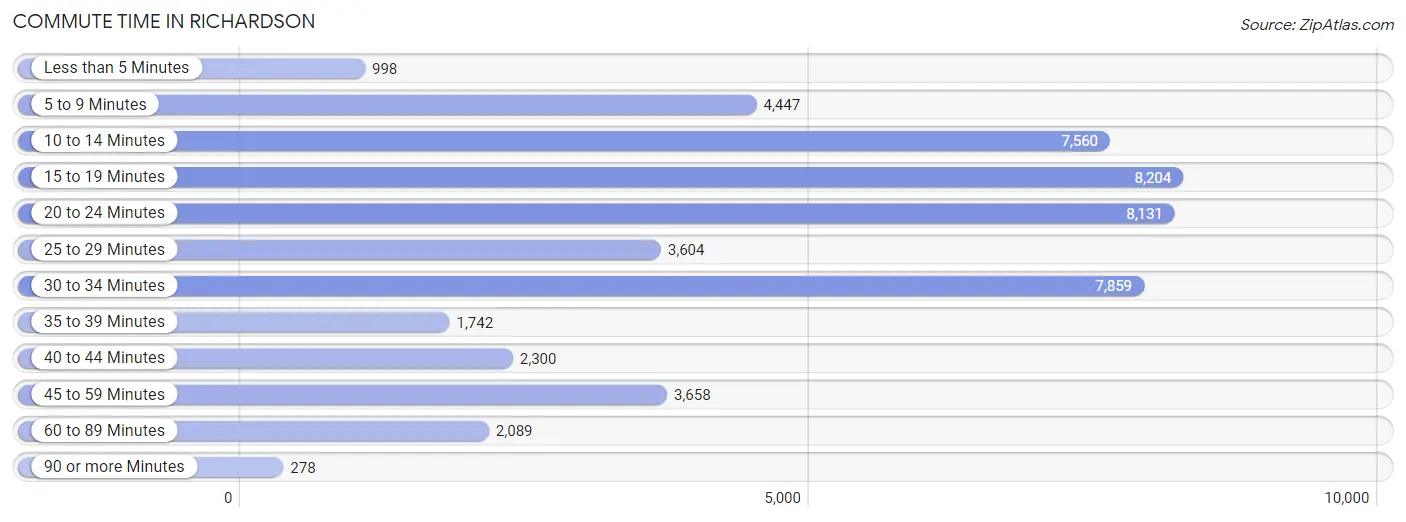
| Commute Time | # Commuters | % Commuters |
| Less than 5 Minutes | 998 | 2.0% |
| 5 to 9 Minutes | 4,447 | 8.7% |
| 10 to 14 Minutes | 7,560 | 14.9% |
| 15 to 19 Minutes | 8,204 | 16.1% |
| 20 to 24 Minutes | 8,131 | 16.0% |
| 25 to 29 Minutes | 3,604 | 7.1% |
| 30 to 34 Minutes | 7,859 | 15.4% |
| 35 to 39 Minutes | 1,742 | 3.4% |
| 40 to 44 Minutes | 2,300 | 4.5% |
| 45 to 59 Minutes | 3,658 | 7.2% |
| 60 to 89 Minutes | 2,089 | 4.1% |
| 90 or more Minutes | 278 | 0.5% |
Commute Time by Sex in Richardson
The most common commute times in Richardson are 20 to 24 minutes (4,278 commuters, 15.8%) for males and 15 to 19 minutes (4,355 commuters, 18.3%) for females.
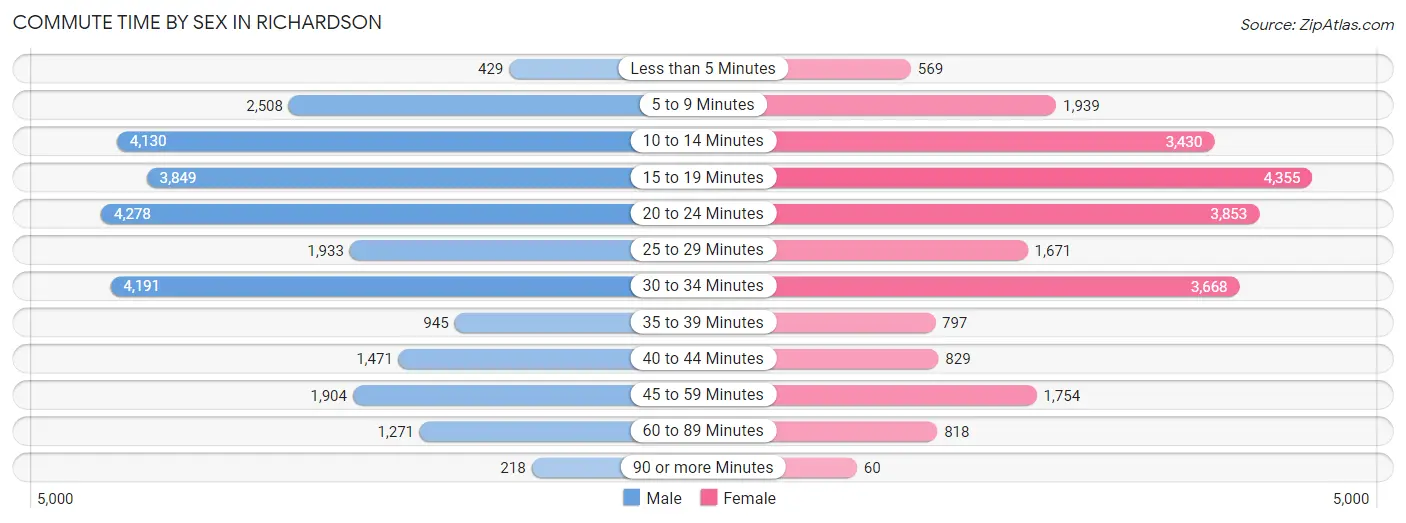
| Commute Time | Male | Female |
| Less than 5 Minutes | 429 (1.6%) | 569 (2.4%) |
| 5 to 9 Minutes | 2,508 (9.2%) | 1,939 (8.2%) |
| 10 to 14 Minutes | 4,130 (15.2%) | 3,430 (14.4%) |
| 15 to 19 Minutes | 3,849 (14.2%) | 4,355 (18.3%) |
| 20 to 24 Minutes | 4,278 (15.8%) | 3,853 (16.2%) |
| 25 to 29 Minutes | 1,933 (7.1%) | 1,671 (7.0%) |
| 30 to 34 Minutes | 4,191 (15.4%) | 3,668 (15.4%) |
| 35 to 39 Minutes | 945 (3.5%) | 797 (3.4%) |
| 40 to 44 Minutes | 1,471 (5.4%) | 829 (3.5%) |
| 45 to 59 Minutes | 1,904 (7.0%) | 1,754 (7.4%) |
| 60 to 89 Minutes | 1,271 (4.7%) | 818 (3.5%) |
| 90 or more Minutes | 218 (0.8%) | 60 (0.3%) |
Time of Departure to Work by Sex in Richardson
The most frequent times of departure to work in Richardson are 8:00 AM to 8:29 AM (4,529, 16.7%) for males and 8:00 AM to 8:29 AM (3,331, 14.0%) for females.
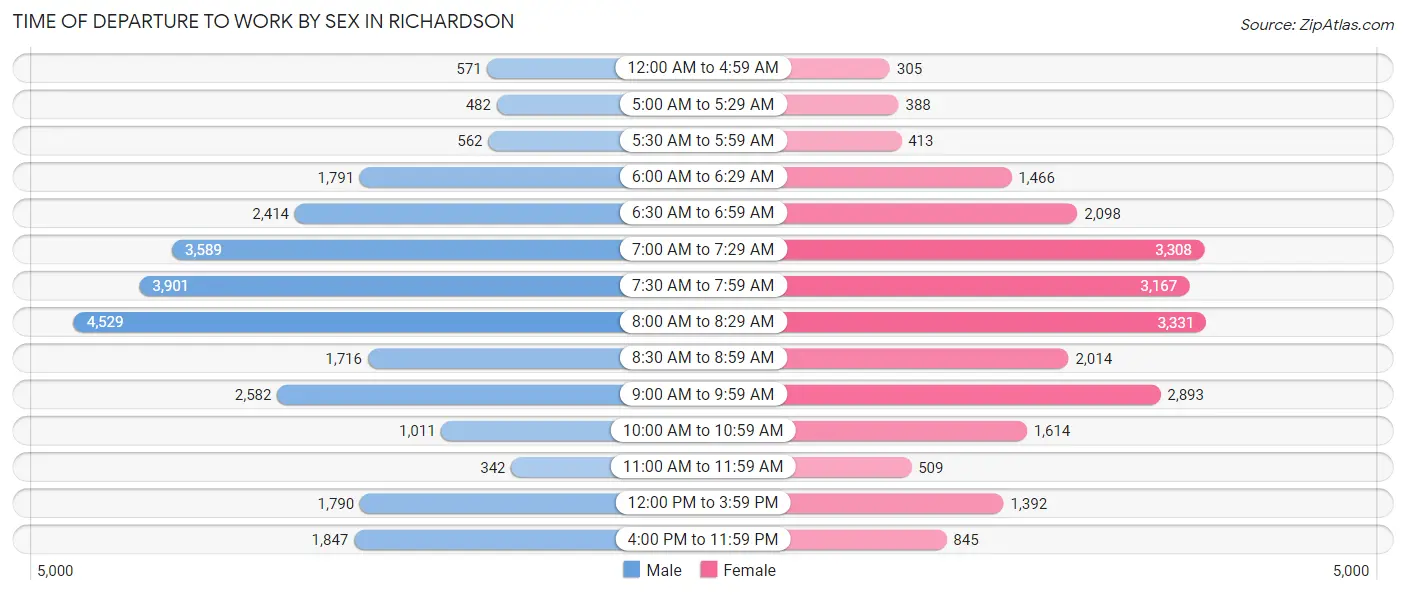
| Time of Departure | Male | Female |
| 12:00 AM to 4:59 AM | 571 (2.1%) | 305 (1.3%) |
| 5:00 AM to 5:29 AM | 482 (1.8%) | 388 (1.6%) |
| 5:30 AM to 5:59 AM | 562 (2.1%) | 413 (1.7%) |
| 6:00 AM to 6:29 AM | 1,791 (6.6%) | 1,466 (6.2%) |
| 6:30 AM to 6:59 AM | 2,414 (8.9%) | 2,098 (8.8%) |
| 7:00 AM to 7:29 AM | 3,589 (13.2%) | 3,308 (13.9%) |
| 7:30 AM to 7:59 AM | 3,901 (14.4%) | 3,167 (13.3%) |
| 8:00 AM to 8:29 AM | 4,529 (16.7%) | 3,331 (14.0%) |
| 8:30 AM to 8:59 AM | 1,716 (6.3%) | 2,014 (8.5%) |
| 9:00 AM to 9:59 AM | 2,582 (9.5%) | 2,893 (12.2%) |
| 10:00 AM to 10:59 AM | 1,011 (3.7%) | 1,614 (6.8%) |
| 11:00 AM to 11:59 AM | 342 (1.3%) | 509 (2.1%) |
| 12:00 PM to 3:59 PM | 1,790 (6.6%) | 1,392 (5.9%) |
| 4:00 PM to 11:59 PM | 1,847 (6.8%) | 845 (3.6%) |
| Total | 27,127 (100.0%) | 23,743 (100.0%) |
Housing Occupancy in Richardson
Occupancy by Ownership in Richardson
Of the total 45,200 dwellings in Richardson, owner-occupied units account for 23,343 (51.6%), while renter-occupied units make up 21,857 (48.4%).
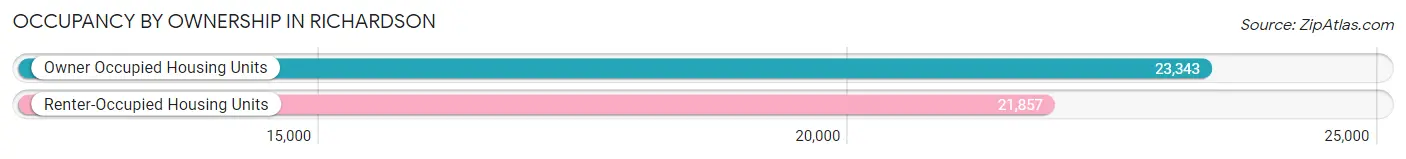
| Occupancy | # Housing Units | % Housing Units |
| Owner Occupied Housing Units | 23,343 | 51.6% |
| Renter-Occupied Housing Units | 21,857 | 48.4% |
| Total Occupied Housing Units | 45,200 | 100.0% |
Occupancy by Household Size in Richardson
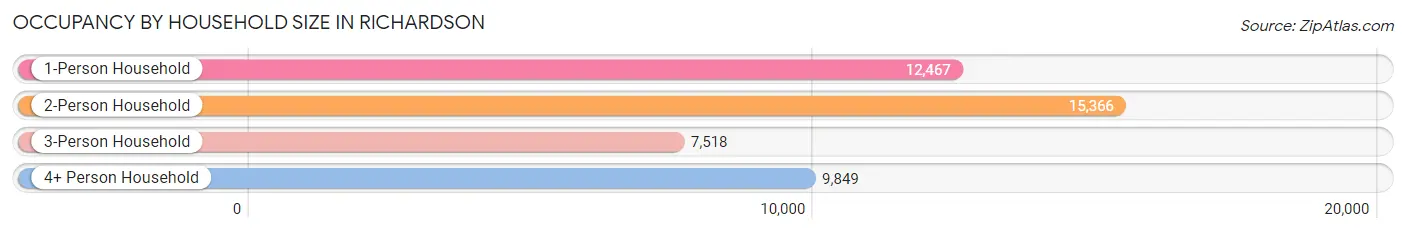
| Household Size | # Housing Units | % Housing Units |
| 1-Person Household | 12,467 | 27.6% |
| 2-Person Household | 15,366 | 34.0% |
| 3-Person Household | 7,518 | 16.6% |
| 4+ Person Household | 9,849 | 21.8% |
| Total Housing Units | 45,200 | 100.0% |
Occupancy by Ownership by Household Size in Richardson
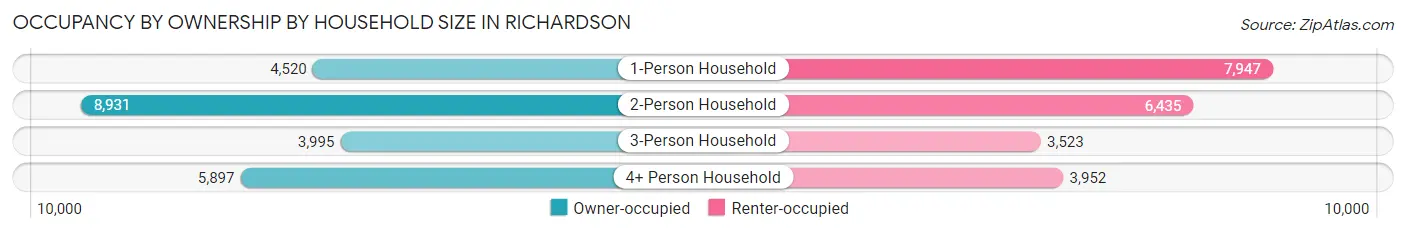
| Household Size | Owner-occupied | Renter-occupied |
| 1-Person Household | 4,520 (36.3%) | 7,947 (63.7%) |
| 2-Person Household | 8,931 (58.1%) | 6,435 (41.9%) |
| 3-Person Household | 3,995 (53.1%) | 3,523 (46.9%) |
| 4+ Person Household | 5,897 (59.9%) | 3,952 (40.1%) |
| Total Housing Units | 23,343 (51.6%) | 21,857 (48.4%) |
Occupancy by Educational Attainment in Richardson
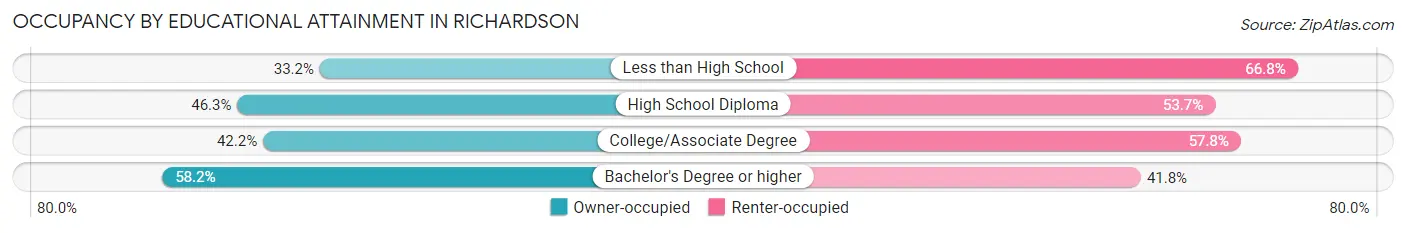
| Household Size | Owner-occupied | Renter-occupied |
| Less than High School | 745 (33.2%) | 1,500 (66.8%) |
| High School Diploma | 2,037 (46.3%) | 2,366 (53.7%) |
| College/Associate Degree | 4,914 (42.2%) | 6,734 (57.8%) |
| Bachelor's Degree or higher | 15,647 (58.2%) | 11,257 (41.8%) |
Occupancy by Age of Householder in Richardson
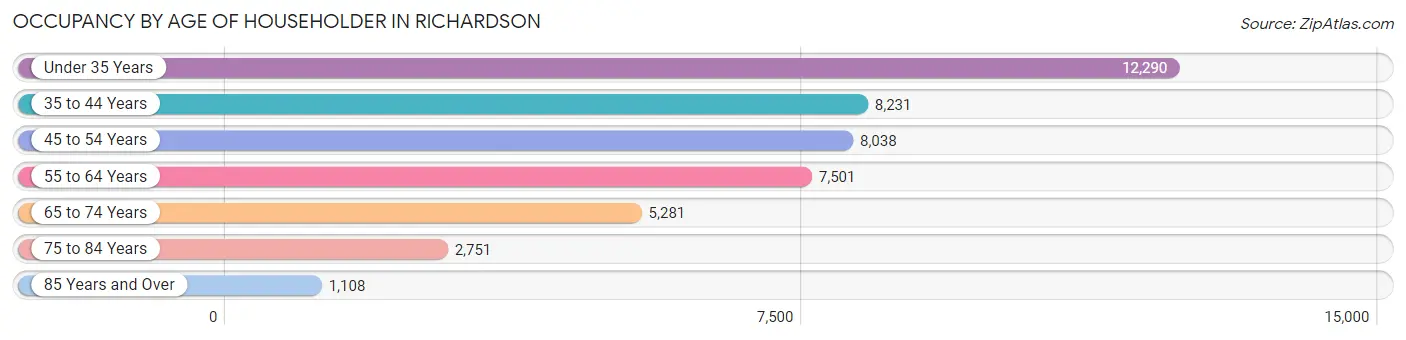
| Age Bracket | # Households | % Households |
| Under 35 Years | 12,290 | 27.2% |
| 35 to 44 Years | 8,231 | 18.2% |
| 45 to 54 Years | 8,038 | 17.8% |
| 55 to 64 Years | 7,501 | 16.6% |
| 65 to 74 Years | 5,281 | 11.7% |
| 75 to 84 Years | 2,751 | 6.1% |
| 85 Years and Over | 1,108 | 2.5% |
| Total | 45,200 | 100.0% |
Housing Finances in Richardson
Median Income by Occupancy in Richardson
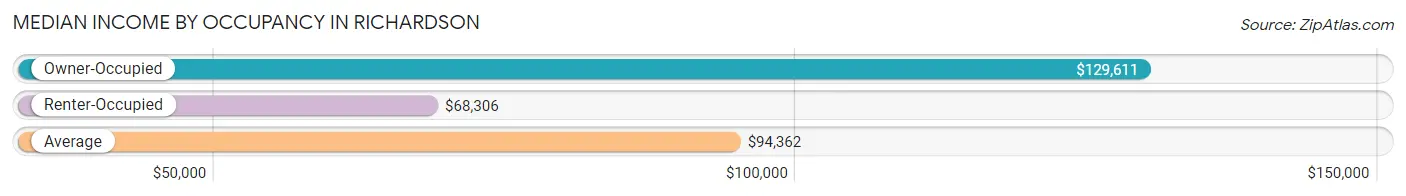
| Occupancy Type | # Households | Median Income |
| Owner-Occupied | 23,343 (51.6%) | $129,611 |
| Renter-Occupied | 21,857 (48.4%) | $68,306 |
| Average | 45,200 (100.0%) | $94,362 |
Occupancy by Householder Income Bracket in Richardson
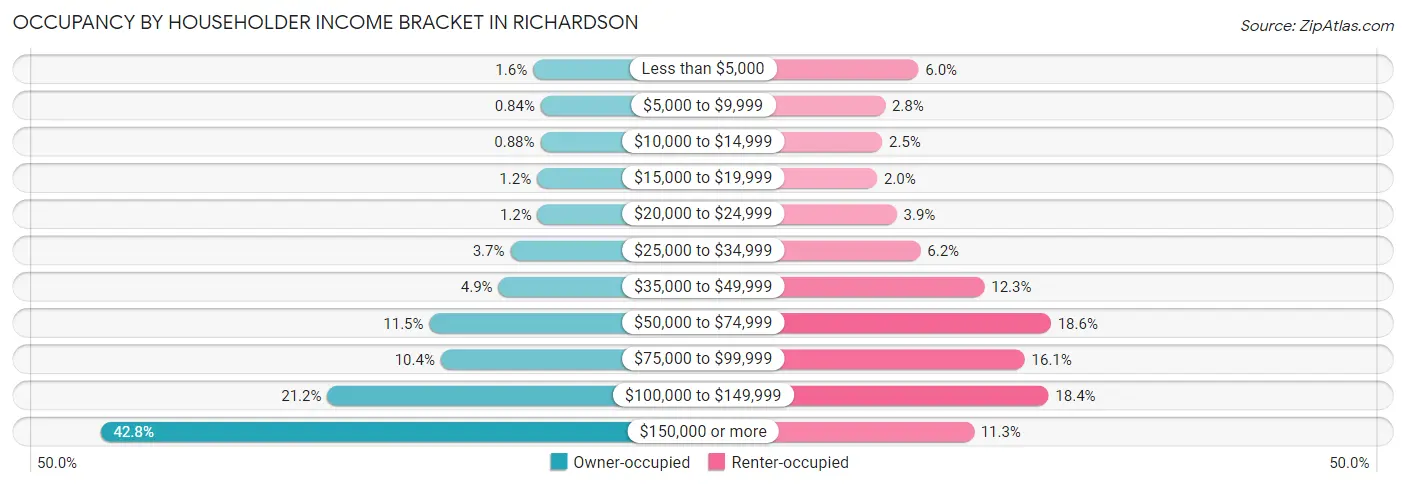
| Income Bracket | Owner-occupied | Renter-occupied |
| Less than $5,000 | 368 (1.6%) | 1,308 (6.0%) |
| $5,000 to $9,999 | 195 (0.8%) | 613 (2.8%) |
| $10,000 to $14,999 | 205 (0.9%) | 552 (2.5%) |
| $15,000 to $19,999 | 279 (1.2%) | 446 (2.0%) |
| $20,000 to $24,999 | 269 (1.1%) | 855 (3.9%) |
| $25,000 to $34,999 | 874 (3.7%) | 1,348 (6.2%) |
| $35,000 to $49,999 | 1,136 (4.9%) | 2,680 (12.3%) |
| $50,000 to $74,999 | 2,672 (11.5%) | 4,064 (18.6%) |
| $75,000 to $99,999 | 2,420 (10.4%) | 3,518 (16.1%) |
| $100,000 to $149,999 | 4,941 (21.2%) | 4,015 (18.4%) |
| $150,000 or more | 9,984 (42.8%) | 2,458 (11.3%) |
| Total | 23,343 (100.0%) | 21,857 (100.0%) |
Monthly Housing Cost Tiers in Richardson
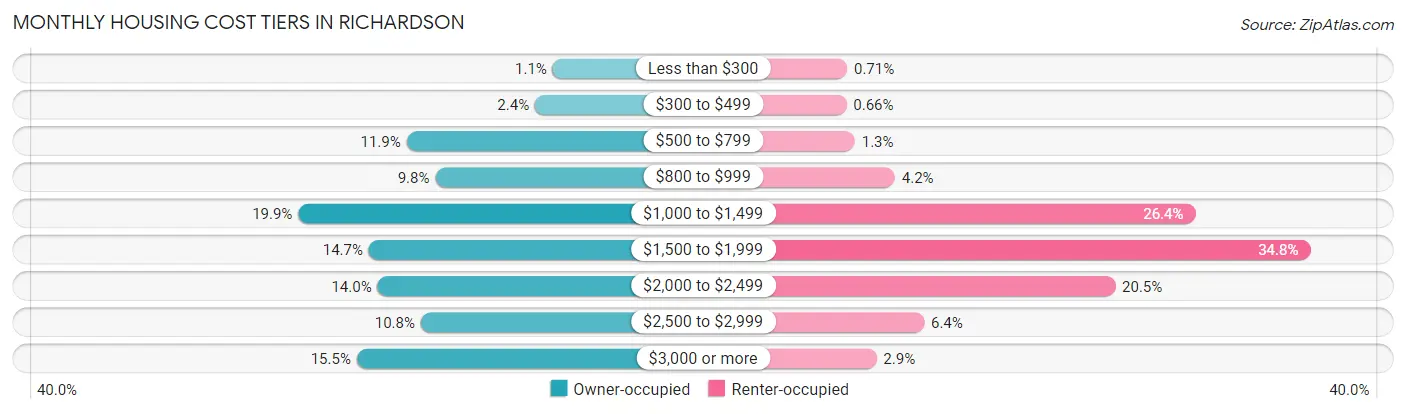
| Monthly Cost | Owner-occupied | Renter-occupied |
| Less than $300 | 260 (1.1%) | 156 (0.7%) |
| $300 to $499 | 563 (2.4%) | 144 (0.7%) |
| $500 to $799 | 2,771 (11.9%) | 279 (1.3%) |
| $800 to $999 | 2,275 (9.8%) | 924 (4.2%) |
| $1,000 to $1,499 | 4,633 (19.9%) | 5,761 (26.4%) |
| $1,500 to $1,999 | 3,419 (14.6%) | 7,611 (34.8%) |
| $2,000 to $2,499 | 3,270 (14.0%) | 4,469 (20.4%) |
| $2,500 to $2,999 | 2,525 (10.8%) | 1,395 (6.4%) |
| $3,000 or more | 3,627 (15.5%) | 628 (2.9%) |
| Total | 23,343 (100.0%) | 21,857 (100.0%) |
Physical Housing Characteristics in Richardson
Housing Structures in Richardson
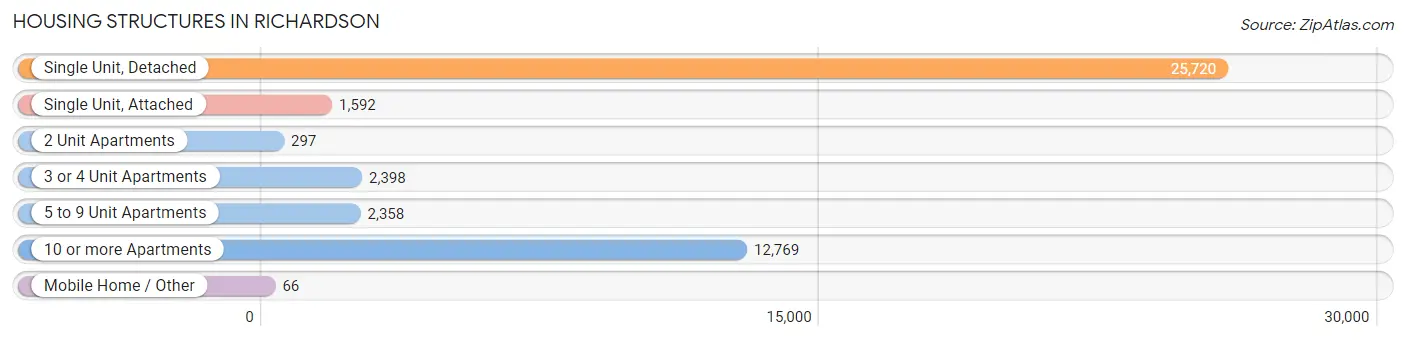
| Structure Type | # Housing Units | % Housing Units |
| Single Unit, Detached | 25,720 | 56.9% |
| Single Unit, Attached | 1,592 | 3.5% |
| 2 Unit Apartments | 297 | 0.7% |
| 3 or 4 Unit Apartments | 2,398 | 5.3% |
| 5 to 9 Unit Apartments | 2,358 | 5.2% |
| 10 or more Apartments | 12,769 | 28.2% |
| Mobile Home / Other | 66 | 0.2% |
| Total | 45,200 | 100.0% |
Housing Structures by Occupancy in Richardson
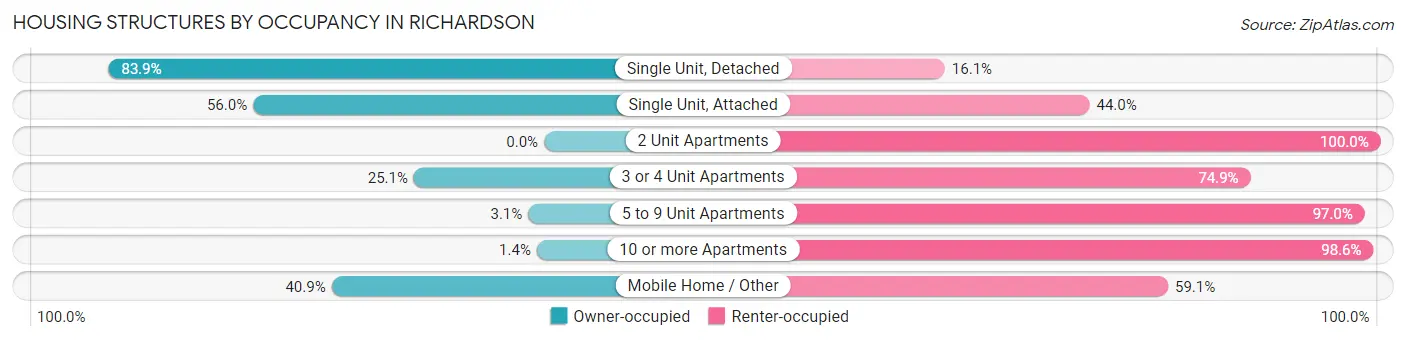
| Structure Type | Owner-occupied | Renter-occupied |
| Single Unit, Detached | 21,573 (83.9%) | 4,147 (16.1%) |
| Single Unit, Attached | 892 (56.0%) | 700 (44.0%) |
| 2 Unit Apartments | 0 (0.0%) | 297 (100.0%) |
| 3 or 4 Unit Apartments | 601 (25.1%) | 1,797 (74.9%) |
| 5 to 9 Unit Apartments | 72 (3.0%) | 2,286 (97.0%) |
| 10 or more Apartments | 178 (1.4%) | 12,591 (98.6%) |
| Mobile Home / Other | 27 (40.9%) | 39 (59.1%) |
| Total | 23,343 (51.6%) | 21,857 (48.4%) |
Housing Structures by Number of Rooms in Richardson
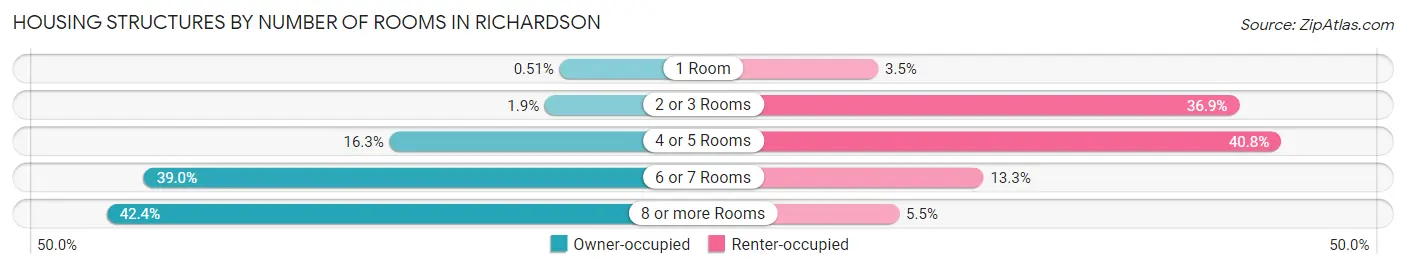
| Number of Rooms | Owner-occupied | Renter-occupied |
| 1 Room | 119 (0.5%) | 772 (3.5%) |
| 2 or 3 Rooms | 436 (1.9%) | 8,070 (36.9%) |
| 4 or 5 Rooms | 3,793 (16.3%) | 8,915 (40.8%) |
| 6 or 7 Rooms | 9,097 (39.0%) | 2,903 (13.3%) |
| 8 or more Rooms | 9,898 (42.4%) | 1,197 (5.5%) |
| Total | 23,343 (100.0%) | 21,857 (100.0%) |
Housing Structure by Heating Type in Richardson
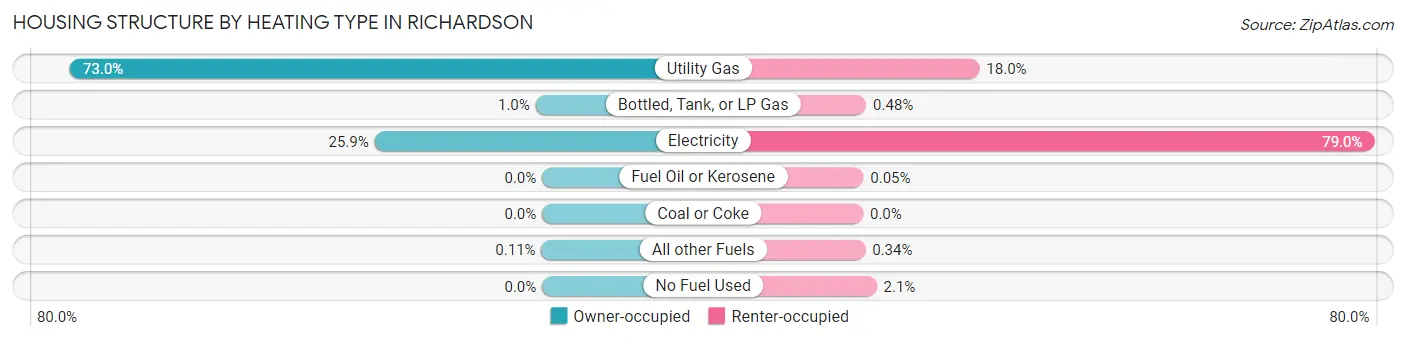
| Heating Type | Owner-occupied | Renter-occupied |
| Utility Gas | 17,037 (73.0%) | 3,933 (18.0%) |
| Bottled, Tank, or LP Gas | 234 (1.0%) | 105 (0.5%) |
| Electricity | 6,046 (25.9%) | 17,274 (79.0%) |
| Fuel Oil or Kerosene | 0 (0.0%) | 12 (0.1%) |
| Coal or Coke | 0 (0.0%) | 0 (0.0%) |
| All other Fuels | 26 (0.1%) | 75 (0.3%) |
| No Fuel Used | 0 (0.0%) | 458 (2.1%) |
| Total | 23,343 (100.0%) | 21,857 (100.0%) |
Household Vehicle Usage in Richardson
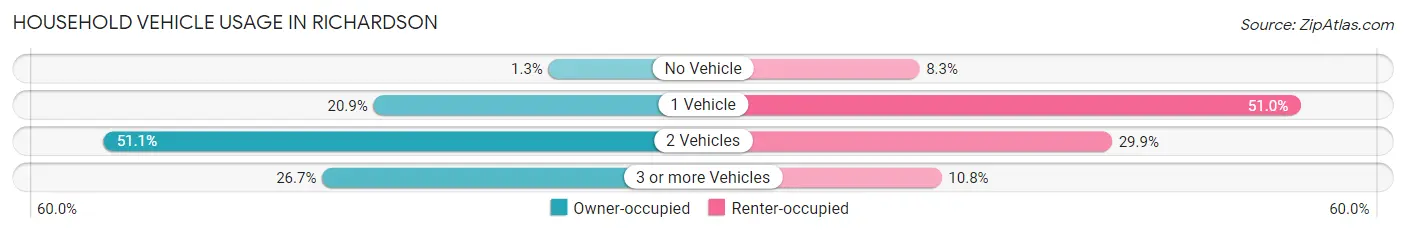
| Vehicles per Household | Owner-occupied | Renter-occupied |
| No Vehicle | 302 (1.3%) | 1,818 (8.3%) |
| 1 Vehicle | 4,882 (20.9%) | 11,143 (51.0%) |
| 2 Vehicles | 11,936 (51.1%) | 6,534 (29.9%) |
| 3 or more Vehicles | 6,223 (26.7%) | 2,362 (10.8%) |
| Total | 23,343 (100.0%) | 21,857 (100.0%) |
Real Estate & Mortgages in Richardson
Real Estate and Mortgage Overview in Richardson
| Characteristic | Without Mortgage | With Mortgage |
| Housing Units | 9,950 | 13,393 |
| Median Property Value | $363,800 | $390,200 |
| Median Household Income | $103,264 | $6,848 |
| Monthly Housing Costs | $931 | $3,547 |
| Real Estate Taxes | $5,193 | $223 |
Property Value by Mortgage Status in Richardson
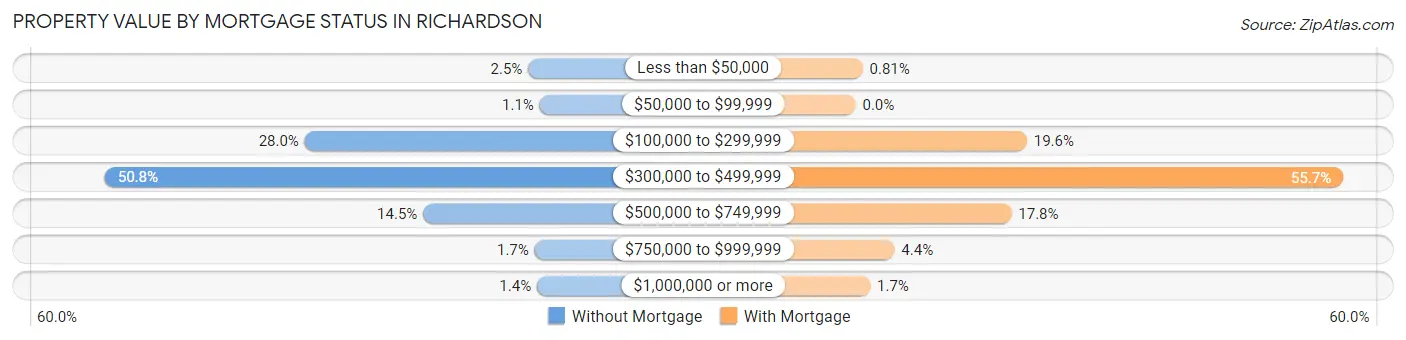
| Property Value | Without Mortgage | With Mortgage |
| Less than $50,000 | 244 (2.5%) | 109 (0.8%) |
| $50,000 to $99,999 | 112 (1.1%) | 0 (0.0%) |
| $100,000 to $299,999 | 2,785 (28.0%) | 2,621 (19.6%) |
| $300,000 to $499,999 | 5,058 (50.8%) | 7,461 (55.7%) |
| $500,000 to $749,999 | 1,438 (14.4%) | 2,385 (17.8%) |
| $750,000 to $999,999 | 170 (1.7%) | 595 (4.4%) |
| $1,000,000 or more | 143 (1.4%) | 222 (1.7%) |
| Total | 9,950 (100.0%) | 13,393 (100.0%) |
Household Income by Mortgage Status in Richardson
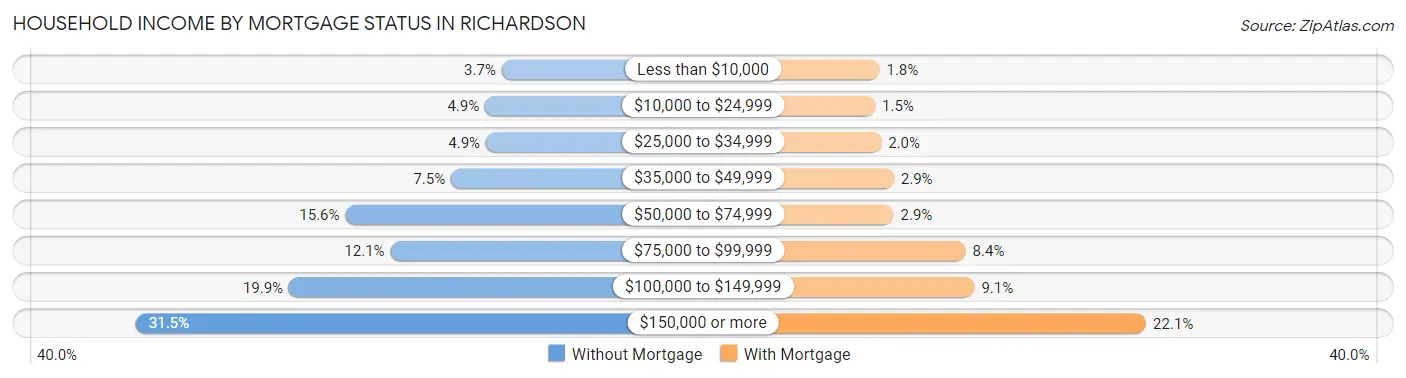
| Household Income | Without Mortgage | With Mortgage |
| Less than $10,000 | 363 (3.6%) | 245 (1.8%) |
| $10,000 to $24,999 | 490 (4.9%) | 200 (1.5%) |
| $25,000 to $34,999 | 483 (4.9%) | 263 (2.0%) |
| $35,000 to $49,999 | 747 (7.5%) | 391 (2.9%) |
| $50,000 to $74,999 | 1,548 (15.6%) | 389 (2.9%) |
| $75,000 to $99,999 | 1,207 (12.1%) | 1,124 (8.4%) |
| $100,000 to $149,999 | 1,976 (19.9%) | 1,213 (9.1%) |
| $150,000 or more | 3,136 (31.5%) | 2,965 (22.1%) |
| Total | 9,950 (100.0%) | 13,393 (100.0%) |
Property Value to Household Income Ratio in Richardson
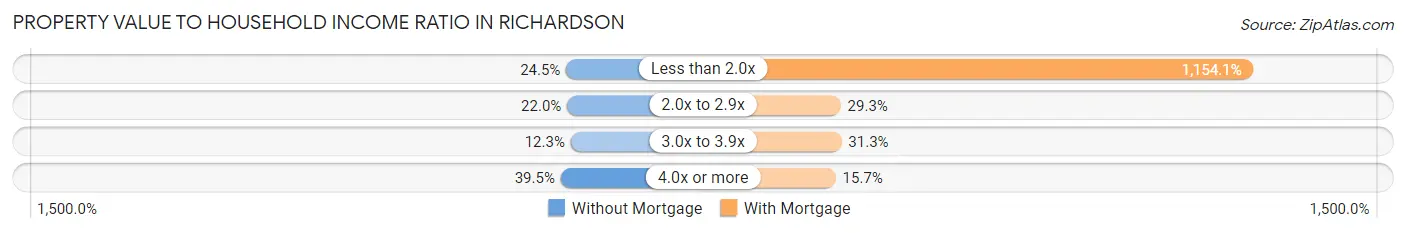
| Value-to-Income Ratio | Without Mortgage | With Mortgage |
| Less than 2.0x | 2,441 (24.5%) | 154,562 (1,154.0%) |
| 2.0x to 2.9x | 2,189 (22.0%) | 3,918 (29.2%) |
| 3.0x to 3.9x | 1,220 (12.3%) | 4,192 (31.3%) |
| 4.0x or more | 3,926 (39.5%) | 2,098 (15.7%) |
| Total | 9,950 (100.0%) | 13,393 (100.0%) |
Real Estate Taxes by Mortgage Status in Richardson
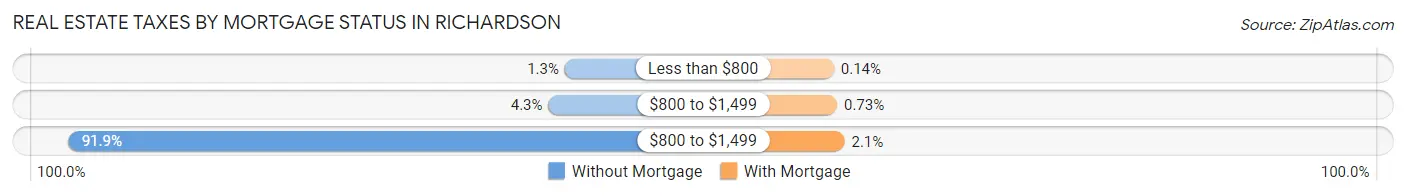
| Property Taxes | Without Mortgage | With Mortgage |
| Less than $800 | 133 (1.3%) | 19 (0.1%) |
| $800 to $1,499 | 432 (4.3%) | 98 (0.7%) |
| $800 to $1,499 | 9,147 (91.9%) | 281 (2.1%) |
| Total | 9,950 (100.0%) | 13,393 (100.0%) |
Health & Disability in Richardson
Health Insurance Coverage by Age in Richardson
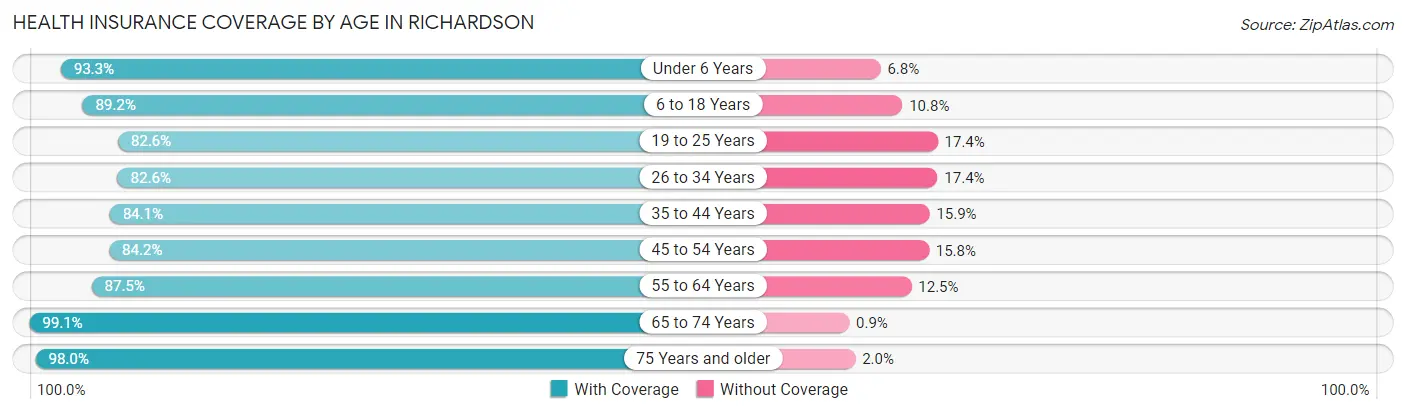
| Age Bracket | With Coverage | Without Coverage |
| Under 6 Years | 8,079 (93.2%) | 585 (6.8%) |
| 6 to 18 Years | 16,308 (89.2%) | 1,975 (10.8%) |
| 19 to 25 Years | 11,679 (82.6%) | 2,460 (17.4%) |
| 26 to 34 Years | 15,558 (82.6%) | 3,269 (17.4%) |
| 35 to 44 Years | 12,685 (84.1%) | 2,394 (15.9%) |
| 45 to 54 Years | 12,643 (84.2%) | 2,365 (15.8%) |
| 55 to 64 Years | 11,392 (87.5%) | 1,627 (12.5%) |
| 65 to 74 Years | 8,786 (99.1%) | 80 (0.9%) |
| 75 Years and older | 5,606 (98.0%) | 117 (2.0%) |
| Total | 102,736 (87.4%) | 14,872 (12.7%) |
Health Insurance Coverage by Citizenship Status in Richardson
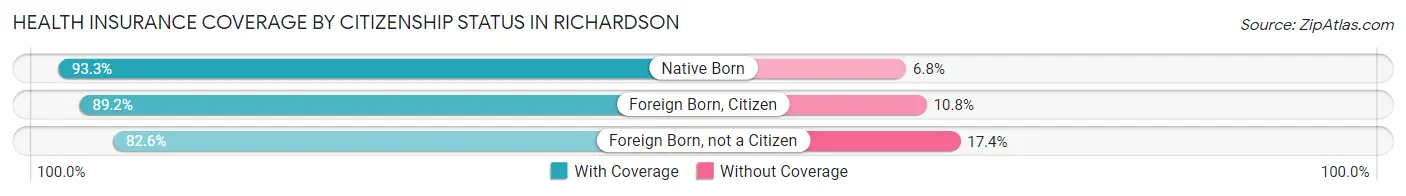
| Citizenship Status | With Coverage | Without Coverage |
| Native Born | 8,079 (93.2%) | 585 (6.8%) |
| Foreign Born, Citizen | 16,308 (89.2%) | 1,975 (10.8%) |
| Foreign Born, not a Citizen | 11,679 (82.6%) | 2,460 (17.4%) |
Health Insurance Coverage by Household Income in Richardson
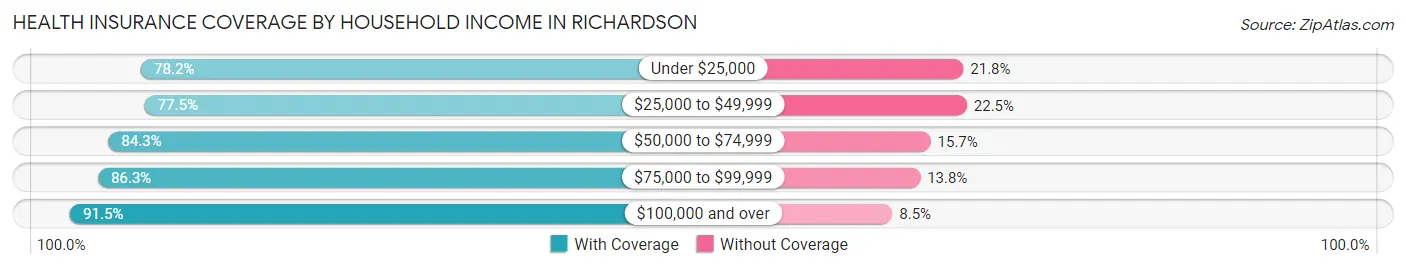
| Household Income | With Coverage | Without Coverage |
| Under $25,000 | 7,654 (78.2%) | 2,139 (21.8%) |
| $25,000 to $49,999 | 10,064 (77.5%) | 2,921 (22.5%) |
| $50,000 to $74,999 | 12,237 (84.3%) | 2,279 (15.7%) |
| $75,000 to $99,999 | 13,387 (86.3%) | 2,134 (13.8%) |
| $100,000 and over | 56,354 (91.5%) | 5,264 (8.5%) |
Public vs Private Health Insurance Coverage by Age in Richardson
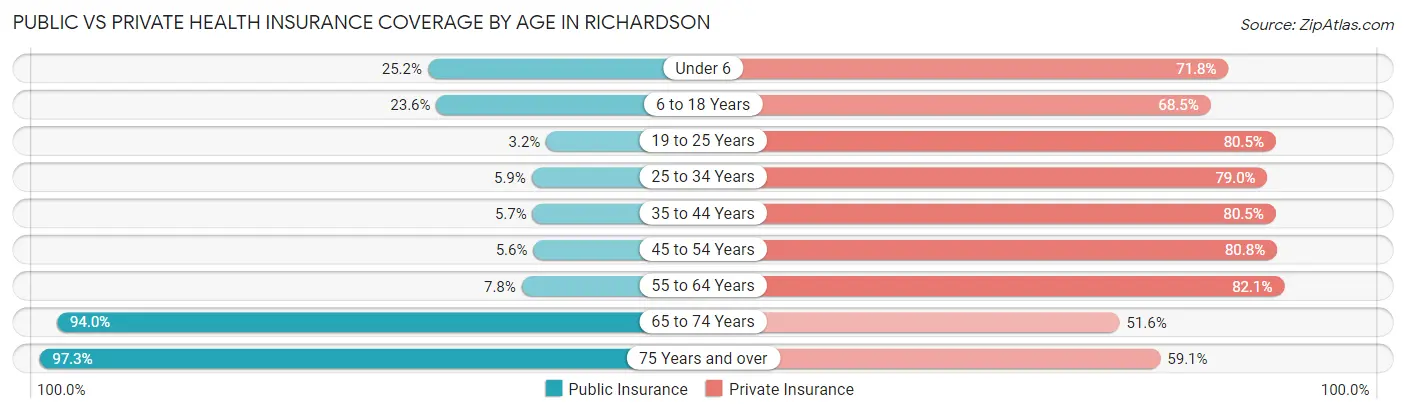
| Age Bracket | Public Insurance | Private Insurance |
| Under 6 | 2,180 (25.2%) | 6,216 (71.8%) |
| 6 to 18 Years | 4,310 (23.6%) | 12,514 (68.4%) |
| 19 to 25 Years | 451 (3.2%) | 11,388 (80.5%) |
| 25 to 34 Years | 1,108 (5.9%) | 14,873 (79.0%) |
| 35 to 44 Years | 863 (5.7%) | 12,142 (80.5%) |
| 45 to 54 Years | 837 (5.6%) | 12,122 (80.8%) |
| 55 to 64 Years | 1,009 (7.7%) | 10,691 (82.1%) |
| 65 to 74 Years | 8,334 (94.0%) | 4,570 (51.5%) |
| 75 Years and over | 5,566 (97.3%) | 3,384 (59.1%) |
| Total | 24,658 (21.0%) | 87,900 (74.7%) |
Disability Status by Sex by Age in Richardson
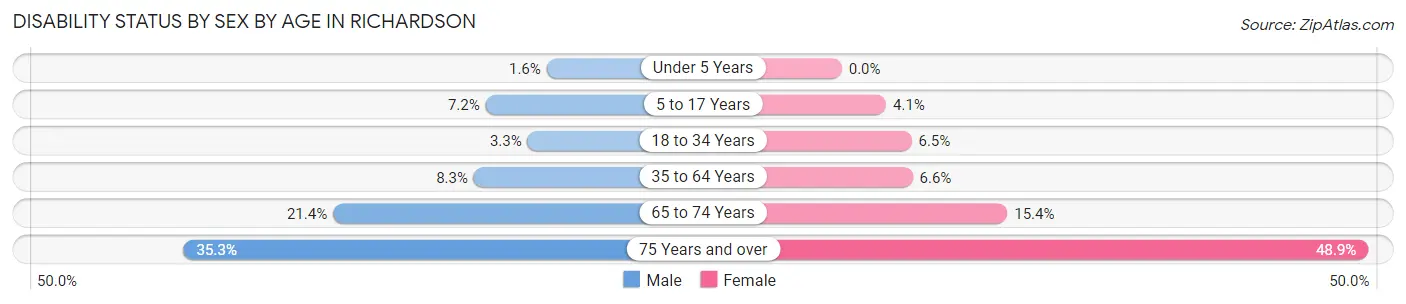
| Age Bracket | Male | Female |
| Under 5 Years | 62 (1.5%) | 0 (0.0%) |
| 5 to 17 Years | 566 (7.2%) | 390 (4.1%) |
| 18 to 34 Years | 601 (3.3%) | 1,099 (6.5%) |
| 35 to 64 Years | 1,713 (8.3%) | 1,477 (6.6%) |
| 65 to 74 Years | 892 (21.4%) | 721 (15.4%) |
| 75 Years and over | 894 (35.2%) | 1,557 (48.8%) |
Disability Class by Sex by Age in Richardson
Disability Class: Hearing Difficulty
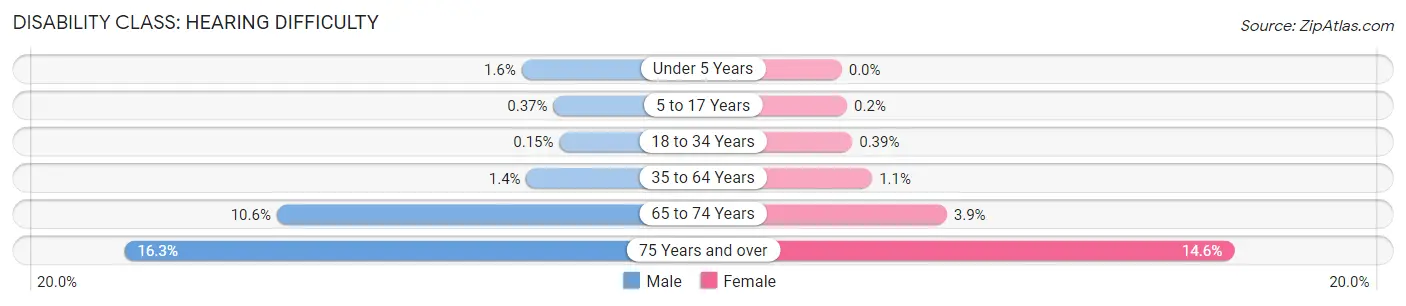
| Age Bracket | Male | Female |
| Under 5 Years | 62 (1.5%) | 0 (0.0%) |
| 5 to 17 Years | 29 (0.4%) | 19 (0.2%) |
| 18 to 34 Years | 27 (0.2%) | 67 (0.4%) |
| 35 to 64 Years | 283 (1.4%) | 255 (1.1%) |
| 65 to 74 Years | 444 (10.6%) | 183 (3.9%) |
| 75 Years and over | 413 (16.3%) | 464 (14.6%) |
Disability Class: Vision Difficulty
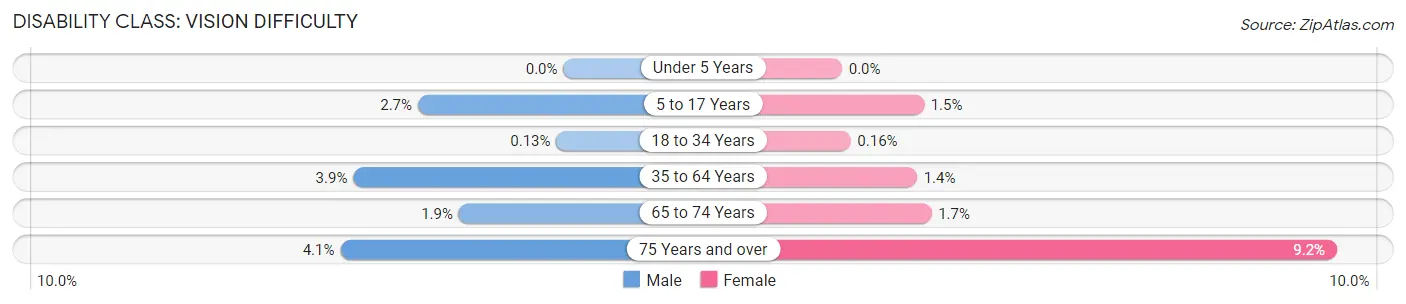
| Age Bracket | Male | Female |
| Under 5 Years | 0 (0.0%) | 0 (0.0%) |
| 5 to 17 Years | 212 (2.7%) | 144 (1.5%) |
| 18 to 34 Years | 23 (0.1%) | 28 (0.2%) |
| 35 to 64 Years | 803 (3.9%) | 313 (1.4%) |
| 65 to 74 Years | 81 (1.9%) | 78 (1.7%) |
| 75 Years and over | 105 (4.1%) | 293 (9.2%) |
Disability Class: Cognitive Difficulty
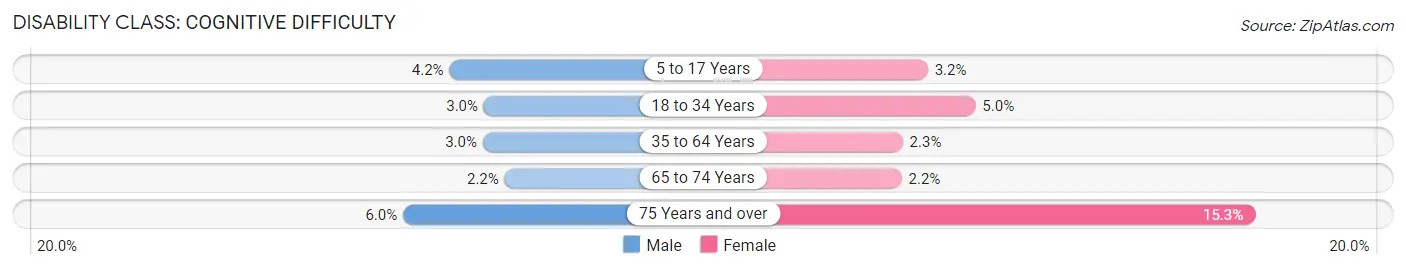
| Age Bracket | Male | Female |
| 5 to 17 Years | 332 (4.2%) | 303 (3.2%) |
| 18 to 34 Years | 534 (2.9%) | 842 (5.0%) |
| 35 to 64 Years | 617 (3.0%) | 509 (2.3%) |
| 65 to 74 Years | 91 (2.2%) | 104 (2.2%) |
| 75 Years and over | 151 (5.9%) | 489 (15.3%) |
Disability Class: Ambulatory Difficulty
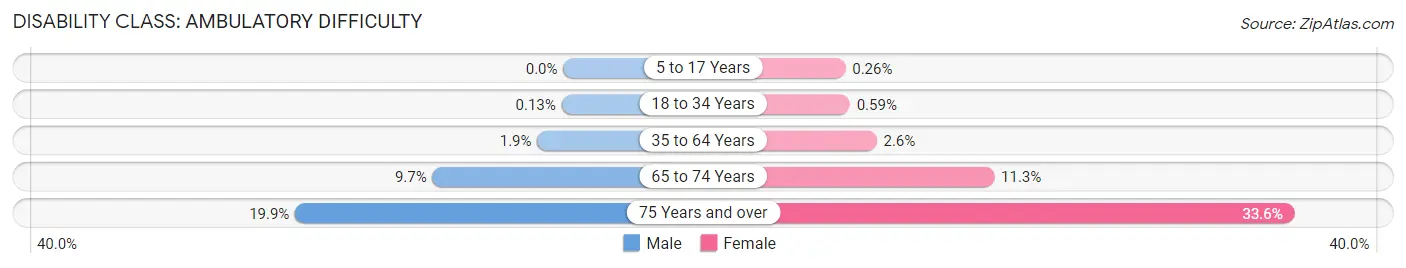
| Age Bracket | Male | Female |
| 5 to 17 Years | 0 (0.0%) | 25 (0.3%) |
| 18 to 34 Years | 23 (0.1%) | 100 (0.6%) |
| 35 to 64 Years | 397 (1.9%) | 581 (2.6%) |
| 65 to 74 Years | 405 (9.7%) | 531 (11.3%) |
| 75 Years and over | 505 (19.9%) | 1,071 (33.6%) |
Disability Class: Self-Care Difficulty
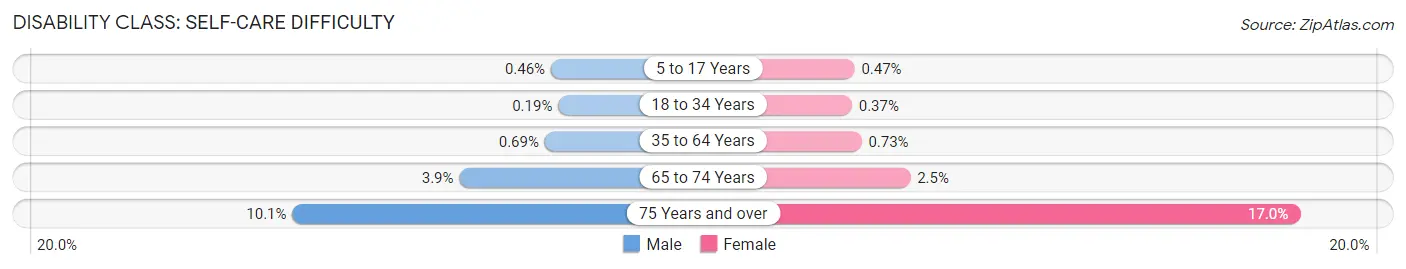
| Age Bracket | Male | Female |
| 5 to 17 Years | 36 (0.5%) | 45 (0.5%) |
| 18 to 34 Years | 34 (0.2%) | 63 (0.4%) |
| 35 to 64 Years | 143 (0.7%) | 165 (0.7%) |
| 65 to 74 Years | 161 (3.9%) | 119 (2.5%) |
| 75 Years and over | 255 (10.1%) | 542 (17.0%) |
Technology Access in Richardson
Computing Device Access in Richardson
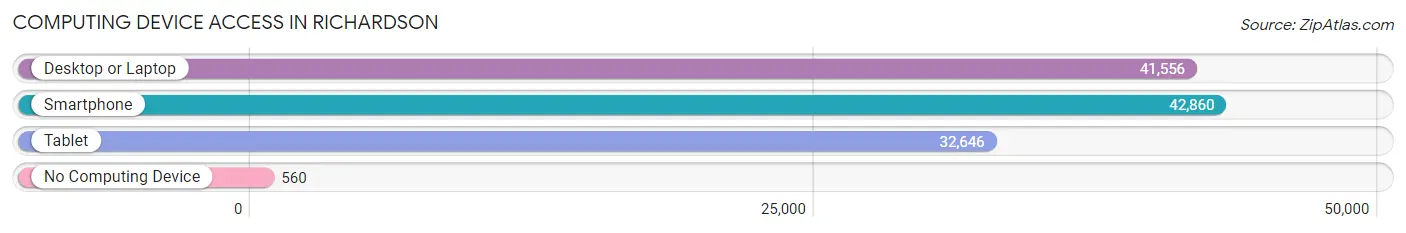
| Device Type | # Households | % Households |
| Desktop or Laptop | 41,556 | 91.9% |
| Smartphone | 42,860 | 94.8% |
| Tablet | 32,646 | 72.2% |
| No Computing Device | 560 | 1.2% |
| Total | 45,200 | 100.0% |
Internet Access in Richardson
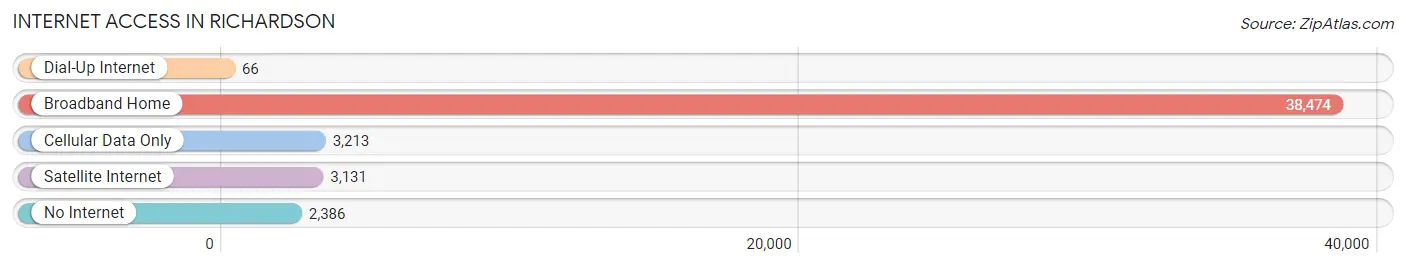
| Internet Type | # Households | % Households |
| Dial-Up Internet | 66 | 0.2% |
| Broadband Home | 38,474 | 85.1% |
| Cellular Data Only | 3,213 | 7.1% |
| Satellite Internet | 3,131 | 6.9% |
| No Internet | 2,386 | 5.3% |
| Total | 45,200 | 100.0% |
Richardson Summary
Richardson, Texas is a city located in the Dallas-Fort Worth metropolitan area in the U.S. state of Texas. It is the third-largest city in Dallas County and the ninth-largest city in the state. The city is home to the University of Texas at Dallas and the Telecom Corridor, with a population of 106,123 as of the 2010 census.
History
Richardson was founded in 1873 by William J. Wheeler and named after the railroad contractor E.H. Richardson. The city was incorporated in 1925 and has since grown to become a major suburb of Dallas. The city has a rich history, having been the site of the first cotton gin in Texas, the first public school in Dallas County, and the first post office in the county.
Geography
Richardson is located in the Dallas-Fort Worth metropolitan area in the U.S. state of Texas. It is situated in the northeast corner of Dallas County, and is bordered by the cities of Plano, Garland, and Dallas. The city has a total area of 22.7 square miles, of which 22.5 square miles is land and 0.2 square miles is water.
Economy
Richardson is home to the Telecom Corridor, a technology hub that is home to many Fortune 500 companies, including AT&T, Verizon, Ericsson, and Texas Instruments. The city is also home to the University of Texas at Dallas, which is a major research university and a major employer in the city. Other major employers in the city include State Farm Insurance, Blue Cross Blue Shield of Texas, and Raytheon.
Demographics
As of the 2010 census, the population of Richardson was 106,123, with a population density of 4,637 people per square mile. The racial makeup of the city was 68.2% White, 11.3% African American, 0.5% Native American, 11.7% Asian, 0.1% Pacific Islander, 5.2% from other races, and 3.0% from two or more races. Hispanic or Latino of any race were 17.3% of the population.
The median income for a household in the city was $63,945, and the median income for a family was $76,821. The per capita income for the city was $31,945. About 8.2% of families and 11.2% of the population were below the poverty line, including 15.2% of those under age 18 and 6.2% of those age 65 or over.
Common Questions
What is Per Capita Income in Richardson?
Per Capita income in Richardson is $48,231.
What is the Median Family Income in Richardson?
Median Family Income in Richardson is $114,293.
What is the Median Household income in Richardson?
Median Household Income in Richardson is $94,362.
What is Income or Wage Gap in Richardson?
Income or Wage Gap in Richardson is 19.0%.
Women in Richardson earn 81.0 cents for every dollar earned by a man.
What is Family Income Deficit in Richardson?
Family Income Deficit in Richardson is $10,720.
Families that are below poverty line in Richardson earn $10,720 less on average than the poverty threshold level.
What is Inequality or Gini Index in Richardson?
Inequality or Gini Index in Richardson is 0.45.
What is the Total Population of Richardson?
Total Population of Richardson is 118,063.
What is the Total Male Population of Richardson?
Total Male Population of Richardson is 57,576.
What is the Total Female Population of Richardson?
Total Female Population of Richardson is 60,487.
What is the Ratio of Males per 100 Females in Richardson?
There are 95.19 Males per 100 Females in Richardson.
What is the Ratio of Females per 100 Males in Richardson?
There are 105.06 Females per 100 Males in Richardson.
What is the Median Population Age in Richardson?
Median Population Age in Richardson is 34.5 Years.
What is the Average Family Size in Richardson
Average Family Size in Richardson is 3.1 People.
What is the Average Household Size in Richardson
Average Household Size in Richardson is 2.5 People.
How Large is the Labor Force in Richardson?
There are 67,864 People in the Labor Forcein in Richardson.
What is the Percentage of People in the Labor Force in Richardson?
70.5% of People are in the Labor Force in Richardson.
What is the Unemployment Rate in Richardson?
Unemployment Rate in Richardson is 5.0%.