East Honolulu, HI Map & Demographics
East Honolulu Map
East Honolulu Overview
$68,070
PER CAPITA INCOME
$166,585
AVG FAMILY INCOME
$151,224
AVG HOUSEHOLD INCOME
34.1%
WAGE / INCOME GAP [ % ]
65.9¢/ $1
WAGE / INCOME GAP [ $ ]
$9,548
FAMILY INCOME DEFICIT
0.43
INEQUALITY / GINI INDEX
49,491
TOTAL POPULATION
24,566
MALE POPULATION
24,925
FEMALE POPULATION
98.56
MALES / 100 FEMALES
101.46
FEMALES / 100 MALES
48.8
MEDIAN AGE
3.1
AVG FAMILY SIZE
2.8
AVG HOUSEHOLD SIZE
25,369
LABOR FORCE [ PEOPLE ]
61.0%
PERCENT IN LABOR FORCE
3.8%
UNEMPLOYMENT RATE
Income in East Honolulu
Income Overview in East Honolulu
Per Capita Income in East Honolulu is $68,070, while median incomes of families and households are $166,585 and $151,224 respectively.
| Characteristic | Number | Measure |
| Per Capita Income | 49,491 | $68,070 |
| Median Family Income | 14,001 | $166,585 |
| Mean Family Income | 14,001 | $205,977 |
| Median Household Income | 17,613 | $151,224 |
| Mean Household Income | 17,613 | $187,656 |
| Income Deficit | 14,001 | $9,548 |
| Wage / Income Gap (%) | 49,491 | 34.09% |
| Wage / Income Gap ($) | 49,491 | 65.91¢ per $1 |
| Gini / Inequality Index | 49,491 | 0.43 |
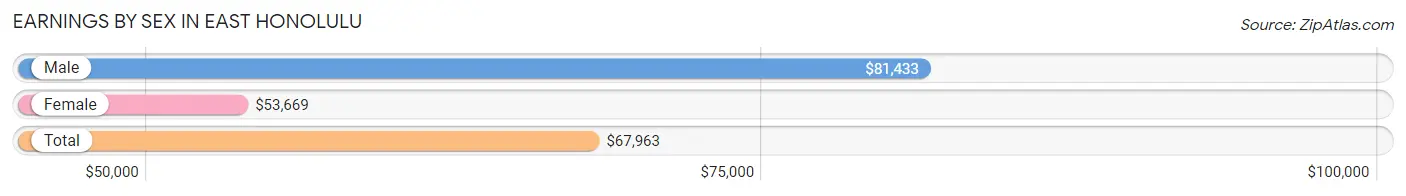
Earnings by Sex in East Honolulu
Average Earnings in East Honolulu are $67,963, $81,433 for men and $53,669 for women, a difference of 34.1%.
| Sex | Number | Average Earnings |
| Male | 14,223 (53.8%) | $81,433 |
| Female | 12,232 (46.2%) | $53,669 |
| Total | 26,455 (100.0%) | $67,963 |
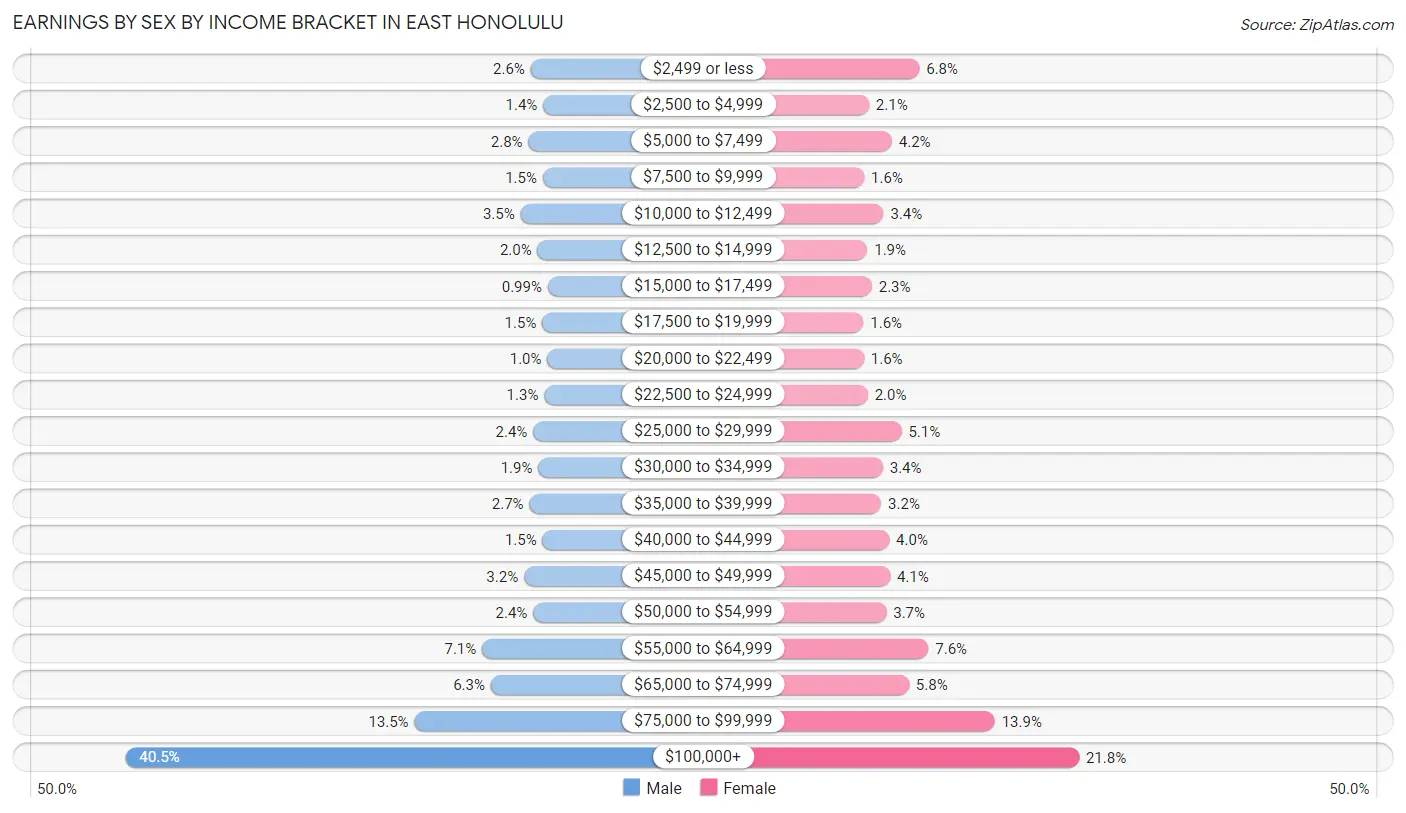
Earnings by Sex by Income Bracket in East Honolulu
The most common earnings brackets in East Honolulu are $100,000+ for men (5,755 | 40.5%) and $100,000+ for women (2,660 | 21.7%).
| Income | Male | Female |
| $2,499 or less | 368 (2.6%) | 831 (6.8%) |
| $2,500 to $4,999 | 202 (1.4%) | 253 (2.1%) |
| $5,000 to $7,499 | 398 (2.8%) | 516 (4.2%) |
| $7,500 to $9,999 | 207 (1.5%) | 198 (1.6%) |
| $10,000 to $12,499 | 503 (3.5%) | 421 (3.4%) |
| $12,500 to $14,999 | 277 (1.9%) | 235 (1.9%) |
| $15,000 to $17,499 | 141 (1.0%) | 286 (2.3%) |
| $17,500 to $19,999 | 215 (1.5%) | 189 (1.5%) |
| $20,000 to $22,499 | 146 (1.0%) | 196 (1.6%) |
| $22,500 to $24,999 | 188 (1.3%) | 240 (2.0%) |
| $25,000 to $29,999 | 335 (2.4%) | 626 (5.1%) |
| $30,000 to $34,999 | 267 (1.9%) | 412 (3.4%) |
| $35,000 to $39,999 | 385 (2.7%) | 394 (3.2%) |
| $40,000 to $44,999 | 210 (1.5%) | 486 (4.0%) |
| $45,000 to $49,999 | 458 (3.2%) | 495 (4.1%) |
| $50,000 to $54,999 | 335 (2.4%) | 453 (3.7%) |
| $55,000 to $64,999 | 1,015 (7.1%) | 934 (7.6%) |
| $65,000 to $74,999 | 901 (6.3%) | 712 (5.8%) |
| $75,000 to $99,999 | 1,917 (13.5%) | 1,695 (13.9%) |
| $100,000+ | 5,755 (40.5%) | 2,660 (21.7%) |
| Total | 14,223 (100.0%) | 12,232 (100.0%) |
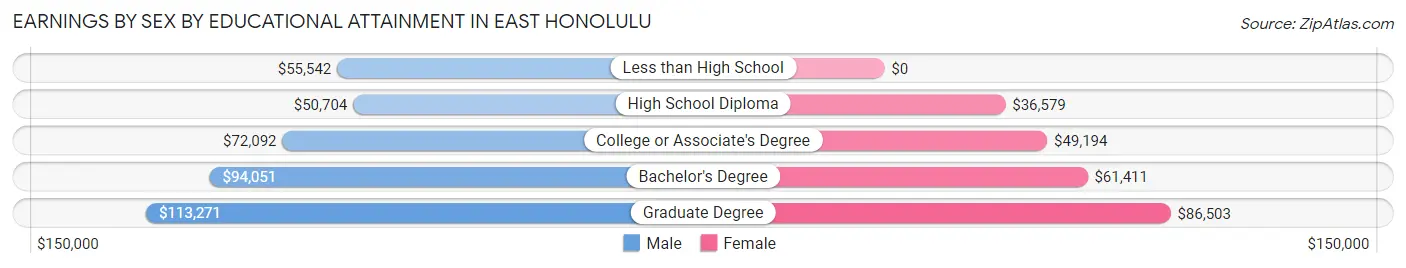
Earnings by Sex by Educational Attainment in East Honolulu
Average earnings in East Honolulu are $88,758 for men and $59,572 for women, a difference of 32.9%. Men with an educational attainment of graduate degree enjoy the highest average annual earnings of $113,271, while those with high school diploma education earn the least with $50,704. Women with an educational attainment of graduate degree earn the most with the average annual earnings of $86,503, while those with high school diploma education have the smallest earnings of $36,579.
| Educational Attainment | Male Income | Female Income |
| Less than High School | $55,542 | $0 |
| High School Diploma | $50,704 | $36,579 |
| College or Associate's Degree | $72,092 | $49,194 |
| Bachelor's Degree | $94,051 | $61,411 |
| Graduate Degree | $113,271 | $86,503 |
| Total | $88,758 | $59,572 |
Family Income in East Honolulu
Family Income Brackets in East Honolulu
According to the East Honolulu family income data, there are 4,984 families falling into the $200,000+ income range, which is the most common income bracket and makes up 35.6% of all families. Conversely, the less than $10,000 income bracket is the least frequent group with only 98 families (0.7%) belonging to this category.
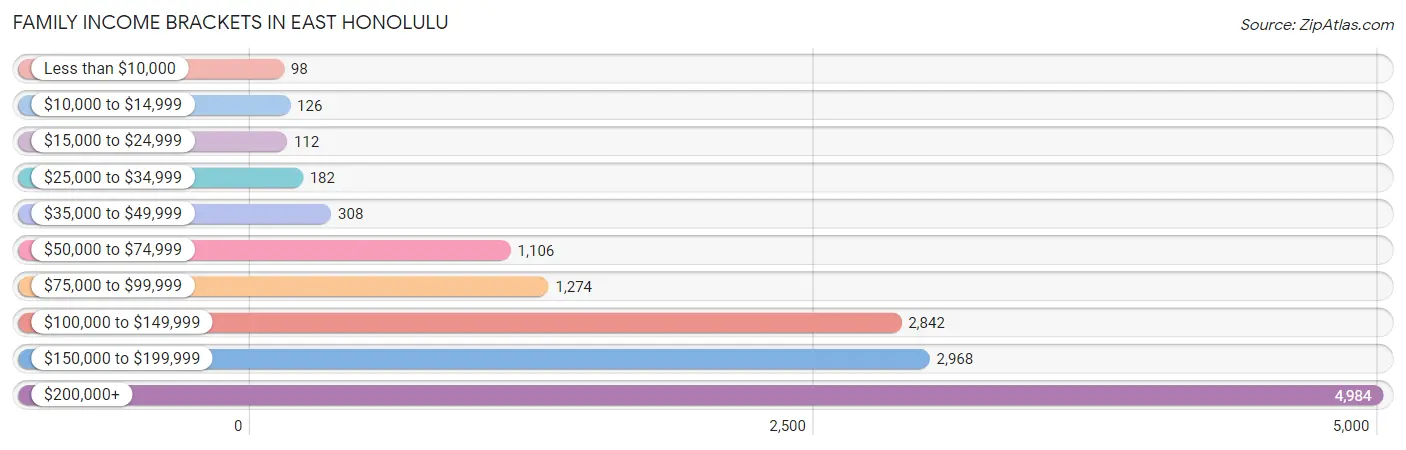
| Income Bracket | # Families | % Families |
| Less than $10,000 | 98 | 0.7% |
| $10,000 to $14,999 | 126 | 0.9% |
| $15,000 to $24,999 | 112 | 0.8% |
| $25,000 to $34,999 | 182 | 1.3% |
| $35,000 to $49,999 | 308 | 2.2% |
| $50,000 to $74,999 | 1,106 | 7.9% |
| $75,000 to $99,999 | 1,274 | 9.1% |
| $100,000 to $149,999 | 2,842 | 20.3% |
| $150,000 to $199,999 | 2,968 | 21.2% |
| $200,000+ | 4,984 | 35.6% |
Family Income by Famaliy Size in East Honolulu
7+ person families (248 | 1.8%) account for the highest median family income in East Honolulu with $244,052 per family, while 2-person families (6,940 | 49.6%) have the highest median income of $72,790 per family member.
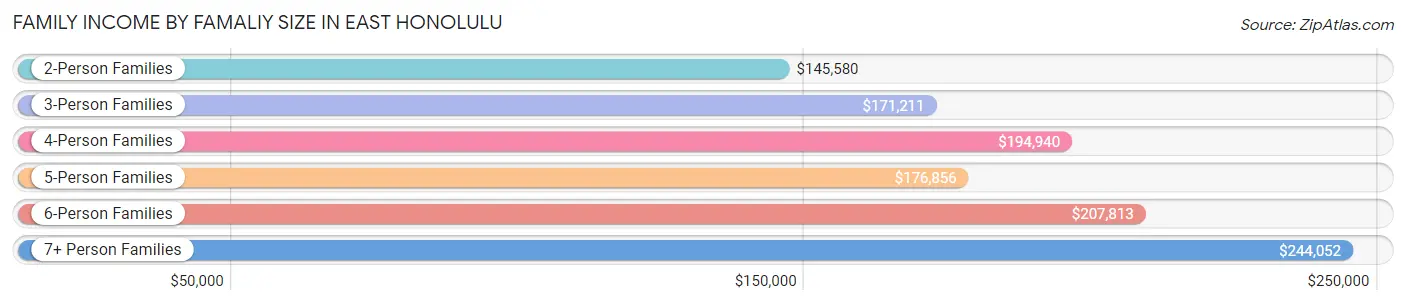
| Income Bracket | # Families | Median Income |
| 2-Person Families | 6,940 (49.6%) | $145,580 |
| 3-Person Families | 2,698 (19.3%) | $171,211 |
| 4-Person Families | 3,111 (22.2%) | $194,940 |
| 5-Person Families | 721 (5.1%) | $176,856 |
| 6-Person Families | 283 (2.0%) | $207,813 |
| 7+ Person Families | 248 (1.8%) | $244,052 |
| Total | 14,001 (100.0%) | $166,585 |
Family Income by Number of Earners in East Honolulu
The median family income in East Honolulu is $166,585, with families comprising 3+ earners (1,867) having the highest median family income of $222,750, while families with 1 earner (3,676) have the lowest median family income of $114,011, accounting for 13.3% and 26.3% of families, respectively.
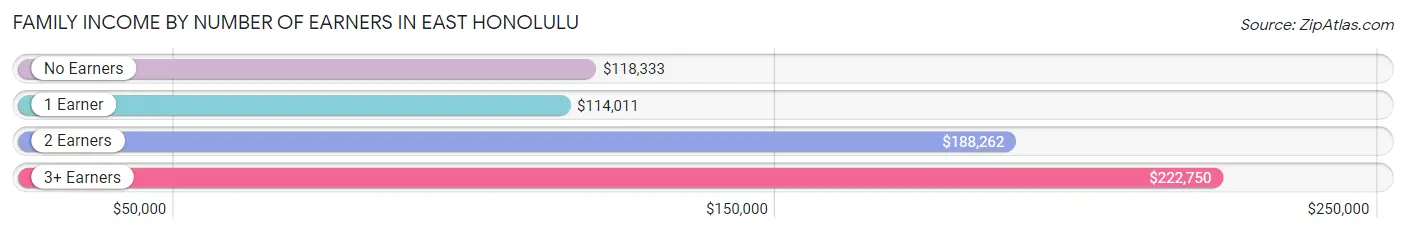
| Number of Earners | # Families | Median Income |
| No Earners | 2,476 (17.7%) | $118,333 |
| 1 Earner | 3,676 (26.3%) | $114,011 |
| 2 Earners | 5,982 (42.7%) | $188,262 |
| 3+ Earners | 1,867 (13.3%) | $222,750 |
| Total | 14,001 (100.0%) | $166,585 |
Household Income in East Honolulu
Household Income Brackets in East Honolulu
With 5,601 households falling in the category, the $200,000+ income range is the most frequent in East Honolulu, accounting for 31.8% of all households. In contrast, only 211 households (1.2%) fall into the $10,000 to $14,999 income bracket, making it the least populous group.
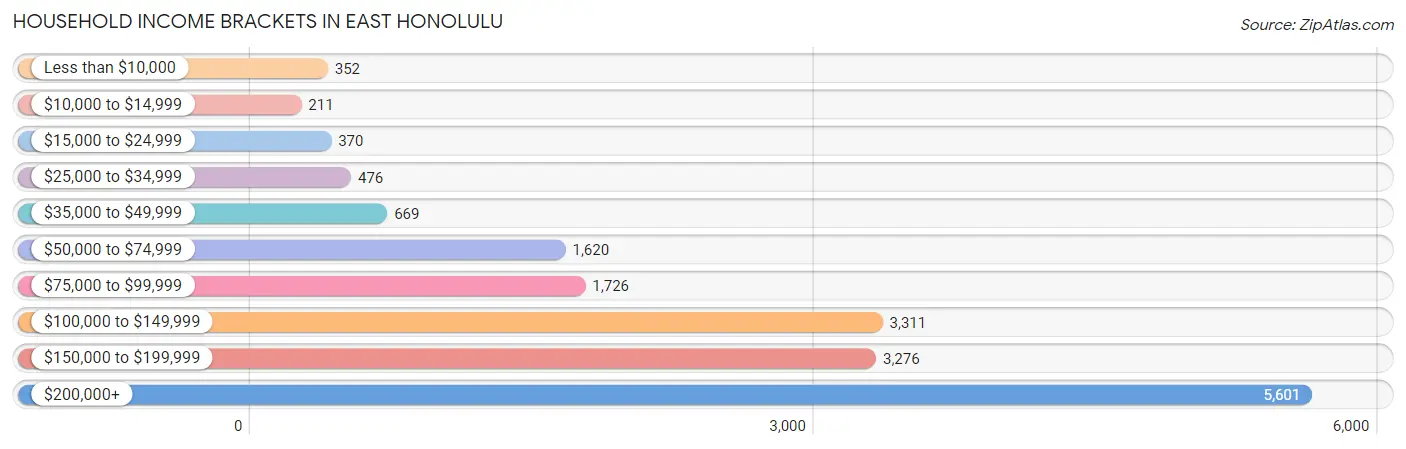
| Income Bracket | # Households | % Households |
| Less than $10,000 | 352 | 2.0% |
| $10,000 to $14,999 | 211 | 1.2% |
| $15,000 to $24,999 | 370 | 2.1% |
| $25,000 to $34,999 | 476 | 2.7% |
| $35,000 to $49,999 | 669 | 3.8% |
| $50,000 to $74,999 | 1,620 | 9.2% |
| $75,000 to $99,999 | 1,726 | 9.8% |
| $100,000 to $149,999 | 3,311 | 18.8% |
| $150,000 to $199,999 | 3,276 | 18.6% |
| $200,000+ | 5,601 | 31.8% |
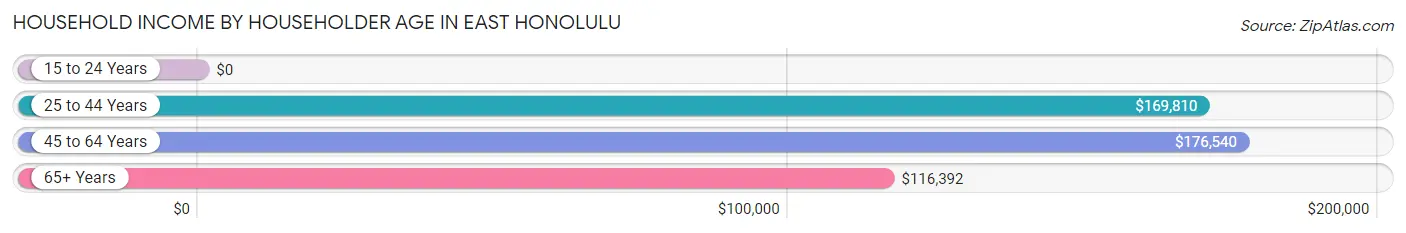
Household Income by Householder Age in East Honolulu
The median household income in East Honolulu is $151,224, with the highest median household income of $176,540 found in the 45 to 64 years age bracket for the primary householder. A total of 6,540 households (37.1%) fall into this category. Meanwhile, the 15 to 24 years age bracket for the primary householder has the lowest median household income of $0, with 55 households (0.3%) in this group.
| Income Bracket | # Households | Median Income |
| 15 to 24 Years | 55 (0.3%) | $0 |
| 25 to 44 Years | 3,237 (18.4%) | $169,810 |
| 45 to 64 Years | 6,540 (37.1%) | $176,540 |
| 65+ Years | 7,781 (44.2%) | $116,392 |
| Total | 17,613 (100.0%) | $151,224 |
Poverty in East Honolulu
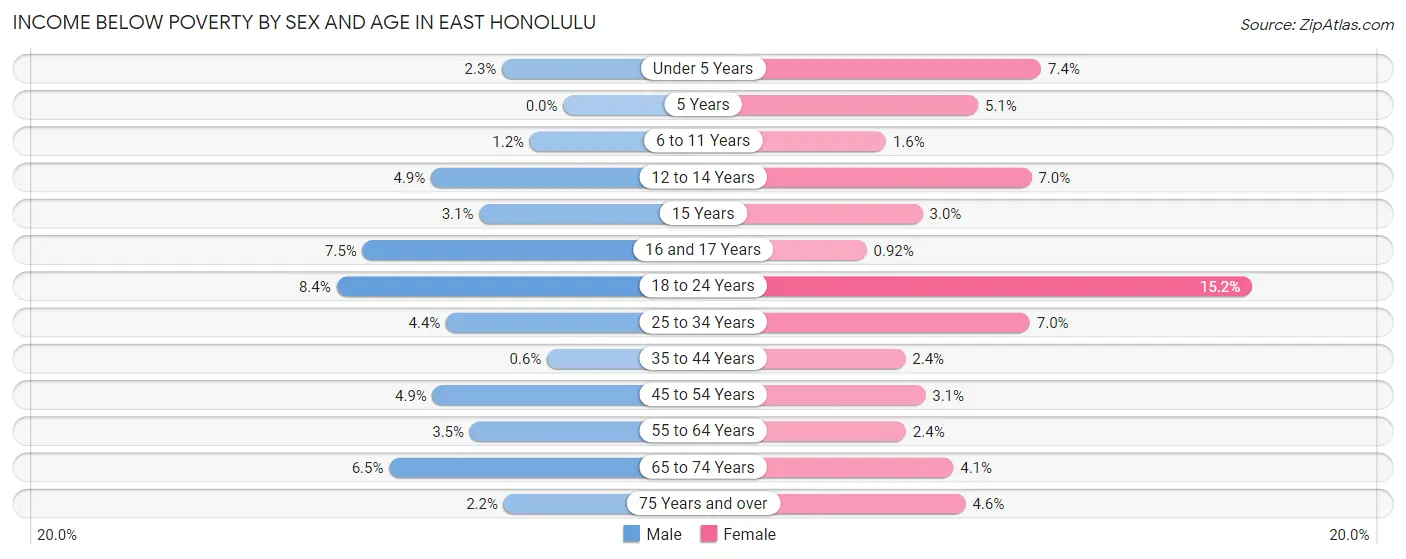
Income Below Poverty by Sex and Age in East Honolulu
With 3.8% poverty level for males and 4.5% for females among the residents of East Honolulu, 18 to 24 year old males and 18 to 24 year old females are the most vulnerable to poverty, with 123 males (8.4%) and 229 females (15.2%) in their respective age groups living below the poverty level.
| Age Bracket | Male | Female |
| Under 5 Years | 28 (2.3%) | 69 (7.4%) |
| 5 Years | 0 (0.0%) | 9 (5.1%) |
| 6 to 11 Years | 18 (1.2%) | 23 (1.6%) |
| 12 to 14 Years | 45 (4.9%) | 64 (7.0%) |
| 15 Years | 10 (3.1%) | 9 (3.0%) |
| 16 and 17 Years | 54 (7.4%) | 5 (0.9%) |
| 18 to 24 Years | 123 (8.4%) | 229 (15.2%) |
| 25 to 34 Years | 104 (4.3%) | 149 (7.0%) |
| 35 to 44 Years | 17 (0.6%) | 69 (2.4%) |
| 45 to 54 Years | 154 (4.9%) | 103 (3.1%) |
| 55 to 64 Years | 121 (3.5%) | 83 (2.4%) |
| 65 to 74 Years | 190 (6.5%) | 135 (4.1%) |
| 75 Years and over | 73 (2.2%) | 179 (4.6%) |
| Total | 937 (3.8%) | 1,126 (4.5%) |
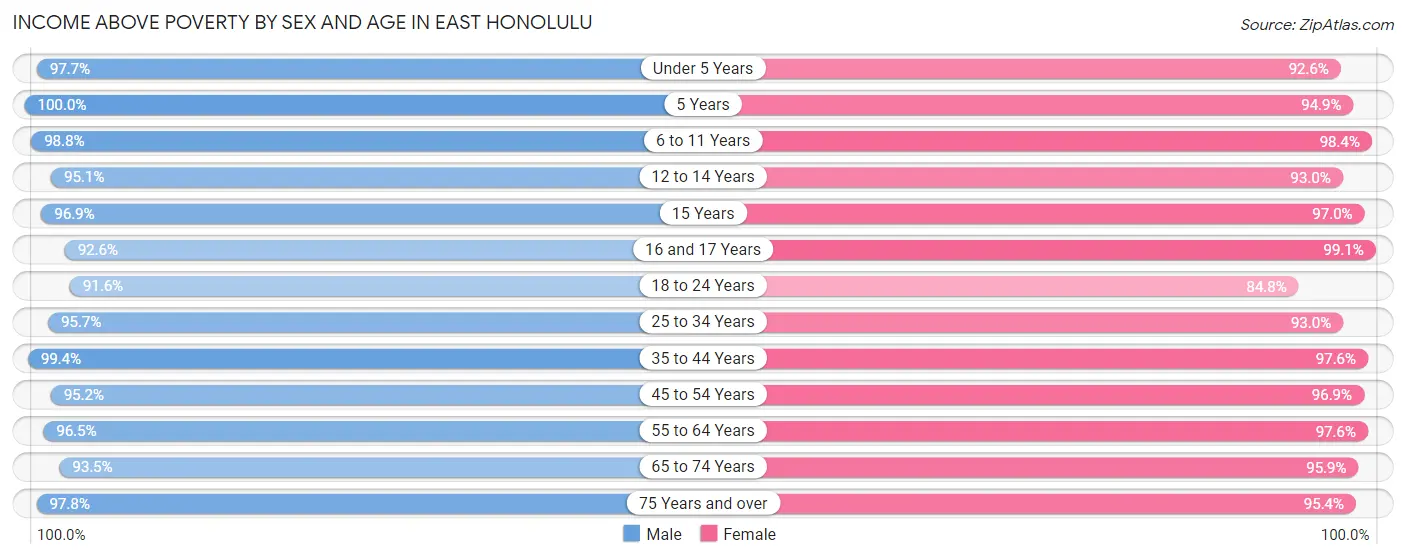
Income Above Poverty by Sex and Age in East Honolulu
According to the poverty statistics in East Honolulu, males aged 5 years and females aged 16 and 17 years are the age groups that are most secure financially, with 100.0% of males and 99.1% of females in these age groups living above the poverty line.
| Age Bracket | Male | Female |
| Under 5 Years | 1,208 (97.7%) | 863 (92.6%) |
| 5 Years | 246 (100.0%) | 169 (94.9%) |
| 6 to 11 Years | 1,432 (98.8%) | 1,378 (98.4%) |
| 12 to 14 Years | 871 (95.1%) | 845 (93.0%) |
| 15 Years | 310 (96.9%) | 291 (97.0%) |
| 16 and 17 Years | 671 (92.5%) | 541 (99.1%) |
| 18 to 24 Years | 1,337 (91.6%) | 1,275 (84.8%) |
| 25 to 34 Years | 2,286 (95.7%) | 1,985 (93.0%) |
| 35 to 44 Years | 2,837 (99.4%) | 2,857 (97.6%) |
| 45 to 54 Years | 3,021 (95.2%) | 3,221 (96.9%) |
| 55 to 64 Years | 3,363 (96.5%) | 3,399 (97.6%) |
| 65 to 74 Years | 2,750 (93.5%) | 3,123 (95.9%) |
| 75 Years and over | 3,225 (97.8%) | 3,725 (95.4%) |
| Total | 23,557 (96.2%) | 23,672 (95.5%) |
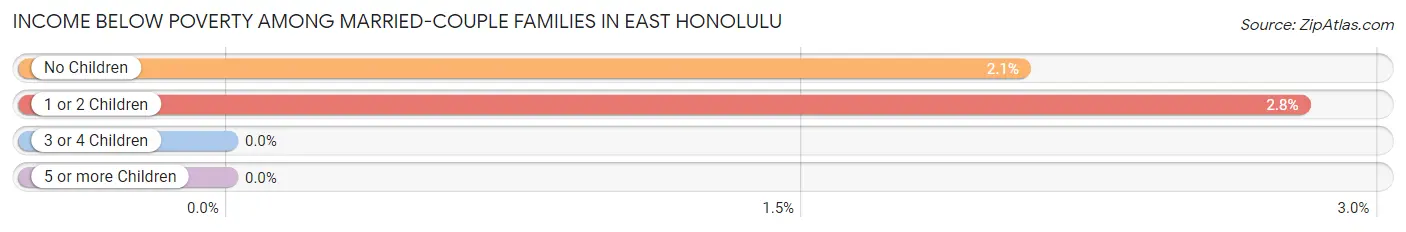
Income Below Poverty Among Married-Couple Families in East Honolulu
The poverty statistics for married-couple families in East Honolulu show that 2.2% or 254 of the total 11,487 families live below the poverty line. Families with 1 or 2 children have the highest poverty rate of 2.8%, comprising of 102 families. On the other hand, families with 3 or 4 children have the lowest poverty rate of 0.0%, which includes 0 families.
| Children | Above Poverty | Below Poverty |
| No Children | 7,201 (97.9%) | 152 (2.1%) |
| 1 or 2 Children | 3,543 (97.2%) | 102 (2.8%) |
| 3 or 4 Children | 487 (100.0%) | 0 (0.0%) |
| 5 or more Children | 2 (100.0%) | 0 (0.0%) |
| Total | 11,233 (97.8%) | 254 (2.2%) |
Income Below Poverty Among Single-Parent Households in East Honolulu
According to the poverty data in East Honolulu, 3.3% or 30 single-father households and 3.5% or 57 single-mother households are living below the poverty line. Among single-father households, those with 1 or 2 children have the highest poverty rate, with 26 households (8.7%) experiencing poverty. Likewise, among single-mother households, those with 1 or 2 children have the highest poverty rate, with 54 households (11.2%) falling below the poverty line.
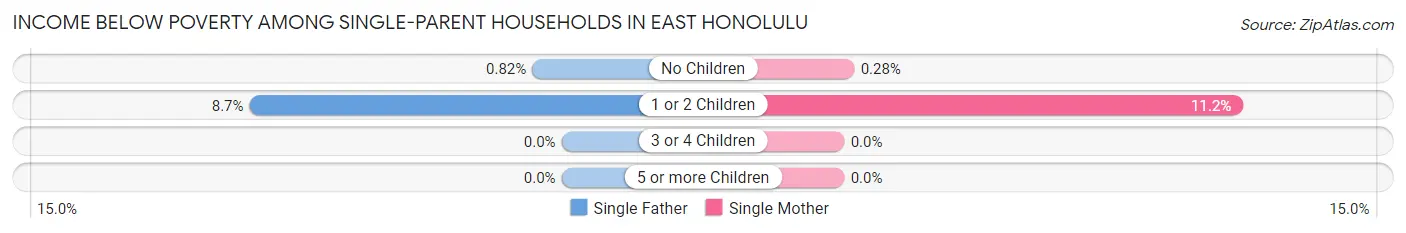
| Children | Single Father | Single Mother |
| No Children | 4 (0.8%) | 3 (0.3%) |
| 1 or 2 Children | 26 (8.7%) | 54 (11.2%) |
| 3 or 4 Children | 0 (0.0%) | 0 (0.0%) |
| 5 or more Children | 0 (0.0%) | 0 (0.0%) |
| Total | 30 (3.3%) | 57 (3.5%) |
Income Below Poverty Among Married-Couple vs Single-Parent Households in East Honolulu
The poverty data for East Honolulu shows that 254 of the married-couple family households (2.2%) and 87 of the single-parent households (3.5%) are living below the poverty level. Within the married-couple family households, those with 1 or 2 children have the highest poverty rate, with 102 households (2.8%) falling below the poverty line. Among the single-parent households, those with 1 or 2 children have the highest poverty rate, with 80 household (10.2%) living below poverty.
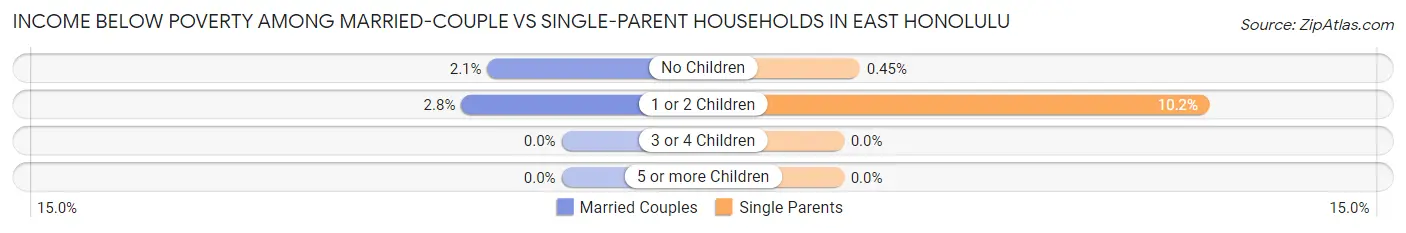
| Children | Married-Couple Families | Single-Parent Households |
| No Children | 152 (2.1%) | 7 (0.4%) |
| 1 or 2 Children | 102 (2.8%) | 80 (10.2%) |
| 3 or 4 Children | 0 (0.0%) | 0 (0.0%) |
| 5 or more Children | 0 (0.0%) | 0 (0.0%) |
| Total | 254 (2.2%) | 87 (3.5%) |
Race in East Honolulu
The most populous races in East Honolulu are Asian (23,684 | 47.9%), White / Caucasian (12,000 | 24.2%), and Two or more Races (11,863 | 24.0%).
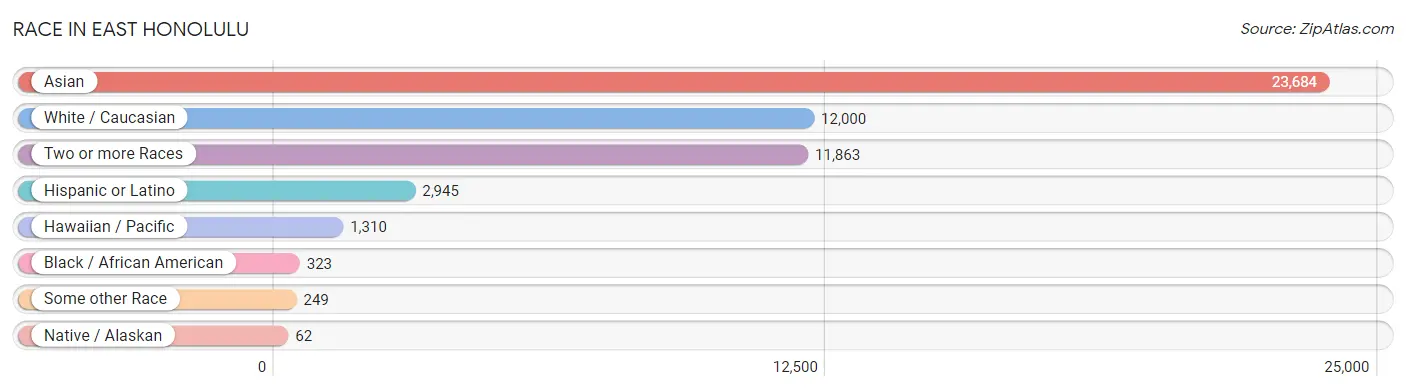
| Race | # Population | % Population |
| Asian | 23,684 | 47.9% |
| Black / African American | 323 | 0.6% |
| Hawaiian / Pacific | 1,310 | 2.6% |
| Hispanic or Latino | 2,945 | 5.9% |
| Native / Alaskan | 62 | 0.1% |
| White / Caucasian | 12,000 | 24.2% |
| Two or more Races | 11,863 | 24.0% |
| Some other Race | 249 | 0.5% |
| Total | 49,491 | 100.0% |
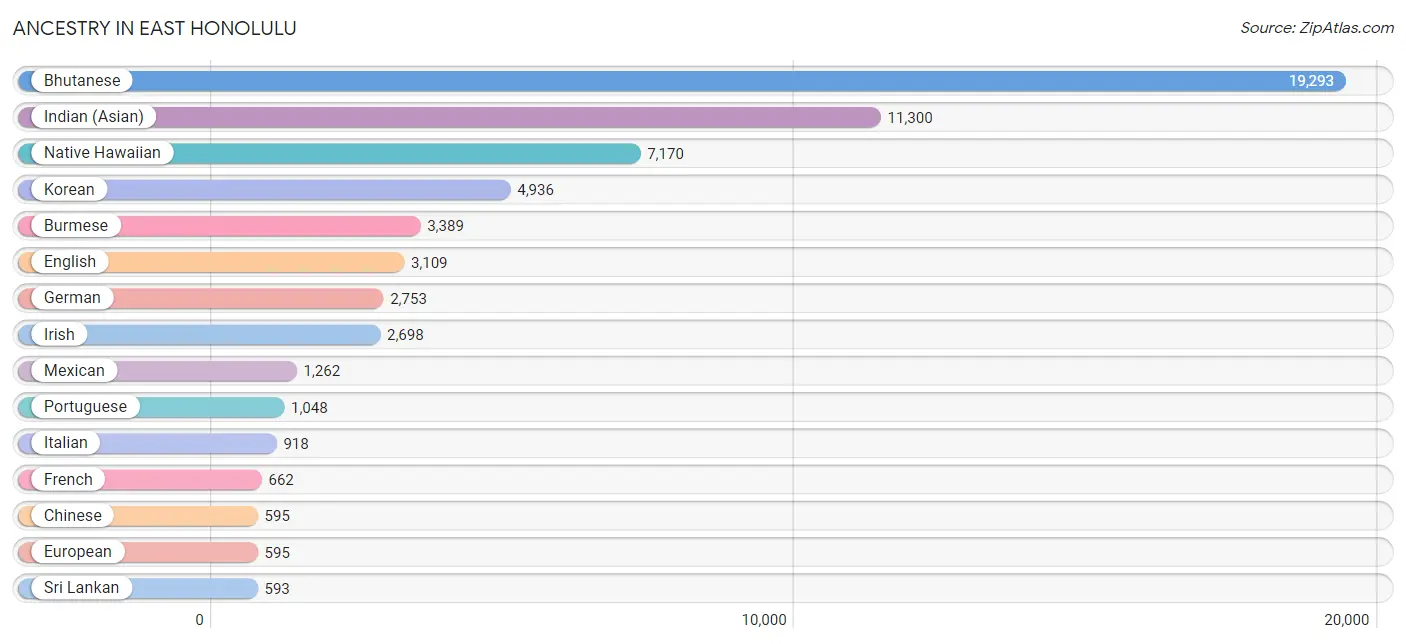
Ancestry in East Honolulu
The most populous ancestries reported in East Honolulu are Bhutanese (19,293 | 39.0%), Indian (Asian) (11,300 | 22.8%), Native Hawaiian (7,170 | 14.5%), Korean (4,936 | 10.0%), and Burmese (3,389 | 6.9%), together accounting for 93.1% of all East Honolulu residents.
| Ancestry | # Population | % Population |
| African | 13 | 0.0% |
| Albanian | 19 | 0.0% |
| American | 559 | 1.1% |
| Apache | 4 | 0.0% |
| Arab | 84 | 0.2% |
| Argentinean | 24 | 0.1% |
| Australian | 38 | 0.1% |
| Austrian | 83 | 0.2% |
| Belgian | 49 | 0.1% |
| Bhutanese | 19,293 | 39.0% |
| Brazilian | 76 | 0.2% |
| British | 196 | 0.4% |
| Bulgarian | 74 | 0.2% |
| Burmese | 3,389 | 6.9% |
| Cambodian | 28 | 0.1% |
| Canadian | 166 | 0.3% |
| Central American | 141 | 0.3% |
| Cherokee | 278 | 0.6% |
| Chilean | 19 | 0.0% |
| Chinese | 595 | 1.2% |
| Chippewa | 9 | 0.0% |
| Choctaw | 43 | 0.1% |
| Comanche | 15 | 0.0% |
| Costa Rican | 1 | 0.0% |
| Croatian | 28 | 0.1% |
| Cuban | 27 | 0.1% |
| Czech | 47 | 0.1% |
| Czechoslovakian | 18 | 0.0% |
| Danish | 198 | 0.4% |
| Dutch | 280 | 0.6% |
| Eastern European | 40 | 0.1% |
| Ecuadorian | 5 | 0.0% |
| English | 3,109 | 6.3% |
| Estonian | 70 | 0.1% |
| European | 595 | 1.2% |
| Fijian | 15 | 0.0% |
| Filipino | 254 | 0.5% |
| Finnish | 172 | 0.4% |
| French | 662 | 1.3% |
| French Canadian | 85 | 0.2% |
| German | 2,753 | 5.6% |
| Greek | 342 | 0.7% |
| Guamanian / Chamorro | 56 | 0.1% |
| Guatemalan | 71 | 0.1% |
| Honduran | 63 | 0.1% |
| Hungarian | 94 | 0.2% |
| Indian (Asian) | 11,300 | 22.8% |
| Iranian | 93 | 0.2% |
| Irish | 2,698 | 5.4% |
| Israeli | 79 | 0.2% |
| Italian | 918 | 1.8% |
| Jamaican | 9 | 0.0% |
| Japanese | 64 | 0.1% |
| Korean | 4,936 | 10.0% |
| Laotian | 15 | 0.0% |
| Lebanese | 44 | 0.1% |
| Lithuanian | 30 | 0.1% |
| Luxembourger | 28 | 0.1% |
| Malaysian | 6 | 0.0% |
| Mexican | 1,262 | 2.5% |
| Mexican American Indian | 48 | 0.1% |
| Native Hawaiian | 7,170 | 14.5% |
| Navajo | 7 | 0.0% |
| New Zealander | 9 | 0.0% |
| Northern European | 55 | 0.1% |
| Norwegian | 393 | 0.8% |
| Okinawan | 1 | 0.0% |
| Pakistani | 103 | 0.2% |
| Peruvian | 57 | 0.1% |
| Polish | 579 | 1.2% |
| Portuguese | 1,048 | 2.1% |
| Puerto Rican | 389 | 0.8% |
| Romanian | 79 | 0.2% |
| Russian | 129 | 0.3% |
| Samoan | 273 | 0.5% |
| Scandinavian | 95 | 0.2% |
| Scotch-Irish | 128 | 0.3% |
| Scottish | 564 | 1.1% |
| Serbian | 20 | 0.0% |
| Sioux | 22 | 0.0% |
| Slavic | 27 | 0.1% |
| Slovak | 40 | 0.1% |
| South American | 159 | 0.3% |
| South American Indian | 6 | 0.0% |
| Spaniard | 545 | 1.1% |
| Spanish | 229 | 0.5% |
| Sri Lankan | 593 | 1.2% |
| Subsaharan African | 126 | 0.3% |
| Swedish | 544 | 1.1% |
| Swiss | 125 | 0.3% |
| Syrian | 23 | 0.1% |
| Thai | 270 | 0.5% |
| Tongan | 26 | 0.1% |
| Turkish | 12 | 0.0% |
| Ukrainian | 91 | 0.2% |
| Venezuelan | 54 | 0.1% |
| Welsh | 92 | 0.2% |
| Zimbabwean | 113 | 0.2% | View All 98 Rows |
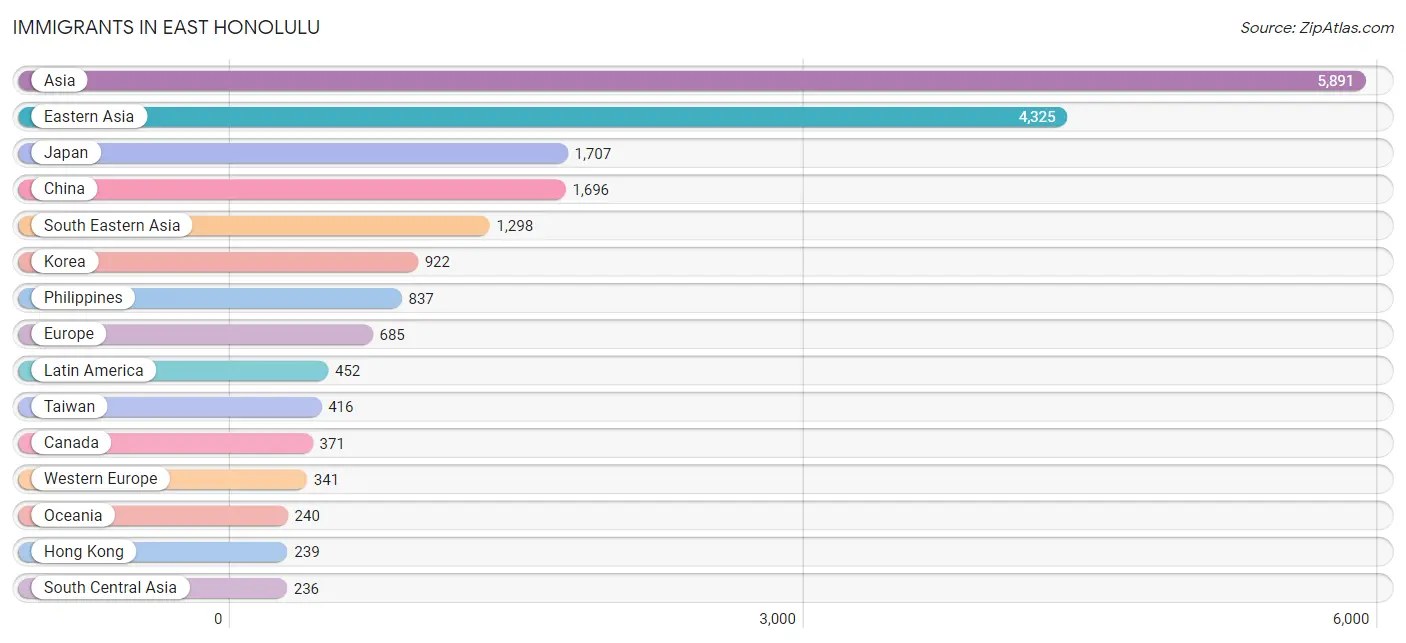
Immigrants in East Honolulu
The most numerous immigrant groups reported in East Honolulu came from Asia (5,891 | 11.9%), Eastern Asia (4,325 | 8.7%), Japan (1,707 | 3.5%), China (1,696 | 3.4%), and South Eastern Asia (1,298 | 2.6%), together accounting for 30.1% of all East Honolulu residents.
| Immigration Origin | # Population | % Population |
| Africa | 118 | 0.2% |
| Asia | 5,891 | 11.9% |
| Australia | 39 | 0.1% |
| Austria | 14 | 0.0% |
| Belgium | 6 | 0.0% |
| Brazil | 165 | 0.3% |
| Bulgaria | 35 | 0.1% |
| Cambodia | 21 | 0.0% |
| Canada | 371 | 0.7% |
| Caribbean | 20 | 0.0% |
| Central America | 205 | 0.4% |
| China | 1,696 | 3.4% |
| Congo | 23 | 0.1% |
| Costa Rica | 1 | 0.0% |
| Eastern Africa | 63 | 0.1% |
| Eastern Asia | 4,325 | 8.7% |
| Eastern Europe | 145 | 0.3% |
| Ecuador | 5 | 0.0% |
| Egypt | 16 | 0.0% |
| England | 55 | 0.1% |
| Europe | 685 | 1.4% |
| Fiji | 7 | 0.0% |
| France | 68 | 0.1% |
| Germany | 206 | 0.4% |
| Guatemala | 71 | 0.1% |
| Honduras | 19 | 0.0% |
| Hong Kong | 239 | 0.5% |
| Hungary | 16 | 0.0% |
| India | 193 | 0.4% |
| Indonesia | 61 | 0.1% |
| Iran | 32 | 0.1% |
| Ireland | 9 | 0.0% |
| Israel | 11 | 0.0% |
| Italy | 4 | 0.0% |
| Jamaica | 9 | 0.0% |
| Japan | 1,707 | 3.5% |
| Kazakhstan | 6 | 0.0% |
| Korea | 922 | 1.9% |
| Laos | 13 | 0.0% |
| Latin America | 452 | 0.9% |
| Malaysia | 36 | 0.1% |
| Mexico | 108 | 0.2% |
| Micronesia | 3 | 0.0% |
| Middle Africa | 23 | 0.1% |
| Netherlands | 19 | 0.0% |
| Nicaragua | 6 | 0.0% |
| Northern Africa | 16 | 0.0% |
| Northern Europe | 151 | 0.3% |
| Norway | 7 | 0.0% |
| Oceania | 240 | 0.5% |
| Pakistan | 5 | 0.0% |
| Peru | 16 | 0.0% |
| Philippines | 837 | 1.7% |
| Poland | 29 | 0.1% |
| Romania | 22 | 0.0% |
| Russia | 26 | 0.1% |
| Singapore | 1 | 0.0% |
| South Africa | 16 | 0.0% |
| South America | 227 | 0.5% |
| South Central Asia | 236 | 0.5% |
| South Eastern Asia | 1,298 | 2.6% |
| Southern Europe | 48 | 0.1% |
| Spain | 44 | 0.1% |
| Sweden | 33 | 0.1% |
| Switzerland | 28 | 0.1% |
| Taiwan | 416 | 0.8% |
| Thailand | 81 | 0.2% |
| Ukraine | 17 | 0.0% |
| Venezuela | 41 | 0.1% |
| Vietnam | 234 | 0.5% |
| Western Asia | 11 | 0.0% |
| Western Europe | 341 | 0.7% |
| Zimbabwe | 63 | 0.1% | View All 73 Rows |
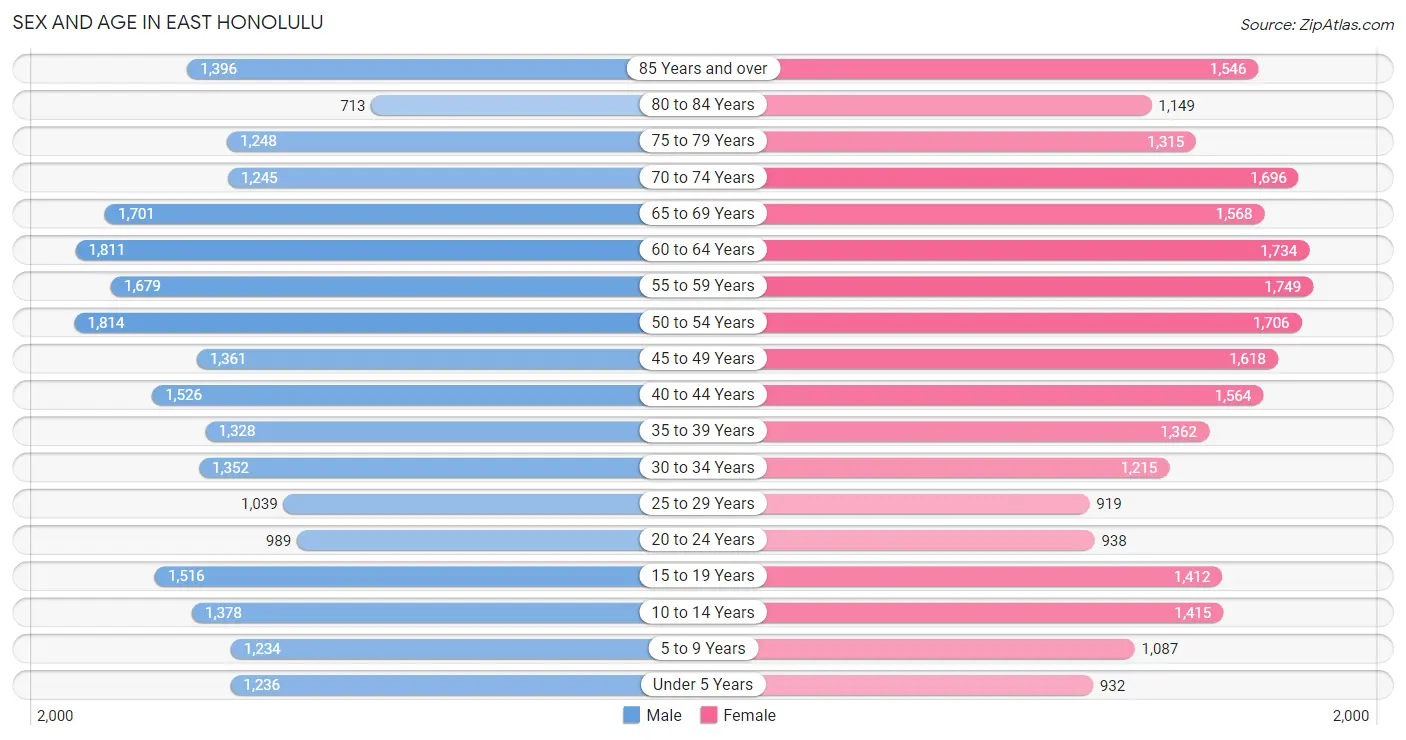
Sex and Age in East Honolulu
Sex and Age in East Honolulu
The most populous age groups in East Honolulu are 50 to 54 Years (1,814 | 7.4%) for men and 55 to 59 Years (1,749 | 7.0%) for women.
| Age Bracket | Male | Female |
| Under 5 Years | 1,236 (5.0%) | 932 (3.7%) |
| 5 to 9 Years | 1,234 (5.0%) | 1,087 (4.4%) |
| 10 to 14 Years | 1,378 (5.6%) | 1,415 (5.7%) |
| 15 to 19 Years | 1,516 (6.2%) | 1,412 (5.7%) |
| 20 to 24 Years | 989 (4.0%) | 938 (3.8%) |
| 25 to 29 Years | 1,039 (4.2%) | 919 (3.7%) |
| 30 to 34 Years | 1,352 (5.5%) | 1,215 (4.9%) |
| 35 to 39 Years | 1,328 (5.4%) | 1,362 (5.5%) |
| 40 to 44 Years | 1,526 (6.2%) | 1,564 (6.3%) |
| 45 to 49 Years | 1,361 (5.5%) | 1,618 (6.5%) |
| 50 to 54 Years | 1,814 (7.4%) | 1,706 (6.8%) |
| 55 to 59 Years | 1,679 (6.8%) | 1,749 (7.0%) |
| 60 to 64 Years | 1,811 (7.4%) | 1,734 (7.0%) |
| 65 to 69 Years | 1,701 (6.9%) | 1,568 (6.3%) |
| 70 to 74 Years | 1,245 (5.1%) | 1,696 (6.8%) |
| 75 to 79 Years | 1,248 (5.1%) | 1,315 (5.3%) |
| 80 to 84 Years | 713 (2.9%) | 1,149 (4.6%) |
| 85 Years and over | 1,396 (5.7%) | 1,546 (6.2%) |
| Total | 24,566 (100.0%) | 24,925 (100.0%) |
Families and Households in East Honolulu
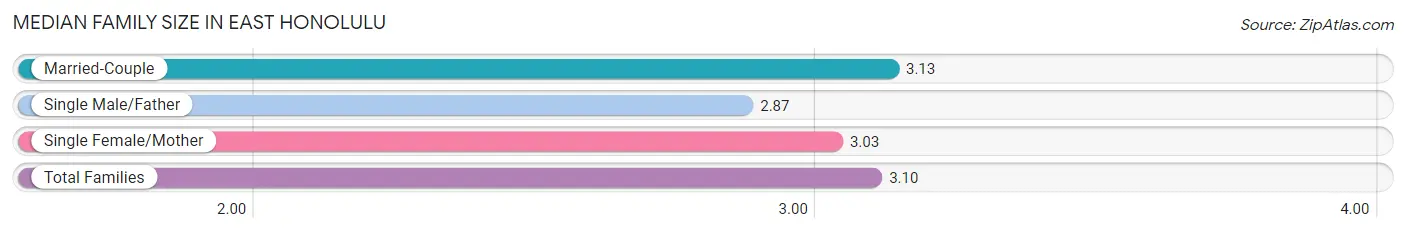
Median Family Size in East Honolulu
The median family size in East Honolulu is 3.10 persons per family, with married-couple families (11,487 | 82.0%) accounting for the largest median family size of 3.13 persons per family. On the other hand, single male/father families (898 | 6.4%) represent the smallest median family size with 2.87 persons per family.
| Family Type | # Families | Family Size |
| Married-Couple | 11,487 (82.0%) | 3.13 |
| Single Male/Father | 898 (6.4%) | 2.87 |
| Single Female/Mother | 1,616 (11.5%) | 3.03 |
| Total Families | 14,001 (100.0%) | 3.10 |
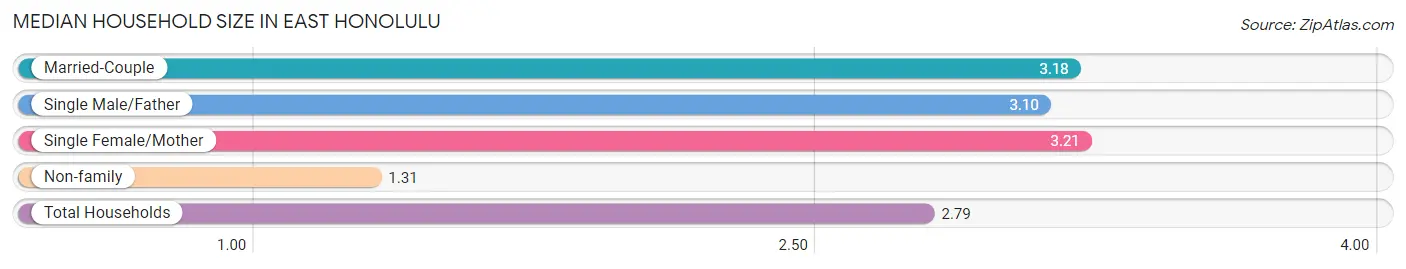
Median Household Size in East Honolulu
The median household size in East Honolulu is 2.79 persons per household, with single female/mother households (1,616 | 9.2%) accounting for the largest median household size of 3.21 persons per household. non-family households (3,612 | 20.5%) represent the smallest median household size with 1.31 persons per household.
| Household Type | # Households | Household Size |
| Married-Couple | 11,487 (65.2%) | 3.18 |
| Single Male/Father | 898 (5.1%) | 3.10 |
| Single Female/Mother | 1,616 (9.2%) | 3.21 |
| Non-family | 3,612 (20.5%) | 1.31 |
| Total Households | 17,613 (100.0%) | 2.79 |
Household Size by Marriage Status in East Honolulu
Out of a total of 17,613 households in East Honolulu, 14,001 (79.5%) are family households, while 3,612 (20.5%) are nonfamily households. The most numerous type of family households are 2-person households, comprising 6,553, and the most common type of nonfamily households are 1-person households, comprising 3,033.
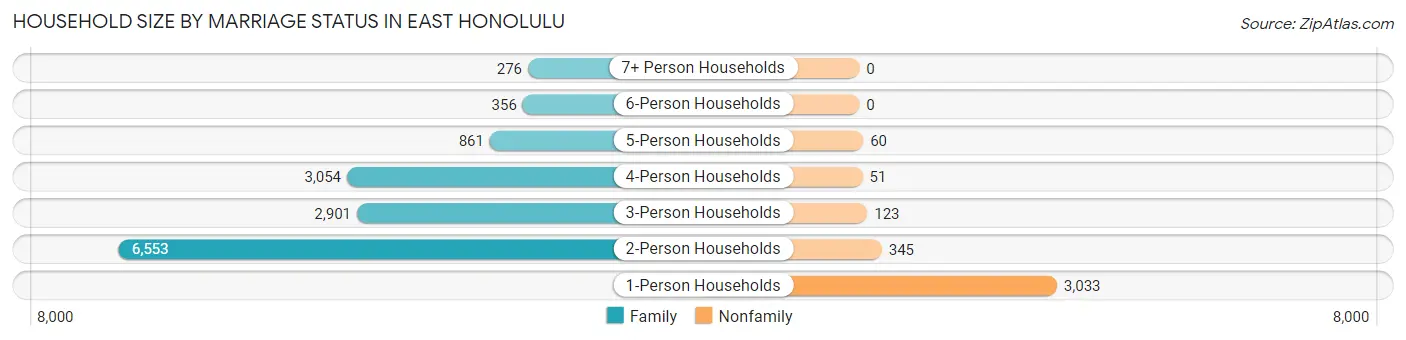
| Household Size | Family Households | Nonfamily Households |
| 1-Person Households | - | 3,033 (17.2%) |
| 2-Person Households | 6,553 (37.2%) | 345 (2.0%) |
| 3-Person Households | 2,901 (16.5%) | 123 (0.7%) |
| 4-Person Households | 3,054 (17.3%) | 51 (0.3%) |
| 5-Person Households | 861 (4.9%) | 60 (0.3%) |
| 6-Person Households | 356 (2.0%) | 0 (0.0%) |
| 7+ Person Households | 276 (1.6%) | 0 (0.0%) |
| Total | 14,001 (79.5%) | 3,612 (20.5%) |
Female Fertility in East Honolulu
Fertility by Age in East Honolulu
Average fertility rate in East Honolulu is 53.0 births per 1,000 women. Women in the age bracket of 20 to 34 years have the highest fertility rate with 83.0 births per 1,000 women. Women in the age bracket of 20 to 34 years acount for 50.5% of all women with births.
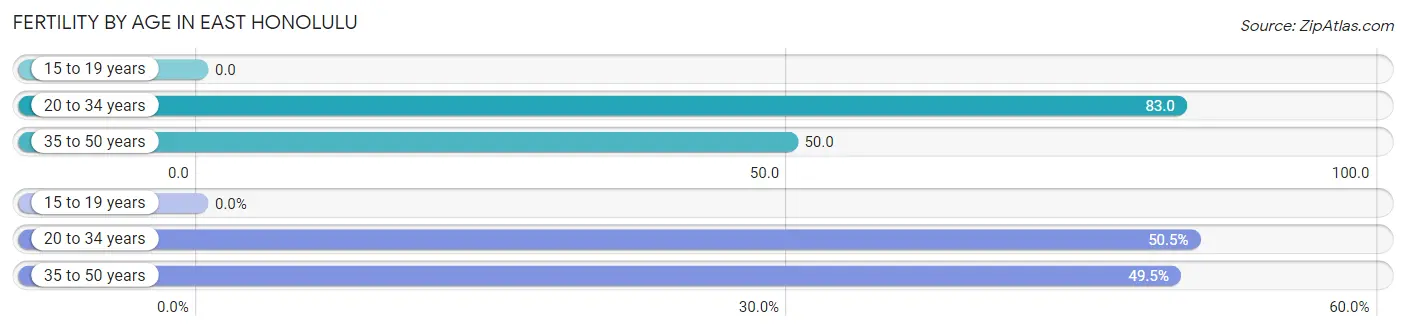
| Age Bracket | Women with Births | Births / 1,000 Women |
| 15 to 19 years | 0 (0.0%) | 0.0 |
| 20 to 34 years | 254 (50.5%) | 83.0 |
| 35 to 50 years | 249 (49.5%) | 50.0 |
| Total | 503 (100.0%) | 53.0 |
Fertility by Age by Marriage Status in East Honolulu
87.3% of women with births (503) in East Honolulu are married. The highest percentage of unmarried women with births falls into 20 to 34 years age bracket with 22.8% of them unmarried at the time of birth, while the lowest percentage of unmarried women with births belong to 35 to 50 years age bracket with 2.4% of them unmarried.
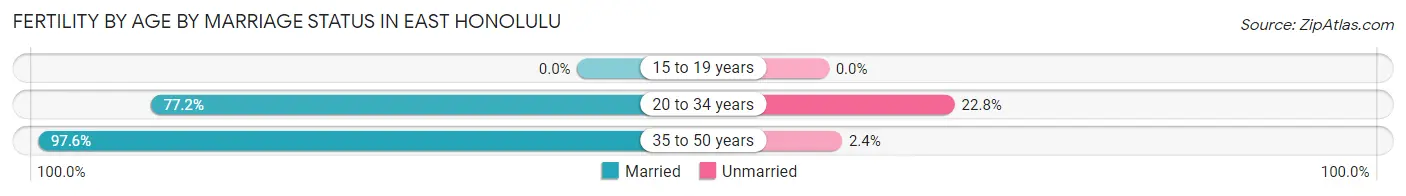
| Age Bracket | Married | Unmarried |
| 15 to 19 years | 0 (0.0%) | 0 (0.0%) |
| 20 to 34 years | 196 (77.2%) | 58 (22.8%) |
| 35 to 50 years | 243 (97.6%) | 6 (2.4%) |
| Total | 439 (87.3%) | 64 (12.7%) |
Fertility by Education in East Honolulu
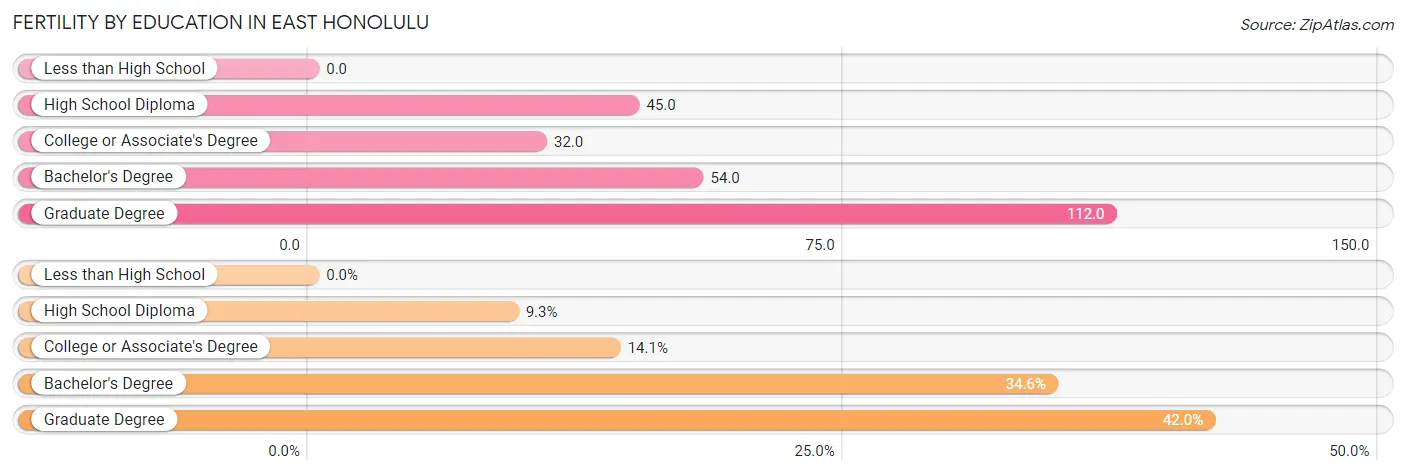
| Educational Attainment | Women with Births | Births / 1,000 Women |
| Less than High School | 0 (0.0%) | 0.0 |
| High School Diploma | 47 (9.3%) | 45.0 |
| College or Associate's Degree | 71 (14.1%) | 32.0 |
| Bachelor's Degree | 174 (34.6%) | 54.0 |
| Graduate Degree | 211 (41.9%) | 112.0 |
| Total | 503 (100.0%) | 53.0 |
Fertility by Education by Marriage Status in East Honolulu
12.7% of women with births in East Honolulu are unmarried. Women with the educational attainment of graduate degree are most likely to be married with 97.2% of them married at childbirth, while women with the educational attainment of high school diploma are least likely to be married with 29.8% of them unmarried at childbirth.
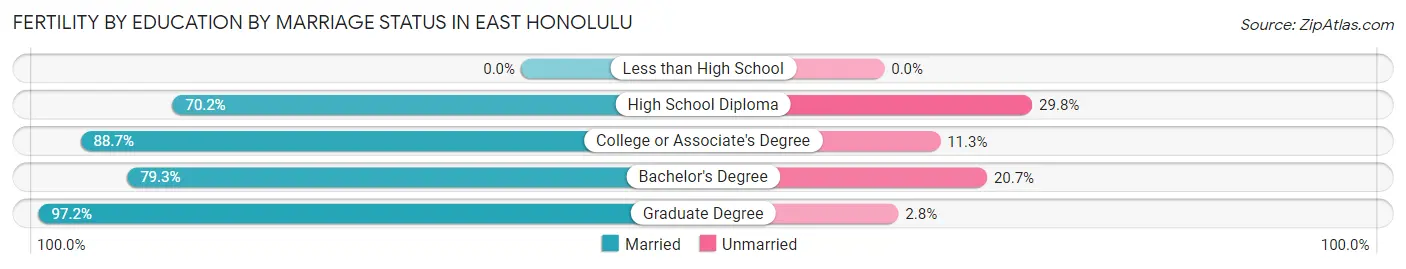
| Educational Attainment | Married | Unmarried |
| Less than High School | 0 (0.0%) | 0 (0.0%) |
| High School Diploma | 33 (70.2%) | 14 (29.8%) |
| College or Associate's Degree | 63 (88.7%) | 8 (11.3%) |
| Bachelor's Degree | 138 (79.3%) | 36 (20.7%) |
| Graduate Degree | 205 (97.2%) | 6 (2.8%) |
| Total | 439 (87.3%) | 64 (12.7%) |
Employment Characteristics in East Honolulu
Employment by Class of Employer in East Honolulu
Among the 23,818 employed individuals in East Honolulu, private company employees (13,560 | 56.9%), state government employees (2,270 | 9.5%), and not-for-profit organizations (2,033 | 8.5%) make up the most common classes of employment.
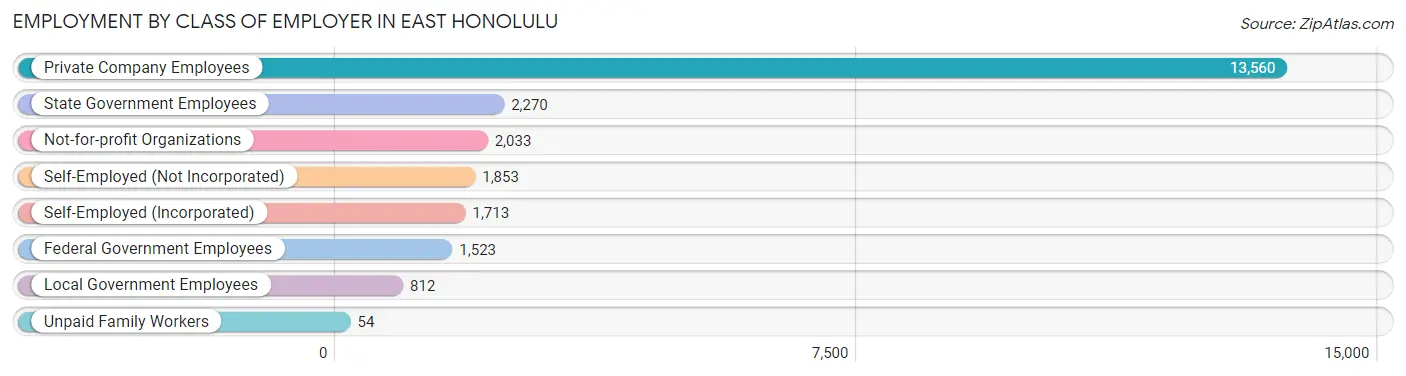
| Employer Class | # Employees | % Employees |
| Private Company Employees | 13,560 | 56.9% |
| Self-Employed (Incorporated) | 1,713 | 7.2% |
| Self-Employed (Not Incorporated) | 1,853 | 7.8% |
| Not-for-profit Organizations | 2,033 | 8.5% |
| Local Government Employees | 812 | 3.4% |
| State Government Employees | 2,270 | 9.5% |
| Federal Government Employees | 1,523 | 6.4% |
| Unpaid Family Workers | 54 | 0.2% |
| Total | 23,818 | 100.0% |
Employment Status by Age in East Honolulu
According to the labor force statistics for East Honolulu, out of the total population over 16 years of age (41,589), 61.0% or 25,369 individuals are in the labor force, with 3.8% or 964 of them unemployed. The age group with the highest labor force participation rate is 45 to 54 years, with 88.6% or 5,758 individuals in the labor force. Within the labor force, the 16 to 19 years age range has the highest percentage of unemployed individuals, with 15.8% or 140 of them being unemployed.
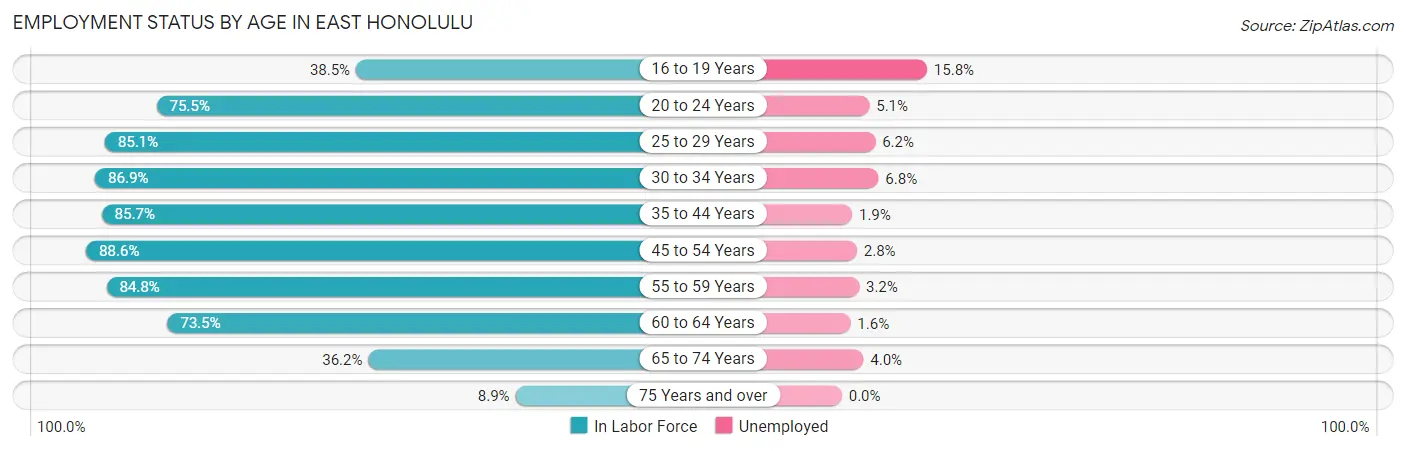
| Age Bracket | In Labor Force | Unemployed |
| 16 to 19 Years | 889 (38.5%) | 140 (15.8%) |
| 20 to 24 Years | 1,455 (75.5%) | 74 (5.1%) |
| 25 to 29 Years | 1,666 (85.1%) | 103 (6.2%) |
| 30 to 34 Years | 2,231 (86.9%) | 152 (6.8%) |
| 35 to 44 Years | 4,953 (85.7%) | 94 (1.9%) |
| 45 to 54 Years | 5,758 (88.6%) | 161 (2.8%) |
| 55 to 59 Years | 2,907 (84.8%) | 93 (3.2%) |
| 60 to 64 Years | 2,606 (73.5%) | 42 (1.6%) |
| 65 to 74 Years | 2,248 (36.2%) | 90 (4.0%) |
| 75 Years and over | 656 (8.9%) | 0 (0.0%) |
| Total | 25,369 (61.0%) | 964 (3.8%) |
Employment Status by Educational Attainment in East Honolulu
According to labor force statistics for East Honolulu, 84.6% of individuals (20,115) out of the total population between 25 and 64 years of age (23,777) are in the labor force, with 3.2% or 644 of them being unemployed. The group with the highest labor force participation rate are those with the educational attainment of bachelor's degree or higher, with 86.6% or 13,016 individuals in the labor force. Within the labor force, individuals with high school diploma education have the highest percentage of unemployment, with 6.8% or 161 of them being unemployed.
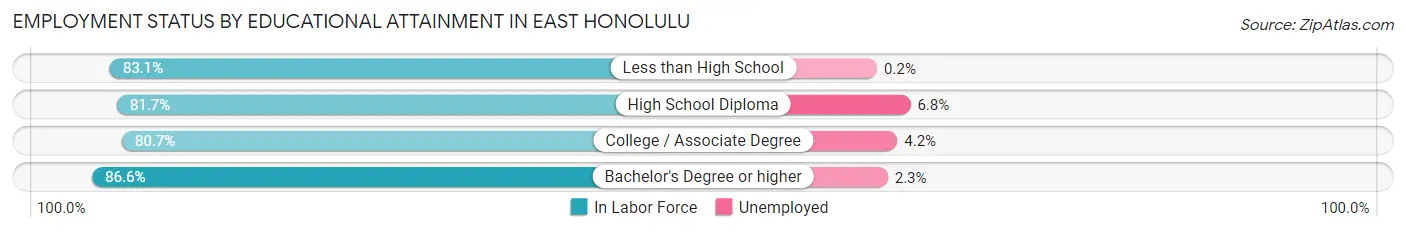
| Educational Attainment | In Labor Force | Unemployed |
| Less than High School | 448 (83.1%) | 1 (0.2%) |
| High School Diploma | 2,366 (81.7%) | 197 (6.8%) |
| College / Associate Degree | 4,287 (80.7%) | 223 (4.2%) |
| Bachelor's Degree or higher | 13,016 (86.6%) | 346 (2.3%) |
| Total | 20,115 (84.6%) | 761 (3.2%) |
Employment Occupations by Sex in East Honolulu
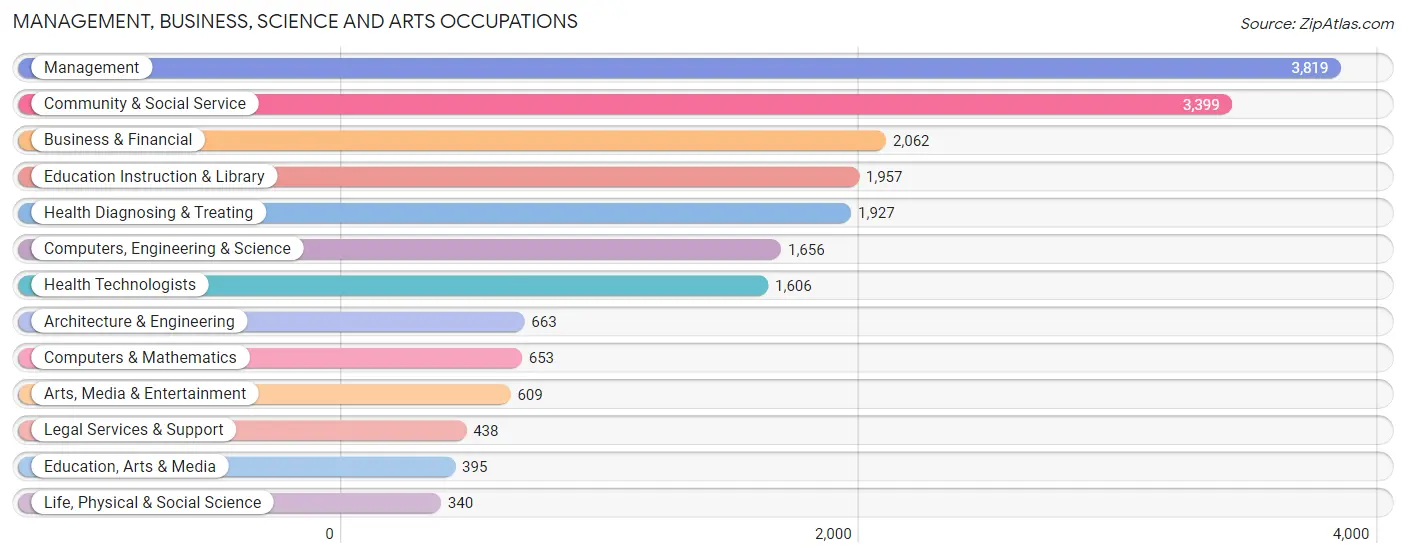
Management, Business, Science and Arts Occupations
The most common Management, Business, Science and Arts occupations in East Honolulu are Management (3,819 | 15.8%), Community & Social Service (3,399 | 14.1%), Business & Financial (2,062 | 8.5%), Education Instruction & Library (1,957 | 8.1%), and Health Diagnosing & Treating (1,927 | 8.0%).
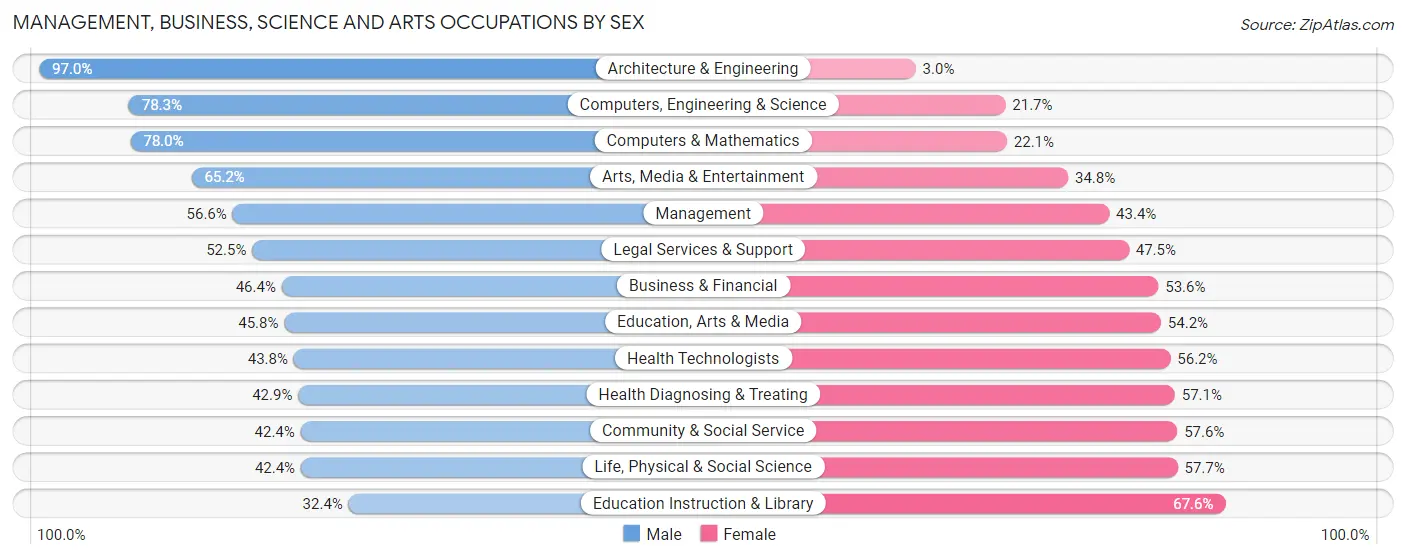
Management, Business, Science and Arts Occupations by Sex
Within the Management, Business, Science and Arts occupations in East Honolulu, the most male-oriented occupations are Architecture & Engineering (97.0%), Computers, Engineering & Science (78.3%), and Computers & Mathematics (77.9%), while the most female-oriented occupations are Education Instruction & Library (67.6%), Life, Physical & Social Science (57.7%), and Community & Social Service (57.6%).
| Occupation | Male | Female |
| Management | 2,162 (56.6%) | 1,657 (43.4%) |
| Business & Financial | 956 (46.4%) | 1,106 (53.6%) |
| Computers, Engineering & Science | 1,296 (78.3%) | 360 (21.7%) |
| Computers & Mathematics | 509 (77.9%) | 144 (22.1%) |
| Architecture & Engineering | 643 (97.0%) | 20 (3.0%) |
| Life, Physical & Social Science | 144 (42.3%) | 196 (57.7%) |
| Community & Social Service | 1,442 (42.4%) | 1,957 (57.6%) |
| Education, Arts & Media | 181 (45.8%) | 214 (54.2%) |
| Legal Services & Support | 230 (52.5%) | 208 (47.5%) |
| Education Instruction & Library | 634 (32.4%) | 1,323 (67.6%) |
| Arts, Media & Entertainment | 397 (65.2%) | 212 (34.8%) |
| Health Diagnosing & Treating | 827 (42.9%) | 1,100 (57.1%) |
| Health Technologists | 704 (43.8%) | 902 (56.2%) |
| Total (Category) | 6,683 (52.0%) | 6,180 (48.0%) |
| Total (Overall) | 13,111 (54.3%) | 11,054 (45.7%) |
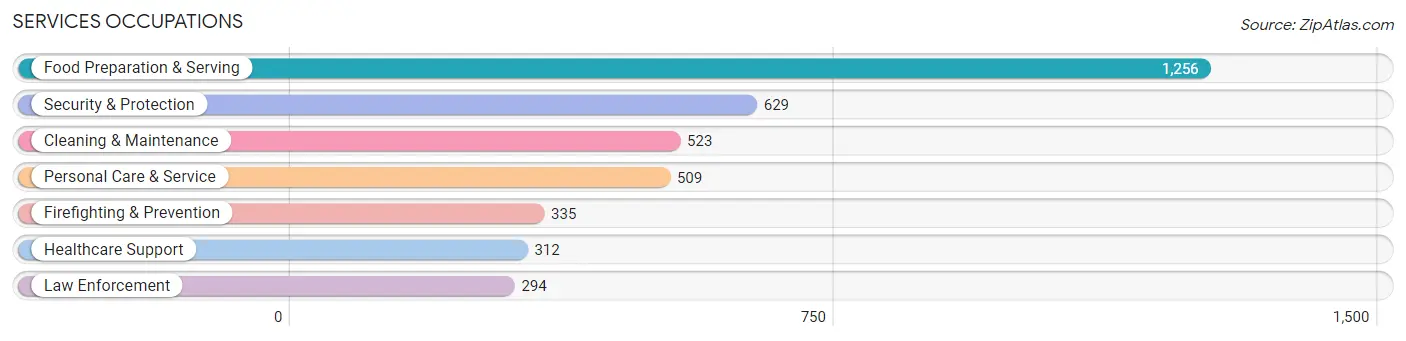
Services Occupations
The most common Services occupations in East Honolulu are Food Preparation & Serving (1,256 | 5.2%), Security & Protection (629 | 2.6%), Cleaning & Maintenance (523 | 2.2%), Personal Care & Service (509 | 2.1%), and Firefighting & Prevention (335 | 1.4%).
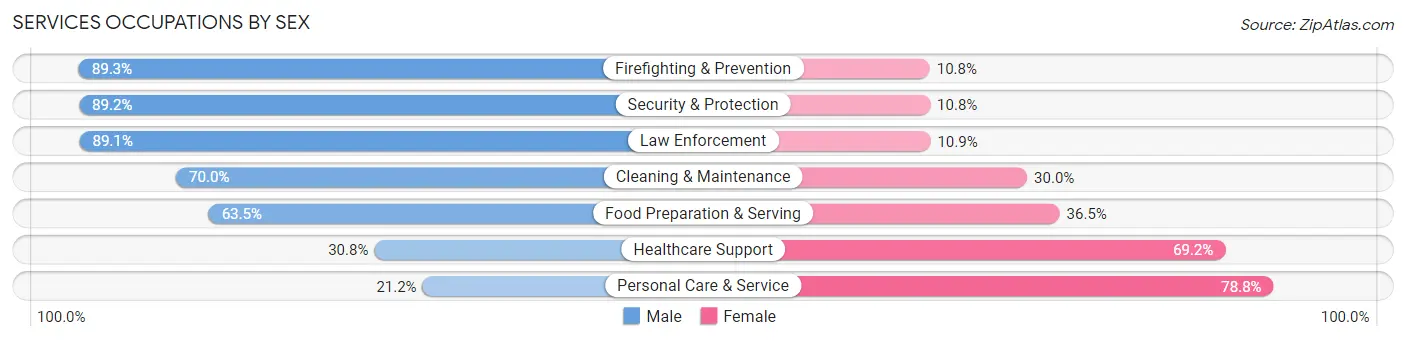
Services Occupations by Sex
Within the Services occupations in East Honolulu, the most male-oriented occupations are Firefighting & Prevention (89.2%), Security & Protection (89.2%), and Law Enforcement (89.1%), while the most female-oriented occupations are Personal Care & Service (78.8%), Healthcare Support (69.2%), and Food Preparation & Serving (36.5%).
| Occupation | Male | Female |
| Healthcare Support | 96 (30.8%) | 216 (69.2%) |
| Security & Protection | 561 (89.2%) | 68 (10.8%) |
| Firefighting & Prevention | 299 (89.2%) | 36 (10.7%) |
| Law Enforcement | 262 (89.1%) | 32 (10.9%) |
| Food Preparation & Serving | 798 (63.5%) | 458 (36.5%) |
| Cleaning & Maintenance | 366 (70.0%) | 157 (30.0%) |
| Personal Care & Service | 108 (21.2%) | 401 (78.8%) |
| Total (Category) | 1,929 (59.7%) | 1,300 (40.3%) |
| Total (Overall) | 13,111 (54.3%) | 11,054 (45.7%) |
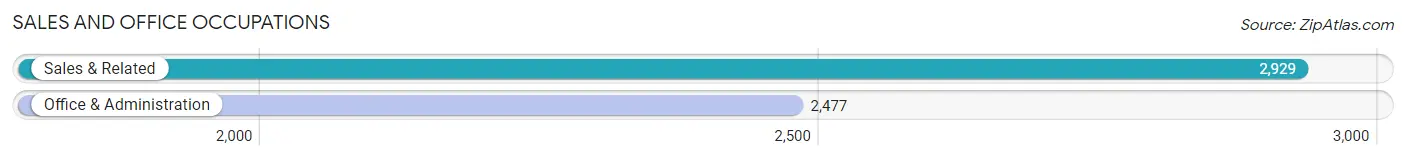
Sales and Office Occupations
The most common Sales and Office occupations in East Honolulu are Sales & Related (2,929 | 12.1%), and Office & Administration (2,477 | 10.2%).
Sales and Office Occupations by Sex
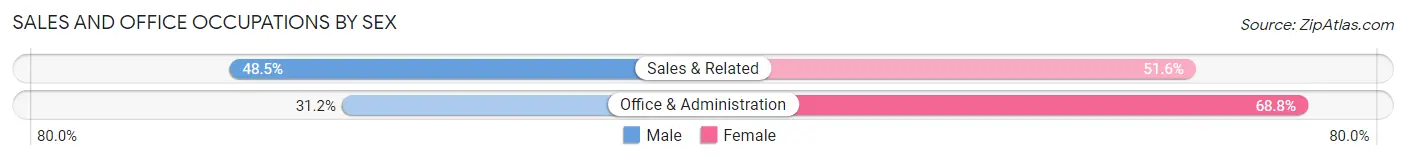
| Occupation | Male | Female |
| Sales & Related | 1,419 (48.4%) | 1,510 (51.5%) |
| Office & Administration | 773 (31.2%) | 1,704 (68.8%) |
| Total (Category) | 2,192 (40.6%) | 3,214 (59.5%) |
| Total (Overall) | 13,111 (54.3%) | 11,054 (45.7%) |
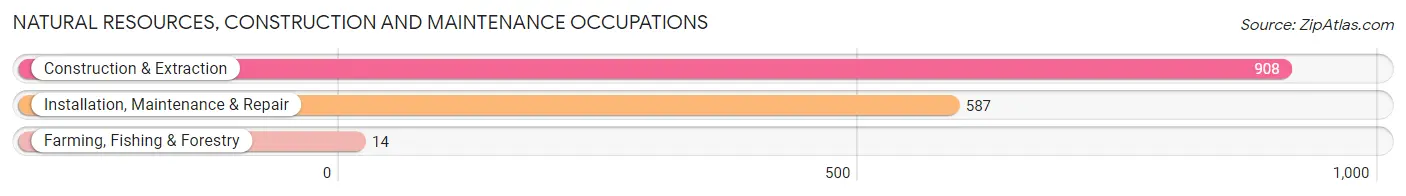
Natural Resources, Construction and Maintenance Occupations
The most common Natural Resources, Construction and Maintenance occupations in East Honolulu are Construction & Extraction (908 | 3.8%), Installation, Maintenance & Repair (587 | 2.4%), and Farming, Fishing & Forestry (14 | 0.1%).
Natural Resources, Construction and Maintenance Occupations by Sex
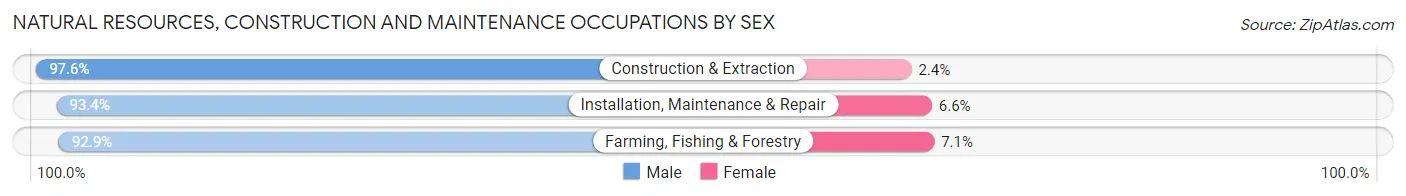
| Occupation | Male | Female |
| Farming, Fishing & Forestry | 13 (92.9%) | 1 (7.1%) |
| Construction & Extraction | 886 (97.6%) | 22 (2.4%) |
| Installation, Maintenance & Repair | 548 (93.4%) | 39 (6.6%) |
| Total (Category) | 1,447 (95.9%) | 62 (4.1%) |
| Total (Overall) | 13,111 (54.3%) | 11,054 (45.7%) |
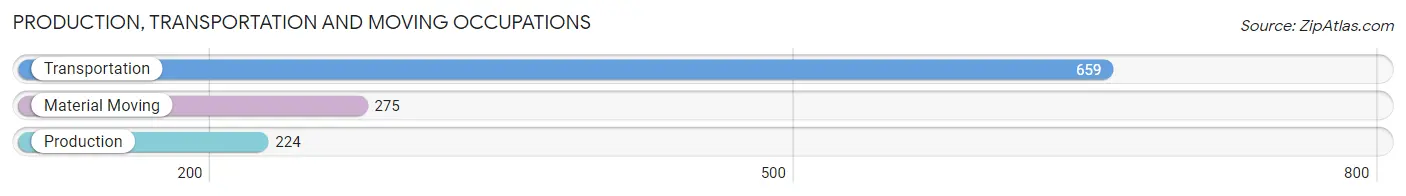
Production, Transportation and Moving Occupations
The most common Production, Transportation and Moving occupations in East Honolulu are Transportation (659 | 2.7%), Material Moving (275 | 1.1%), and Production (224 | 0.9%).
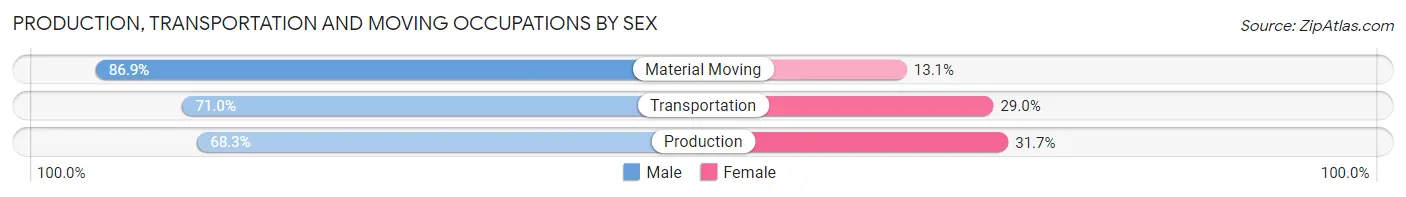
Production, Transportation and Moving Occupations by Sex
| Occupation | Male | Female |
| Production | 153 (68.3%) | 71 (31.7%) |
| Transportation | 468 (71.0%) | 191 (29.0%) |
| Material Moving | 239 (86.9%) | 36 (13.1%) |
| Total (Category) | 860 (74.3%) | 298 (25.7%) |
| Total (Overall) | 13,111 (54.3%) | 11,054 (45.7%) |
Employment Industries by Sex in East Honolulu
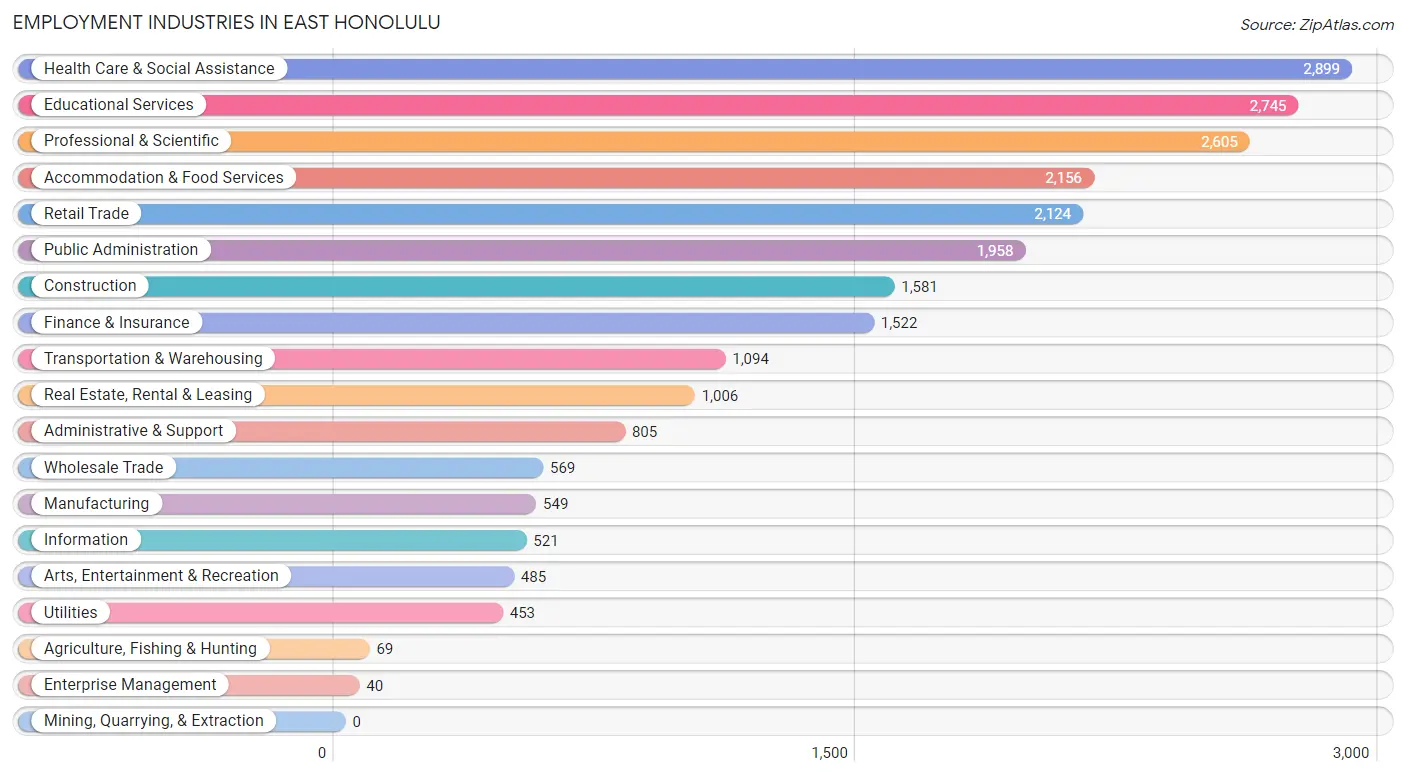
Employment Industries in East Honolulu
The major employment industries in East Honolulu include Health Care & Social Assistance (2,899 | 12.0%), Educational Services (2,745 | 11.4%), Professional & Scientific (2,605 | 10.8%), Accommodation & Food Services (2,156 | 8.9%), and Retail Trade (2,124 | 8.8%).
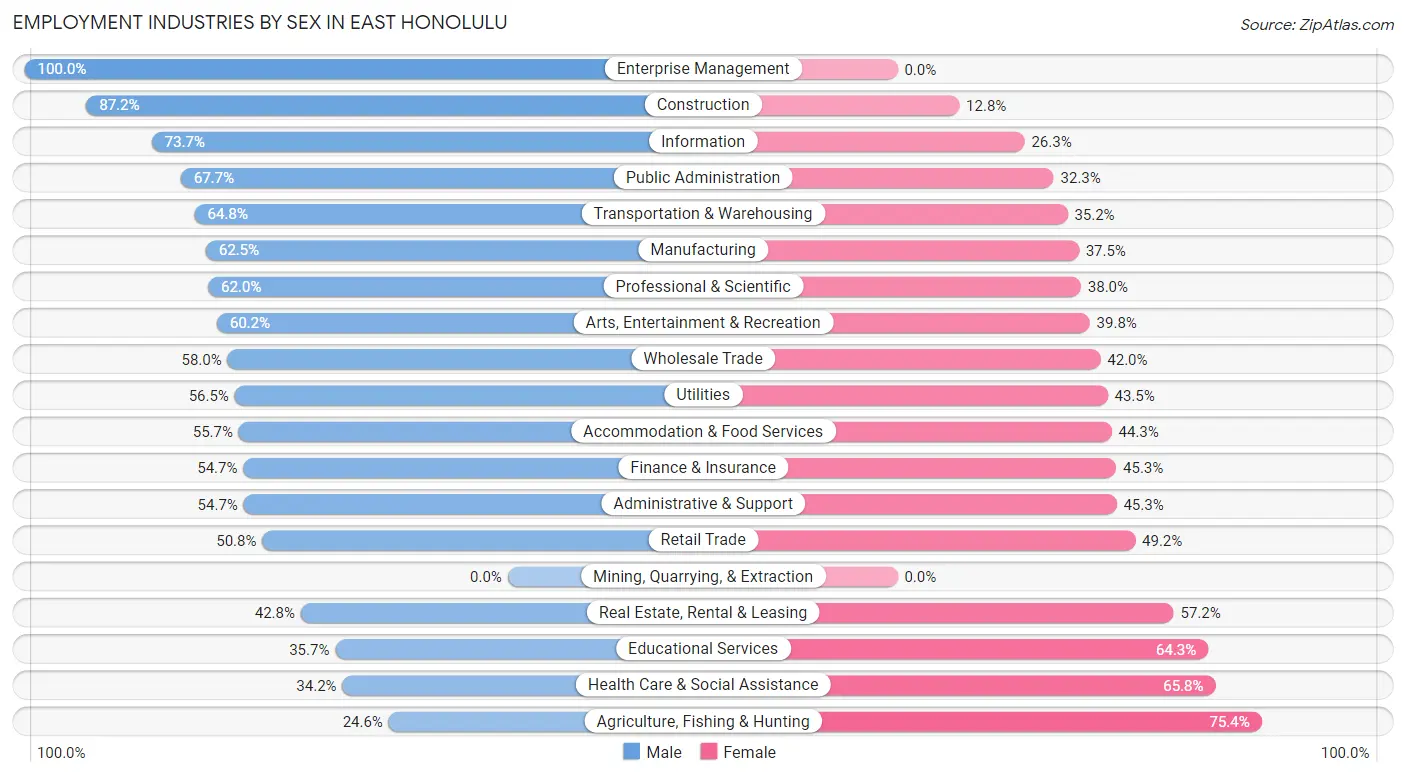
Employment Industries by Sex in East Honolulu
The East Honolulu industries that see more men than women are Enterprise Management (100.0%), Construction (87.2%), and Information (73.7%), whereas the industries that tend to have a higher number of women are Agriculture, Fishing & Hunting (75.4%), Health Care & Social Assistance (65.8%), and Educational Services (64.3%).
| Industry | Male | Female |
| Agriculture, Fishing & Hunting | 17 (24.6%) | 52 (75.4%) |
| Mining, Quarrying, & Extraction | 0 (0.0%) | 0 (0.0%) |
| Construction | 1,379 (87.2%) | 202 (12.8%) |
| Manufacturing | 343 (62.5%) | 206 (37.5%) |
| Wholesale Trade | 330 (58.0%) | 239 (42.0%) |
| Retail Trade | 1,079 (50.8%) | 1,045 (49.2%) |
| Transportation & Warehousing | 709 (64.8%) | 385 (35.2%) |
| Utilities | 256 (56.5%) | 197 (43.5%) |
| Information | 384 (73.7%) | 137 (26.3%) |
| Finance & Insurance | 833 (54.7%) | 689 (45.3%) |
| Real Estate, Rental & Leasing | 431 (42.8%) | 575 (57.2%) |
| Professional & Scientific | 1,616 (62.0%) | 989 (38.0%) |
| Enterprise Management | 40 (100.0%) | 0 (0.0%) |
| Administrative & Support | 440 (54.7%) | 365 (45.3%) |
| Educational Services | 980 (35.7%) | 1,765 (64.3%) |
| Health Care & Social Assistance | 992 (34.2%) | 1,907 (65.8%) |
| Arts, Entertainment & Recreation | 292 (60.2%) | 193 (39.8%) |
| Accommodation & Food Services | 1,200 (55.7%) | 956 (44.3%) |
| Public Administration | 1,325 (67.7%) | 633 (32.3%) |
| Total | 13,111 (54.3%) | 11,054 (45.7%) |
Education in East Honolulu
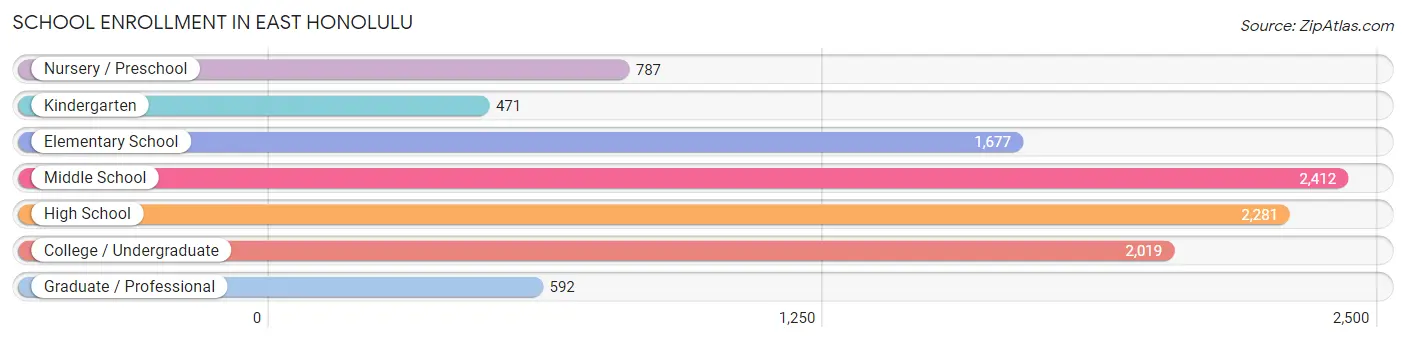
School Enrollment in East Honolulu
The most common levels of schooling among the 10,239 students in East Honolulu are middle school (2,412 | 23.6%), high school (2,281 | 22.3%), and college / undergraduate (2,019 | 19.7%).
| School Level | # Students | % Students |
| Nursery / Preschool | 787 | 7.7% |
| Kindergarten | 471 | 4.6% |
| Elementary School | 1,677 | 16.4% |
| Middle School | 2,412 | 23.6% |
| High School | 2,281 | 22.3% |
| College / Undergraduate | 2,019 | 19.7% |
| Graduate / Professional | 592 | 5.8% |
| Total | 10,239 | 100.0% |
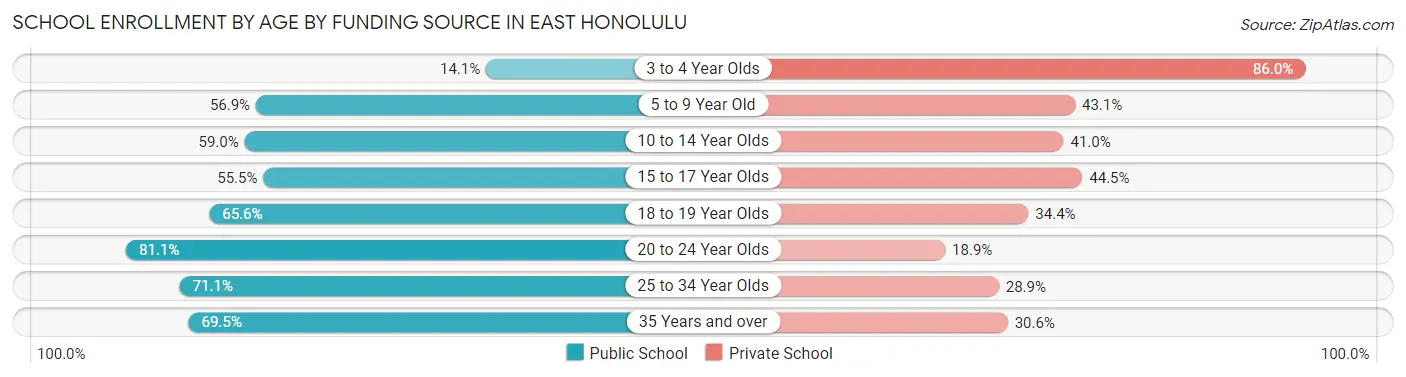
School Enrollment by Age by Funding Source in East Honolulu
Out of a total of 10,239 students who are enrolled in schools in East Honolulu, 4,198 (41.0%) attend a private institution, while the remaining 6,041 (59.0%) are enrolled in public schools. The age group of 3 to 4 year olds has the highest likelihood of being enrolled in private schools, with 532 (86.0% in the age bracket) enrolled. Conversely, the age group of 20 to 24 year olds has the lowest likelihood of being enrolled in a private school, with 755 (81.1% in the age bracket) attending a public institution.
| Age Bracket | Public School | Private School |
| 3 to 4 Year Olds | 87 (14.1%) | 532 (86.0%) |
| 5 to 9 Year Old | 1,231 (56.9%) | 932 (43.1%) |
| 10 to 14 Year Olds | 1,610 (59.0%) | 1,117 (41.0%) |
| 15 to 17 Year Olds | 1,038 (55.5%) | 831 (44.5%) |
| 18 to 19 Year Olds | 488 (65.6%) | 256 (34.4%) |
| 20 to 24 Year Olds | 755 (81.1%) | 176 (18.9%) |
| 25 to 34 Year Olds | 443 (71.1%) | 180 (28.9%) |
| 35 Years and over | 391 (69.5%) | 172 (30.5%) |
| Total | 6,041 (59.0%) | 4,198 (41.0%) |
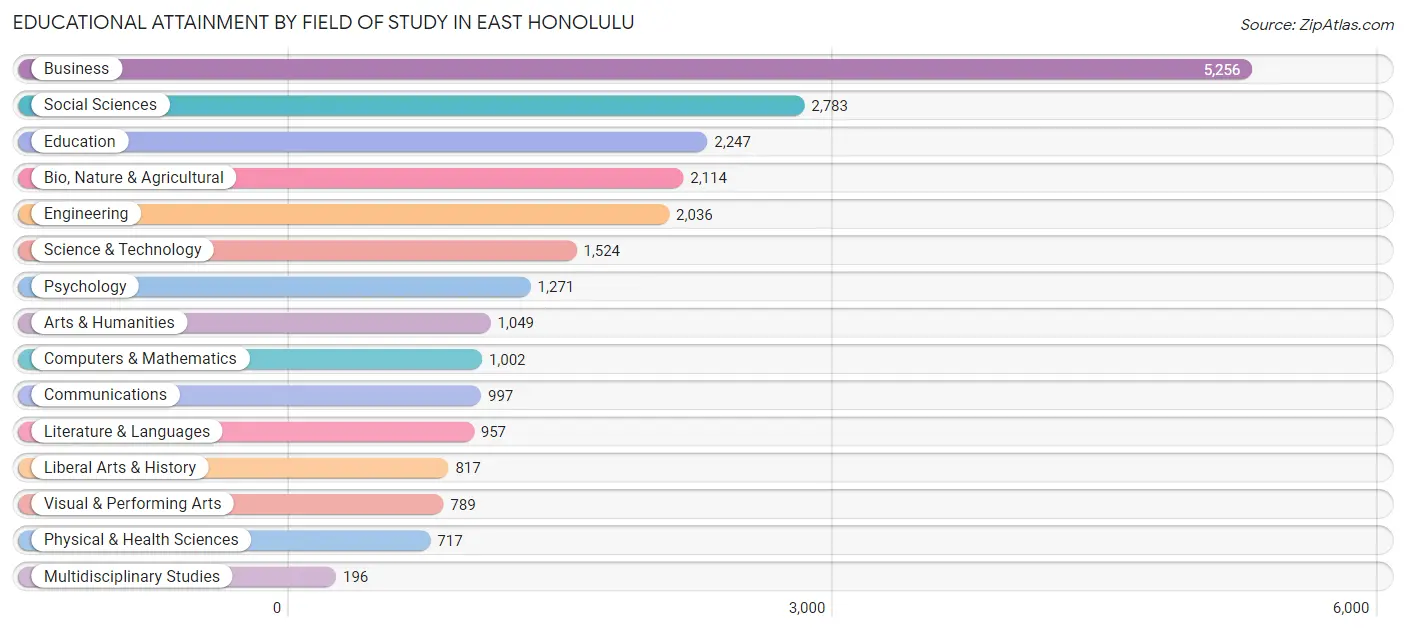
Educational Attainment by Field of Study in East Honolulu
Business (5,256 | 22.1%), social sciences (2,783 | 11.7%), education (2,247 | 9.5%), bio, nature & agricultural (2,114 | 8.9%), and engineering (2,036 | 8.6%) are the most common fields of study among 23,755 individuals in East Honolulu who have obtained a bachelor's degree or higher.
| Field of Study | # Graduates | % Graduates |
| Computers & Mathematics | 1,002 | 4.2% |
| Bio, Nature & Agricultural | 2,114 | 8.9% |
| Physical & Health Sciences | 717 | 3.0% |
| Psychology | 1,271 | 5.3% |
| Social Sciences | 2,783 | 11.7% |
| Engineering | 2,036 | 8.6% |
| Multidisciplinary Studies | 196 | 0.8% |
| Science & Technology | 1,524 | 6.4% |
| Business | 5,256 | 22.1% |
| Education | 2,247 | 9.5% |
| Literature & Languages | 957 | 4.0% |
| Liberal Arts & History | 817 | 3.4% |
| Visual & Performing Arts | 789 | 3.3% |
| Communications | 997 | 4.2% |
| Arts & Humanities | 1,049 | 4.4% |
| Total | 23,755 | 100.0% |
Transportation & Commute in East Honolulu
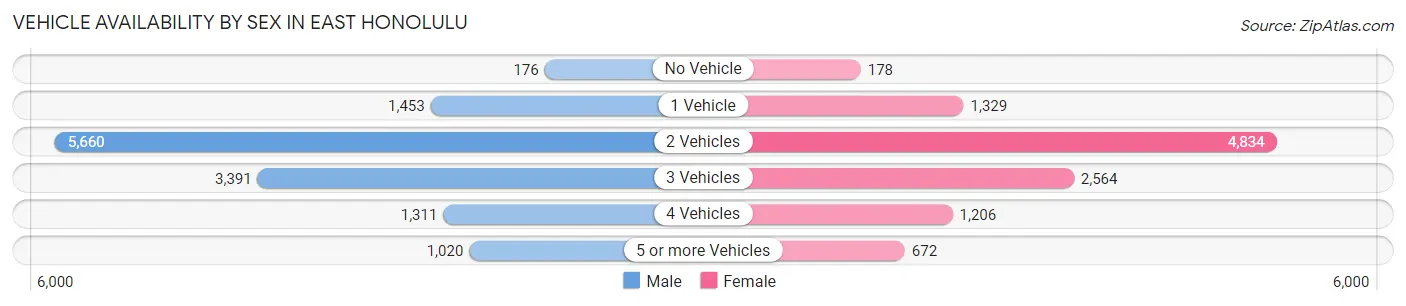
Vehicle Availability by Sex in East Honolulu
The most prevalent vehicle ownership categories in East Honolulu are males with 2 vehicles (5,660, accounting for 43.5%) and females with 2 vehicles (4,834, making up 52.5%).
| Vehicles Available | Male | Female |
| No Vehicle | 176 (1.3%) | 178 (1.7%) |
| 1 Vehicle | 1,453 (11.2%) | 1,329 (12.3%) |
| 2 Vehicles | 5,660 (43.5%) | 4,834 (44.8%) |
| 3 Vehicles | 3,391 (26.1%) | 2,564 (23.8%) |
| 4 Vehicles | 1,311 (10.1%) | 1,206 (11.2%) |
| 5 or more Vehicles | 1,020 (7.8%) | 672 (6.2%) |
| Total | 13,011 (100.0%) | 10,783 (100.0%) |
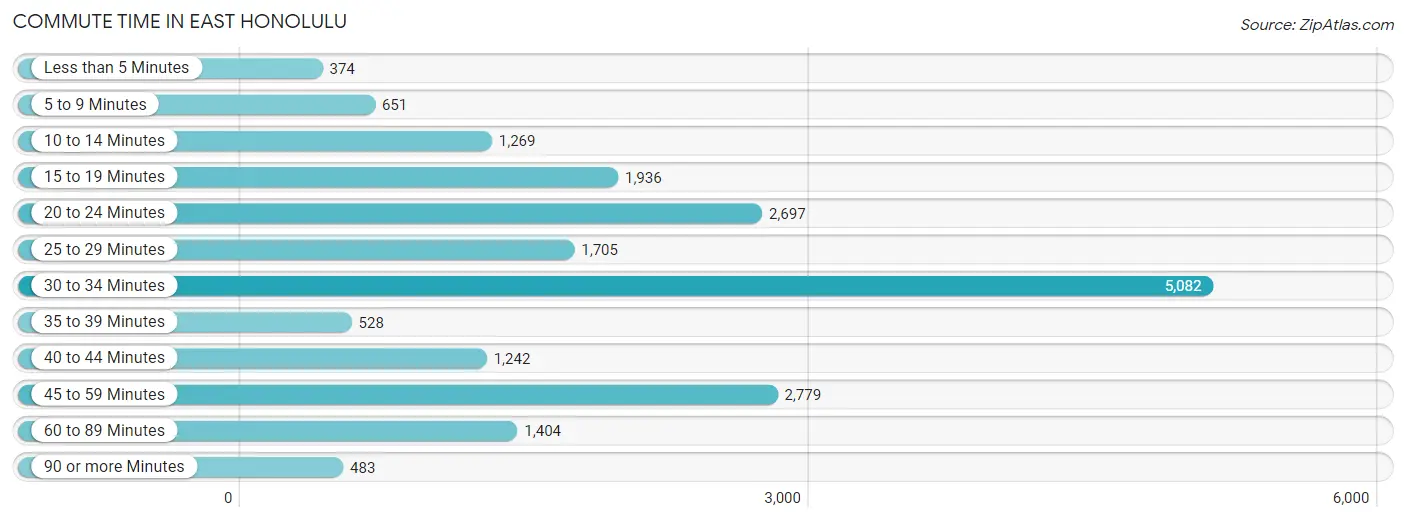
Commute Time in East Honolulu
The most frequently occuring commute durations in East Honolulu are 30 to 34 minutes (5,082 commuters, 25.2%), 45 to 59 minutes (2,779 commuters, 13.8%), and 20 to 24 minutes (2,697 commuters, 13.4%).
| Commute Time | # Commuters | % Commuters |
| Less than 5 Minutes | 374 | 1.9% |
| 5 to 9 Minutes | 651 | 3.2% |
| 10 to 14 Minutes | 1,269 | 6.3% |
| 15 to 19 Minutes | 1,936 | 9.6% |
| 20 to 24 Minutes | 2,697 | 13.4% |
| 25 to 29 Minutes | 1,705 | 8.5% |
| 30 to 34 Minutes | 5,082 | 25.2% |
| 35 to 39 Minutes | 528 | 2.6% |
| 40 to 44 Minutes | 1,242 | 6.2% |
| 45 to 59 Minutes | 2,779 | 13.8% |
| 60 to 89 Minutes | 1,404 | 7.0% |
| 90 or more Minutes | 483 | 2.4% |
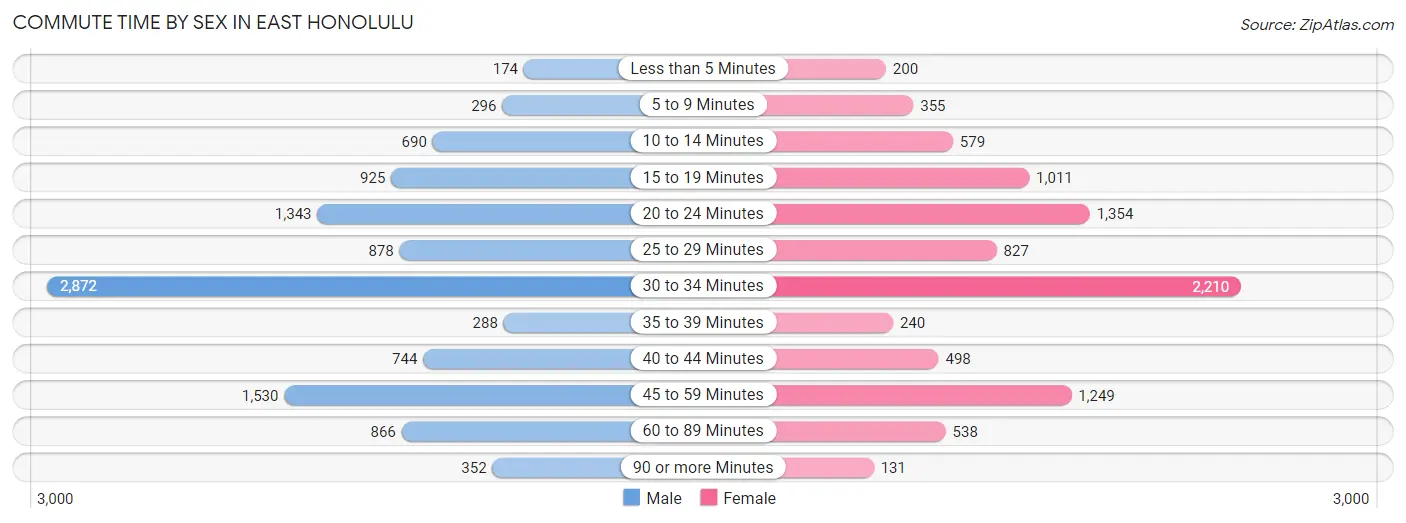
Commute Time by Sex in East Honolulu
The most common commute times in East Honolulu are 30 to 34 minutes (2,872 commuters, 26.2%) for males and 30 to 34 minutes (2,210 commuters, 24.0%) for females.
| Commute Time | Male | Female |
| Less than 5 Minutes | 174 (1.6%) | 200 (2.2%) |
| 5 to 9 Minutes | 296 (2.7%) | 355 (3.9%) |
| 10 to 14 Minutes | 690 (6.3%) | 579 (6.3%) |
| 15 to 19 Minutes | 925 (8.4%) | 1,011 (11.0%) |
| 20 to 24 Minutes | 1,343 (12.3%) | 1,354 (14.7%) |
| 25 to 29 Minutes | 878 (8.0%) | 827 (9.0%) |
| 30 to 34 Minutes | 2,872 (26.2%) | 2,210 (24.0%) |
| 35 to 39 Minutes | 288 (2.6%) | 240 (2.6%) |
| 40 to 44 Minutes | 744 (6.8%) | 498 (5.4%) |
| 45 to 59 Minutes | 1,530 (14.0%) | 1,249 (13.6%) |
| 60 to 89 Minutes | 866 (7.9%) | 538 (5.9%) |
| 90 or more Minutes | 352 (3.2%) | 131 (1.4%) |
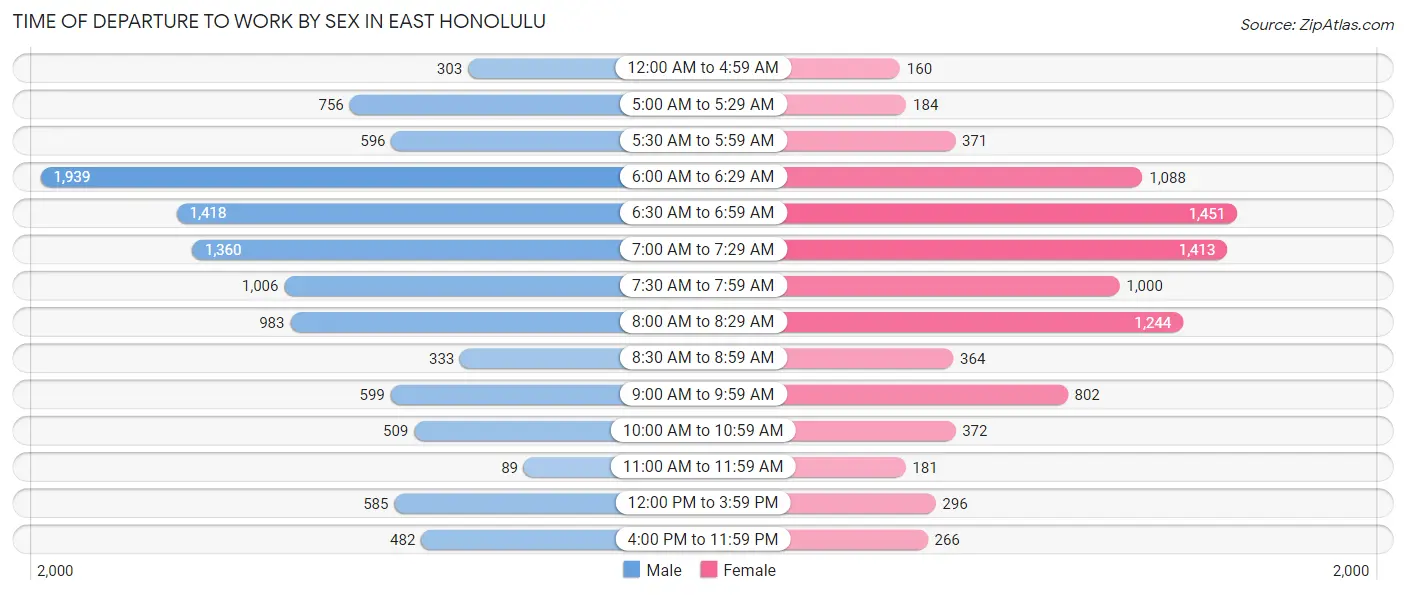
Time of Departure to Work by Sex in East Honolulu
The most frequent times of departure to work in East Honolulu are 6:00 AM to 6:29 AM (1,939, 17.7%) for males and 6:30 AM to 6:59 AM (1,451, 15.8%) for females.
| Time of Departure | Male | Female |
| 12:00 AM to 4:59 AM | 303 (2.8%) | 160 (1.7%) |
| 5:00 AM to 5:29 AM | 756 (6.9%) | 184 (2.0%) |
| 5:30 AM to 5:59 AM | 596 (5.4%) | 371 (4.0%) |
| 6:00 AM to 6:29 AM | 1,939 (17.7%) | 1,088 (11.8%) |
| 6:30 AM to 6:59 AM | 1,418 (12.9%) | 1,451 (15.8%) |
| 7:00 AM to 7:29 AM | 1,360 (12.4%) | 1,413 (15.4%) |
| 7:30 AM to 7:59 AM | 1,006 (9.2%) | 1,000 (10.9%) |
| 8:00 AM to 8:29 AM | 983 (9.0%) | 1,244 (13.5%) |
| 8:30 AM to 8:59 AM | 333 (3.0%) | 364 (4.0%) |
| 9:00 AM to 9:59 AM | 599 (5.5%) | 802 (8.7%) |
| 10:00 AM to 10:59 AM | 509 (4.6%) | 372 (4.1%) |
| 11:00 AM to 11:59 AM | 89 (0.8%) | 181 (2.0%) |
| 12:00 PM to 3:59 PM | 585 (5.3%) | 296 (3.2%) |
| 4:00 PM to 11:59 PM | 482 (4.4%) | 266 (2.9%) |
| Total | 10,958 (100.0%) | 9,192 (100.0%) |
Housing Occupancy in East Honolulu
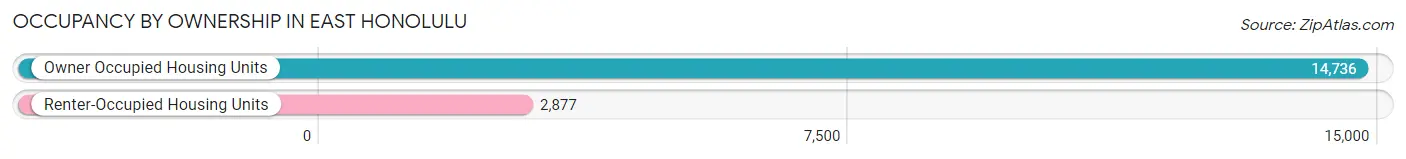
Occupancy by Ownership in East Honolulu
Of the total 17,613 dwellings in East Honolulu, owner-occupied units account for 14,736 (83.7%), while renter-occupied units make up 2,877 (16.3%).
| Occupancy | # Housing Units | % Housing Units |
| Owner Occupied Housing Units | 14,736 | 83.7% |
| Renter-Occupied Housing Units | 2,877 | 16.3% |
| Total Occupied Housing Units | 17,613 | 100.0% |
Occupancy by Household Size in East Honolulu
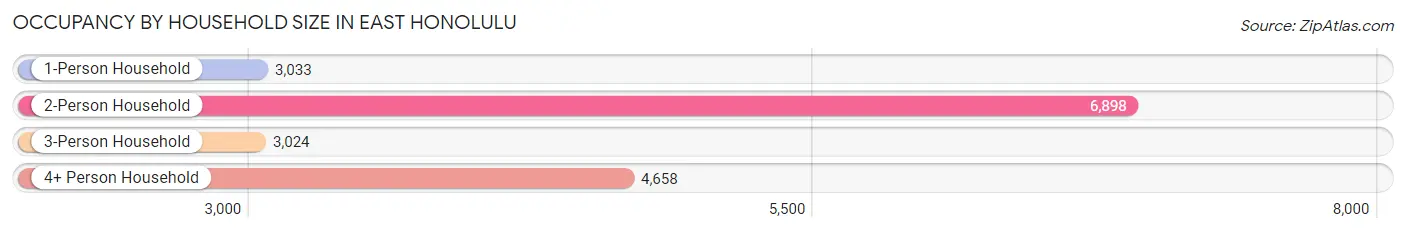
| Household Size | # Housing Units | % Housing Units |
| 1-Person Household | 3,033 | 17.2% |
| 2-Person Household | 6,898 | 39.2% |
| 3-Person Household | 3,024 | 17.2% |
| 4+ Person Household | 4,658 | 26.5% |
| Total Housing Units | 17,613 | 100.0% |
Occupancy by Ownership by Household Size in East Honolulu
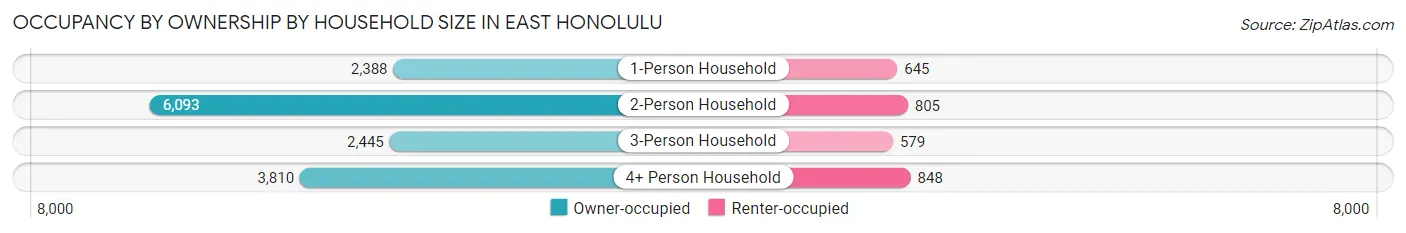
| Household Size | Owner-occupied | Renter-occupied |
| 1-Person Household | 2,388 (78.7%) | 645 (21.3%) |
| 2-Person Household | 6,093 (88.3%) | 805 (11.7%) |
| 3-Person Household | 2,445 (80.8%) | 579 (19.2%) |
| 4+ Person Household | 3,810 (81.8%) | 848 (18.2%) |
| Total Housing Units | 14,736 (83.7%) | 2,877 (16.3%) |
Occupancy by Educational Attainment in East Honolulu
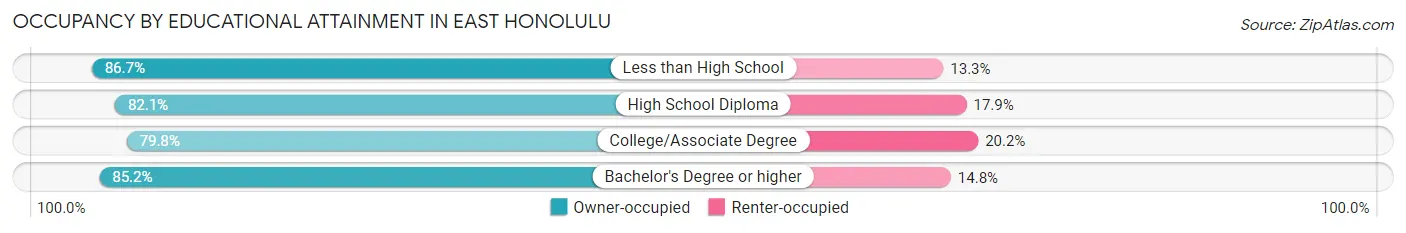
| Household Size | Owner-occupied | Renter-occupied |
| Less than High School | 319 (86.7%) | 49 (13.3%) |
| High School Diploma | 1,512 (82.1%) | 330 (17.9%) |
| College/Associate Degree | 3,178 (79.8%) | 806 (20.2%) |
| Bachelor's Degree or higher | 9,727 (85.2%) | 1,692 (14.8%) |
Occupancy by Age of Householder in East Honolulu
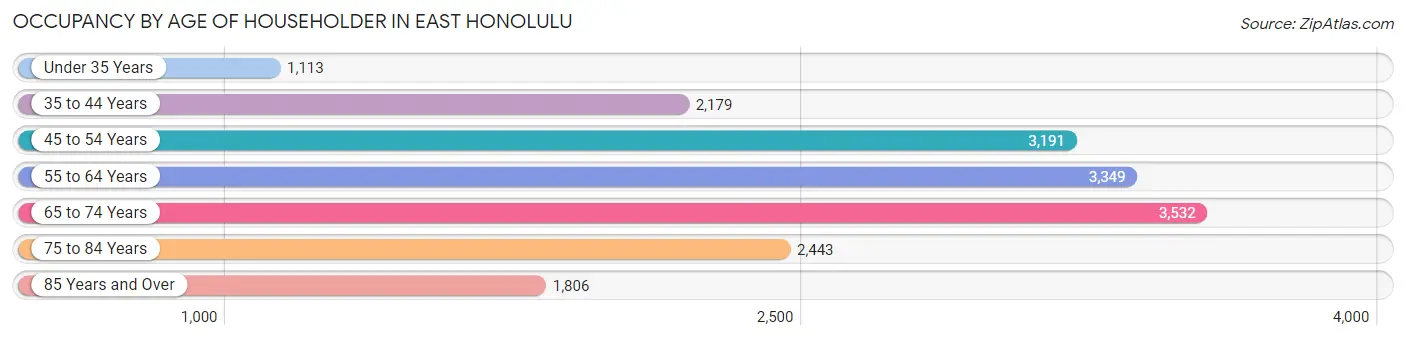
| Age Bracket | # Households | % Households |
| Under 35 Years | 1,113 | 6.3% |
| 35 to 44 Years | 2,179 | 12.4% |
| 45 to 54 Years | 3,191 | 18.1% |
| 55 to 64 Years | 3,349 | 19.0% |
| 65 to 74 Years | 3,532 | 20.1% |
| 75 to 84 Years | 2,443 | 13.9% |
| 85 Years and Over | 1,806 | 10.2% |
| Total | 17,613 | 100.0% |
Housing Finances in East Honolulu
Median Income by Occupancy in East Honolulu
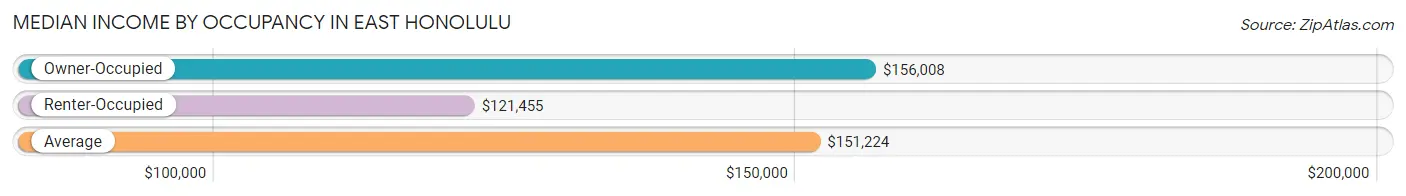
| Occupancy Type | # Households | Median Income |
| Owner-Occupied | 14,736 (83.7%) | $156,008 |
| Renter-Occupied | 2,877 (16.3%) | $121,455 |
| Average | 17,613 (100.0%) | $151,224 |
Occupancy by Householder Income Bracket in East Honolulu
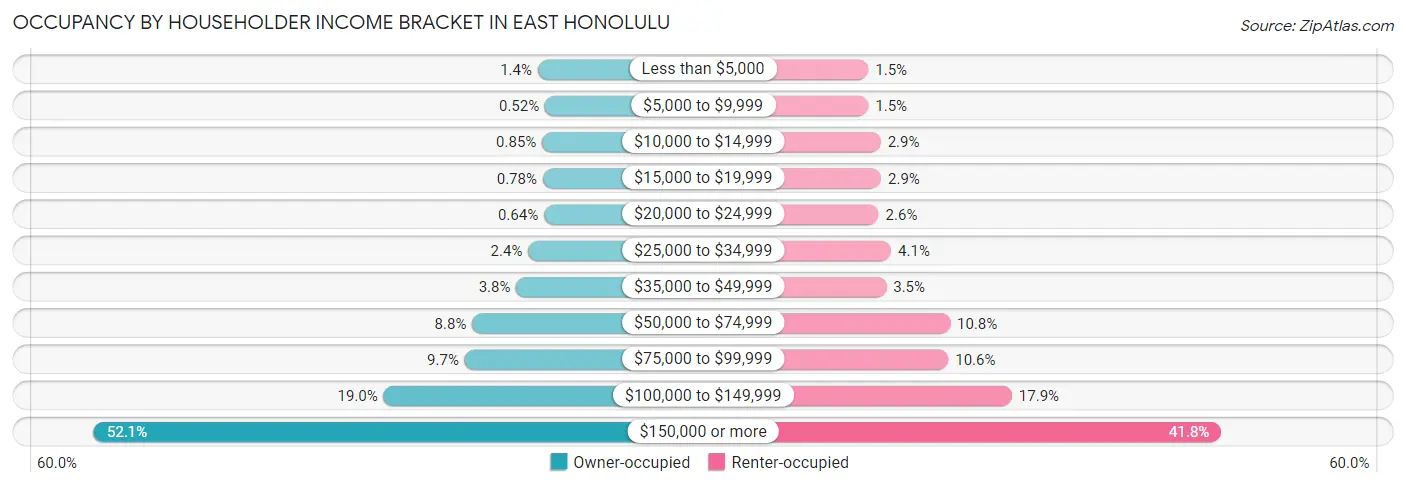
| Income Bracket | Owner-occupied | Renter-occupied |
| Less than $5,000 | 199 (1.3%) | 42 (1.5%) |
| $5,000 to $9,999 | 77 (0.5%) | 42 (1.5%) |
| $10,000 to $14,999 | 125 (0.9%) | 83 (2.9%) |
| $15,000 to $19,999 | 115 (0.8%) | 84 (2.9%) |
| $20,000 to $24,999 | 95 (0.6%) | 76 (2.6%) |
| $25,000 to $34,999 | 360 (2.4%) | 117 (4.1%) |
| $35,000 to $49,999 | 562 (3.8%) | 101 (3.5%) |
| $50,000 to $74,999 | 1,302 (8.8%) | 311 (10.8%) |
| $75,000 to $99,999 | 1,429 (9.7%) | 305 (10.6%) |
| $100,000 to $149,999 | 2,797 (19.0%) | 514 (17.9%) |
| $150,000 or more | 7,675 (52.1%) | 1,202 (41.8%) |
| Total | 14,736 (100.0%) | 2,877 (100.0%) |
Monthly Housing Cost Tiers in East Honolulu
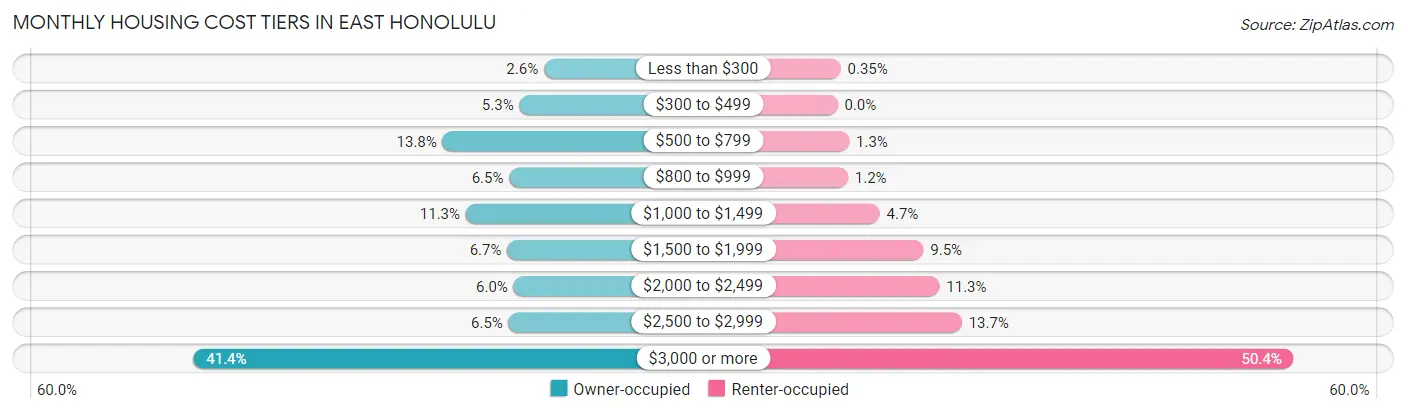
| Monthly Cost | Owner-occupied | Renter-occupied |
| Less than $300 | 386 (2.6%) | 10 (0.4%) |
| $300 to $499 | 785 (5.3%) | 0 (0.0%) |
| $500 to $799 | 2,037 (13.8%) | 37 (1.3%) |
| $800 to $999 | 951 (6.5%) | 33 (1.1%) |
| $1,000 to $1,499 | 1,658 (11.3%) | 134 (4.7%) |
| $1,500 to $1,999 | 984 (6.7%) | 273 (9.5%) |
| $2,000 to $2,499 | 880 (6.0%) | 324 (11.3%) |
| $2,500 to $2,999 | 961 (6.5%) | 395 (13.7%) |
| $3,000 or more | 6,094 (41.3%) | 1,450 (50.4%) |
| Total | 14,736 (100.0%) | 2,877 (100.0%) |
Physical Housing Characteristics in East Honolulu
Housing Structures in East Honolulu
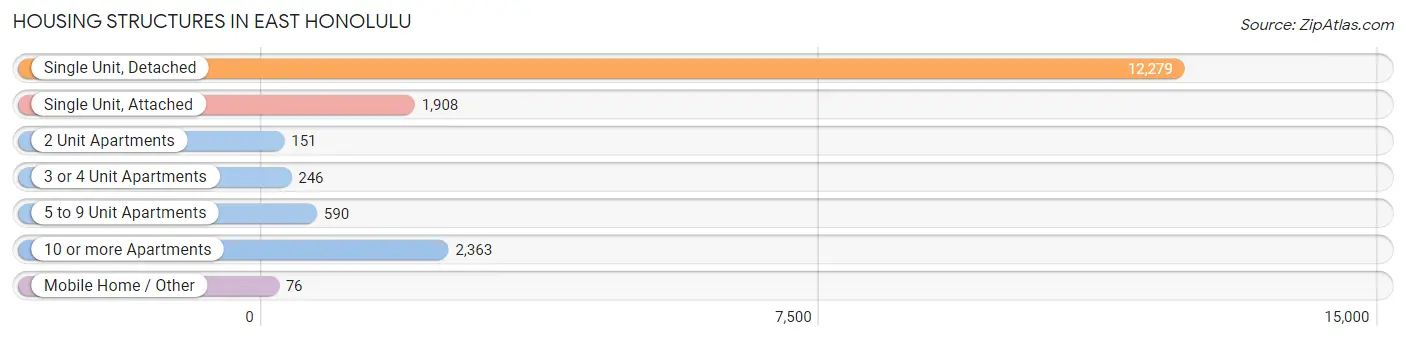
| Structure Type | # Housing Units | % Housing Units |
| Single Unit, Detached | 12,279 | 69.7% |
| Single Unit, Attached | 1,908 | 10.8% |
| 2 Unit Apartments | 151 | 0.9% |
| 3 or 4 Unit Apartments | 246 | 1.4% |
| 5 to 9 Unit Apartments | 590 | 3.4% |
| 10 or more Apartments | 2,363 | 13.4% |
| Mobile Home / Other | 76 | 0.4% |
| Total | 17,613 | 100.0% |
Housing Structures by Occupancy in East Honolulu
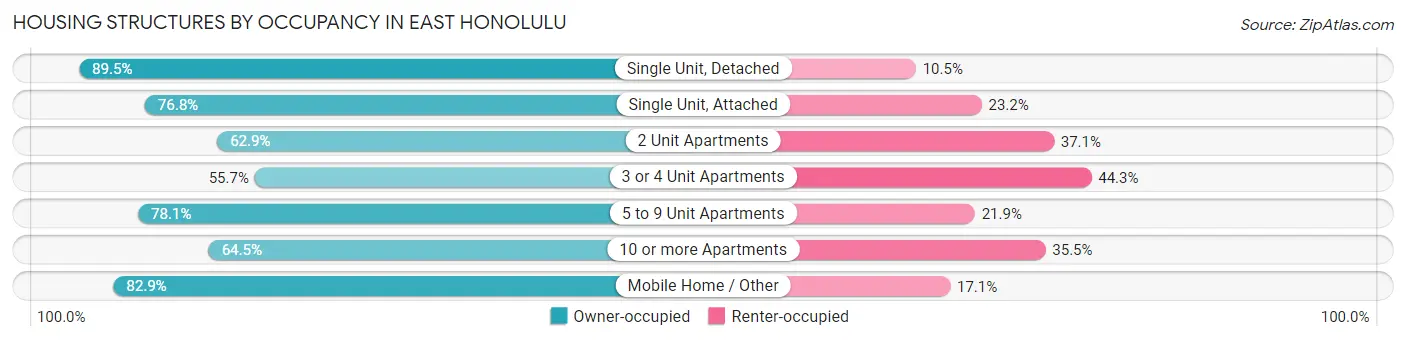
| Structure Type | Owner-occupied | Renter-occupied |
| Single Unit, Detached | 10,989 (89.5%) | 1,290 (10.5%) |
| Single Unit, Attached | 1,466 (76.8%) | 442 (23.2%) |
| 2 Unit Apartments | 95 (62.9%) | 56 (37.1%) |
| 3 or 4 Unit Apartments | 137 (55.7%) | 109 (44.3%) |
| 5 to 9 Unit Apartments | 461 (78.1%) | 129 (21.9%) |
| 10 or more Apartments | 1,525 (64.5%) | 838 (35.5%) |
| Mobile Home / Other | 63 (82.9%) | 13 (17.1%) |
| Total | 14,736 (83.7%) | 2,877 (16.3%) |
Housing Structures by Number of Rooms in East Honolulu
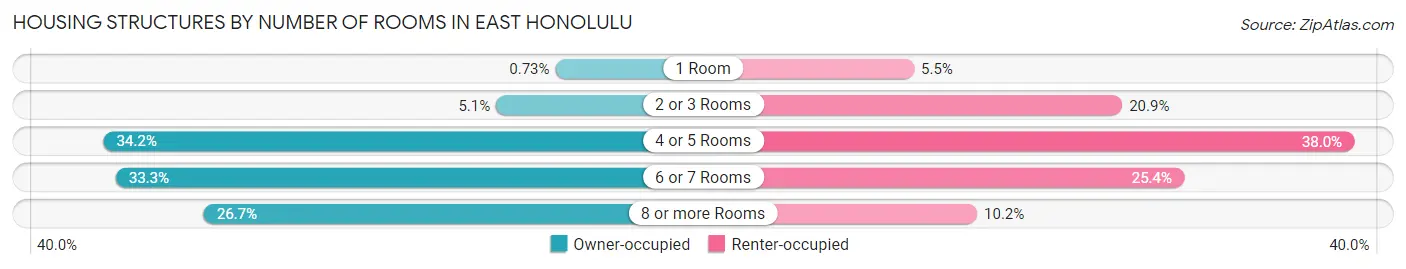
| Number of Rooms | Owner-occupied | Renter-occupied |
| 1 Room | 107 (0.7%) | 158 (5.5%) |
| 2 or 3 Rooms | 755 (5.1%) | 601 (20.9%) |
| 4 or 5 Rooms | 5,034 (34.2%) | 1,094 (38.0%) |
| 6 or 7 Rooms | 4,900 (33.3%) | 732 (25.4%) |
| 8 or more Rooms | 3,940 (26.7%) | 292 (10.2%) |
| Total | 14,736 (100.0%) | 2,877 (100.0%) |
Housing Structure by Heating Type in East Honolulu
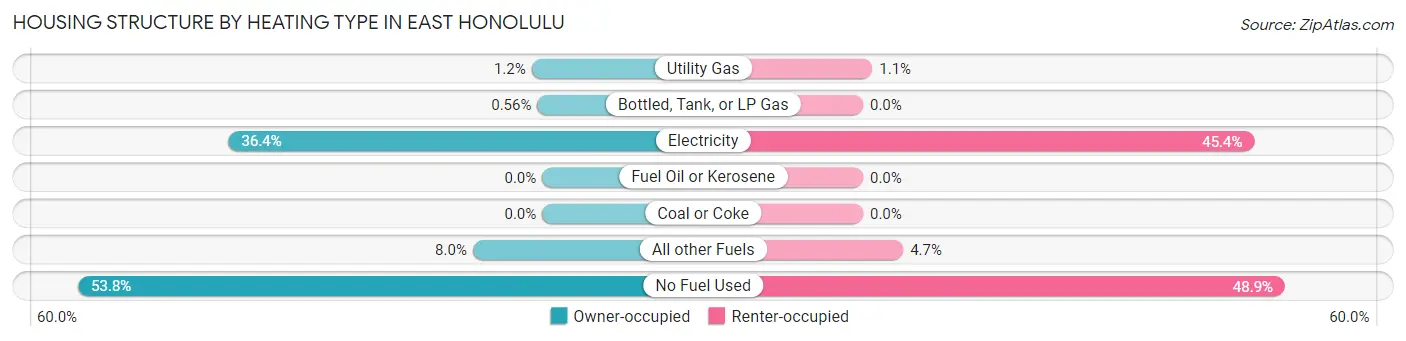
| Heating Type | Owner-occupied | Renter-occupied |
| Utility Gas | 180 (1.2%) | 31 (1.1%) |
| Bottled, Tank, or LP Gas | 82 (0.6%) | 0 (0.0%) |
| Electricity | 5,360 (36.4%) | 1,305 (45.4%) |
| Fuel Oil or Kerosene | 0 (0.0%) | 0 (0.0%) |
| Coal or Coke | 0 (0.0%) | 0 (0.0%) |
| All other Fuels | 1,185 (8.0%) | 134 (4.7%) |
| No Fuel Used | 7,929 (53.8%) | 1,407 (48.9%) |
| Total | 14,736 (100.0%) | 2,877 (100.0%) |
Household Vehicle Usage in East Honolulu
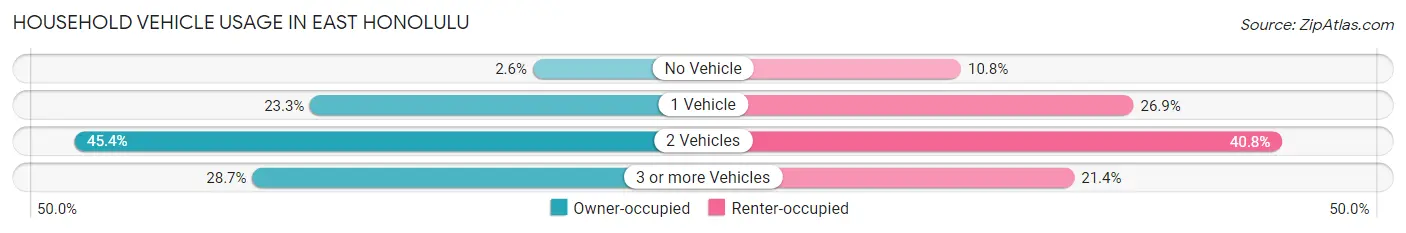
| Vehicles per Household | Owner-occupied | Renter-occupied |
| No Vehicle | 377 (2.6%) | 312 (10.8%) |
| 1 Vehicle | 3,439 (23.3%) | 775 (26.9%) |
| 2 Vehicles | 6,685 (45.4%) | 1,174 (40.8%) |
| 3 or more Vehicles | 4,235 (28.7%) | 616 (21.4%) |
| Total | 14,736 (100.0%) | 2,877 (100.0%) |
Real Estate & Mortgages in East Honolulu
Real Estate and Mortgage Overview in East Honolulu
| Characteristic | Without Mortgage | With Mortgage |
| Housing Units | 5,789 | 8,947 |
| Median Property Value | $1,114,700 | $1,119,200 |
| Median Household Income | $116,813 | $5,379 |
| Monthly Housing Costs | $775 | $6,045 |
| Real Estate Taxes | $3,361 | $189 |
Property Value by Mortgage Status in East Honolulu
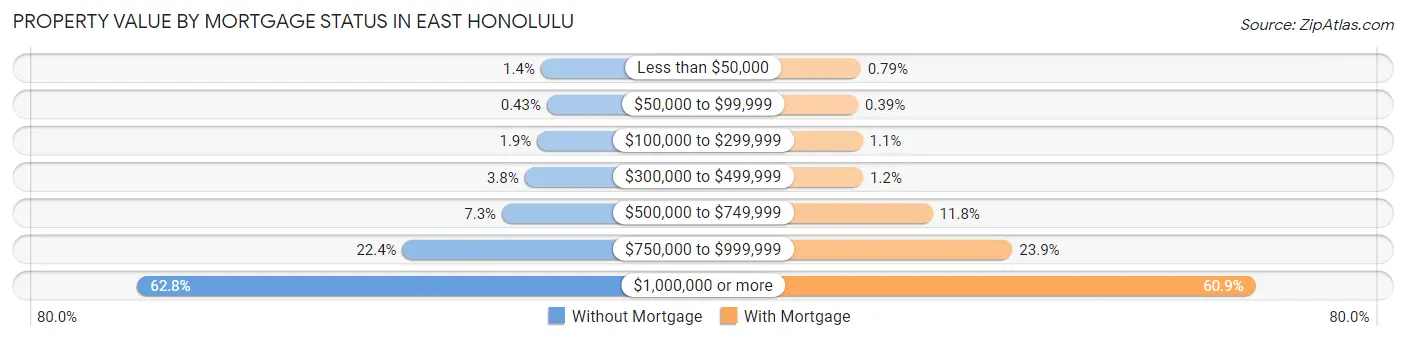
| Property Value | Without Mortgage | With Mortgage |
| Less than $50,000 | 78 (1.3%) | 71 (0.8%) |
| $50,000 to $99,999 | 25 (0.4%) | 35 (0.4%) |
| $100,000 to $299,999 | 110 (1.9%) | 96 (1.1%) |
| $300,000 to $499,999 | 221 (3.8%) | 104 (1.2%) |
| $500,000 to $749,999 | 421 (7.3%) | 1,051 (11.7%) |
| $750,000 to $999,999 | 1,298 (22.4%) | 2,138 (23.9%) |
| $1,000,000 or more | 3,636 (62.8%) | 5,452 (60.9%) |
| Total | 5,789 (100.0%) | 8,947 (100.0%) |
Household Income by Mortgage Status in East Honolulu
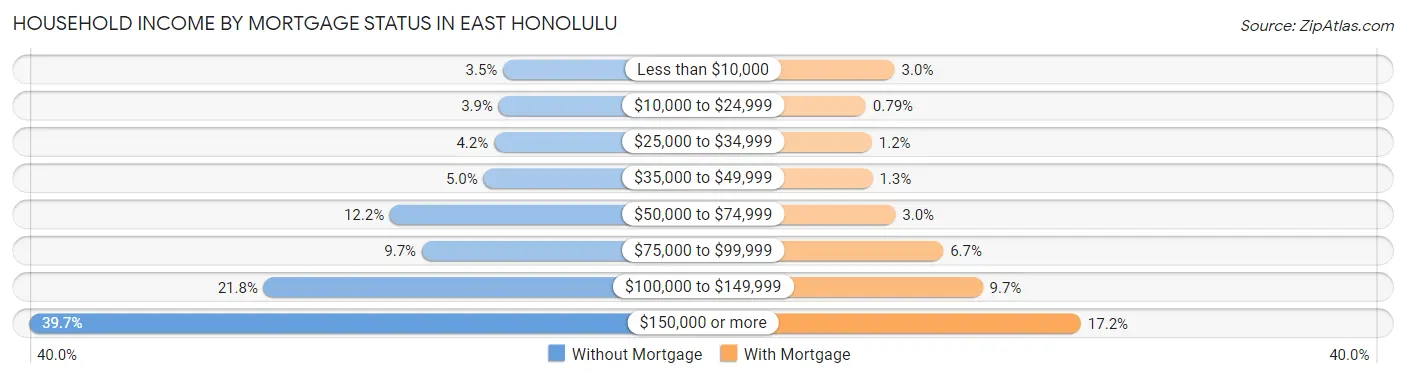
| Household Income | Without Mortgage | With Mortgage |
| Less than $10,000 | 205 (3.5%) | 267 (3.0%) |
| $10,000 to $24,999 | 224 (3.9%) | 71 (0.8%) |
| $25,000 to $34,999 | 245 (4.2%) | 111 (1.2%) |
| $35,000 to $49,999 | 291 (5.0%) | 115 (1.3%) |
| $50,000 to $74,999 | 704 (12.2%) | 271 (3.0%) |
| $75,000 to $99,999 | 563 (9.7%) | 598 (6.7%) |
| $100,000 to $149,999 | 1,261 (21.8%) | 866 (9.7%) |
| $150,000 or more | 2,296 (39.7%) | 1,536 (17.2%) |
| Total | 5,789 (100.0%) | 8,947 (100.0%) |
Property Value to Household Income Ratio in East Honolulu
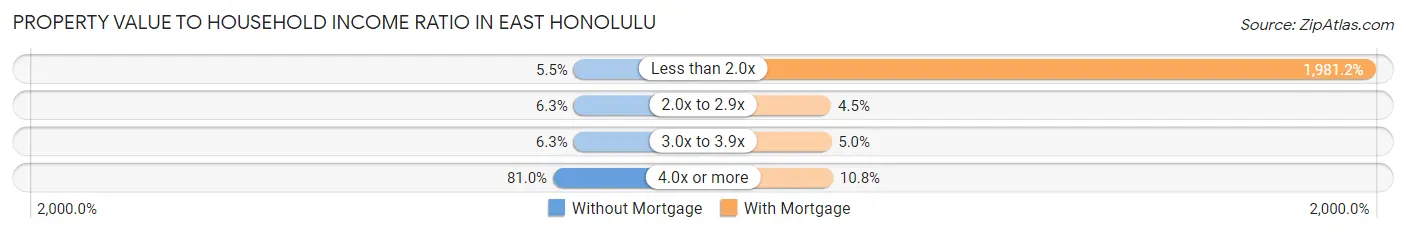
| Value-to-Income Ratio | Without Mortgage | With Mortgage |
| Less than 2.0x | 321 (5.5%) | 177,260 (1,981.2%) |
| 2.0x to 2.9x | 363 (6.3%) | 404 (4.5%) |
| 3.0x to 3.9x | 365 (6.3%) | 449 (5.0%) |
| 4.0x or more | 4,687 (81.0%) | 969 (10.8%) |
| Total | 5,789 (100.0%) | 8,947 (100.0%) |
Real Estate Taxes by Mortgage Status in East Honolulu
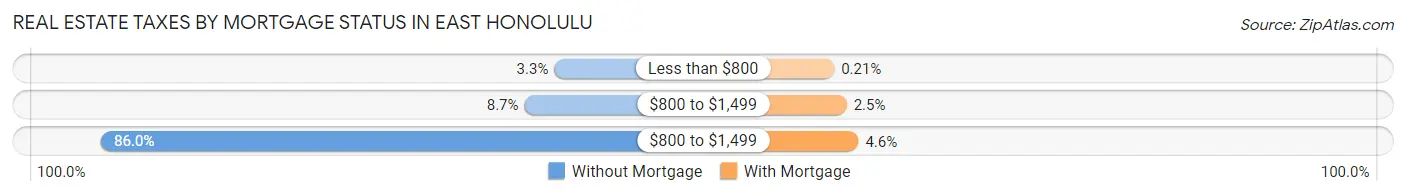
| Property Taxes | Without Mortgage | With Mortgage |
| Less than $800 | 189 (3.3%) | 19 (0.2%) |
| $800 to $1,499 | 505 (8.7%) | 224 (2.5%) |
| $800 to $1,499 | 4,980 (86.0%) | 415 (4.6%) |
| Total | 5,789 (100.0%) | 8,947 (100.0%) |
Health & Disability in East Honolulu
Health Insurance Coverage by Age in East Honolulu
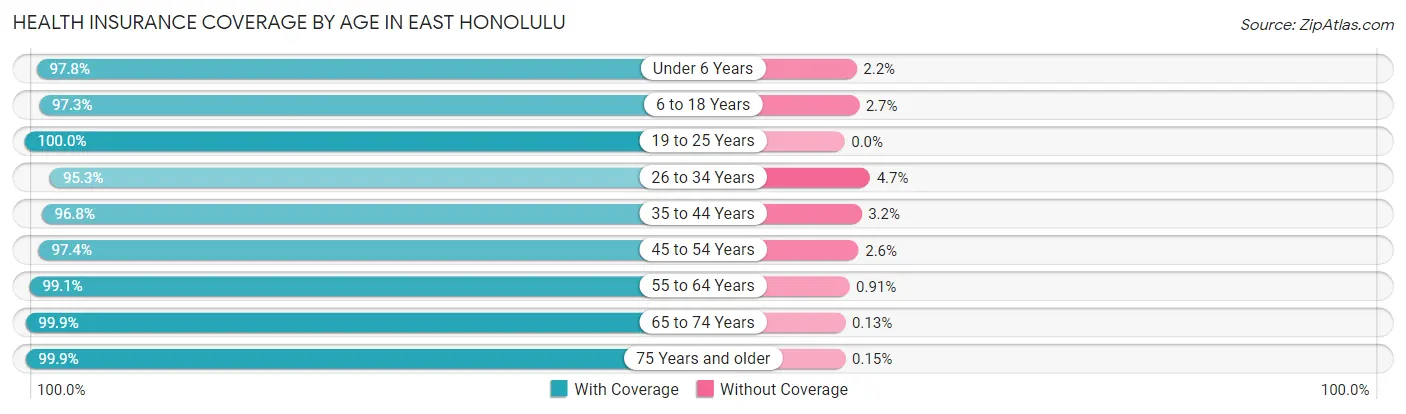
| Age Bracket | With Coverage | Without Coverage |
| Under 6 Years | 2,534 (97.8%) | 58 (2.2%) |
| 6 to 18 Years | 6,952 (97.3%) | 192 (2.7%) |
| 19 to 25 Years | 2,877 (100.0%) | 0 (0.0%) |
| 26 to 34 Years | 3,775 (95.3%) | 188 (4.7%) |
| 35 to 44 Years | 5,516 (96.8%) | 180 (3.2%) |
| 45 to 54 Years | 6,267 (97.4%) | 168 (2.6%) |
| 55 to 64 Years | 6,869 (99.1%) | 63 (0.9%) |
| 65 to 74 Years | 6,190 (99.9%) | 8 (0.1%) |
| 75 Years and older | 7,191 (99.9%) | 11 (0.2%) |
| Total | 48,171 (98.2%) | 868 (1.8%) |
Health Insurance Coverage by Citizenship Status in East Honolulu
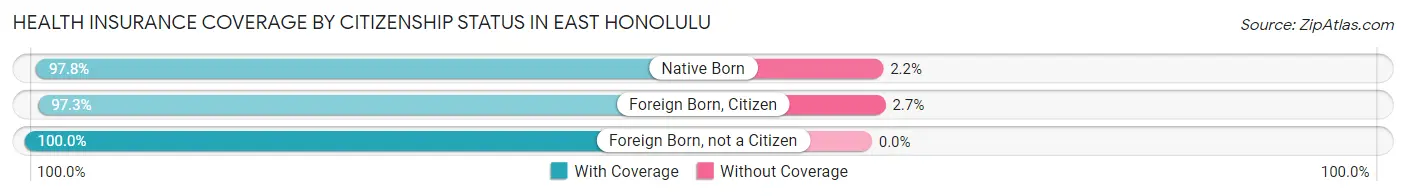
| Citizenship Status | With Coverage | Without Coverage |
| Native Born | 2,534 (97.8%) | 58 (2.2%) |
| Foreign Born, Citizen | 6,952 (97.3%) | 192 (2.7%) |
| Foreign Born, not a Citizen | 2,877 (100.0%) | 0 (0.0%) |
Health Insurance Coverage by Household Income in East Honolulu
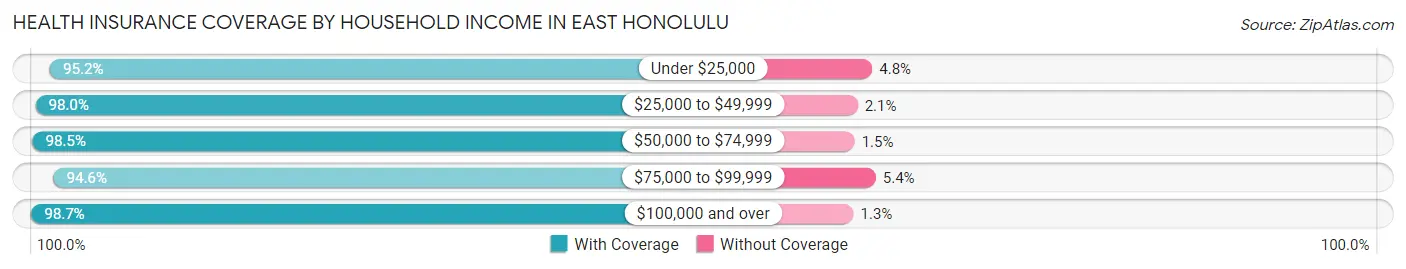
| Household Income | With Coverage | Without Coverage |
| Under $25,000 | 1,430 (95.2%) | 72 (4.8%) |
| $25,000 to $49,999 | 2,098 (98.0%) | 44 (2.1%) |
| $50,000 to $74,999 | 3,250 (98.5%) | 49 (1.5%) |
| $75,000 to $99,999 | 3,788 (94.6%) | 218 (5.4%) |
| $100,000 and over | 37,506 (98.7%) | 485 (1.3%) |
Public vs Private Health Insurance Coverage by Age in East Honolulu
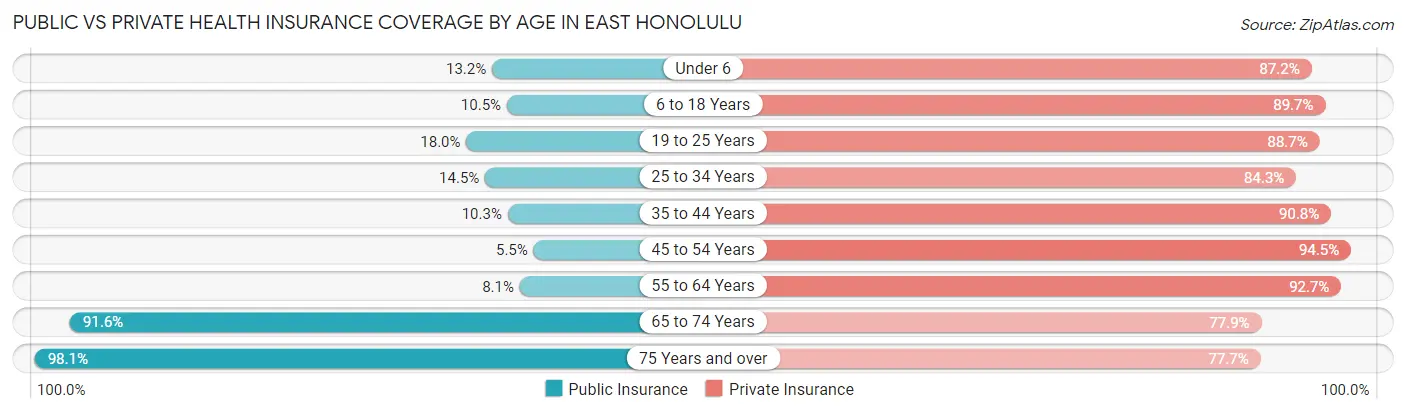
| Age Bracket | Public Insurance | Private Insurance |
| Under 6 | 343 (13.2%) | 2,260 (87.2%) |
| 6 to 18 Years | 749 (10.5%) | 6,411 (89.7%) |
| 19 to 25 Years | 518 (18.0%) | 2,551 (88.7%) |
| 25 to 34 Years | 575 (14.5%) | 3,342 (84.3%) |
| 35 to 44 Years | 588 (10.3%) | 5,173 (90.8%) |
| 45 to 54 Years | 355 (5.5%) | 6,083 (94.5%) |
| 55 to 64 Years | 560 (8.1%) | 6,425 (92.7%) |
| 65 to 74 Years | 5,676 (91.6%) | 4,827 (77.9%) |
| 75 Years and over | 7,066 (98.1%) | 5,598 (77.7%) |
| Total | 16,430 (33.5%) | 42,670 (87.0%) |
Disability Status by Sex by Age in East Honolulu
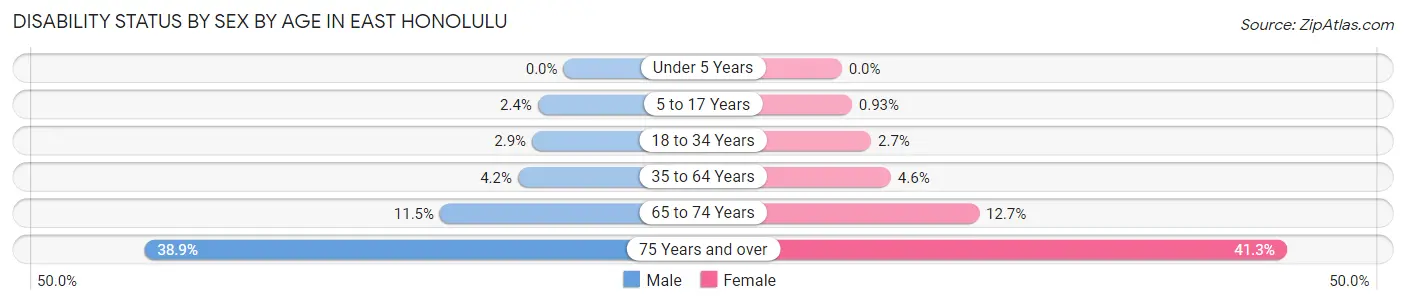
| Age Bracket | Male | Female |
| Under 5 Years | 0 (0.0%) | 0 (0.0%) |
| 5 to 17 Years | 87 (2.4%) | 31 (0.9%) |
| 18 to 34 Years | 111 (2.9%) | 98 (2.7%) |
| 35 to 64 Years | 397 (4.2%) | 441 (4.6%) |
| 65 to 74 Years | 337 (11.5%) | 415 (12.7%) |
| 75 Years and over | 1,282 (38.9%) | 1,611 (41.3%) |
Disability Class by Sex by Age in East Honolulu
Disability Class: Hearing Difficulty
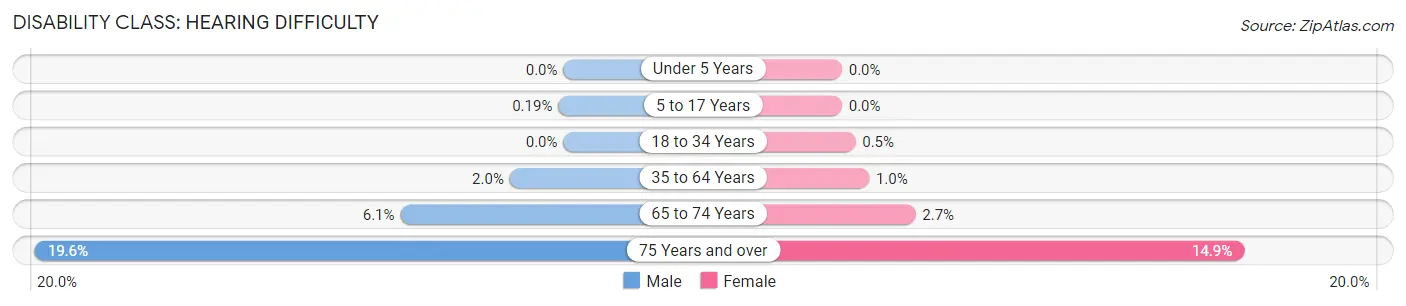
| Age Bracket | Male | Female |
| Under 5 Years | 0 (0.0%) | 0 (0.0%) |
| 5 to 17 Years | 7 (0.2%) | 0 (0.0%) |
| 18 to 34 Years | 0 (0.0%) | 18 (0.5%) |
| 35 to 64 Years | 187 (2.0%) | 98 (1.0%) |
| 65 to 74 Years | 178 (6.0%) | 89 (2.7%) |
| 75 Years and over | 647 (19.6%) | 583 (14.9%) |
Disability Class: Vision Difficulty
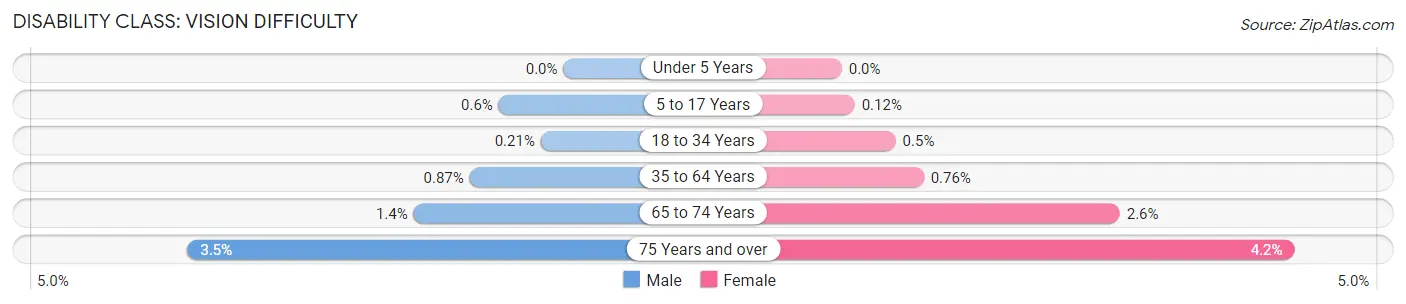
| Age Bracket | Male | Female |
| Under 5 Years | 0 (0.0%) | 0 (0.0%) |
| 5 to 17 Years | 22 (0.6%) | 4 (0.1%) |
| 18 to 34 Years | 8 (0.2%) | 18 (0.5%) |
| 35 to 64 Years | 82 (0.9%) | 74 (0.8%) |
| 65 to 74 Years | 41 (1.4%) | 84 (2.6%) |
| 75 Years and over | 115 (3.5%) | 164 (4.2%) |
Disability Class: Cognitive Difficulty
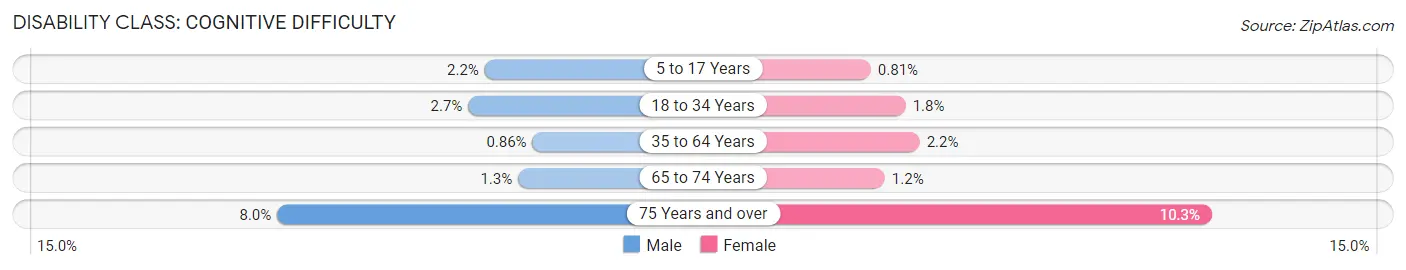
| Age Bracket | Male | Female |
| 5 to 17 Years | 80 (2.2%) | 27 (0.8%) |
| 18 to 34 Years | 101 (2.6%) | 64 (1.8%) |
| 35 to 64 Years | 81 (0.9%) | 210 (2.2%) |
| 65 to 74 Years | 37 (1.3%) | 39 (1.2%) |
| 75 Years and over | 263 (8.0%) | 402 (10.3%) |
Disability Class: Ambulatory Difficulty
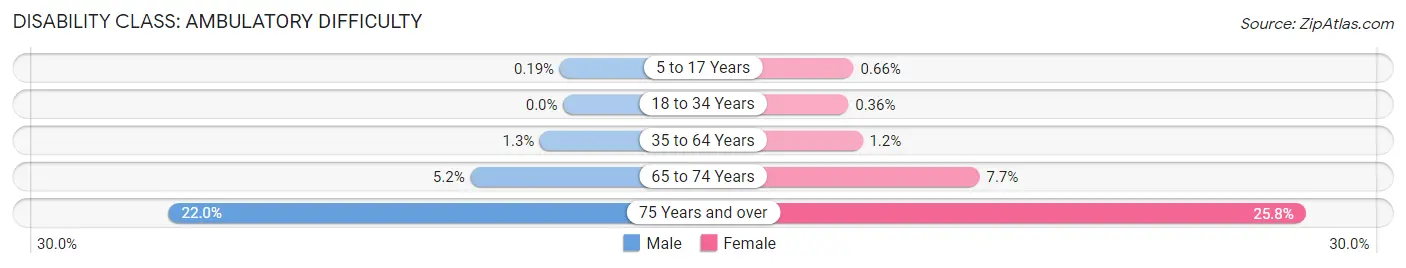
| Age Bracket | Male | Female |
| 5 to 17 Years | 7 (0.2%) | 22 (0.7%) |
| 18 to 34 Years | 0 (0.0%) | 13 (0.4%) |
| 35 to 64 Years | 121 (1.3%) | 111 (1.1%) |
| 65 to 74 Years | 152 (5.2%) | 250 (7.7%) |
| 75 Years and over | 725 (22.0%) | 1,008 (25.8%) |
Disability Class: Self-Care Difficulty
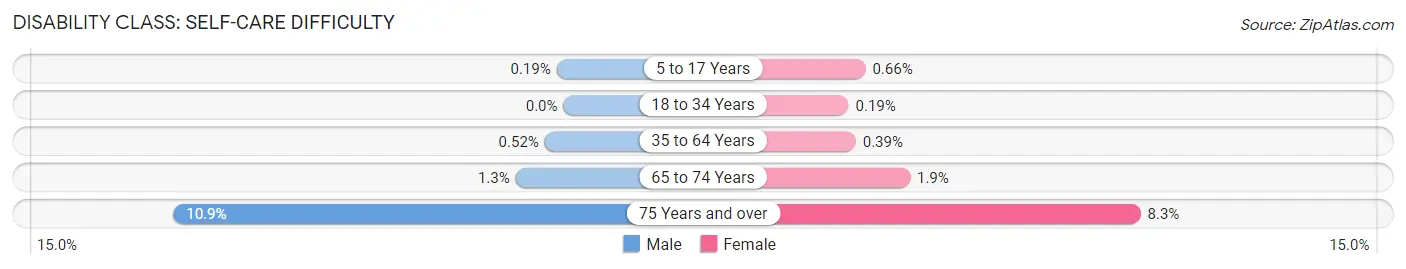
| Age Bracket | Male | Female |
| 5 to 17 Years | 7 (0.2%) | 22 (0.7%) |
| 18 to 34 Years | 0 (0.0%) | 7 (0.2%) |
| 35 to 64 Years | 49 (0.5%) | 38 (0.4%) |
| 65 to 74 Years | 39 (1.3%) | 62 (1.9%) |
| 75 Years and over | 358 (10.9%) | 325 (8.3%) |
Technology Access in East Honolulu
Computing Device Access in East Honolulu
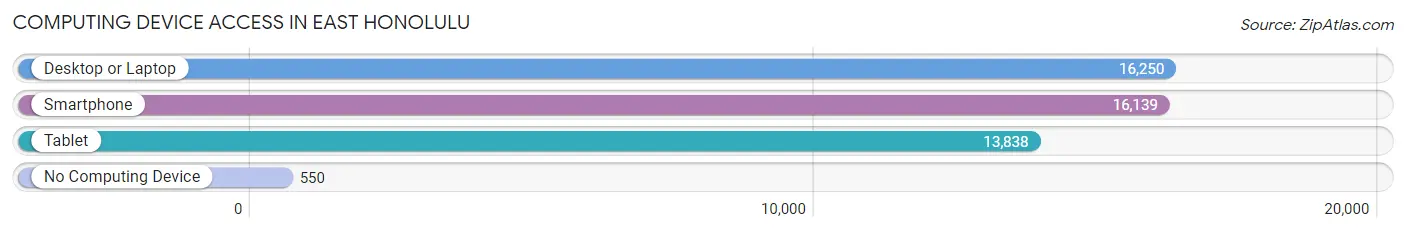
| Device Type | # Households | % Households |
| Desktop or Laptop | 16,250 | 92.3% |
| Smartphone | 16,139 | 91.6% |
| Tablet | 13,838 | 78.6% |
| No Computing Device | 550 | 3.1% |
| Total | 17,613 | 100.0% |
Internet Access in East Honolulu
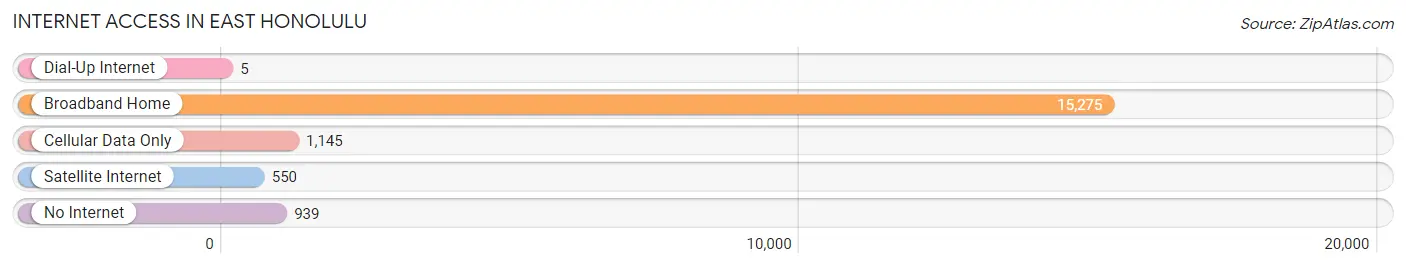
| Internet Type | # Households | % Households |
| Dial-Up Internet | 5 | 0.0% |
| Broadband Home | 15,275 | 86.7% |
| Cellular Data Only | 1,145 | 6.5% |
| Satellite Internet | 550 | 3.1% |
| No Internet | 939 | 5.3% |
| Total | 17,613 | 100.0% |
East Honolulu Summary
Honolulu is the capital of the state of Hawaii and the largest city in the state. It is located on the island of Oahu and is the county seat of Honolulu County. Honolulu is the most populous city in the state and the most populous city in the United States outside of the mainland. It is also the most populous city in the Polynesian Triangle, which includes Hawaii, Samoa, and Tahiti.
History
The area that is now Honolulu was first settled by Polynesians in the 11th century. The first European contact with the area was in 1778 when Captain James Cook arrived in the area. The area was then known as Kou. In 1794, King Kamehameha I unified the Hawaiian Islands and established Honolulu as the capital of the Kingdom of Hawaii.
In 1845, the Great Mahele was enacted, which divided the land among the Hawaiian people. This led to the development of the city of Honolulu. In 1887, the city was incorporated and became the capital of the Territory of Hawaii.
In 1898, the United States annexed Hawaii and Honolulu became the capital of the Territory of Hawaii. In 1959, Hawaii became the 50th state of the United States and Honolulu became the state capital.
Geography
Honolulu is located on the southeastern coast of the island of Oahu. It is situated on a natural harbor and is surrounded by mountains. The city is located at 21°18'N, 157°51'W.
The city has a total area of 68.4 square miles, of which 62.7 square miles is land and 5.7 square miles is water. The city is located at an elevation of 13 feet above sea level.
Economy
Honolulu is the economic center of Hawaii and is home to a variety of industries. The city is a major tourist destination and is home to a number of resorts and hotels. The city is also home to a number of military bases, including Pearl Harbor.
The city is home to a number of corporate headquarters, including Hawaiian Airlines, Bank of Hawaii, and First Hawaiian Bank. The city is also home to a number of technology companies, including Hawaiian Telcom and Oceanic Time Warner Cable.
Demographics
As of the 2010 census, the population of Honolulu was 953,207. The population density was 14,092 people per square mile. The racial makeup of the city was:
White 24 3
Asian 43 2
Native Hawaiian and Other Pacific Islander 10 2
Black or African American 2 2
Other 20 1
The median household income in the city was $63,824 and the median family income was $76,945. The per capita income was $35,845. The poverty rate was 10.2%.
Conclusion
Honolulu is the capital of the state of Hawaii and the largest city in the state. It is located on the island of Oahu and is the county seat of Honolulu County. The city has a long and rich history and is the economic center of the state. The city is a major tourist destination and is home to a number of corporate headquarters and technology companies. The population of the city is diverse and the median household income is above the national average.
Common Questions
What is Per Capita Income in East Honolulu?
Per Capita income in East Honolulu is $68,070.
What is the Median Family Income in East Honolulu?
Median Family Income in East Honolulu is $166,585.
What is the Median Household income in East Honolulu?
Median Household Income in East Honolulu is $151,224.
What is Income or Wage Gap in East Honolulu?
Income or Wage Gap in East Honolulu is 34.1%.
Women in East Honolulu earn 65.9 cents for every dollar earned by a man.
What is Family Income Deficit in East Honolulu?
Family Income Deficit in East Honolulu is $9,548.
Families that are below poverty line in East Honolulu earn $9,548 less on average than the poverty threshold level.
What is Inequality or Gini Index in East Honolulu?
Inequality or Gini Index in East Honolulu is 0.43.
What is the Total Population of East Honolulu?
Total Population of East Honolulu is 49,491.
What is the Total Male Population of East Honolulu?
Total Male Population of East Honolulu is 24,566.
What is the Total Female Population of East Honolulu?
Total Female Population of East Honolulu is 24,925.
What is the Ratio of Males per 100 Females in East Honolulu?
There are 98.56 Males per 100 Females in East Honolulu.
What is the Ratio of Females per 100 Males in East Honolulu?
There are 101.46 Females per 100 Males in East Honolulu.
What is the Median Population Age in East Honolulu?
Median Population Age in East Honolulu is 48.8 Years.
What is the Average Family Size in East Honolulu
Average Family Size in East Honolulu is 3.1 People.
What is the Average Household Size in East Honolulu
Average Household Size in East Honolulu is 2.8 People.
How Large is the Labor Force in East Honolulu?
There are 25,369 People in the Labor Forcein in East Honolulu.
What is the Percentage of People in the Labor Force in East Honolulu?
61.0% of People are in the Labor Force in East Honolulu.
What is the Unemployment Rate in East Honolulu?
Unemployment Rate in East Honolulu is 3.8%.