St Cloud, MN Map & Demographics
St Cloud Map
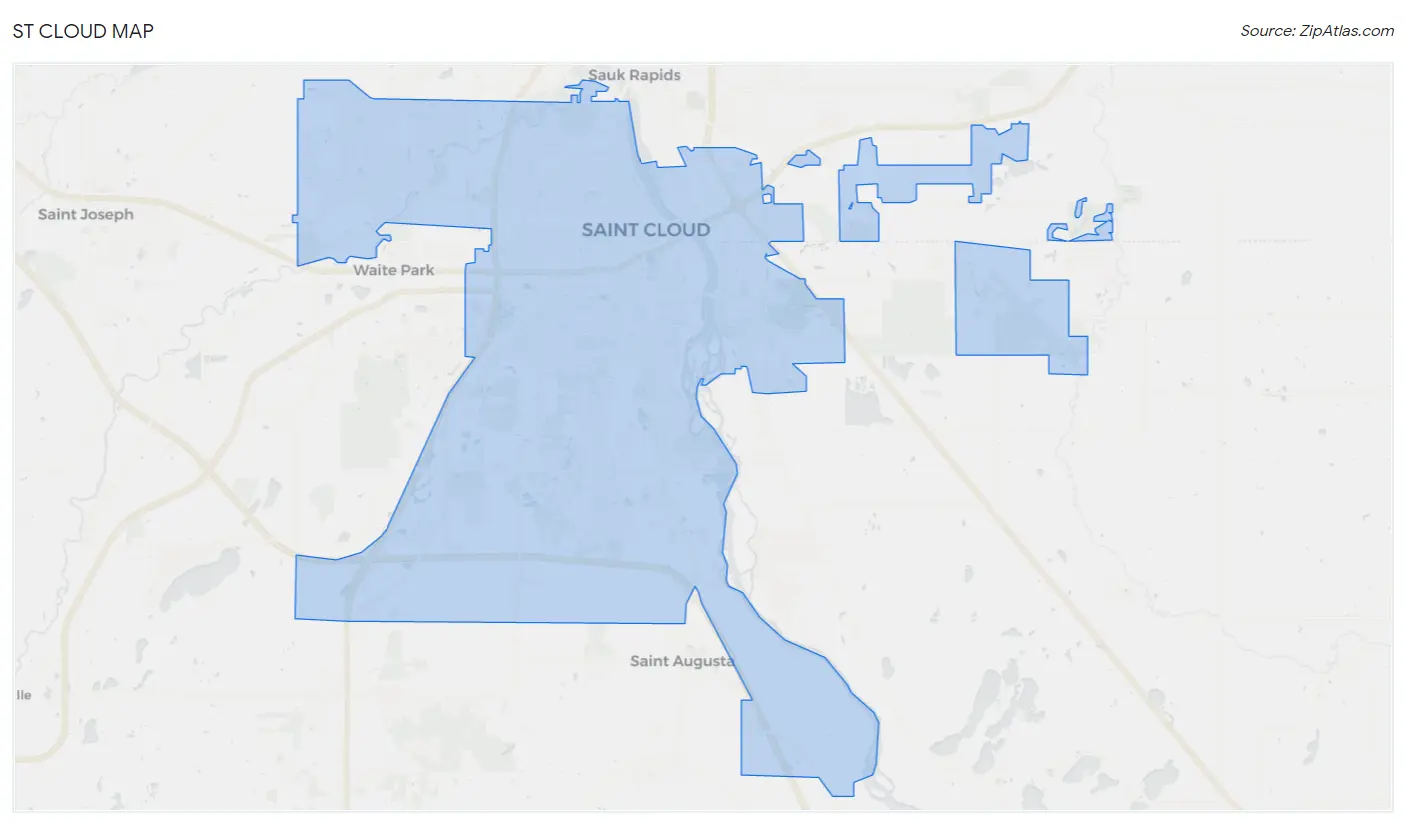
St Cloud Overview
$31,230
PER CAPITA INCOME
$76,384
AVG FAMILY INCOME
$58,910
AVG HOUSEHOLD INCOME
29.8%
WAGE / INCOME GAP [ % ]
70.2¢/ $1
WAGE / INCOME GAP [ $ ]
$8,328
FAMILY INCOME DEFICIT
0.44
INEQUALITY / GINI INDEX
68,910
TOTAL POPULATION
34,798
MALE POPULATION
34,112
FEMALE POPULATION
102.01
MALES / 100 FEMALES
98.03
FEMALES / 100 MALES
30.3
MEDIAN AGE
3.0
AVG FAMILY SIZE
2.4
AVG HOUSEHOLD SIZE
39,026
LABOR FORCE [ PEOPLE ]
70.3%
PERCENT IN LABOR FORCE
7.1%
UNEMPLOYMENT RATE
Income in St Cloud
Income Overview in St Cloud
Per Capita Income in St Cloud is $31,230, while median incomes of families and households are $76,384 and $58,910 respectively.
| Characteristic | Number | Measure |
| Per Capita Income | 68,910 | $31,230 |
| Median Family Income | 14,708 | $76,384 |
| Mean Family Income | 14,708 | $94,672 |
| Median Household Income | 27,453 | $58,910 |
| Mean Household Income | 27,453 | $76,026 |
| Income Deficit | 14,708 | $8,328 |
| Wage / Income Gap (%) | 68,910 | 29.75% |
| Wage / Income Gap ($) | 68,910 | 70.25¢ per $1 |
| Gini / Inequality Index | 68,910 | 0.44 |
Earnings by Sex in St Cloud
Average Earnings in St Cloud are $31,623, $36,239 for men and $25,457 for women, a difference of 29.7%.
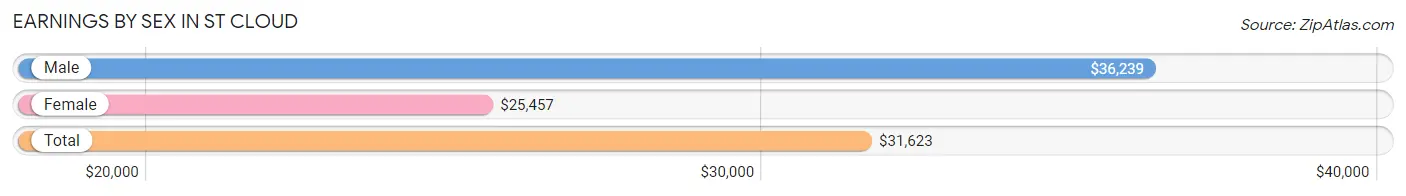
| Sex | Number | Average Earnings |
| Male | 21,348 (51.9%) | $36,239 |
| Female | 19,767 (48.1%) | $25,457 |
| Total | 41,115 (100.0%) | $31,623 |
Earnings by Sex by Income Bracket in St Cloud
The most common earnings brackets in St Cloud are $75,000 to $99,999 for men (1,950 | 9.1%) and $2,500 to $4,999 for women (1,545 | 7.8%).
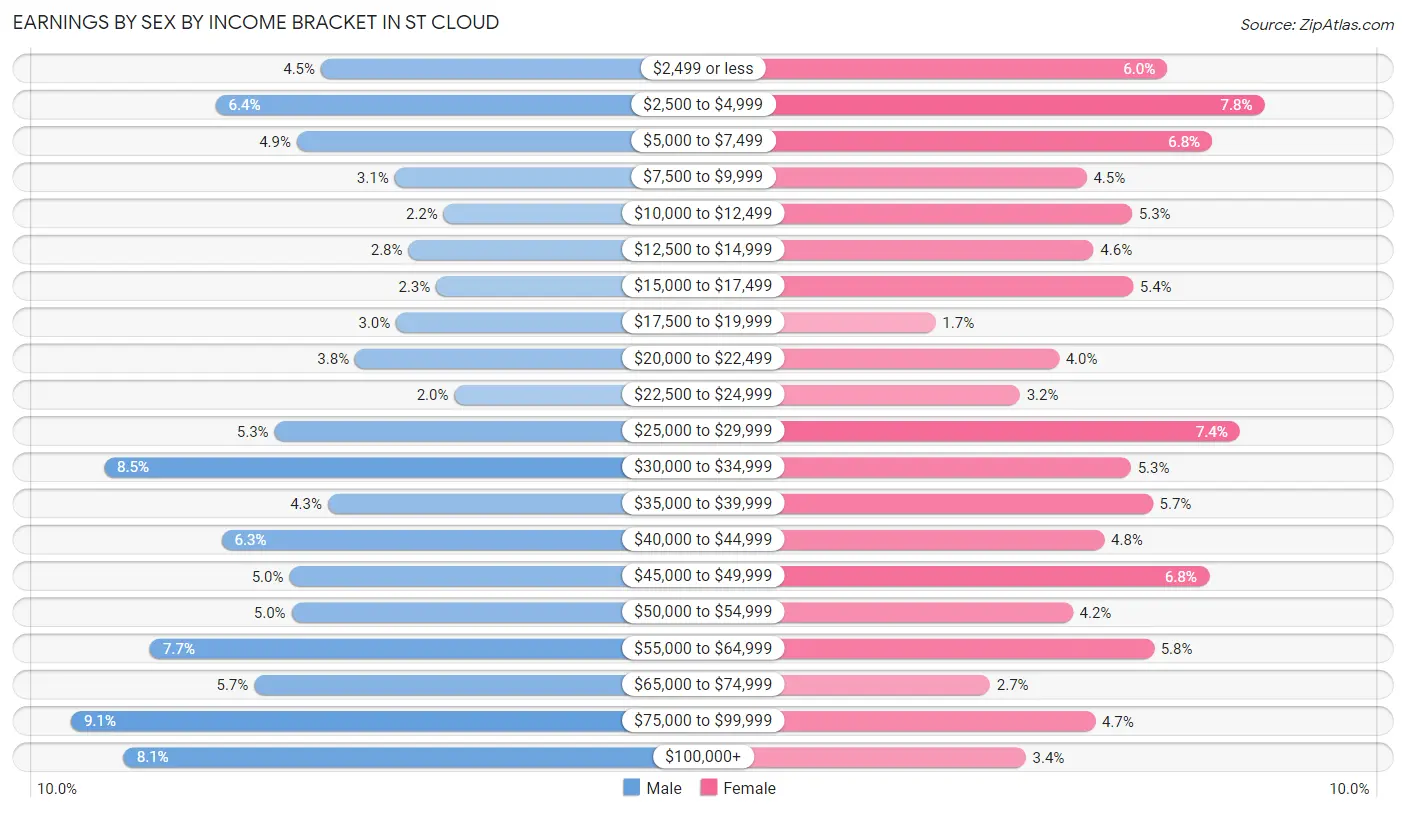
| Income | Male | Female |
| $2,499 or less | 950 (4.4%) | 1,186 (6.0%) |
| $2,500 to $4,999 | 1,370 (6.4%) | 1,545 (7.8%) |
| $5,000 to $7,499 | 1,045 (4.9%) | 1,352 (6.8%) |
| $7,500 to $9,999 | 655 (3.1%) | 888 (4.5%) |
| $10,000 to $12,499 | 459 (2.1%) | 1,055 (5.3%) |
| $12,500 to $14,999 | 600 (2.8%) | 914 (4.6%) |
| $15,000 to $17,499 | 488 (2.3%) | 1,059 (5.4%) |
| $17,500 to $19,999 | 648 (3.0%) | 328 (1.7%) |
| $20,000 to $22,499 | 813 (3.8%) | 785 (4.0%) |
| $22,500 to $24,999 | 417 (1.9%) | 640 (3.2%) |
| $25,000 to $29,999 | 1,136 (5.3%) | 1,454 (7.4%) |
| $30,000 to $34,999 | 1,817 (8.5%) | 1,052 (5.3%) |
| $35,000 to $39,999 | 922 (4.3%) | 1,132 (5.7%) |
| $40,000 to $44,999 | 1,346 (6.3%) | 952 (4.8%) |
| $45,000 to $49,999 | 1,077 (5.0%) | 1,340 (6.8%) |
| $50,000 to $54,999 | 1,067 (5.0%) | 836 (4.2%) |
| $55,000 to $64,999 | 1,634 (7.6%) | 1,137 (5.8%) |
| $65,000 to $74,999 | 1,217 (5.7%) | 530 (2.7%) |
| $75,000 to $99,999 | 1,950 (9.1%) | 919 (4.6%) |
| $100,000+ | 1,737 (8.1%) | 663 (3.4%) |
| Total | 21,348 (100.0%) | 19,767 (100.0%) |
Earnings by Sex by Educational Attainment in St Cloud
Average earnings in St Cloud are $47,710 for men and $35,158 for women, a difference of 26.3%. Men with an educational attainment of graduate degree enjoy the highest average annual earnings of $81,753, while those with less than high school education earn the least with $31,346. Women with an educational attainment of graduate degree earn the most with the average annual earnings of $62,188, while those with high school diploma education have the smallest earnings of $26,964.
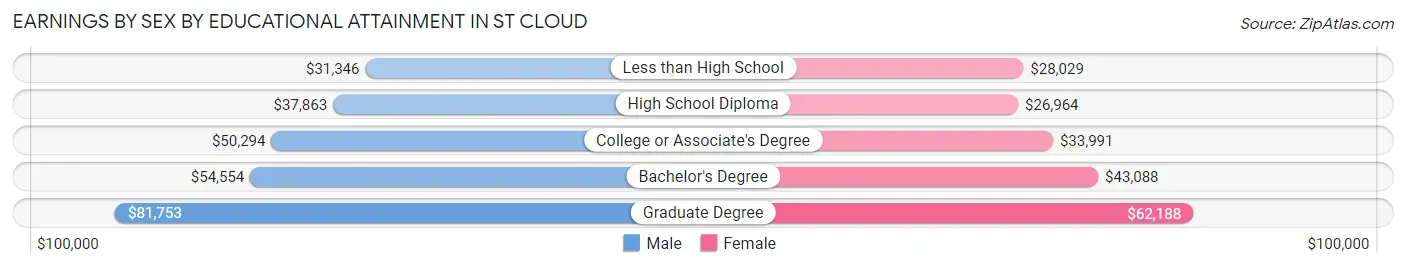
| Educational Attainment | Male Income | Female Income |
| Less than High School | $31,346 | $28,029 |
| High School Diploma | $37,863 | $26,964 |
| College or Associate's Degree | $50,294 | $33,991 |
| Bachelor's Degree | $54,554 | $43,088 |
| Graduate Degree | $81,753 | $62,188 |
| Total | $47,710 | $35,158 |
Family Income in St Cloud
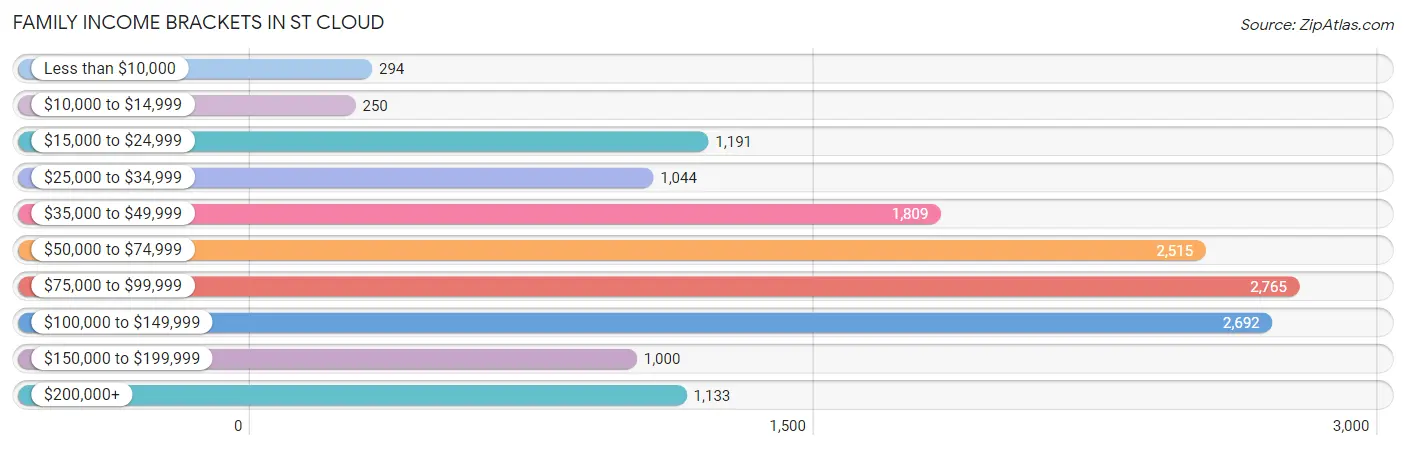
Family Income Brackets in St Cloud
According to the St Cloud family income data, there are 2,765 families falling into the $75,000 to $99,999 income range, which is the most common income bracket and makes up 18.8% of all families. Conversely, the $10,000 to $14,999 income bracket is the least frequent group with only 250 families (1.7%) belonging to this category.
| Income Bracket | # Families | % Families |
| Less than $10,000 | 294 | 2.0% |
| $10,000 to $14,999 | 250 | 1.7% |
| $15,000 to $24,999 | 1,191 | 8.1% |
| $25,000 to $34,999 | 1,044 | 7.1% |
| $35,000 to $49,999 | 1,809 | 12.3% |
| $50,000 to $74,999 | 2,515 | 17.1% |
| $75,000 to $99,999 | 2,765 | 18.8% |
| $100,000 to $149,999 | 2,692 | 18.3% |
| $150,000 to $199,999 | 1,000 | 6.8% |
| $200,000+ | 1,133 | 7.7% |
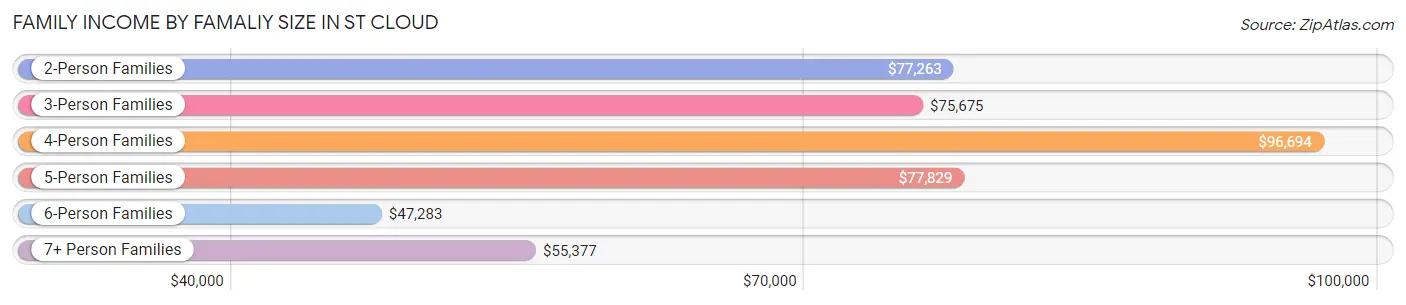
Family Income by Famaliy Size in St Cloud
4-person families (1,910 | 13.0%) account for the highest median family income in St Cloud with $96,694 per family, while 2-person families (6,956 | 47.3%) have the highest median income of $38,632 per family member.
| Income Bracket | # Families | Median Income |
| 2-Person Families | 6,956 (47.3%) | $77,263 |
| 3-Person Families | 3,421 (23.3%) | $75,675 |
| 4-Person Families | 1,910 (13.0%) | $96,694 |
| 5-Person Families | 1,156 (7.9%) | $77,829 |
| 6-Person Families | 478 (3.3%) | $47,283 |
| 7+ Person Families | 787 (5.3%) | $55,377 |
| Total | 14,708 (100.0%) | $76,384 |
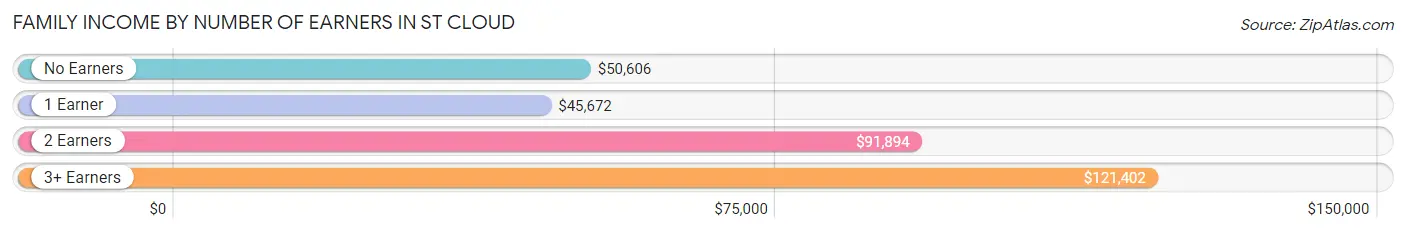
Family Income by Number of Earners in St Cloud
The median family income in St Cloud is $76,384, with families comprising 3+ earners (1,660) having the highest median family income of $121,402, while families with 1 earner (5,051) have the lowest median family income of $45,672, accounting for 11.3% and 34.3% of families, respectively.
| Number of Earners | # Families | Median Income |
| No Earners | 1,927 (13.1%) | $50,606 |
| 1 Earner | 5,051 (34.3%) | $45,672 |
| 2 Earners | 6,070 (41.3%) | $91,894 |
| 3+ Earners | 1,660 (11.3%) | $121,402 |
| Total | 14,708 (100.0%) | $76,384 |
Household Income in St Cloud
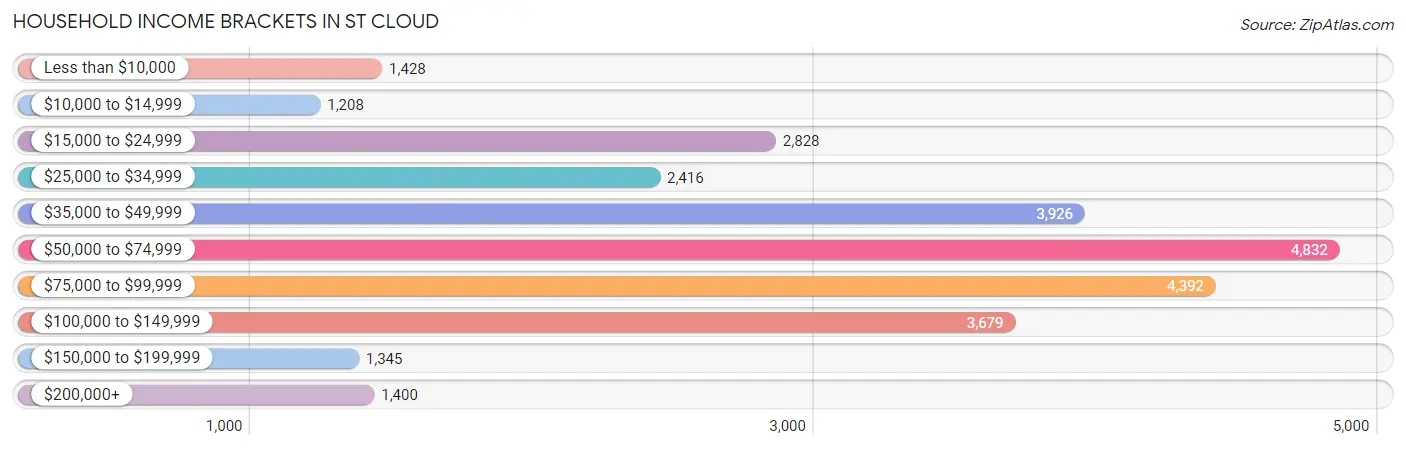
Household Income Brackets in St Cloud
With 4,832 households falling in the category, the $50,000 to $74,999 income range is the most frequent in St Cloud, accounting for 17.6% of all households. In contrast, only 1,208 households (4.4%) fall into the $10,000 to $14,999 income bracket, making it the least populous group.
| Income Bracket | # Households | % Households |
| Less than $10,000 | 1,428 | 5.2% |
| $10,000 to $14,999 | 1,208 | 4.4% |
| $15,000 to $24,999 | 2,828 | 10.3% |
| $25,000 to $34,999 | 2,416 | 8.8% |
| $35,000 to $49,999 | 3,926 | 14.3% |
| $50,000 to $74,999 | 4,832 | 17.6% |
| $75,000 to $99,999 | 4,392 | 16.0% |
| $100,000 to $149,999 | 3,679 | 13.4% |
| $150,000 to $199,999 | 1,345 | 4.9% |
| $200,000+ | 1,400 | 5.1% |
Household Income by Householder Age in St Cloud
The median household income in St Cloud is $58,910, with the highest median household income of $78,235 found in the 45 to 64 years age bracket for the primary householder. A total of 7,998 households (29.1%) fall into this category. Meanwhile, the 15 to 24 years age bracket for the primary householder has the lowest median household income of $40,063, with 4,075 households (14.8%) in this group.
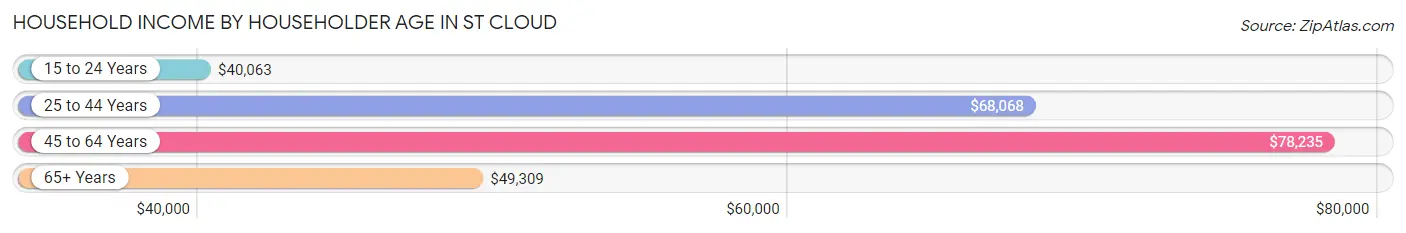
| Income Bracket | # Households | Median Income |
| 15 to 24 Years | 4,075 (14.8%) | $40,063 |
| 25 to 44 Years | 9,863 (35.9%) | $68,068 |
| 45 to 64 Years | 7,998 (29.1%) | $78,235 |
| 65+ Years | 5,517 (20.1%) | $49,309 |
| Total | 27,453 (100.0%) | $58,910 |
Poverty in St Cloud
Income Below Poverty by Sex and Age in St Cloud
With 17.2% poverty level for males and 22.4% for females among the residents of St Cloud, under 5 year old males and 18 to 24 year old females are the most vulnerable to poverty, with 724 males (33.9%) and 2,695 females (46.4%) in their respective age groups living below the poverty level.
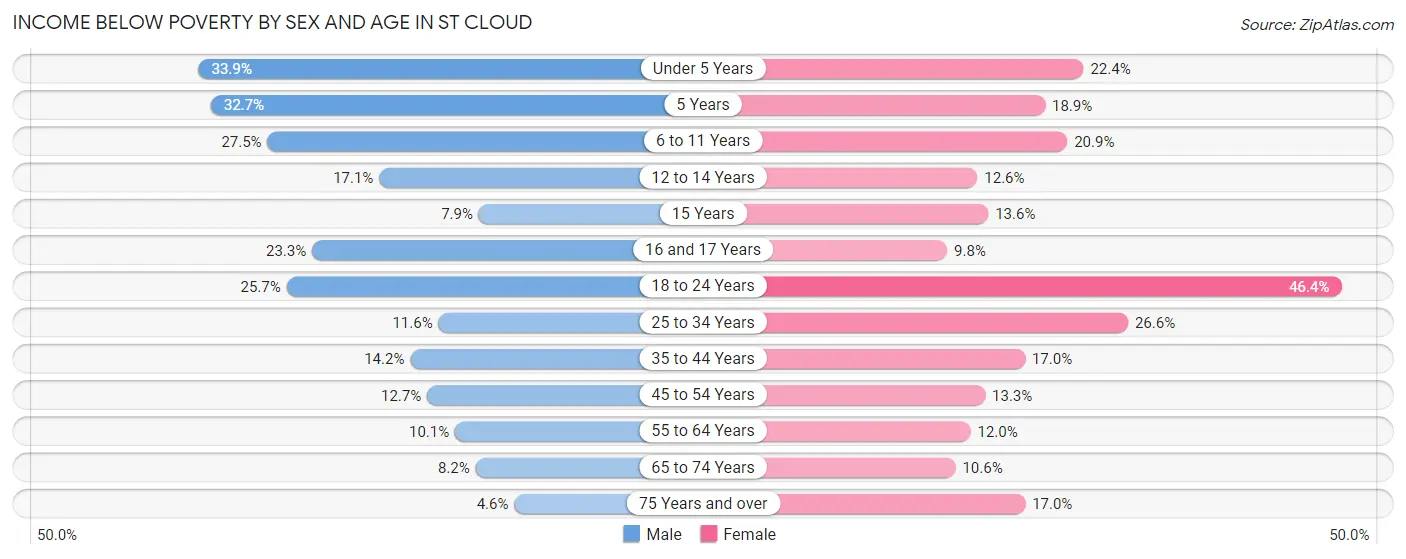
| Age Bracket | Male | Female |
| Under 5 Years | 724 (33.9%) | 490 (22.4%) |
| 5 Years | 89 (32.7%) | 73 (18.9%) |
| 6 to 11 Years | 724 (27.5%) | 491 (20.9%) |
| 12 to 14 Years | 196 (17.1%) | 181 (12.6%) |
| 15 Years | 31 (7.9%) | 53 (13.6%) |
| 16 and 17 Years | 132 (23.3%) | 75 (9.8%) |
| 18 to 24 Years | 1,533 (25.7%) | 2,695 (46.4%) |
| 25 to 34 Years | 620 (11.6%) | 1,218 (26.6%) |
| 35 to 44 Years | 601 (14.2%) | 576 (17.0%) |
| 45 to 54 Years | 395 (12.7%) | 443 (13.3%) |
| 55 to 64 Years | 334 (10.1%) | 398 (11.9%) |
| 65 to 74 Years | 197 (8.2%) | 288 (10.5%) |
| 75 Years and over | 53 (4.5%) | 356 (17.0%) |
| Total | 5,629 (17.2%) | 7,337 (22.4%) |
Income Above Poverty by Sex and Age in St Cloud
According to the poverty statistics in St Cloud, males aged 75 years and over and females aged 16 and 17 years are the age groups that are most secure financially, with 95.5% of males and 90.2% of females in these age groups living above the poverty line.
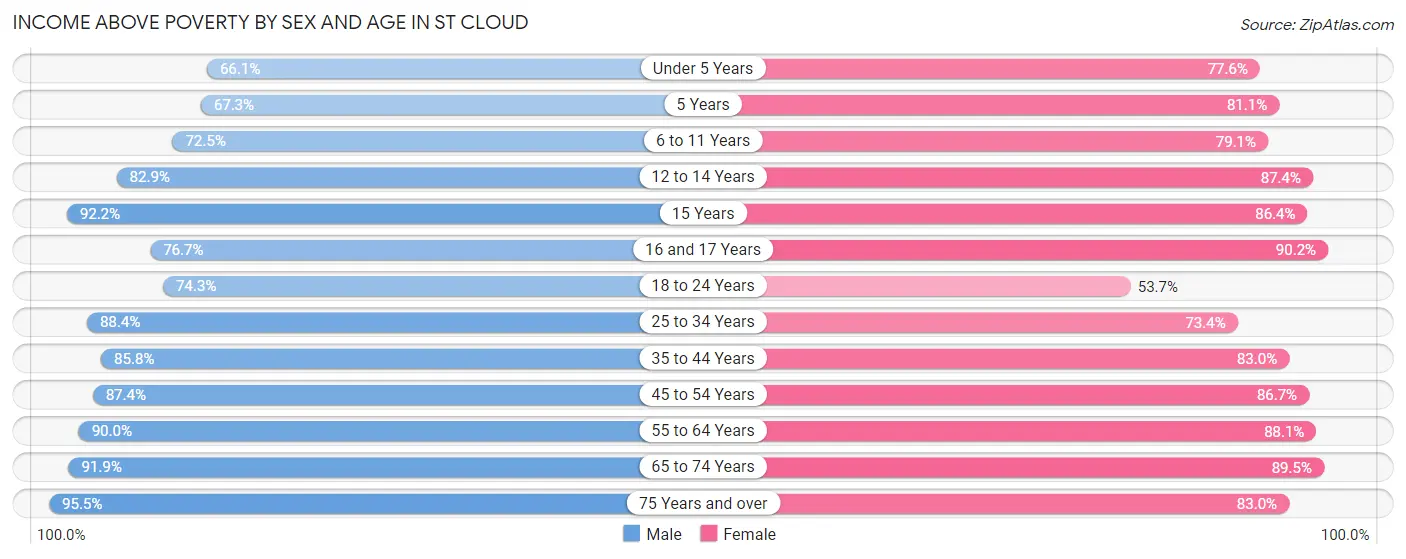
| Age Bracket | Male | Female |
| Under 5 Years | 1,414 (66.1%) | 1,695 (77.6%) |
| 5 Years | 183 (67.3%) | 314 (81.1%) |
| 6 to 11 Years | 1,913 (72.5%) | 1,856 (79.1%) |
| 12 to 14 Years | 951 (82.9%) | 1,258 (87.4%) |
| 15 Years | 364 (92.1%) | 337 (86.4%) |
| 16 and 17 Years | 434 (76.7%) | 692 (90.2%) |
| 18 to 24 Years | 4,435 (74.3%) | 3,119 (53.6%) |
| 25 to 34 Years | 4,729 (88.4%) | 3,367 (73.4%) |
| 35 to 44 Years | 3,627 (85.8%) | 2,813 (83.0%) |
| 45 to 54 Years | 2,727 (87.4%) | 2,888 (86.7%) |
| 55 to 64 Years | 2,989 (89.9%) | 2,933 (88.0%) |
| 65 to 74 Years | 2,220 (91.8%) | 2,442 (89.4%) |
| 75 Years and over | 1,111 (95.5%) | 1,736 (83.0%) |
| Total | 27,097 (82.8%) | 25,450 (77.6%) |
Income Below Poverty Among Married-Couple Families in St Cloud
The poverty statistics for married-couple families in St Cloud show that 6.4% or 615 of the total 9,548 families live below the poverty line. Families with 5 or more children have the highest poverty rate of 54.5%, comprising of 272 families. On the other hand, families with no children have the lowest poverty rate of 2.2%, which includes 121 families.
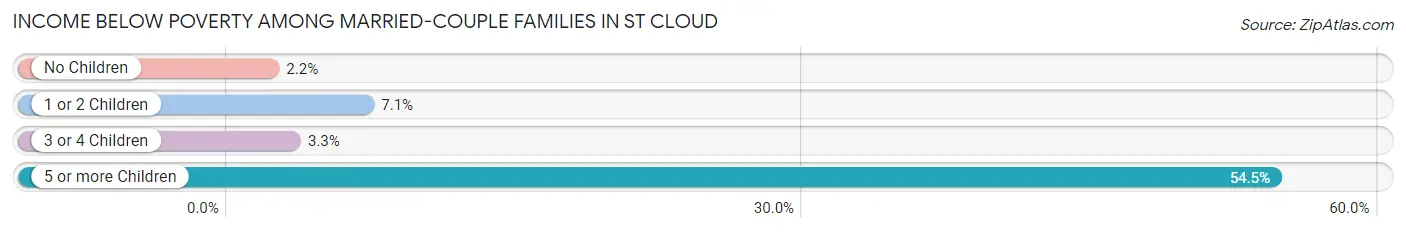
| Children | Above Poverty | Below Poverty |
| No Children | 5,468 (97.8%) | 121 (2.2%) |
| 1 or 2 Children | 2,621 (92.9%) | 201 (7.1%) |
| 3 or 4 Children | 617 (96.7%) | 21 (3.3%) |
| 5 or more Children | 227 (45.5%) | 272 (54.5%) |
| Total | 8,933 (93.6%) | 615 (6.4%) |
Income Below Poverty Among Single-Parent Households in St Cloud
According to the poverty data in St Cloud, 8.1% or 132 single-father households and 34.3% or 1,215 single-mother households are living below the poverty line. Among single-father households, those with no children have the highest poverty rate, with 84 households (13.7%) experiencing poverty. Likewise, among single-mother households, those with 5 or more children have the highest poverty rate, with 98 households (100.0%) falling below the poverty line.
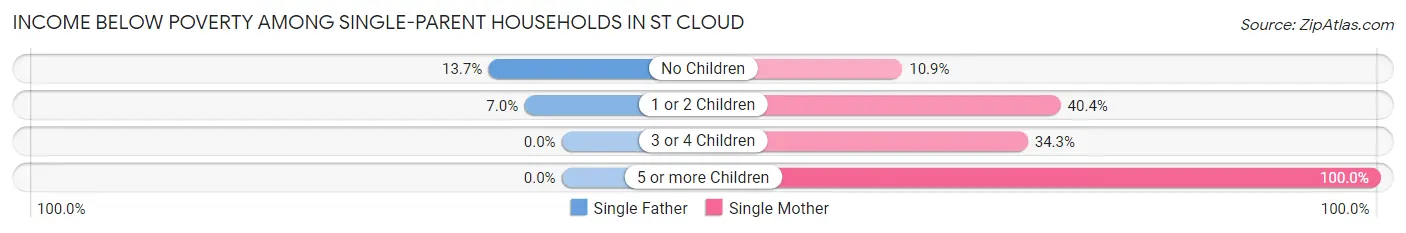
| Children | Single Father | Single Mother |
| No Children | 84 (13.7%) | 88 (10.9%) |
| 1 or 2 Children | 48 (7.0%) | 827 (40.4%) |
| 3 or 4 Children | 0 (0.0%) | 202 (34.3%) |
| 5 or more Children | 0 (0.0%) | 98 (100.0%) |
| Total | 132 (8.1%) | 1,215 (34.3%) |
Income Below Poverty Among Married-Couple vs Single-Parent Households in St Cloud
The poverty data for St Cloud shows that 615 of the married-couple family households (6.4%) and 1,347 of the single-parent households (26.1%) are living below the poverty level. Within the married-couple family households, those with 5 or more children have the highest poverty rate, with 272 households (54.5%) falling below the poverty line. Among the single-parent households, those with 5 or more children have the highest poverty rate, with 98 household (46.0%) living below poverty.
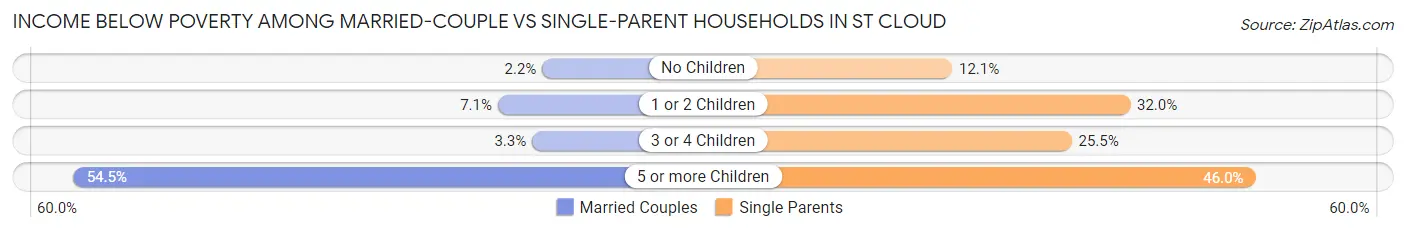
| Children | Married-Couple Families | Single-Parent Households |
| No Children | 121 (2.2%) | 172 (12.1%) |
| 1 or 2 Children | 201 (7.1%) | 875 (32.0%) |
| 3 or 4 Children | 21 (3.3%) | 202 (25.5%) |
| 5 or more Children | 272 (54.5%) | 98 (46.0%) |
| Total | 615 (6.4%) | 1,347 (26.1%) |
Race in St Cloud
The most populous races in St Cloud are White / Caucasian (48,061 | 69.7%), Black / African American (12,522 | 18.2%), and Two or more Races (4,075 | 5.9%).
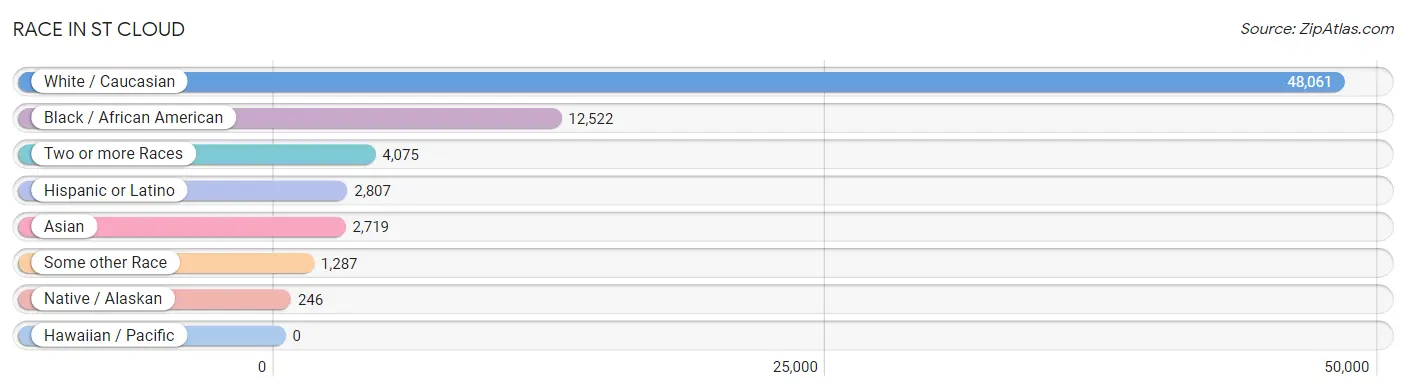
| Race | # Population | % Population |
| Asian | 2,719 | 4.0% |
| Black / African American | 12,522 | 18.2% |
| Hawaiian / Pacific | 0 | 0.0% |
| Hispanic or Latino | 2,807 | 4.1% |
| Native / Alaskan | 246 | 0.4% |
| White / Caucasian | 48,061 | 69.7% |
| Two or more Races | 4,075 | 5.9% |
| Some other Race | 1,287 | 1.9% |
| Total | 68,910 | 100.0% |
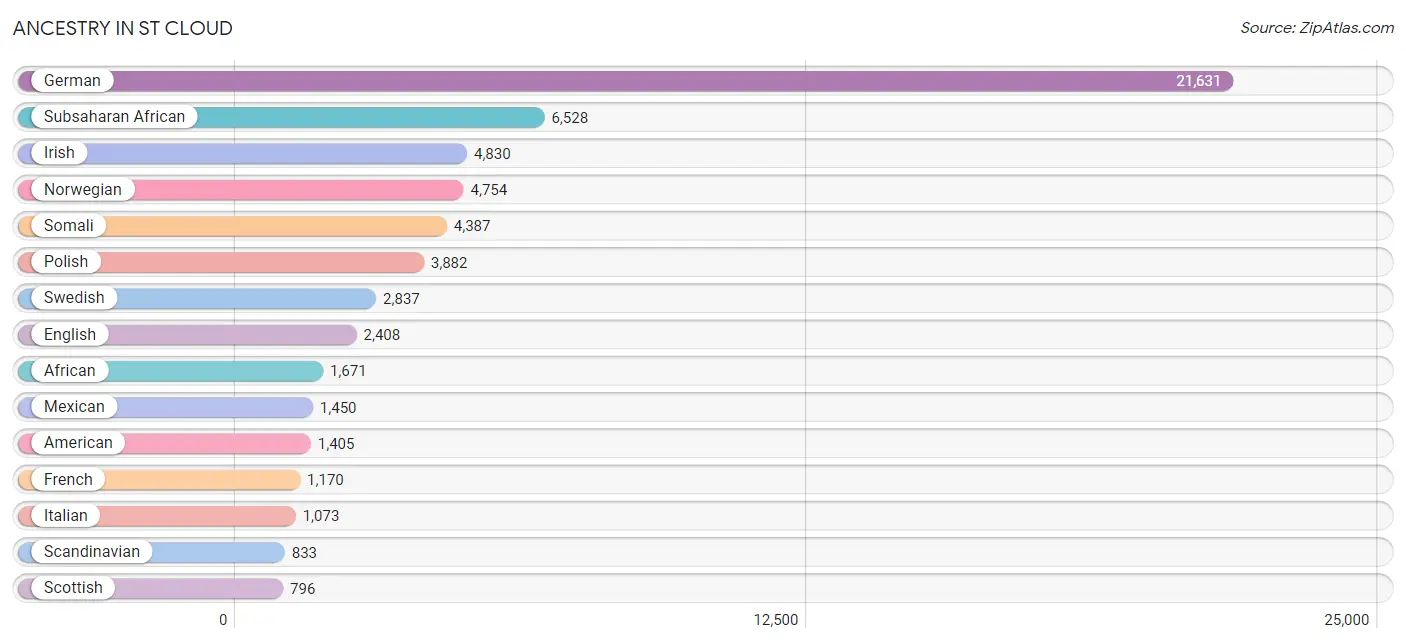
Ancestry in St Cloud
The most populous ancestries reported in St Cloud are German (21,631 | 31.4%), Subsaharan African (6,528 | 9.5%), Irish (4,830 | 7.0%), Norwegian (4,754 | 6.9%), and Somali (4,387 | 6.4%), together accounting for 61.1% of all St Cloud residents.
| Ancestry | # Population | % Population |
| African | 1,671 | 2.4% |
| Albanian | 26 | 0.0% |
| Alsatian | 9 | 0.0% |
| American | 1,405 | 2.0% |
| Arab | 276 | 0.4% |
| Argentinean | 13 | 0.0% |
| Australian | 11 | 0.0% |
| Austrian | 119 | 0.2% |
| Bahamian | 3 | 0.0% |
| Bangladeshi | 457 | 0.7% |
| Belgian | 92 | 0.1% |
| Bhutanese | 44 | 0.1% |
| Blackfeet | 20 | 0.0% |
| Bolivian | 13 | 0.0% |
| British | 93 | 0.1% |
| Bulgarian | 34 | 0.1% |
| Burmese | 311 | 0.4% |
| Canadian | 92 | 0.1% |
| Cape Verdean | 54 | 0.1% |
| Celtic | 4 | 0.0% |
| Central American | 174 | 0.3% |
| Central American Indian | 65 | 0.1% |
| Cherokee | 104 | 0.2% |
| Chippewa | 573 | 0.8% |
| Choctaw | 13 | 0.0% |
| Colombian | 102 | 0.2% |
| Costa Rican | 49 | 0.1% |
| Cree | 7 | 0.0% |
| Croatian | 58 | 0.1% |
| Cuban | 277 | 0.4% |
| Czech | 486 | 0.7% |
| Czechoslovakian | 25 | 0.0% |
| Danish | 385 | 0.6% |
| Dominican | 28 | 0.0% |
| Dutch | 706 | 1.0% |
| Dutch West Indian | 5 | 0.0% |
| Eastern European | 82 | 0.1% |
| Ecuadorian | 105 | 0.2% |
| Egyptian | 4 | 0.0% |
| English | 2,408 | 3.5% |
| Ethiopian | 31 | 0.0% |
| European | 695 | 1.0% |
| Filipino | 17 | 0.0% |
| Finnish | 540 | 0.8% |
| French | 1,170 | 1.7% |
| French American Indian | 2 | 0.0% |
| French Canadian | 459 | 0.7% |
| German | 21,631 | 31.4% |
| Ghanaian | 7 | 0.0% |
| Greek | 144 | 0.2% |
| Guamanian / Chamorro | 4 | 0.0% |
| Guatemalan | 84 | 0.1% |
| Haitian | 13 | 0.0% |
| Honduran | 30 | 0.0% |
| Hungarian | 125 | 0.2% |
| Indian (Asian) | 550 | 0.8% |
| Iranian | 47 | 0.1% |
| Irish | 4,830 | 7.0% |
| Iroquois | 72 | 0.1% |
| Italian | 1,073 | 1.6% |
| Jamaican | 21 | 0.0% |
| Japanese | 136 | 0.2% |
| Kenyan | 99 | 0.1% |
| Korean | 140 | 0.2% |
| Latvian | 23 | 0.0% |
| Lebanese | 35 | 0.1% |
| Liberian | 50 | 0.1% |
| Lithuanian | 57 | 0.1% |
| Luxembourger | 39 | 0.1% |
| Malaysian | 504 | 0.7% |
| Mexican | 1,450 | 2.1% |
| Mexican American Indian | 7 | 0.0% |
| Moroccan | 3 | 0.0% |
| Native Hawaiian | 12 | 0.0% |
| Nicaraguan | 4 | 0.0% |
| Nigerian | 147 | 0.2% |
| Northern European | 98 | 0.1% |
| Norwegian | 4,754 | 6.9% |
| Pakistani | 70 | 0.1% |
| Pennsylvania German | 7 | 0.0% |
| Peruvian | 15 | 0.0% |
| Polish | 3,882 | 5.6% |
| Portuguese | 11 | 0.0% |
| Puerto Rican | 475 | 0.7% |
| Romanian | 50 | 0.1% |
| Russian | 60 | 0.1% |
| Salvadoran | 7 | 0.0% |
| Scandinavian | 833 | 1.2% |
| Scotch-Irish | 185 | 0.3% |
| Scottish | 796 | 1.2% |
| Senegalese | 5 | 0.0% |
| Sioux | 58 | 0.1% |
| Slovak | 35 | 0.1% |
| Slovene | 91 | 0.1% |
| Somali | 4,387 | 6.4% |
| South American | 248 | 0.4% |
| Spaniard | 15 | 0.0% |
| Sri Lankan | 566 | 0.8% |
| Subsaharan African | 6,528 | 9.5% |
| Sudanese | 32 | 0.1% |
| Swedish | 2,837 | 4.1% |
| Swiss | 187 | 0.3% |
| Syrian | 4 | 0.0% |
| Thai | 327 | 0.5% |
| Trinidadian and Tobagonian | 10 | 0.0% |
| Ugandan | 4 | 0.0% |
| Ukrainian | 71 | 0.1% |
| Vietnamese | 56 | 0.1% |
| Welsh | 317 | 0.5% |
| West Indian | 10 | 0.0% |
| Yugoslavian | 196 | 0.3% | View All 111 Rows |
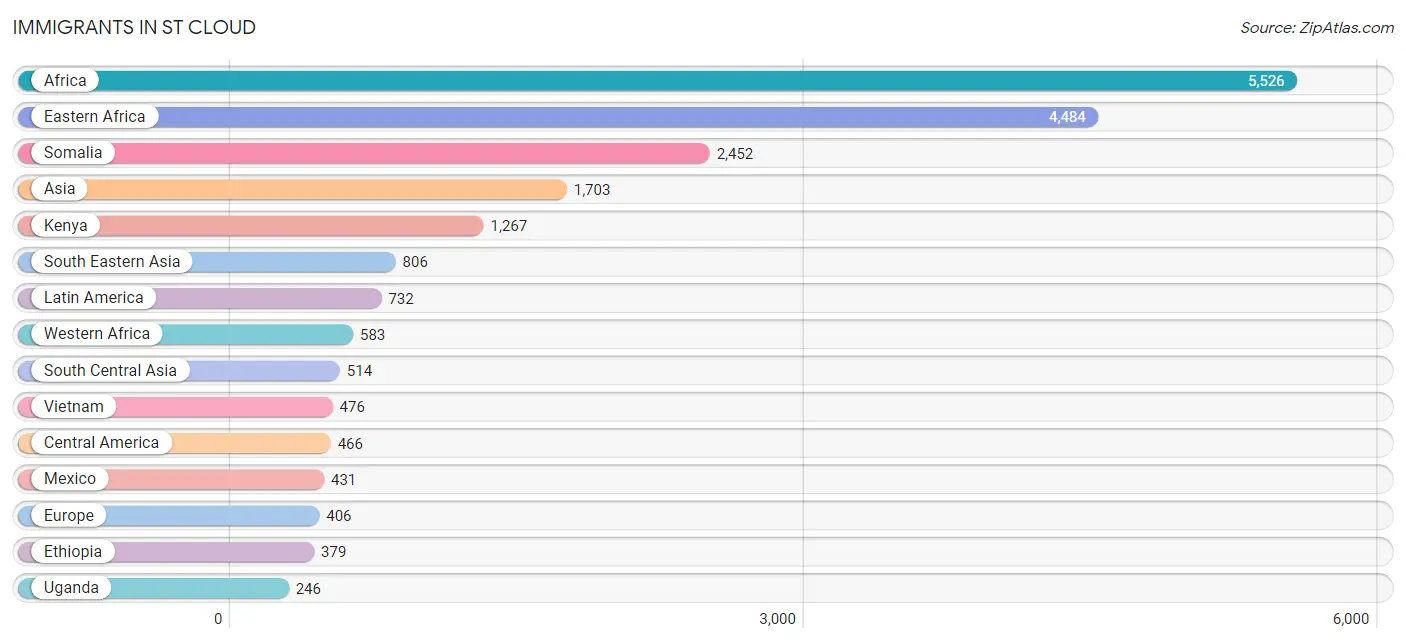
Immigrants in St Cloud
The most numerous immigrant groups reported in St Cloud came from Africa (5,526 | 8.0%), Eastern Africa (4,484 | 6.5%), Somalia (2,452 | 3.6%), Asia (1,703 | 2.5%), and Kenya (1,267 | 1.8%), together accounting for 22.4% of all St Cloud residents.
| Immigration Origin | # Population | % Population |
| Africa | 5,526 | 8.0% |
| Albania | 9 | 0.0% |
| Asia | 1,703 | 2.5% |
| Australia | 14 | 0.0% |
| Bahamas | 13 | 0.0% |
| Bangladesh | 9 | 0.0% |
| Bolivia | 13 | 0.0% |
| Bosnia and Herzegovina | 59 | 0.1% |
| Brazil | 71 | 0.1% |
| Bulgaria | 34 | 0.1% |
| Cambodia | 11 | 0.0% |
| Canada | 116 | 0.2% |
| Caribbean | 63 | 0.1% |
| Central America | 466 | 0.7% |
| China | 111 | 0.2% |
| Colombia | 56 | 0.1% |
| Congo | 44 | 0.1% |
| Croatia | 40 | 0.1% |
| Cuba | 25 | 0.0% |
| Eastern Africa | 4,484 | 6.5% |
| Eastern Asia | 219 | 0.3% |
| Eastern Europe | 238 | 0.4% |
| Ecuador | 60 | 0.1% |
| El Salvador | 11 | 0.0% |
| England | 22 | 0.0% |
| Ethiopia | 379 | 0.5% |
| Europe | 406 | 0.6% |
| France | 44 | 0.1% |
| Germany | 66 | 0.1% |
| Guatemala | 13 | 0.0% |
| Haiti | 13 | 0.0% |
| Honduras | 7 | 0.0% |
| Hungary | 7 | 0.0% |
| India | 127 | 0.2% |
| Iran | 47 | 0.1% |
| Jamaica | 12 | 0.0% |
| Japan | 9 | 0.0% |
| Kenya | 1,267 | 1.8% |
| Korea | 99 | 0.1% |
| Kuwait | 61 | 0.1% |
| Laos | 192 | 0.3% |
| Latin America | 732 | 1.1% |
| Liberia | 12 | 0.0% |
| Lithuania | 4 | 0.0% |
| Mexico | 431 | 0.6% |
| Middle Africa | 81 | 0.1% |
| Moldova | 9 | 0.0% |
| Nepal | 158 | 0.2% |
| Netherlands | 17 | 0.0% |
| Nicaragua | 4 | 0.0% |
| Nigeria | 239 | 0.4% |
| Northern Africa | 44 | 0.1% |
| Northern Europe | 41 | 0.1% |
| Oceania | 14 | 0.0% |
| Pakistan | 138 | 0.2% |
| Philippines | 55 | 0.1% |
| Russia | 76 | 0.1% |
| Saudi Arabia | 95 | 0.1% |
| Scotland | 11 | 0.0% |
| Senegal | 92 | 0.1% |
| Somalia | 2,452 | 3.6% |
| South America | 203 | 0.3% |
| South Central Asia | 514 | 0.7% |
| South Eastern Asia | 806 | 1.2% |
| Sri Lanka | 35 | 0.1% |
| Sudan | 44 | 0.1% |
| Taiwan | 17 | 0.0% |
| Thailand | 72 | 0.1% |
| Uganda | 246 | 0.4% |
| Vietnam | 476 | 0.7% |
| Western Africa | 583 | 0.9% |
| Western Asia | 164 | 0.2% |
| Western Europe | 127 | 0.2% |
| Zaire | 37 | 0.1% |
| Zimbabwe | 10 | 0.0% | View All 75 Rows |
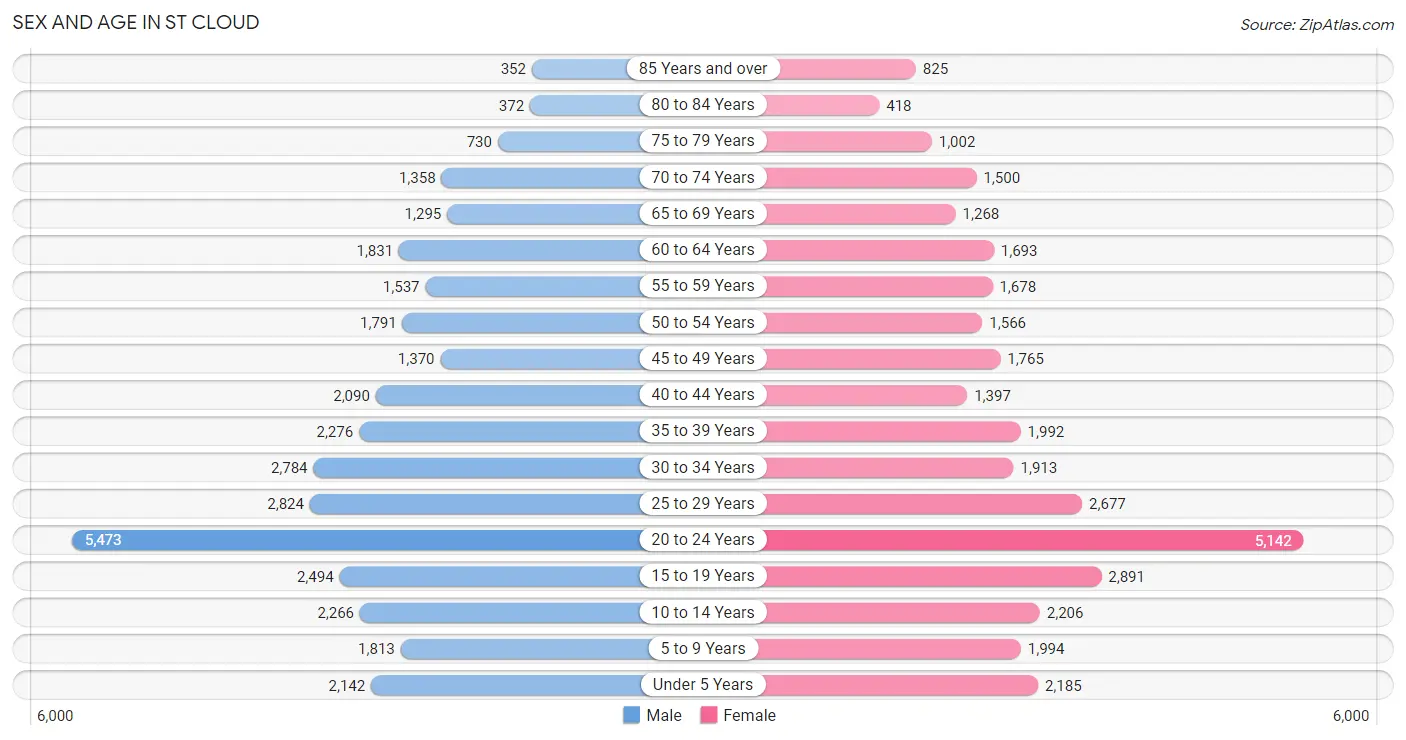
Sex and Age in St Cloud
Sex and Age in St Cloud
The most populous age groups in St Cloud are 20 to 24 Years (5,473 | 15.7%) for men and 20 to 24 Years (5,142 | 15.1%) for women.
| Age Bracket | Male | Female |
| Under 5 Years | 2,142 (6.2%) | 2,185 (6.4%) |
| 5 to 9 Years | 1,813 (5.2%) | 1,994 (5.9%) |
| 10 to 14 Years | 2,266 (6.5%) | 2,206 (6.5%) |
| 15 to 19 Years | 2,494 (7.2%) | 2,891 (8.5%) |
| 20 to 24 Years | 5,473 (15.7%) | 5,142 (15.1%) |
| 25 to 29 Years | 2,824 (8.1%) | 2,677 (7.9%) |
| 30 to 34 Years | 2,784 (8.0%) | 1,913 (5.6%) |
| 35 to 39 Years | 2,276 (6.5%) | 1,992 (5.8%) |
| 40 to 44 Years | 2,090 (6.0%) | 1,397 (4.1%) |
| 45 to 49 Years | 1,370 (3.9%) | 1,765 (5.2%) |
| 50 to 54 Years | 1,791 (5.1%) | 1,566 (4.6%) |
| 55 to 59 Years | 1,537 (4.4%) | 1,678 (4.9%) |
| 60 to 64 Years | 1,831 (5.3%) | 1,693 (5.0%) |
| 65 to 69 Years | 1,295 (3.7%) | 1,268 (3.7%) |
| 70 to 74 Years | 1,358 (3.9%) | 1,500 (4.4%) |
| 75 to 79 Years | 730 (2.1%) | 1,002 (2.9%) |
| 80 to 84 Years | 372 (1.1%) | 418 (1.2%) |
| 85 Years and over | 352 (1.0%) | 825 (2.4%) |
| Total | 34,798 (100.0%) | 34,112 (100.0%) |
Families and Households in St Cloud
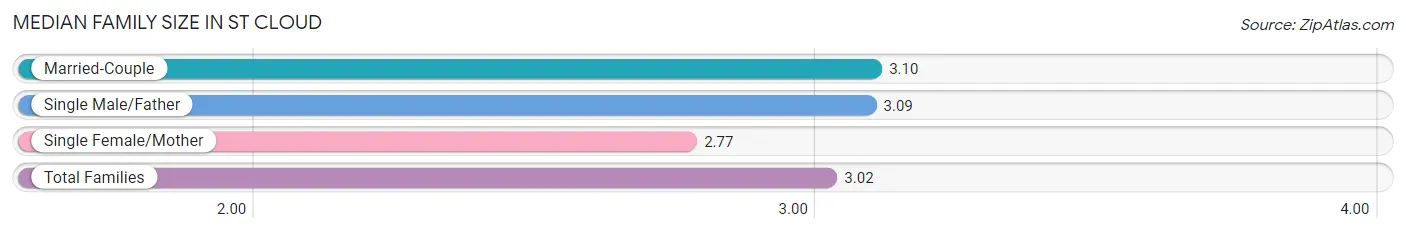
Median Family Size in St Cloud
The median family size in St Cloud is 3.02 persons per family, with married-couple families (9,548 | 64.9%) accounting for the largest median family size of 3.1 persons per family. On the other hand, single female/mother families (3,539 | 24.1%) represent the smallest median family size with 2.77 persons per family.
| Family Type | # Families | Family Size |
| Married-Couple | 9,548 (64.9%) | 3.10 |
| Single Male/Father | 1,621 (11.0%) | 3.09 |
| Single Female/Mother | 3,539 (24.1%) | 2.77 |
| Total Families | 14,708 (100.0%) | 3.02 |
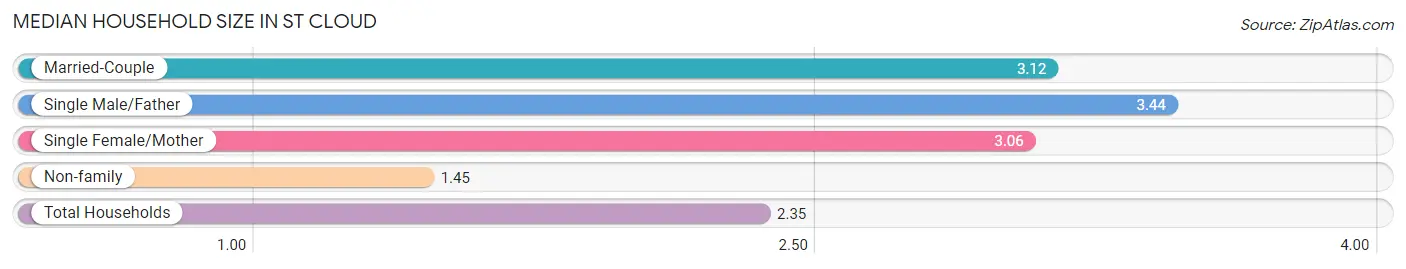
Median Household Size in St Cloud
The median household size in St Cloud is 2.35 persons per household, with single male/father households (1,621 | 5.9%) accounting for the largest median household size of 3.44 persons per household. non-family households (12,745 | 46.4%) represent the smallest median household size with 1.45 persons per household.
| Household Type | # Households | Household Size |
| Married-Couple | 9,548 (34.8%) | 3.12 |
| Single Male/Father | 1,621 (5.9%) | 3.44 |
| Single Female/Mother | 3,539 (12.9%) | 3.06 |
| Non-family | 12,745 (46.4%) | 1.45 |
| Total Households | 27,453 (100.0%) | 2.35 |
Household Size by Marriage Status in St Cloud
Out of a total of 27,453 households in St Cloud, 14,708 (53.6%) are family households, while 12,745 (46.4%) are nonfamily households. The most numerous type of family households are 2-person households, comprising 6,270, and the most common type of nonfamily households are 1-person households, comprising 8,991.
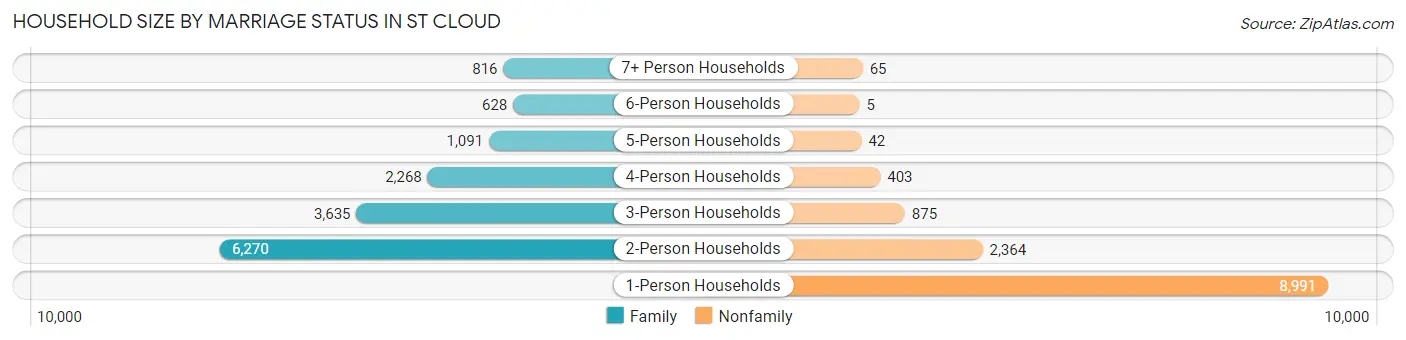
| Household Size | Family Households | Nonfamily Households |
| 1-Person Households | - | 8,991 (32.8%) |
| 2-Person Households | 6,270 (22.8%) | 2,364 (8.6%) |
| 3-Person Households | 3,635 (13.2%) | 875 (3.2%) |
| 4-Person Households | 2,268 (8.3%) | 403 (1.5%) |
| 5-Person Households | 1,091 (4.0%) | 42 (0.2%) |
| 6-Person Households | 628 (2.3%) | 5 (0.0%) |
| 7+ Person Households | 816 (3.0%) | 65 (0.2%) |
| Total | 14,708 (53.6%) | 12,745 (46.4%) |
Female Fertility in St Cloud
Fertility by Age in St Cloud
Average fertility rate in St Cloud is 59.0 births per 1,000 women. Women in the age bracket of 20 to 34 years have the highest fertility rate with 97.0 births per 1,000 women. Women in the age bracket of 20 to 34 years acount for 88.3% of all women with births.
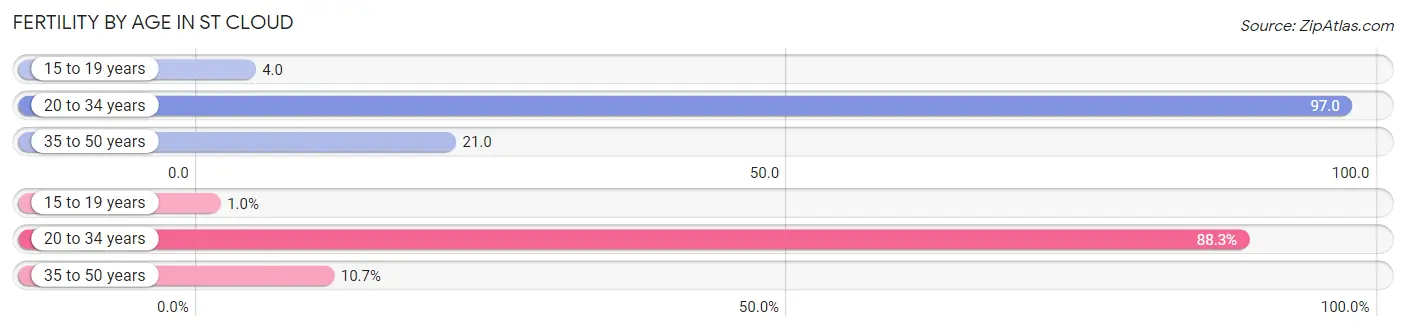
| Age Bracket | Women with Births | Births / 1,000 Women |
| 15 to 19 years | 11 (1.0%) | 4.0 |
| 20 to 34 years | 943 (88.3%) | 97.0 |
| 35 to 50 years | 114 (10.7%) | 21.0 |
| Total | 1,068 (100.0%) | 59.0 |
Fertility by Age by Marriage Status in St Cloud
55.6% of women with births (1,068) in St Cloud are married. The highest percentage of unmarried women with births falls into 15 to 19 years age bracket with 100.0% of them unmarried at the time of birth, while the lowest percentage of unmarried women with births belong to 35 to 50 years age bracket with 4.4% of them unmarried.
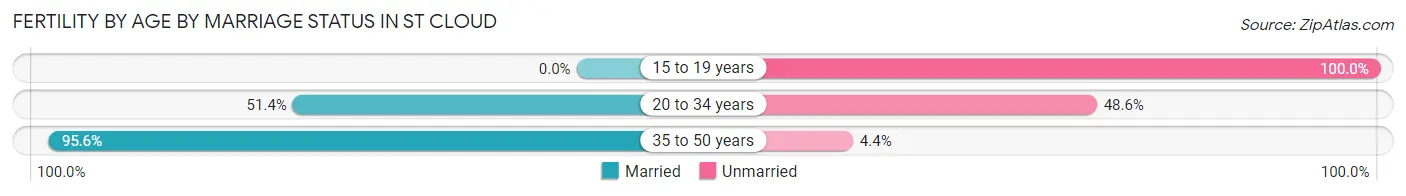
| Age Bracket | Married | Unmarried |
| 15 to 19 years | 0 (0.0%) | 11 (100.0%) |
| 20 to 34 years | 485 (51.4%) | 458 (48.6%) |
| 35 to 50 years | 109 (95.6%) | 5 (4.4%) |
| Total | 594 (55.6%) | 474 (44.4%) |
Fertility by Education in St Cloud
Average fertility rate in St Cloud is 59.0 births per 1,000 women. Women with the education attainment of less than high school have the highest fertility rate of 89.0 births per 1,000 women, while women with the education attainment of high school diploma have the lowest fertility at 22.0 births per 1,000 women. Women with the education attainment of college or associate's degree represent 42.1% of all women with births.
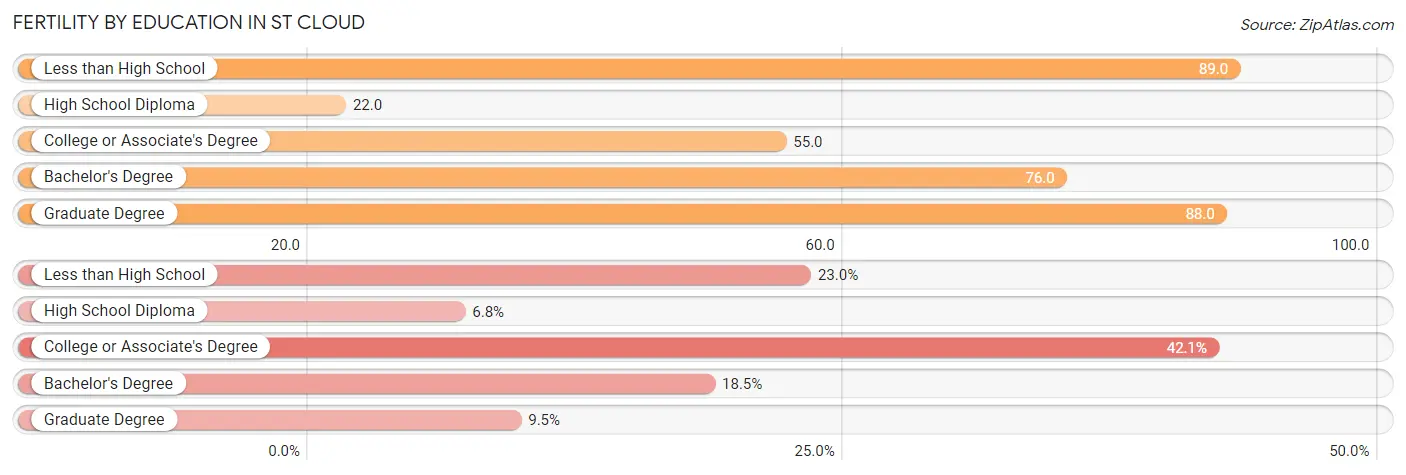
| Educational Attainment | Women with Births | Births / 1,000 Women |
| Less than High School | 246 (23.0%) | 89.0 |
| High School Diploma | 73 (6.8%) | 22.0 |
| College or Associate's Degree | 450 (42.1%) | 55.0 |
| Bachelor's Degree | 198 (18.5%) | 76.0 |
| Graduate Degree | 101 (9.5%) | 88.0 |
| Total | 1,068 (100.0%) | 59.0 |
Fertility by Education by Marriage Status in St Cloud
44.4% of women with births in St Cloud are unmarried. Women with the educational attainment of graduate degree are most likely to be married with 100.0% of them married at childbirth, while women with the educational attainment of high school diploma are least likely to be married with 83.6% of them unmarried at childbirth.
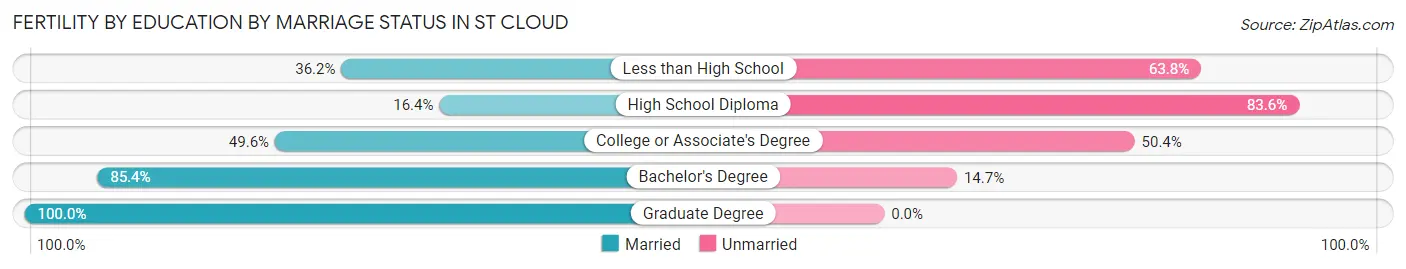
| Educational Attainment | Married | Unmarried |
| Less than High School | 89 (36.2%) | 157 (63.8%) |
| High School Diploma | 12 (16.4%) | 61 (83.6%) |
| College or Associate's Degree | 223 (49.6%) | 227 (50.4%) |
| Bachelor's Degree | 169 (85.4%) | 29 (14.6%) |
| Graduate Degree | 101 (100.0%) | 0 (0.0%) |
| Total | 594 (55.6%) | 474 (44.4%) |
Employment Characteristics in St Cloud
Employment by Class of Employer in St Cloud
Among the 35,046 employed individuals in St Cloud, private company employees (23,364 | 66.7%), not-for-profit organizations (5,380 | 15.3%), and local government employees (2,015 | 5.8%) make up the most common classes of employment.
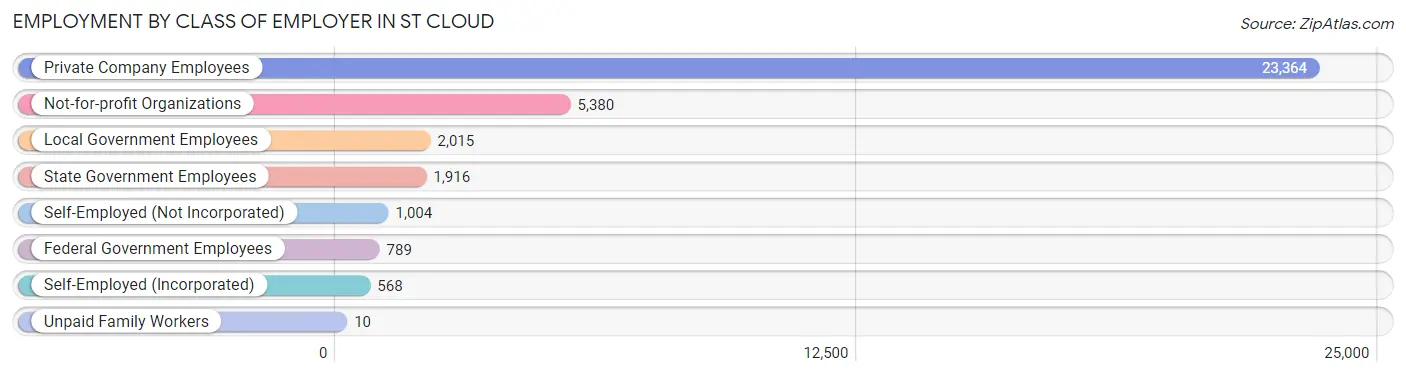
| Employer Class | # Employees | % Employees |
| Private Company Employees | 23,364 | 66.7% |
| Self-Employed (Incorporated) | 568 | 1.6% |
| Self-Employed (Not Incorporated) | 1,004 | 2.9% |
| Not-for-profit Organizations | 5,380 | 15.3% |
| Local Government Employees | 2,015 | 5.8% |
| State Government Employees | 1,916 | 5.5% |
| Federal Government Employees | 789 | 2.2% |
| Unpaid Family Workers | 10 | 0.0% |
| Total | 35,046 | 100.0% |
Employment Status by Age in St Cloud
According to the labor force statistics for St Cloud, out of the total population over 16 years of age (55,514), 70.3% or 39,026 individuals are in the labor force, with 7.1% or 2,771 of them unemployed. The age group with the highest labor force participation rate is 30 to 34 years, with 87.7% or 4,119 individuals in the labor force. Within the labor force, the 16 to 19 years age range has the highest percentage of unemployed individuals, with 13.4% or 390 of them being unemployed.
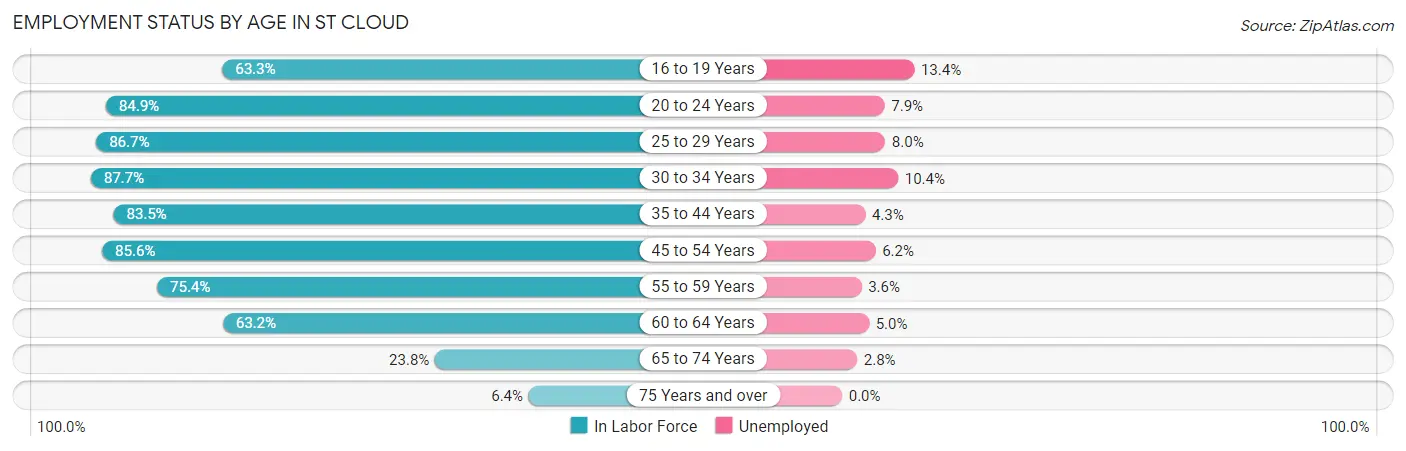
| Age Bracket | In Labor Force | Unemployed |
| 16 to 19 Years | 2,909 (63.3%) | 390 (13.4%) |
| 20 to 24 Years | 9,012 (84.9%) | 712 (7.9%) |
| 25 to 29 Years | 4,769 (86.7%) | 382 (8.0%) |
| 30 to 34 Years | 4,119 (87.7%) | 428 (10.4%) |
| 35 to 44 Years | 6,475 (83.5%) | 278 (4.3%) |
| 45 to 54 Years | 5,557 (85.6%) | 345 (6.2%) |
| 55 to 59 Years | 2,424 (75.4%) | 87 (3.6%) |
| 60 to 64 Years | 2,227 (63.2%) | 111 (5.0%) |
| 65 to 74 Years | 1,290 (23.8%) | 36 (2.8%) |
| 75 Years and over | 237 (6.4%) | 0 (0.0%) |
| Total | 39,026 (70.3%) | 2,771 (7.1%) |
Employment Status by Educational Attainment in St Cloud
According to labor force statistics for St Cloud, 82.0% of individuals (25,571) out of the total population between 25 and 64 years of age (31,184) are in the labor force, with 6.4% or 1,637 of them being unemployed. The group with the highest labor force participation rate are those with the educational attainment of bachelor's degree or higher, with 90.3% or 8,469 individuals in the labor force. Within the labor force, individuals with college / associate degree education have the highest percentage of unemployment, with 9.9% or 949 of them being unemployed.
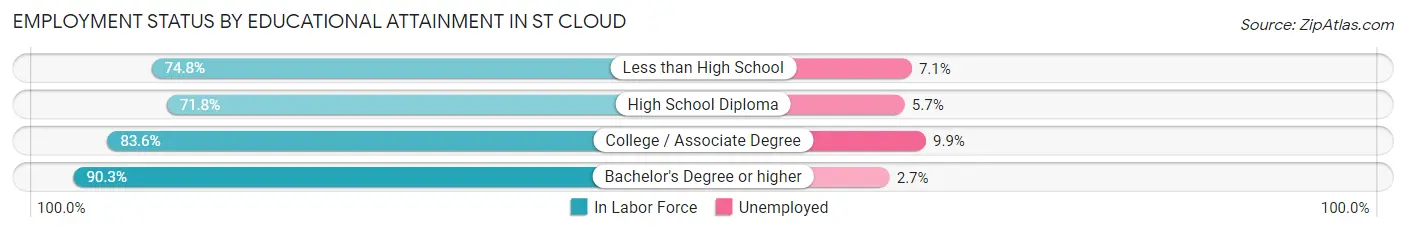
| Educational Attainment | In Labor Force | Unemployed |
| Less than High School | 2,141 (74.8%) | 203 (7.1%) |
| High School Diploma | 5,370 (71.8%) | 426 (5.7%) |
| College / Associate Degree | 9,584 (83.6%) | 1,135 (9.9%) |
| Bachelor's Degree or higher | 8,469 (90.3%) | 253 (2.7%) |
| Total | 25,571 (82.0%) | 1,996 (6.4%) |
Employment Occupations by Sex in St Cloud
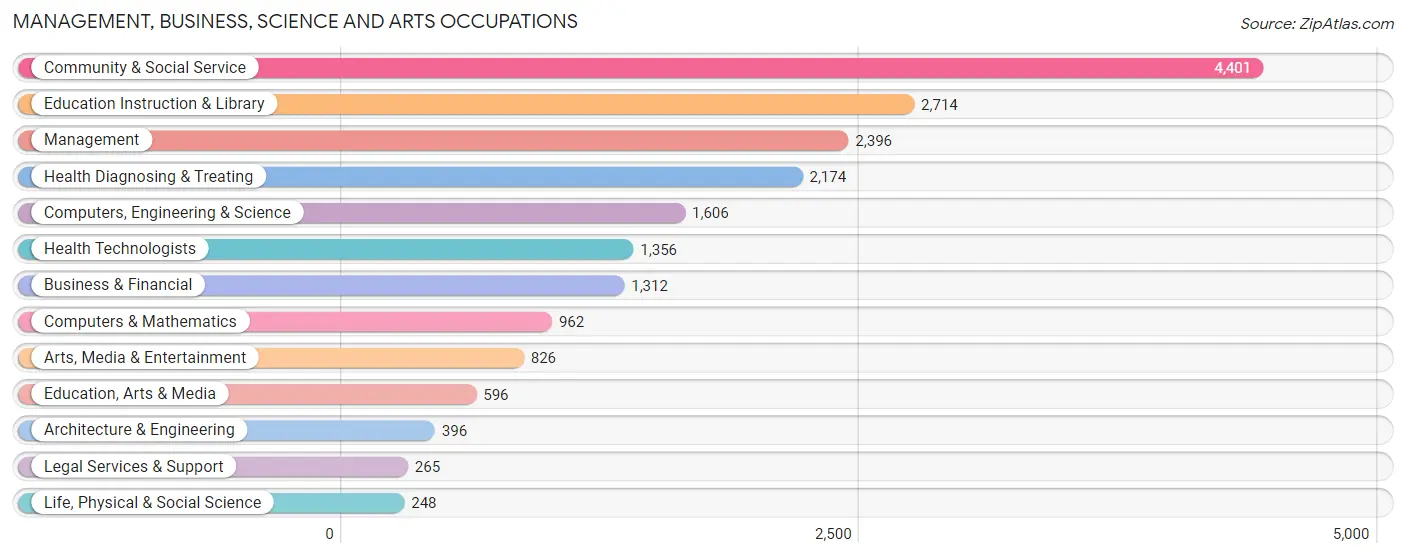
Management, Business, Science and Arts Occupations
The most common Management, Business, Science and Arts occupations in St Cloud are Community & Social Service (4,401 | 12.2%), Education Instruction & Library (2,714 | 7.5%), Management (2,396 | 6.7%), Health Diagnosing & Treating (2,174 | 6.0%), and Computers, Engineering & Science (1,606 | 4.5%).
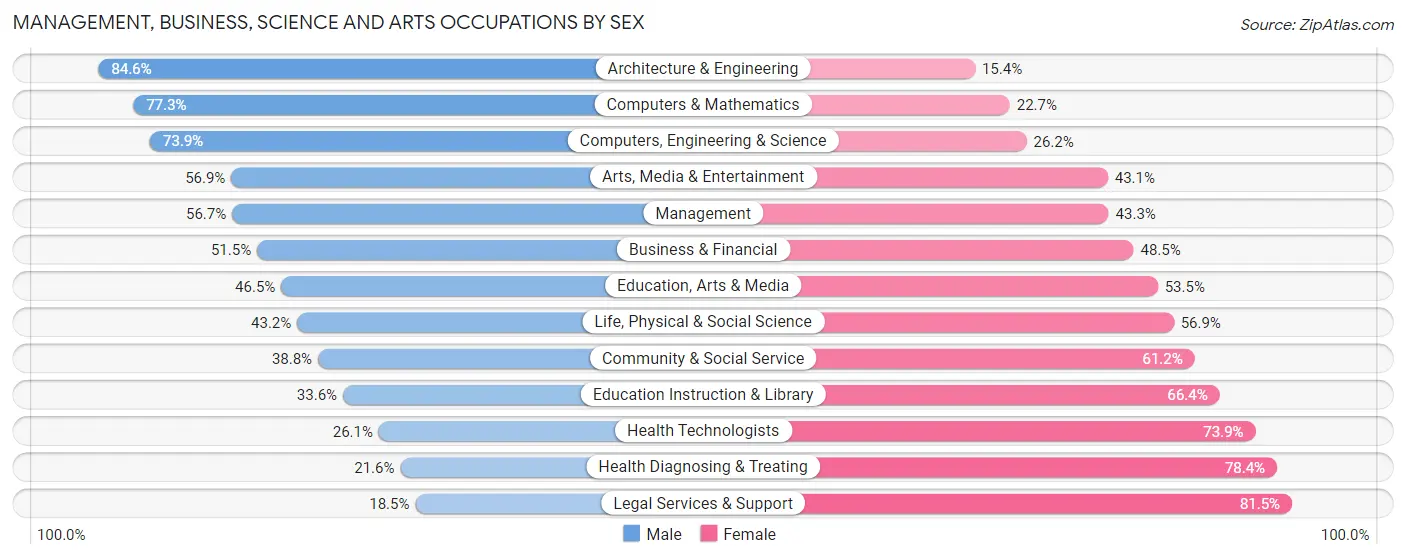
Management, Business, Science and Arts Occupations by Sex
Within the Management, Business, Science and Arts occupations in St Cloud, the most male-oriented occupations are Architecture & Engineering (84.6%), Computers & Mathematics (77.3%), and Computers, Engineering & Science (73.9%), while the most female-oriented occupations are Legal Services & Support (81.5%), Health Diagnosing & Treating (78.4%), and Health Technologists (73.9%).
| Occupation | Male | Female |
| Management | 1,359 (56.7%) | 1,037 (43.3%) |
| Business & Financial | 676 (51.5%) | 636 (48.5%) |
| Computers, Engineering & Science | 1,186 (73.9%) | 420 (26.2%) |
| Computers & Mathematics | 744 (77.3%) | 218 (22.7%) |
| Architecture & Engineering | 335 (84.6%) | 61 (15.4%) |
| Life, Physical & Social Science | 107 (43.1%) | 141 (56.9%) |
| Community & Social Service | 1,708 (38.8%) | 2,693 (61.2%) |
| Education, Arts & Media | 277 (46.5%) | 319 (53.5%) |
| Legal Services & Support | 49 (18.5%) | 216 (81.5%) |
| Education Instruction & Library | 912 (33.6%) | 1,802 (66.4%) |
| Arts, Media & Entertainment | 470 (56.9%) | 356 (43.1%) |
| Health Diagnosing & Treating | 470 (21.6%) | 1,704 (78.4%) |
| Health Technologists | 354 (26.1%) | 1,002 (73.9%) |
| Total (Category) | 5,399 (45.4%) | 6,490 (54.6%) |
| Total (Overall) | 18,456 (51.2%) | 17,569 (48.8%) |
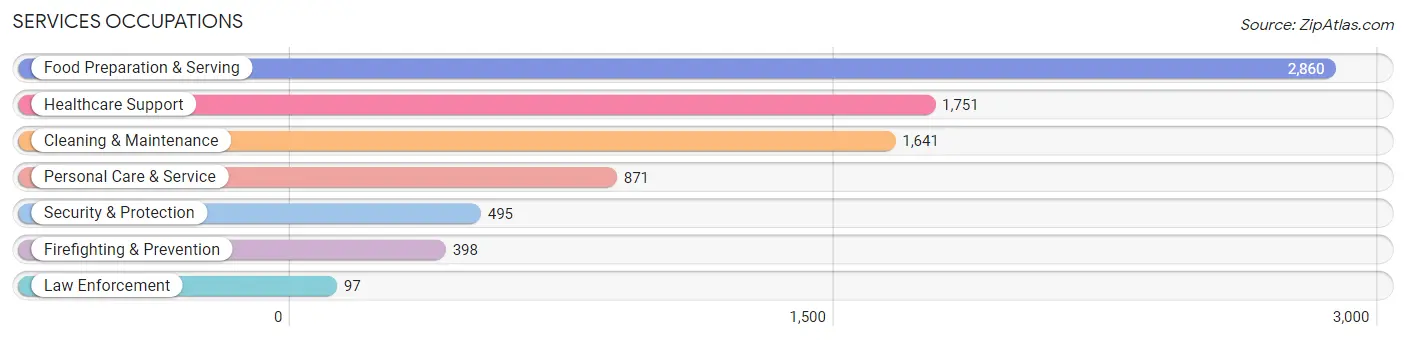
Services Occupations
The most common Services occupations in St Cloud are Food Preparation & Serving (2,860 | 7.9%), Healthcare Support (1,751 | 4.9%), Cleaning & Maintenance (1,641 | 4.6%), Personal Care & Service (871 | 2.4%), and Security & Protection (495 | 1.4%).
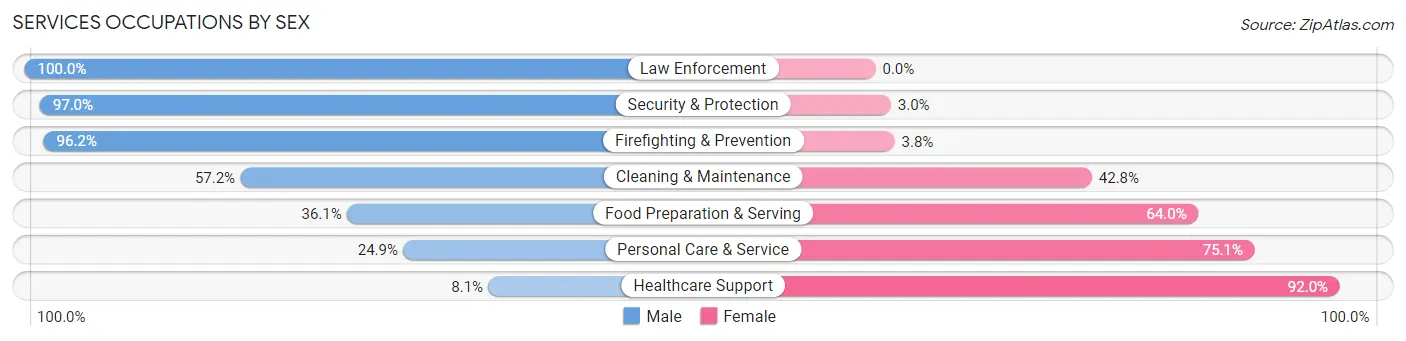
Services Occupations by Sex
Within the Services occupations in St Cloud, the most male-oriented occupations are Law Enforcement (100.0%), Security & Protection (97.0%), and Firefighting & Prevention (96.2%), while the most female-oriented occupations are Healthcare Support (91.9%), Personal Care & Service (75.1%), and Food Preparation & Serving (63.9%).
| Occupation | Male | Female |
| Healthcare Support | 141 (8.1%) | 1,610 (91.9%) |
| Security & Protection | 480 (97.0%) | 15 (3.0%) |
| Firefighting & Prevention | 383 (96.2%) | 15 (3.8%) |
| Law Enforcement | 97 (100.0%) | 0 (0.0%) |
| Food Preparation & Serving | 1,031 (36.0%) | 1,829 (63.9%) |
| Cleaning & Maintenance | 938 (57.2%) | 703 (42.8%) |
| Personal Care & Service | 217 (24.9%) | 654 (75.1%) |
| Total (Category) | 2,807 (36.8%) | 4,811 (63.1%) |
| Total (Overall) | 18,456 (51.2%) | 17,569 (48.8%) |
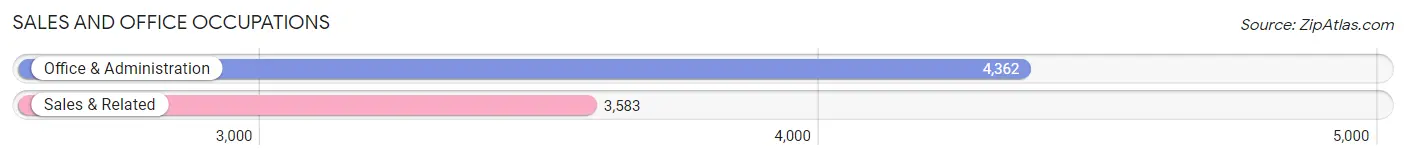
Sales and Office Occupations
The most common Sales and Office occupations in St Cloud are Office & Administration (4,362 | 12.1%), and Sales & Related (3,583 | 10.0%).
Sales and Office Occupations by Sex
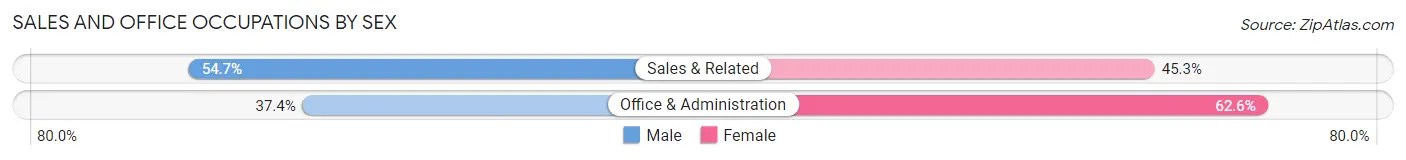
| Occupation | Male | Female |
| Sales & Related | 1,961 (54.7%) | 1,622 (45.3%) |
| Office & Administration | 1,631 (37.4%) | 2,731 (62.6%) |
| Total (Category) | 3,592 (45.2%) | 4,353 (54.8%) |
| Total (Overall) | 18,456 (51.2%) | 17,569 (48.8%) |
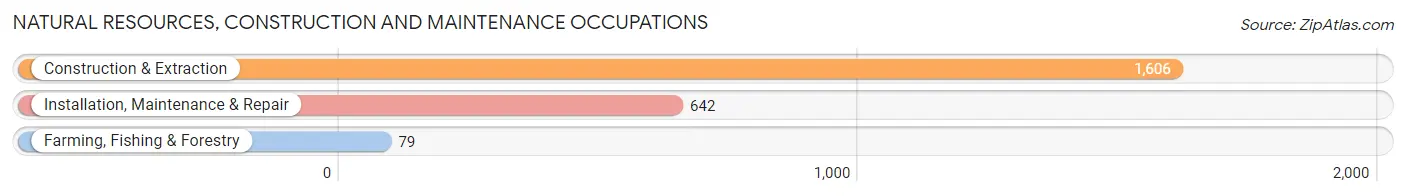
Natural Resources, Construction and Maintenance Occupations
The most common Natural Resources, Construction and Maintenance occupations in St Cloud are Construction & Extraction (1,606 | 4.5%), Installation, Maintenance & Repair (642 | 1.8%), and Farming, Fishing & Forestry (79 | 0.2%).
Natural Resources, Construction and Maintenance Occupations by Sex
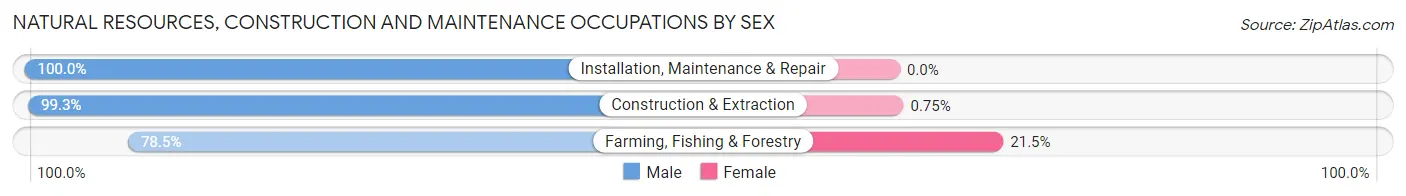
| Occupation | Male | Female |
| Farming, Fishing & Forestry | 62 (78.5%) | 17 (21.5%) |
| Construction & Extraction | 1,594 (99.3%) | 12 (0.7%) |
| Installation, Maintenance & Repair | 642 (100.0%) | 0 (0.0%) |
| Total (Category) | 2,298 (98.8%) | 29 (1.3%) |
| Total (Overall) | 18,456 (51.2%) | 17,569 (48.8%) |
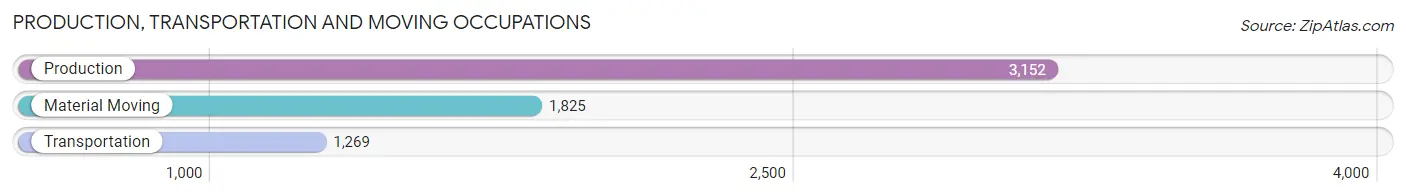
Production, Transportation and Moving Occupations
The most common Production, Transportation and Moving occupations in St Cloud are Production (3,152 | 8.7%), Material Moving (1,825 | 5.1%), and Transportation (1,269 | 3.5%).
Production, Transportation and Moving Occupations by Sex
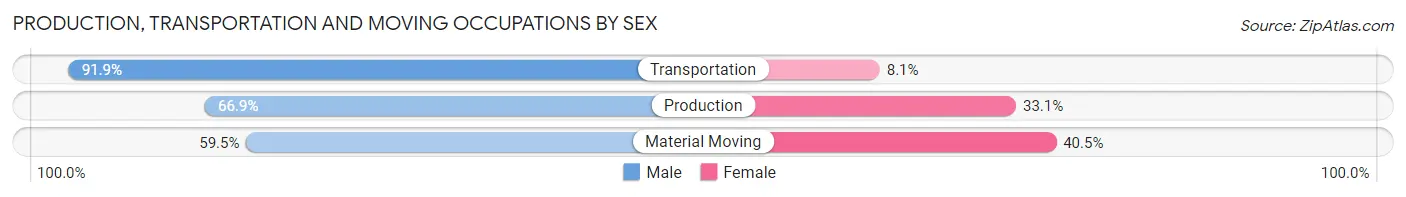
| Occupation | Male | Female |
| Production | 2,108 (66.9%) | 1,044 (33.1%) |
| Transportation | 1,166 (91.9%) | 103 (8.1%) |
| Material Moving | 1,086 (59.5%) | 739 (40.5%) |
| Total (Category) | 4,360 (69.8%) | 1,886 (30.2%) |
| Total (Overall) | 18,456 (51.2%) | 17,569 (48.8%) |
Employment Industries by Sex in St Cloud
Employment Industries in St Cloud
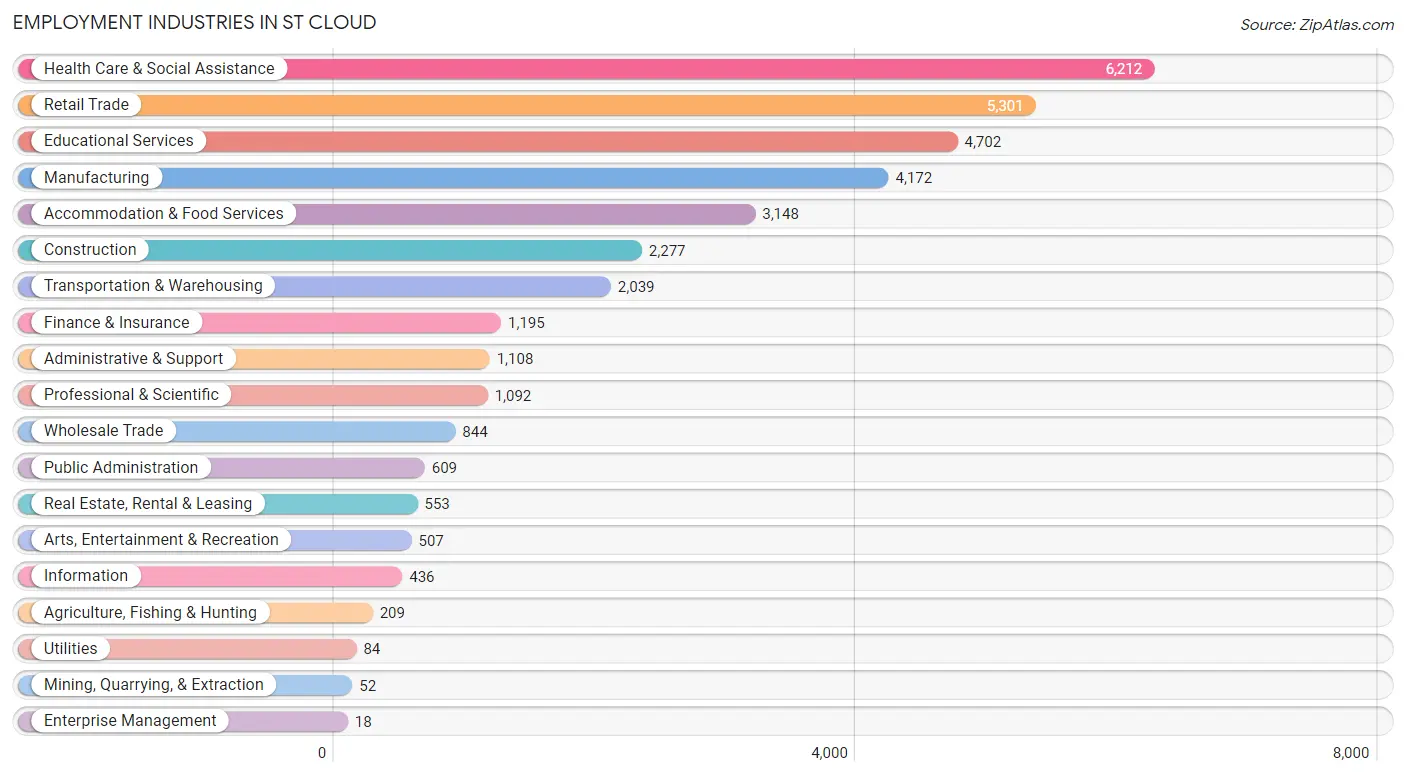
The major employment industries in St Cloud include Health Care & Social Assistance (6,212 | 17.2%), Retail Trade (5,301 | 14.7%), Educational Services (4,702 | 13.1%), Manufacturing (4,172 | 11.6%), and Accommodation & Food Services (3,148 | 8.7%).
Employment Industries by Sex in St Cloud
The St Cloud industries that see more men than women are Mining, Quarrying, & Extraction (100.0%), Enterprise Management (100.0%), and Agriculture, Fishing & Hunting (94.3%), whereas the industries that tend to have a higher number of women are Health Care & Social Assistance (76.4%), Accommodation & Food Services (63.8%), and Educational Services (60.4%).
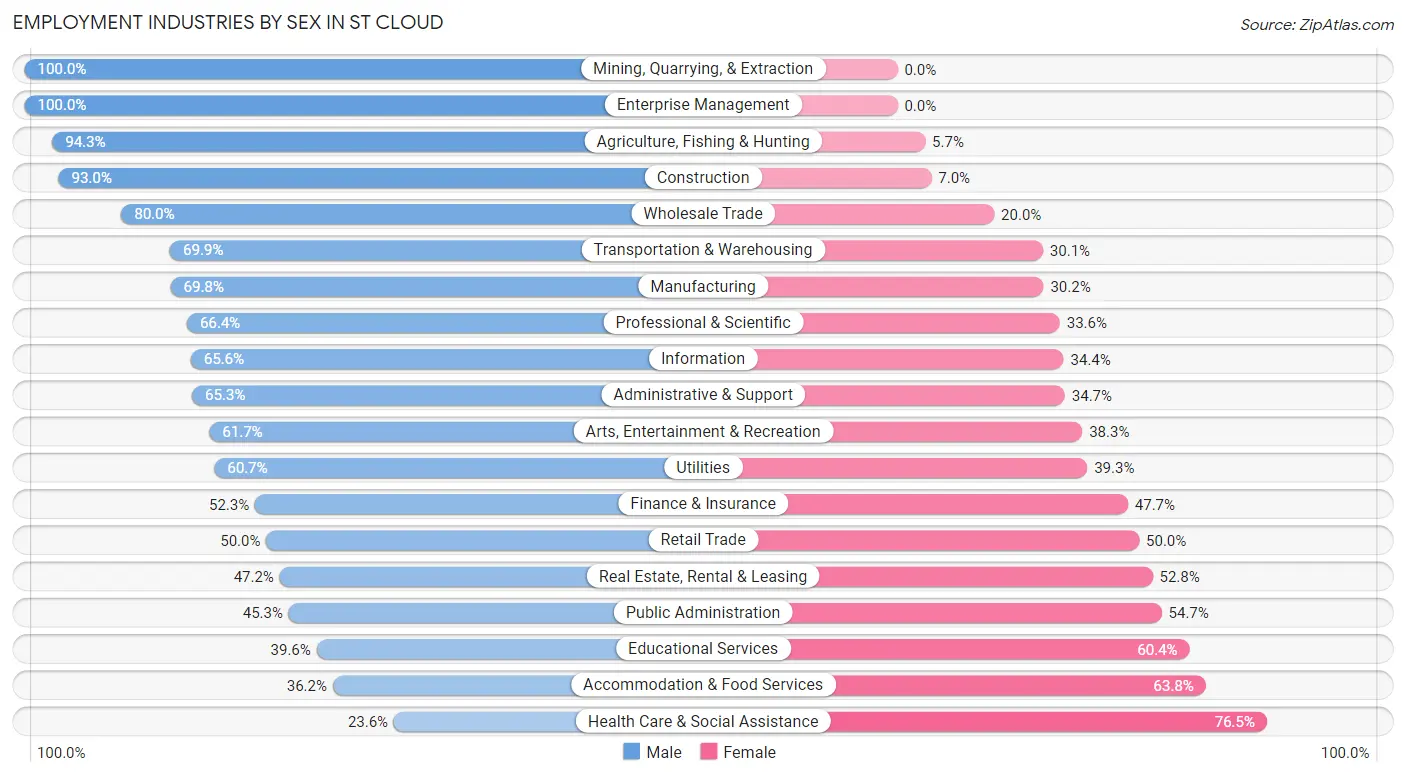
| Industry | Male | Female |
| Agriculture, Fishing & Hunting | 197 (94.3%) | 12 (5.7%) |
| Mining, Quarrying, & Extraction | 52 (100.0%) | 0 (0.0%) |
| Construction | 2,117 (93.0%) | 160 (7.0%) |
| Manufacturing | 2,911 (69.8%) | 1,261 (30.2%) |
| Wholesale Trade | 675 (80.0%) | 169 (20.0%) |
| Retail Trade | 2,649 (50.0%) | 2,652 (50.0%) |
| Transportation & Warehousing | 1,425 (69.9%) | 614 (30.1%) |
| Utilities | 51 (60.7%) | 33 (39.3%) |
| Information | 286 (65.6%) | 150 (34.4%) |
| Finance & Insurance | 625 (52.3%) | 570 (47.7%) |
| Real Estate, Rental & Leasing | 261 (47.2%) | 292 (52.8%) |
| Professional & Scientific | 725 (66.4%) | 367 (33.6%) |
| Enterprise Management | 18 (100.0%) | 0 (0.0%) |
| Administrative & Support | 724 (65.3%) | 384 (34.7%) |
| Educational Services | 1,860 (39.6%) | 2,842 (60.4%) |
| Health Care & Social Assistance | 1,463 (23.5%) | 4,749 (76.4%) |
| Arts, Entertainment & Recreation | 313 (61.7%) | 194 (38.3%) |
| Accommodation & Food Services | 1,140 (36.2%) | 2,008 (63.8%) |
| Public Administration | 276 (45.3%) | 333 (54.7%) |
| Total | 18,456 (51.2%) | 17,569 (48.8%) |
Education in St Cloud
School Enrollment in St Cloud
The most common levels of schooling among the 21,062 students in St Cloud are college / undergraduate (8,890 | 42.2%), elementary school (3,268 | 15.5%), and middle school (3,118 | 14.8%).
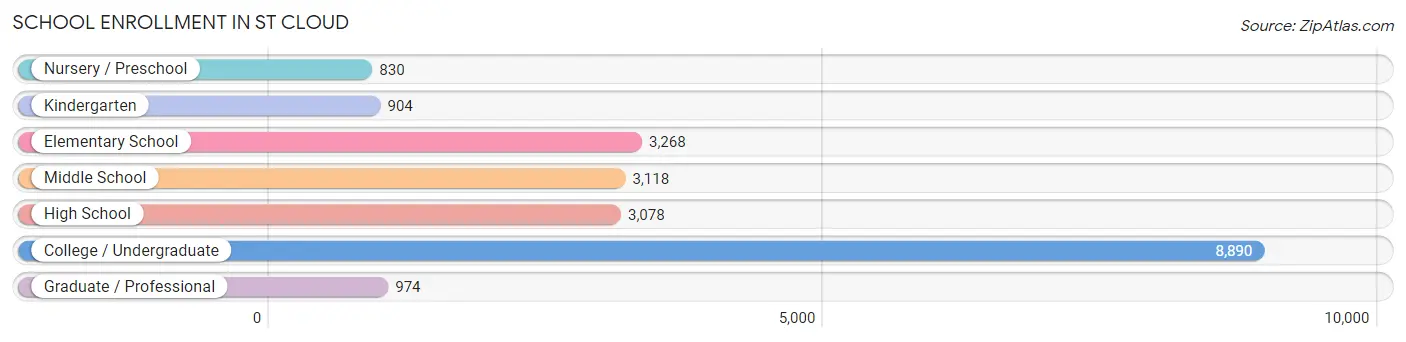
| School Level | # Students | % Students |
| Nursery / Preschool | 830 | 3.9% |
| Kindergarten | 904 | 4.3% |
| Elementary School | 3,268 | 15.5% |
| Middle School | 3,118 | 14.8% |
| High School | 3,078 | 14.6% |
| College / Undergraduate | 8,890 | 42.2% |
| Graduate / Professional | 974 | 4.6% |
| Total | 21,062 | 100.0% |
School Enrollment by Age by Funding Source in St Cloud
Out of a total of 21,062 students who are enrolled in schools in St Cloud, 2,822 (13.4%) attend a private institution, while the remaining 18,240 (86.6%) are enrolled in public schools. The age group of 3 to 4 year olds has the highest likelihood of being enrolled in private schools, with 241 (38.3% in the age bracket) enrolled. Conversely, the age group of 35 years and over has the lowest likelihood of being enrolled in a private school, with 778 (92.0% in the age bracket) attending a public institution.
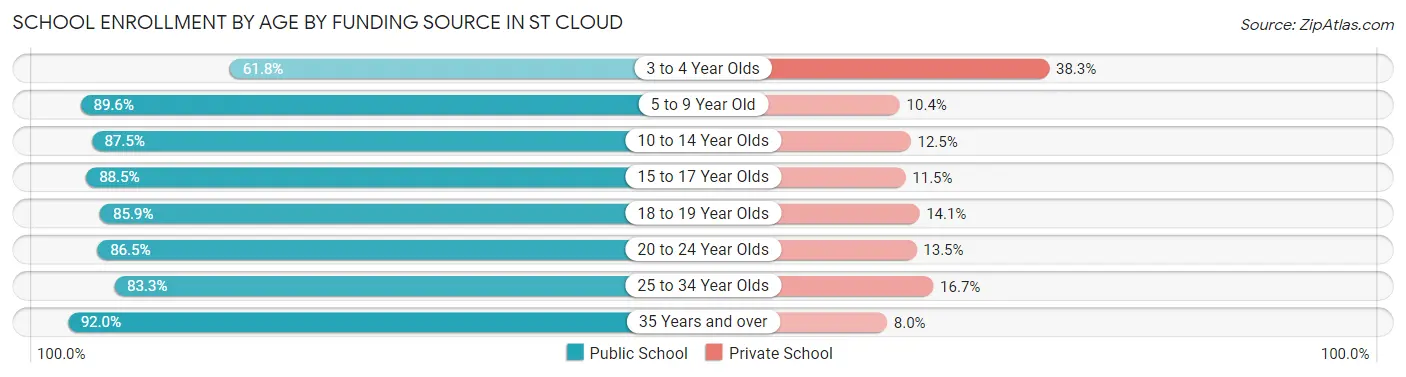
| Age Bracket | Public School | Private School |
| 3 to 4 Year Olds | 389 (61.8%) | 241 (38.3%) |
| 5 to 9 Year Old | 3,254 (89.6%) | 379 (10.4%) |
| 10 to 14 Year Olds | 3,779 (87.5%) | 538 (12.5%) |
| 15 to 17 Year Olds | 1,779 (88.5%) | 231 (11.5%) |
| 18 to 19 Year Olds | 2,071 (85.9%) | 339 (14.1%) |
| 20 to 24 Year Olds | 5,134 (86.5%) | 804 (13.5%) |
| 25 to 34 Year Olds | 1,065 (83.3%) | 213 (16.7%) |
| 35 Years and over | 778 (92.0%) | 68 (8.0%) |
| Total | 18,240 (86.6%) | 2,822 (13.4%) |
Educational Attainment by Field of Study in St Cloud
Business (2,381 | 17.6%), education (2,084 | 15.4%), science & technology (1,456 | 10.7%), social sciences (890 | 6.6%), and bio, nature & agricultural (863 | 6.4%) are the most common fields of study among 13,544 individuals in St Cloud who have obtained a bachelor's degree or higher.
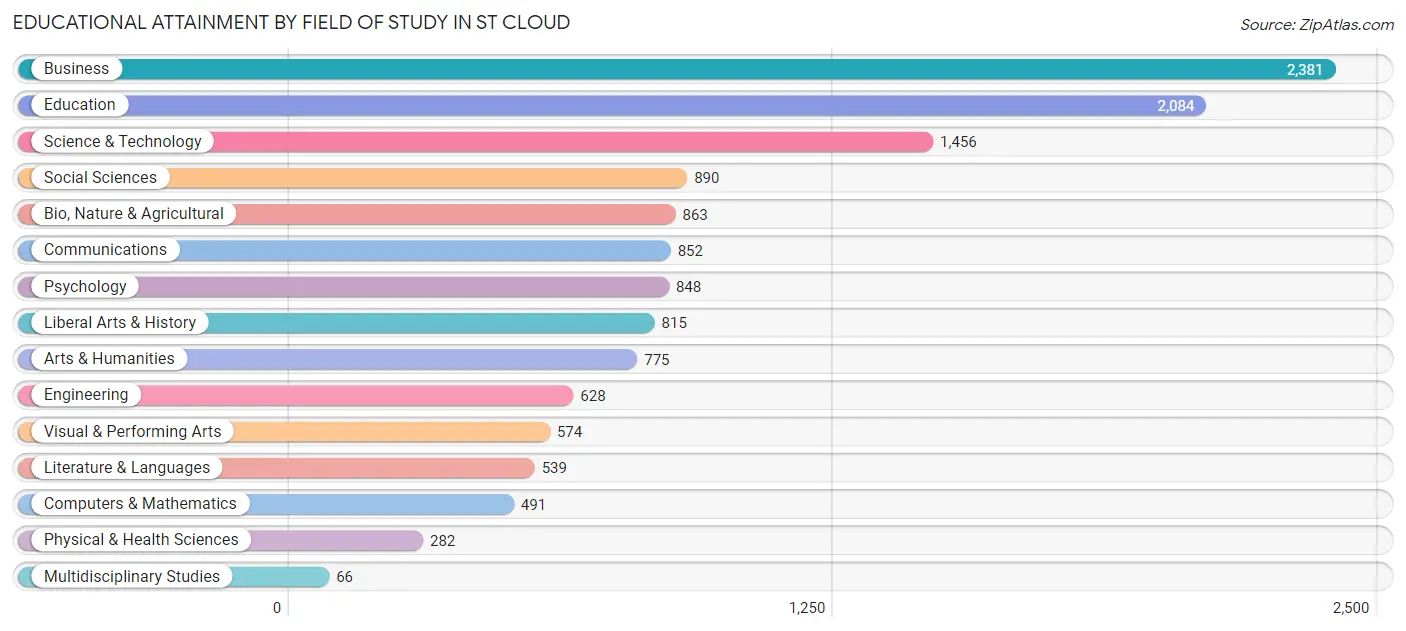
| Field of Study | # Graduates | % Graduates |
| Computers & Mathematics | 491 | 3.6% |
| Bio, Nature & Agricultural | 863 | 6.4% |
| Physical & Health Sciences | 282 | 2.1% |
| Psychology | 848 | 6.3% |
| Social Sciences | 890 | 6.6% |
| Engineering | 628 | 4.6% |
| Multidisciplinary Studies | 66 | 0.5% |
| Science & Technology | 1,456 | 10.7% |
| Business | 2,381 | 17.6% |
| Education | 2,084 | 15.4% |
| Literature & Languages | 539 | 4.0% |
| Liberal Arts & History | 815 | 6.0% |
| Visual & Performing Arts | 574 | 4.2% |
| Communications | 852 | 6.3% |
| Arts & Humanities | 775 | 5.7% |
| Total | 13,544 | 100.0% |
Transportation & Commute in St Cloud
Vehicle Availability by Sex in St Cloud
The most prevalent vehicle ownership categories in St Cloud are males with 2 vehicles (7,342, accounting for 41.9%) and females with 2 vehicles (6,189, making up 45.8%).
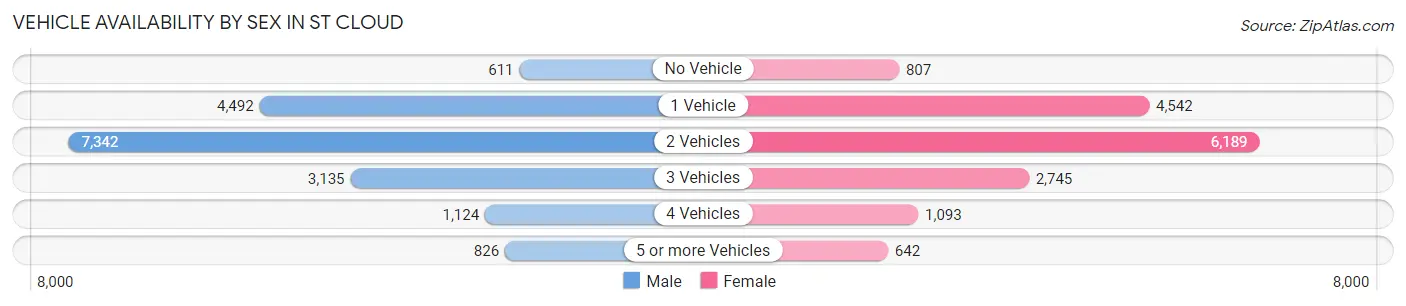
| Vehicles Available | Male | Female |
| No Vehicle | 611 (3.5%) | 807 (5.0%) |
| 1 Vehicle | 4,492 (25.6%) | 4,542 (28.4%) |
| 2 Vehicles | 7,342 (41.9%) | 6,189 (38.6%) |
| 3 Vehicles | 3,135 (17.9%) | 2,745 (17.1%) |
| 4 Vehicles | 1,124 (6.4%) | 1,093 (6.8%) |
| 5 or more Vehicles | 826 (4.7%) | 642 (4.0%) |
| Total | 17,530 (100.0%) | 16,018 (100.0%) |
Commute Time in St Cloud
The most frequently occuring commute durations in St Cloud are 10 to 14 minutes (8,101 commuters, 24.7%), 15 to 19 minutes (7,610 commuters, 23.2%), and 5 to 9 minutes (5,720 commuters, 17.5%).
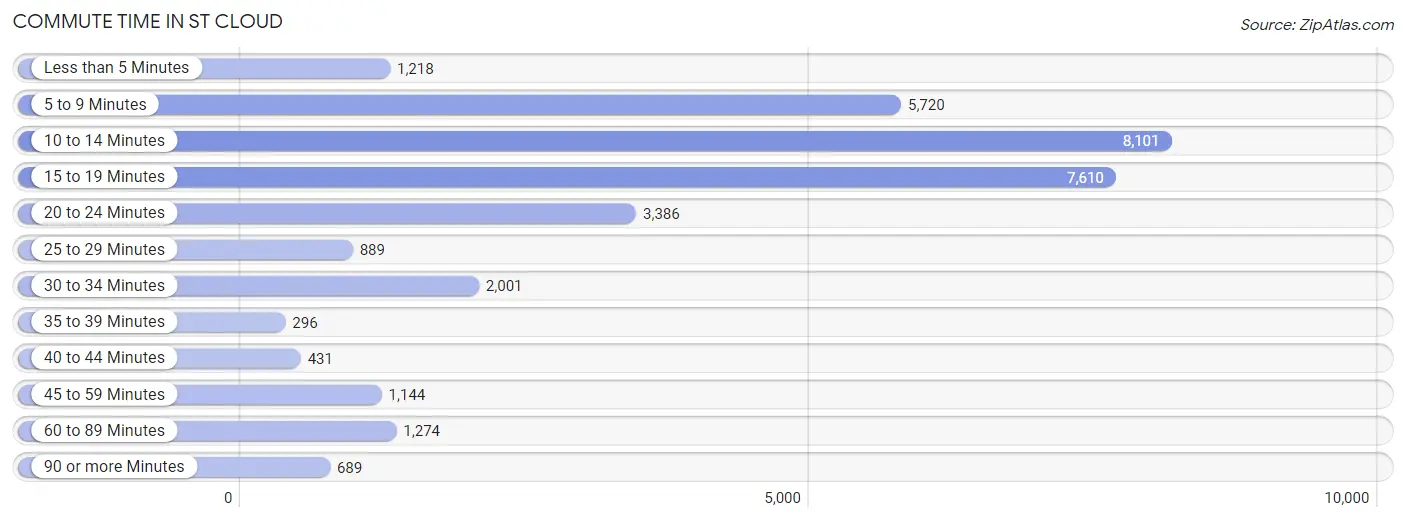
| Commute Time | # Commuters | % Commuters |
| Less than 5 Minutes | 1,218 | 3.7% |
| 5 to 9 Minutes | 5,720 | 17.5% |
| 10 to 14 Minutes | 8,101 | 24.7% |
| 15 to 19 Minutes | 7,610 | 23.2% |
| 20 to 24 Minutes | 3,386 | 10.3% |
| 25 to 29 Minutes | 889 | 2.7% |
| 30 to 34 Minutes | 2,001 | 6.1% |
| 35 to 39 Minutes | 296 | 0.9% |
| 40 to 44 Minutes | 431 | 1.3% |
| 45 to 59 Minutes | 1,144 | 3.5% |
| 60 to 89 Minutes | 1,274 | 3.9% |
| 90 or more Minutes | 689 | 2.1% |
Commute Time by Sex in St Cloud
The most common commute times in St Cloud are 10 to 14 minutes (4,242 commuters, 24.9%) for males and 15 to 19 minutes (4,254 commuters, 27.1%) for females.
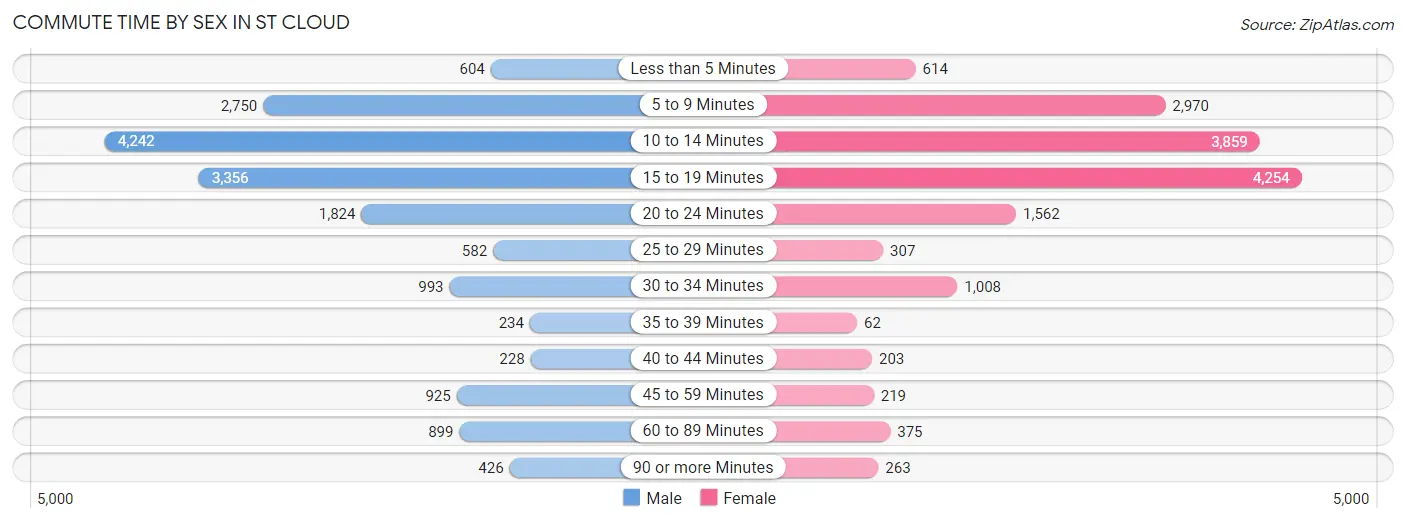
| Commute Time | Male | Female |
| Less than 5 Minutes | 604 (3.5%) | 614 (3.9%) |
| 5 to 9 Minutes | 2,750 (16.1%) | 2,970 (18.9%) |
| 10 to 14 Minutes | 4,242 (24.9%) | 3,859 (24.6%) |
| 15 to 19 Minutes | 3,356 (19.7%) | 4,254 (27.1%) |
| 20 to 24 Minutes | 1,824 (10.7%) | 1,562 (10.0%) |
| 25 to 29 Minutes | 582 (3.4%) | 307 (2.0%) |
| 30 to 34 Minutes | 993 (5.8%) | 1,008 (6.4%) |
| 35 to 39 Minutes | 234 (1.4%) | 62 (0.4%) |
| 40 to 44 Minutes | 228 (1.3%) | 203 (1.3%) |
| 45 to 59 Minutes | 925 (5.4%) | 219 (1.4%) |
| 60 to 89 Minutes | 899 (5.3%) | 375 (2.4%) |
| 90 or more Minutes | 426 (2.5%) | 263 (1.7%) |
Time of Departure to Work by Sex in St Cloud
The most frequent times of departure to work in St Cloud are 12:00 PM to 3:59 PM (1,871, 11.0%) for males and 12:00 PM to 3:59 PM (2,336, 14.9%) for females.
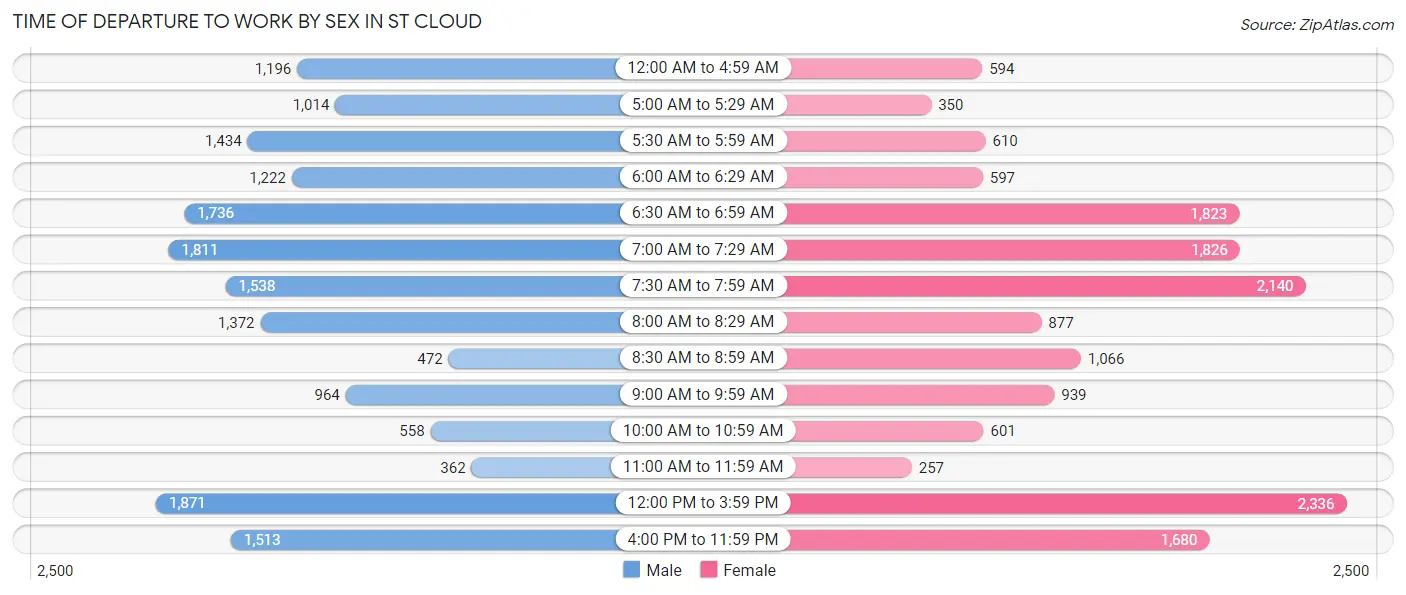
| Time of Departure | Male | Female |
| 12:00 AM to 4:59 AM | 1,196 (7.0%) | 594 (3.8%) |
| 5:00 AM to 5:29 AM | 1,014 (5.9%) | 350 (2.2%) |
| 5:30 AM to 5:59 AM | 1,434 (8.4%) | 610 (3.9%) |
| 6:00 AM to 6:29 AM | 1,222 (7.2%) | 597 (3.8%) |
| 6:30 AM to 6:59 AM | 1,736 (10.2%) | 1,823 (11.6%) |
| 7:00 AM to 7:29 AM | 1,811 (10.6%) | 1,826 (11.6%) |
| 7:30 AM to 7:59 AM | 1,538 (9.0%) | 2,140 (13.6%) |
| 8:00 AM to 8:29 AM | 1,372 (8.0%) | 877 (5.6%) |
| 8:30 AM to 8:59 AM | 472 (2.8%) | 1,066 (6.8%) |
| 9:00 AM to 9:59 AM | 964 (5.7%) | 939 (6.0%) |
| 10:00 AM to 10:59 AM | 558 (3.3%) | 601 (3.8%) |
| 11:00 AM to 11:59 AM | 362 (2.1%) | 257 (1.6%) |
| 12:00 PM to 3:59 PM | 1,871 (11.0%) | 2,336 (14.9%) |
| 4:00 PM to 11:59 PM | 1,513 (8.9%) | 1,680 (10.7%) |
| Total | 17,063 (100.0%) | 15,696 (100.0%) |
Housing Occupancy in St Cloud
Occupancy by Ownership in St Cloud
Of the total 27,453 dwellings in St Cloud, owner-occupied units account for 13,234 (48.2%), while renter-occupied units make up 14,219 (51.8%).
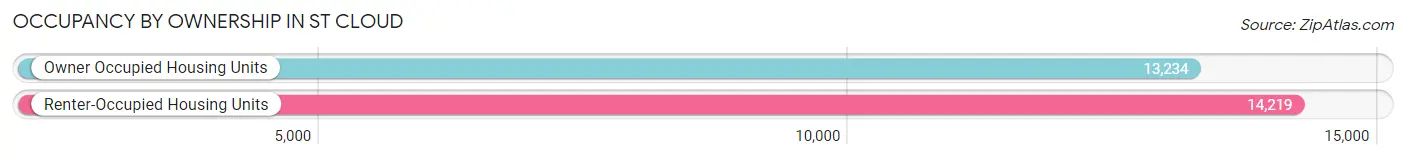
| Occupancy | # Housing Units | % Housing Units |
| Owner Occupied Housing Units | 13,234 | 48.2% |
| Renter-Occupied Housing Units | 14,219 | 51.8% |
| Total Occupied Housing Units | 27,453 | 100.0% |
Occupancy by Household Size in St Cloud
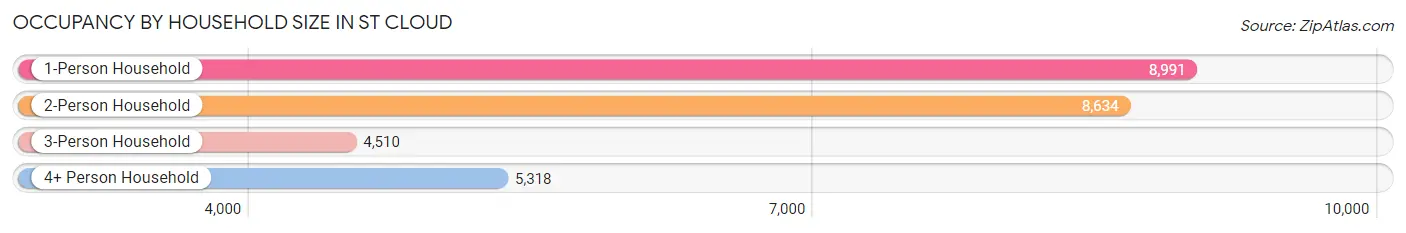
| Household Size | # Housing Units | % Housing Units |
| 1-Person Household | 8,991 | 32.8% |
| 2-Person Household | 8,634 | 31.5% |
| 3-Person Household | 4,510 | 16.4% |
| 4+ Person Household | 5,318 | 19.4% |
| Total Housing Units | 27,453 | 100.0% |
Occupancy by Ownership by Household Size in St Cloud
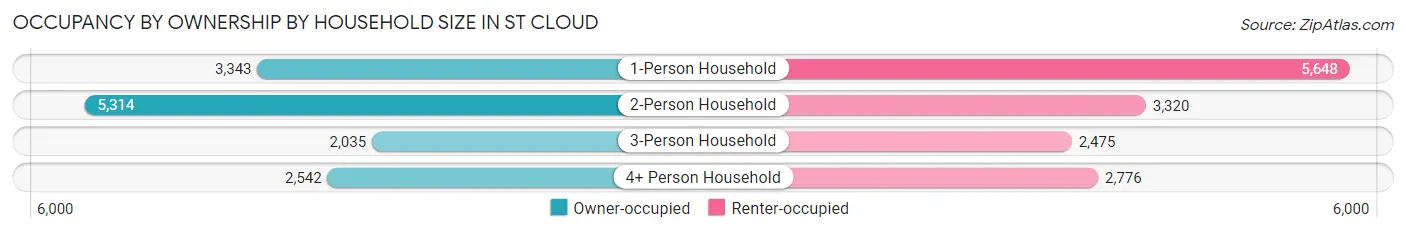
| Household Size | Owner-occupied | Renter-occupied |
| 1-Person Household | 3,343 (37.2%) | 5,648 (62.8%) |
| 2-Person Household | 5,314 (61.6%) | 3,320 (38.5%) |
| 3-Person Household | 2,035 (45.1%) | 2,475 (54.9%) |
| 4+ Person Household | 2,542 (47.8%) | 2,776 (52.2%) |
| Total Housing Units | 13,234 (48.2%) | 14,219 (51.8%) |
Occupancy by Educational Attainment in St Cloud
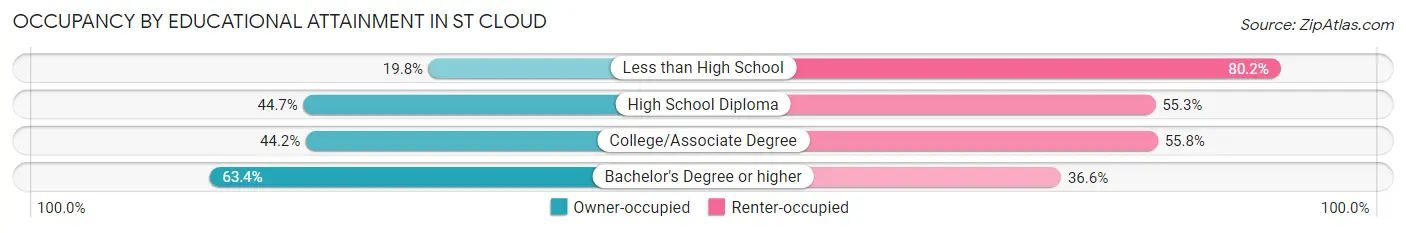
| Household Size | Owner-occupied | Renter-occupied |
| Less than High School | 446 (19.8%) | 1,802 (80.2%) |
| High School Diploma | 2,543 (44.7%) | 3,148 (55.3%) |
| College/Associate Degree | 4,881 (44.2%) | 6,167 (55.8%) |
| Bachelor's Degree or higher | 5,364 (63.4%) | 3,102 (36.6%) |
Occupancy by Age of Householder in St Cloud
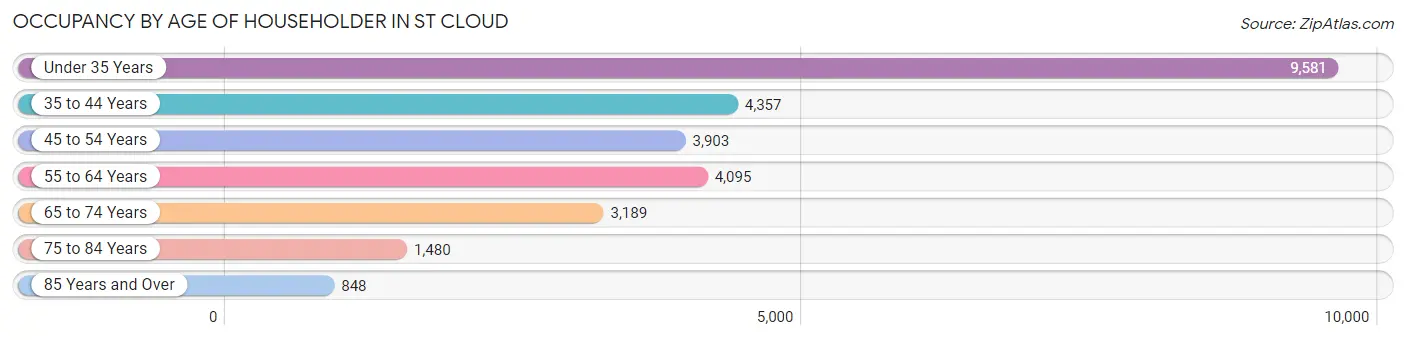
| Age Bracket | # Households | % Households |
| Under 35 Years | 9,581 | 34.9% |
| 35 to 44 Years | 4,357 | 15.9% |
| 45 to 54 Years | 3,903 | 14.2% |
| 55 to 64 Years | 4,095 | 14.9% |
| 65 to 74 Years | 3,189 | 11.6% |
| 75 to 84 Years | 1,480 | 5.4% |
| 85 Years and Over | 848 | 3.1% |
| Total | 27,453 | 100.0% |
Housing Finances in St Cloud
Median Income by Occupancy in St Cloud
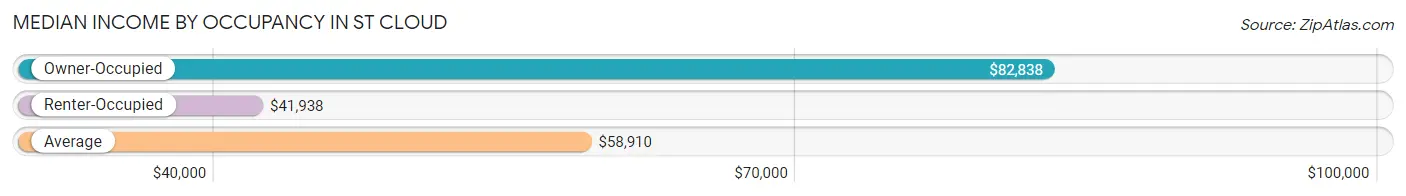
| Occupancy Type | # Households | Median Income |
| Owner-Occupied | 13,234 (48.2%) | $82,838 |
| Renter-Occupied | 14,219 (51.8%) | $41,938 |
| Average | 27,453 (100.0%) | $58,910 |
Occupancy by Householder Income Bracket in St Cloud
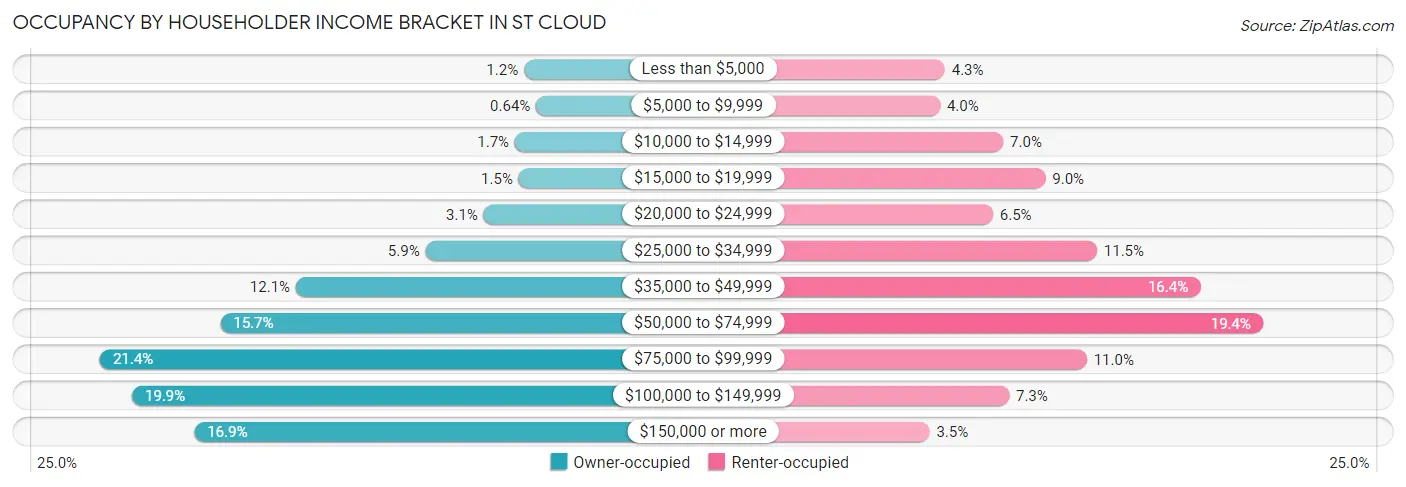
| Income Bracket | Owner-occupied | Renter-occupied |
| Less than $5,000 | 161 (1.2%) | 604 (4.3%) |
| $5,000 to $9,999 | 85 (0.6%) | 572 (4.0%) |
| $10,000 to $14,999 | 219 (1.7%) | 1,000 (7.0%) |
| $15,000 to $19,999 | 194 (1.5%) | 1,286 (9.0%) |
| $20,000 to $24,999 | 415 (3.1%) | 930 (6.5%) |
| $25,000 to $34,999 | 782 (5.9%) | 1,634 (11.5%) |
| $35,000 to $49,999 | 1,599 (12.1%) | 2,332 (16.4%) |
| $50,000 to $74,999 | 2,075 (15.7%) | 2,757 (19.4%) |
| $75,000 to $99,999 | 2,833 (21.4%) | 1,565 (11.0%) |
| $100,000 to $149,999 | 2,632 (19.9%) | 1,039 (7.3%) |
| $150,000 or more | 2,239 (16.9%) | 500 (3.5%) |
| Total | 13,234 (100.0%) | 14,219 (100.0%) |
Monthly Housing Cost Tiers in St Cloud
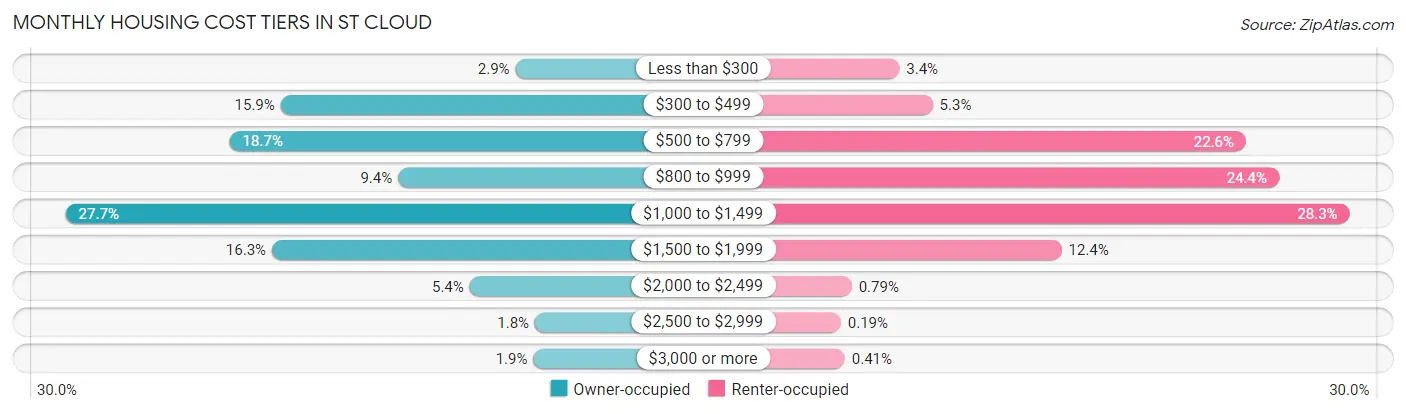
| Monthly Cost | Owner-occupied | Renter-occupied |
| Less than $300 | 383 (2.9%) | 486 (3.4%) |
| $300 to $499 | 2,099 (15.9%) | 748 (5.3%) |
| $500 to $799 | 2,472 (18.7%) | 3,208 (22.6%) |
| $800 to $999 | 1,240 (9.4%) | 3,467 (24.4%) |
| $1,000 to $1,499 | 3,670 (27.7%) | 4,021 (28.3%) |
| $1,500 to $1,999 | 2,162 (16.3%) | 1,761 (12.4%) |
| $2,000 to $2,499 | 717 (5.4%) | 113 (0.8%) |
| $2,500 to $2,999 | 239 (1.8%) | 27 (0.2%) |
| $3,000 or more | 252 (1.9%) | 59 (0.4%) |
| Total | 13,234 (100.0%) | 14,219 (100.0%) |
Physical Housing Characteristics in St Cloud
Housing Structures in St Cloud
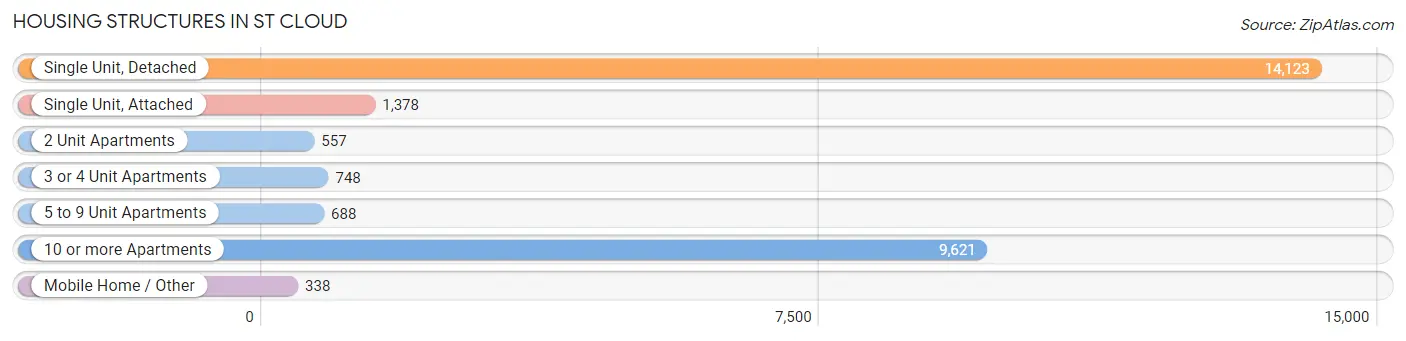
| Structure Type | # Housing Units | % Housing Units |
| Single Unit, Detached | 14,123 | 51.4% |
| Single Unit, Attached | 1,378 | 5.0% |
| 2 Unit Apartments | 557 | 2.0% |
| 3 or 4 Unit Apartments | 748 | 2.7% |
| 5 to 9 Unit Apartments | 688 | 2.5% |
| 10 or more Apartments | 9,621 | 35.0% |
| Mobile Home / Other | 338 | 1.2% |
| Total | 27,453 | 100.0% |
Housing Structures by Occupancy in St Cloud
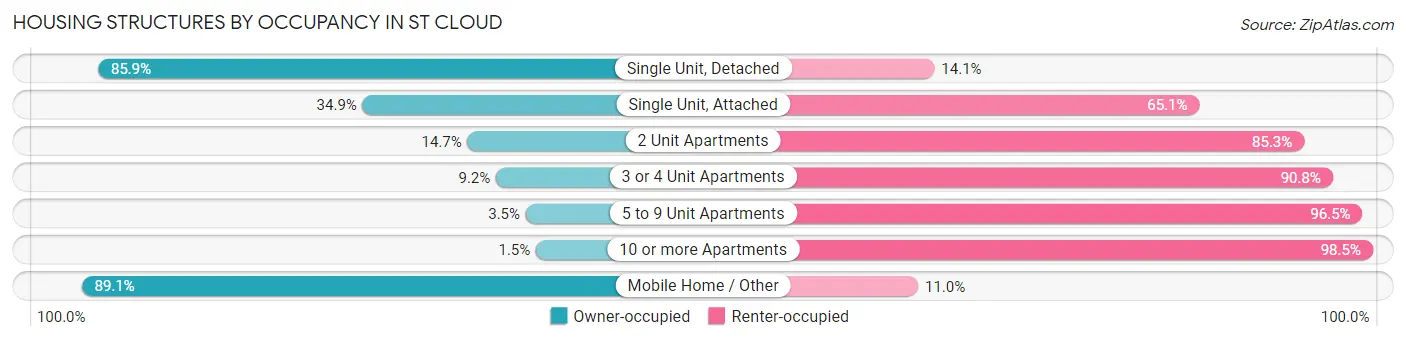
| Structure Type | Owner-occupied | Renter-occupied |
| Single Unit, Detached | 12,132 (85.9%) | 1,991 (14.1%) |
| Single Unit, Attached | 481 (34.9%) | 897 (65.1%) |
| 2 Unit Apartments | 82 (14.7%) | 475 (85.3%) |
| 3 or 4 Unit Apartments | 69 (9.2%) | 679 (90.8%) |
| 5 to 9 Unit Apartments | 24 (3.5%) | 664 (96.5%) |
| 10 or more Apartments | 145 (1.5%) | 9,476 (98.5%) |
| Mobile Home / Other | 301 (89.0%) | 37 (11.0%) |
| Total | 13,234 (48.2%) | 14,219 (51.8%) |
Housing Structures by Number of Rooms in St Cloud
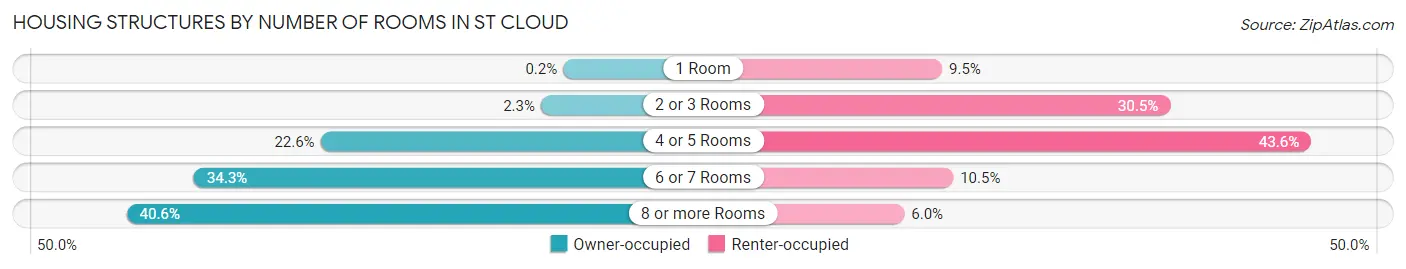
| Number of Rooms | Owner-occupied | Renter-occupied |
| 1 Room | 26 (0.2%) | 1,343 (9.5%) |
| 2 or 3 Rooms | 299 (2.3%) | 4,343 (30.5%) |
| 4 or 5 Rooms | 2,996 (22.6%) | 6,195 (43.6%) |
| 6 or 7 Rooms | 4,545 (34.3%) | 1,490 (10.5%) |
| 8 or more Rooms | 5,368 (40.6%) | 848 (6.0%) |
| Total | 13,234 (100.0%) | 14,219 (100.0%) |
Housing Structure by Heating Type in St Cloud
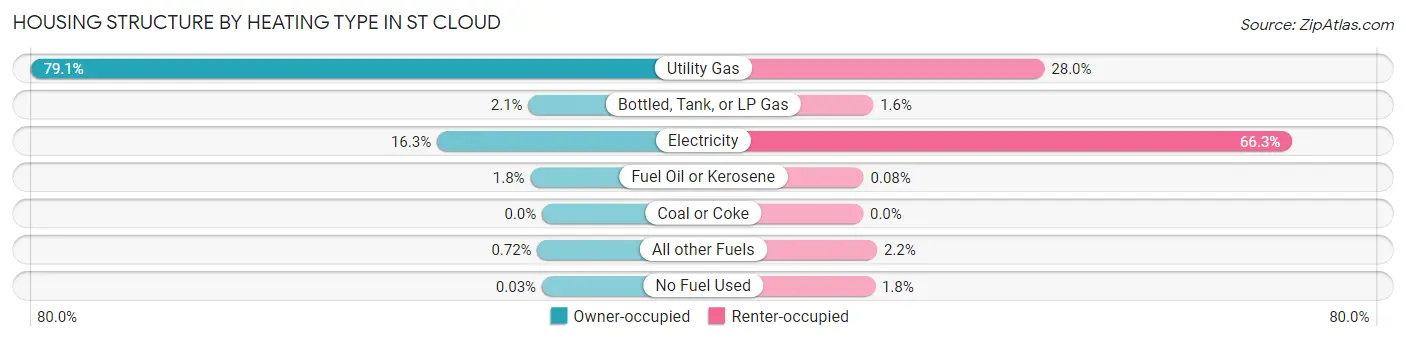
| Heating Type | Owner-occupied | Renter-occupied |
| Utility Gas | 10,467 (79.1%) | 3,985 (28.0%) |
| Bottled, Tank, or LP Gas | 279 (2.1%) | 223 (1.6%) |
| Electricity | 2,151 (16.3%) | 9,432 (66.3%) |
| Fuel Oil or Kerosene | 238 (1.8%) | 12 (0.1%) |
| Coal or Coke | 0 (0.0%) | 0 (0.0%) |
| All other Fuels | 95 (0.7%) | 306 (2.1%) |
| No Fuel Used | 4 (0.0%) | 261 (1.8%) |
| Total | 13,234 (100.0%) | 14,219 (100.0%) |
Household Vehicle Usage in St Cloud
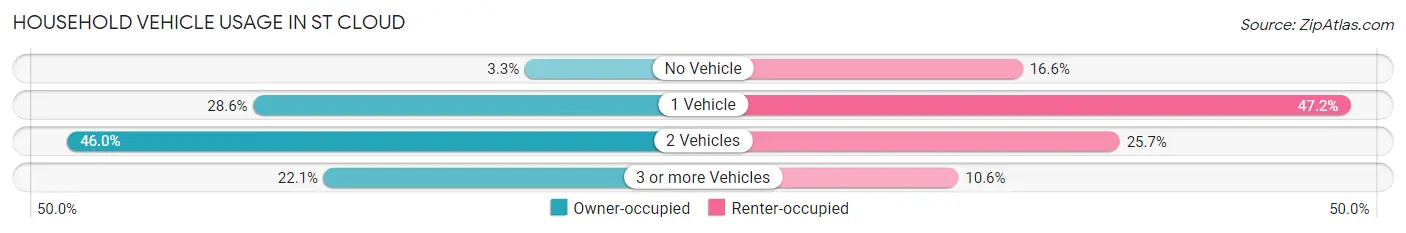
| Vehicles per Household | Owner-occupied | Renter-occupied |
| No Vehicle | 435 (3.3%) | 2,361 (16.6%) |
| 1 Vehicle | 3,790 (28.6%) | 6,705 (47.2%) |
| 2 Vehicles | 6,090 (46.0%) | 3,647 (25.7%) |
| 3 or more Vehicles | 2,919 (22.1%) | 1,506 (10.6%) |
| Total | 13,234 (100.0%) | 14,219 (100.0%) |
Real Estate & Mortgages in St Cloud
Real Estate and Mortgage Overview in St Cloud
| Characteristic | Without Mortgage | With Mortgage |
| Housing Units | 5,399 | 7,835 |
| Median Property Value | $198,200 | $184,400 |
| Median Household Income | $76,434 | $1,350 |
| Monthly Housing Costs | $533 | $252 |
| Real Estate Taxes | $2,252 | $258 |
Property Value by Mortgage Status in St Cloud
| Property Value | Without Mortgage | With Mortgage |
| Less than $50,000 | 309 (5.7%) | 327 (4.2%) |
| $50,000 to $99,999 | 181 (3.4%) | 235 (3.0%) |
| $100,000 to $299,999 | 3,820 (70.8%) | 5,994 (76.5%) |
| $300,000 to $499,999 | 890 (16.5%) | 1,075 (13.7%) |
| $500,000 to $749,999 | 182 (3.4%) | 110 (1.4%) |
| $750,000 to $999,999 | 0 (0.0%) | 33 (0.4%) |
| $1,000,000 or more | 17 (0.3%) | 61 (0.8%) |
| Total | 5,399 (100.0%) | 7,835 (100.0%) |
Household Income by Mortgage Status in St Cloud
| Household Income | Without Mortgage | With Mortgage |
| Less than $10,000 | 181 (3.4%) | 76 (1.0%) |
| $10,000 to $24,999 | 525 (9.7%) | 65 (0.8%) |
| $25,000 to $34,999 | 379 (7.0%) | 303 (3.9%) |
| $35,000 to $49,999 | 788 (14.6%) | 403 (5.1%) |
| $50,000 to $74,999 | 772 (14.3%) | 811 (10.3%) |
| $75,000 to $99,999 | 841 (15.6%) | 1,303 (16.6%) |
| $100,000 to $149,999 | 1,024 (19.0%) | 1,992 (25.4%) |
| $150,000 or more | 889 (16.5%) | 1,608 (20.5%) |
| Total | 5,399 (100.0%) | 7,835 (100.0%) |
Property Value to Household Income Ratio in St Cloud
| Value-to-Income Ratio | Without Mortgage | With Mortgage |
| Less than 2.0x | 1,981 (36.7%) | 87,689 (1,119.2%) |
| 2.0x to 2.9x | 923 (17.1%) | 3,302 (42.1%) |
| 3.0x to 3.9x | 859 (15.9%) | 2,236 (28.5%) |
| 4.0x or more | 1,593 (29.5%) | 986 (12.6%) |
| Total | 5,399 (100.0%) | 7,835 (100.0%) |
Real Estate Taxes by Mortgage Status in St Cloud
| Property Taxes | Without Mortgage | With Mortgage |
| Less than $800 | 335 (6.2%) | 12 (0.2%) |
| $800 to $1,499 | 1,139 (21.1%) | 477 (6.1%) |
| $800 to $1,499 | 3,794 (70.3%) | 2,503 (32.0%) |
| Total | 5,399 (100.0%) | 7,835 (100.0%) |
Health & Disability in St Cloud
Health Insurance Coverage by Age in St Cloud
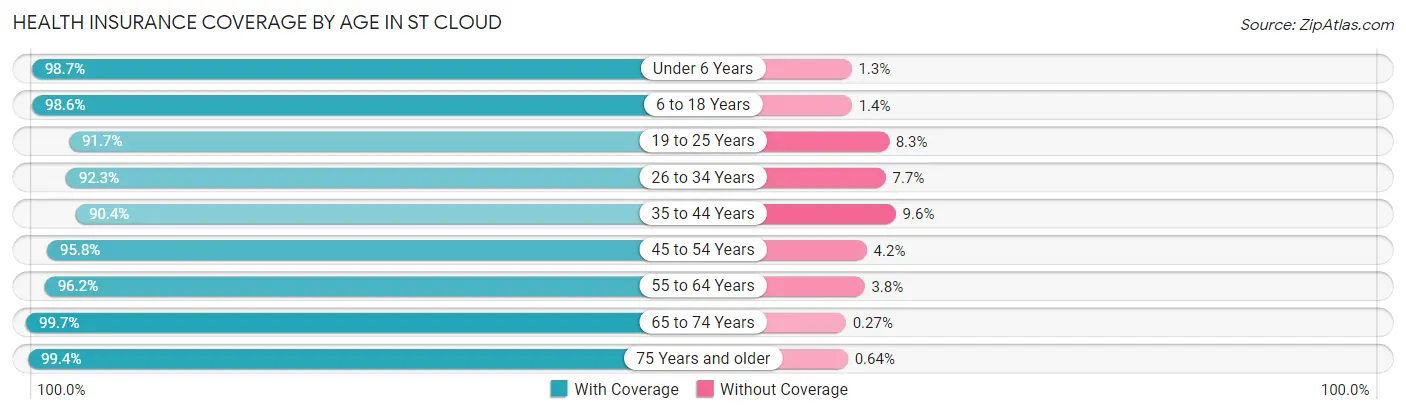
| Age Bracket | With Coverage | Without Coverage |
| Under 6 Years | 4,915 (98.7%) | 67 (1.3%) |
| 6 to 18 Years | 10,960 (98.6%) | 155 (1.4%) |
| 19 to 25 Years | 12,510 (91.7%) | 1,129 (8.3%) |
| 26 to 34 Years | 7,936 (92.3%) | 661 (7.7%) |
| 35 to 44 Years | 6,792 (90.4%) | 720 (9.6%) |
| 45 to 54 Years | 6,184 (95.8%) | 269 (4.2%) |
| 55 to 64 Years | 6,404 (96.2%) | 250 (3.8%) |
| 65 to 74 Years | 5,133 (99.7%) | 14 (0.3%) |
| 75 Years and older | 3,235 (99.4%) | 21 (0.6%) |
| Total | 64,069 (95.1%) | 3,286 (4.9%) |
Health Insurance Coverage by Citizenship Status in St Cloud
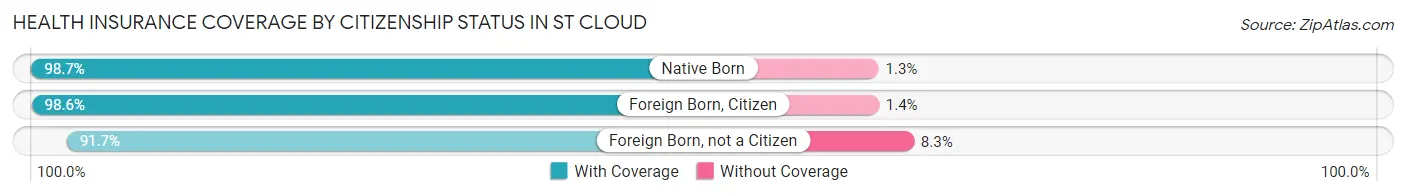
| Citizenship Status | With Coverage | Without Coverage |
| Native Born | 4,915 (98.7%) | 67 (1.3%) |
| Foreign Born, Citizen | 10,960 (98.6%) | 155 (1.4%) |
| Foreign Born, not a Citizen | 12,510 (91.7%) | 1,129 (8.3%) |
Health Insurance Coverage by Household Income in St Cloud
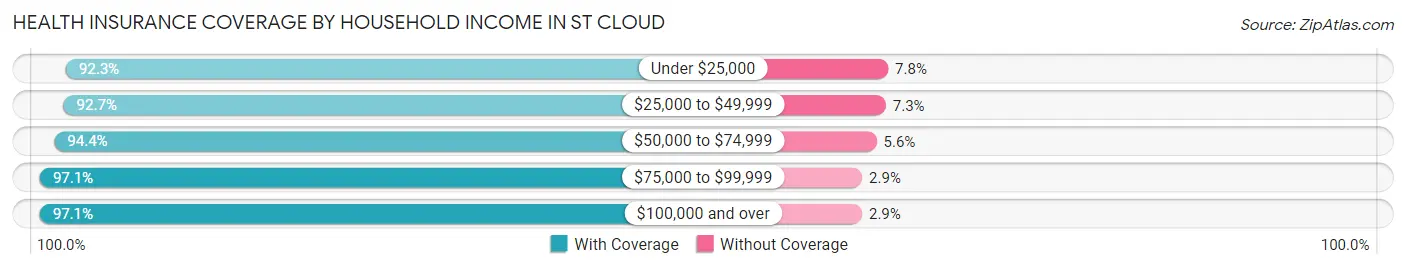
| Household Income | With Coverage | Without Coverage |
| Under $25,000 | 7,670 (92.2%) | 644 (7.7%) |
| $25,000 to $49,999 | 12,363 (92.7%) | 977 (7.3%) |
| $50,000 to $74,999 | 11,747 (94.4%) | 696 (5.6%) |
| $75,000 to $99,999 | 10,763 (97.1%) | 319 (2.9%) |
| $100,000 and over | 18,645 (97.1%) | 549 (2.9%) |
Public vs Private Health Insurance Coverage by Age in St Cloud
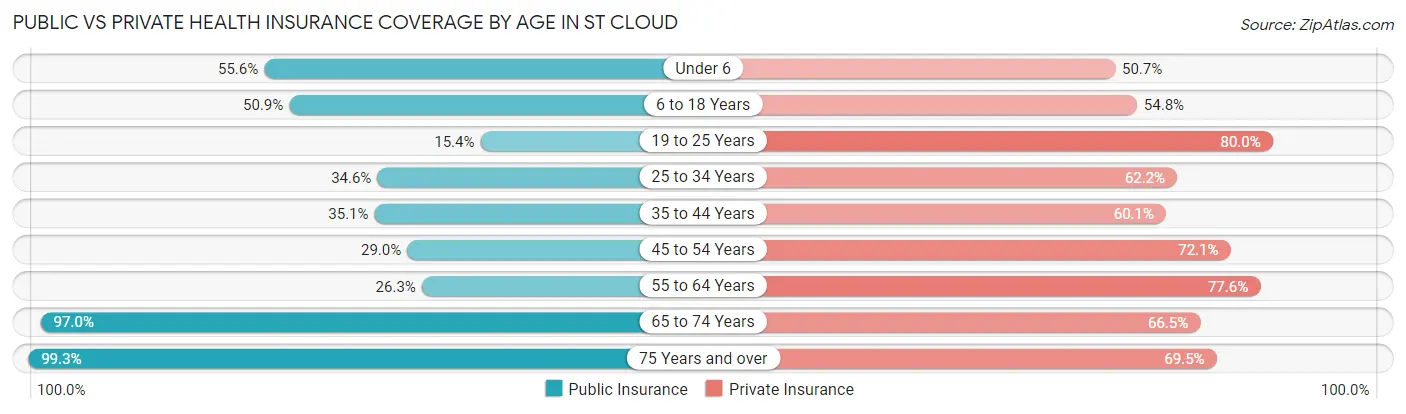
| Age Bracket | Public Insurance | Private Insurance |
| Under 6 | 2,768 (55.6%) | 2,527 (50.7%) |
| 6 to 18 Years | 5,660 (50.9%) | 6,089 (54.8%) |
| 19 to 25 Years | 2,103 (15.4%) | 10,904 (79.9%) |
| 25 to 34 Years | 2,970 (34.5%) | 5,347 (62.2%) |
| 35 to 44 Years | 2,635 (35.1%) | 4,517 (60.1%) |
| 45 to 54 Years | 1,872 (29.0%) | 4,653 (72.1%) |
| 55 to 64 Years | 1,750 (26.3%) | 5,165 (77.6%) |
| 65 to 74 Years | 4,994 (97.0%) | 3,422 (66.5%) |
| 75 Years and over | 3,234 (99.3%) | 2,264 (69.5%) |
| Total | 27,986 (41.5%) | 44,888 (66.6%) |
Disability Status by Sex by Age in St Cloud
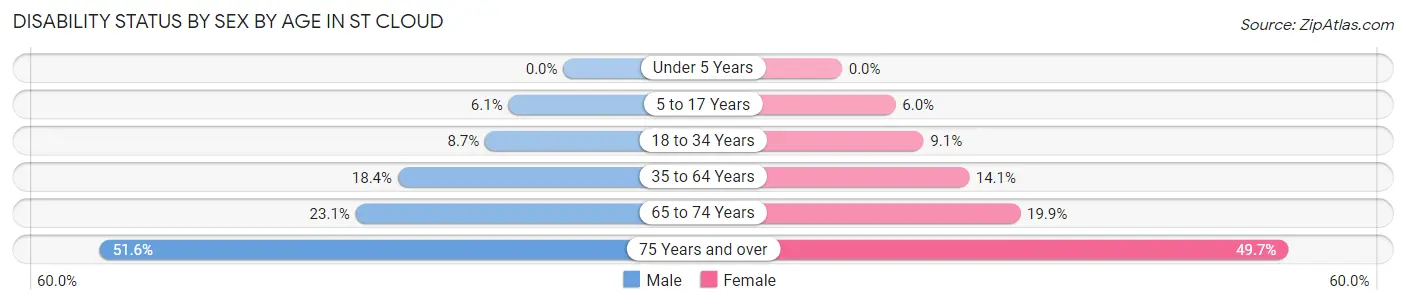
| Age Bracket | Male | Female |
| Under 5 Years | 0 (0.0%) | 0 (0.0%) |
| 5 to 17 Years | 308 (6.1%) | 319 (6.0%) |
| 18 to 34 Years | 1,059 (8.7%) | 1,042 (9.1%) |
| 35 to 64 Years | 1,954 (18.4%) | 1,416 (14.1%) |
| 65 to 74 Years | 559 (23.1%) | 542 (19.9%) |
| 75 Years and over | 601 (51.6%) | 1,040 (49.7%) |
Disability Class by Sex by Age in St Cloud
Disability Class: Hearing Difficulty
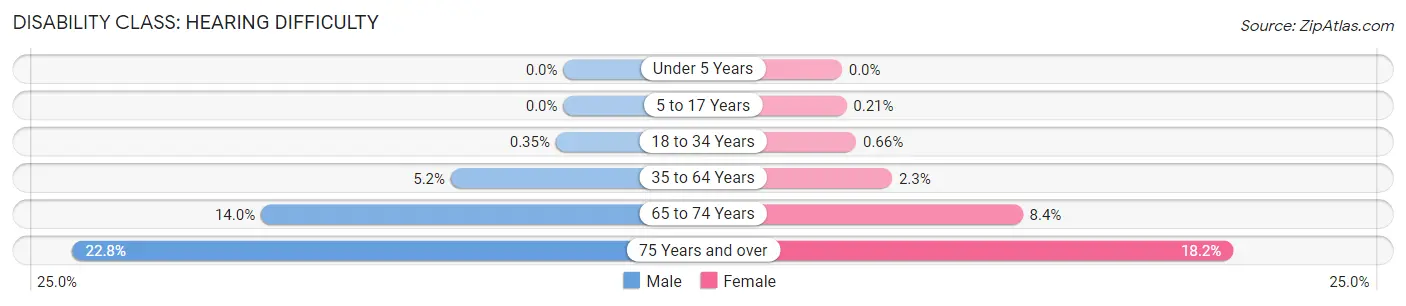
| Age Bracket | Male | Female |
| Under 5 Years | 0 (0.0%) | 0 (0.0%) |
| 5 to 17 Years | 0 (0.0%) | 11 (0.2%) |
| 18 to 34 Years | 43 (0.4%) | 76 (0.7%) |
| 35 to 64 Years | 554 (5.2%) | 233 (2.3%) |
| 65 to 74 Years | 339 (14.0%) | 229 (8.4%) |
| 75 Years and over | 265 (22.8%) | 380 (18.2%) |
Disability Class: Vision Difficulty
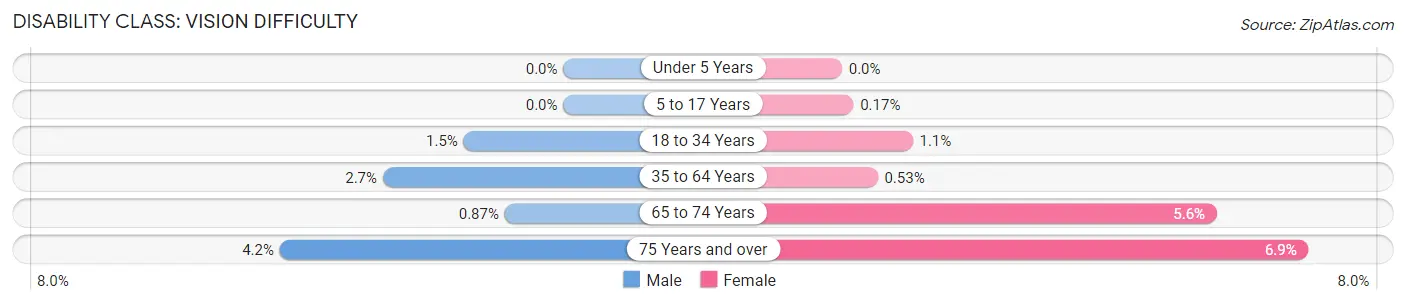
| Age Bracket | Male | Female |
| Under 5 Years | 0 (0.0%) | 0 (0.0%) |
| 5 to 17 Years | 0 (0.0%) | 9 (0.2%) |
| 18 to 34 Years | 180 (1.5%) | 120 (1.1%) |
| 35 to 64 Years | 284 (2.7%) | 53 (0.5%) |
| 65 to 74 Years | 21 (0.9%) | 152 (5.6%) |
| 75 Years and over | 49 (4.2%) | 145 (6.9%) |
Disability Class: Cognitive Difficulty
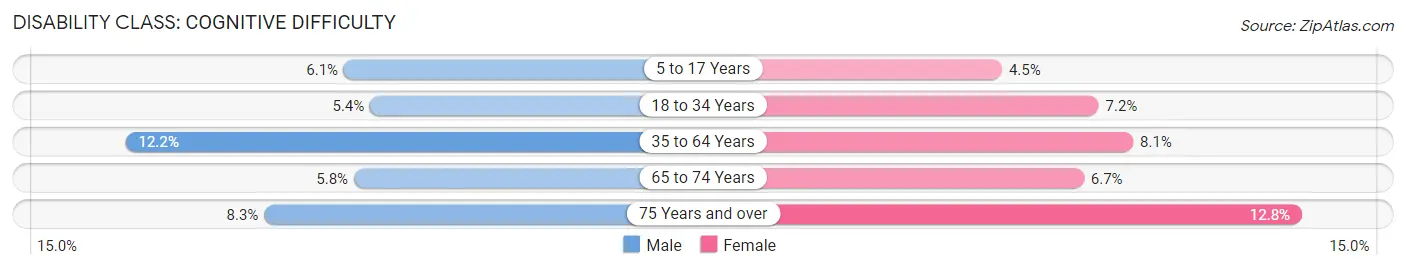
| Age Bracket | Male | Female |
| 5 to 17 Years | 308 (6.1%) | 239 (4.5%) |
| 18 to 34 Years | 654 (5.4%) | 820 (7.1%) |
| 35 to 64 Years | 1,293 (12.2%) | 812 (8.1%) |
| 65 to 74 Years | 141 (5.8%) | 184 (6.7%) |
| 75 Years and over | 97 (8.3%) | 268 (12.8%) |
Disability Class: Ambulatory Difficulty
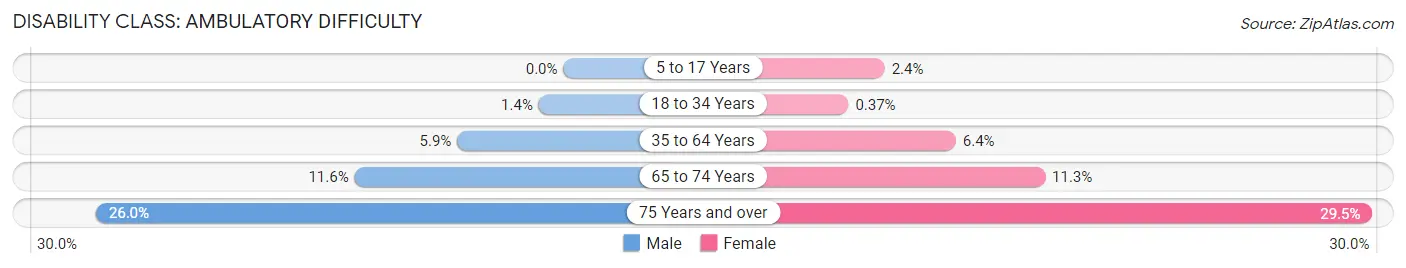
| Age Bracket | Male | Female |
| 5 to 17 Years | 0 (0.0%) | 128 (2.4%) |
| 18 to 34 Years | 166 (1.4%) | 42 (0.4%) |
| 35 to 64 Years | 627 (5.9%) | 636 (6.4%) |
| 65 to 74 Years | 281 (11.6%) | 309 (11.3%) |
| 75 Years and over | 303 (26.0%) | 618 (29.5%) |
Disability Class: Self-Care Difficulty
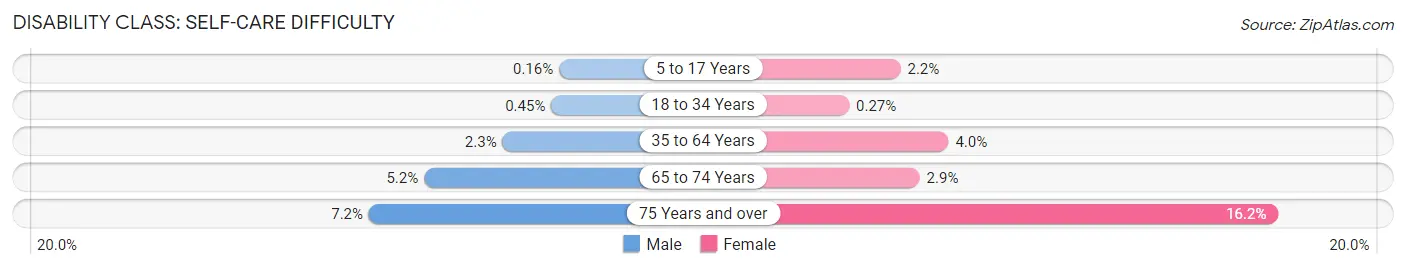
| Age Bracket | Male | Female |
| 5 to 17 Years | 8 (0.2%) | 117 (2.2%) |
| 18 to 34 Years | 55 (0.4%) | 31 (0.3%) |
| 35 to 64 Years | 240 (2.3%) | 397 (4.0%) |
| 65 to 74 Years | 125 (5.2%) | 79 (2.9%) |
| 75 Years and over | 84 (7.2%) | 339 (16.2%) |
Technology Access in St Cloud
Computing Device Access in St Cloud
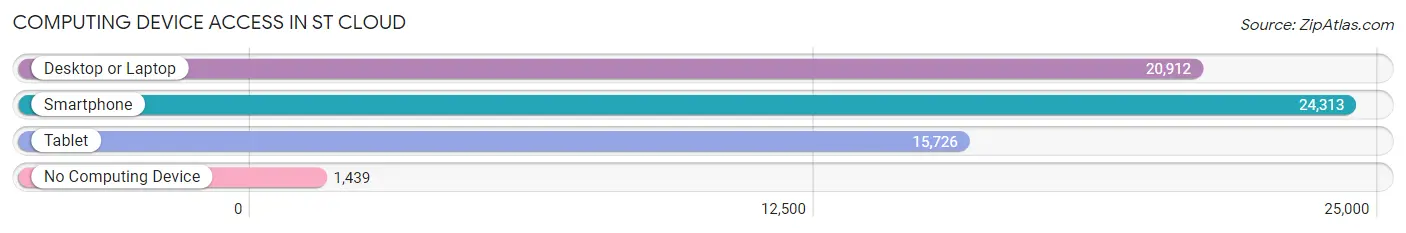
| Device Type | # Households | % Households |
| Desktop or Laptop | 20,912 | 76.2% |
| Smartphone | 24,313 | 88.6% |
| Tablet | 15,726 | 57.3% |
| No Computing Device | 1,439 | 5.2% |
| Total | 27,453 | 100.0% |
Internet Access in St Cloud
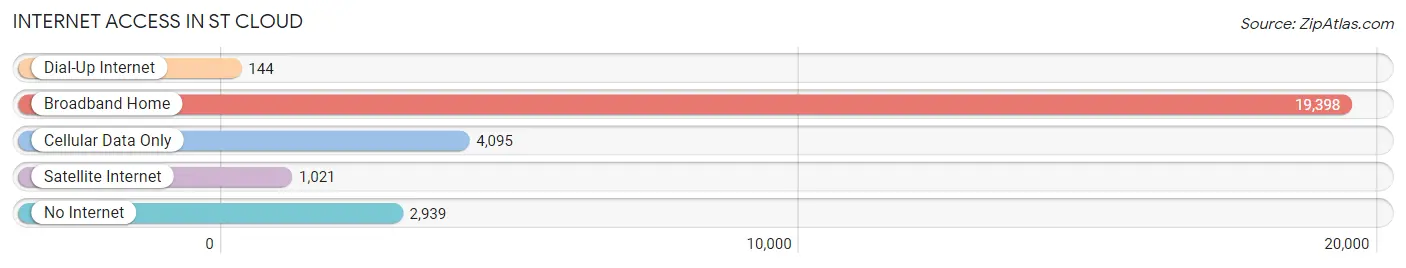
| Internet Type | # Households | % Households |
| Dial-Up Internet | 144 | 0.5% |
| Broadband Home | 19,398 | 70.7% |
| Cellular Data Only | 4,095 | 14.9% |
| Satellite Internet | 1,021 | 3.7% |
| No Internet | 2,939 | 10.7% |
| Total | 27,453 | 100.0% |
St Cloud Summary
St. Cloud, Minnesota is a city located in the central part of the state, about an hour northwest of Minneapolis. It is the largest city in the St. Cloud metropolitan area, which includes the cities of Sauk Rapids, Sartell, and Waite Park. The city is situated on the banks of the Mississippi River and is home to a population of over 67,000 people.
History
The area that is now St. Cloud was first settled by the Ojibwe people in the early 1800s. The first European settlers arrived in the area in 1851, and the city was officially incorporated in 1856. The city was named after the nearby St. Cloud rapids, which were named after the French explorer Pierre Gaultier de Varennes, Sieur de La Verendrye, who explored the area in the 1700s.
The city grew rapidly in the late 19th century, and by the early 20th century, it had become a major industrial center. The city was home to several large factories, including the St. Cloud Woolen Mills, the St. Cloud Brewing Company, and the St. Cloud Canning Company. The city also became a major transportation hub, with the Great Northern Railway and the Northern Pacific Railway both running through the city.
Geography
St. Cloud is located in the central part of Minnesota, about an hour northwest of Minneapolis. The city is situated on the banks of the Mississippi River, and is surrounded by several lakes, including Lake George, Lake Wobegon, and Lake Maria. The city is located in a region of rolling hills and forests, and is home to several parks and nature preserves.
Economy
St. Cloud is home to a diverse economy, with a variety of industries represented in the city. The city is home to several large employers, including CentraCare Health System, St. Cloud State University, and the St. Cloud Times newspaper. The city is also home to several manufacturing companies, including Electrolux, 3M, and Andersen Windows.
The city is also home to a thriving tourism industry, with several attractions, including the St. Cloud River's Edge Convention Center, the St. Cloud Civic Center, and the St. Cloud Children's Museum. The city is also home to several festivals and events, including the St. Cloud Granite City Days Festival and the St. Cloud Art Crawl.
Demographics
As of the 2010 census, the population of St. Cloud was 67,109. The city has a population that is predominantly white (90.2%), with smaller percentages of African Americans (3.2%), Asians (2.3%), and Hispanics (2.2%). The median household income in the city is $45,945, and the median home value is $164,400.
St. Cloud is home to a variety of religious denominations, including Catholicism (37.2%), Lutheranism (17.2%), and Islam (2.2%). The city is also home to a variety of educational institutions, including St. Cloud State University, St. Cloud Technical and Community College, and the College of St. Benedict.
Conclusion
St. Cloud, Minnesota is a city located in the central part of the state, about an hour northwest of Minneapolis. It is the largest city in the St. Cloud metropolitan area, and is home to a population of over 67,000 people. The city is situated on the banks of the Mississippi River and is home to a diverse economy, with a variety of industries represented in the city. The city is also home to a variety of religious denominations, and is home to several educational institutions.
Common Questions
What is Per Capita Income in St Cloud?
Per Capita income in St Cloud is $31,230.
What is the Median Family Income in St Cloud?
Median Family Income in St Cloud is $76,384.
What is the Median Household income in St Cloud?
Median Household Income in St Cloud is $58,910.
What is Income or Wage Gap in St Cloud?
Income or Wage Gap in St Cloud is 29.8%.
Women in St Cloud earn 70.2 cents for every dollar earned by a man.
What is Family Income Deficit in St Cloud?
Family Income Deficit in St Cloud is $8,328.
Families that are below poverty line in St Cloud earn $8,328 less on average than the poverty threshold level.
What is Inequality or Gini Index in St Cloud?
Inequality or Gini Index in St Cloud is 0.44.
What is the Total Population of St Cloud?
Total Population of St Cloud is 68,910.
What is the Total Male Population of St Cloud?
Total Male Population of St Cloud is 34,798.
What is the Total Female Population of St Cloud?
Total Female Population of St Cloud is 34,112.
What is the Ratio of Males per 100 Females in St Cloud?
There are 102.01 Males per 100 Females in St Cloud.
What is the Ratio of Females per 100 Males in St Cloud?
There are 98.03 Females per 100 Males in St Cloud.
What is the Median Population Age in St Cloud?
Median Population Age in St Cloud is 30.3 Years.
What is the Average Family Size in St Cloud
Average Family Size in St Cloud is 3.0 People.
What is the Average Household Size in St Cloud
Average Household Size in St Cloud is 2.4 People.
How Large is the Labor Force in St Cloud?
There are 39,026 People in the Labor Forcein in St Cloud.
What is the Percentage of People in the Labor Force in St Cloud?
70.3% of People are in the Labor Force in St Cloud.
What is the Unemployment Rate in St Cloud?
Unemployment Rate in St Cloud is 7.1%.