Huntersville, NC Map & Demographics
Huntersville Map
Huntersville Overview
$54,989
PER CAPITA INCOME
$133,947
AVG FAMILY INCOME
$112,893
AVG HOUSEHOLD INCOME
41.4%
WAGE / INCOME GAP [ % ]
58.6¢/ $1
WAGE / INCOME GAP [ $ ]
0.41
INEQUALITY / GINI INDEX
61,202
TOTAL POPULATION
30,467
MALE POPULATION
30,735
FEMALE POPULATION
99.13
MALES / 100 FEMALES
100.88
FEMALES / 100 MALES
39.8
MEDIAN AGE
3.1
AVG FAMILY SIZE
2.6
AVG HOUSEHOLD SIZE
34,705
LABOR FORCE [ PEOPLE ]
72.9%
PERCENT IN LABOR FORCE
4.1%
UNEMPLOYMENT RATE
Huntersville Zip Codes
Huntersville Area Codes
Income in Huntersville
Income Overview in Huntersville
Per Capita Income in Huntersville is $54,989, while median incomes of families and households are $133,947 and $112,893 respectively.
| Characteristic | Number | Measure |
| Per Capita Income | 61,202 | $54,989 |
| Median Family Income | 16,712 | $133,947 |
| Mean Family Income | 16,712 | $162,936 |
| Median Household Income | 22,974 | $112,893 |
| Mean Household Income | 22,974 | $144,607 |
| Income Deficit | 16,712 | $0 |
| Wage / Income Gap (%) | 61,202 | 41.43% |
| Wage / Income Gap ($) | 61,202 | 58.57¢ per $1 |
| Gini / Inequality Index | 61,202 | 0.41 |
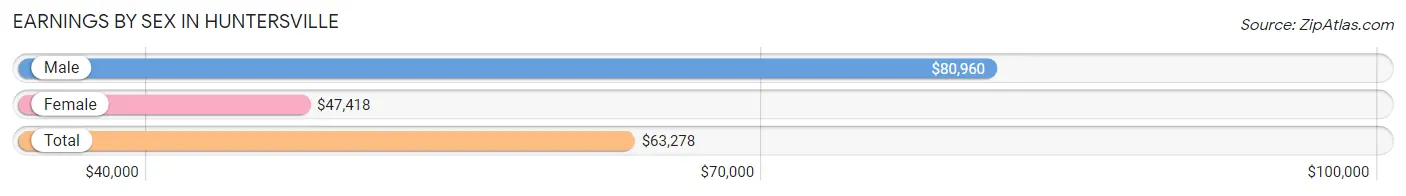
Earnings by Sex in Huntersville
Average Earnings in Huntersville are $63,278, $80,960 for men and $47,418 for women, a difference of 41.4%.
| Sex | Number | Average Earnings |
| Male | 18,537 (52.1%) | $80,960 |
| Female | 17,013 (47.9%) | $47,418 |
| Total | 35,550 (100.0%) | $63,278 |
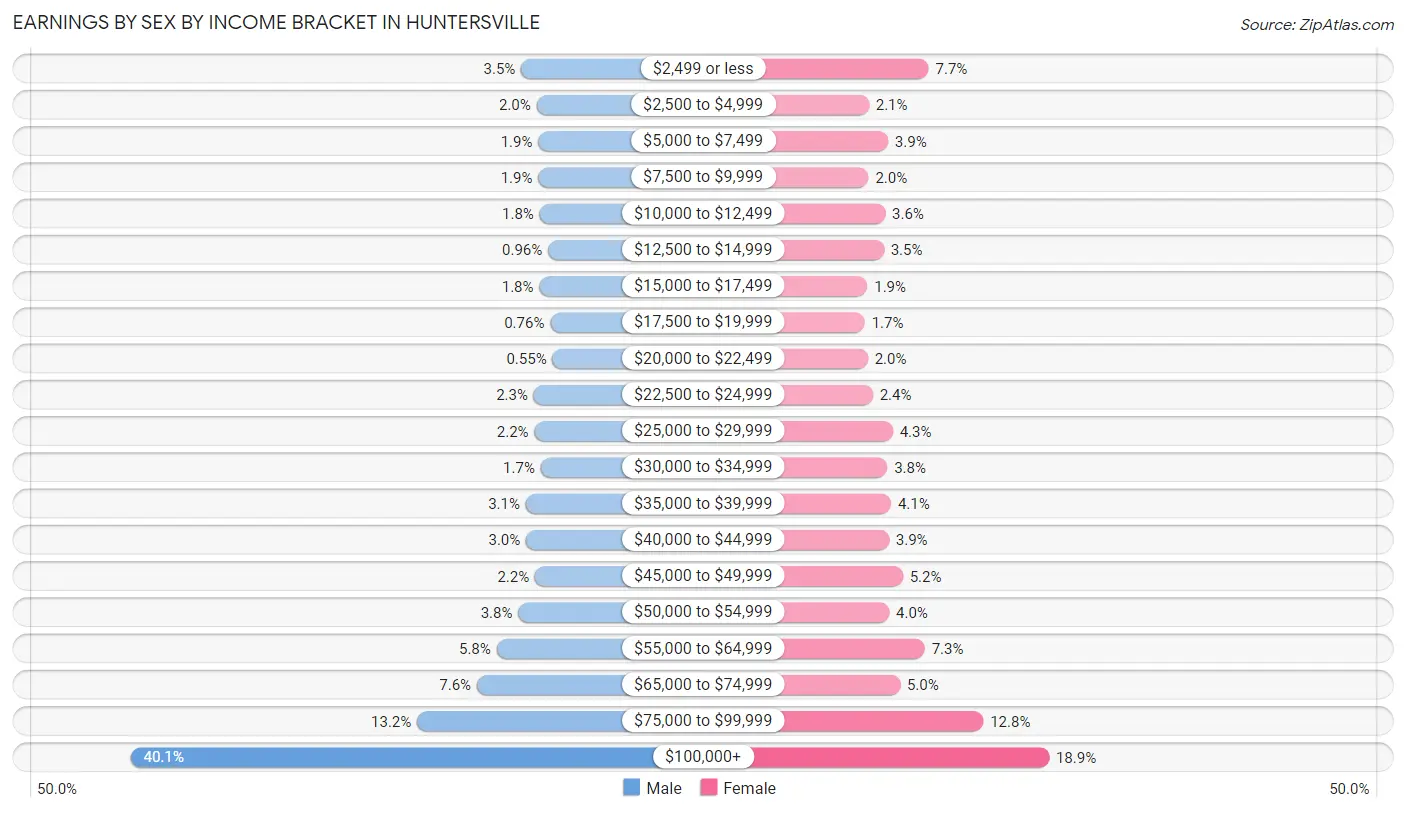
Earnings by Sex by Income Bracket in Huntersville
The most common earnings brackets in Huntersville are $100,000+ for men (7,428 | 40.1%) and $100,000+ for women (3,222 | 18.9%).
| Income | Male | Female |
| $2,499 or less | 646 (3.5%) | 1,304 (7.7%) |
| $2,500 to $4,999 | 379 (2.0%) | 350 (2.1%) |
| $5,000 to $7,499 | 348 (1.9%) | 655 (3.8%) |
| $7,500 to $9,999 | 349 (1.9%) | 346 (2.0%) |
| $10,000 to $12,499 | 325 (1.8%) | 611 (3.6%) |
| $12,500 to $14,999 | 178 (1.0%) | 589 (3.5%) |
| $15,000 to $17,499 | 330 (1.8%) | 327 (1.9%) |
| $17,500 to $19,999 | 141 (0.8%) | 285 (1.7%) |
| $20,000 to $22,499 | 102 (0.5%) | 333 (2.0%) |
| $22,500 to $24,999 | 426 (2.3%) | 413 (2.4%) |
| $25,000 to $29,999 | 415 (2.2%) | 731 (4.3%) |
| $30,000 to $34,999 | 305 (1.7%) | 644 (3.8%) |
| $35,000 to $39,999 | 566 (3.0%) | 705 (4.1%) |
| $40,000 to $44,999 | 560 (3.0%) | 670 (3.9%) |
| $45,000 to $49,999 | 405 (2.2%) | 892 (5.2%) |
| $50,000 to $54,999 | 695 (3.7%) | 673 (4.0%) |
| $55,000 to $64,999 | 1,072 (5.8%) | 1,242 (7.3%) |
| $65,000 to $74,999 | 1,415 (7.6%) | 847 (5.0%) |
| $75,000 to $99,999 | 2,452 (13.2%) | 2,174 (12.8%) |
| $100,000+ | 7,428 (40.1%) | 3,222 (18.9%) |
| Total | 18,537 (100.0%) | 17,013 (100.0%) |
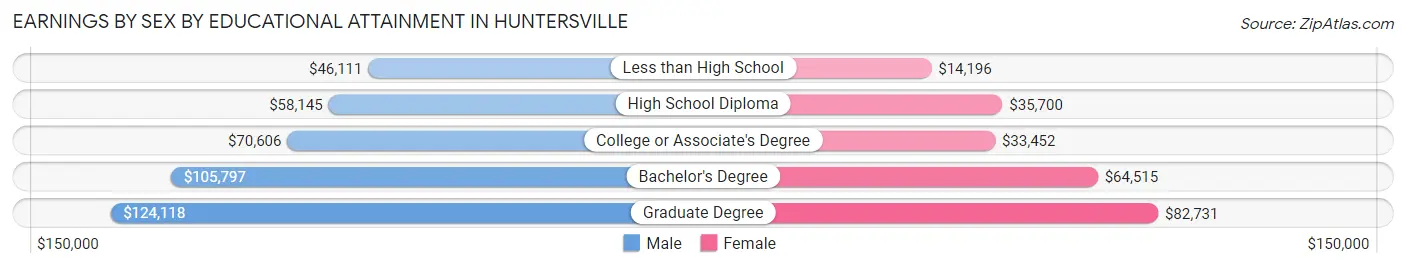
Earnings by Sex by Educational Attainment in Huntersville
Average earnings in Huntersville are $90,519 for men and $54,461 for women, a difference of 39.8%. Men with an educational attainment of graduate degree enjoy the highest average annual earnings of $124,118, while those with less than high school education earn the least with $46,111. Women with an educational attainment of graduate degree earn the most with the average annual earnings of $82,731, while those with less than high school education have the smallest earnings of $14,196.
| Educational Attainment | Male Income | Female Income |
| Less than High School | $46,111 | $14,196 |
| High School Diploma | $58,145 | $35,700 |
| College or Associate's Degree | $70,606 | $33,452 |
| Bachelor's Degree | $105,797 | $64,515 |
| Graduate Degree | $124,118 | $82,731 |
| Total | $90,519 | $54,461 |
Family Income in Huntersville
Family Income Brackets in Huntersville
According to the Huntersville family income data, there are 4,596 families falling into the $200,000+ income range, which is the most common income bracket and makes up 27.5% of all families. Conversely, the $10,000 to $14,999 income bracket is the least frequent group with only 167 families (1.0%) belonging to this category.
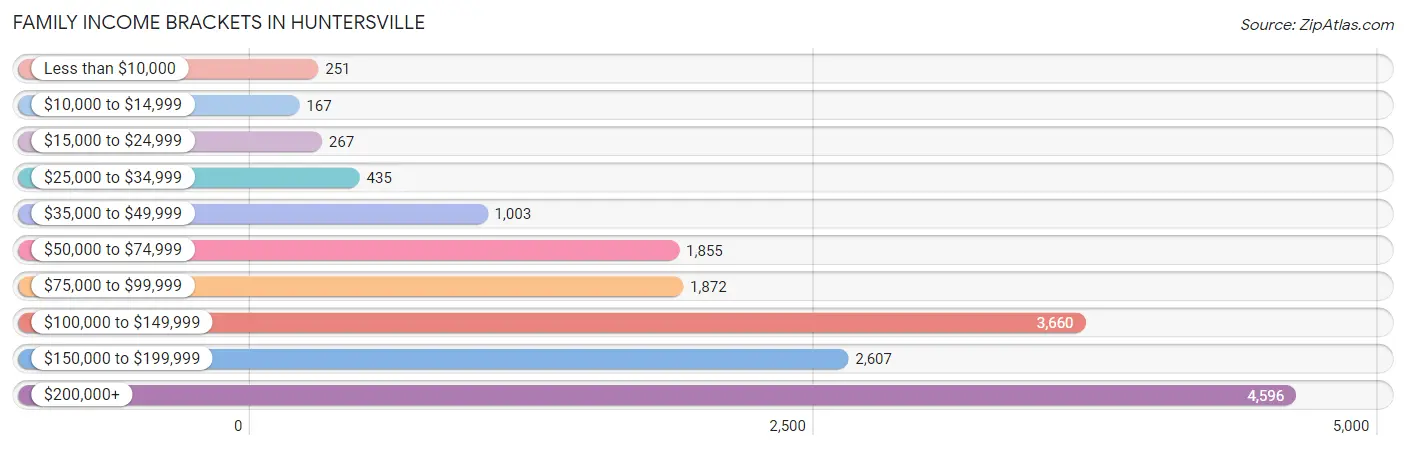
| Income Bracket | # Families | % Families |
| Less than $10,000 | 251 | 1.5% |
| $10,000 to $14,999 | 167 | 1.0% |
| $15,000 to $24,999 | 267 | 1.6% |
| $25,000 to $34,999 | 435 | 2.6% |
| $35,000 to $49,999 | 1,003 | 6.0% |
| $50,000 to $74,999 | 1,855 | 11.1% |
| $75,000 to $99,999 | 1,872 | 11.2% |
| $100,000 to $149,999 | 3,660 | 21.9% |
| $150,000 to $199,999 | 2,607 | 15.6% |
| $200,000+ | 4,596 | 27.5% |
Family Income by Famaliy Size in Huntersville
6-person families (239 | 1.4%) account for the highest median family income in Huntersville with $240,625 per family, while 2-person families (6,731 | 40.3%) have the highest median income of $56,958 per family member.
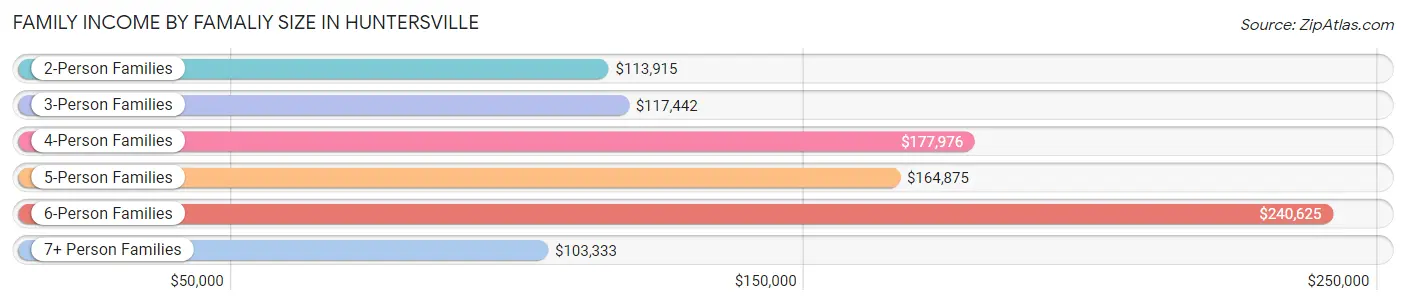
| Income Bracket | # Families | Median Income |
| 2-Person Families | 6,731 (40.3%) | $113,915 |
| 3-Person Families | 4,760 (28.5%) | $117,442 |
| 4-Person Families | 3,648 (21.8%) | $177,976 |
| 5-Person Families | 1,238 (7.4%) | $164,875 |
| 6-Person Families | 239 (1.4%) | $240,625 |
| 7+ Person Families | 96 (0.6%) | $103,333 |
| Total | 16,712 (100.0%) | $133,947 |
Family Income by Number of Earners in Huntersville
The median family income in Huntersville is $133,947, with families comprising 3+ earners (1,889) having the highest median family income of $187,917, while families with no earners (1,912) have the lowest median family income of $63,159, accounting for 11.3% and 11.4% of families, respectively.
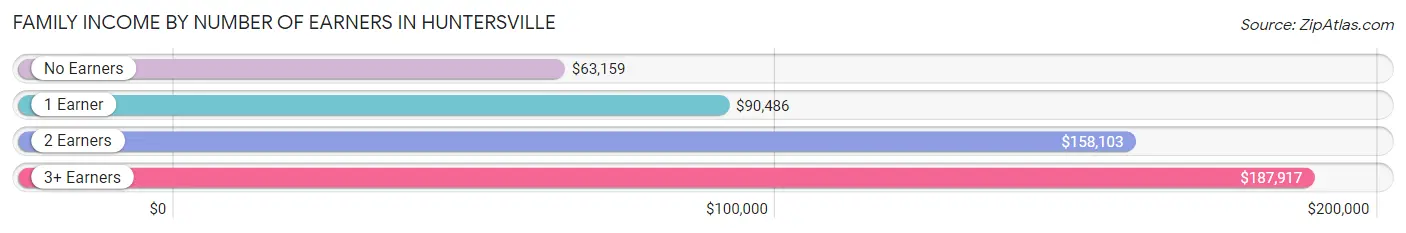
| Number of Earners | # Families | Median Income |
| No Earners | 1,912 (11.4%) | $63,159 |
| 1 Earner | 4,441 (26.6%) | $90,486 |
| 2 Earners | 8,470 (50.7%) | $158,103 |
| 3+ Earners | 1,889 (11.3%) | $187,917 |
| Total | 16,712 (100.0%) | $133,947 |
Household Income in Huntersville
Household Income Brackets in Huntersville
With 5,100 households falling in the category, the $200,000+ income range is the most frequent in Huntersville, accounting for 22.2% of all households. In contrast, only 299 households (1.3%) fall into the $10,000 to $14,999 income bracket, making it the least populous group.
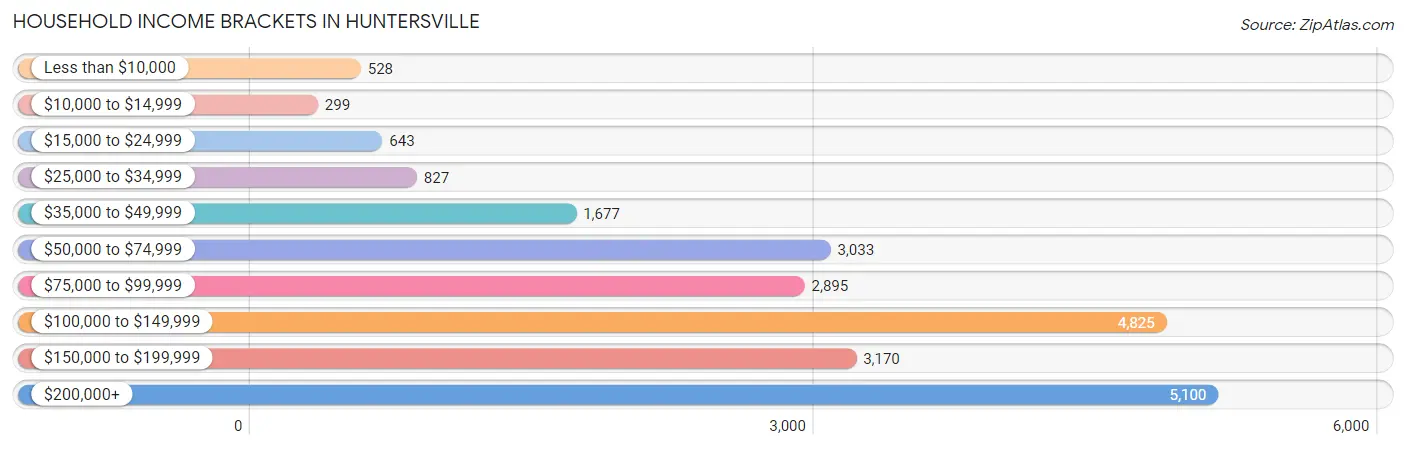
| Income Bracket | # Households | % Households |
| Less than $10,000 | 528 | 2.3% |
| $10,000 to $14,999 | 299 | 1.3% |
| $15,000 to $24,999 | 643 | 2.8% |
| $25,000 to $34,999 | 827 | 3.6% |
| $35,000 to $49,999 | 1,677 | 7.3% |
| $50,000 to $74,999 | 3,033 | 13.2% |
| $75,000 to $99,999 | 2,895 | 12.6% |
| $100,000 to $149,999 | 4,825 | 21.0% |
| $150,000 to $199,999 | 3,170 | 13.8% |
| $200,000+ | 5,100 | 22.2% |
Household Income by Householder Age in Huntersville
The median household income in Huntersville is $112,893, with the highest median household income of $132,881 found in the 25 to 44 years age bracket for the primary householder. A total of 8,042 households (35.0%) fall into this category. Meanwhile, the 65+ years age bracket for the primary householder has the lowest median household income of $64,379, with 4,516 households (19.7%) in this group.
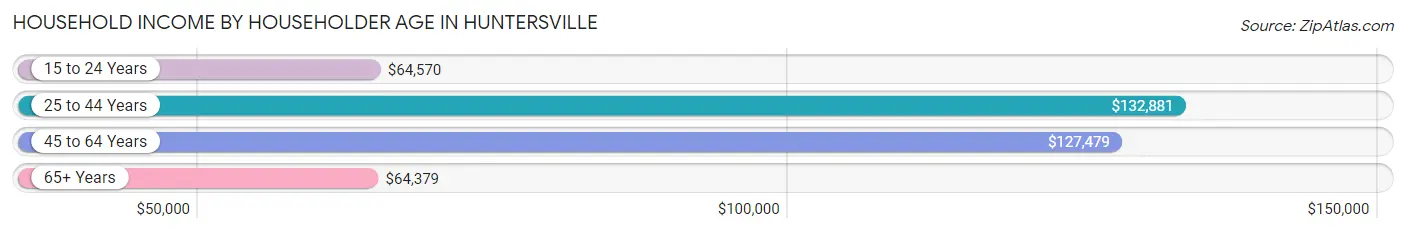
| Income Bracket | # Households | Median Income |
| 15 to 24 Years | 389 (1.7%) | $64,570 |
| 25 to 44 Years | 8,042 (35.0%) | $132,881 |
| 45 to 64 Years | 10,027 (43.6%) | $127,479 |
| 65+ Years | 4,516 (19.7%) | $64,379 |
| Total | 22,974 (100.0%) | $112,893 |
Poverty in Huntersville
Income Below Poverty by Sex and Age in Huntersville
With 4.8% poverty level for males and 3.7% for females among the residents of Huntersville, 12 to 14 year old males and 75 year old and over females are the most vulnerable to poverty, with 169 males (12.8%) and 99 females (7.3%) in their respective age groups living below the poverty level.
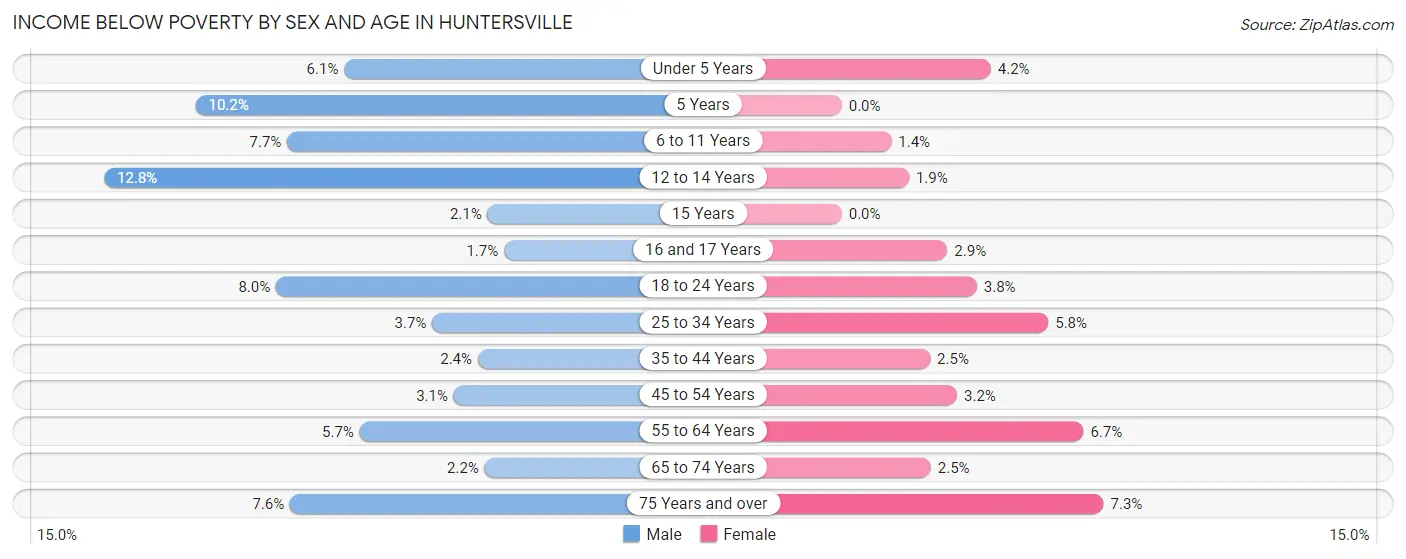
| Age Bracket | Male | Female |
| Under 5 Years | 119 (6.1%) | 69 (4.2%) |
| 5 Years | 34 (10.2%) | 0 (0.0%) |
| 6 to 11 Years | 209 (7.7%) | 40 (1.4%) |
| 12 to 14 Years | 169 (12.8%) | 22 (1.9%) |
| 15 Years | 10 (2.1%) | 0 (0.0%) |
| 16 and 17 Years | 13 (1.7%) | 23 (2.9%) |
| 18 to 24 Years | 157 (8.0%) | 71 (3.8%) |
| 25 to 34 Years | 122 (3.6%) | 221 (5.8%) |
| 35 to 44 Years | 126 (2.4%) | 110 (2.5%) |
| 45 to 54 Years | 147 (3.0%) | 161 (3.2%) |
| 55 to 64 Years | 221 (5.7%) | 237 (6.7%) |
| 65 to 74 Years | 55 (2.2%) | 71 (2.5%) |
| 75 Years and over | 73 (7.6%) | 99 (7.3%) |
| Total | 1,455 (4.8%) | 1,124 (3.7%) |
Income Above Poverty by Sex and Age in Huntersville
According to the poverty statistics in Huntersville, males aged 16 and 17 years and females aged 5 years are the age groups that are most secure financially, with 98.4% of males and 100.0% of females in these age groups living above the poverty line.
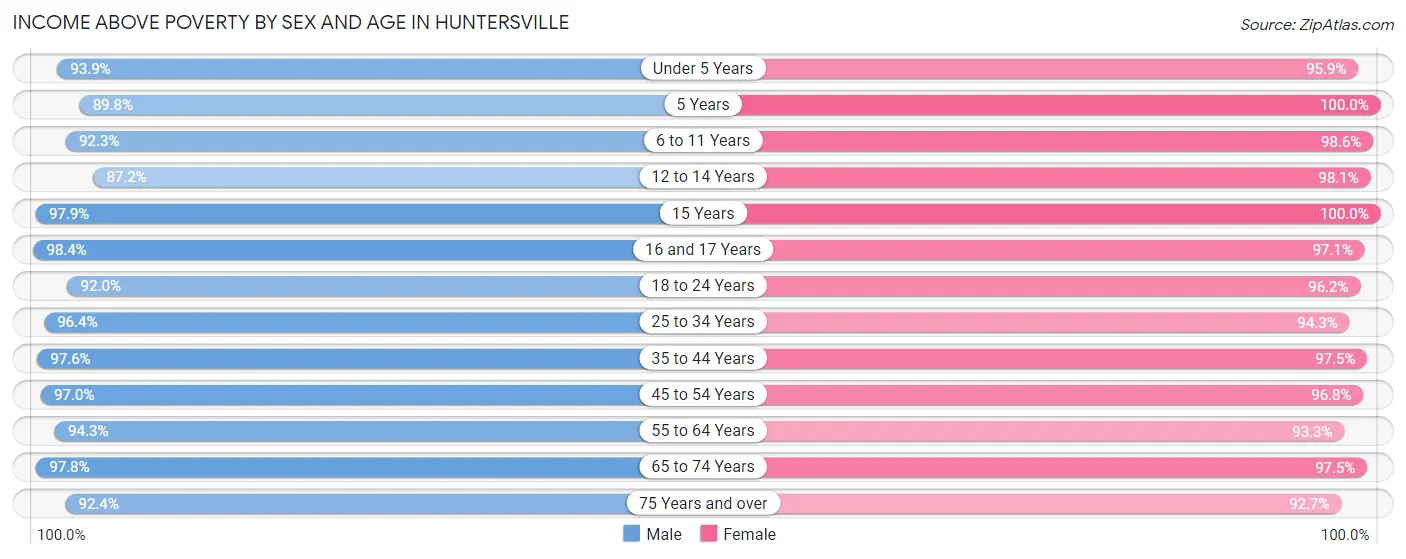
| Age Bracket | Male | Female |
| Under 5 Years | 1,833 (93.9%) | 1,592 (95.9%) |
| 5 Years | 298 (89.8%) | 447 (100.0%) |
| 6 to 11 Years | 2,508 (92.3%) | 2,865 (98.6%) |
| 12 to 14 Years | 1,152 (87.2%) | 1,157 (98.1%) |
| 15 Years | 463 (97.9%) | 446 (100.0%) |
| 16 and 17 Years | 774 (98.4%) | 760 (97.1%) |
| 18 to 24 Years | 1,806 (92.0%) | 1,818 (96.2%) |
| 25 to 34 Years | 3,224 (96.4%) | 3,625 (94.3%) |
| 35 to 44 Years | 5,177 (97.6%) | 4,367 (97.5%) |
| 45 to 54 Years | 4,669 (97.0%) | 4,853 (96.8%) |
| 55 to 64 Years | 3,677 (94.3%) | 3,286 (93.3%) |
| 65 to 74 Years | 2,456 (97.8%) | 2,795 (97.5%) |
| 75 Years and over | 886 (92.4%) | 1,259 (92.7%) |
| Total | 28,923 (95.2%) | 29,270 (96.3%) |
Income Below Poverty Among Married-Couple Families in Huntersville
The poverty statistics for married-couple families in Huntersville show that 1.4% or 190 of the total 13,242 families live below the poverty line. Families with 3 or 4 children have the highest poverty rate of 4.6%, comprising of 45 families. On the other hand, families with 5 or more children have the lowest poverty rate of 0.0%, which includes 0 families.
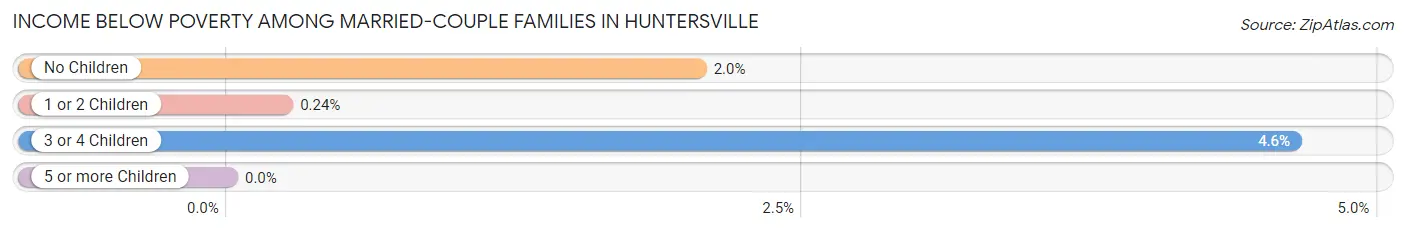
| Children | Above Poverty | Below Poverty |
| No Children | 6,296 (98.0%) | 131 (2.0%) |
| 1 or 2 Children | 5,810 (99.8%) | 14 (0.2%) |
| 3 or 4 Children | 927 (95.4%) | 45 (4.6%) |
| 5 or more Children | 19 (100.0%) | 0 (0.0%) |
| Total | 13,052 (98.6%) | 190 (1.4%) |
Income Below Poverty Among Single-Parent Households in Huntersville
According to the poverty data in Huntersville, 1.4% or 16 single-father households and 13.2% or 304 single-mother households are living below the poverty line. Among single-father households, those with no children have the highest poverty rate, with 14 households (2.5%) experiencing poverty. Likewise, among single-mother households, those with 3 or 4 children have the highest poverty rate, with 30 households (27.8%) falling below the poverty line.
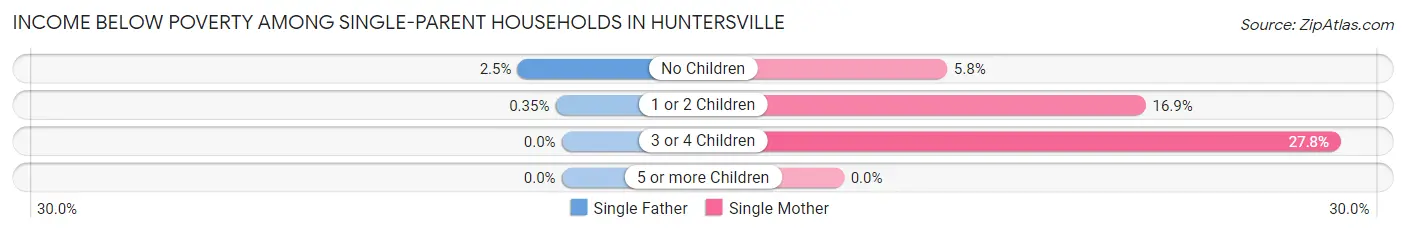
| Children | Single Father | Single Mother |
| No Children | 14 (2.5%) | 50 (5.8%) |
| 1 or 2 Children | 2 (0.4%) | 224 (16.9%) |
| 3 or 4 Children | 0 (0.0%) | 30 (27.8%) |
| 5 or more Children | 0 (0.0%) | 0 (0.0%) |
| Total | 16 (1.4%) | 304 (13.2%) |
Income Below Poverty Among Married-Couple vs Single-Parent Households in Huntersville
The poverty data for Huntersville shows that 190 of the married-couple family households (1.4%) and 320 of the single-parent households (9.2%) are living below the poverty level. Within the married-couple family households, those with 3 or 4 children have the highest poverty rate, with 45 households (4.6%) falling below the poverty line. Among the single-parent households, those with 3 or 4 children have the highest poverty rate, with 30 household (22.9%) living below poverty.
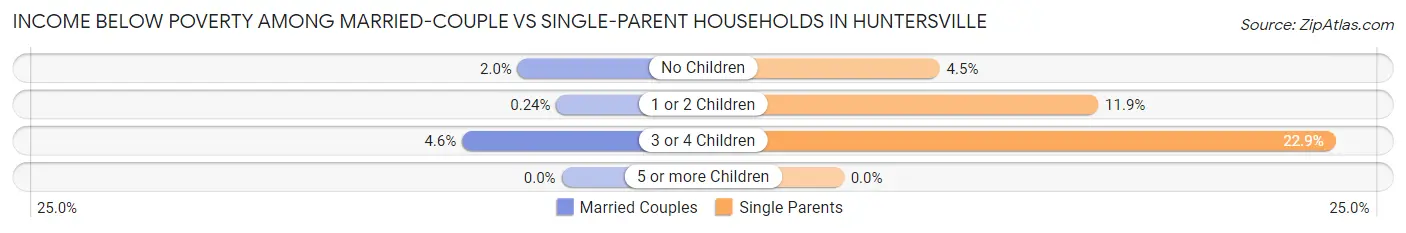
| Children | Married-Couple Families | Single-Parent Households |
| No Children | 131 (2.0%) | 64 (4.5%) |
| 1 or 2 Children | 14 (0.2%) | 226 (11.8%) |
| 3 or 4 Children | 45 (4.6%) | 30 (22.9%) |
| 5 or more Children | 0 (0.0%) | 0 (0.0%) |
| Total | 190 (1.4%) | 320 (9.2%) |
Race in Huntersville
The most populous races in Huntersville are White / Caucasian (45,427 | 74.2%), Black / African American (8,073 | 13.2%), and Hispanic or Latino (4,401 | 7.2%).
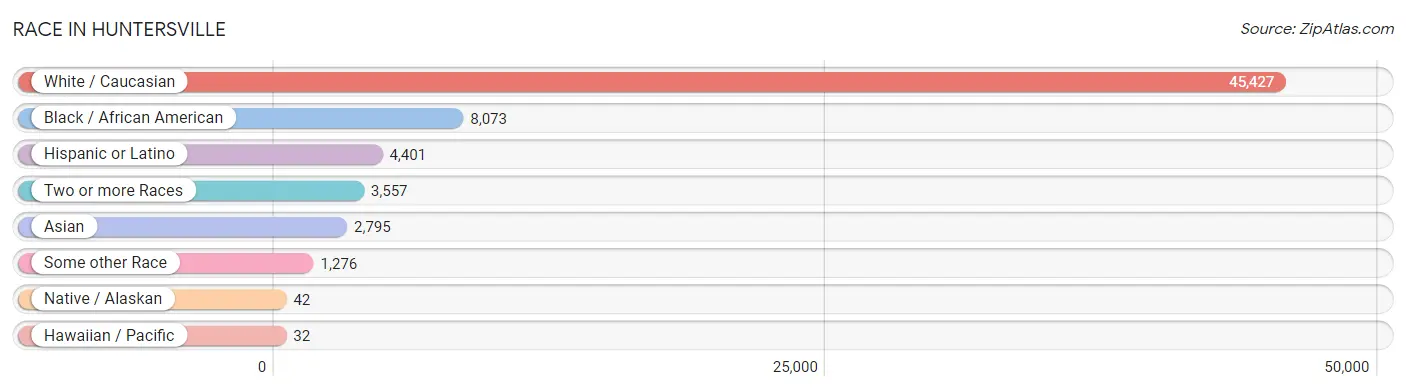
| Race | # Population | % Population |
| Asian | 2,795 | 4.6% |
| Black / African American | 8,073 | 13.2% |
| Hawaiian / Pacific | 32 | 0.1% |
| Hispanic or Latino | 4,401 | 7.2% |
| Native / Alaskan | 42 | 0.1% |
| White / Caucasian | 45,427 | 74.2% |
| Two or more Races | 3,557 | 5.8% |
| Some other Race | 1,276 | 2.1% |
| Total | 61,202 | 100.0% |
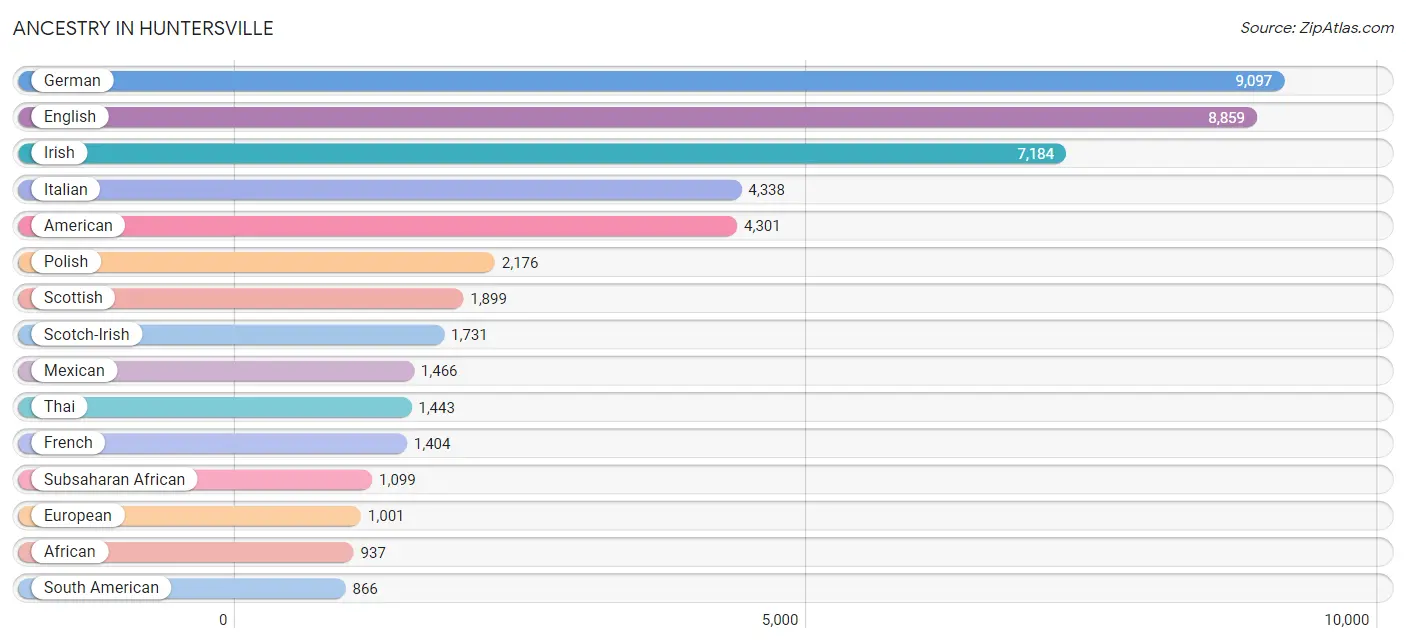
Ancestry in Huntersville
The most populous ancestries reported in Huntersville are German (9,097 | 14.9%), English (8,859 | 14.5%), Irish (7,184 | 11.7%), Italian (4,338 | 7.1%), and American (4,301 | 7.0%), together accounting for 55.2% of all Huntersville residents.
| Ancestry | # Population | % Population |
| African | 937 | 1.5% |
| American | 4,301 | 7.0% |
| Apache | 7 | 0.0% |
| Arab | 386 | 0.6% |
| Argentinean | 41 | 0.1% |
| Armenian | 7 | 0.0% |
| Australian | 43 | 0.1% |
| Austrian | 105 | 0.2% |
| Belgian | 40 | 0.1% |
| Bhutanese | 105 | 0.2% |
| Blackfeet | 33 | 0.1% |
| Bolivian | 29 | 0.1% |
| Brazilian | 48 | 0.1% |
| British | 460 | 0.7% |
| British West Indian | 12 | 0.0% |
| Bulgarian | 32 | 0.1% |
| Burmese | 607 | 1.0% |
| Canadian | 244 | 0.4% |
| Cape Verdean | 25 | 0.0% |
| Central American | 353 | 0.6% |
| Central American Indian | 5 | 0.0% |
| Cherokee | 194 | 0.3% |
| Colombian | 502 | 0.8% |
| Costa Rican | 22 | 0.0% |
| Croatian | 9 | 0.0% |
| Cuban | 564 | 0.9% |
| Czech | 184 | 0.3% |
| Czechoslovakian | 19 | 0.0% |
| Danish | 121 | 0.2% |
| Dominican | 207 | 0.3% |
| Dutch | 498 | 0.8% |
| Eastern European | 184 | 0.3% |
| Ecuadorian | 55 | 0.1% |
| English | 8,859 | 14.5% |
| Estonian | 11 | 0.0% |
| European | 1,001 | 1.6% |
| Filipino | 10 | 0.0% |
| Finnish | 250 | 0.4% |
| French | 1,404 | 2.3% |
| French Canadian | 338 | 0.5% |
| German | 9,097 | 14.9% |
| Greek | 240 | 0.4% |
| Guamanian / Chamorro | 45 | 0.1% |
| Guatemalan | 81 | 0.1% |
| Guyanese | 29 | 0.1% |
| Haitian | 16 | 0.0% |
| Honduran | 147 | 0.2% |
| Hungarian | 202 | 0.3% |
| Indian (Asian) | 276 | 0.4% |
| Indonesian | 15 | 0.0% |
| Iranian | 16 | 0.0% |
| Irish | 7,184 | 11.7% |
| Iroquois | 24 | 0.0% |
| Italian | 4,338 | 7.1% |
| Jamaican | 187 | 0.3% |
| Japanese | 11 | 0.0% |
| Jordanian | 12 | 0.0% |
| Korean | 295 | 0.5% |
| Latvian | 12 | 0.0% |
| Lebanese | 268 | 0.4% |
| Lithuanian | 65 | 0.1% |
| Lumbee | 33 | 0.1% |
| Macedonian | 29 | 0.1% |
| Malaysian | 24 | 0.0% |
| Mexican | 1,466 | 2.4% |
| Native Hawaiian | 11 | 0.0% |
| Nicaraguan | 12 | 0.0% |
| Nigerian | 148 | 0.2% |
| Northern European | 175 | 0.3% |
| Norwegian | 653 | 1.1% |
| Osage | 16 | 0.0% |
| Paiute | 52 | 0.1% |
| Pakistani | 77 | 0.1% |
| Palestinian | 34 | 0.1% |
| Panamanian | 56 | 0.1% |
| Pennsylvania German | 23 | 0.0% |
| Peruvian | 21 | 0.0% |
| Polish | 2,176 | 3.6% |
| Portuguese | 106 | 0.2% |
| Puerto Rican | 739 | 1.2% |
| Romanian | 124 | 0.2% |
| Russian | 208 | 0.3% |
| Salvadoran | 35 | 0.1% |
| Samoan | 144 | 0.2% |
| Scandinavian | 143 | 0.2% |
| Scotch-Irish | 1,731 | 2.8% |
| Scottish | 1,899 | 3.1% |
| Serbian | 19 | 0.0% |
| Shoshone | 50 | 0.1% |
| Sioux | 14 | 0.0% |
| Slavic | 17 | 0.0% |
| Slovak | 135 | 0.2% |
| Slovene | 19 | 0.0% |
| South American | 866 | 1.4% |
| Spaniard | 70 | 0.1% |
| Spanish | 106 | 0.2% |
| Sri Lankan | 234 | 0.4% |
| Subsaharan African | 1,099 | 1.8% |
| Swedish | 826 | 1.3% |
| Swiss | 214 | 0.4% |
| Thai | 1,443 | 2.4% |
| Trinidadian and Tobagonian | 28 | 0.1% |
| Turkish | 81 | 0.1% |
| Ukrainian | 319 | 0.5% |
| Uruguayan | 14 | 0.0% |
| Venezuelan | 204 | 0.3% |
| Welsh | 461 | 0.7% |
| West Indian | 22 | 0.0% | View All 108 Rows |
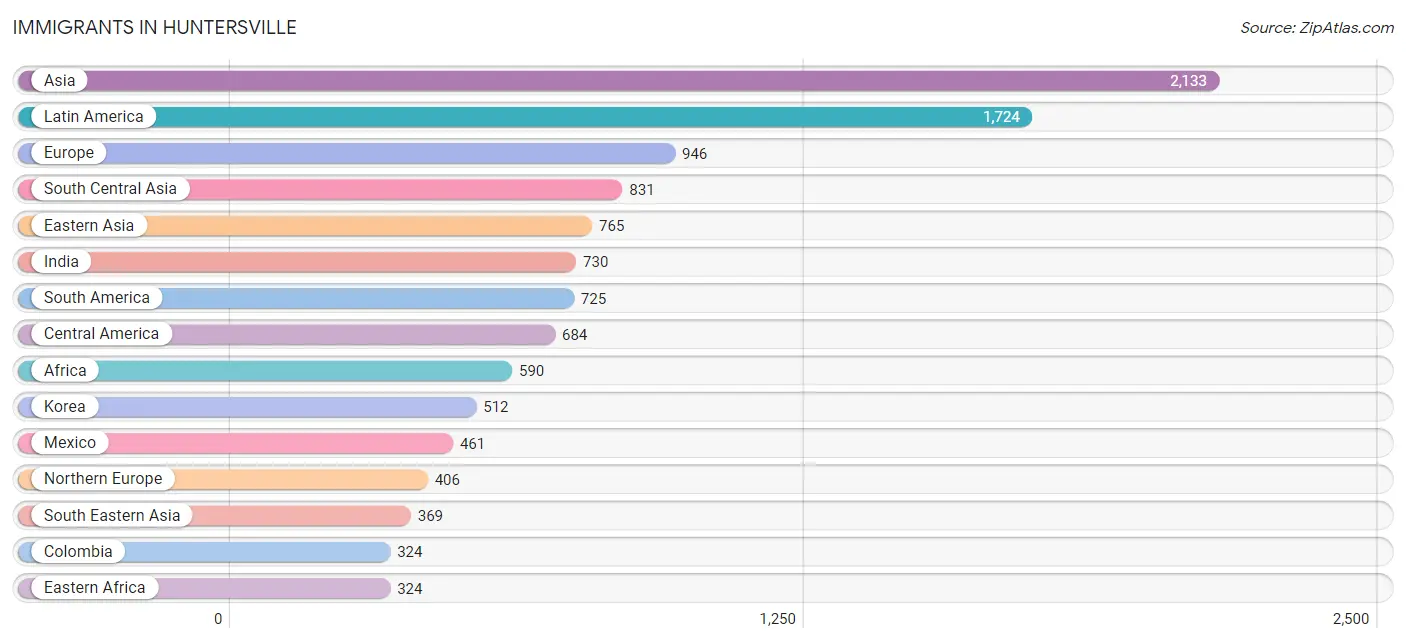
Immigrants in Huntersville
The most numerous immigrant groups reported in Huntersville came from Asia (2,133 | 3.5%), Latin America (1,724 | 2.8%), Europe (946 | 1.5%), South Central Asia (831 | 1.4%), and Eastern Asia (765 | 1.3%), together accounting for 10.5% of all Huntersville residents.
| Immigration Origin | # Population | % Population |
| Africa | 590 | 1.0% |
| Argentina | 16 | 0.0% |
| Asia | 2,133 | 3.5% |
| Australia | 46 | 0.1% |
| Bangladesh | 20 | 0.0% |
| Bolivia | 29 | 0.1% |
| Brazil | 33 | 0.1% |
| Bulgaria | 32 | 0.1% |
| Canada | 304 | 0.5% |
| Caribbean | 315 | 0.5% |
| Central America | 684 | 1.1% |
| China | 237 | 0.4% |
| Colombia | 324 | 0.5% |
| Congo | 28 | 0.1% |
| Cuba | 50 | 0.1% |
| Czechoslovakia | 7 | 0.0% |
| Dominican Republic | 102 | 0.2% |
| Eastern Africa | 324 | 0.5% |
| Eastern Asia | 765 | 1.3% |
| Eastern Europe | 285 | 0.5% |
| Ecuador | 21 | 0.0% |
| El Salvador | 22 | 0.0% |
| England | 75 | 0.1% |
| Europe | 946 | 1.5% |
| Germany | 121 | 0.2% |
| Greece | 20 | 0.0% |
| Guatemala | 58 | 0.1% |
| Guyana | 101 | 0.2% |
| Honduras | 115 | 0.2% |
| India | 730 | 1.2% |
| Ireland | 7 | 0.0% |
| Italy | 80 | 0.1% |
| Jamaica | 143 | 0.2% |
| Japan | 16 | 0.0% |
| Kenya | 10 | 0.0% |
| Korea | 512 | 0.8% |
| Laos | 17 | 0.0% |
| Latin America | 1,724 | 2.8% |
| Lebanon | 57 | 0.1% |
| Malaysia | 66 | 0.1% |
| Mexico | 461 | 0.7% |
| Middle Africa | 28 | 0.1% |
| Moldova | 42 | 0.1% |
| Morocco | 9 | 0.0% |
| Nepal | 28 | 0.1% |
| Nigeria | 112 | 0.2% |
| North Macedonia | 23 | 0.0% |
| Northern Africa | 9 | 0.0% |
| Northern Europe | 406 | 0.7% |
| Norway | 68 | 0.1% |
| Oceania | 46 | 0.1% |
| Pakistan | 44 | 0.1% |
| Panama | 28 | 0.1% |
| Peru | 21 | 0.0% |
| Philippines | 134 | 0.2% |
| Poland | 48 | 0.1% |
| Romania | 99 | 0.2% |
| Russia | 14 | 0.0% |
| Scotland | 47 | 0.1% |
| South Africa | 24 | 0.0% |
| South America | 725 | 1.2% |
| South Central Asia | 831 | 1.4% |
| South Eastern Asia | 369 | 0.6% |
| Southern Europe | 117 | 0.2% |
| Spain | 17 | 0.0% |
| Sweden | 65 | 0.1% |
| Switzerland | 17 | 0.0% |
| Taiwan | 10 | 0.0% |
| Thailand | 77 | 0.1% |
| Trinidad and Tobago | 8 | 0.0% |
| Turkey | 54 | 0.1% |
| Uganda | 172 | 0.3% |
| Ukraine | 20 | 0.0% |
| Uruguay | 14 | 0.0% |
| Venezuela | 166 | 0.3% |
| Vietnam | 75 | 0.1% |
| Western Africa | 157 | 0.3% |
| Western Asia | 168 | 0.3% |
| Western Europe | 138 | 0.2% |
| Zimbabwe | 138 | 0.2% | View All 80 Rows |
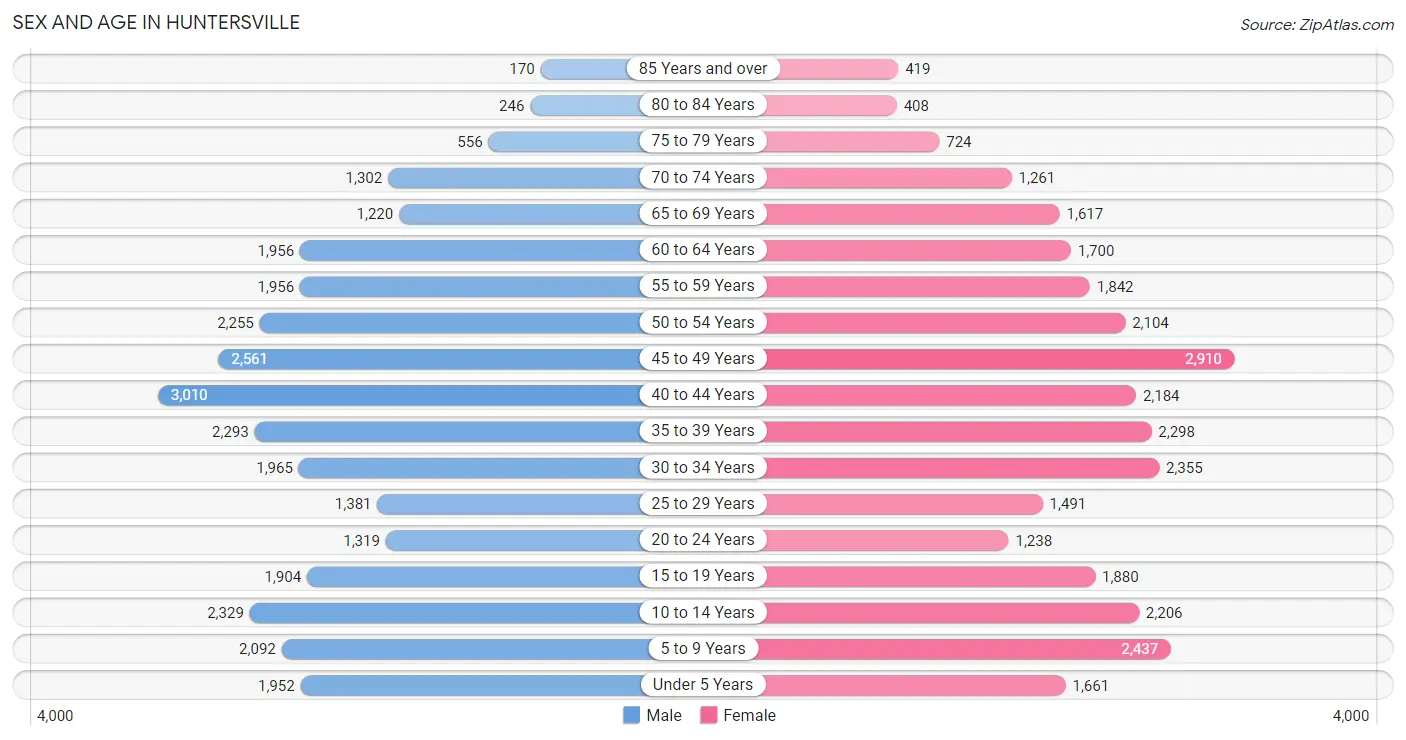
Sex and Age in Huntersville
Sex and Age in Huntersville
The most populous age groups in Huntersville are 40 to 44 Years (3,010 | 9.9%) for men and 45 to 49 Years (2,910 | 9.5%) for women.
| Age Bracket | Male | Female |
| Under 5 Years | 1,952 (6.4%) | 1,661 (5.4%) |
| 5 to 9 Years | 2,092 (6.9%) | 2,437 (7.9%) |
| 10 to 14 Years | 2,329 (7.6%) | 2,206 (7.2%) |
| 15 to 19 Years | 1,904 (6.2%) | 1,880 (6.1%) |
| 20 to 24 Years | 1,319 (4.3%) | 1,238 (4.0%) |
| 25 to 29 Years | 1,381 (4.5%) | 1,491 (4.9%) |
| 30 to 34 Years | 1,965 (6.5%) | 2,355 (7.7%) |
| 35 to 39 Years | 2,293 (7.5%) | 2,298 (7.5%) |
| 40 to 44 Years | 3,010 (9.9%) | 2,184 (7.1%) |
| 45 to 49 Years | 2,561 (8.4%) | 2,910 (9.5%) |
| 50 to 54 Years | 2,255 (7.4%) | 2,104 (6.9%) |
| 55 to 59 Years | 1,956 (6.4%) | 1,842 (6.0%) |
| 60 to 64 Years | 1,956 (6.4%) | 1,700 (5.5%) |
| 65 to 69 Years | 1,220 (4.0%) | 1,617 (5.3%) |
| 70 to 74 Years | 1,302 (4.3%) | 1,261 (4.1%) |
| 75 to 79 Years | 556 (1.8%) | 724 (2.4%) |
| 80 to 84 Years | 246 (0.8%) | 408 (1.3%) |
| 85 Years and over | 170 (0.6%) | 419 (1.4%) |
| Total | 30,467 (100.0%) | 30,735 (100.0%) |
Families and Households in Huntersville
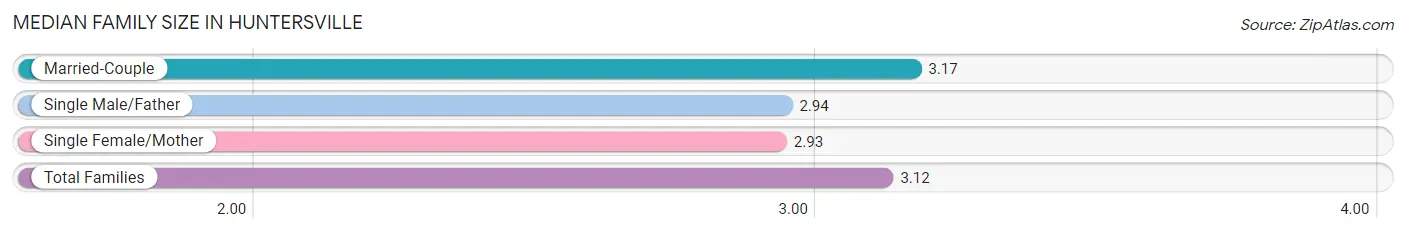
Median Family Size in Huntersville
The median family size in Huntersville is 3.12 persons per family, with married-couple families (13,242 | 79.2%) accounting for the largest median family size of 3.17 persons per family. On the other hand, single female/mother families (2,302 | 13.8%) represent the smallest median family size with 2.93 persons per family.
| Family Type | # Families | Family Size |
| Married-Couple | 13,242 (79.2%) | 3.17 |
| Single Male/Father | 1,168 (7.0%) | 2.94 |
| Single Female/Mother | 2,302 (13.8%) | 2.93 |
| Total Families | 16,712 (100.0%) | 3.12 |
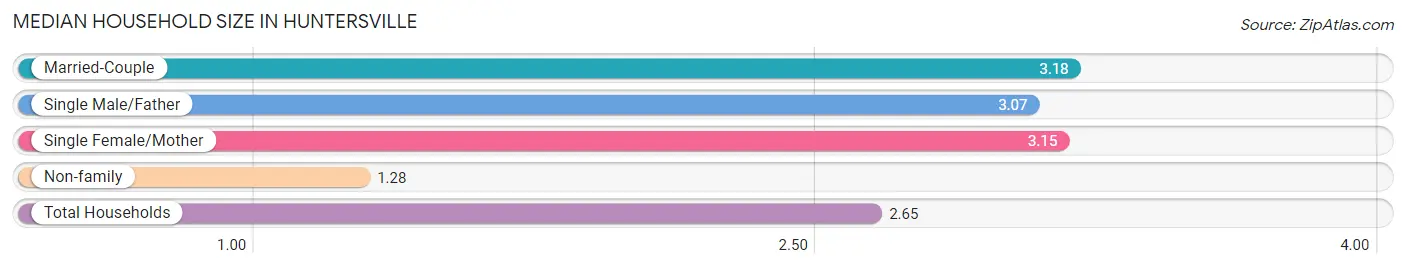
Median Household Size in Huntersville
The median household size in Huntersville is 2.65 persons per household, with married-couple households (13,242 | 57.6%) accounting for the largest median household size of 3.18 persons per household. non-family households (6,262 | 27.3%) represent the smallest median household size with 1.28 persons per household.
| Household Type | # Households | Household Size |
| Married-Couple | 13,242 (57.6%) | 3.18 |
| Single Male/Father | 1,168 (5.1%) | 3.07 |
| Single Female/Mother | 2,302 (10.0%) | 3.15 |
| Non-family | 6,262 (27.3%) | 1.28 |
| Total Households | 22,974 (100.0%) | 2.65 |
Household Size by Marriage Status in Huntersville
Out of a total of 22,974 households in Huntersville, 16,712 (72.7%) are family households, while 6,262 (27.3%) are nonfamily households. The most numerous type of family households are 2-person households, comprising 6,500, and the most common type of nonfamily households are 1-person households, comprising 4,951.
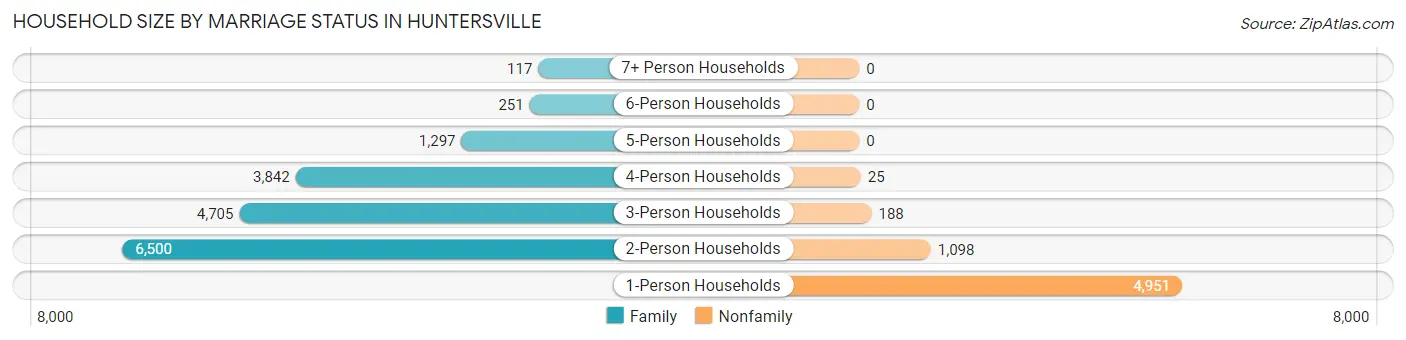
| Household Size | Family Households | Nonfamily Households |
| 1-Person Households | - | 4,951 (21.5%) |
| 2-Person Households | 6,500 (28.3%) | 1,098 (4.8%) |
| 3-Person Households | 4,705 (20.5%) | 188 (0.8%) |
| 4-Person Households | 3,842 (16.7%) | 25 (0.1%) |
| 5-Person Households | 1,297 (5.7%) | 0 (0.0%) |
| 6-Person Households | 251 (1.1%) | 0 (0.0%) |
| 7+ Person Households | 117 (0.5%) | 0 (0.0%) |
| Total | 16,712 (72.7%) | 6,262 (27.3%) |
Female Fertility in Huntersville
Fertility by Age in Huntersville
Average fertility rate in Huntersville is 44.0 births per 1,000 women. Women in the age bracket of 20 to 34 years have the highest fertility rate with 68.0 births per 1,000 women. Women in the age bracket of 20 to 34 years acount for 52.8% of all women with births.
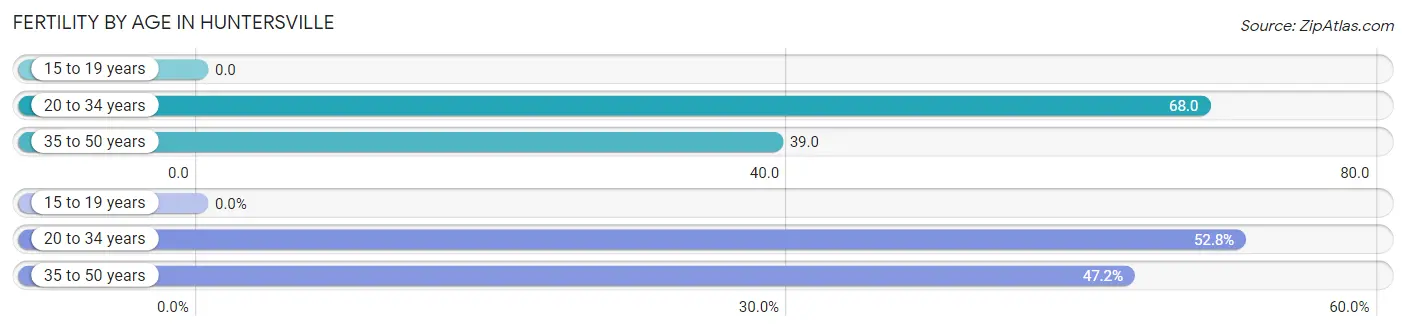
| Age Bracket | Women with Births | Births / 1,000 Women |
| 15 to 19 years | 0 (0.0%) | 0.0 |
| 20 to 34 years | 345 (52.8%) | 68.0 |
| 35 to 50 years | 308 (47.2%) | 39.0 |
| Total | 653 (100.0%) | 44.0 |
Fertility by Age by Marriage Status in Huntersville
97.5% of women with births (653) in Huntersville are married. The highest percentage of unmarried women with births falls into 20 to 34 years age bracket with 2.6% of them unmarried at the time of birth, while the lowest percentage of unmarried women with births belong to 35 to 50 years age bracket with 2.3% of them unmarried.
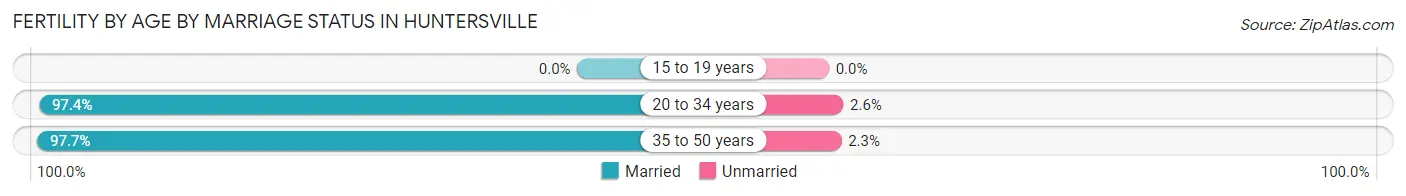
| Age Bracket | Married | Unmarried |
| 15 to 19 years | 0 (0.0%) | 0 (0.0%) |
| 20 to 34 years | 336 (97.4%) | 9 (2.6%) |
| 35 to 50 years | 301 (97.7%) | 7 (2.3%) |
| Total | 637 (97.6%) | 16 (2.5%) |
Fertility by Education in Huntersville
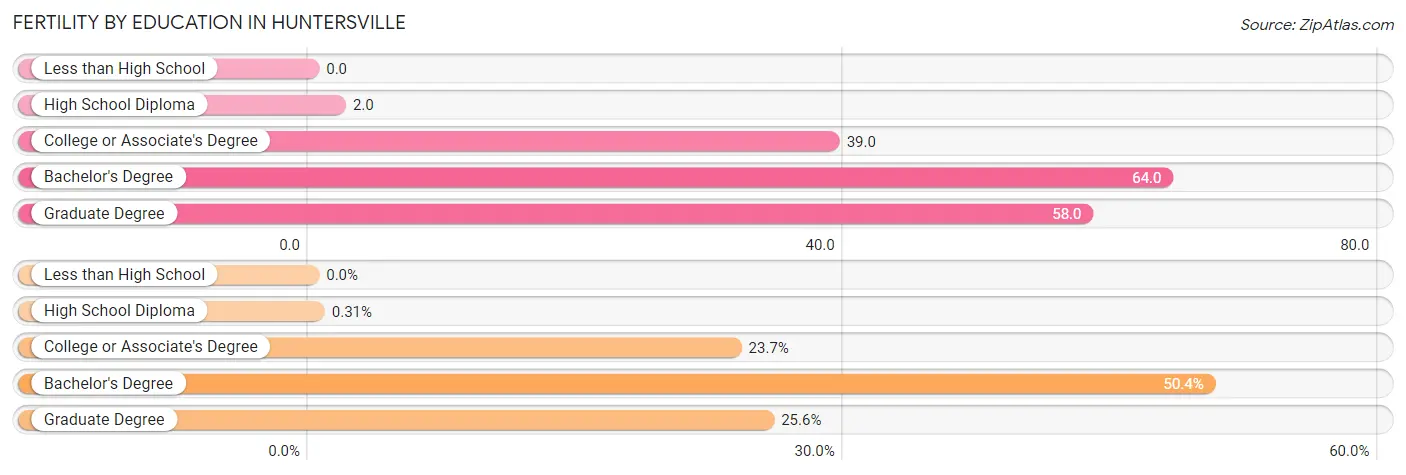
| Educational Attainment | Women with Births | Births / 1,000 Women |
| Less than High School | 0 (0.0%) | 0.0 |
| High School Diploma | 2 (0.3%) | 2.0 |
| College or Associate's Degree | 155 (23.7%) | 39.0 |
| Bachelor's Degree | 329 (50.4%) | 64.0 |
| Graduate Degree | 167 (25.6%) | 58.0 |
| Total | 653 (100.0%) | 44.0 |
Fertility by Education by Marriage Status in Huntersville
2.5% of women with births in Huntersville are unmarried. Women with the educational attainment of bachelor's degree are most likely to be married with 100.0% of them married at childbirth, while women with the educational attainment of high school diploma are least likely to be married with 100.0% of them unmarried at childbirth.
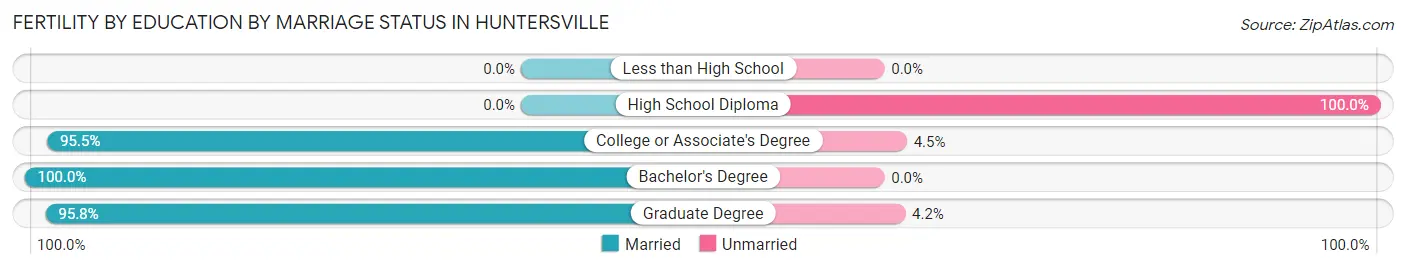
| Educational Attainment | Married | Unmarried |
| Less than High School | 0 (0.0%) | 0 (0.0%) |
| High School Diploma | 0 (0.0%) | 2 (100.0%) |
| College or Associate's Degree | 148 (95.5%) | 7 (4.5%) |
| Bachelor's Degree | 329 (100.0%) | 0 (0.0%) |
| Graduate Degree | 160 (95.8%) | 7 (4.2%) |
| Total | 637 (97.6%) | 16 (2.5%) |
Employment Characteristics in Huntersville
Employment by Class of Employer in Huntersville
Among the 32,362 employed individuals in Huntersville, private company employees (24,372 | 75.3%), not-for-profit organizations (2,482 | 7.7%), and self-employed (not incorporated) (1,815 | 5.6%) make up the most common classes of employment.
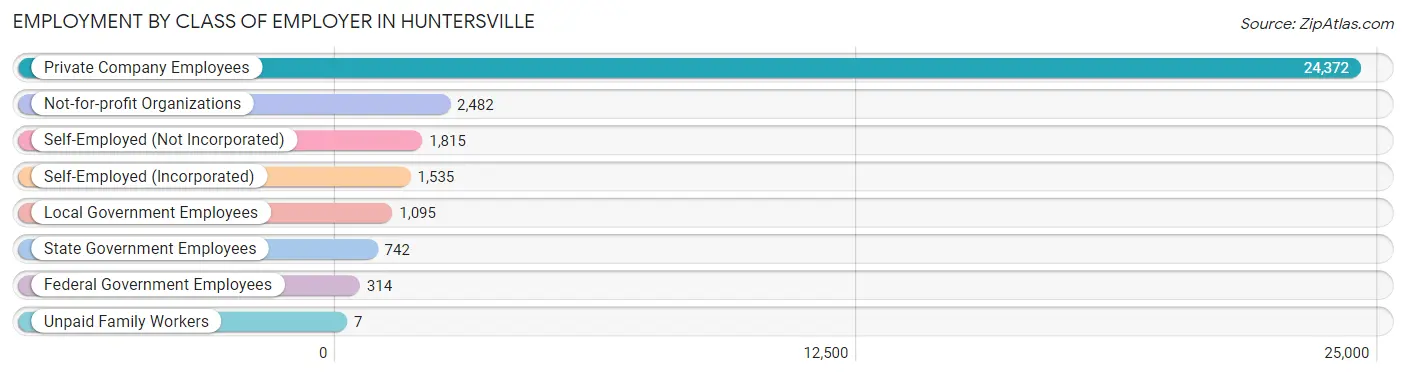
| Employer Class | # Employees | % Employees |
| Private Company Employees | 24,372 | 75.3% |
| Self-Employed (Incorporated) | 1,535 | 4.7% |
| Self-Employed (Not Incorporated) | 1,815 | 5.6% |
| Not-for-profit Organizations | 2,482 | 7.7% |
| Local Government Employees | 1,095 | 3.4% |
| State Government Employees | 742 | 2.3% |
| Federal Government Employees | 314 | 1.0% |
| Unpaid Family Workers | 7 | 0.0% |
| Total | 32,362 | 100.0% |
Employment Status by Age in Huntersville
According to the labor force statistics for Huntersville, out of the total population over 16 years of age (47,606), 72.9% or 34,705 individuals are in the labor force, with 4.1% or 1,423 of them unemployed. The age group with the highest labor force participation rate is 25 to 29 years, with 95.0% or 2,728 individuals in the labor force. Within the labor force, the 25 to 29 years age range has the highest percentage of unemployed individuals, with 11.9% or 325 of them being unemployed.
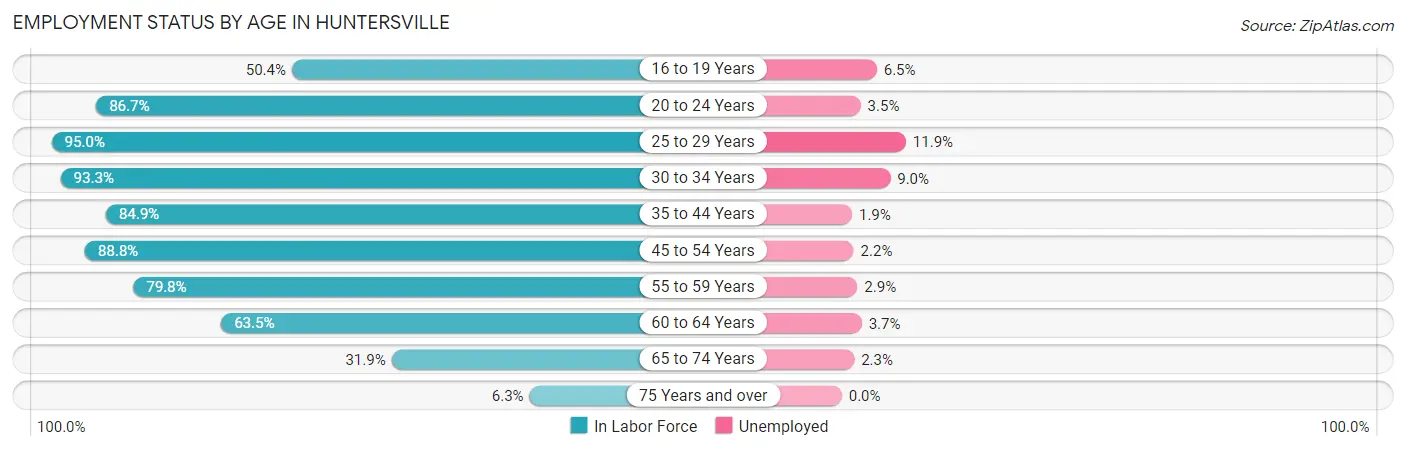
| Age Bracket | In Labor Force | Unemployed |
| 16 to 19 Years | 1,444 (50.4%) | 94 (6.5%) |
| 20 to 24 Years | 2,217 (86.7%) | 78 (3.5%) |
| 25 to 29 Years | 2,728 (95.0%) | 325 (11.9%) |
| 30 to 34 Years | 4,031 (93.3%) | 363 (9.0%) |
| 35 to 44 Years | 8,307 (84.9%) | 158 (1.9%) |
| 45 to 54 Years | 8,729 (88.8%) | 192 (2.2%) |
| 55 to 59 Years | 3,031 (79.8%) | 88 (2.9%) |
| 60 to 64 Years | 2,322 (63.5%) | 86 (3.7%) |
| 65 to 74 Years | 1,723 (31.9%) | 40 (2.3%) |
| 75 Years and over | 159 (6.3%) | 0 (0.0%) |
| Total | 34,705 (72.9%) | 1,423 (4.1%) |
Employment Status by Educational Attainment in Huntersville
According to labor force statistics for Huntersville, 85.1% of individuals (29,156) out of the total population between 25 and 64 years of age (34,261) are in the labor force, with 4.1% or 1,195 of them being unemployed. The group with the highest labor force participation rate are those with the educational attainment of bachelor's degree or higher, with 88.5% or 18,196 individuals in the labor force. Within the labor force, individuals with high school diploma education have the highest percentage of unemployment, with 12.6% or 380 of them being unemployed.
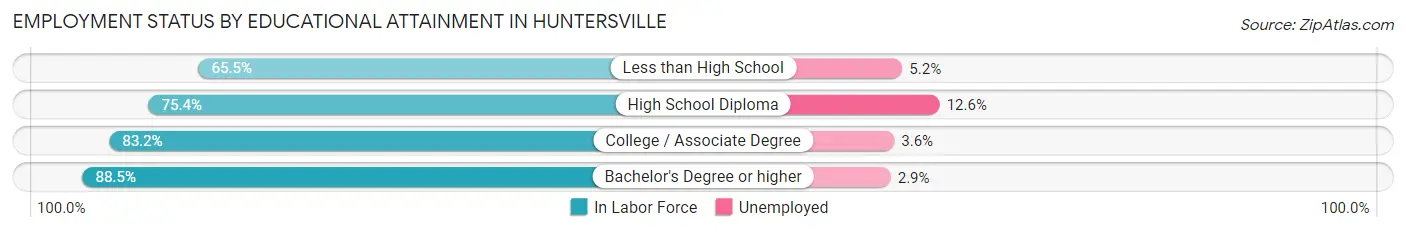
| Educational Attainment | In Labor Force | Unemployed |
| Less than High School | 484 (65.5%) | 38 (5.2%) |
| High School Diploma | 3,017 (75.4%) | 504 (12.6%) |
| College / Associate Degree | 7,455 (83.2%) | 323 (3.6%) |
| Bachelor's Degree or higher | 18,196 (88.5%) | 596 (2.9%) |
| Total | 29,156 (85.1%) | 1,405 (4.1%) |
Employment Occupations by Sex in Huntersville
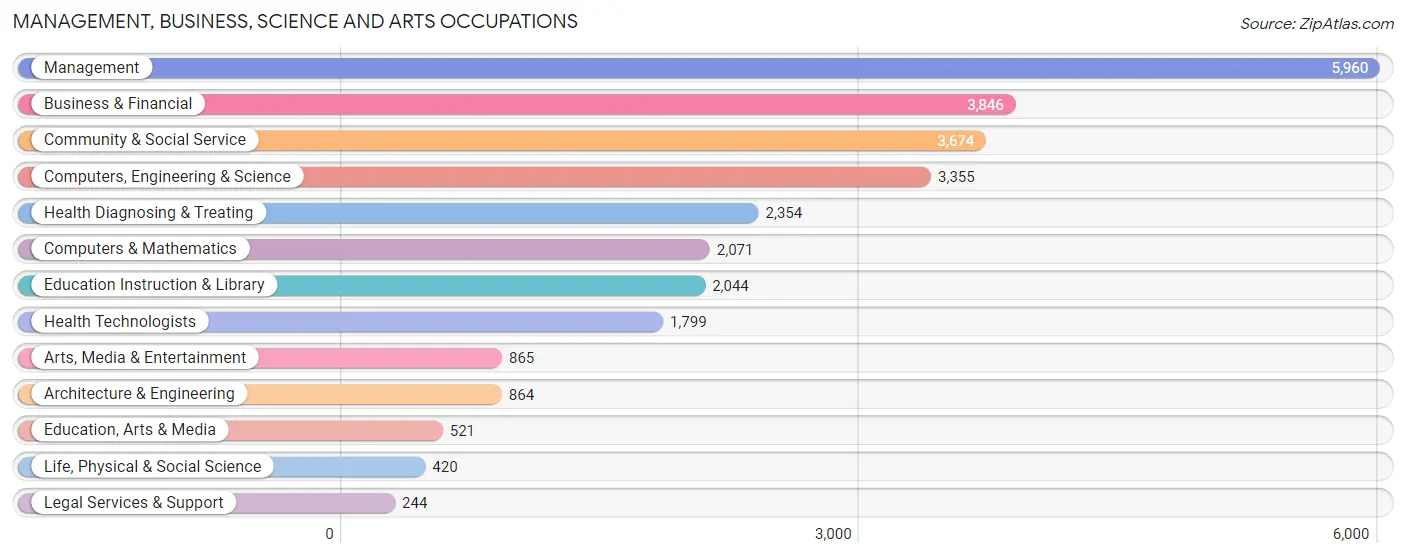
Management, Business, Science and Arts Occupations
The most common Management, Business, Science and Arts occupations in Huntersville are Management (5,960 | 17.9%), Business & Financial (3,846 | 11.6%), Community & Social Service (3,674 | 11.0%), Computers, Engineering & Science (3,355 | 10.1%), and Health Diagnosing & Treating (2,354 | 7.1%).
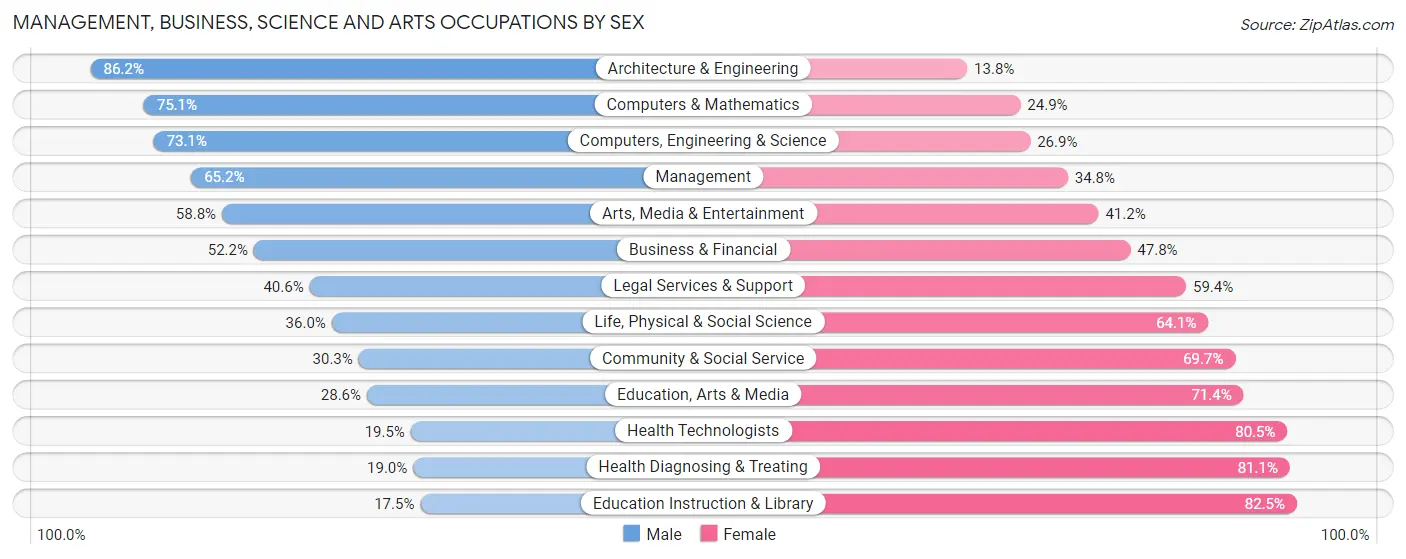
Management, Business, Science and Arts Occupations by Sex
Within the Management, Business, Science and Arts occupations in Huntersville, the most male-oriented occupations are Architecture & Engineering (86.2%), Computers & Mathematics (75.1%), and Computers, Engineering & Science (73.1%), while the most female-oriented occupations are Education Instruction & Library (82.5%), Health Diagnosing & Treating (81.0%), and Health Technologists (80.5%).
| Occupation | Male | Female |
| Management | 3,888 (65.2%) | 2,072 (34.8%) |
| Business & Financial | 2,007 (52.2%) | 1,839 (47.8%) |
| Computers, Engineering & Science | 2,452 (73.1%) | 903 (26.9%) |
| Computers & Mathematics | 1,556 (75.1%) | 515 (24.9%) |
| Architecture & Engineering | 745 (86.2%) | 119 (13.8%) |
| Life, Physical & Social Science | 151 (35.9%) | 269 (64.0%) |
| Community & Social Service | 1,114 (30.3%) | 2,560 (69.7%) |
| Education, Arts & Media | 149 (28.6%) | 372 (71.4%) |
| Legal Services & Support | 99 (40.6%) | 145 (59.4%) |
| Education Instruction & Library | 357 (17.5%) | 1,687 (82.5%) |
| Arts, Media & Entertainment | 509 (58.8%) | 356 (41.2%) |
| Health Diagnosing & Treating | 446 (19.0%) | 1,908 (81.0%) |
| Health Technologists | 350 (19.5%) | 1,449 (80.5%) |
| Total (Category) | 9,907 (51.6%) | 9,282 (48.4%) |
| Total (Overall) | 17,581 (52.8%) | 15,697 (47.2%) |
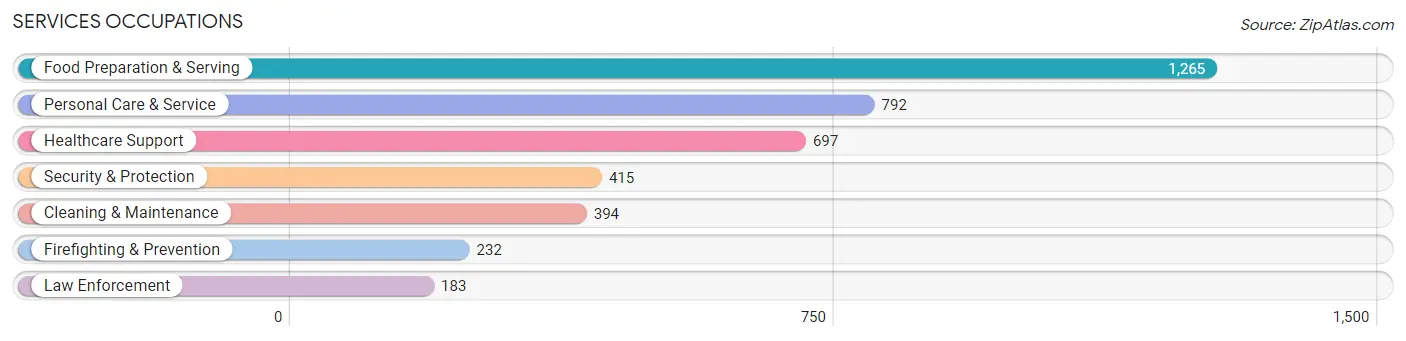
Services Occupations
The most common Services occupations in Huntersville are Food Preparation & Serving (1,265 | 3.8%), Personal Care & Service (792 | 2.4%), Healthcare Support (697 | 2.1%), Security & Protection (415 | 1.3%), and Cleaning & Maintenance (394 | 1.2%).
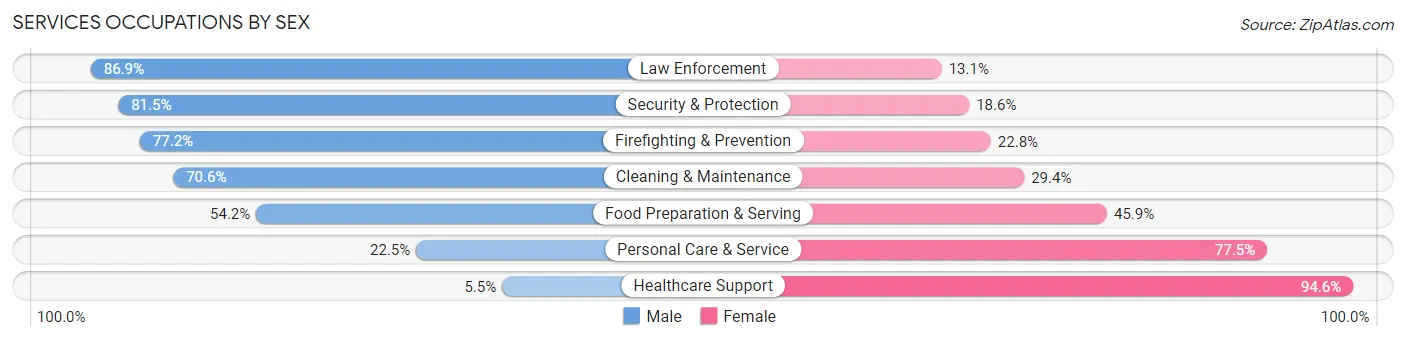
Services Occupations by Sex
Within the Services occupations in Huntersville, the most male-oriented occupations are Law Enforcement (86.9%), Security & Protection (81.5%), and Firefighting & Prevention (77.2%), while the most female-oriented occupations are Healthcare Support (94.6%), Personal Care & Service (77.5%), and Food Preparation & Serving (45.9%).
| Occupation | Male | Female |
| Healthcare Support | 38 (5.4%) | 659 (94.6%) |
| Security & Protection | 338 (81.5%) | 77 (18.5%) |
| Firefighting & Prevention | 179 (77.2%) | 53 (22.8%) |
| Law Enforcement | 159 (86.9%) | 24 (13.1%) |
| Food Preparation & Serving | 685 (54.1%) | 580 (45.9%) |
| Cleaning & Maintenance | 278 (70.6%) | 116 (29.4%) |
| Personal Care & Service | 178 (22.5%) | 614 (77.5%) |
| Total (Category) | 1,517 (42.6%) | 2,046 (57.4%) |
| Total (Overall) | 17,581 (52.8%) | 15,697 (47.2%) |
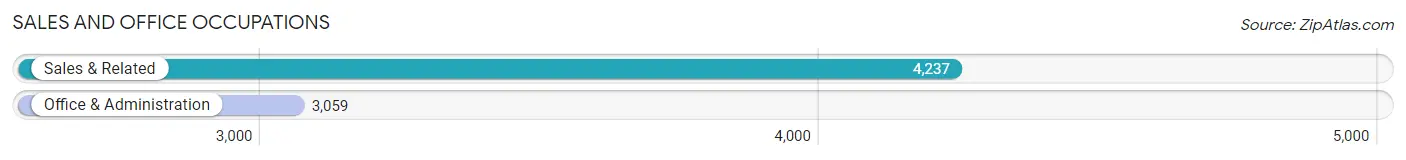
Sales and Office Occupations
The most common Sales and Office occupations in Huntersville are Sales & Related (4,237 | 12.7%), and Office & Administration (3,059 | 9.2%).
Sales and Office Occupations by Sex
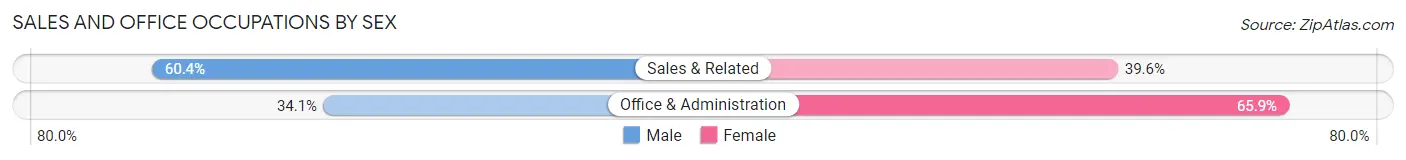
| Occupation | Male | Female |
| Sales & Related | 2,560 (60.4%) | 1,677 (39.6%) |
| Office & Administration | 1,043 (34.1%) | 2,016 (65.9%) |
| Total (Category) | 3,603 (49.4%) | 3,693 (50.6%) |
| Total (Overall) | 17,581 (52.8%) | 15,697 (47.2%) |
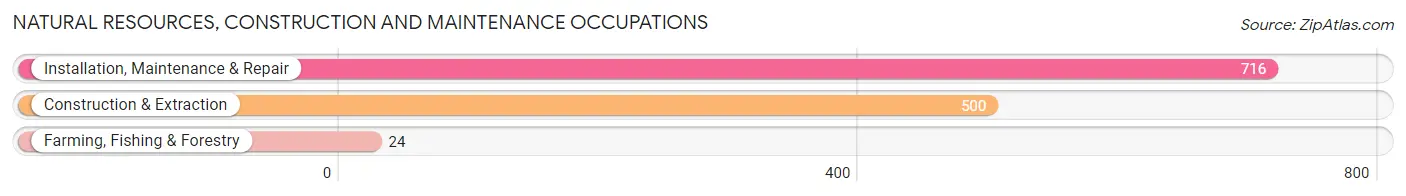
Natural Resources, Construction and Maintenance Occupations
The most common Natural Resources, Construction and Maintenance occupations in Huntersville are Installation, Maintenance & Repair (716 | 2.1%), Construction & Extraction (500 | 1.5%), and Farming, Fishing & Forestry (24 | 0.1%).
Natural Resources, Construction and Maintenance Occupations by Sex
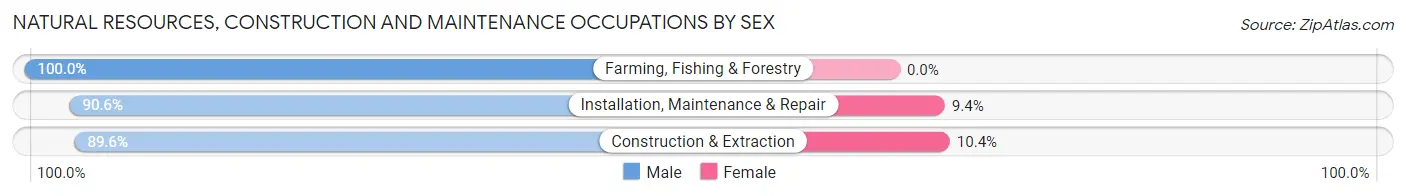
| Occupation | Male | Female |
| Farming, Fishing & Forestry | 24 (100.0%) | 0 (0.0%) |
| Construction & Extraction | 448 (89.6%) | 52 (10.4%) |
| Installation, Maintenance & Repair | 649 (90.6%) | 67 (9.4%) |
| Total (Category) | 1,121 (90.4%) | 119 (9.6%) |
| Total (Overall) | 17,581 (52.8%) | 15,697 (47.2%) |
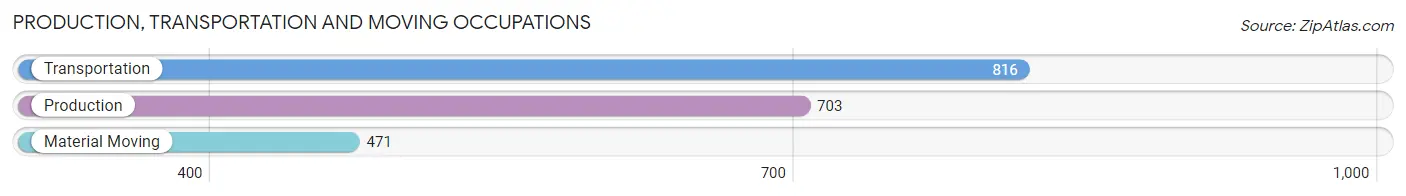
Production, Transportation and Moving Occupations
The most common Production, Transportation and Moving occupations in Huntersville are Transportation (816 | 2.5%), Production (703 | 2.1%), and Material Moving (471 | 1.4%).
Production, Transportation and Moving Occupations by Sex
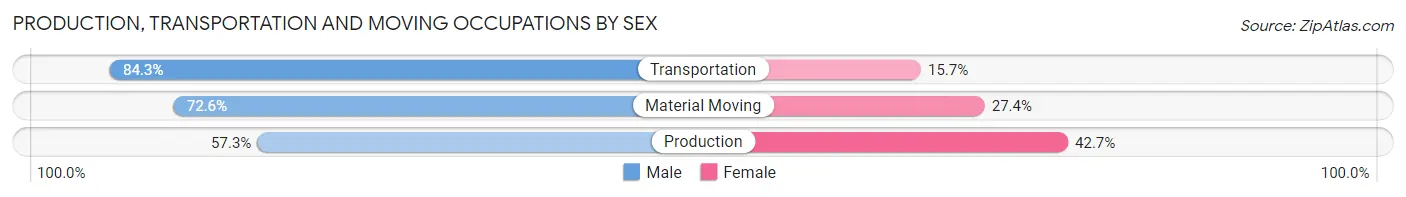
| Occupation | Male | Female |
| Production | 403 (57.3%) | 300 (42.7%) |
| Transportation | 688 (84.3%) | 128 (15.7%) |
| Material Moving | 342 (72.6%) | 129 (27.4%) |
| Total (Category) | 1,433 (72.0%) | 557 (28.0%) |
| Total (Overall) | 17,581 (52.8%) | 15,697 (47.2%) |
Employment Industries by Sex in Huntersville
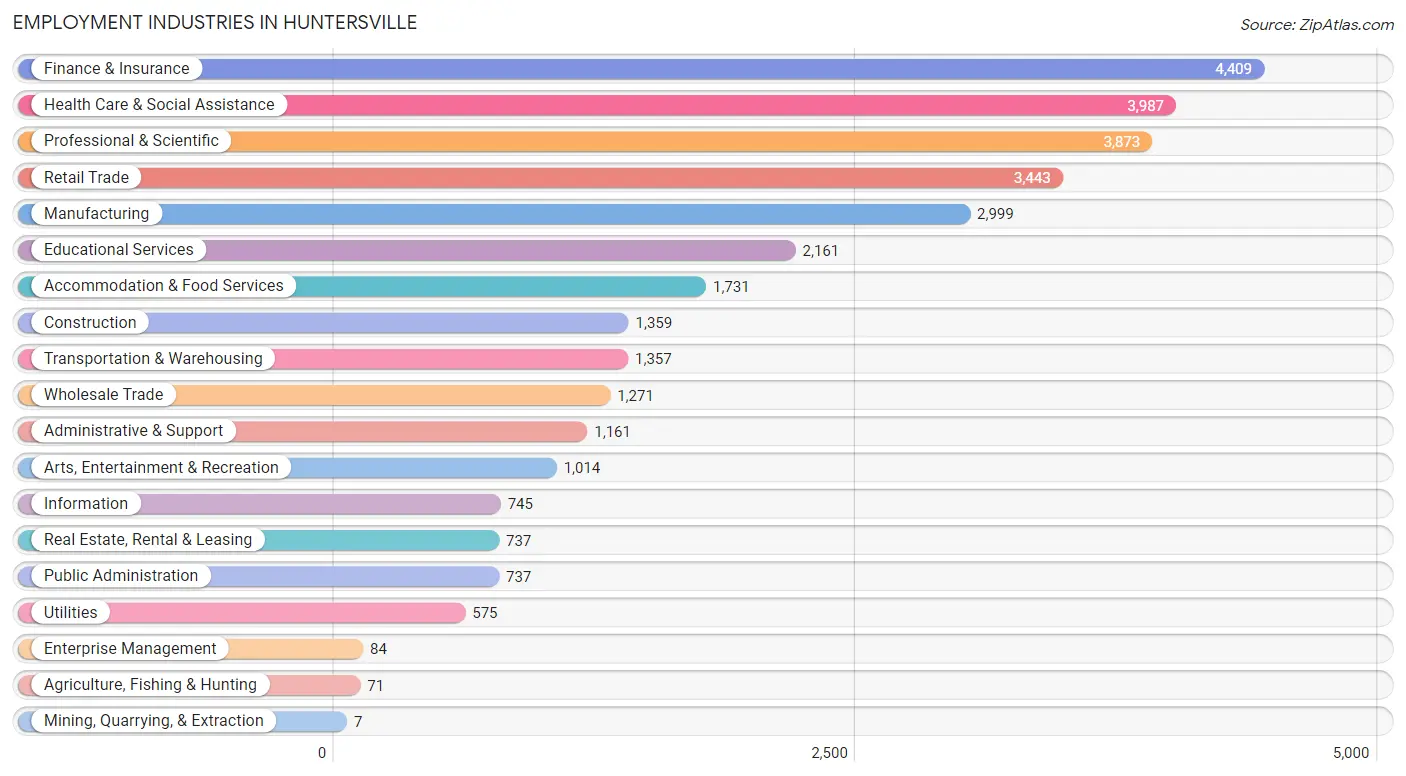
Employment Industries in Huntersville
The major employment industries in Huntersville include Finance & Insurance (4,409 | 13.3%), Health Care & Social Assistance (3,987 | 12.0%), Professional & Scientific (3,873 | 11.6%), Retail Trade (3,443 | 10.3%), and Manufacturing (2,999 | 9.0%).
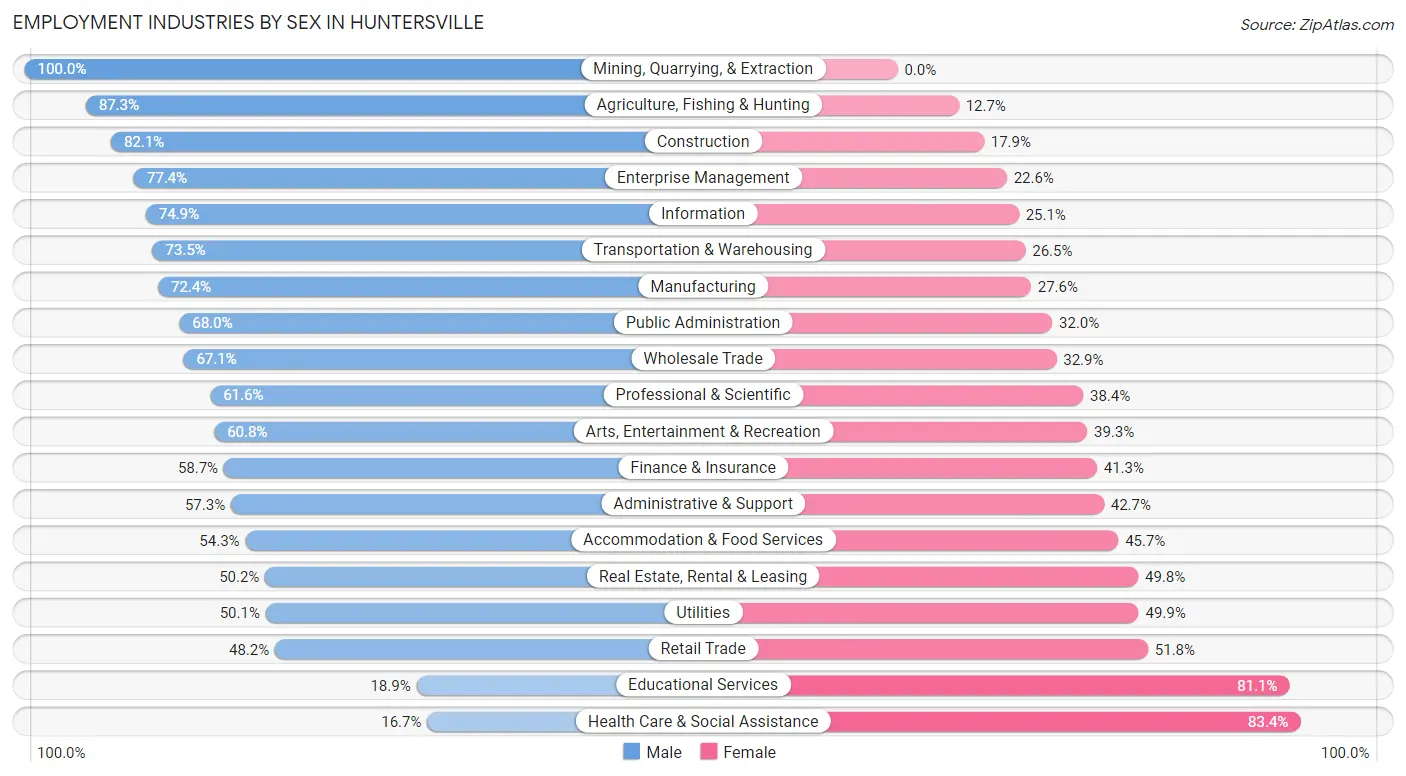
Employment Industries by Sex in Huntersville
The Huntersville industries that see more men than women are Mining, Quarrying, & Extraction (100.0%), Agriculture, Fishing & Hunting (87.3%), and Construction (82.1%), whereas the industries that tend to have a higher number of women are Health Care & Social Assistance (83.4%), Educational Services (81.1%), and Retail Trade (51.8%).
| Industry | Male | Female |
| Agriculture, Fishing & Hunting | 62 (87.3%) | 9 (12.7%) |
| Mining, Quarrying, & Extraction | 7 (100.0%) | 0 (0.0%) |
| Construction | 1,116 (82.1%) | 243 (17.9%) |
| Manufacturing | 2,171 (72.4%) | 828 (27.6%) |
| Wholesale Trade | 853 (67.1%) | 418 (32.9%) |
| Retail Trade | 1,658 (48.2%) | 1,785 (51.8%) |
| Transportation & Warehousing | 998 (73.5%) | 359 (26.5%) |
| Utilities | 288 (50.1%) | 287 (49.9%) |
| Information | 558 (74.9%) | 187 (25.1%) |
| Finance & Insurance | 2,590 (58.7%) | 1,819 (41.3%) |
| Real Estate, Rental & Leasing | 370 (50.2%) | 367 (49.8%) |
| Professional & Scientific | 2,385 (61.6%) | 1,488 (38.4%) |
| Enterprise Management | 65 (77.4%) | 19 (22.6%) |
| Administrative & Support | 665 (57.3%) | 496 (42.7%) |
| Educational Services | 408 (18.9%) | 1,753 (81.1%) |
| Health Care & Social Assistance | 664 (16.7%) | 3,323 (83.4%) |
| Arts, Entertainment & Recreation | 616 (60.8%) | 398 (39.3%) |
| Accommodation & Food Services | 940 (54.3%) | 791 (45.7%) |
| Public Administration | 501 (68.0%) | 236 (32.0%) |
| Total | 17,581 (52.8%) | 15,697 (47.2%) |
Education in Huntersville
School Enrollment in Huntersville
The most common levels of schooling among the 16,001 students in Huntersville are middle school (3,761 | 23.5%), elementary school (3,615 | 22.6%), and high school (3,422 | 21.4%).
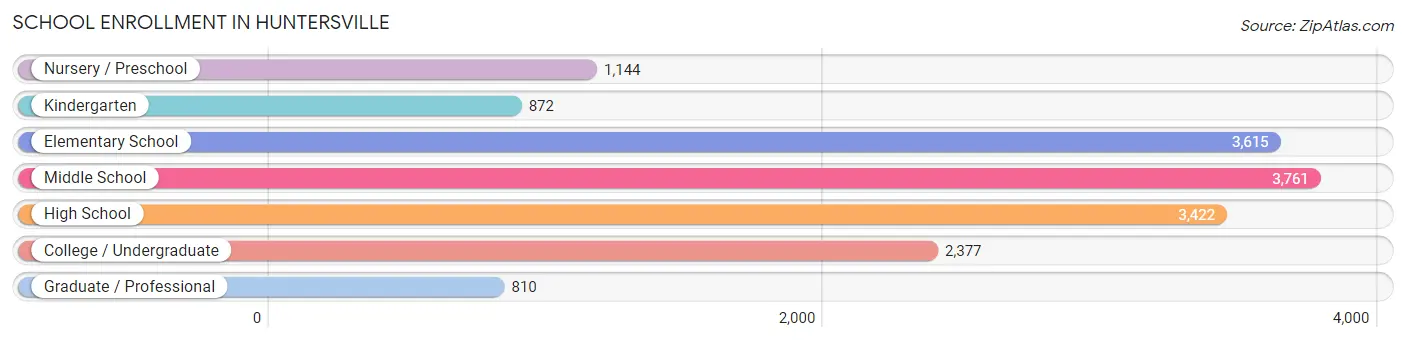
| School Level | # Students | % Students |
| Nursery / Preschool | 1,144 | 7.1% |
| Kindergarten | 872 | 5.4% |
| Elementary School | 3,615 | 22.6% |
| Middle School | 3,761 | 23.5% |
| High School | 3,422 | 21.4% |
| College / Undergraduate | 2,377 | 14.9% |
| Graduate / Professional | 810 | 5.1% |
| Total | 16,001 | 100.0% |
School Enrollment by Age by Funding Source in Huntersville
Out of a total of 16,001 students who are enrolled in schools in Huntersville, 3,040 (19.0%) attend a private institution, while the remaining 12,961 (81.0%) are enrolled in public schools. The age group of 3 to 4 year olds has the highest likelihood of being enrolled in private schools, with 520 (70.9% in the age bracket) enrolled. Conversely, the age group of 5 to 9 year old has the lowest likelihood of being enrolled in a private school, with 3,805 (86.3% in the age bracket) attending a public institution.
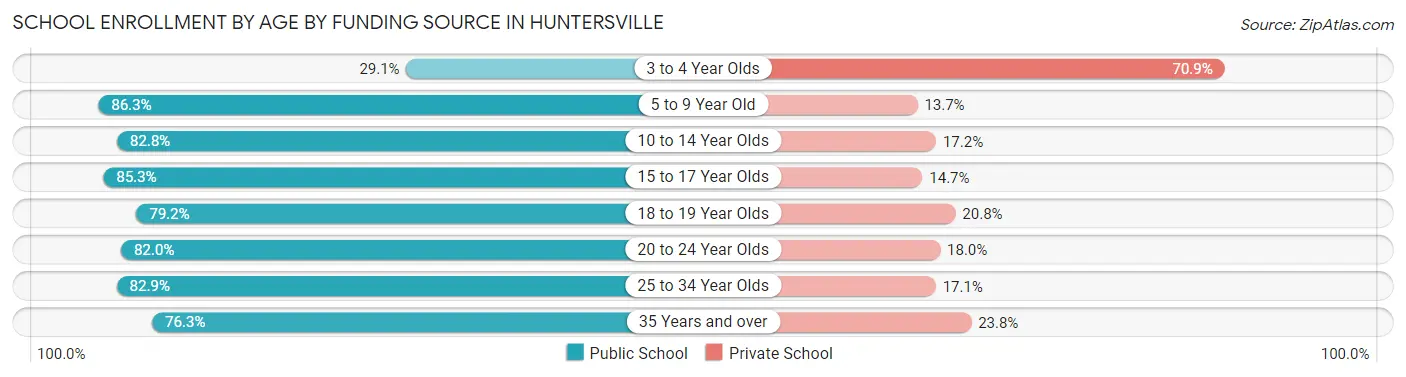
| Age Bracket | Public School | Private School |
| 3 to 4 Year Olds | 213 (29.1%) | 520 (70.9%) |
| 5 to 9 Year Old | 3,805 (86.3%) | 606 (13.7%) |
| 10 to 14 Year Olds | 3,730 (82.8%) | 775 (17.2%) |
| 15 to 17 Year Olds | 2,078 (85.3%) | 357 (14.7%) |
| 18 to 19 Year Olds | 864 (79.2%) | 227 (20.8%) |
| 20 to 24 Year Olds | 932 (82.0%) | 204 (18.0%) |
| 25 to 34 Year Olds | 619 (82.9%) | 128 (17.1%) |
| 35 Years and over | 719 (76.2%) | 224 (23.7%) |
| Total | 12,961 (81.0%) | 3,040 (19.0%) |
Educational Attainment by Field of Study in Huntersville
Business (6,787 | 26.6%), education (2,380 | 9.3%), science & technology (2,256 | 8.8%), engineering (2,234 | 8.7%), and communications (1,812 | 7.1%) are the most common fields of study among 25,553 individuals in Huntersville who have obtained a bachelor's degree or higher.
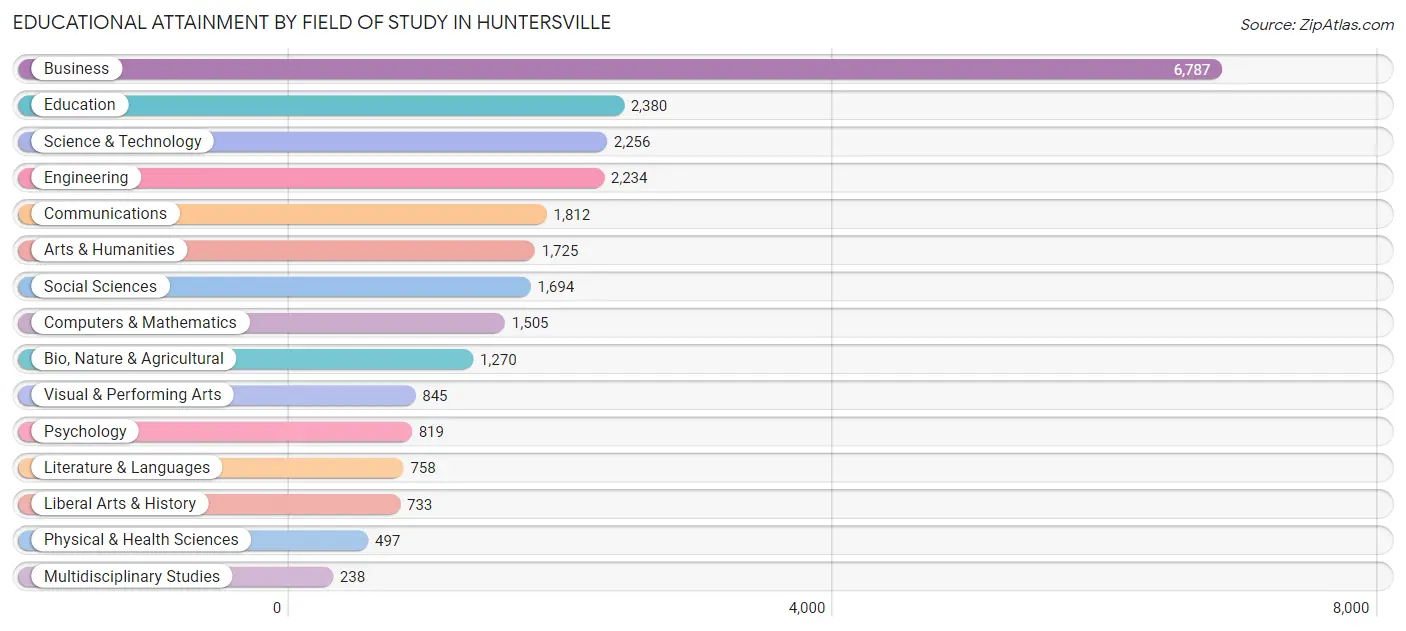
| Field of Study | # Graduates | % Graduates |
| Computers & Mathematics | 1,505 | 5.9% |
| Bio, Nature & Agricultural | 1,270 | 5.0% |
| Physical & Health Sciences | 497 | 1.9% |
| Psychology | 819 | 3.2% |
| Social Sciences | 1,694 | 6.6% |
| Engineering | 2,234 | 8.7% |
| Multidisciplinary Studies | 238 | 0.9% |
| Science & Technology | 2,256 | 8.8% |
| Business | 6,787 | 26.6% |
| Education | 2,380 | 9.3% |
| Literature & Languages | 758 | 3.0% |
| Liberal Arts & History | 733 | 2.9% |
| Visual & Performing Arts | 845 | 3.3% |
| Communications | 1,812 | 7.1% |
| Arts & Humanities | 1,725 | 6.8% |
| Total | 25,553 | 100.0% |
Transportation & Commute in Huntersville
Vehicle Availability by Sex in Huntersville
The most prevalent vehicle ownership categories in Huntersville are males with 2 vehicles (8,725, accounting for 50.4%) and females with 2 vehicles (7,313, making up 58.0%).
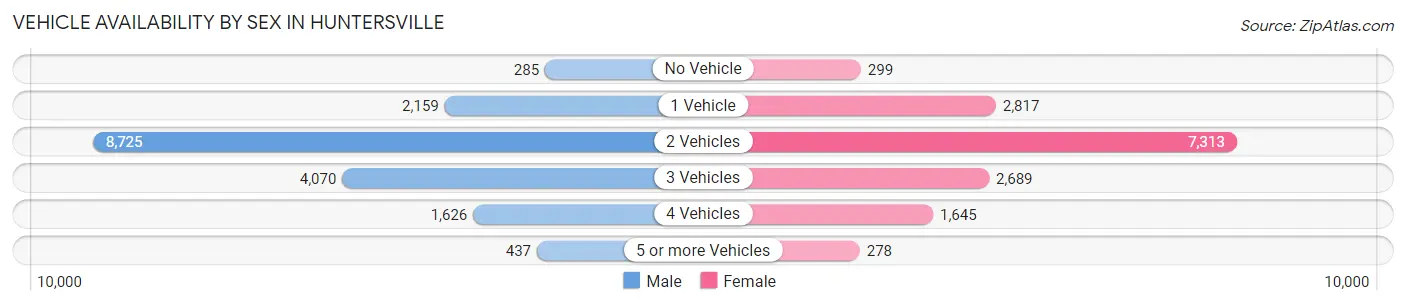
| Vehicles Available | Male | Female |
| No Vehicle | 285 (1.7%) | 299 (2.0%) |
| 1 Vehicle | 2,159 (12.5%) | 2,817 (18.7%) |
| 2 Vehicles | 8,725 (50.4%) | 7,313 (48.6%) |
| 3 Vehicles | 4,070 (23.5%) | 2,689 (17.9%) |
| 4 Vehicles | 1,626 (9.4%) | 1,645 (10.9%) |
| 5 or more Vehicles | 437 (2.5%) | 278 (1.8%) |
| Total | 17,302 (100.0%) | 15,041 (100.0%) |
Commute Time in Huntersville
The most frequently occuring commute durations in Huntersville are 30 to 34 minutes (4,340 commuters, 17.4%), 20 to 24 minutes (3,601 commuters, 14.5%), and 15 to 19 minutes (3,472 commuters, 14.0%).
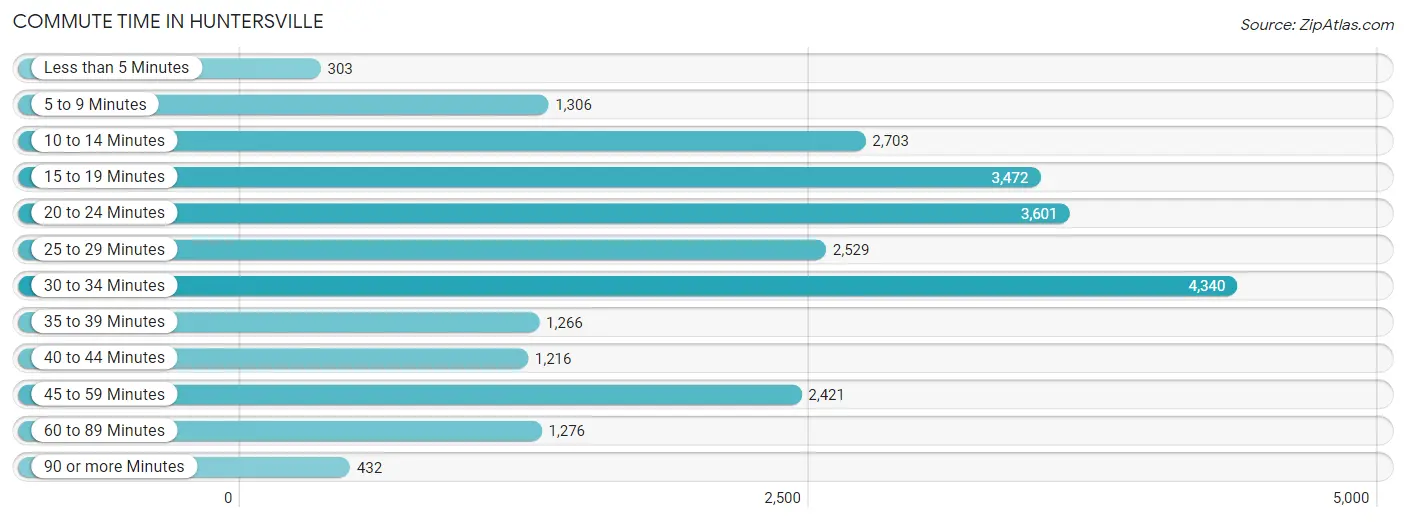
| Commute Time | # Commuters | % Commuters |
| Less than 5 Minutes | 303 | 1.2% |
| 5 to 9 Minutes | 1,306 | 5.2% |
| 10 to 14 Minutes | 2,703 | 10.9% |
| 15 to 19 Minutes | 3,472 | 14.0% |
| 20 to 24 Minutes | 3,601 | 14.5% |
| 25 to 29 Minutes | 2,529 | 10.2% |
| 30 to 34 Minutes | 4,340 | 17.4% |
| 35 to 39 Minutes | 1,266 | 5.1% |
| 40 to 44 Minutes | 1,216 | 4.9% |
| 45 to 59 Minutes | 2,421 | 9.7% |
| 60 to 89 Minutes | 1,276 | 5.1% |
| 90 or more Minutes | 432 | 1.7% |
Commute Time by Sex in Huntersville
The most common commute times in Huntersville are 30 to 34 minutes (2,453 commuters, 18.5%) for males and 30 to 34 minutes (1,887 commuters, 16.2%) for females.
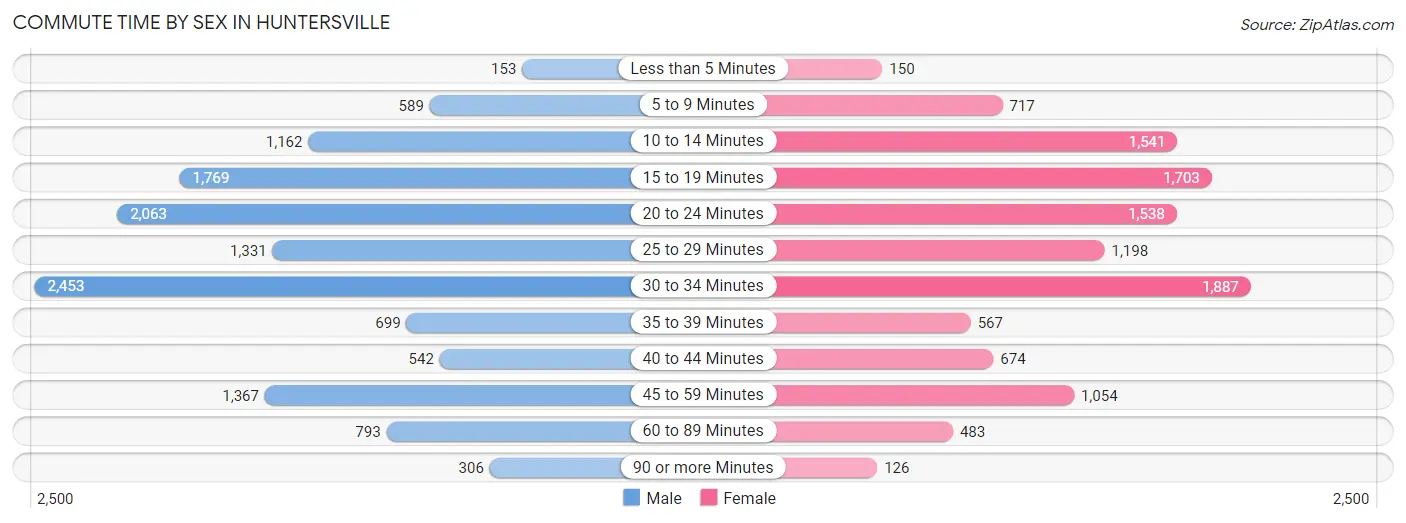
| Commute Time | Male | Female |
| Less than 5 Minutes | 153 (1.2%) | 150 (1.3%) |
| 5 to 9 Minutes | 589 (4.4%) | 717 (6.2%) |
| 10 to 14 Minutes | 1,162 (8.8%) | 1,541 (13.2%) |
| 15 to 19 Minutes | 1,769 (13.4%) | 1,703 (14.6%) |
| 20 to 24 Minutes | 2,063 (15.6%) | 1,538 (13.2%) |
| 25 to 29 Minutes | 1,331 (10.1%) | 1,198 (10.3%) |
| 30 to 34 Minutes | 2,453 (18.5%) | 1,887 (16.2%) |
| 35 to 39 Minutes | 699 (5.3%) | 567 (4.9%) |
| 40 to 44 Minutes | 542 (4.1%) | 674 (5.8%) |
| 45 to 59 Minutes | 1,367 (10.3%) | 1,054 (9.1%) |
| 60 to 89 Minutes | 793 (6.0%) | 483 (4.2%) |
| 90 or more Minutes | 306 (2.3%) | 126 (1.1%) |
Time of Departure to Work by Sex in Huntersville
The most frequent times of departure to work in Huntersville are 7:00 AM to 7:29 AM (2,382, 18.0%) for males and 7:00 AM to 7:29 AM (1,901, 16.3%) for females.
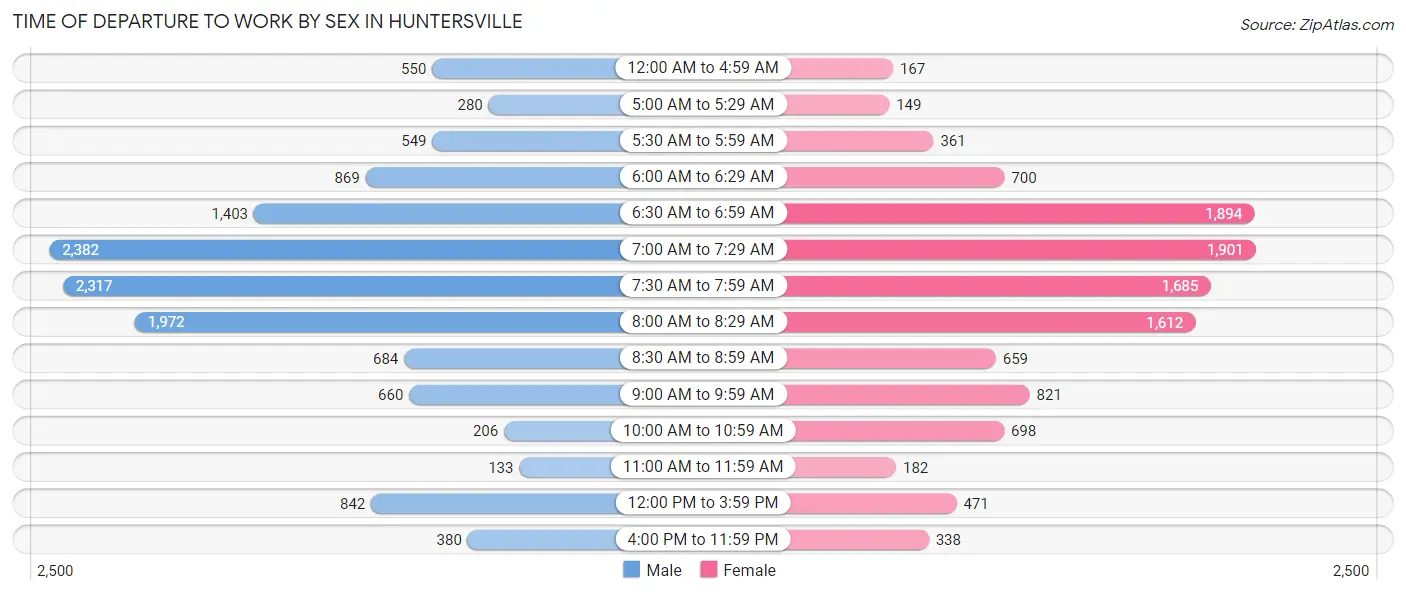
| Time of Departure | Male | Female |
| 12:00 AM to 4:59 AM | 550 (4.2%) | 167 (1.4%) |
| 5:00 AM to 5:29 AM | 280 (2.1%) | 149 (1.3%) |
| 5:30 AM to 5:59 AM | 549 (4.2%) | 361 (3.1%) |
| 6:00 AM to 6:29 AM | 869 (6.6%) | 700 (6.0%) |
| 6:30 AM to 6:59 AM | 1,403 (10.6%) | 1,894 (16.3%) |
| 7:00 AM to 7:29 AM | 2,382 (18.0%) | 1,901 (16.3%) |
| 7:30 AM to 7:59 AM | 2,317 (17.5%) | 1,685 (14.5%) |
| 8:00 AM to 8:29 AM | 1,972 (14.9%) | 1,612 (13.9%) |
| 8:30 AM to 8:59 AM | 684 (5.2%) | 659 (5.7%) |
| 9:00 AM to 9:59 AM | 660 (5.0%) | 821 (7.0%) |
| 10:00 AM to 10:59 AM | 206 (1.6%) | 698 (6.0%) |
| 11:00 AM to 11:59 AM | 133 (1.0%) | 182 (1.6%) |
| 12:00 PM to 3:59 PM | 842 (6.4%) | 471 (4.1%) |
| 4:00 PM to 11:59 PM | 380 (2.9%) | 338 (2.9%) |
| Total | 13,227 (100.0%) | 11,638 (100.0%) |
Housing Occupancy in Huntersville
Occupancy by Ownership in Huntersville
Of the total 22,974 dwellings in Huntersville, owner-occupied units account for 16,799 (73.1%), while renter-occupied units make up 6,175 (26.9%).
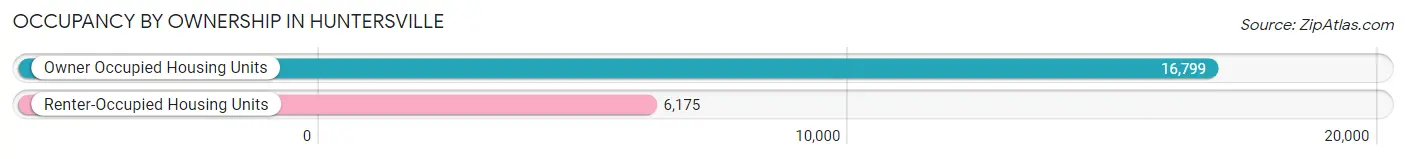
| Occupancy | # Housing Units | % Housing Units |
| Owner Occupied Housing Units | 16,799 | 73.1% |
| Renter-Occupied Housing Units | 6,175 | 26.9% |
| Total Occupied Housing Units | 22,974 | 100.0% |
Occupancy by Household Size in Huntersville
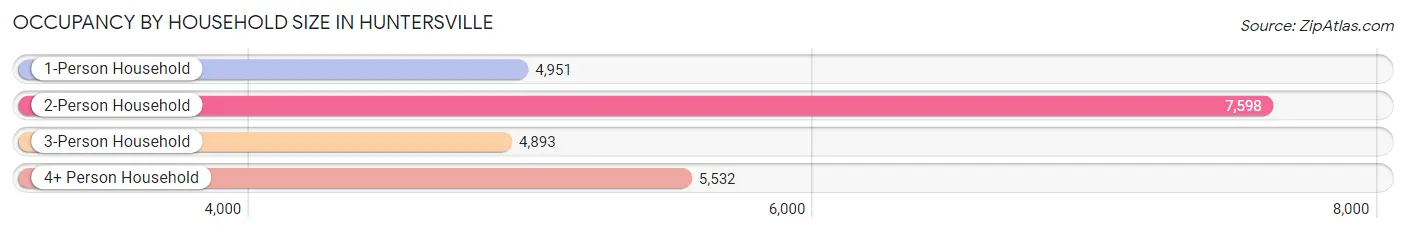
| Household Size | # Housing Units | % Housing Units |
| 1-Person Household | 4,951 | 21.5% |
| 2-Person Household | 7,598 | 33.1% |
| 3-Person Household | 4,893 | 21.3% |
| 4+ Person Household | 5,532 | 24.1% |
| Total Housing Units | 22,974 | 100.0% |
Occupancy by Ownership by Household Size in Huntersville
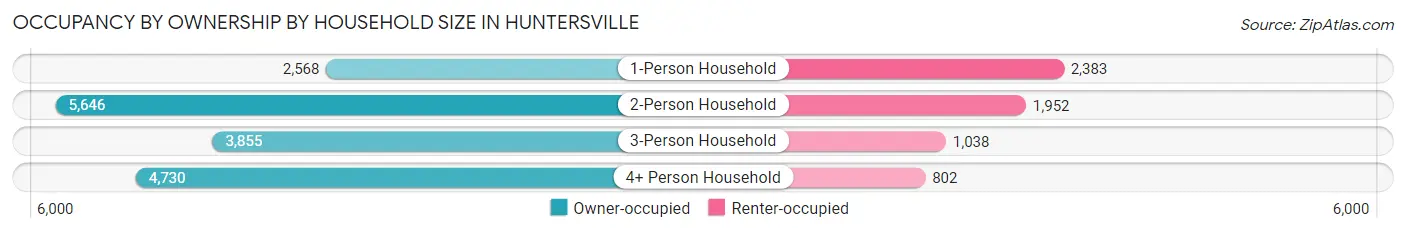
| Household Size | Owner-occupied | Renter-occupied |
| 1-Person Household | 2,568 (51.9%) | 2,383 (48.1%) |
| 2-Person Household | 5,646 (74.3%) | 1,952 (25.7%) |
| 3-Person Household | 3,855 (78.8%) | 1,038 (21.2%) |
| 4+ Person Household | 4,730 (85.5%) | 802 (14.5%) |
| Total Housing Units | 16,799 (73.1%) | 6,175 (26.9%) |
Occupancy by Educational Attainment in Huntersville
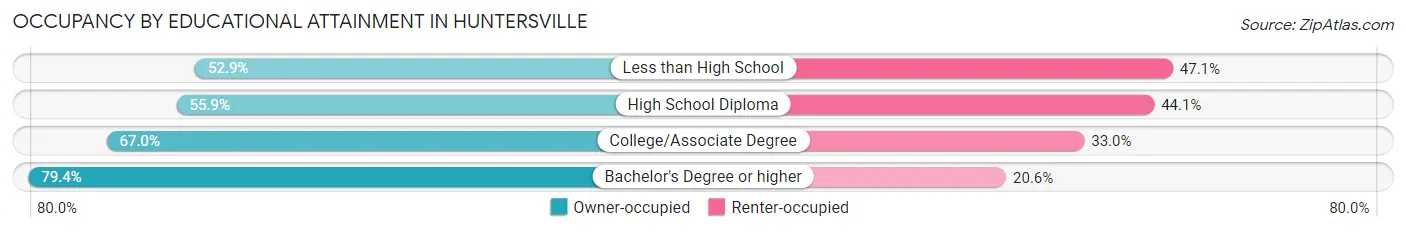
| Household Size | Owner-occupied | Renter-occupied |
| Less than High School | 252 (52.9%) | 224 (47.1%) |
| High School Diploma | 1,275 (55.9%) | 1,006 (44.1%) |
| College/Associate Degree | 4,206 (67.0%) | 2,073 (33.0%) |
| Bachelor's Degree or higher | 11,066 (79.4%) | 2,872 (20.6%) |
Occupancy by Age of Householder in Huntersville
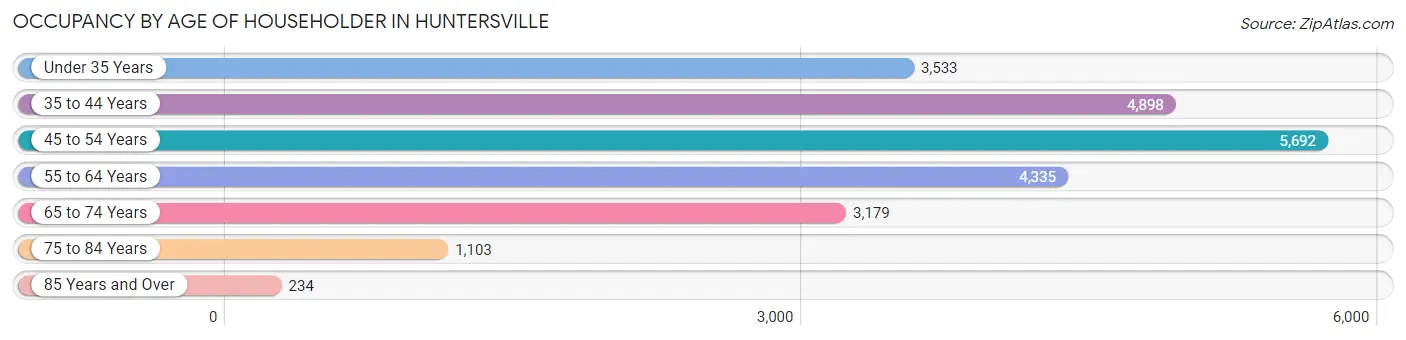
| Age Bracket | # Households | % Households |
| Under 35 Years | 3,533 | 15.4% |
| 35 to 44 Years | 4,898 | 21.3% |
| 45 to 54 Years | 5,692 | 24.8% |
| 55 to 64 Years | 4,335 | 18.9% |
| 65 to 74 Years | 3,179 | 13.8% |
| 75 to 84 Years | 1,103 | 4.8% |
| 85 Years and Over | 234 | 1.0% |
| Total | 22,974 | 100.0% |
Housing Finances in Huntersville
Median Income by Occupancy in Huntersville
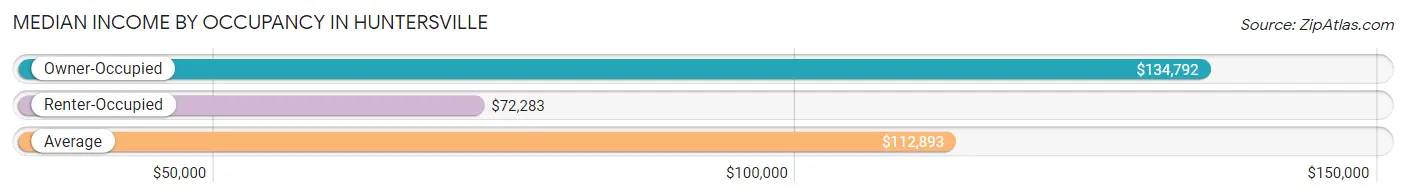
| Occupancy Type | # Households | Median Income |
| Owner-Occupied | 16,799 (73.1%) | $134,792 |
| Renter-Occupied | 6,175 (26.9%) | $72,283 |
| Average | 22,974 (100.0%) | $112,893 |
Occupancy by Householder Income Bracket in Huntersville
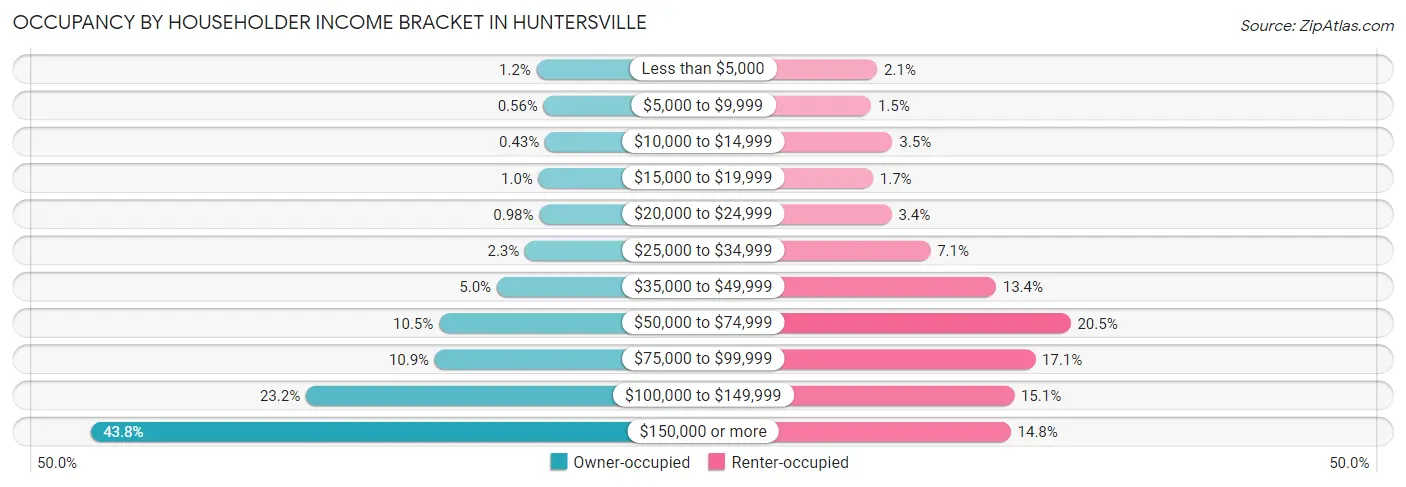
| Income Bracket | Owner-occupied | Renter-occupied |
| Less than $5,000 | 207 (1.2%) | 127 (2.1%) |
| $5,000 to $9,999 | 94 (0.6%) | 91 (1.5%) |
| $10,000 to $14,999 | 73 (0.4%) | 217 (3.5%) |
| $15,000 to $19,999 | 174 (1.0%) | 102 (1.7%) |
| $20,000 to $24,999 | 165 (1.0%) | 211 (3.4%) |
| $25,000 to $34,999 | 391 (2.3%) | 439 (7.1%) |
| $35,000 to $49,999 | 843 (5.0%) | 825 (13.4%) |
| $50,000 to $74,999 | 1,769 (10.5%) | 1,264 (20.5%) |
| $75,000 to $99,999 | 1,835 (10.9%) | 1,055 (17.1%) |
| $100,000 to $149,999 | 3,898 (23.2%) | 932 (15.1%) |
| $150,000 or more | 7,350 (43.8%) | 912 (14.8%) |
| Total | 16,799 (100.0%) | 6,175 (100.0%) |
Monthly Housing Cost Tiers in Huntersville
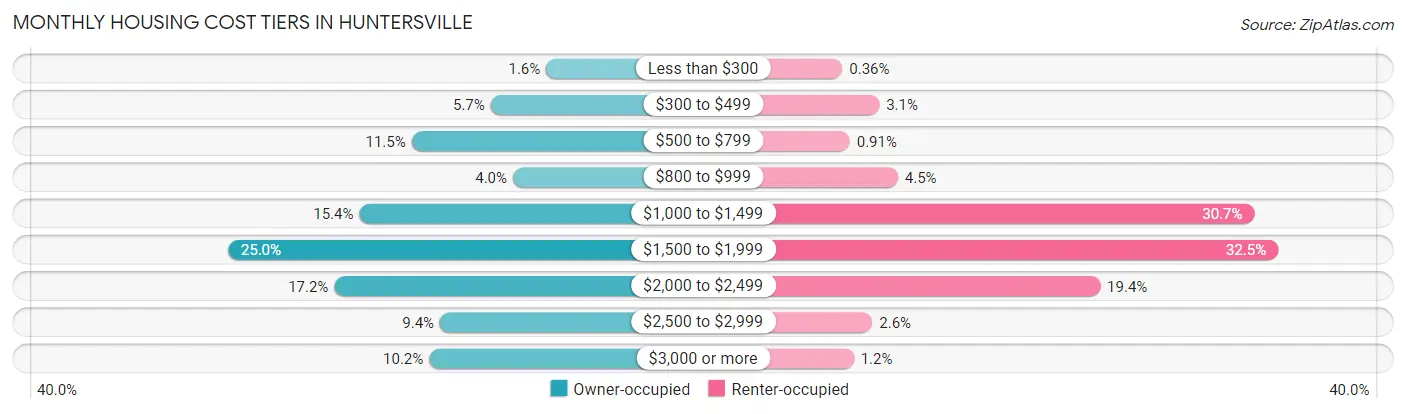
| Monthly Cost | Owner-occupied | Renter-occupied |
| Less than $300 | 267 (1.6%) | 22 (0.4%) |
| $300 to $499 | 954 (5.7%) | 190 (3.1%) |
| $500 to $799 | 1,932 (11.5%) | 56 (0.9%) |
| $800 to $999 | 679 (4.0%) | 275 (4.4%) |
| $1,000 to $1,499 | 2,579 (15.3%) | 1,896 (30.7%) |
| $1,500 to $1,999 | 4,204 (25.0%) | 2,004 (32.5%) |
| $2,000 to $2,499 | 2,889 (17.2%) | 1,195 (19.4%) |
| $2,500 to $2,999 | 1,580 (9.4%) | 159 (2.6%) |
| $3,000 or more | 1,715 (10.2%) | 74 (1.2%) |
| Total | 16,799 (100.0%) | 6,175 (100.0%) |
Physical Housing Characteristics in Huntersville
Housing Structures in Huntersville
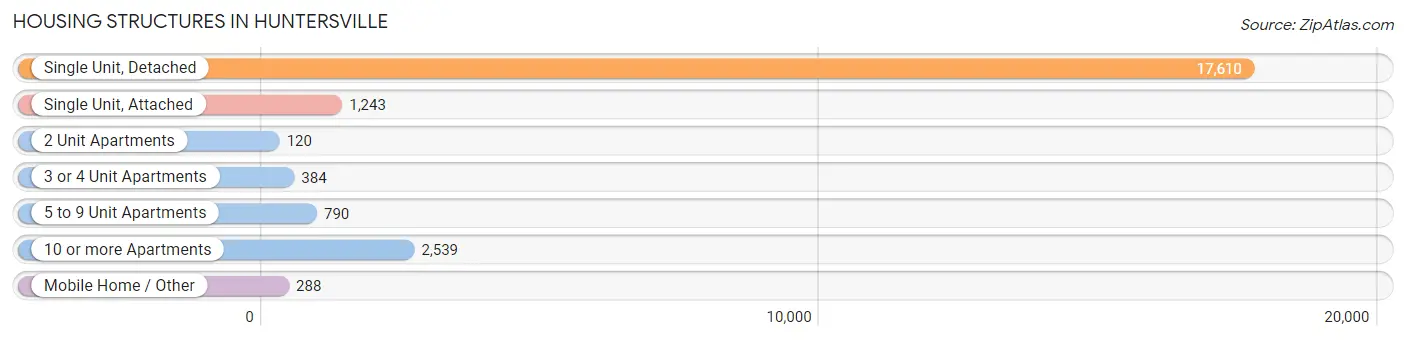
| Structure Type | # Housing Units | % Housing Units |
| Single Unit, Detached | 17,610 | 76.6% |
| Single Unit, Attached | 1,243 | 5.4% |
| 2 Unit Apartments | 120 | 0.5% |
| 3 or 4 Unit Apartments | 384 | 1.7% |
| 5 to 9 Unit Apartments | 790 | 3.4% |
| 10 or more Apartments | 2,539 | 11.1% |
| Mobile Home / Other | 288 | 1.3% |
| Total | 22,974 | 100.0% |
Housing Structures by Occupancy in Huntersville

| Structure Type | Owner-occupied | Renter-occupied |
| Single Unit, Detached | 15,666 (89.0%) | 1,944 (11.0%) |
| Single Unit, Attached | 894 (71.9%) | 349 (28.1%) |
| 2 Unit Apartments | 0 (0.0%) | 120 (100.0%) |
| 3 or 4 Unit Apartments | 17 (4.4%) | 367 (95.6%) |
| 5 to 9 Unit Apartments | 58 (7.3%) | 732 (92.7%) |
| 10 or more Apartments | 0 (0.0%) | 2,539 (100.0%) |
| Mobile Home / Other | 164 (56.9%) | 124 (43.1%) |
| Total | 16,799 (73.1%) | 6,175 (26.9%) |
Housing Structures by Number of Rooms in Huntersville
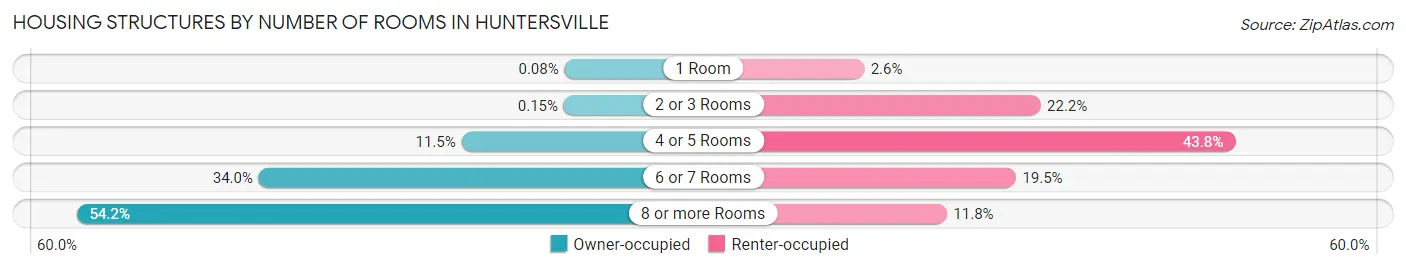
| Number of Rooms | Owner-occupied | Renter-occupied |
| 1 Room | 14 (0.1%) | 163 (2.6%) |
| 2 or 3 Rooms | 26 (0.2%) | 1,372 (22.2%) |
| 4 or 5 Rooms | 1,934 (11.5%) | 2,707 (43.8%) |
| 6 or 7 Rooms | 5,713 (34.0%) | 1,203 (19.5%) |
| 8 or more Rooms | 9,112 (54.2%) | 730 (11.8%) |
| Total | 16,799 (100.0%) | 6,175 (100.0%) |
Housing Structure by Heating Type in Huntersville
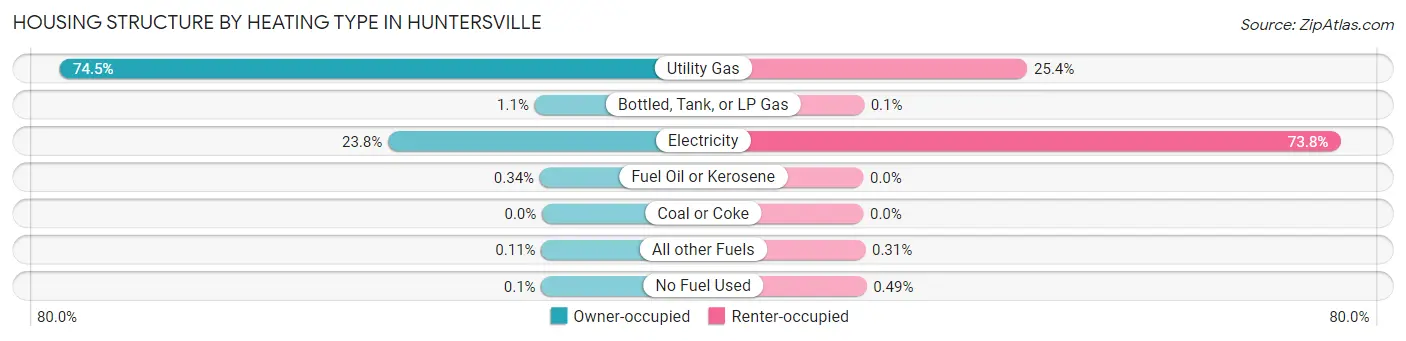
| Heating Type | Owner-occupied | Renter-occupied |
| Utility Gas | 12,516 (74.5%) | 1,566 (25.4%) |
| Bottled, Tank, or LP Gas | 191 (1.1%) | 6 (0.1%) |
| Electricity | 4,001 (23.8%) | 4,554 (73.8%) |
| Fuel Oil or Kerosene | 57 (0.3%) | 0 (0.0%) |
| Coal or Coke | 0 (0.0%) | 0 (0.0%) |
| All other Fuels | 18 (0.1%) | 19 (0.3%) |
| No Fuel Used | 16 (0.1%) | 30 (0.5%) |
| Total | 16,799 (100.0%) | 6,175 (100.0%) |
Household Vehicle Usage in Huntersville
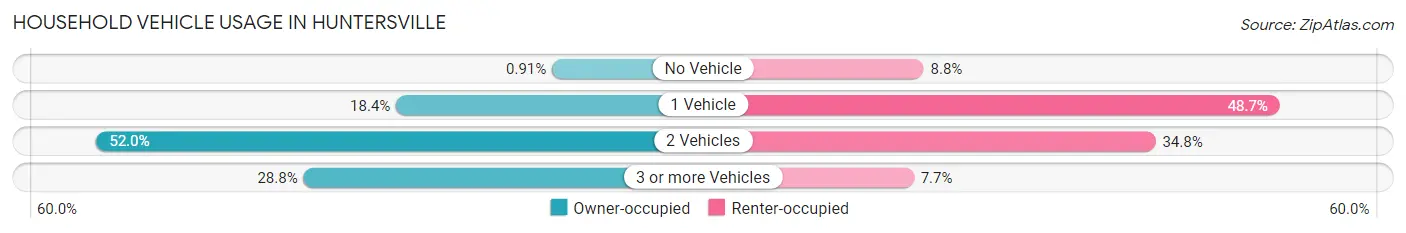
| Vehicles per Household | Owner-occupied | Renter-occupied |
| No Vehicle | 153 (0.9%) | 544 (8.8%) |
| 1 Vehicle | 3,087 (18.4%) | 3,007 (48.7%) |
| 2 Vehicles | 8,728 (52.0%) | 2,148 (34.8%) |
| 3 or more Vehicles | 4,831 (28.8%) | 476 (7.7%) |
| Total | 16,799 (100.0%) | 6,175 (100.0%) |
Real Estate & Mortgages in Huntersville
Real Estate and Mortgage Overview in Huntersville
| Characteristic | Without Mortgage | With Mortgage |
| Housing Units | 3,472 | 13,327 |
| Median Property Value | $416,700 | $386,800 |
| Median Household Income | $98,415 | $6,300 |
| Monthly Housing Costs | $600 | $1,715 |
| Real Estate Taxes | $2,877 | $126 |
Property Value by Mortgage Status in Huntersville
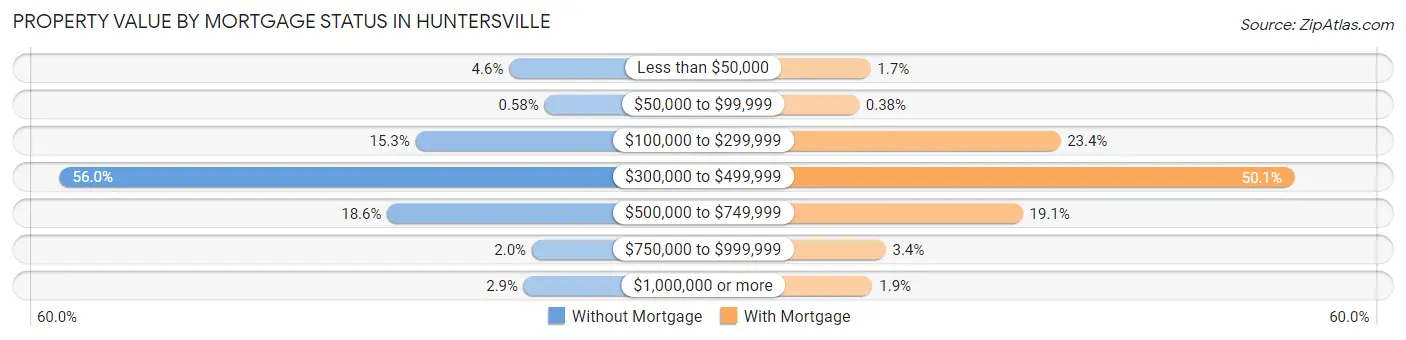
| Property Value | Without Mortgage | With Mortgage |
| Less than $50,000 | 160 (4.6%) | 226 (1.7%) |
| $50,000 to $99,999 | 20 (0.6%) | 51 (0.4%) |
| $100,000 to $299,999 | 532 (15.3%) | 3,117 (23.4%) |
| $300,000 to $499,999 | 1,944 (56.0%) | 6,674 (50.1%) |
| $500,000 to $749,999 | 644 (18.5%) | 2,546 (19.1%) |
| $750,000 to $999,999 | 70 (2.0%) | 457 (3.4%) |
| $1,000,000 or more | 102 (2.9%) | 256 (1.9%) |
| Total | 3,472 (100.0%) | 13,327 (100.0%) |
Household Income by Mortgage Status in Huntersville
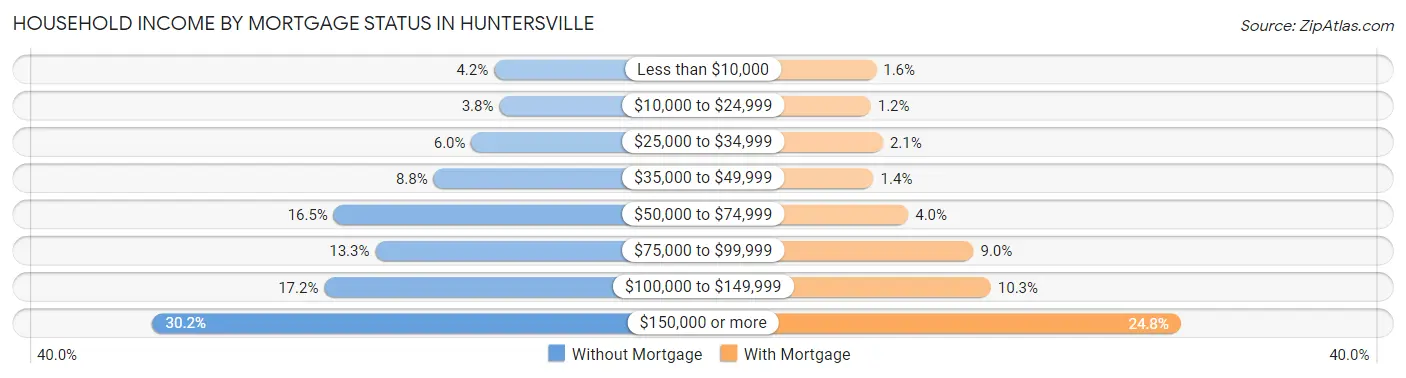
| Household Income | Without Mortgage | With Mortgage |
| Less than $10,000 | 147 (4.2%) | 210 (1.6%) |
| $10,000 to $24,999 | 133 (3.8%) | 154 (1.2%) |
| $25,000 to $34,999 | 207 (6.0%) | 279 (2.1%) |
| $35,000 to $49,999 | 307 (8.8%) | 184 (1.4%) |
| $50,000 to $74,999 | 571 (16.5%) | 536 (4.0%) |
| $75,000 to $99,999 | 461 (13.3%) | 1,198 (9.0%) |
| $100,000 to $149,999 | 596 (17.2%) | 1,374 (10.3%) |
| $150,000 or more | 1,050 (30.2%) | 3,302 (24.8%) |
| Total | 3,472 (100.0%) | 13,327 (100.0%) |
Property Value to Household Income Ratio in Huntersville
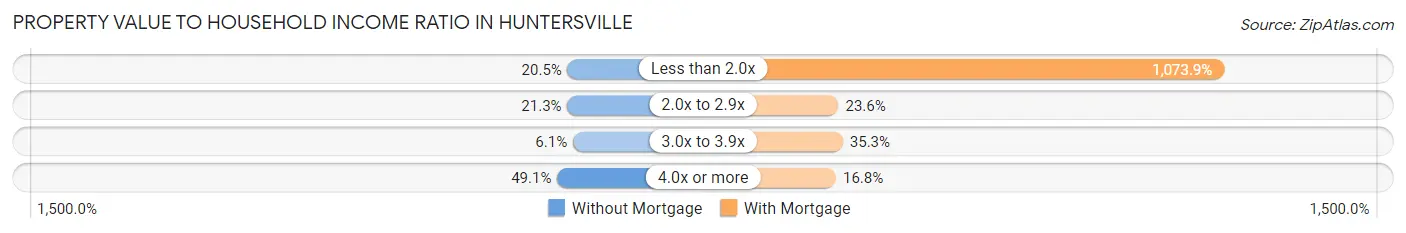
| Value-to-Income Ratio | Without Mortgage | With Mortgage |
| Less than 2.0x | 713 (20.5%) | 143,115 (1,073.9%) |
| 2.0x to 2.9x | 740 (21.3%) | 3,138 (23.5%) |
| 3.0x to 3.9x | 211 (6.1%) | 4,701 (35.3%) |
| 4.0x or more | 1,703 (49.0%) | 2,237 (16.8%) |
| Total | 3,472 (100.0%) | 13,327 (100.0%) |
Real Estate Taxes by Mortgage Status in Huntersville
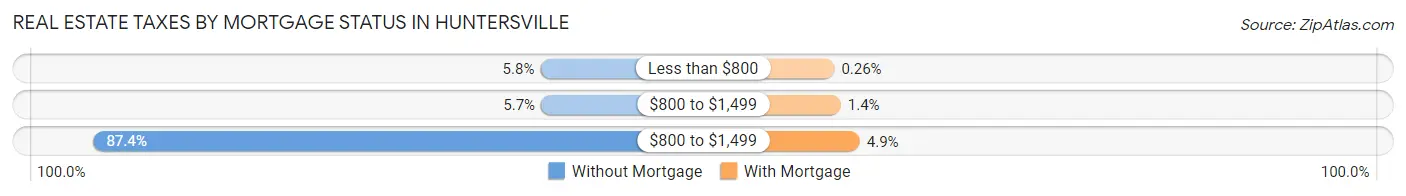
| Property Taxes | Without Mortgage | With Mortgage |
| Less than $800 | 202 (5.8%) | 34 (0.3%) |
| $800 to $1,499 | 198 (5.7%) | 190 (1.4%) |
| $800 to $1,499 | 3,035 (87.4%) | 653 (4.9%) |
| Total | 3,472 (100.0%) | 13,327 (100.0%) |
Health & Disability in Huntersville
Health Insurance Coverage by Age in Huntersville
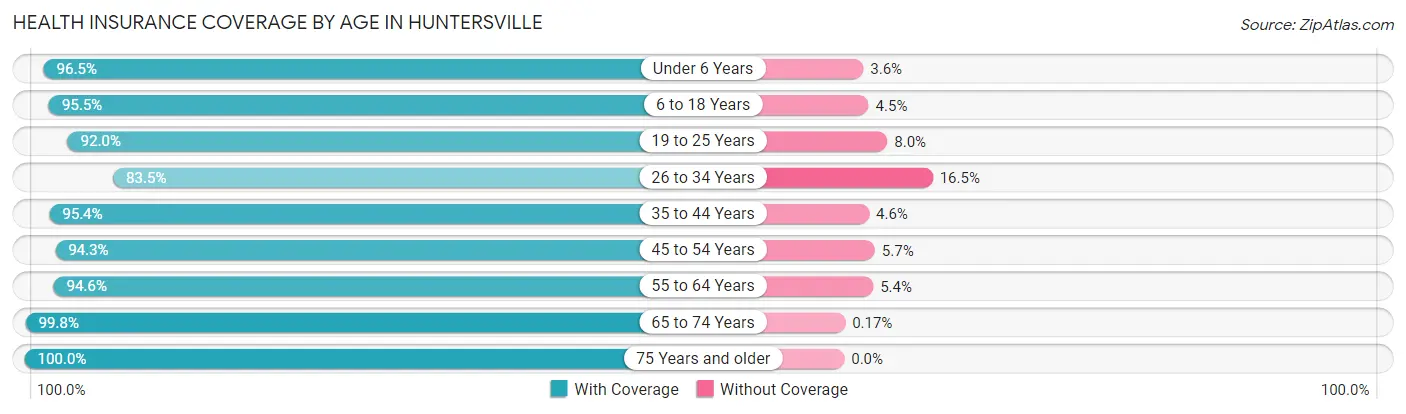
| Age Bracket | With Coverage | Without Coverage |
| Under 6 Years | 4,236 (96.5%) | 156 (3.5%) |
| 6 to 18 Years | 11,287 (95.5%) | 537 (4.5%) |
| 19 to 25 Years | 3,413 (92.0%) | 298 (8.0%) |
| 26 to 34 Years | 5,247 (83.5%) | 1,036 (16.5%) |
| 35 to 44 Years | 9,328 (95.4%) | 452 (4.6%) |
| 45 to 54 Years | 9,269 (94.3%) | 561 (5.7%) |
| 55 to 64 Years | 7,020 (94.6%) | 401 (5.4%) |
| 65 to 74 Years | 5,368 (99.8%) | 9 (0.2%) |
| 75 Years and older | 2,317 (100.0%) | 0 (0.0%) |
| Total | 57,485 (94.3%) | 3,450 (5.7%) |
Health Insurance Coverage by Citizenship Status in Huntersville
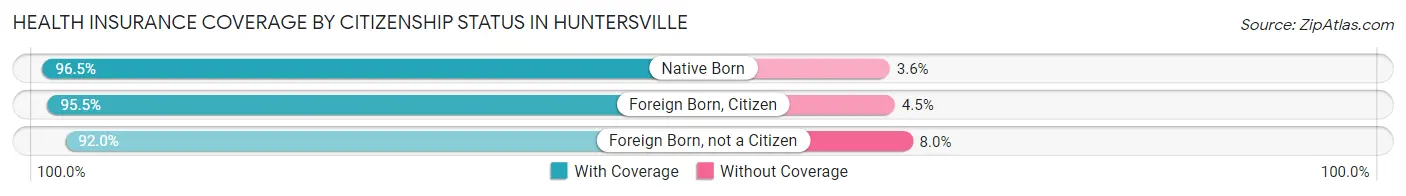
| Citizenship Status | With Coverage | Without Coverage |
| Native Born | 4,236 (96.5%) | 156 (3.5%) |
| Foreign Born, Citizen | 11,287 (95.5%) | 537 (4.5%) |
| Foreign Born, not a Citizen | 3,413 (92.0%) | 298 (8.0%) |
Health Insurance Coverage by Household Income in Huntersville
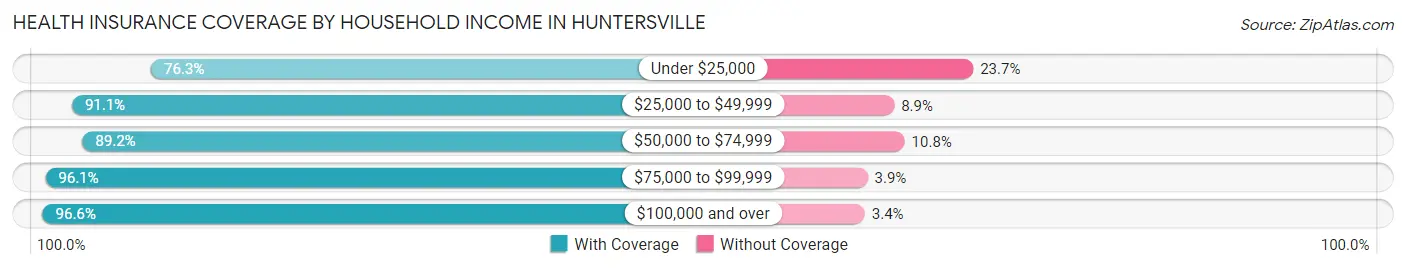
| Household Income | With Coverage | Without Coverage |
| Under $25,000 | 1,994 (76.3%) | 619 (23.7%) |
| $25,000 to $49,999 | 4,854 (91.1%) | 473 (8.9%) |
| $50,000 to $74,999 | 6,253 (89.2%) | 760 (10.8%) |
| $75,000 to $99,999 | 6,366 (96.1%) | 258 (3.9%) |
| $100,000 and over | 37,985 (96.6%) | 1,327 (3.4%) |
Public vs Private Health Insurance Coverage by Age in Huntersville
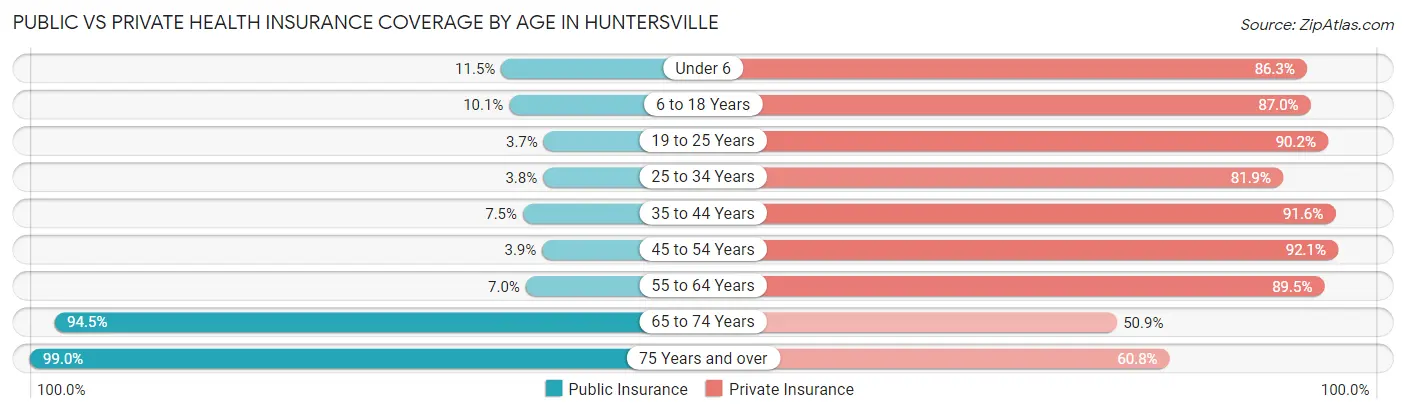
| Age Bracket | Public Insurance | Private Insurance |
| Under 6 | 507 (11.5%) | 3,790 (86.3%) |
| 6 to 18 Years | 1,188 (10.1%) | 10,285 (87.0%) |
| 19 to 25 Years | 136 (3.7%) | 3,347 (90.2%) |
| 25 to 34 Years | 236 (3.8%) | 5,143 (81.9%) |
| 35 to 44 Years | 734 (7.5%) | 8,955 (91.6%) |
| 45 to 54 Years | 387 (3.9%) | 9,049 (92.0%) |
| 55 to 64 Years | 519 (7.0%) | 6,645 (89.5%) |
| 65 to 74 Years | 5,083 (94.5%) | 2,739 (50.9%) |
| 75 Years and over | 2,294 (99.0%) | 1,409 (60.8%) |
| Total | 11,084 (18.2%) | 51,362 (84.3%) |
Disability Status by Sex by Age in Huntersville
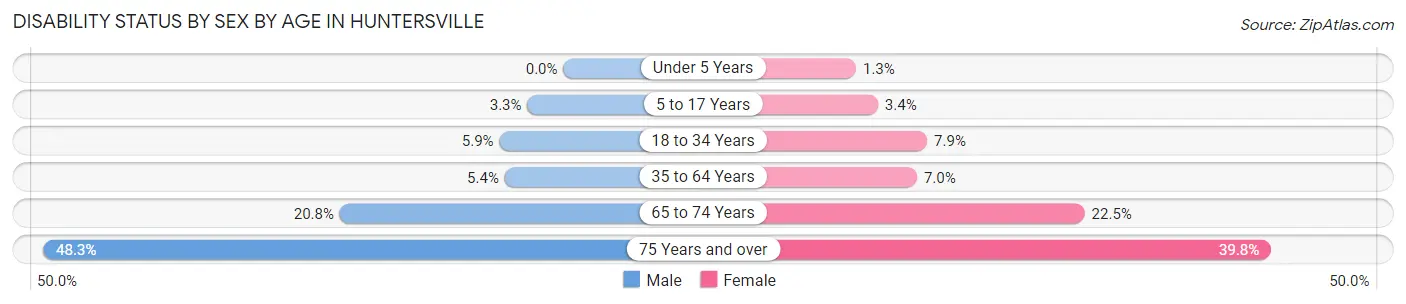
| Age Bracket | Male | Female |
| Under 5 Years | 0 (0.0%) | 22 (1.3%) |
| 5 to 17 Years | 190 (3.3%) | 197 (3.4%) |
| 18 to 34 Years | 315 (5.9%) | 454 (7.9%) |
| 35 to 64 Years | 763 (5.4%) | 909 (7.0%) |
| 65 to 74 Years | 521 (20.7%) | 646 (22.5%) |
| 75 Years and over | 463 (48.3%) | 541 (39.8%) |
Disability Class by Sex by Age in Huntersville
Disability Class: Hearing Difficulty
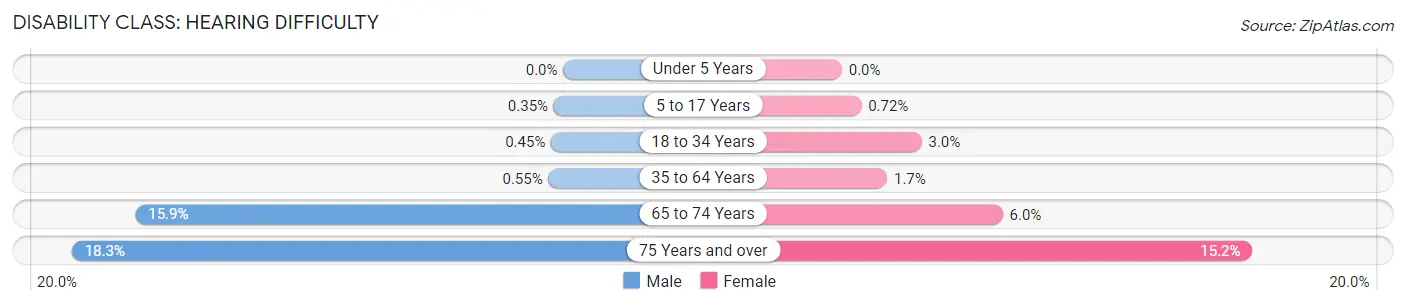
| Age Bracket | Male | Female |
| Under 5 Years | 0 (0.0%) | 0 (0.0%) |
| 5 to 17 Years | 20 (0.4%) | 42 (0.7%) |
| 18 to 34 Years | 24 (0.4%) | 170 (3.0%) |
| 35 to 64 Years | 77 (0.5%) | 218 (1.7%) |
| 65 to 74 Years | 399 (15.9%) | 171 (6.0%) |
| 75 Years and over | 175 (18.2%) | 207 (15.2%) |
Disability Class: Vision Difficulty
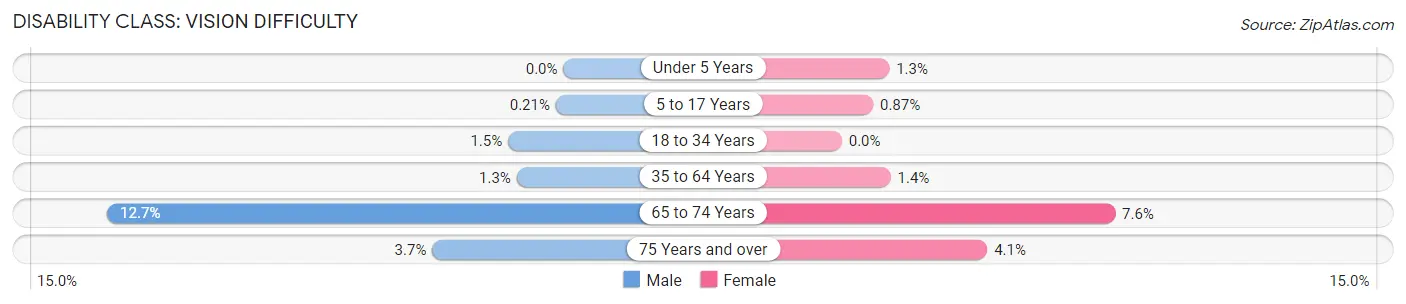
| Age Bracket | Male | Female |
| Under 5 Years | 0 (0.0%) | 22 (1.3%) |
| 5 to 17 Years | 12 (0.2%) | 51 (0.9%) |
| 18 to 34 Years | 82 (1.5%) | 0 (0.0%) |
| 35 to 64 Years | 182 (1.3%) | 177 (1.4%) |
| 65 to 74 Years | 319 (12.7%) | 218 (7.6%) |
| 75 Years and over | 35 (3.6%) | 55 (4.1%) |
Disability Class: Cognitive Difficulty
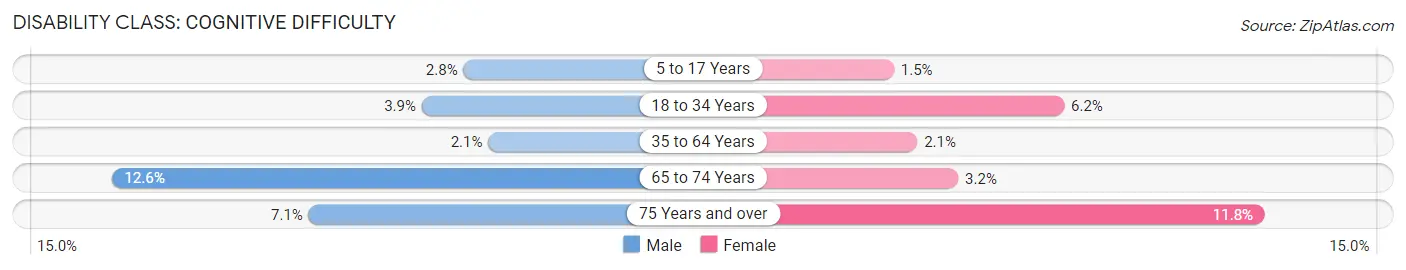
| Age Bracket | Male | Female |
| 5 to 17 Years | 158 (2.8%) | 85 (1.5%) |
| 18 to 34 Years | 209 (3.9%) | 355 (6.2%) |
| 35 to 64 Years | 293 (2.1%) | 273 (2.1%) |
| 65 to 74 Years | 316 (12.6%) | 93 (3.2%) |
| 75 Years and over | 68 (7.1%) | 160 (11.8%) |
Disability Class: Ambulatory Difficulty
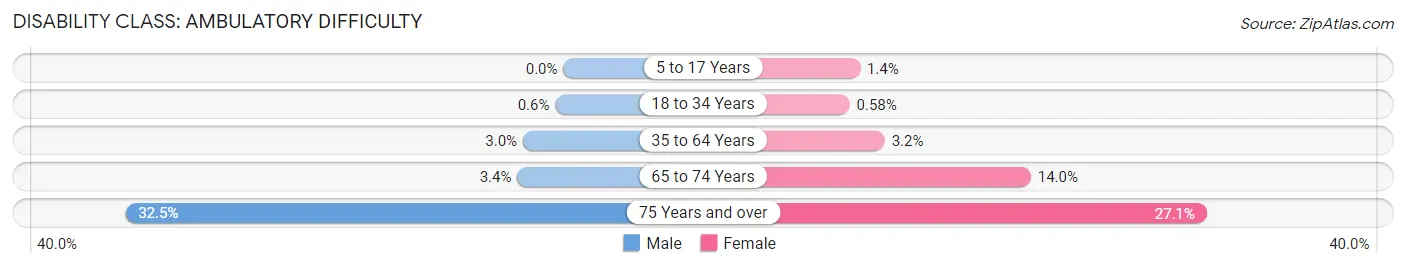
| Age Bracket | Male | Female |
| 5 to 17 Years | 0 (0.0%) | 79 (1.3%) |
| 18 to 34 Years | 32 (0.6%) | 33 (0.6%) |
| 35 to 64 Years | 420 (3.0%) | 415 (3.2%) |
| 65 to 74 Years | 86 (3.4%) | 402 (14.0%) |
| 75 Years and over | 312 (32.5%) | 368 (27.1%) |
Disability Class: Self-Care Difficulty
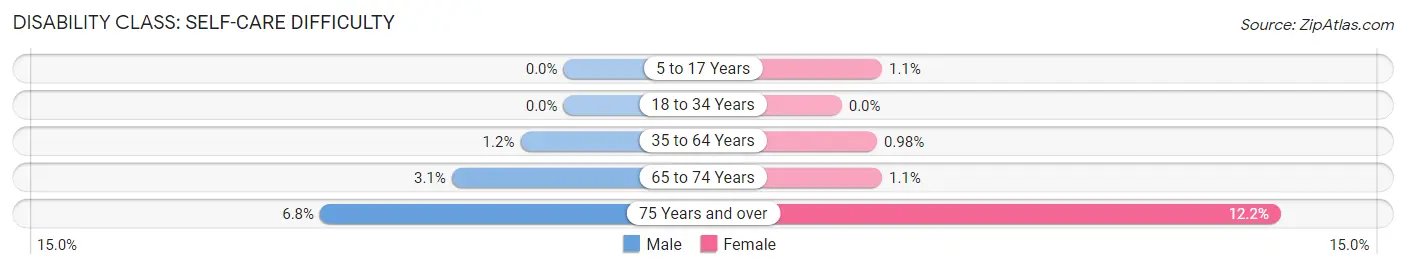
| Age Bracket | Male | Female |
| 5 to 17 Years | 0 (0.0%) | 66 (1.1%) |
| 18 to 34 Years | 0 (0.0%) | 0 (0.0%) |
| 35 to 64 Years | 168 (1.2%) | 127 (1.0%) |
| 65 to 74 Years | 78 (3.1%) | 32 (1.1%) |
| 75 Years and over | 65 (6.8%) | 166 (12.2%) |
Technology Access in Huntersville
Computing Device Access in Huntersville
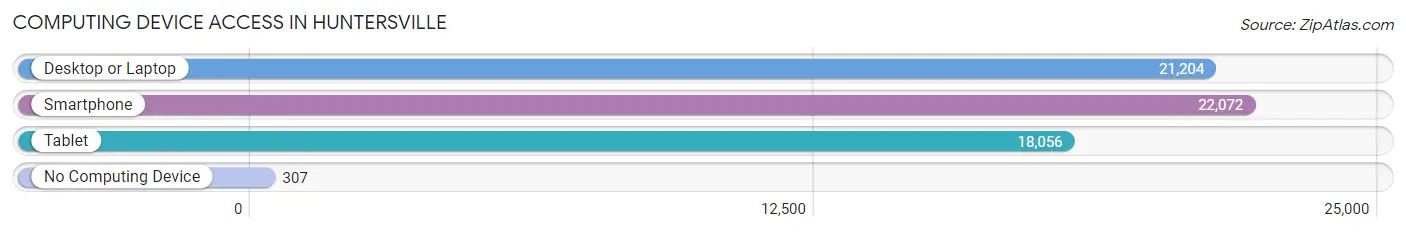
| Device Type | # Households | % Households |
| Desktop or Laptop | 21,204 | 92.3% |
| Smartphone | 22,072 | 96.1% |
| Tablet | 18,056 | 78.6% |
| No Computing Device | 307 | 1.3% |
| Total | 22,974 | 100.0% |
Internet Access in Huntersville
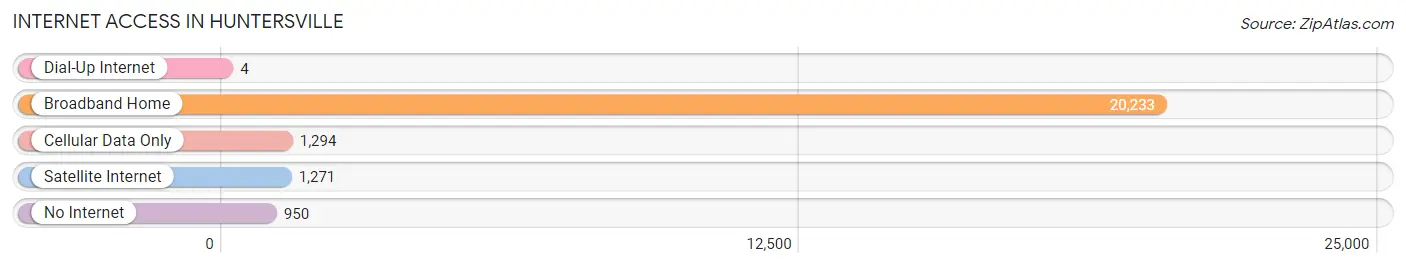
| Internet Type | # Households | % Households |
| Dial-Up Internet | 4 | 0.0% |
| Broadband Home | 20,233 | 88.1% |
| Cellular Data Only | 1,294 | 5.6% |
| Satellite Internet | 1,271 | 5.5% |
| No Internet | 950 | 4.1% |
| Total | 22,974 | 100.0% |
Huntersville Summary
Huntersville, North Carolina is a town located in Mecklenburg County, North Carolina. It is a suburb of Charlotte and is located just north of the city. The town was founded in 1873 and has a population of around 50,000 people.
Geography
Huntersville is located in the Piedmont region of North Carolina, and is situated in the southern part of Mecklenburg County. The town is located on the Catawba River, and is bordered by Cornelius, Davidson, and Charlotte. The town is located at an elevation of 745 feet above sea level. The town has a total area of 24.2 square miles, of which 24.1 square miles is land and 0.1 square miles is water.
Climate
Huntersville has a humid subtropical climate, with hot, humid summers and mild winters. The average annual temperature is around 61 degrees Fahrenheit, with an average high of around 87 degrees Fahrenheit in the summer and an average low of around 35 degrees Fahrenheit in the winter. The town receives an average of 48 inches of precipitation per year, with the majority of it falling in the summer months.
Demographics
As of the 2010 census, the population of Huntersville was 46,773. The racial makeup of the town was 79.2% White, 11.3% African American, 0.3% Native American, 4.7% Asian, 0.1% Pacific Islander, 2.2% from other races, and 2.4% from two or more races. Hispanic or Latino of any race were 6.2% of the population.
Economy
Huntersville is home to a variety of businesses, including retail stores, restaurants, and professional services. The town is also home to several large employers, including Lowe’s Home Improvement, Novant Health, and Atrium Health. The town is also home to several corporate headquarters, including Harris Teeter, Family Dollar, and Compass Group.
History
Huntersville was founded in 1873 by a group of settlers from the Catawba Valley. The town was named after Robert B. Hunter, who was a prominent local landowner. The town was incorporated in 1877, and the first post office was established in 1878.
In the early 1900s, the town began to grow rapidly, and by the 1950s, the population had grown to over 1,000 people. The town continued to grow throughout the 20th century, and by the 2000 census, the population had grown to over 20,000 people.
Today, Huntersville is a thriving community with a population of over 50,000 people. The town is home to a variety of businesses, and is a popular destination for visitors and residents alike.
Common Questions
What is Per Capita Income in Huntersville?
Per Capita income in Huntersville is $54,989.
What is the Median Family Income in Huntersville?
Median Family Income in Huntersville is $133,947.
What is the Median Household income in Huntersville?
Median Household Income in Huntersville is $112,893.
What is Income or Wage Gap in Huntersville?
Income or Wage Gap in Huntersville is 41.4%.
Women in Huntersville earn 58.6 cents for every dollar earned by a man.
What is Inequality or Gini Index in Huntersville?
Inequality or Gini Index in Huntersville is 0.41.
What is the Total Population of Huntersville?
Total Population of Huntersville is 61,202.
What is the Total Male Population of Huntersville?
Total Male Population of Huntersville is 30,467.
What is the Total Female Population of Huntersville?
Total Female Population of Huntersville is 30,735.
What is the Ratio of Males per 100 Females in Huntersville?
There are 99.13 Males per 100 Females in Huntersville.
What is the Ratio of Females per 100 Males in Huntersville?
There are 100.88 Females per 100 Males in Huntersville.
What is the Median Population Age in Huntersville?
Median Population Age in Huntersville is 39.8 Years.
What is the Average Family Size in Huntersville
Average Family Size in Huntersville is 3.1 People.
What is the Average Household Size in Huntersville
Average Household Size in Huntersville is 2.6 People.
How Large is the Labor Force in Huntersville?
There are 34,705 People in the Labor Forcein in Huntersville.
What is the Percentage of People in the Labor Force in Huntersville?
72.9% of People are in the Labor Force in Huntersville.
What is the Unemployment Rate in Huntersville?
Unemployment Rate in Huntersville is 4.1%.