Daphne, AL Map & Demographics
Daphne Map
Daphne Overview
$38,533
PER CAPITA INCOME
$92,413
AVG FAMILY INCOME
$80,657
AVG HOUSEHOLD INCOME
43.7%
WAGE / INCOME GAP [ % ]
56.3¢/ $1
WAGE / INCOME GAP [ $ ]
$12,816
FAMILY INCOME DEFICIT
0.40
INEQUALITY / GINI INDEX
27,861
TOTAL POPULATION
13,445
MALE POPULATION
14,416
FEMALE POPULATION
93.26
MALES / 100 FEMALES
107.22
FEMALES / 100 MALES
37.6
MEDIAN AGE
3.2
AVG FAMILY SIZE
2.6
AVG HOUSEHOLD SIZE
13,690
LABOR FORCE [ PEOPLE ]
64.1%
PERCENT IN LABOR FORCE
2.8%
UNEMPLOYMENT RATE
Daphne Area Codes
Income in Daphne
Income Overview in Daphne
Per Capita Income in Daphne is $38,533, while median incomes of families and households are $92,413 and $80,657 respectively.
| Characteristic | Number | Measure |
| Per Capita Income | 27,861 | $38,533 |
| Median Family Income | 7,117 | $92,413 |
| Mean Family Income | 7,117 | $111,105 |
| Median Household Income | 10,469 | $80,657 |
| Mean Household Income | 10,469 | $99,197 |
| Income Deficit | 7,117 | $12,816 |
| Wage / Income Gap (%) | 27,861 | 43.74% |
| Wage / Income Gap ($) | 27,861 | 56.26¢ per $1 |
| Gini / Inequality Index | 27,861 | 0.40 |
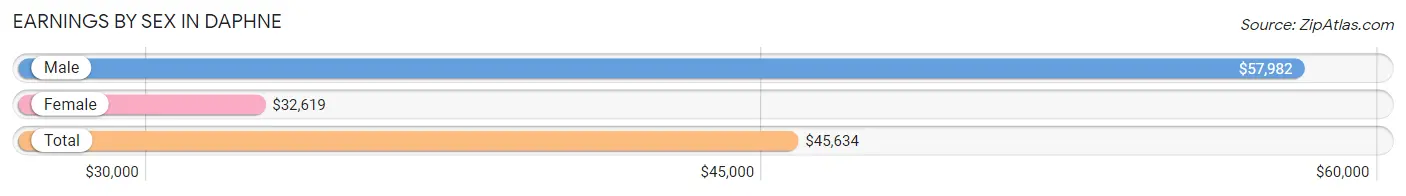
Earnings by Sex in Daphne
Average Earnings in Daphne are $45,634, $57,982 for men and $32,619 for women, a difference of 43.7%.
| Sex | Number | Average Earnings |
| Male | 7,314 (50.8%) | $57,982 |
| Female | 7,084 (49.2%) | $32,619 |
| Total | 14,398 (100.0%) | $45,634 |
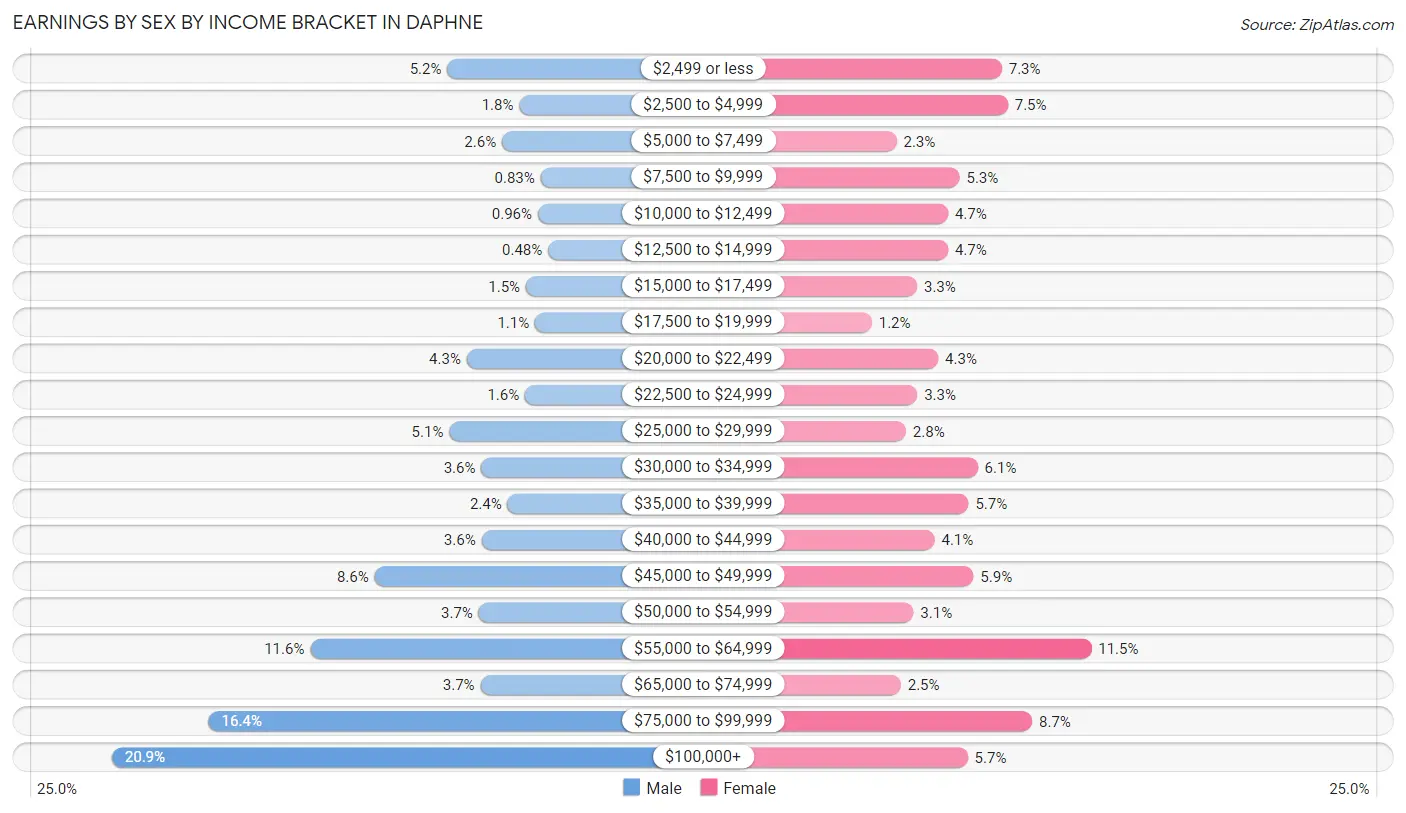
Earnings by Sex by Income Bracket in Daphne
The most common earnings brackets in Daphne are $100,000+ for men (1,529 | 20.9%) and $55,000 to $64,999 for women (811 | 11.5%).
| Income | Male | Female |
| $2,499 or less | 380 (5.2%) | 514 (7.3%) |
| $2,500 to $4,999 | 134 (1.8%) | 534 (7.5%) |
| $5,000 to $7,499 | 193 (2.6%) | 165 (2.3%) |
| $7,500 to $9,999 | 61 (0.8%) | 374 (5.3%) |
| $10,000 to $12,499 | 70 (1.0%) | 336 (4.7%) |
| $12,500 to $14,999 | 35 (0.5%) | 336 (4.7%) |
| $15,000 to $17,499 | 111 (1.5%) | 233 (3.3%) |
| $17,500 to $19,999 | 80 (1.1%) | 83 (1.2%) |
| $20,000 to $22,499 | 314 (4.3%) | 303 (4.3%) |
| $22,500 to $24,999 | 114 (1.6%) | 234 (3.3%) |
| $25,000 to $29,999 | 374 (5.1%) | 196 (2.8%) |
| $30,000 to $34,999 | 264 (3.6%) | 434 (6.1%) |
| $35,000 to $39,999 | 174 (2.4%) | 404 (5.7%) |
| $40,000 to $44,999 | 263 (3.6%) | 291 (4.1%) |
| $45,000 to $49,999 | 630 (8.6%) | 420 (5.9%) |
| $50,000 to $54,999 | 273 (3.7%) | 221 (3.1%) |
| $55,000 to $64,999 | 850 (11.6%) | 811 (11.5%) |
| $65,000 to $74,999 | 267 (3.6%) | 179 (2.5%) |
| $75,000 to $99,999 | 1,198 (16.4%) | 615 (8.7%) |
| $100,000+ | 1,529 (20.9%) | 401 (5.7%) |
| Total | 7,314 (100.0%) | 7,084 (100.0%) |
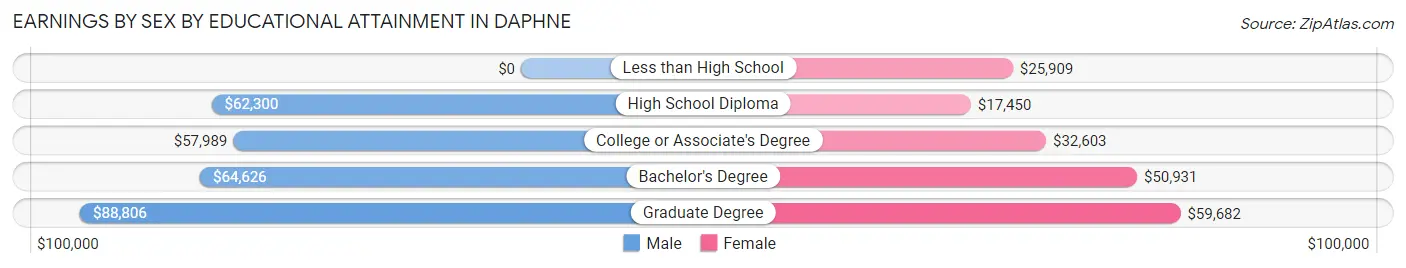
Earnings by Sex by Educational Attainment in Daphne
Average earnings in Daphne are $62,561 for men and $38,987 for women, a difference of 37.7%. Men with an educational attainment of graduate degree enjoy the highest average annual earnings of $88,806, while those with college or associate's degree education earn the least with $57,989. Women with an educational attainment of graduate degree earn the most with the average annual earnings of $59,682, while those with high school diploma education have the smallest earnings of $17,450.
| Educational Attainment | Male Income | Female Income |
| Less than High School | - | - |
| High School Diploma | $62,300 | $17,450 |
| College or Associate's Degree | $57,989 | $32,603 |
| Bachelor's Degree | $64,626 | $50,931 |
| Graduate Degree | $88,806 | $59,682 |
| Total | $62,561 | $38,987 |
Family Income in Daphne
Family Income Brackets in Daphne
According to the Daphne family income data, there are 1,765 families falling into the $100,000 to $149,999 income range, which is the most common income bracket and makes up 24.8% of all families. Conversely, the $10,000 to $14,999 income bracket is the least frequent group with only 28 families (0.4%) belonging to this category.
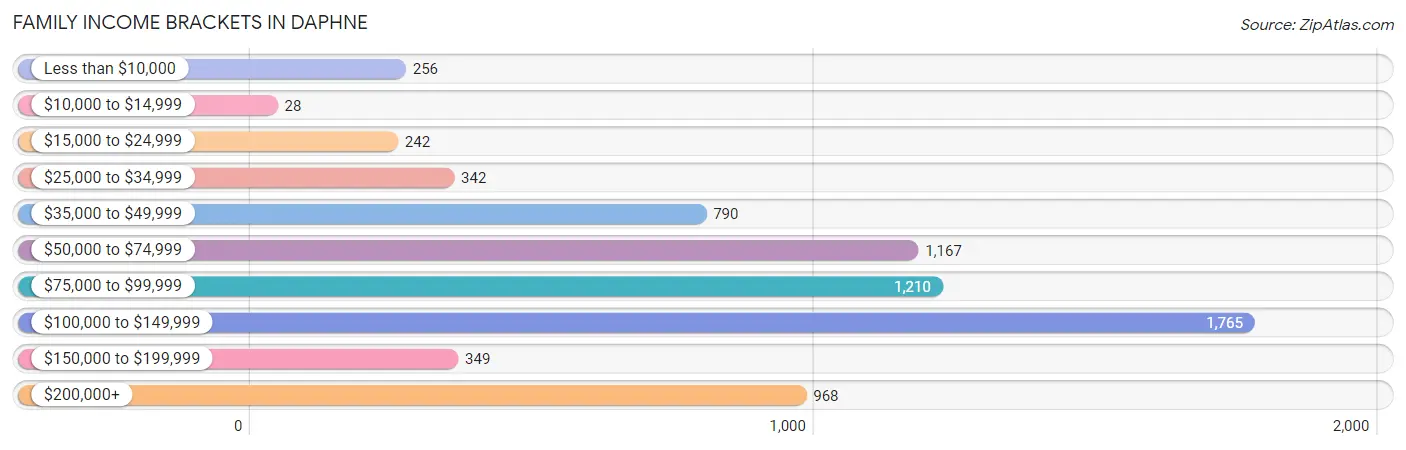
| Income Bracket | # Families | % Families |
| Less than $10,000 | 256 | 3.6% |
| $10,000 to $14,999 | 28 | 0.4% |
| $15,000 to $24,999 | 242 | 3.4% |
| $25,000 to $34,999 | 342 | 4.8% |
| $35,000 to $49,999 | 790 | 11.1% |
| $50,000 to $74,999 | 1,167 | 16.4% |
| $75,000 to $99,999 | 1,210 | 17.0% |
| $100,000 to $149,999 | 1,765 | 24.8% |
| $150,000 to $199,999 | 349 | 4.9% |
| $200,000+ | 968 | 13.6% |
Family Income by Famaliy Size in Daphne
4-person families (1,581 | 22.2%) account for the highest median family income in Daphne with $110,257 per family, while 2-person families (3,201 | 45.0%) have the highest median income of $41,213 per family member.
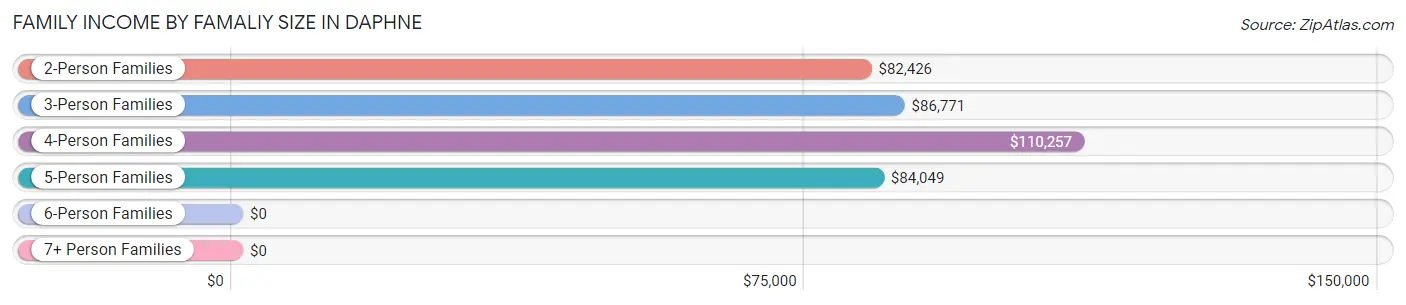
| Income Bracket | # Families | Median Income |
| 2-Person Families | 3,201 (45.0%) | $82,426 |
| 3-Person Families | 1,508 (21.2%) | $86,771 |
| 4-Person Families | 1,581 (22.2%) | $110,257 |
| 5-Person Families | 587 (8.3%) | $84,049 |
| 6-Person Families | 179 (2.5%) | $0 |
| 7+ Person Families | 61 (0.9%) | $0 |
| Total | 7,117 (100.0%) | $92,413 |
Family Income by Number of Earners in Daphne
The median family income in Daphne is $92,413, with families comprising 3+ earners (632) having the highest median family income of $119,519, while families with 1 earner (2,257) have the lowest median family income of $53,679, accounting for 8.9% and 31.7% of families, respectively.
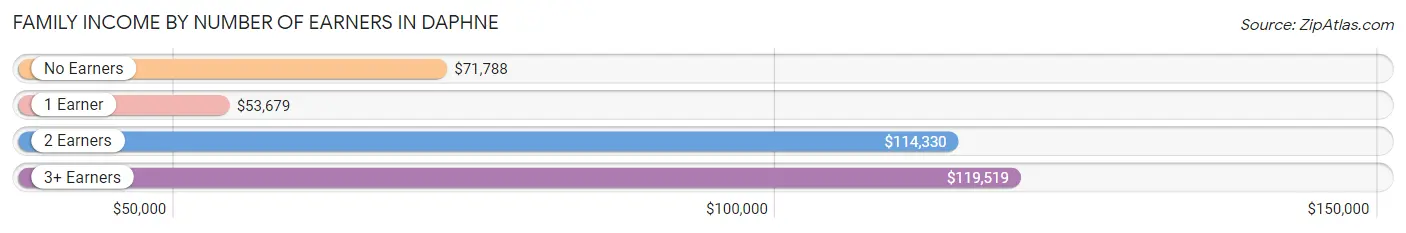
| Number of Earners | # Families | Median Income |
| No Earners | 1,145 (16.1%) | $71,788 |
| 1 Earner | 2,257 (31.7%) | $53,679 |
| 2 Earners | 3,083 (43.3%) | $114,330 |
| 3+ Earners | 632 (8.9%) | $119,519 |
| Total | 7,117 (100.0%) | $92,413 |
Household Income in Daphne
Household Income Brackets in Daphne
With 2,178 households falling in the category, the $100,000 to $149,999 income range is the most frequent in Daphne, accounting for 20.8% of all households. In contrast, only 105 households (1.0%) fall into the $10,000 to $14,999 income bracket, making it the least populous group.
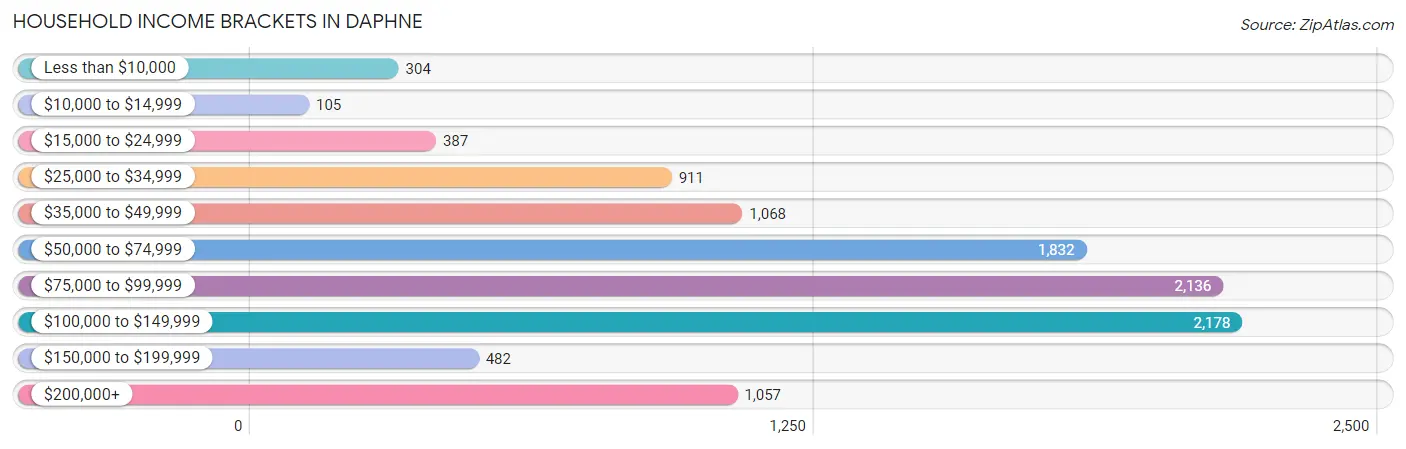
| Income Bracket | # Households | % Households |
| Less than $10,000 | 304 | 2.9% |
| $10,000 to $14,999 | 105 | 1.0% |
| $15,000 to $24,999 | 387 | 3.7% |
| $25,000 to $34,999 | 911 | 8.7% |
| $35,000 to $49,999 | 1,068 | 10.2% |
| $50,000 to $74,999 | 1,832 | 17.5% |
| $75,000 to $99,999 | 2,136 | 20.4% |
| $100,000 to $149,999 | 2,178 | 20.8% |
| $150,000 to $199,999 | 482 | 4.6% |
| $200,000+ | 1,057 | 10.1% |
Household Income by Householder Age in Daphne
The median household income in Daphne is $80,657, with the highest median household income of $89,132 found in the 25 to 44 years age bracket for the primary householder. A total of 3,680 households (35.1%) fall into this category. Meanwhile, the 15 to 24 years age bracket for the primary householder has the lowest median household income of $57,930, with 125 households (1.2%) in this group.
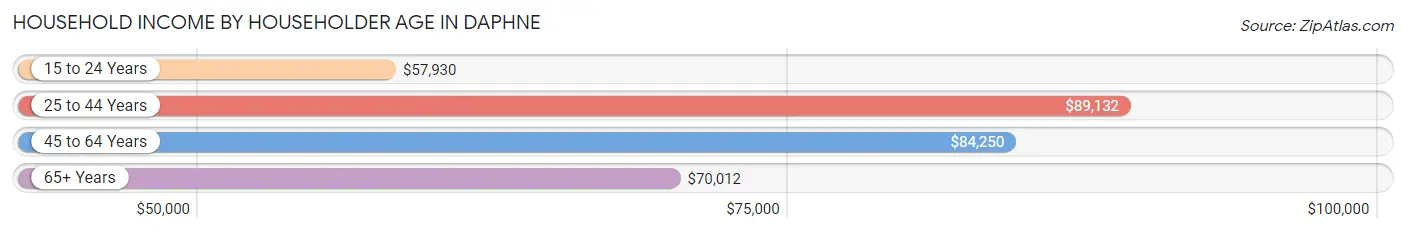
| Income Bracket | # Households | Median Income |
| 15 to 24 Years | 125 (1.2%) | $57,930 |
| 25 to 44 Years | 3,680 (35.1%) | $89,132 |
| 45 to 64 Years | 3,975 (38.0%) | $84,250 |
| 65+ Years | 2,689 (25.7%) | $70,012 |
| Total | 10,469 (100.0%) | $80,657 |
Poverty in Daphne
Income Below Poverty by Sex and Age in Daphne
With 8.5% poverty level for males and 10.2% for females among the residents of Daphne, 15 year old males and 5 year old females are the most vulnerable to poverty, with 33 males (35.5%) and 143 females (44.1%) in their respective age groups living below the poverty level.
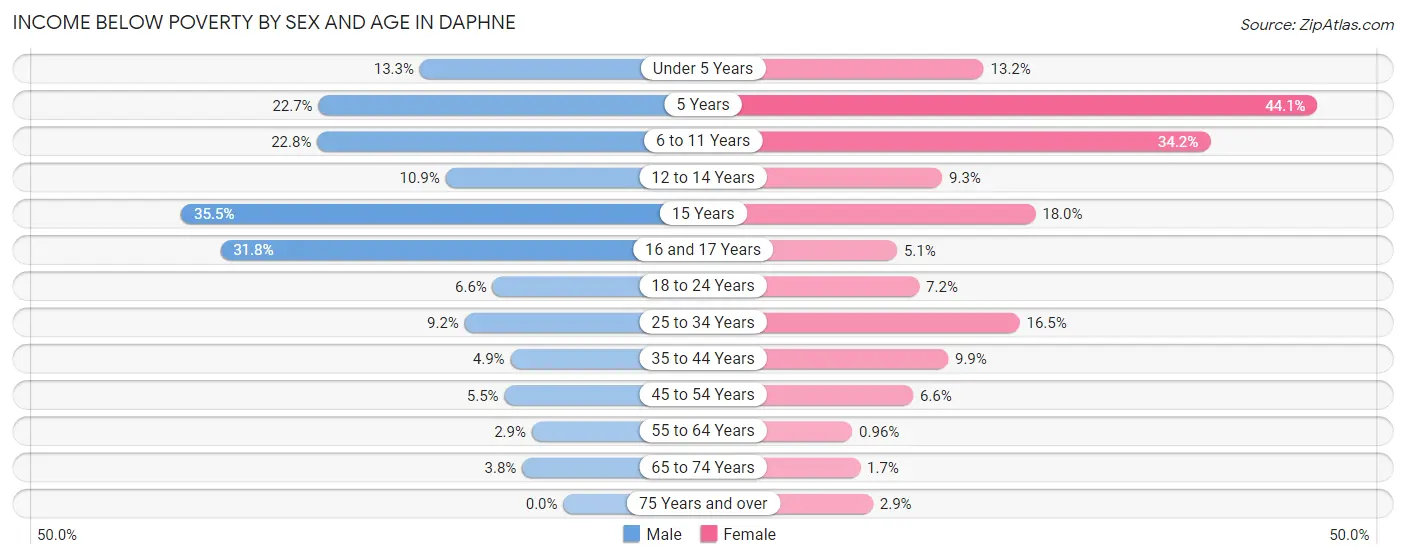
| Age Bracket | Male | Female |
| Under 5 Years | 158 (13.3%) | 170 (13.2%) |
| 5 Years | 50 (22.7%) | 143 (44.1%) |
| 6 to 11 Years | 241 (22.8%) | 281 (34.2%) |
| 12 to 14 Years | 68 (10.9%) | 54 (9.3%) |
| 15 Years | 33 (35.5%) | 44 (18.0%) |
| 16 and 17 Years | 71 (31.8%) | 24 (5.1%) |
| 18 to 24 Years | 67 (6.6%) | 64 (7.2%) |
| 25 to 34 Years | 171 (9.2%) | 313 (16.5%) |
| 35 to 44 Years | 91 (4.9%) | 180 (9.9%) |
| 45 to 54 Years | 75 (5.5%) | 119 (6.6%) |
| 55 to 64 Years | 42 (2.9%) | 17 (1.0%) |
| 65 to 74 Years | 53 (3.8%) | 25 (1.7%) |
| 75 Years and over | 0 (0.0%) | 27 (2.9%) |
| Total | 1,120 (8.5%) | 1,461 (10.2%) |
Income Above Poverty by Sex and Age in Daphne
According to the poverty statistics in Daphne, males aged 75 years and over and females aged 55 to 64 years are the age groups that are most secure financially, with 100.0% of males and 99.0% of females in these age groups living above the poverty line.
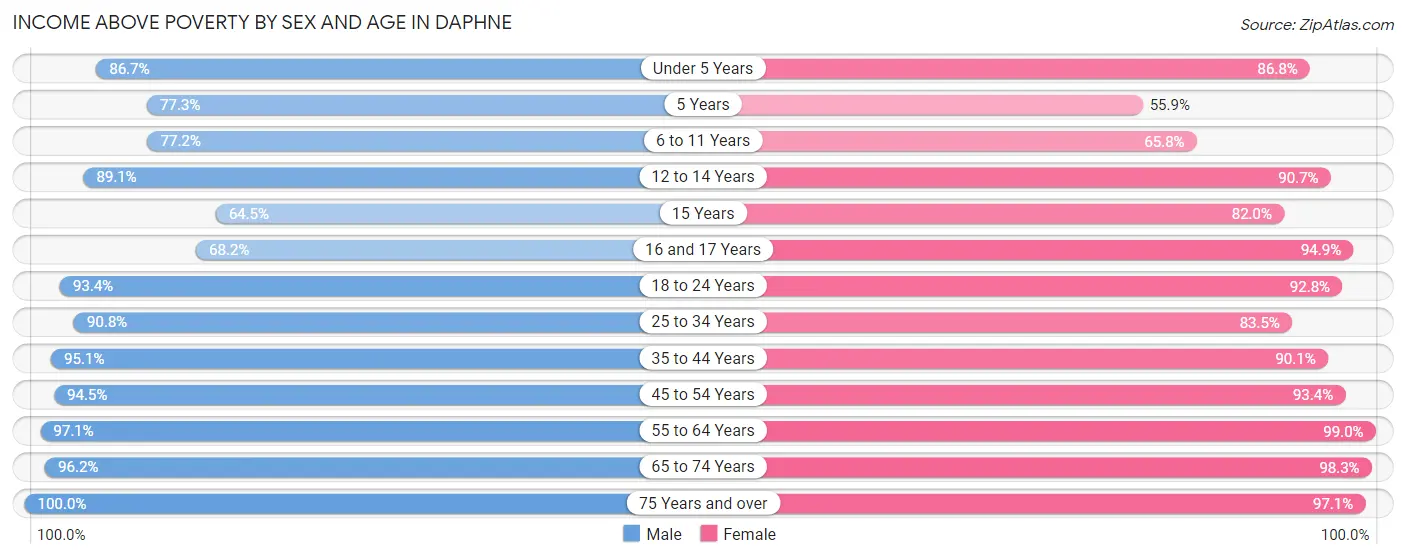
| Age Bracket | Male | Female |
| Under 5 Years | 1,028 (86.7%) | 1,122 (86.8%) |
| 5 Years | 170 (77.3%) | 181 (55.9%) |
| 6 to 11 Years | 814 (77.2%) | 541 (65.8%) |
| 12 to 14 Years | 554 (89.1%) | 526 (90.7%) |
| 15 Years | 60 (64.5%) | 201 (82.0%) |
| 16 and 17 Years | 152 (68.2%) | 445 (94.9%) |
| 18 to 24 Years | 954 (93.4%) | 827 (92.8%) |
| 25 to 34 Years | 1,696 (90.8%) | 1,584 (83.5%) |
| 35 to 44 Years | 1,763 (95.1%) | 1,645 (90.1%) |
| 45 to 54 Years | 1,296 (94.5%) | 1,681 (93.4%) |
| 55 to 64 Years | 1,392 (97.1%) | 1,757 (99.0%) |
| 65 to 74 Years | 1,333 (96.2%) | 1,446 (98.3%) |
| 75 Years and over | 859 (100.0%) | 912 (97.1%) |
| Total | 12,071 (91.5%) | 12,868 (89.8%) |
Income Below Poverty Among Married-Couple Families in Daphne
The poverty statistics for married-couple families in Daphne show that 2.3% or 135 of the total 5,801 families live below the poverty line. Families with 5 or more children have the highest poverty rate of 67.2%, comprising of 41 families. On the other hand, families with 3 or 4 children have the lowest poverty rate of 0.0%, which includes 0 families.
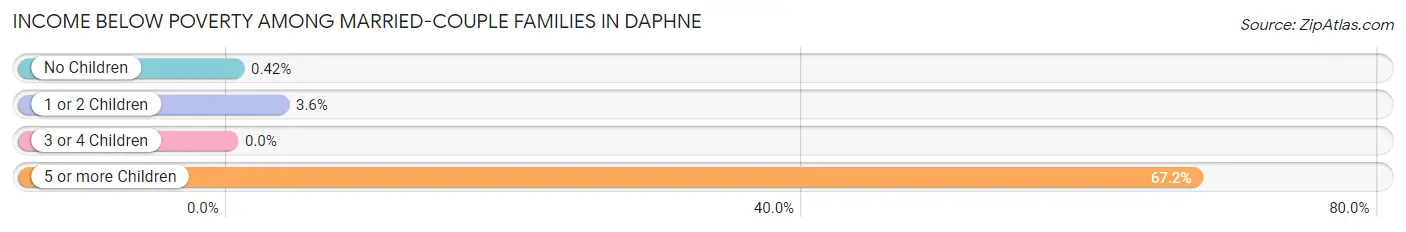
| Children | Above Poverty | Below Poverty |
| No Children | 3,046 (99.6%) | 13 (0.4%) |
| 1 or 2 Children | 2,199 (96.5%) | 81 (3.5%) |
| 3 or 4 Children | 401 (100.0%) | 0 (0.0%) |
| 5 or more Children | 20 (32.8%) | 41 (67.2%) |
| Total | 5,666 (97.7%) | 135 (2.3%) |
Income Below Poverty Among Single-Parent Households in Daphne
According to the poverty data in Daphne, 29.9% or 90 single-father households and 32.1% or 326 single-mother households are living below the poverty line. Among single-father households, those with 1 or 2 children have the highest poverty rate, with 90 households (58.4%) experiencing poverty. Likewise, among single-mother households, those with 5 or more children have the highest poverty rate, with 43 households (100.0%) falling below the poverty line.
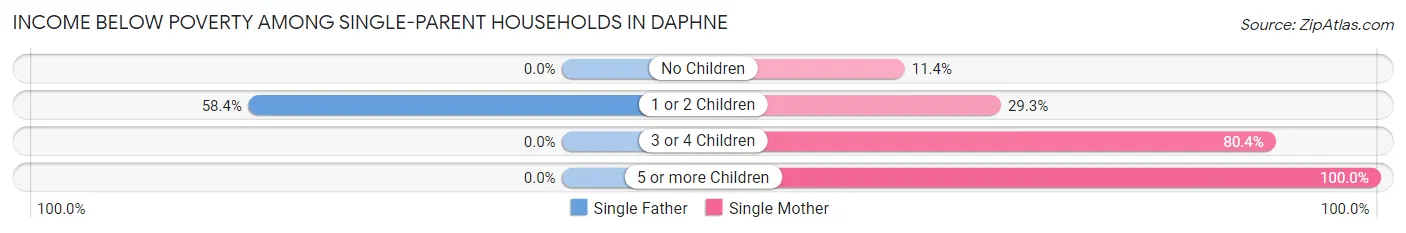
| Children | Single Father | Single Mother |
| No Children | 0 (0.0%) | 46 (11.4%) |
| 1 or 2 Children | 90 (58.4%) | 126 (29.3%) |
| 3 or 4 Children | 0 (0.0%) | 111 (80.4%) |
| 5 or more Children | 0 (0.0%) | 43 (100.0%) |
| Total | 90 (29.9%) | 326 (32.1%) |
Income Below Poverty Among Married-Couple vs Single-Parent Households in Daphne
The poverty data for Daphne shows that 135 of the married-couple family households (2.3%) and 416 of the single-parent households (31.6%) are living below the poverty level. Within the married-couple family households, those with 5 or more children have the highest poverty rate, with 41 households (67.2%) falling below the poverty line. Among the single-parent households, those with 5 or more children have the highest poverty rate, with 43 household (100.0%) living below poverty.
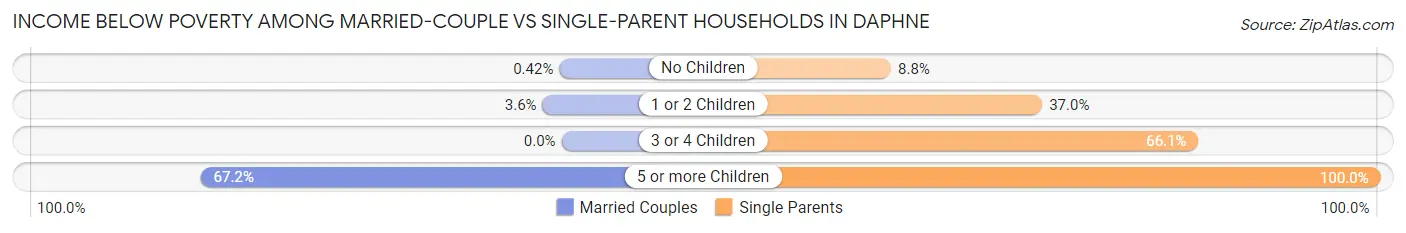
| Children | Married-Couple Families | Single-Parent Households |
| No Children | 13 (0.4%) | 46 (8.8%) |
| 1 or 2 Children | 81 (3.5%) | 216 (37.0%) |
| 3 or 4 Children | 0 (0.0%) | 111 (66.1%) |
| 5 or more Children | 41 (67.2%) | 43 (100.0%) |
| Total | 135 (2.3%) | 416 (31.6%) |
Race in Daphne
The most populous races in Daphne are White / Caucasian (21,406 | 76.8%), Black / African American (4,007 | 14.4%), and Two or more Races (1,535 | 5.5%).
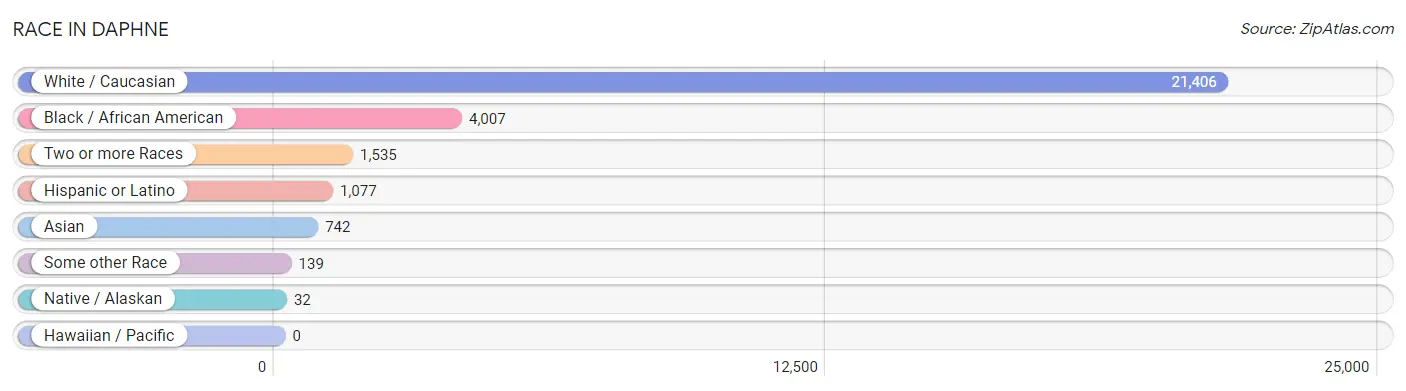
| Race | # Population | % Population |
| Asian | 742 | 2.7% |
| Black / African American | 4,007 | 14.4% |
| Hawaiian / Pacific | 0 | 0.0% |
| Hispanic or Latino | 1,077 | 3.9% |
| Native / Alaskan | 32 | 0.1% |
| White / Caucasian | 21,406 | 76.8% |
| Two or more Races | 1,535 | 5.5% |
| Some other Race | 139 | 0.5% |
| Total | 27,861 | 100.0% |
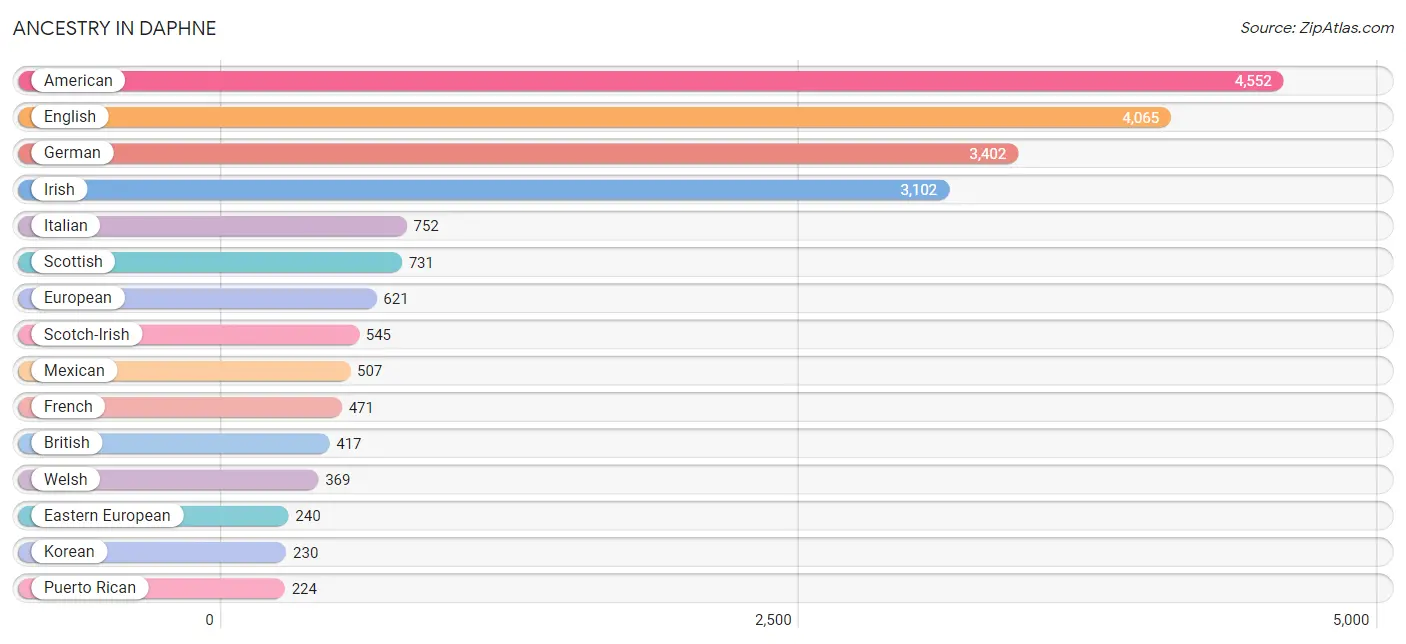
Ancestry in Daphne
The most populous ancestries reported in Daphne are American (4,552 | 16.3%), English (4,065 | 14.6%), German (3,402 | 12.2%), Irish (3,102 | 11.1%), and Italian (752 | 2.7%), together accounting for 57.0% of all Daphne residents.
| Ancestry | # Population | % Population |
| African | 33 | 0.1% |
| American | 4,552 | 16.3% |
| Arab | 24 | 0.1% |
| Austrian | 16 | 0.1% |
| Belgian | 9 | 0.0% |
| Bhutanese | 188 | 0.7% |
| Brazilian | 114 | 0.4% |
| British | 417 | 1.5% |
| Burmese | 185 | 0.7% |
| Cajun | 29 | 0.1% |
| Canadian | 44 | 0.2% |
| Celtic | 41 | 0.2% |
| Central American | 110 | 0.4% |
| Cherokee | 221 | 0.8% |
| Choctaw | 84 | 0.3% |
| Creek | 21 | 0.1% |
| Cuban | 19 | 0.1% |
| Czech | 32 | 0.1% |
| Danish | 136 | 0.5% |
| Dutch | 36 | 0.1% |
| Dutch West Indian | 15 | 0.1% |
| Eastern European | 240 | 0.9% |
| Ecuadorian | 51 | 0.2% |
| English | 4,065 | 14.6% |
| European | 621 | 2.2% |
| Finnish | 33 | 0.1% |
| French | 471 | 1.7% |
| French Canadian | 185 | 0.7% |
| German | 3,402 | 12.2% |
| Greek | 174 | 0.6% |
| Haitian | 74 | 0.3% |
| Honduran | 110 | 0.4% |
| Hungarian | 26 | 0.1% |
| Indian (Asian) | 71 | 0.3% |
| Iranian | 11 | 0.0% |
| Irish | 3,102 | 11.1% |
| Italian | 752 | 2.7% |
| Korean | 230 | 0.8% |
| Laotian | 209 | 0.7% |
| Lithuanian | 82 | 0.3% |
| Macedonian | 36 | 0.1% |
| Mexican | 507 | 1.8% |
| Mexican American Indian | 24 | 0.1% |
| Mongolian | 50 | 0.2% |
| Moroccan | 22 | 0.1% |
| Nigerian | 29 | 0.1% |
| Norwegian | 122 | 0.4% |
| Pakistani | 23 | 0.1% |
| Palestinian | 2 | 0.0% |
| Polish | 127 | 0.5% |
| Puerto Rican | 224 | 0.8% |
| Romanian | 16 | 0.1% |
| Russian | 17 | 0.1% |
| Scandinavian | 2 | 0.0% |
| Scotch-Irish | 545 | 2.0% |
| Scottish | 731 | 2.6% |
| South American | 51 | 0.2% |
| Spaniard | 28 | 0.1% |
| Spanish | 18 | 0.1% |
| Sri Lankan | 45 | 0.2% |
| Subsaharan African | 62 | 0.2% |
| Swedish | 220 | 0.8% |
| Swiss | 62 | 0.2% |
| Thai | 144 | 0.5% |
| Tongan | 117 | 0.4% |
| Turkish | 15 | 0.1% |
| Ukrainian | 8 | 0.0% |
| Welsh | 369 | 1.3% |
| Yugoslavian | 115 | 0.4% | View All 69 Rows |
Immigrants in Daphne
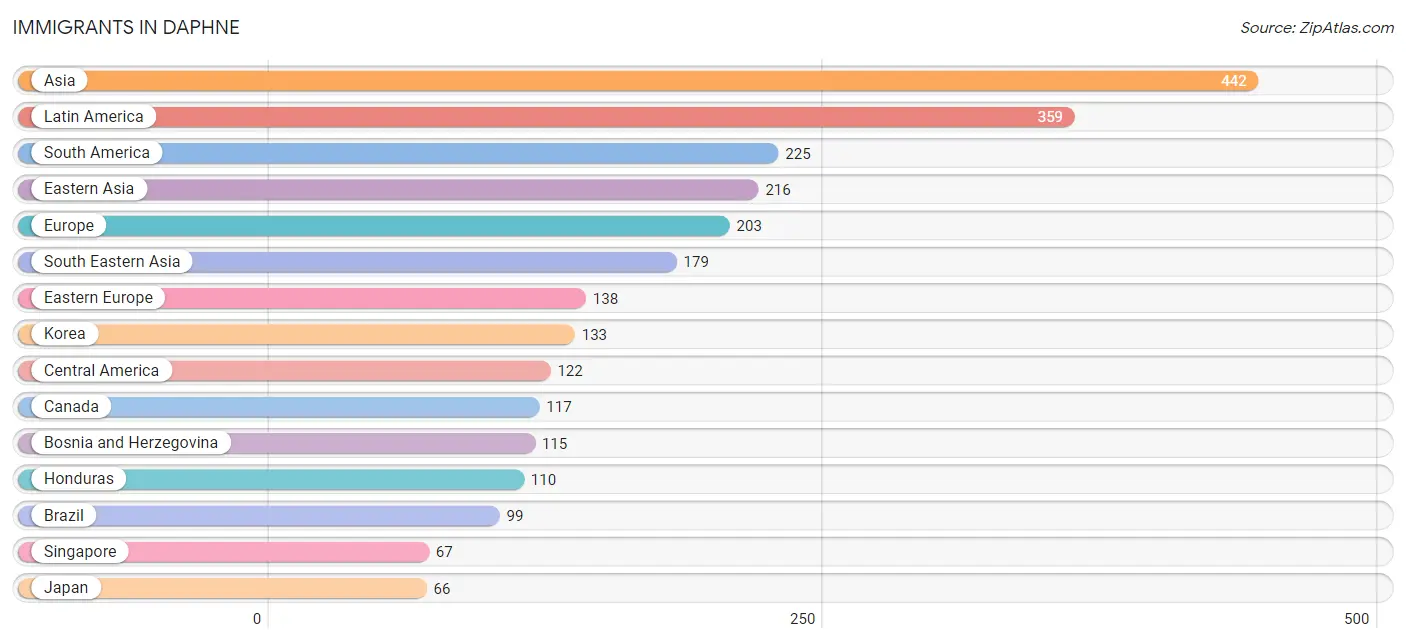
The most numerous immigrant groups reported in Daphne came from Asia (442 | 1.6%), Latin America (359 | 1.3%), South America (225 | 0.8%), Eastern Asia (216 | 0.8%), and Europe (203 | 0.7%), together accounting for 5.2% of all Daphne residents.
| Immigration Origin | # Population | % Population |
| Africa | 41 | 0.2% |
| Asia | 442 | 1.6% |
| Bosnia and Herzegovina | 115 | 0.4% |
| Brazil | 99 | 0.4% |
| Cambodia | 14 | 0.1% |
| Canada | 117 | 0.4% |
| Caribbean | 12 | 0.0% |
| Central America | 122 | 0.4% |
| China | 17 | 0.1% |
| Colombia | 10 | 0.0% |
| Czechoslovakia | 12 | 0.0% |
| Eastern Asia | 216 | 0.8% |
| Eastern Europe | 138 | 0.5% |
| Ecuador | 51 | 0.2% |
| England | 15 | 0.1% |
| Europe | 203 | 0.7% |
| Germany | 13 | 0.1% |
| Greece | 12 | 0.0% |
| Haiti | 12 | 0.0% |
| Honduras | 110 | 0.4% |
| India | 32 | 0.1% |
| Italy | 12 | 0.0% |
| Japan | 66 | 0.2% |
| Korea | 133 | 0.5% |
| Latin America | 359 | 1.3% |
| Malaysia | 33 | 0.1% |
| Mexico | 12 | 0.0% |
| Nigeria | 29 | 0.1% |
| Northern Europe | 28 | 0.1% |
| Norway | 13 | 0.1% |
| Philippines | 20 | 0.1% |
| Poland | 11 | 0.0% |
| Singapore | 67 | 0.2% |
| South Africa | 12 | 0.0% |
| South America | 225 | 0.8% |
| South Central Asia | 32 | 0.1% |
| South Eastern Asia | 179 | 0.6% |
| Southern Europe | 24 | 0.1% |
| Turkey | 15 | 0.1% |
| Uruguay | 65 | 0.2% |
| Vietnam | 45 | 0.2% |
| Western Africa | 29 | 0.1% |
| Western Asia | 15 | 0.1% |
| Western Europe | 13 | 0.1% | View All 44 Rows |
Sex and Age in Daphne
Sex and Age in Daphne
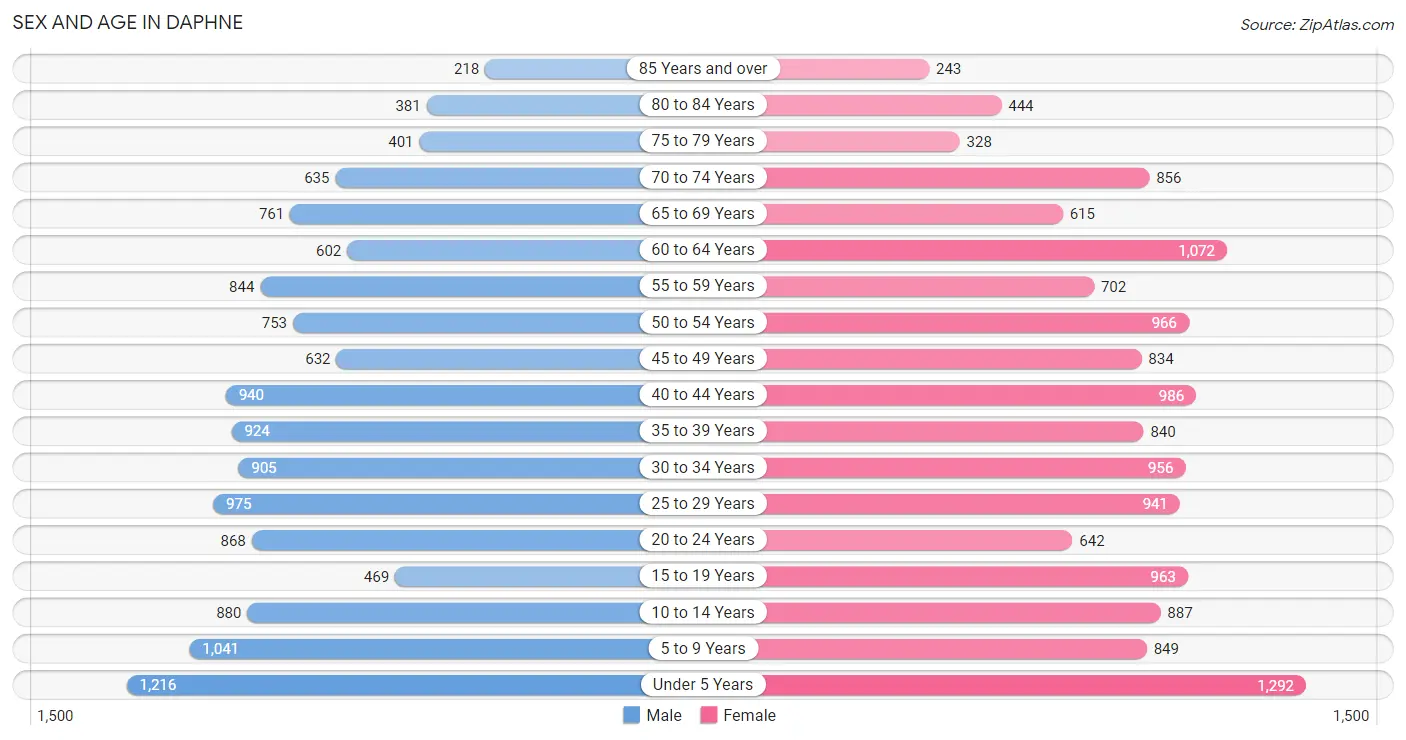
The most populous age groups in Daphne are Under 5 Years (1,216 | 9.0%) for men and Under 5 Years (1,292 | 9.0%) for women.
| Age Bracket | Male | Female |
| Under 5 Years | 1,216 (9.0%) | 1,292 (9.0%) |
| 5 to 9 Years | 1,041 (7.7%) | 849 (5.9%) |
| 10 to 14 Years | 880 (6.6%) | 887 (6.1%) |
| 15 to 19 Years | 469 (3.5%) | 963 (6.7%) |
| 20 to 24 Years | 868 (6.5%) | 642 (4.4%) |
| 25 to 29 Years | 975 (7.2%) | 941 (6.5%) |
| 30 to 34 Years | 905 (6.7%) | 956 (6.6%) |
| 35 to 39 Years | 924 (6.9%) | 840 (5.8%) |
| 40 to 44 Years | 940 (7.0%) | 986 (6.8%) |
| 45 to 49 Years | 632 (4.7%) | 834 (5.8%) |
| 50 to 54 Years | 753 (5.6%) | 966 (6.7%) |
| 55 to 59 Years | 844 (6.3%) | 702 (4.9%) |
| 60 to 64 Years | 602 (4.5%) | 1,072 (7.4%) |
| 65 to 69 Years | 761 (5.7%) | 615 (4.3%) |
| 70 to 74 Years | 635 (4.7%) | 856 (5.9%) |
| 75 to 79 Years | 401 (3.0%) | 328 (2.3%) |
| 80 to 84 Years | 381 (2.8%) | 444 (3.1%) |
| 85 Years and over | 218 (1.6%) | 243 (1.7%) |
| Total | 13,445 (100.0%) | 14,416 (100.0%) |
Families and Households in Daphne
Median Family Size in Daphne
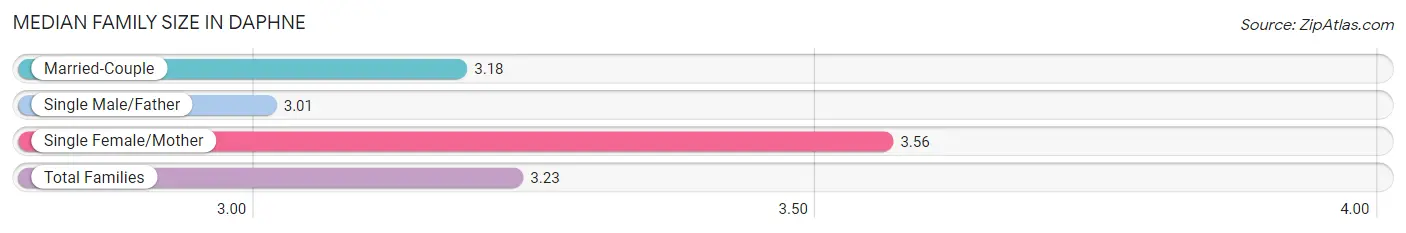
The median family size in Daphne is 3.23 persons per family, with single female/mother families (1,015 | 14.3%) accounting for the largest median family size of 3.56 persons per family. On the other hand, single male/father families (301 | 4.2%) represent the smallest median family size with 3.01 persons per family.
| Family Type | # Families | Family Size |
| Married-Couple | 5,801 (81.5%) | 3.18 |
| Single Male/Father | 301 (4.2%) | 3.01 |
| Single Female/Mother | 1,015 (14.3%) | 3.56 |
| Total Families | 7,117 (100.0%) | 3.23 |
Median Household Size in Daphne
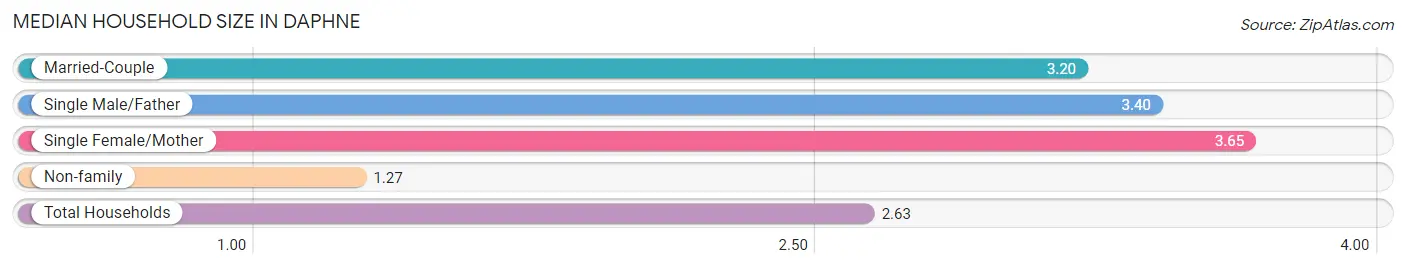
The median household size in Daphne is 2.63 persons per household, with single female/mother households (1,015 | 9.7%) accounting for the largest median household size of 3.65 persons per household. non-family households (3,352 | 32.0%) represent the smallest median household size with 1.27 persons per household.
| Household Type | # Households | Household Size |
| Married-Couple | 5,801 (55.4%) | 3.20 |
| Single Male/Father | 301 (2.9%) | 3.40 |
| Single Female/Mother | 1,015 (9.7%) | 3.65 |
| Non-family | 3,352 (32.0%) | 1.27 |
| Total Households | 10,469 (100.0%) | 2.63 |
Household Size by Marriage Status in Daphne
Out of a total of 10,469 households in Daphne, 7,117 (68.0%) are family households, while 3,352 (32.0%) are nonfamily households. The most numerous type of family households are 2-person households, comprising 3,158, and the most common type of nonfamily households are 1-person households, comprising 2,719.
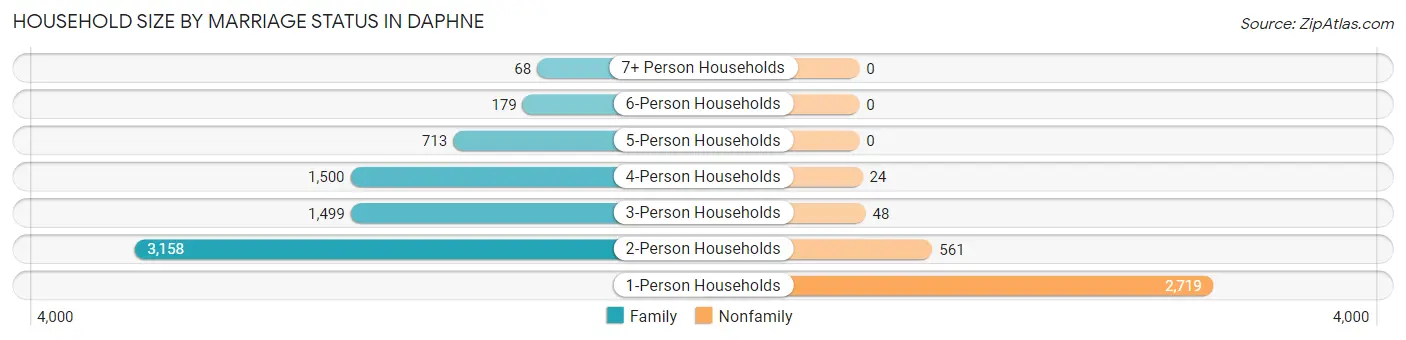
| Household Size | Family Households | Nonfamily Households |
| 1-Person Households | - | 2,719 (26.0%) |
| 2-Person Households | 3,158 (30.2%) | 561 (5.4%) |
| 3-Person Households | 1,499 (14.3%) | 48 (0.5%) |
| 4-Person Households | 1,500 (14.3%) | 24 (0.2%) |
| 5-Person Households | 713 (6.8%) | 0 (0.0%) |
| 6-Person Households | 179 (1.7%) | 0 (0.0%) |
| 7+ Person Households | 68 (0.6%) | 0 (0.0%) |
| Total | 7,117 (68.0%) | 3,352 (32.0%) |
Female Fertility in Daphne
Fertility by Age in Daphne
Average fertility rate in Daphne is 82.0 births per 1,000 women. Women in the age bracket of 20 to 34 years have the highest fertility rate with 182.0 births per 1,000 women. Women in the age bracket of 20 to 34 years acount for 89.7% of all women with births.
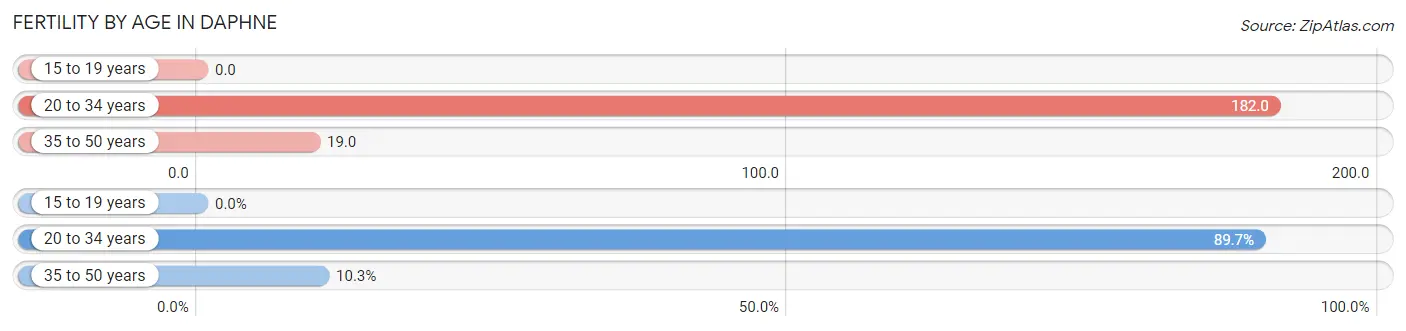
| Age Bracket | Women with Births | Births / 1,000 Women |
| 15 to 19 years | 0 (0.0%) | 0.0 |
| 20 to 34 years | 463 (89.7%) | 182.0 |
| 35 to 50 years | 53 (10.3%) | 19.0 |
| Total | 516 (100.0%) | 82.0 |
Fertility by Age by Marriage Status in Daphne
99.8% of women with births (516) in Daphne are married. The highest percentage of unmarried women with births falls into 35 to 50 years age bracket with 1.9% of them unmarried at the time of birth, while the lowest percentage of unmarried women with births belong to 20 to 34 years age bracket with 0.0% of them unmarried.
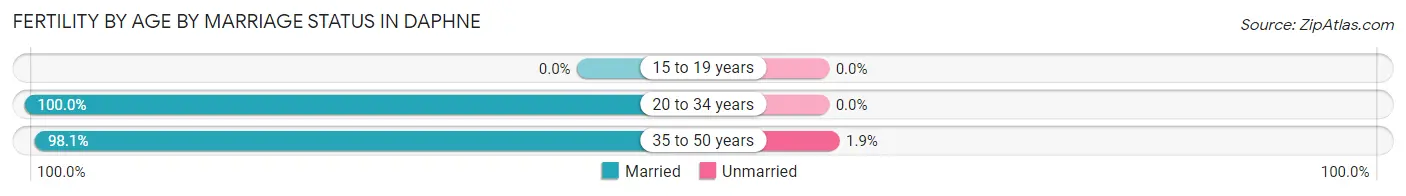
| Age Bracket | Married | Unmarried |
| 15 to 19 years | 0 (0.0%) | 0 (0.0%) |
| 20 to 34 years | 463 (100.0%) | 0 (0.0%) |
| 35 to 50 years | 52 (98.1%) | 1 (1.9%) |
| Total | 515 (99.8%) | 1 (0.2%) |
Fertility by Education in Daphne
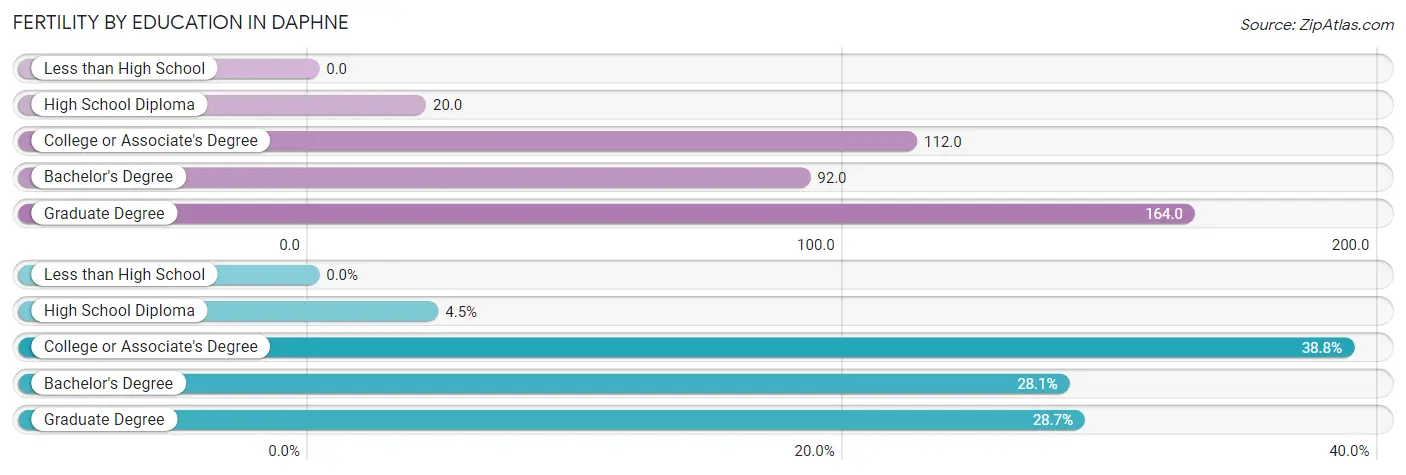
| Educational Attainment | Women with Births | Births / 1,000 Women |
| Less than High School | 0 (0.0%) | 0.0 |
| High School Diploma | 23 (4.5%) | 20.0 |
| College or Associate's Degree | 200 (38.8%) | 112.0 |
| Bachelor's Degree | 145 (28.1%) | 92.0 |
| Graduate Degree | 148 (28.7%) | 164.0 |
| Total | 516 (100.0%) | 82.0 |
Fertility by Education by Marriage Status in Daphne
0.2% of women with births in Daphne are unmarried. Women with the educational attainment of high school diploma are most likely to be married with 100.0% of them married at childbirth, while women with the educational attainment of college or associate's degree are least likely to be married with 0.5% of them unmarried at childbirth.
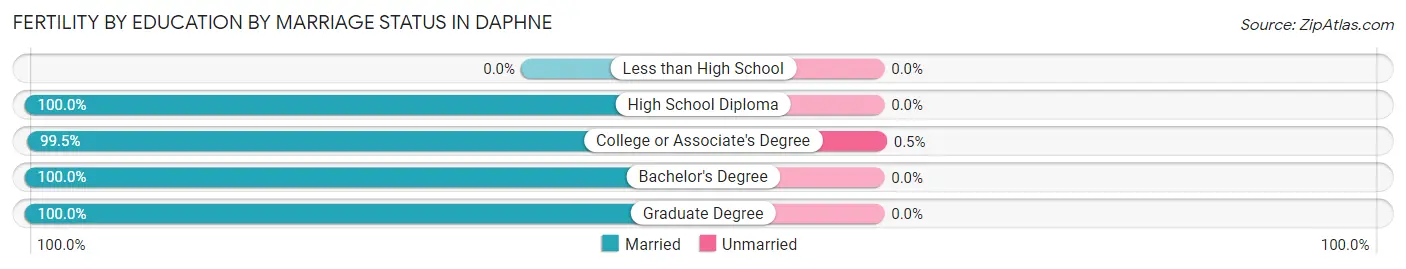
| Educational Attainment | Married | Unmarried |
| Less than High School | 0 (0.0%) | 0 (0.0%) |
| High School Diploma | 23 (100.0%) | 0 (0.0%) |
| College or Associate's Degree | 199 (99.5%) | 1 (0.5%) |
| Bachelor's Degree | 145 (100.0%) | 0 (0.0%) |
| Graduate Degree | 148 (100.0%) | 0 (0.0%) |
| Total | 515 (99.8%) | 1 (0.2%) |
Employment Characteristics in Daphne
Employment by Class of Employer in Daphne
Among the 13,190 employed individuals in Daphne, private company employees (8,559 | 64.9%), local government employees (1,196 | 9.1%), and not-for-profit organizations (1,060 | 8.0%) make up the most common classes of employment.
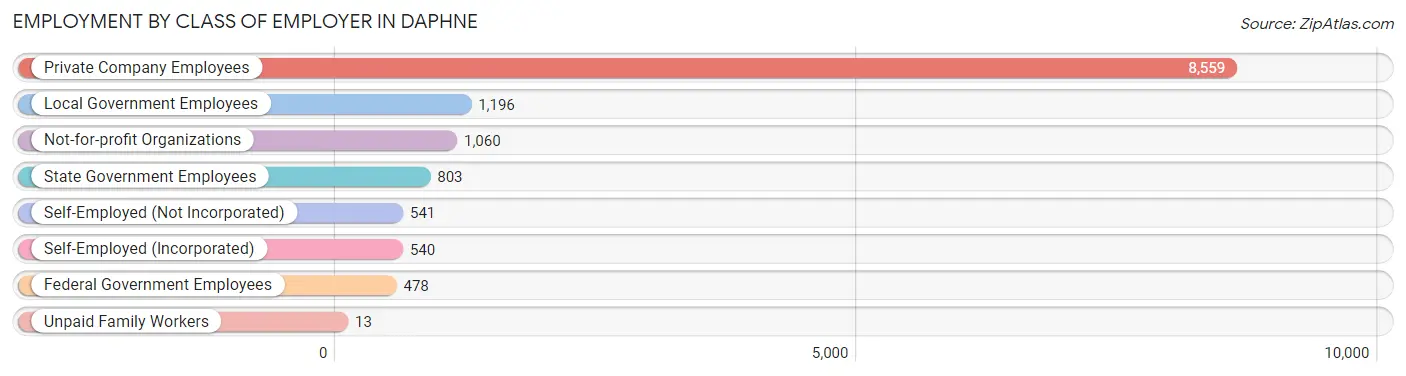
| Employer Class | # Employees | % Employees |
| Private Company Employees | 8,559 | 64.9% |
| Self-Employed (Incorporated) | 540 | 4.1% |
| Self-Employed (Not Incorporated) | 541 | 4.1% |
| Not-for-profit Organizations | 1,060 | 8.0% |
| Local Government Employees | 1,196 | 9.1% |
| State Government Employees | 803 | 6.1% |
| Federal Government Employees | 478 | 3.6% |
| Unpaid Family Workers | 13 | 0.1% |
| Total | 13,190 | 100.0% |
Employment Status by Age in Daphne
According to the labor force statistics for Daphne, out of the total population over 16 years of age (21,358), 64.1% or 13,690 individuals are in the labor force, with 2.8% or 383 of them unemployed. The age group with the highest labor force participation rate is 35 to 44 years, with 85.2% or 3,144 individuals in the labor force. Within the labor force, the 20 to 24 years age range has the highest percentage of unemployed individuals, with 19.5% or 243 of them being unemployed.
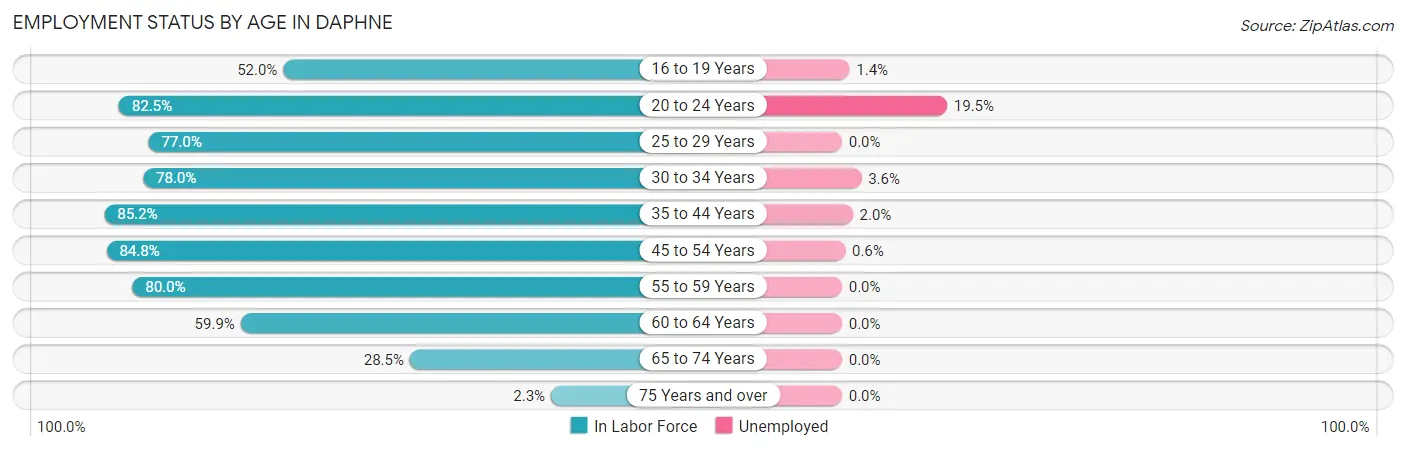
| Age Bracket | In Labor Force | Unemployed |
| 16 to 19 Years | 569 (52.0%) | 8 (1.4%) |
| 20 to 24 Years | 1,246 (82.5%) | 243 (19.5%) |
| 25 to 29 Years | 1,475 (77.0%) | 0 (0.0%) |
| 30 to 34 Years | 1,452 (78.0%) | 52 (3.6%) |
| 35 to 44 Years | 3,144 (85.2%) | 63 (2.0%) |
| 45 to 54 Years | 2,701 (84.8%) | 16 (0.6%) |
| 55 to 59 Years | 1,237 (80.0%) | 0 (0.0%) |
| 60 to 64 Years | 1,003 (59.9%) | 0 (0.0%) |
| 65 to 74 Years | 817 (28.5%) | 0 (0.0%) |
| 75 Years and over | 46 (2.3%) | 0 (0.0%) |
| Total | 13,690 (64.1%) | 383 (2.8%) |
Employment Status by Educational Attainment in Daphne
According to labor force statistics for Daphne, 79.4% of individuals (11,014) out of the total population between 25 and 64 years of age (13,872) are in the labor force, with 1.2% or 132 of them being unemployed. The group with the highest labor force participation rate are those with the educational attainment of less than high school, with 87.6% or 445 individuals in the labor force. Within the labor force, individuals with less than high school education have the highest percentage of unemployment, with 7.2% or 32 of them being unemployed.
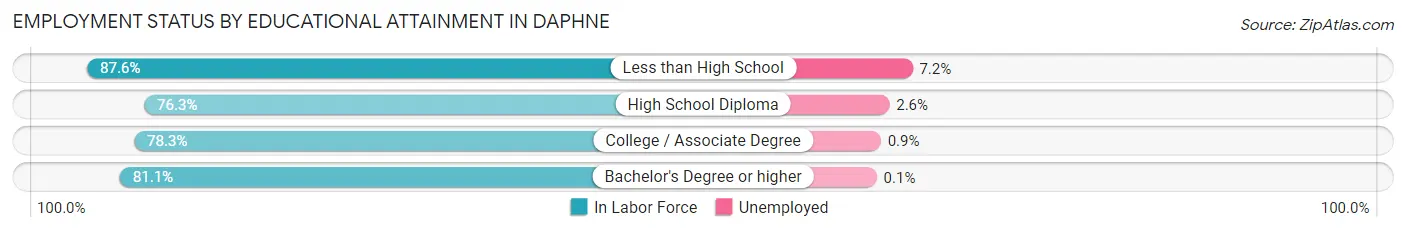
| Educational Attainment | In Labor Force | Unemployed |
| Less than High School | 445 (87.6%) | 37 (7.2%) |
| High School Diploma | 2,342 (76.3%) | 80 (2.6%) |
| College / Associate Degree | 3,467 (78.3%) | 40 (0.9%) |
| Bachelor's Degree or higher | 4,757 (81.1%) | 6 (0.1%) |
| Total | 11,014 (79.4%) | 166 (1.2%) |
Employment Occupations by Sex in Daphne
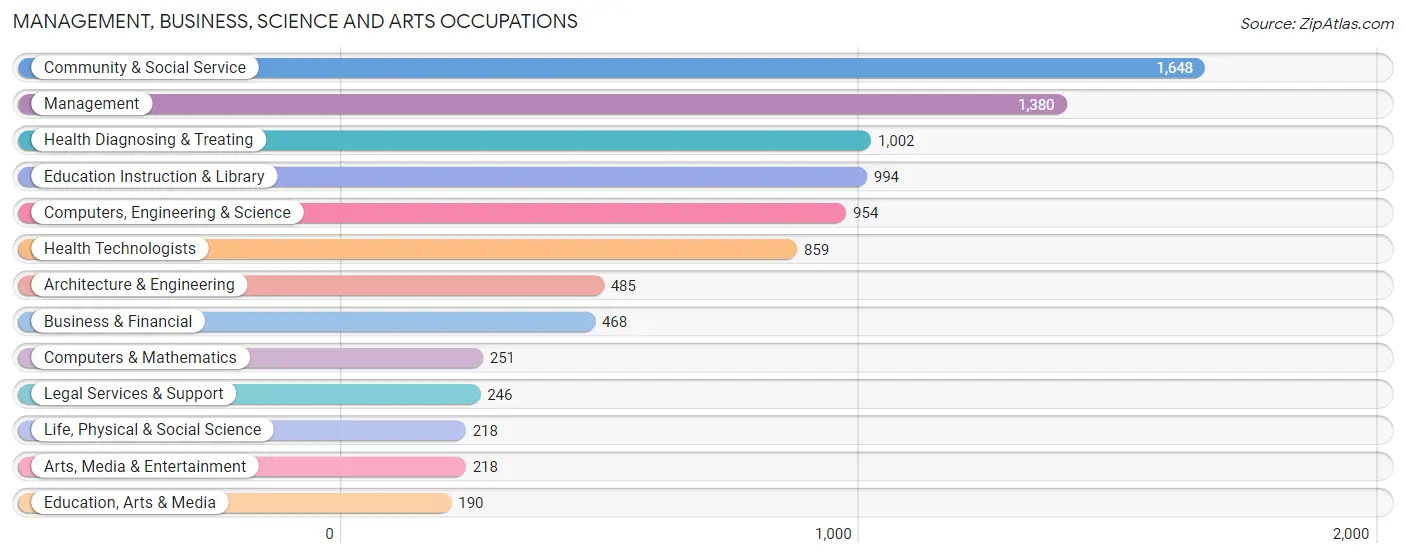
Management, Business, Science and Arts Occupations
The most common Management, Business, Science and Arts occupations in Daphne are Community & Social Service (1,648 | 12.6%), Management (1,380 | 10.5%), Health Diagnosing & Treating (1,002 | 7.6%), Education Instruction & Library (994 | 7.6%), and Computers, Engineering & Science (954 | 7.3%).
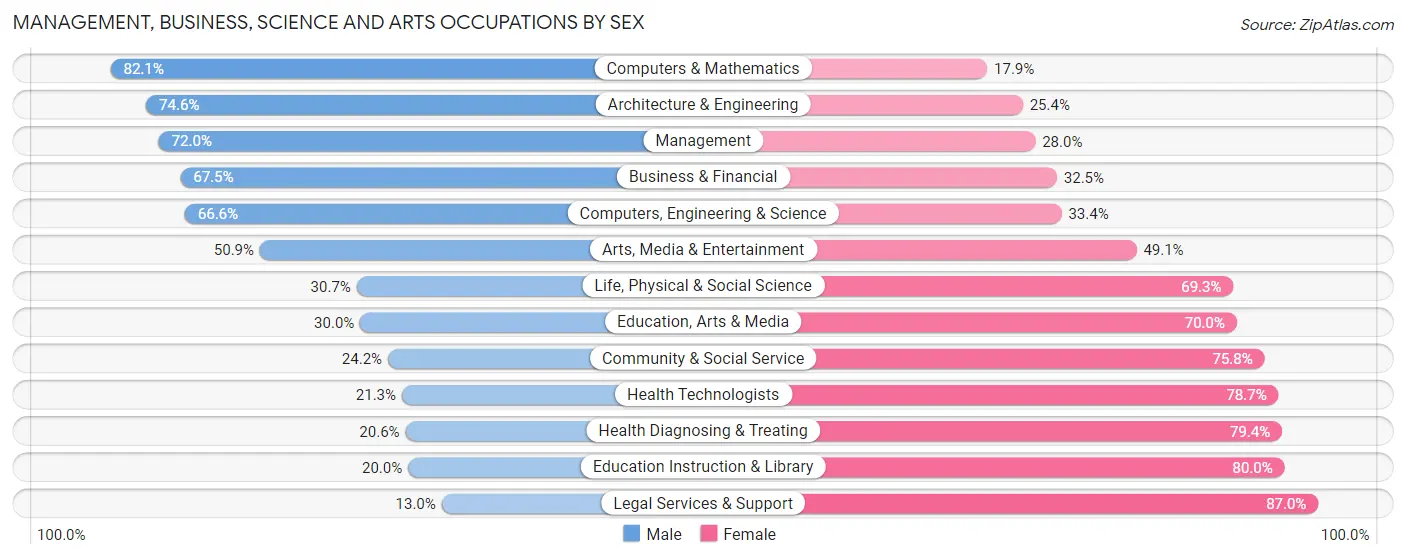
Management, Business, Science and Arts Occupations by Sex
Within the Management, Business, Science and Arts occupations in Daphne, the most male-oriented occupations are Computers & Mathematics (82.1%), Architecture & Engineering (74.6%), and Management (72.0%), while the most female-oriented occupations are Legal Services & Support (87.0%), Education Instruction & Library (80.0%), and Health Diagnosing & Treating (79.4%).
| Occupation | Male | Female |
| Management | 994 (72.0%) | 386 (28.0%) |
| Business & Financial | 316 (67.5%) | 152 (32.5%) |
| Computers, Engineering & Science | 635 (66.6%) | 319 (33.4%) |
| Computers & Mathematics | 206 (82.1%) | 45 (17.9%) |
| Architecture & Engineering | 362 (74.6%) | 123 (25.4%) |
| Life, Physical & Social Science | 67 (30.7%) | 151 (69.3%) |
| Community & Social Service | 399 (24.2%) | 1,249 (75.8%) |
| Education, Arts & Media | 57 (30.0%) | 133 (70.0%) |
| Legal Services & Support | 32 (13.0%) | 214 (87.0%) |
| Education Instruction & Library | 199 (20.0%) | 795 (80.0%) |
| Arts, Media & Entertainment | 111 (50.9%) | 107 (49.1%) |
| Health Diagnosing & Treating | 206 (20.6%) | 796 (79.4%) |
| Health Technologists | 183 (21.3%) | 676 (78.7%) |
| Total (Category) | 2,550 (46.8%) | 2,902 (53.2%) |
| Total (Overall) | 6,821 (52.0%) | 6,293 (48.0%) |
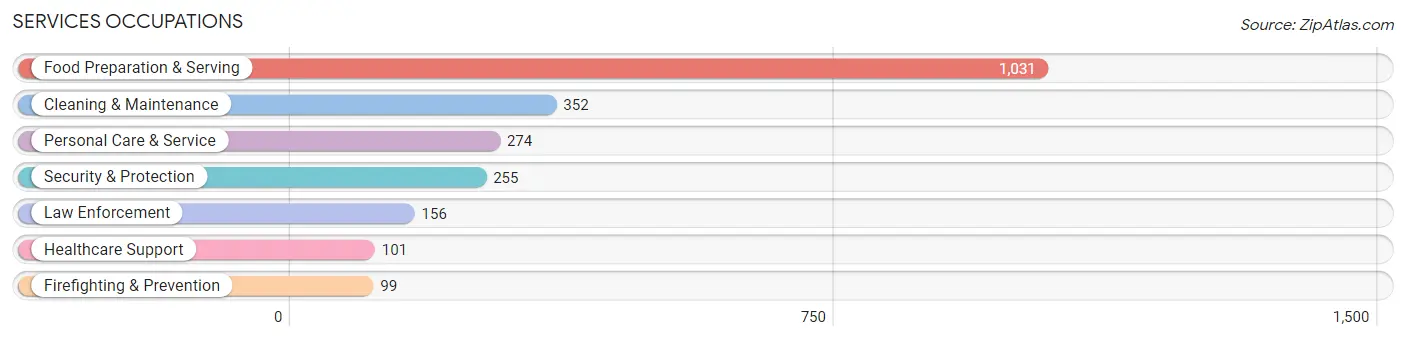
Services Occupations
The most common Services occupations in Daphne are Food Preparation & Serving (1,031 | 7.9%), Cleaning & Maintenance (352 | 2.7%), Personal Care & Service (274 | 2.1%), Security & Protection (255 | 1.9%), and Law Enforcement (156 | 1.2%).
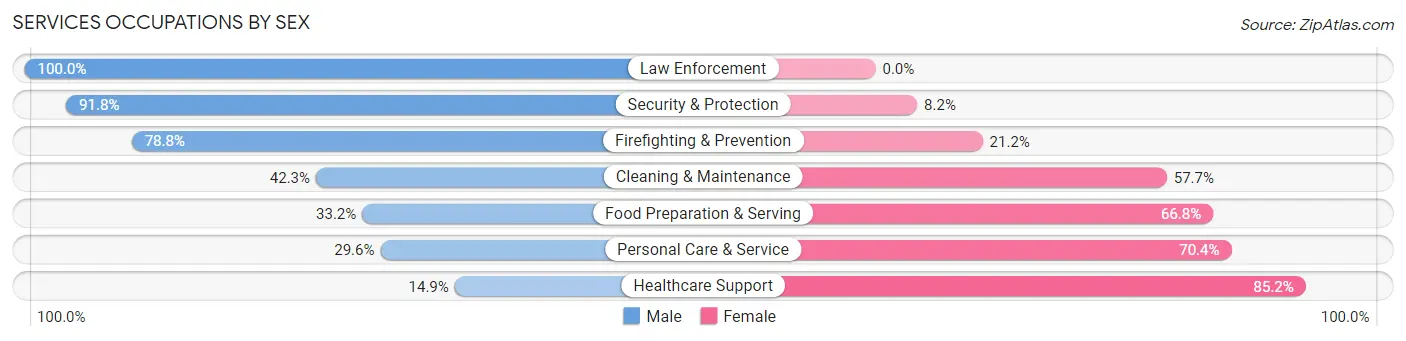
Services Occupations by Sex
Within the Services occupations in Daphne, the most male-oriented occupations are Law Enforcement (100.0%), Security & Protection (91.8%), and Firefighting & Prevention (78.8%), while the most female-oriented occupations are Healthcare Support (85.2%), Personal Care & Service (70.4%), and Food Preparation & Serving (66.8%).
| Occupation | Male | Female |
| Healthcare Support | 15 (14.8%) | 86 (85.2%) |
| Security & Protection | 234 (91.8%) | 21 (8.2%) |
| Firefighting & Prevention | 78 (78.8%) | 21 (21.2%) |
| Law Enforcement | 156 (100.0%) | 0 (0.0%) |
| Food Preparation & Serving | 342 (33.2%) | 689 (66.8%) |
| Cleaning & Maintenance | 149 (42.3%) | 203 (57.7%) |
| Personal Care & Service | 81 (29.6%) | 193 (70.4%) |
| Total (Category) | 821 (40.8%) | 1,192 (59.2%) |
| Total (Overall) | 6,821 (52.0%) | 6,293 (48.0%) |
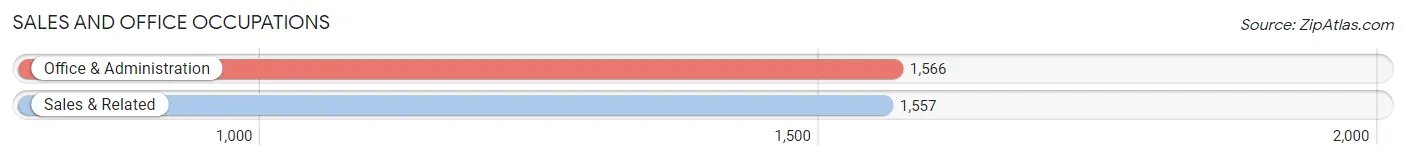
Sales and Office Occupations
The most common Sales and Office occupations in Daphne are Office & Administration (1,566 | 11.9%), and Sales & Related (1,557 | 11.9%).
Sales and Office Occupations by Sex
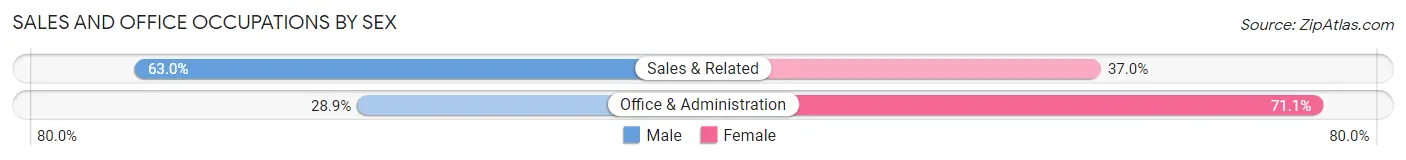
| Occupation | Male | Female |
| Sales & Related | 981 (63.0%) | 576 (37.0%) |
| Office & Administration | 452 (28.9%) | 1,114 (71.1%) |
| Total (Category) | 1,433 (45.9%) | 1,690 (54.1%) |
| Total (Overall) | 6,821 (52.0%) | 6,293 (48.0%) |
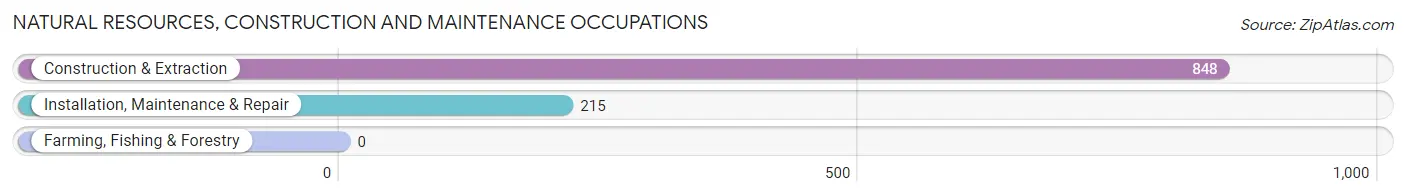
Natural Resources, Construction and Maintenance Occupations
The most common Natural Resources, Construction and Maintenance occupations in Daphne are Construction & Extraction (848 | 6.5%), and Installation, Maintenance & Repair (215 | 1.6%).
Natural Resources, Construction and Maintenance Occupations by Sex
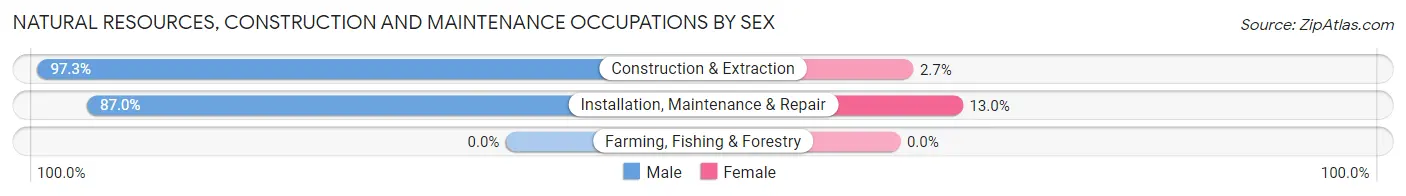
| Occupation | Male | Female |
| Farming, Fishing & Forestry | 0 (0.0%) | 0 (0.0%) |
| Construction & Extraction | 825 (97.3%) | 23 (2.7%) |
| Installation, Maintenance & Repair | 187 (87.0%) | 28 (13.0%) |
| Total (Category) | 1,012 (95.2%) | 51 (4.8%) |
| Total (Overall) | 6,821 (52.0%) | 6,293 (48.0%) |
Production, Transportation and Moving Occupations
The most common Production, Transportation and Moving occupations in Daphne are Production (656 | 5.0%), Transportation (476 | 3.6%), and Material Moving (331 | 2.5%).
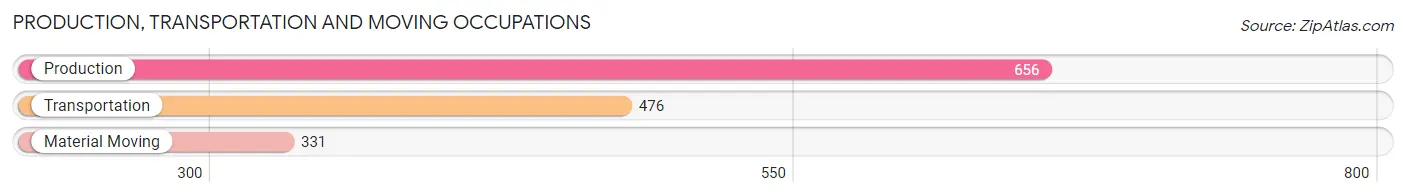
Production, Transportation and Moving Occupations by Sex
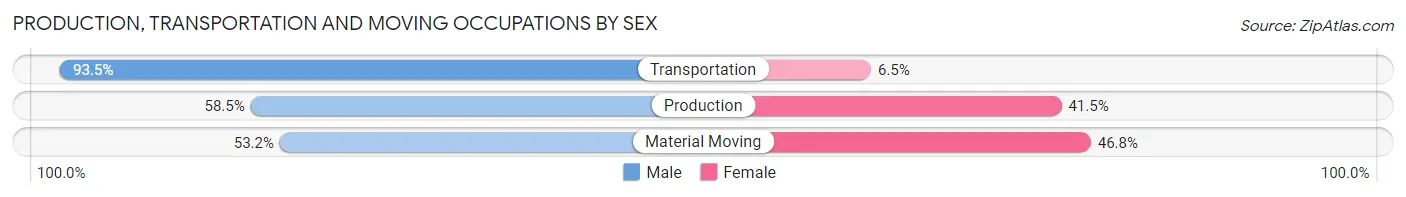
| Occupation | Male | Female |
| Production | 384 (58.5%) | 272 (41.5%) |
| Transportation | 445 (93.5%) | 31 (6.5%) |
| Material Moving | 176 (53.2%) | 155 (46.8%) |
| Total (Category) | 1,005 (68.7%) | 458 (31.3%) |
| Total (Overall) | 6,821 (52.0%) | 6,293 (48.0%) |
Employment Industries by Sex in Daphne
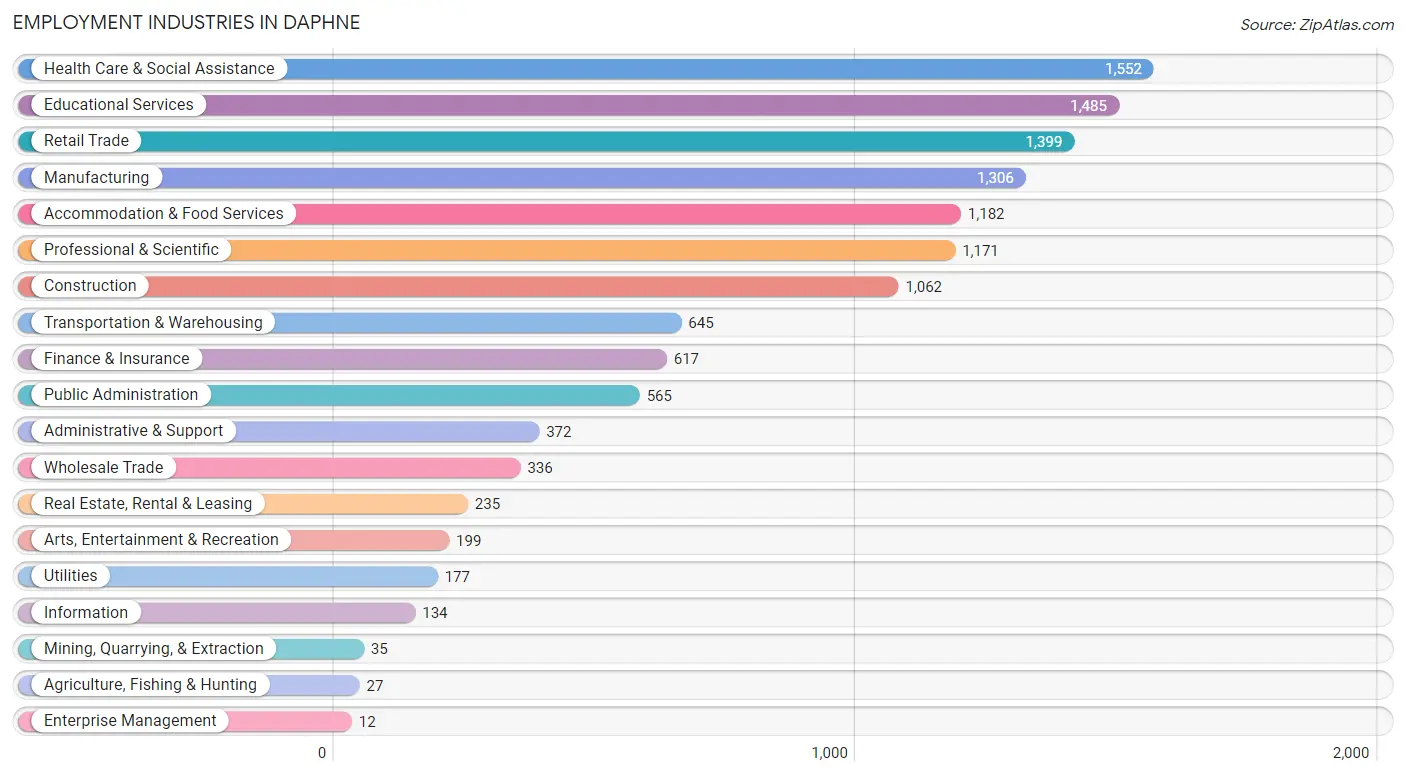
Employment Industries in Daphne
The major employment industries in Daphne include Health Care & Social Assistance (1,552 | 11.8%), Educational Services (1,485 | 11.3%), Retail Trade (1,399 | 10.7%), Manufacturing (1,306 | 10.0%), and Accommodation & Food Services (1,182 | 9.0%).
Employment Industries by Sex in Daphne
The Daphne industries that see more men than women are Agriculture, Fishing & Hunting (100.0%), Mining, Quarrying, & Extraction (100.0%), and Transportation & Warehousing (96.4%), whereas the industries that tend to have a higher number of women are Enterprise Management (100.0%), Educational Services (83.2%), and Real Estate, Rental & Leasing (82.1%).
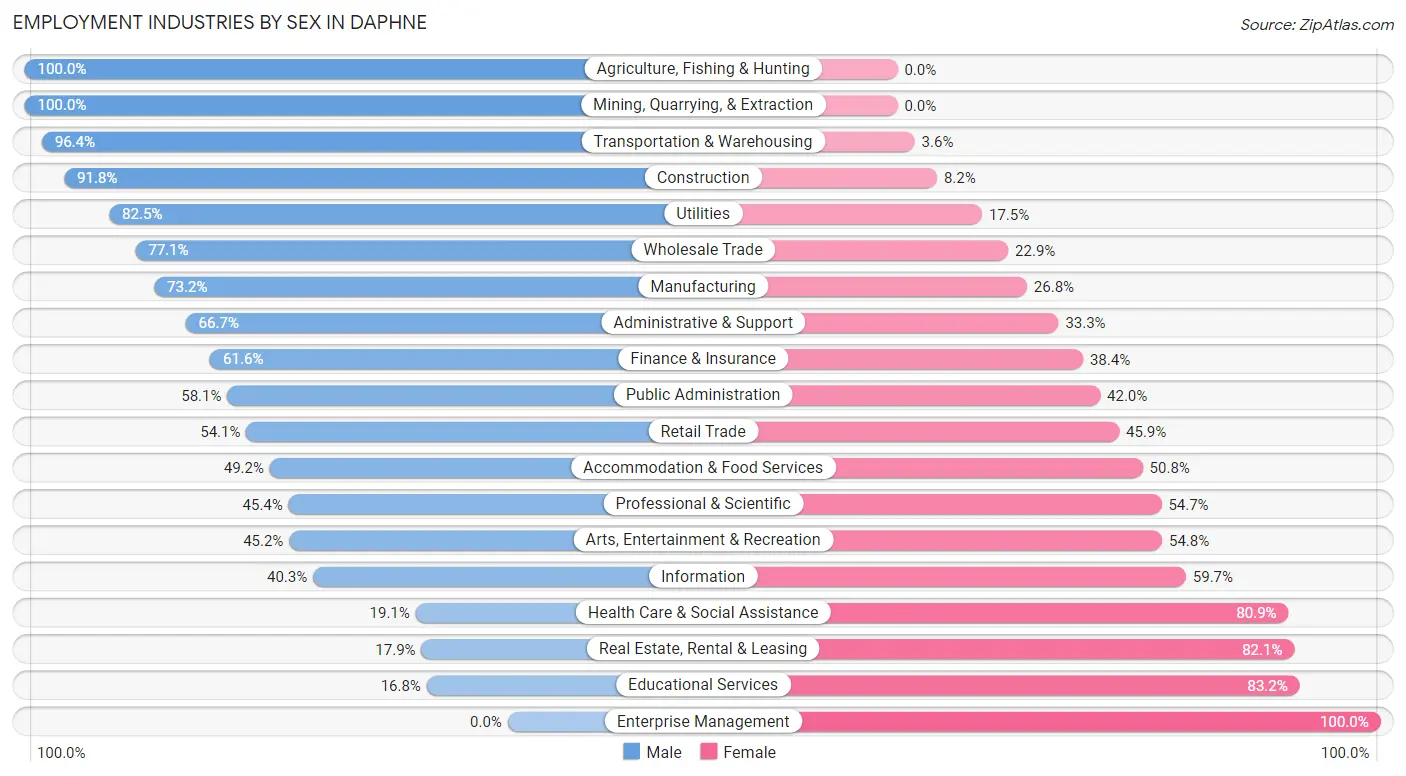
| Industry | Male | Female |
| Agriculture, Fishing & Hunting | 27 (100.0%) | 0 (0.0%) |
| Mining, Quarrying, & Extraction | 35 (100.0%) | 0 (0.0%) |
| Construction | 975 (91.8%) | 87 (8.2%) |
| Manufacturing | 956 (73.2%) | 350 (26.8%) |
| Wholesale Trade | 259 (77.1%) | 77 (22.9%) |
| Retail Trade | 757 (54.1%) | 642 (45.9%) |
| Transportation & Warehousing | 622 (96.4%) | 23 (3.6%) |
| Utilities | 146 (82.5%) | 31 (17.5%) |
| Information | 54 (40.3%) | 80 (59.7%) |
| Finance & Insurance | 380 (61.6%) | 237 (38.4%) |
| Real Estate, Rental & Leasing | 42 (17.9%) | 193 (82.1%) |
| Professional & Scientific | 531 (45.4%) | 640 (54.6%) |
| Enterprise Management | 0 (0.0%) | 12 (100.0%) |
| Administrative & Support | 248 (66.7%) | 124 (33.3%) |
| Educational Services | 249 (16.8%) | 1,236 (83.2%) |
| Health Care & Social Assistance | 296 (19.1%) | 1,256 (80.9%) |
| Arts, Entertainment & Recreation | 90 (45.2%) | 109 (54.8%) |
| Accommodation & Food Services | 582 (49.2%) | 600 (50.8%) |
| Public Administration | 328 (58.1%) | 237 (41.9%) |
| Total | 6,821 (52.0%) | 6,293 (48.0%) |
Education in Daphne
School Enrollment in Daphne
The most common levels of schooling among the 6,302 students in Daphne are middle school (1,483 | 23.5%), high school (1,439 | 22.8%), and elementary school (1,119 | 17.8%).
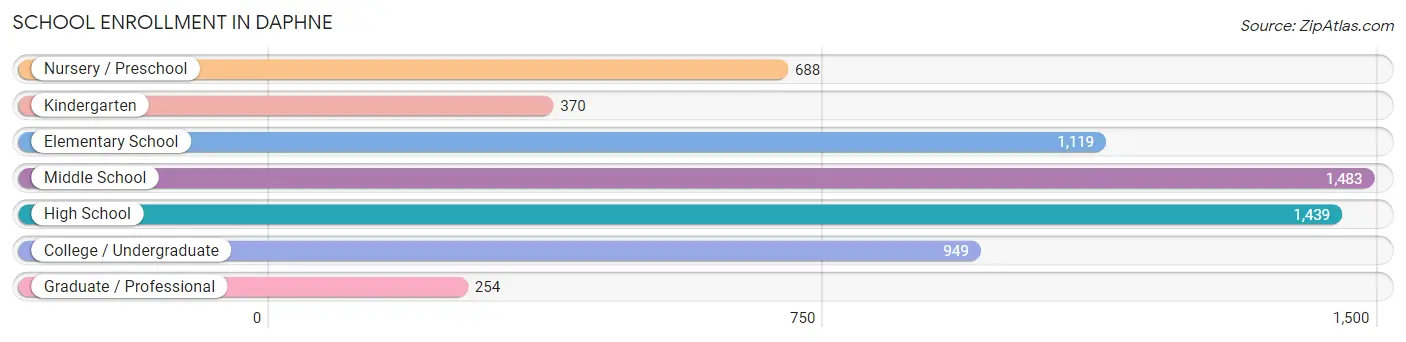
| School Level | # Students | % Students |
| Nursery / Preschool | 688 | 10.9% |
| Kindergarten | 370 | 5.9% |
| Elementary School | 1,119 | 17.8% |
| Middle School | 1,483 | 23.5% |
| High School | 1,439 | 22.8% |
| College / Undergraduate | 949 | 15.1% |
| Graduate / Professional | 254 | 4.0% |
| Total | 6,302 | 100.0% |
School Enrollment by Age by Funding Source in Daphne
Out of a total of 6,302 students who are enrolled in schools in Daphne, 1,525 (24.2%) attend a private institution, while the remaining 4,777 (75.8%) are enrolled in public schools. The age group of 3 to 4 year olds has the highest likelihood of being enrolled in private schools, with 277 (54.0% in the age bracket) enrolled. Conversely, the age group of 35 years and over has the lowest likelihood of being enrolled in a private school, with 253 (100.0% in the age bracket) attending a public institution.
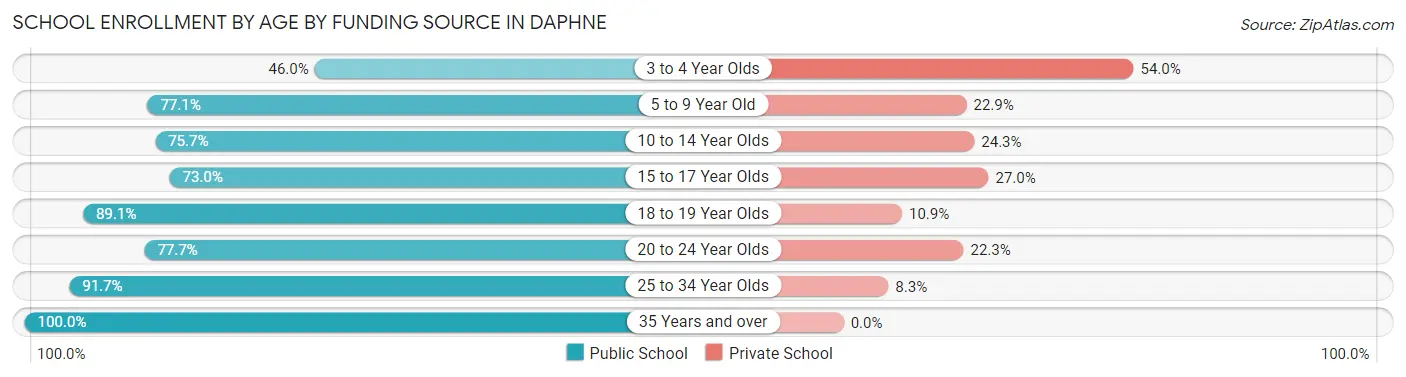
| Age Bracket | Public School | Private School |
| 3 to 4 Year Olds | 236 (46.0%) | 277 (54.0%) |
| 5 to 9 Year Old | 1,226 (77.1%) | 364 (22.9%) |
| 10 to 14 Year Olds | 1,337 (75.7%) | 430 (24.3%) |
| 15 to 17 Year Olds | 752 (73.0%) | 278 (27.0%) |
| 18 to 19 Year Olds | 303 (89.1%) | 37 (10.9%) |
| 20 to 24 Year Olds | 414 (77.7%) | 119 (22.3%) |
| 25 to 34 Year Olds | 253 (91.7%) | 23 (8.3%) |
| 35 Years and over | 253 (100.0%) | 0 (0.0%) |
| Total | 4,777 (75.8%) | 1,525 (24.2%) |
Educational Attainment by Field of Study in Daphne
Business (1,500 | 18.6%), education (1,033 | 12.8%), science & technology (1,026 | 12.7%), liberal arts & history (621 | 7.7%), and bio, nature & agricultural (566 | 7.0%) are the most common fields of study among 8,052 individuals in Daphne who have obtained a bachelor's degree or higher.
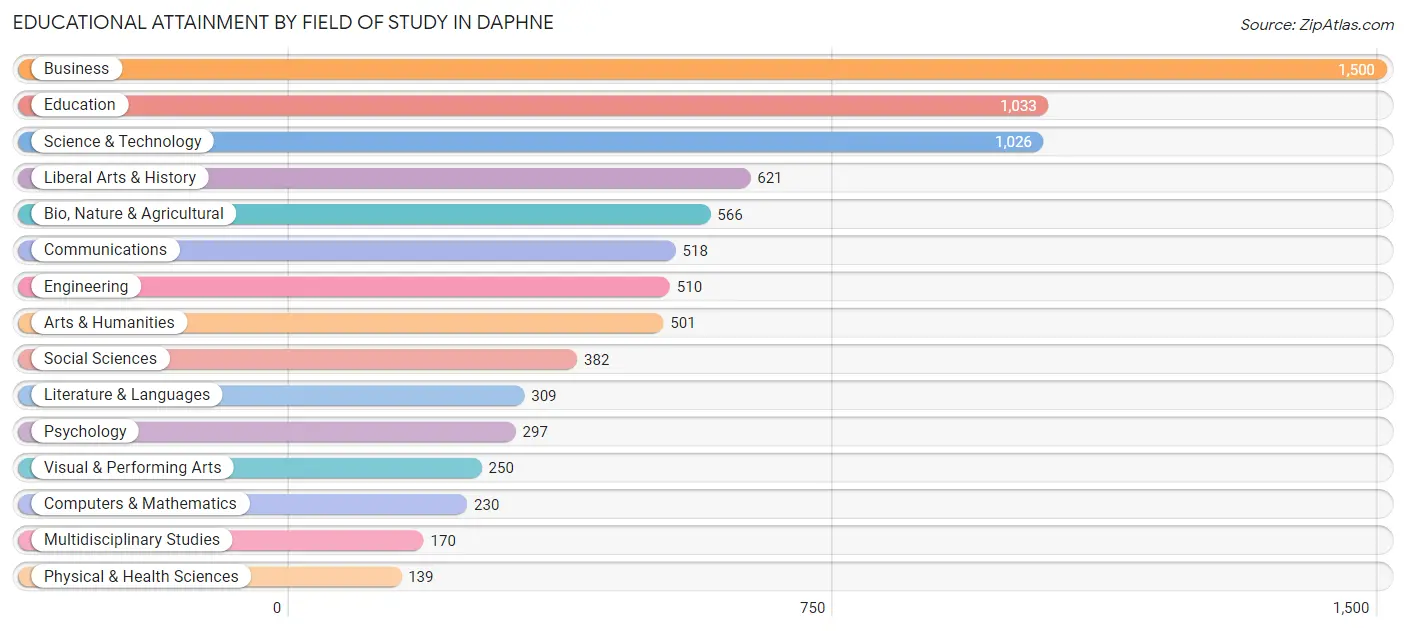
| Field of Study | # Graduates | % Graduates |
| Computers & Mathematics | 230 | 2.9% |
| Bio, Nature & Agricultural | 566 | 7.0% |
| Physical & Health Sciences | 139 | 1.7% |
| Psychology | 297 | 3.7% |
| Social Sciences | 382 | 4.7% |
| Engineering | 510 | 6.3% |
| Multidisciplinary Studies | 170 | 2.1% |
| Science & Technology | 1,026 | 12.7% |
| Business | 1,500 | 18.6% |
| Education | 1,033 | 12.8% |
| Literature & Languages | 309 | 3.8% |
| Liberal Arts & History | 621 | 7.7% |
| Visual & Performing Arts | 250 | 3.1% |
| Communications | 518 | 6.4% |
| Arts & Humanities | 501 | 6.2% |
| Total | 8,052 | 100.0% |
Transportation & Commute in Daphne
Vehicle Availability by Sex in Daphne
The most prevalent vehicle ownership categories in Daphne are males with 2 vehicles (3,195, accounting for 46.5%) and females with 2 vehicles (2,664, making up 50.6%).
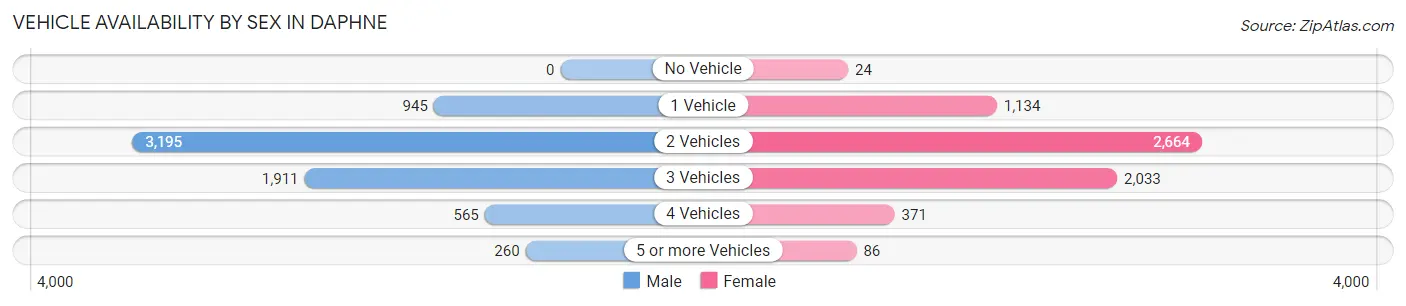
| Vehicles Available | Male | Female |
| No Vehicle | 0 (0.0%) | 24 (0.4%) |
| 1 Vehicle | 945 (13.7%) | 1,134 (18.0%) |
| 2 Vehicles | 3,195 (46.5%) | 2,664 (42.2%) |
| 3 Vehicles | 1,911 (27.8%) | 2,033 (32.2%) |
| 4 Vehicles | 565 (8.2%) | 371 (5.9%) |
| 5 or more Vehicles | 260 (3.8%) | 86 (1.4%) |
| Total | 6,876 (100.0%) | 6,312 (100.0%) |
Commute Time in Daphne
The most frequently occuring commute durations in Daphne are 15 to 19 minutes (1,773 commuters, 14.9%), 20 to 24 minutes (1,769 commuters, 14.9%), and 30 to 34 minutes (1,523 commuters, 12.8%).
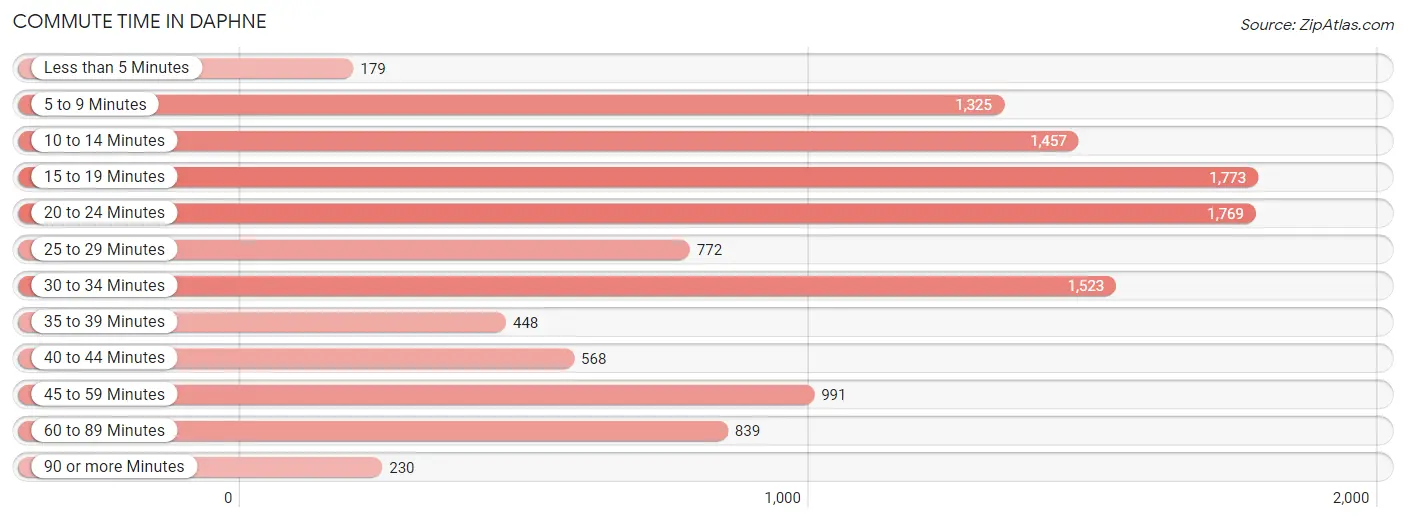
| Commute Time | # Commuters | % Commuters |
| Less than 5 Minutes | 179 | 1.5% |
| 5 to 9 Minutes | 1,325 | 11.2% |
| 10 to 14 Minutes | 1,457 | 12.3% |
| 15 to 19 Minutes | 1,773 | 14.9% |
| 20 to 24 Minutes | 1,769 | 14.9% |
| 25 to 29 Minutes | 772 | 6.5% |
| 30 to 34 Minutes | 1,523 | 12.8% |
| 35 to 39 Minutes | 448 | 3.8% |
| 40 to 44 Minutes | 568 | 4.8% |
| 45 to 59 Minutes | 991 | 8.4% |
| 60 to 89 Minutes | 839 | 7.1% |
| 90 or more Minutes | 230 | 1.9% |
Commute Time by Sex in Daphne
The most common commute times in Daphne are 15 to 19 minutes (945 commuters, 14.9%) for males and 10 to 14 minutes (1,006 commuters, 18.2%) for females.
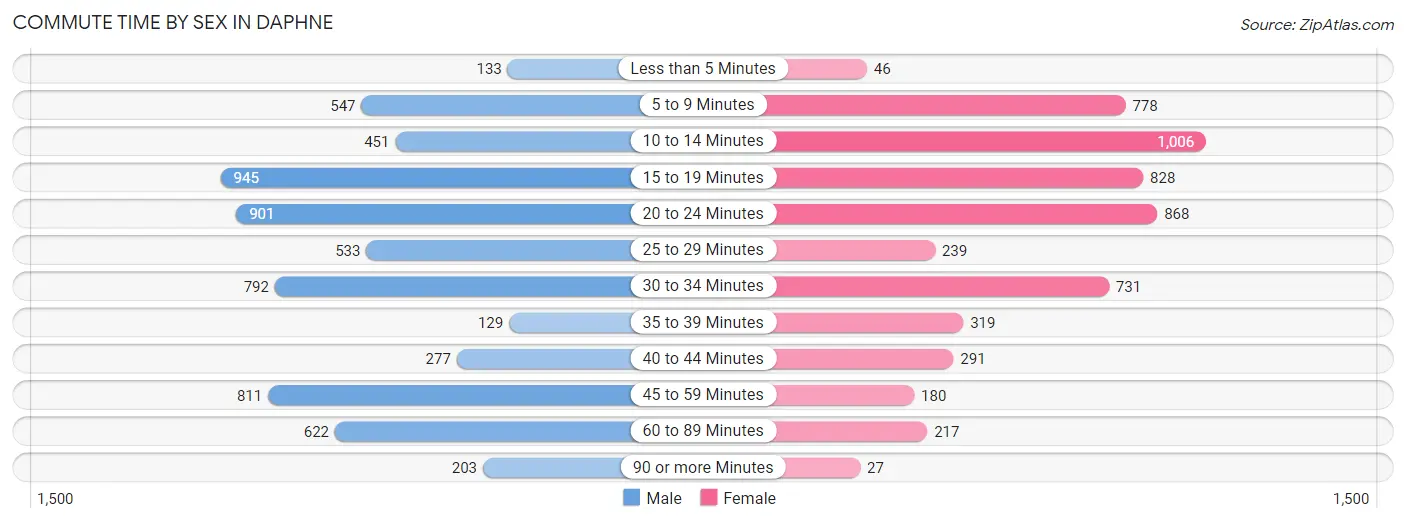
| Commute Time | Male | Female |
| Less than 5 Minutes | 133 (2.1%) | 46 (0.8%) |
| 5 to 9 Minutes | 547 (8.6%) | 778 (14.1%) |
| 10 to 14 Minutes | 451 (7.1%) | 1,006 (18.2%) |
| 15 to 19 Minutes | 945 (14.9%) | 828 (15.0%) |
| 20 to 24 Minutes | 901 (14.2%) | 868 (15.7%) |
| 25 to 29 Minutes | 533 (8.4%) | 239 (4.3%) |
| 30 to 34 Minutes | 792 (12.5%) | 731 (13.2%) |
| 35 to 39 Minutes | 129 (2.0%) | 319 (5.8%) |
| 40 to 44 Minutes | 277 (4.4%) | 291 (5.3%) |
| 45 to 59 Minutes | 811 (12.8%) | 180 (3.3%) |
| 60 to 89 Minutes | 622 (9.8%) | 217 (3.9%) |
| 90 or more Minutes | 203 (3.2%) | 27 (0.5%) |
Time of Departure to Work by Sex in Daphne
The most frequent times of departure to work in Daphne are 7:30 AM to 7:59 AM (1,172, 18.5%) for males and 7:00 AM to 7:29 AM (1,182, 21.4%) for females.
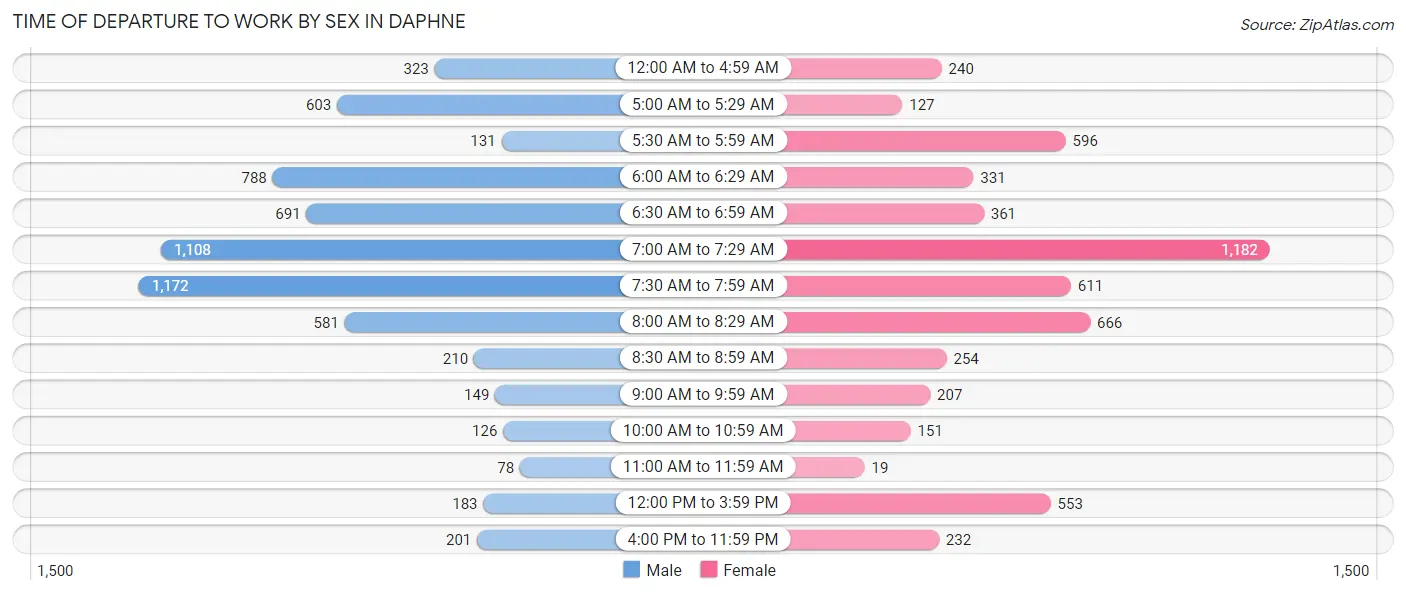
| Time of Departure | Male | Female |
| 12:00 AM to 4:59 AM | 323 (5.1%) | 240 (4.3%) |
| 5:00 AM to 5:29 AM | 603 (9.5%) | 127 (2.3%) |
| 5:30 AM to 5:59 AM | 131 (2.1%) | 596 (10.8%) |
| 6:00 AM to 6:29 AM | 788 (12.4%) | 331 (6.0%) |
| 6:30 AM to 6:59 AM | 691 (10.9%) | 361 (6.5%) |
| 7:00 AM to 7:29 AM | 1,108 (17.5%) | 1,182 (21.4%) |
| 7:30 AM to 7:59 AM | 1,172 (18.5%) | 611 (11.1%) |
| 8:00 AM to 8:29 AM | 581 (9.2%) | 666 (12.0%) |
| 8:30 AM to 8:59 AM | 210 (3.3%) | 254 (4.6%) |
| 9:00 AM to 9:59 AM | 149 (2.4%) | 207 (3.7%) |
| 10:00 AM to 10:59 AM | 126 (2.0%) | 151 (2.7%) |
| 11:00 AM to 11:59 AM | 78 (1.2%) | 19 (0.3%) |
| 12:00 PM to 3:59 PM | 183 (2.9%) | 553 (10.0%) |
| 4:00 PM to 11:59 PM | 201 (3.2%) | 232 (4.2%) |
| Total | 6,344 (100.0%) | 5,530 (100.0%) |
Housing Occupancy in Daphne
Occupancy by Ownership in Daphne
Of the total 10,469 dwellings in Daphne, owner-occupied units account for 7,485 (71.5%), while renter-occupied units make up 2,984 (28.5%).
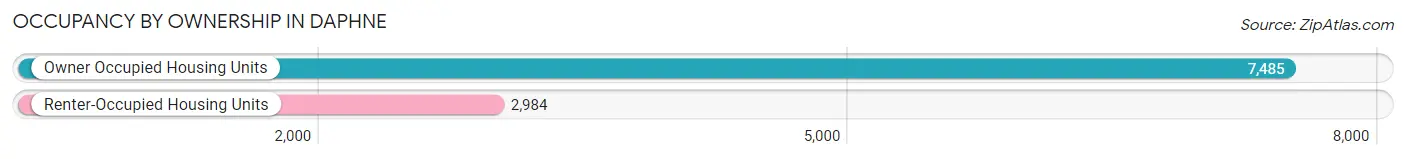
| Occupancy | # Housing Units | % Housing Units |
| Owner Occupied Housing Units | 7,485 | 71.5% |
| Renter-Occupied Housing Units | 2,984 | 28.5% |
| Total Occupied Housing Units | 10,469 | 100.0% |
Occupancy by Household Size in Daphne
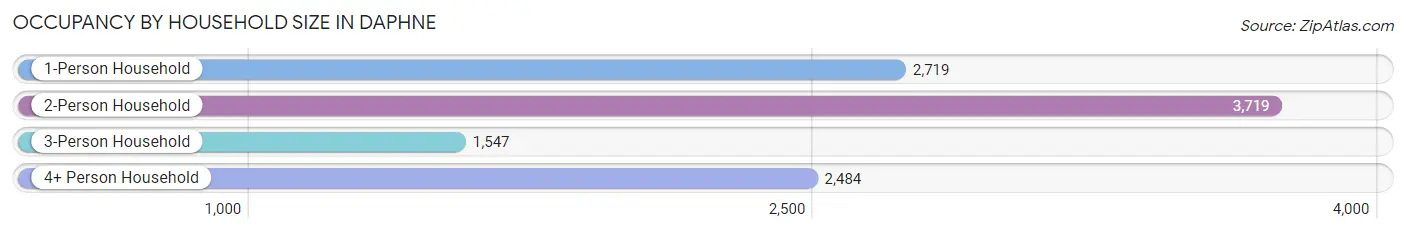
| Household Size | # Housing Units | % Housing Units |
| 1-Person Household | 2,719 | 26.0% |
| 2-Person Household | 3,719 | 35.5% |
| 3-Person Household | 1,547 | 14.8% |
| 4+ Person Household | 2,484 | 23.7% |
| Total Housing Units | 10,469 | 100.0% |
Occupancy by Ownership by Household Size in Daphne
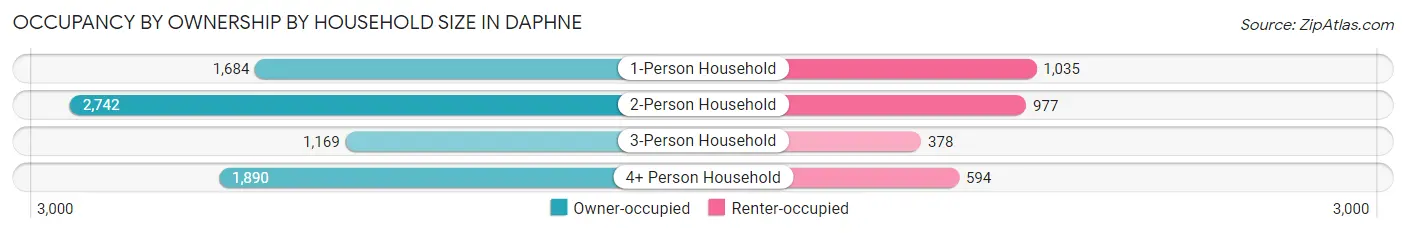
| Household Size | Owner-occupied | Renter-occupied |
| 1-Person Household | 1,684 (61.9%) | 1,035 (38.1%) |
| 2-Person Household | 2,742 (73.7%) | 977 (26.3%) |
| 3-Person Household | 1,169 (75.6%) | 378 (24.4%) |
| 4+ Person Household | 1,890 (76.1%) | 594 (23.9%) |
| Total Housing Units | 7,485 (71.5%) | 2,984 (28.5%) |
Occupancy by Educational Attainment in Daphne
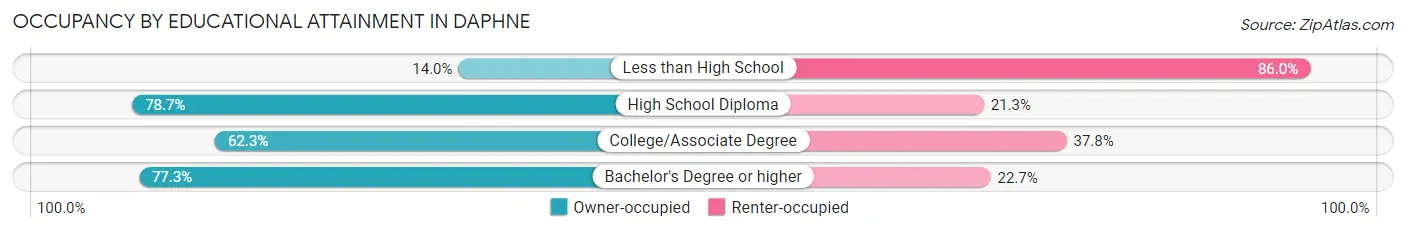
| Household Size | Owner-occupied | Renter-occupied |
| Less than High School | 35 (14.0%) | 215 (86.0%) |
| High School Diploma | 1,898 (78.7%) | 515 (21.3%) |
| College/Associate Degree | 1,999 (62.3%) | 1,212 (37.8%) |
| Bachelor's Degree or higher | 3,553 (77.3%) | 1,042 (22.7%) |
Occupancy by Age of Householder in Daphne
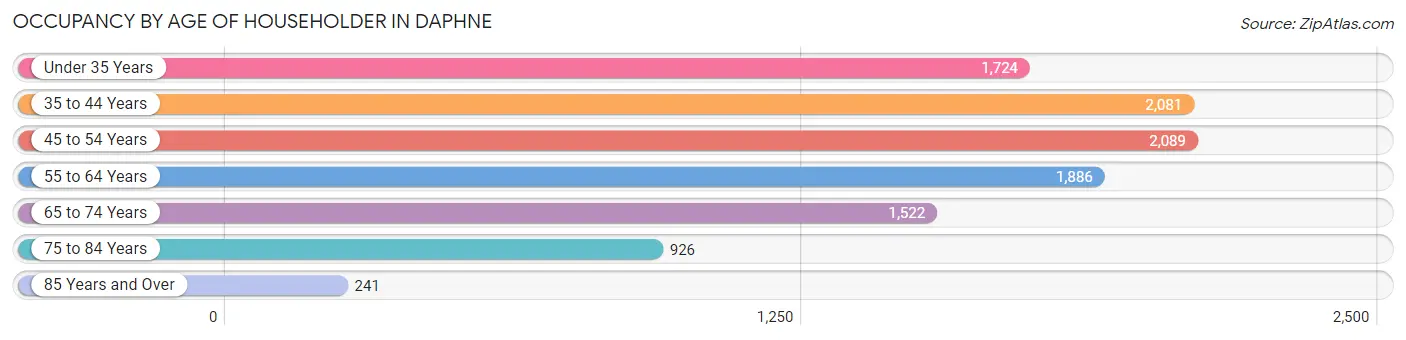
| Age Bracket | # Households | % Households |
| Under 35 Years | 1,724 | 16.5% |
| 35 to 44 Years | 2,081 | 19.9% |
| 45 to 54 Years | 2,089 | 20.0% |
| 55 to 64 Years | 1,886 | 18.0% |
| 65 to 74 Years | 1,522 | 14.5% |
| 75 to 84 Years | 926 | 8.8% |
| 85 Years and Over | 241 | 2.3% |
| Total | 10,469 | 100.0% |
Housing Finances in Daphne
Median Income by Occupancy in Daphne
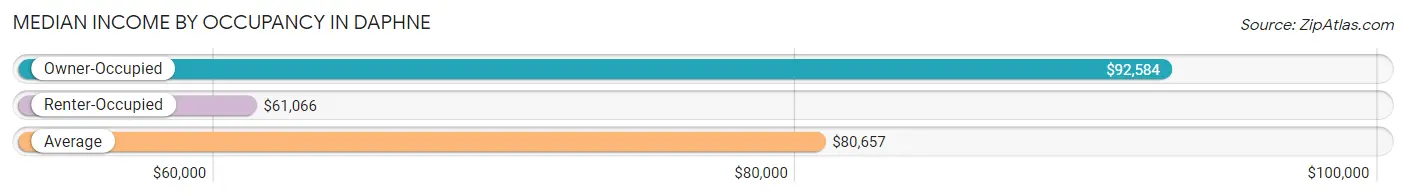
| Occupancy Type | # Households | Median Income |
| Owner-Occupied | 7,485 (71.5%) | $92,584 |
| Renter-Occupied | 2,984 (28.5%) | $61,066 |
| Average | 10,469 (100.0%) | $80,657 |
Occupancy by Householder Income Bracket in Daphne
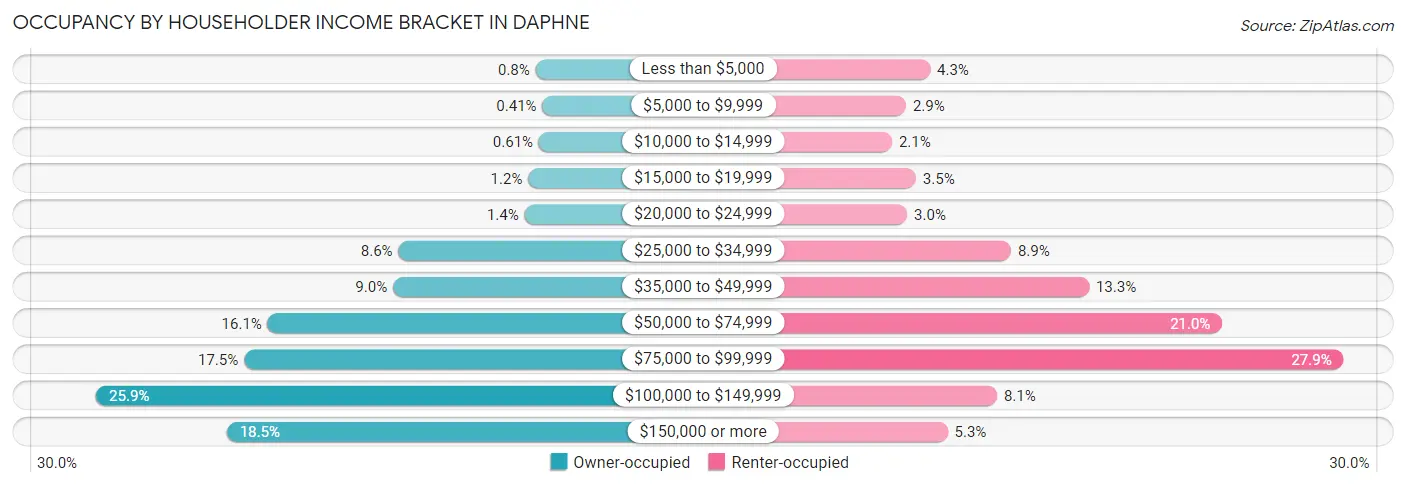
| Income Bracket | Owner-occupied | Renter-occupied |
| Less than $5,000 | 60 (0.8%) | 127 (4.3%) |
| $5,000 to $9,999 | 31 (0.4%) | 86 (2.9%) |
| $10,000 to $14,999 | 46 (0.6%) | 62 (2.1%) |
| $15,000 to $19,999 | 91 (1.2%) | 103 (3.5%) |
| $20,000 to $24,999 | 107 (1.4%) | 88 (2.9%) |
| $25,000 to $34,999 | 647 (8.6%) | 265 (8.9%) |
| $35,000 to $49,999 | 670 (8.9%) | 398 (13.3%) |
| $50,000 to $74,999 | 1,206 (16.1%) | 625 (20.9%) |
| $75,000 to $99,999 | 1,307 (17.5%) | 832 (27.9%) |
| $100,000 to $149,999 | 1,939 (25.9%) | 241 (8.1%) |
| $150,000 or more | 1,381 (18.4%) | 157 (5.3%) |
| Total | 7,485 (100.0%) | 2,984 (100.0%) |
Monthly Housing Cost Tiers in Daphne
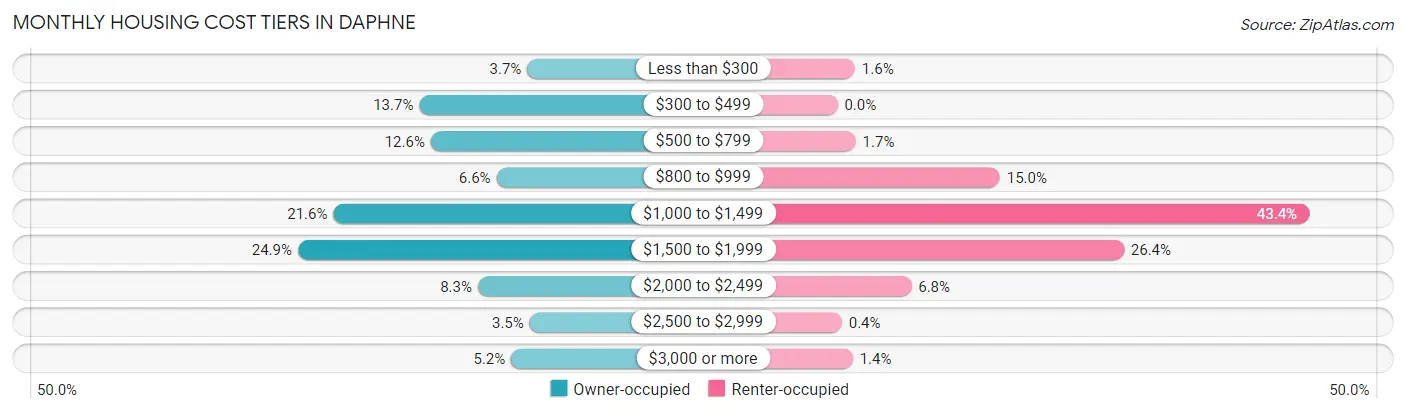
| Monthly Cost | Owner-occupied | Renter-occupied |
| Less than $300 | 279 (3.7%) | 48 (1.6%) |
| $300 to $499 | 1,023 (13.7%) | 0 (0.0%) |
| $500 to $799 | 944 (12.6%) | 50 (1.7%) |
| $800 to $999 | 491 (6.6%) | 446 (14.9%) |
| $1,000 to $1,499 | 1,615 (21.6%) | 1,295 (43.4%) |
| $1,500 to $1,999 | 1,860 (24.8%) | 787 (26.4%) |
| $2,000 to $2,499 | 620 (8.3%) | 203 (6.8%) |
| $2,500 to $2,999 | 263 (3.5%) | 12 (0.4%) |
| $3,000 or more | 390 (5.2%) | 42 (1.4%) |
| Total | 7,485 (100.0%) | 2,984 (100.0%) |
Physical Housing Characteristics in Daphne
Housing Structures in Daphne
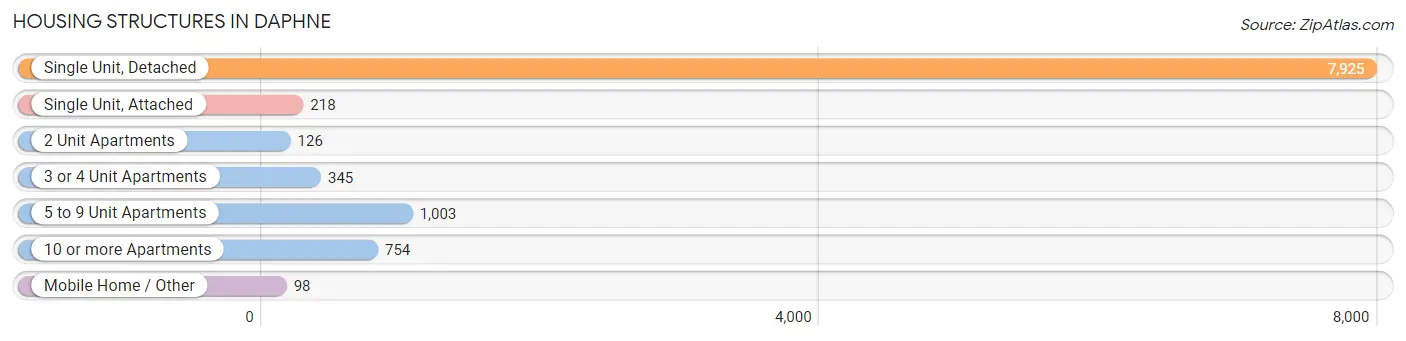
| Structure Type | # Housing Units | % Housing Units |
| Single Unit, Detached | 7,925 | 75.7% |
| Single Unit, Attached | 218 | 2.1% |
| 2 Unit Apartments | 126 | 1.2% |
| 3 or 4 Unit Apartments | 345 | 3.3% |
| 5 to 9 Unit Apartments | 1,003 | 9.6% |
| 10 or more Apartments | 754 | 7.2% |
| Mobile Home / Other | 98 | 0.9% |
| Total | 10,469 | 100.0% |
Housing Structures by Occupancy in Daphne
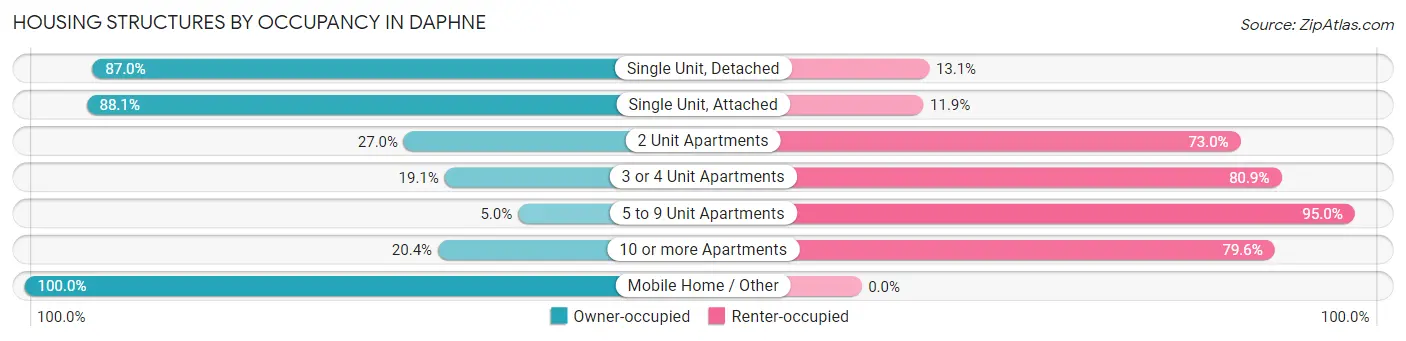
| Structure Type | Owner-occupied | Renter-occupied |
| Single Unit, Detached | 6,891 (87.0%) | 1,034 (13.1%) |
| Single Unit, Attached | 192 (88.1%) | 26 (11.9%) |
| 2 Unit Apartments | 34 (27.0%) | 92 (73.0%) |
| 3 or 4 Unit Apartments | 66 (19.1%) | 279 (80.9%) |
| 5 to 9 Unit Apartments | 50 (5.0%) | 953 (95.0%) |
| 10 or more Apartments | 154 (20.4%) | 600 (79.6%) |
| Mobile Home / Other | 98 (100.0%) | 0 (0.0%) |
| Total | 7,485 (71.5%) | 2,984 (28.5%) |
Housing Structures by Number of Rooms in Daphne
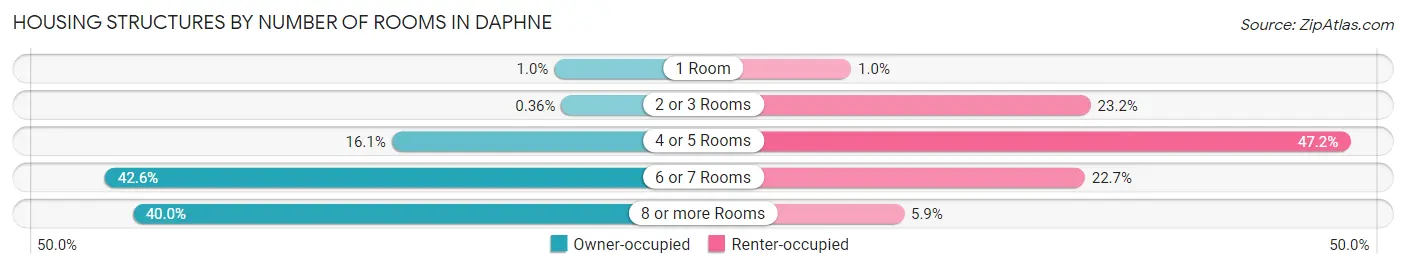
| Number of Rooms | Owner-occupied | Renter-occupied |
| 1 Room | 76 (1.0%) | 31 (1.0%) |
| 2 or 3 Rooms | 27 (0.4%) | 692 (23.2%) |
| 4 or 5 Rooms | 1,202 (16.1%) | 1,408 (47.2%) |
| 6 or 7 Rooms | 3,186 (42.6%) | 676 (22.7%) |
| 8 or more Rooms | 2,994 (40.0%) | 177 (5.9%) |
| Total | 7,485 (100.0%) | 2,984 (100.0%) |
Housing Structure by Heating Type in Daphne
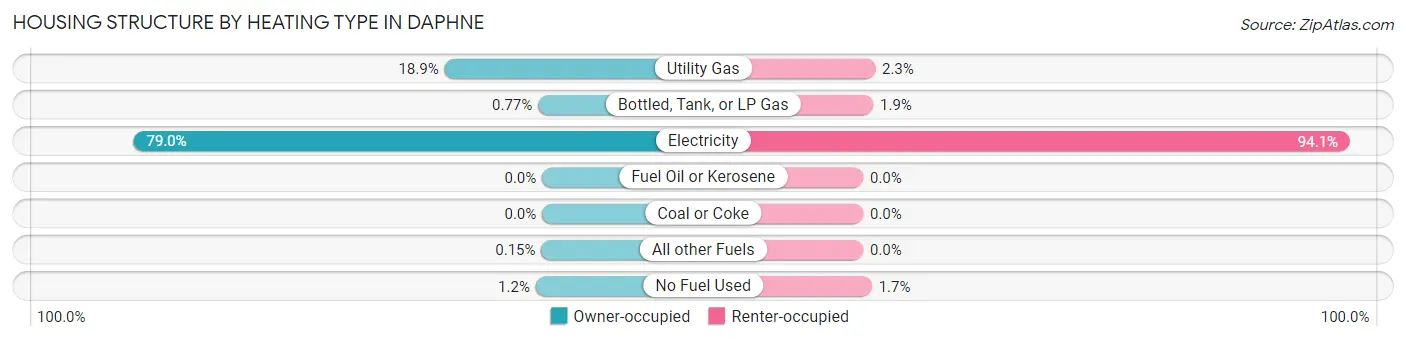
| Heating Type | Owner-occupied | Renter-occupied |
| Utility Gas | 1,412 (18.9%) | 69 (2.3%) |
| Bottled, Tank, or LP Gas | 58 (0.8%) | 58 (1.9%) |
| Electricity | 5,912 (79.0%) | 2,807 (94.1%) |
| Fuel Oil or Kerosene | 0 (0.0%) | 0 (0.0%) |
| Coal or Coke | 0 (0.0%) | 0 (0.0%) |
| All other Fuels | 11 (0.2%) | 0 (0.0%) |
| No Fuel Used | 92 (1.2%) | 50 (1.7%) |
| Total | 7,485 (100.0%) | 2,984 (100.0%) |
Household Vehicle Usage in Daphne
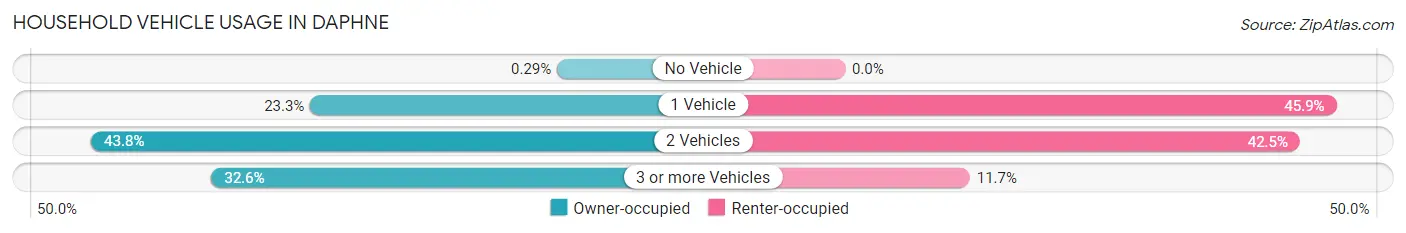
| Vehicles per Household | Owner-occupied | Renter-occupied |
| No Vehicle | 22 (0.3%) | 0 (0.0%) |
| 1 Vehicle | 1,747 (23.3%) | 1,369 (45.9%) |
| 2 Vehicles | 3,278 (43.8%) | 1,267 (42.5%) |
| 3 or more Vehicles | 2,438 (32.6%) | 348 (11.7%) |
| Total | 7,485 (100.0%) | 2,984 (100.0%) |
Real Estate & Mortgages in Daphne
Real Estate and Mortgage Overview in Daphne
| Characteristic | Without Mortgage | With Mortgage |
| Housing Units | 2,545 | 4,940 |
| Median Property Value | $316,500 | $256,900 |
| Median Household Income | $76,705 | $964 |
| Monthly Housing Costs | $504 | $390 |
| Real Estate Taxes | $1,000 | $681 |
Property Value by Mortgage Status in Daphne
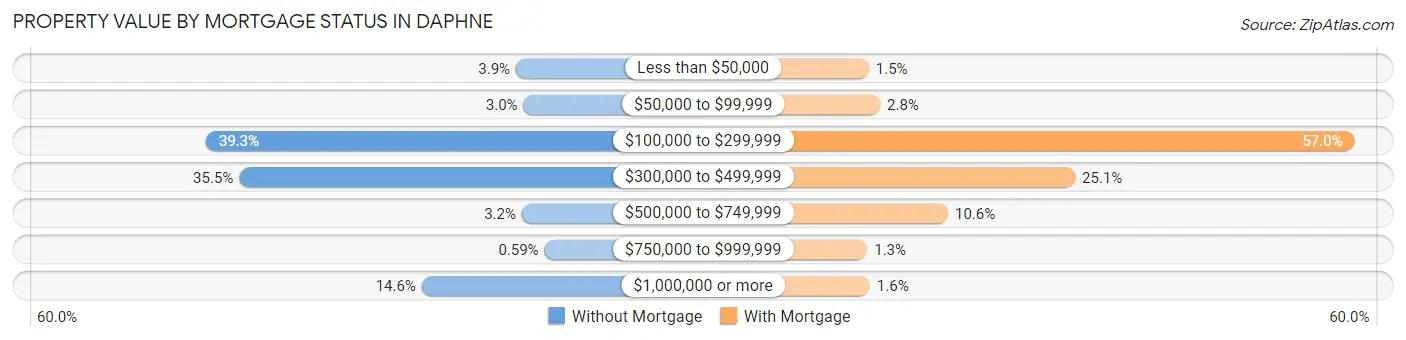
| Property Value | Without Mortgage | With Mortgage |
| Less than $50,000 | 98 (3.8%) | 75 (1.5%) |
| $50,000 to $99,999 | 76 (3.0%) | 139 (2.8%) |
| $100,000 to $299,999 | 1,000 (39.3%) | 2,817 (57.0%) |
| $300,000 to $499,999 | 903 (35.5%) | 1,240 (25.1%) |
| $500,000 to $749,999 | 81 (3.2%) | 522 (10.6%) |
| $750,000 to $999,999 | 15 (0.6%) | 66 (1.3%) |
| $1,000,000 or more | 372 (14.6%) | 81 (1.6%) |
| Total | 2,545 (100.0%) | 4,940 (100.0%) |
Household Income by Mortgage Status in Daphne
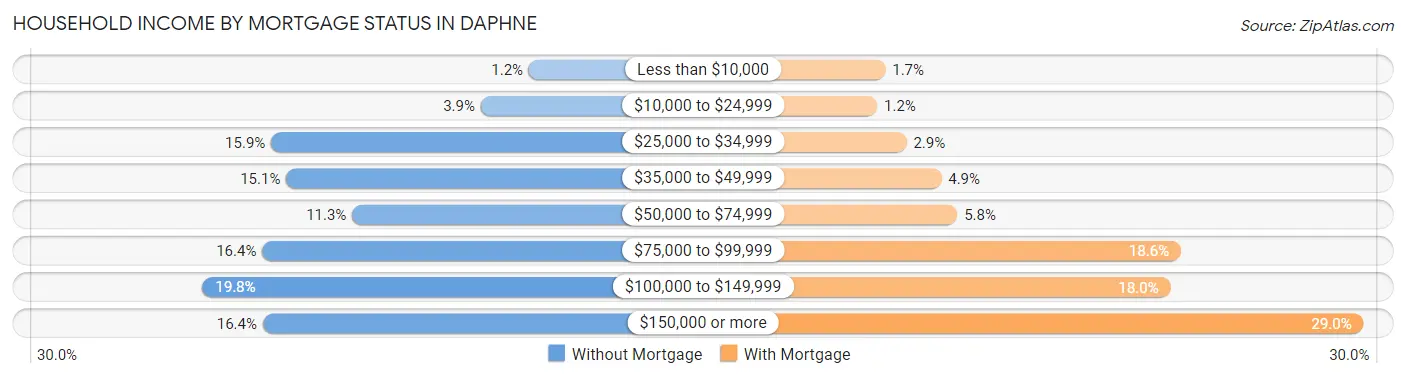
| Household Income | Without Mortgage | With Mortgage |
| Less than $10,000 | 30 (1.2%) | 84 (1.7%) |
| $10,000 to $24,999 | 100 (3.9%) | 61 (1.2%) |
| $25,000 to $34,999 | 405 (15.9%) | 144 (2.9%) |
| $35,000 to $49,999 | 383 (15.0%) | 242 (4.9%) |
| $50,000 to $74,999 | 287 (11.3%) | 287 (5.8%) |
| $75,000 to $99,999 | 418 (16.4%) | 919 (18.6%) |
| $100,000 to $149,999 | 505 (19.8%) | 889 (18.0%) |
| $150,000 or more | 417 (16.4%) | 1,434 (29.0%) |
| Total | 2,545 (100.0%) | 4,940 (100.0%) |
Property Value to Household Income Ratio in Daphne
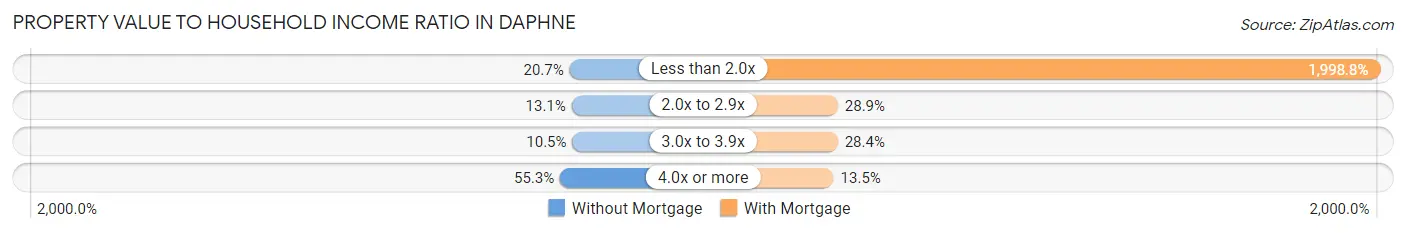
| Value-to-Income Ratio | Without Mortgage | With Mortgage |
| Less than 2.0x | 526 (20.7%) | 98,741 (1,998.8%) |
| 2.0x to 2.9x | 334 (13.1%) | 1,425 (28.8%) |
| 3.0x to 3.9x | 266 (10.4%) | 1,402 (28.4%) |
| 4.0x or more | 1,406 (55.2%) | 666 (13.5%) |
| Total | 2,545 (100.0%) | 4,940 (100.0%) |
Real Estate Taxes by Mortgage Status in Daphne
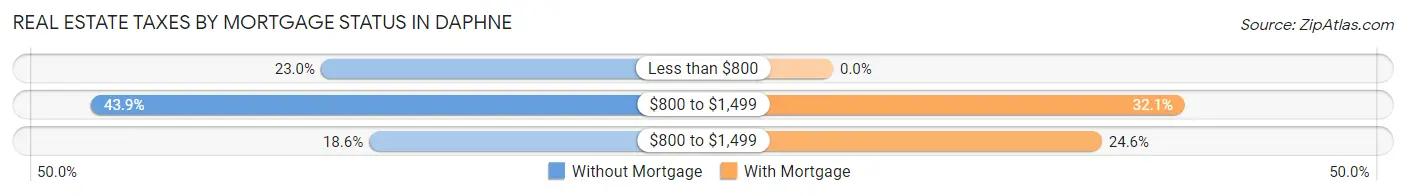
| Property Taxes | Without Mortgage | With Mortgage |
| Less than $800 | 584 (23.0%) | 0 (0.0%) |
| $800 to $1,499 | 1,118 (43.9%) | 1,587 (32.1%) |
| $800 to $1,499 | 472 (18.5%) | 1,213 (24.5%) |
| Total | 2,545 (100.0%) | 4,940 (100.0%) |
Health & Disability in Daphne
Health Insurance Coverage by Age in Daphne
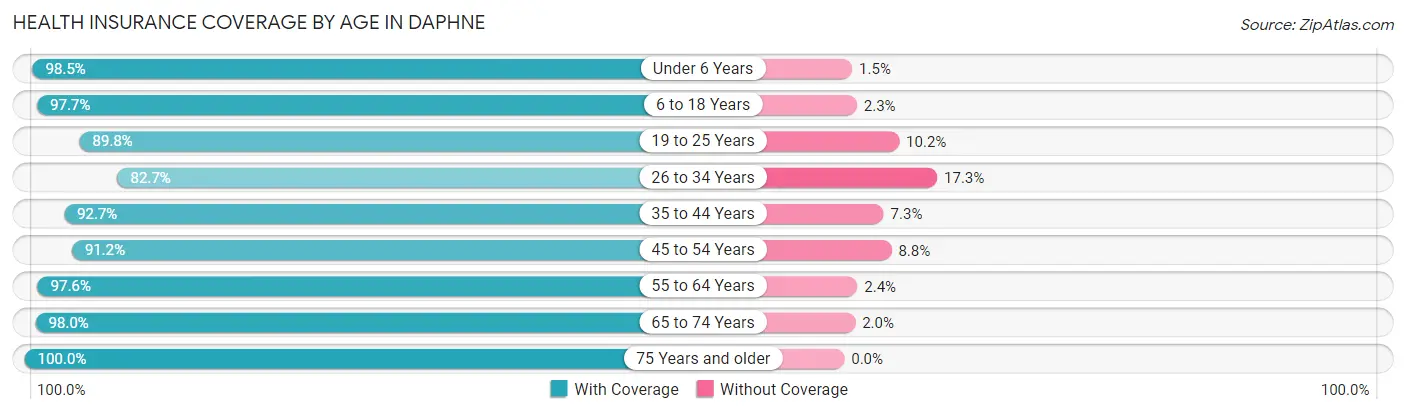
| Age Bracket | With Coverage | Without Coverage |
| Under 6 Years | 3,007 (98.5%) | 45 (1.5%) |
| 6 to 18 Years | 4,217 (97.7%) | 101 (2.3%) |
| 19 to 25 Years | 1,702 (89.8%) | 194 (10.2%) |
| 26 to 34 Years | 2,947 (82.7%) | 617 (17.3%) |
| 35 to 44 Years | 3,357 (92.7%) | 266 (7.3%) |
| 45 to 54 Years | 2,797 (91.2%) | 270 (8.8%) |
| 55 to 64 Years | 3,130 (97.6%) | 78 (2.4%) |
| 65 to 74 Years | 2,799 (98.0%) | 58 (2.0%) |
| 75 Years and older | 1,798 (100.0%) | 0 (0.0%) |
| Total | 25,754 (94.1%) | 1,629 (5.9%) |
Health Insurance Coverage by Citizenship Status in Daphne
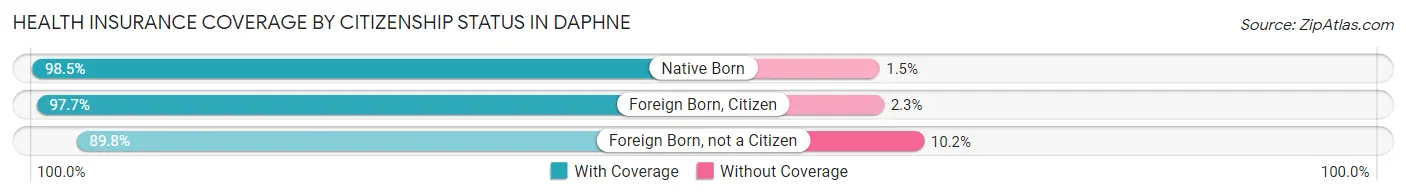
| Citizenship Status | With Coverage | Without Coverage |
| Native Born | 3,007 (98.5%) | 45 (1.5%) |
| Foreign Born, Citizen | 4,217 (97.7%) | 101 (2.3%) |
| Foreign Born, not a Citizen | 1,702 (89.8%) | 194 (10.2%) |
Health Insurance Coverage by Household Income in Daphne
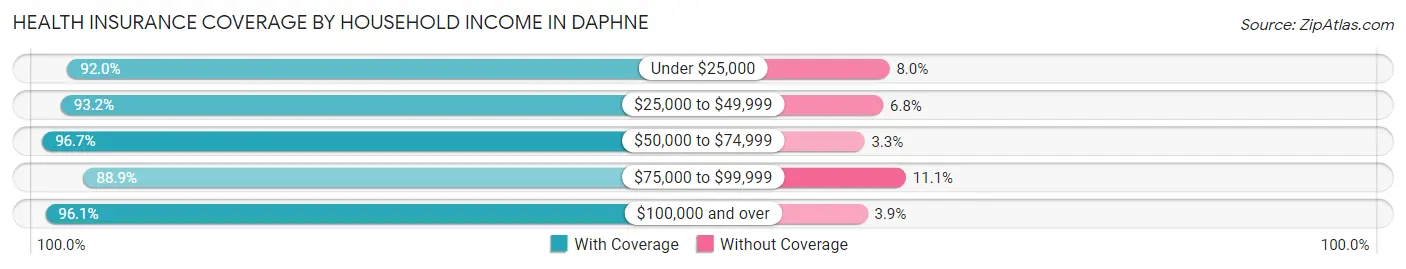
| Household Income | With Coverage | Without Coverage |
| Under $25,000 | 1,793 (92.0%) | 156 (8.0%) |
| $25,000 to $49,999 | 3,756 (93.2%) | 274 (6.8%) |
| $50,000 to $74,999 | 4,638 (96.7%) | 159 (3.3%) |
| $75,000 to $99,999 | 4,764 (88.9%) | 593 (11.1%) |
| $100,000 and over | 10,790 (96.1%) | 435 (3.9%) |
Public vs Private Health Insurance Coverage by Age in Daphne
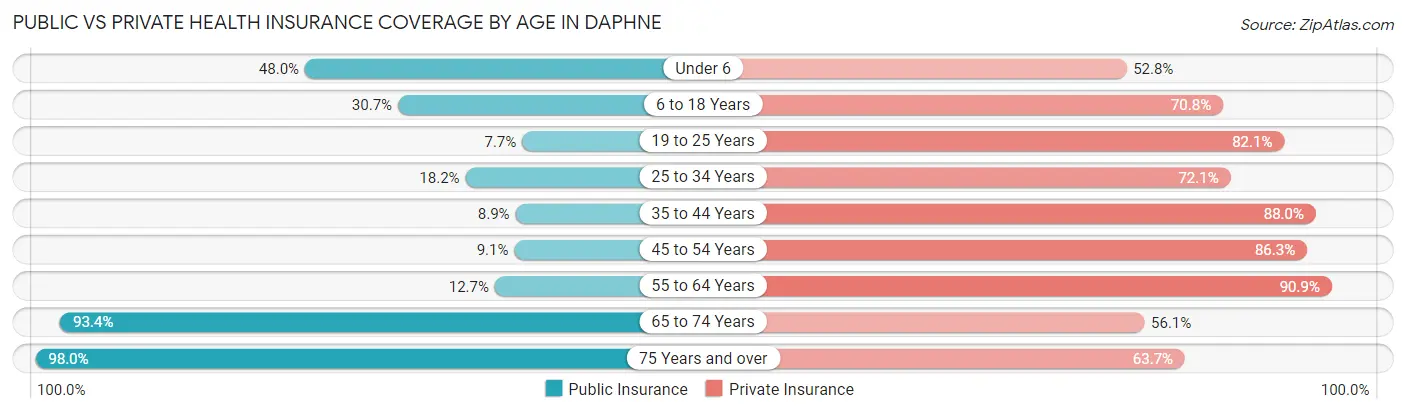
| Age Bracket | Public Insurance | Private Insurance |
| Under 6 | 1,464 (48.0%) | 1,611 (52.8%) |
| 6 to 18 Years | 1,326 (30.7%) | 3,055 (70.8%) |
| 19 to 25 Years | 145 (7.6%) | 1,557 (82.1%) |
| 25 to 34 Years | 648 (18.2%) | 2,571 (72.1%) |
| 35 to 44 Years | 322 (8.9%) | 3,187 (88.0%) |
| 45 to 54 Years | 279 (9.1%) | 2,648 (86.3%) |
| 55 to 64 Years | 408 (12.7%) | 2,917 (90.9%) |
| 65 to 74 Years | 2,669 (93.4%) | 1,603 (56.1%) |
| 75 Years and over | 1,762 (98.0%) | 1,145 (63.7%) |
| Total | 9,023 (33.0%) | 20,294 (74.1%) |
Disability Status by Sex by Age in Daphne
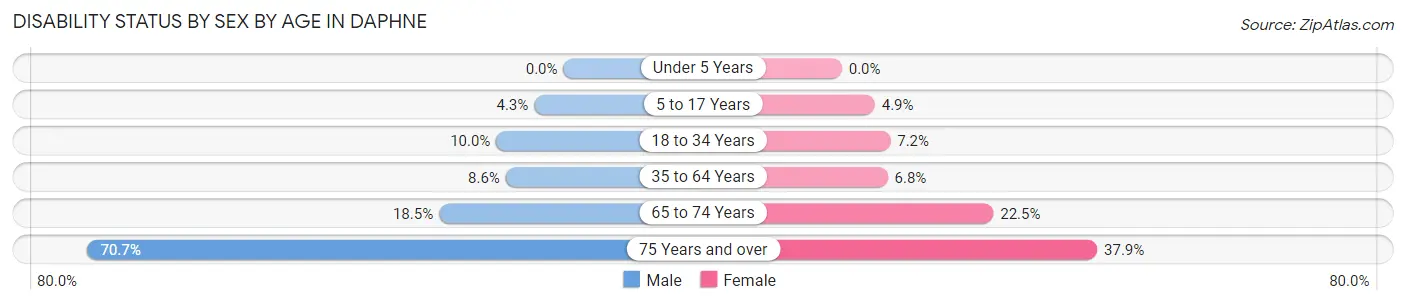
| Age Bracket | Male | Female |
| Under 5 Years | 0 (0.0%) | 0 (0.0%) |
| 5 to 17 Years | 97 (4.3%) | 120 (4.9%) |
| 18 to 34 Years | 285 (10.0%) | 200 (7.2%) |
| 35 to 64 Years | 388 (8.6%) | 365 (6.8%) |
| 65 to 74 Years | 256 (18.5%) | 331 (22.5%) |
| 75 Years and over | 607 (70.7%) | 356 (37.9%) |
Disability Class by Sex by Age in Daphne
Disability Class: Hearing Difficulty
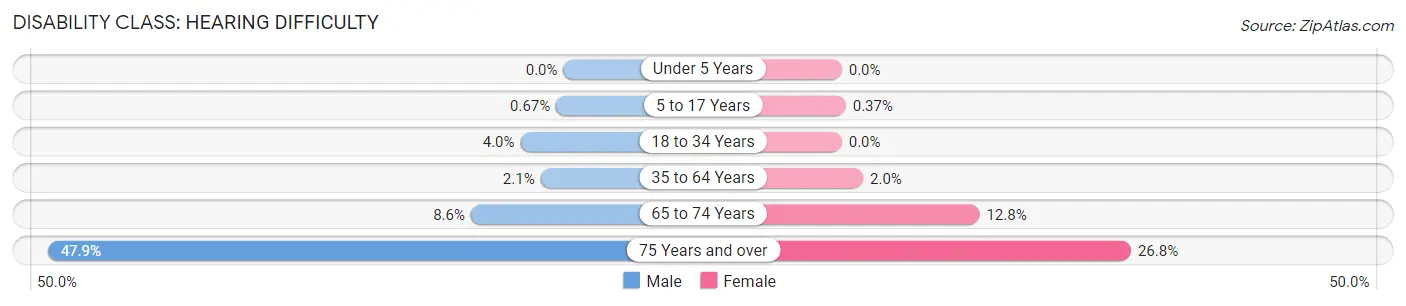
| Age Bracket | Male | Female |
| Under 5 Years | 0 (0.0%) | 0 (0.0%) |
| 5 to 17 Years | 15 (0.7%) | 9 (0.4%) |
| 18 to 34 Years | 114 (4.0%) | 0 (0.0%) |
| 35 to 64 Years | 96 (2.1%) | 106 (2.0%) |
| 65 to 74 Years | 119 (8.6%) | 188 (12.8%) |
| 75 Years and over | 411 (47.8%) | 252 (26.8%) |
Disability Class: Vision Difficulty
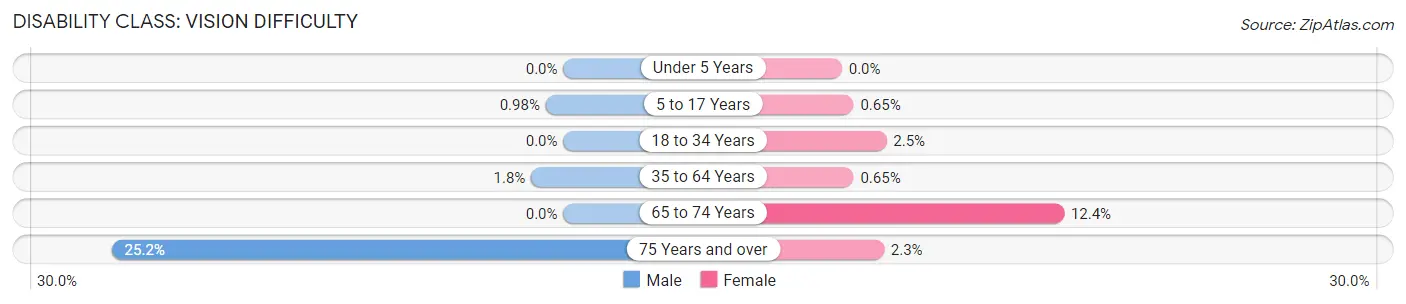
| Age Bracket | Male | Female |
| Under 5 Years | 0 (0.0%) | 0 (0.0%) |
| 5 to 17 Years | 22 (1.0%) | 16 (0.6%) |
| 18 to 34 Years | 0 (0.0%) | 69 (2.5%) |
| 35 to 64 Years | 81 (1.8%) | 35 (0.6%) |
| 65 to 74 Years | 0 (0.0%) | 182 (12.4%) |
| 75 Years and over | 216 (25.2%) | 22 (2.3%) |
Disability Class: Cognitive Difficulty
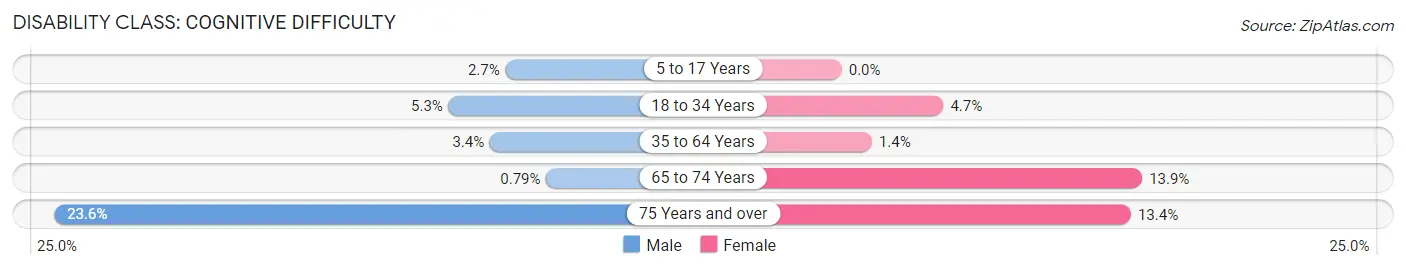
| Age Bracket | Male | Female |
| 5 to 17 Years | 60 (2.7%) | 0 (0.0%) |
| 18 to 34 Years | 152 (5.3%) | 131 (4.7%) |
| 35 to 64 Years | 154 (3.4%) | 75 (1.4%) |
| 65 to 74 Years | 11 (0.8%) | 205 (13.9%) |
| 75 Years and over | 203 (23.6%) | 126 (13.4%) |
Disability Class: Ambulatory Difficulty
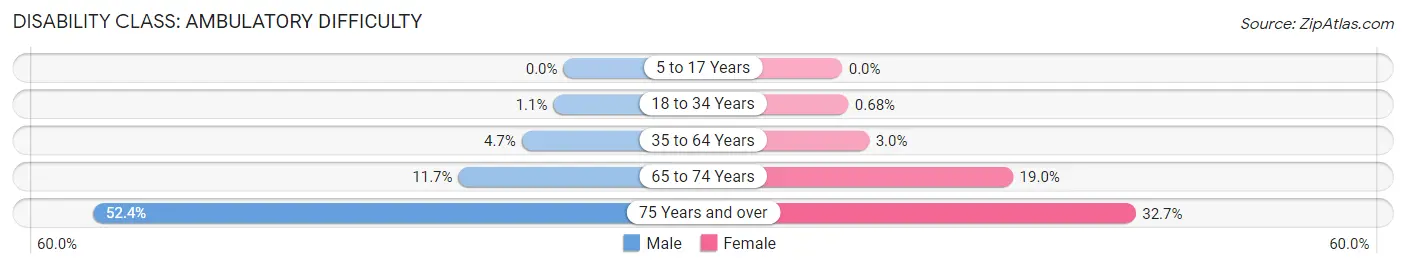
| Age Bracket | Male | Female |
| 5 to 17 Years | 0 (0.0%) | 0 (0.0%) |
| 18 to 34 Years | 32 (1.1%) | 19 (0.7%) |
| 35 to 64 Years | 211 (4.6%) | 161 (3.0%) |
| 65 to 74 Years | 162 (11.7%) | 280 (19.0%) |
| 75 Years and over | 450 (52.4%) | 307 (32.7%) |
Disability Class: Self-Care Difficulty
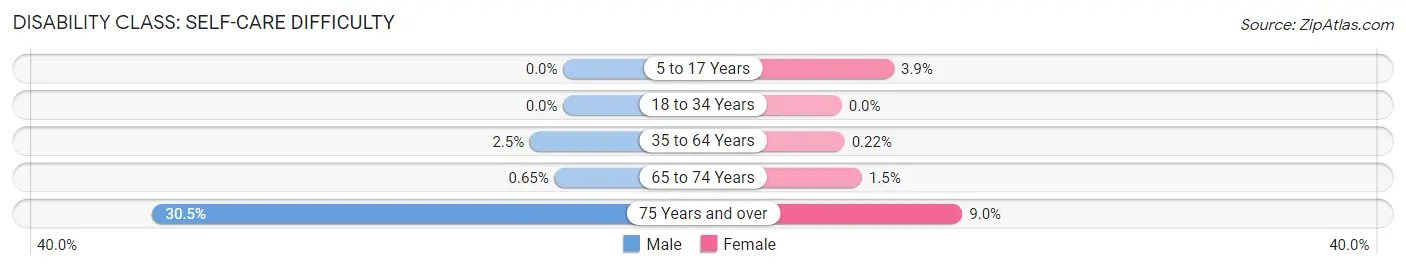
| Age Bracket | Male | Female |
| 5 to 17 Years | 0 (0.0%) | 95 (3.9%) |
| 18 to 34 Years | 0 (0.0%) | 0 (0.0%) |
| 35 to 64 Years | 112 (2.5%) | 12 (0.2%) |
| 65 to 74 Years | 9 (0.6%) | 22 (1.5%) |
| 75 Years and over | 262 (30.5%) | 84 (8.9%) |
Technology Access in Daphne
Computing Device Access in Daphne
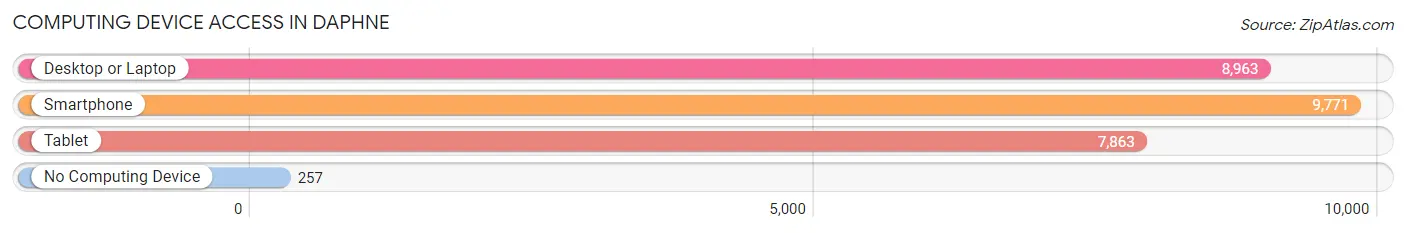
| Device Type | # Households | % Households |
| Desktop or Laptop | 8,963 | 85.6% |
| Smartphone | 9,771 | 93.3% |
| Tablet | 7,863 | 75.1% |
| No Computing Device | 257 | 2.5% |
| Total | 10,469 | 100.0% |
Internet Access in Daphne
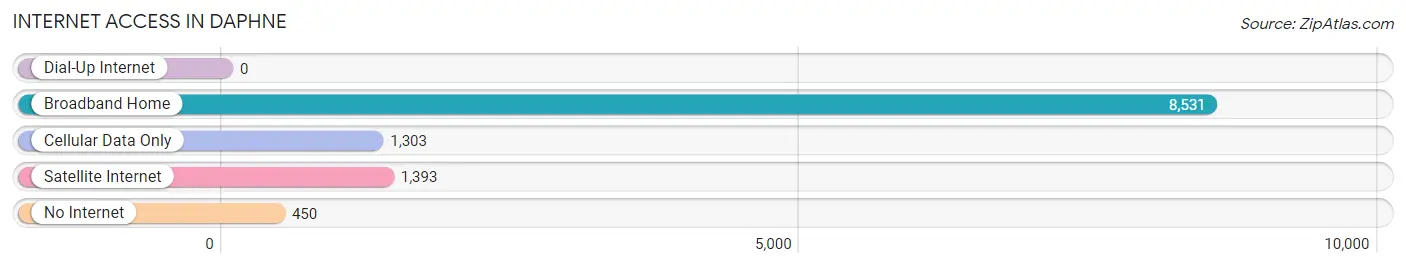
| Internet Type | # Households | % Households |
| Dial-Up Internet | 0 | 0.0% |
| Broadband Home | 8,531 | 81.5% |
| Cellular Data Only | 1,303 | 12.4% |
| Satellite Internet | 1,393 | 13.3% |
| No Internet | 450 | 4.3% |
| Total | 10,469 | 100.0% |
Daphne Summary
Daphne, Alabama is a city located in Baldwin County, Alabama, United States. It is a part of the Daphne-Fairhope-Foley metropolitan area, which is the largest metropolitan area in Baldwin County. The city is located on the eastern shore of Mobile Bay, and is part of the Mobile-Daphne-Fairhope Combined Statistical Area. As of the 2010 census, the population of Daphne was 21,570.
Geography
Daphne is located at 30°37'25" North, 87°53'17" West (30.623607, -87.888090). According to the United States Census Bureau, the city has a total area of 16.2 square miles (41.8 km2), of which 15.7 square miles (40.7 km2) is land and 0.5 square miles (1.2 km2) is water.
The city is located on the eastern shore of Mobile Bay, and is part of the Mobile-Daphne-Fairhope Combined Statistical Area. It is bordered by the cities of Fairhope to the east and Spanish Fort to the west.
History
Daphne was founded in 1874 by the Daphne Land Company, which was formed by a group of investors from Mobile, Alabama. The city was named after the Greek mythological figure Daphne, who was the daughter of the river god Peneus.
The city was incorporated in 1882, and the first mayor was William H. McVay. The city grew rapidly in the late 19th and early 20th centuries, and by the 1920s it had become a popular resort town.
Economy
Daphne's economy is largely based on tourism and retail. The city is home to several large shopping centers, including the Eastern Shore Centre, which is the largest shopping center in Baldwin County. The city is also home to several restaurants, hotels, and other businesses that cater to tourists.
The city is also home to several large employers, including Austal USA, a shipbuilding company, and Infirmary Health, a healthcare provider.
Demographics
As of the 2010 census, there were 21,570 people, 8,845 households, and 5,945 families residing in the city. The population density was 1,377.3 people per square mile (531.2/km2). There were 9,717 housing units at an average density of 617.3 per square mile (238.3/km2). The racial makeup of the city was 79.2% White, 15.2% African American, 0.3% Native American, 2.2% Asian, 0.1% Pacific Islander, 1.2% from other races, and 1.9% from two or more races. Hispanic or Latino of any race were 3.7% of the population.
There were 8,845 households, out of which 28.7% had children under the age of 18 living with them, 51.2% were married couples living together, 11.7% had a female householder with no husband present, and 33.2% were non-families. 27.2% of all households were made up of individuals, and 9.2% had someone living alone who was 65 years of age or older. The average household size was 2.41 and the average family size was 2.94.
In the city, the population was spread out, with 23.2% under the age of 18, 8.2% from 18 to 24, 28.2% from 25 to 44, 25.7% from 45 to 64, and 14.7% who were 65 years of age or older. The median age was 38 years. For every 100 females, there were 92.2 males. For every 100 females age 18 and over, there were 88.7 males.
The median income for a household in the city was $45,945, and the median income for a family was $54,945. Males had a median income of $41,945 versus $30,945 for females. The per capita income for the city was $24,945. About 6.7% of families and 8.7% of the population were below the poverty line, including 11.7% of those under age 18 and 6.7% of those age 65 or over.
Common Questions
What is Per Capita Income in Daphne?
Per Capita income in Daphne is $38,533.
What is the Median Family Income in Daphne?
Median Family Income in Daphne is $92,413.
What is the Median Household income in Daphne?
Median Household Income in Daphne is $80,657.
What is Income or Wage Gap in Daphne?
Income or Wage Gap in Daphne is 43.7%.
Women in Daphne earn 56.3 cents for every dollar earned by a man.
What is Family Income Deficit in Daphne?
Family Income Deficit in Daphne is $12,816.
Families that are below poverty line in Daphne earn $12,816 less on average than the poverty threshold level.
What is Inequality or Gini Index in Daphne?
Inequality or Gini Index in Daphne is 0.40.
What is the Total Population of Daphne?
Total Population of Daphne is 27,861.
What is the Total Male Population of Daphne?
Total Male Population of Daphne is 13,445.
What is the Total Female Population of Daphne?
Total Female Population of Daphne is 14,416.
What is the Ratio of Males per 100 Females in Daphne?
There are 93.26 Males per 100 Females in Daphne.
What is the Ratio of Females per 100 Males in Daphne?
There are 107.22 Females per 100 Males in Daphne.
What is the Median Population Age in Daphne?
Median Population Age in Daphne is 37.6 Years.
What is the Average Family Size in Daphne
Average Family Size in Daphne is 3.2 People.
What is the Average Household Size in Daphne
Average Household Size in Daphne is 2.6 People.
How Large is the Labor Force in Daphne?
There are 13,690 People in the Labor Forcein in Daphne.
What is the Percentage of People in the Labor Force in Daphne?
64.1% of People are in the Labor Force in Daphne.
What is the Unemployment Rate in Daphne?
Unemployment Rate in Daphne is 2.8%.