Blue Springs, MO Map & Demographics
Blue Springs Map
Blue Springs Overview
$38,842
PER CAPITA INCOME
$95,098
AVG FAMILY INCOME
$82,965
AVG HOUSEHOLD INCOME
31.5%
WAGE / INCOME GAP [ % ]
68.5¢/ $1
WAGE / INCOME GAP [ $ ]
$12,939
FAMILY INCOME DEFICIT
0.40
INEQUALITY / GINI INDEX
58,720
TOTAL POPULATION
28,390
MALE POPULATION
30,330
FEMALE POPULATION
93.60
MALES / 100 FEMALES
106.83
FEMALES / 100 MALES
36.6
MEDIAN AGE
3.1
AVG FAMILY SIZE
2.7
AVG HOUSEHOLD SIZE
30,830
LABOR FORCE [ PEOPLE ]
69.7%
PERCENT IN LABOR FORCE
4.0%
UNEMPLOYMENT RATE
Blue Springs Area Codes
Income in Blue Springs
Income Overview in Blue Springs
Per Capita Income in Blue Springs is $38,842, while median incomes of families and households are $95,098 and $82,965 respectively.
| Characteristic | Number | Measure |
| Per Capita Income | 58,720 | $38,842 |
| Median Family Income | 16,157 | $95,098 |
| Mean Family Income | 16,157 | $116,991 |
| Median Household Income | 21,864 | $82,965 |
| Mean Household Income | 21,864 | $103,676 |
| Income Deficit | 16,157 | $12,939 |
| Wage / Income Gap (%) | 58,720 | 31.47% |
| Wage / Income Gap ($) | 58,720 | 68.53¢ per $1 |
| Gini / Inequality Index | 58,720 | 0.40 |
Earnings by Sex in Blue Springs
Average Earnings in Blue Springs are $46,977, $57,104 for men and $39,131 for women, a difference of 31.5%.
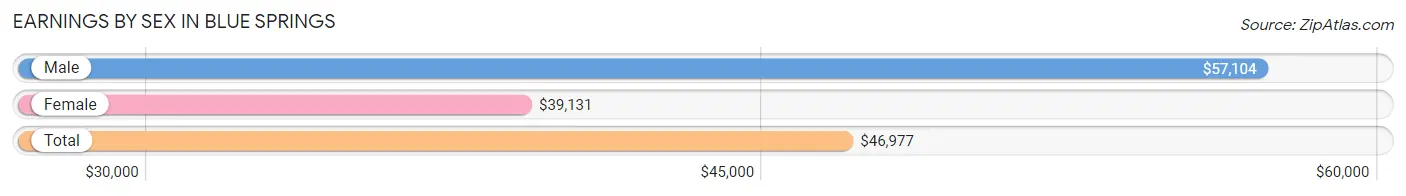
| Sex | Number | Average Earnings |
| Male | 15,765 (49.4%) | $57,104 |
| Female | 16,146 (50.6%) | $39,131 |
| Total | 31,911 (100.0%) | $46,977 |
Earnings by Sex by Income Bracket in Blue Springs
The most common earnings brackets in Blue Springs are $100,000+ for men (2,982 | 18.9%) and $55,000 to $64,999 for women (1,439 | 8.9%).
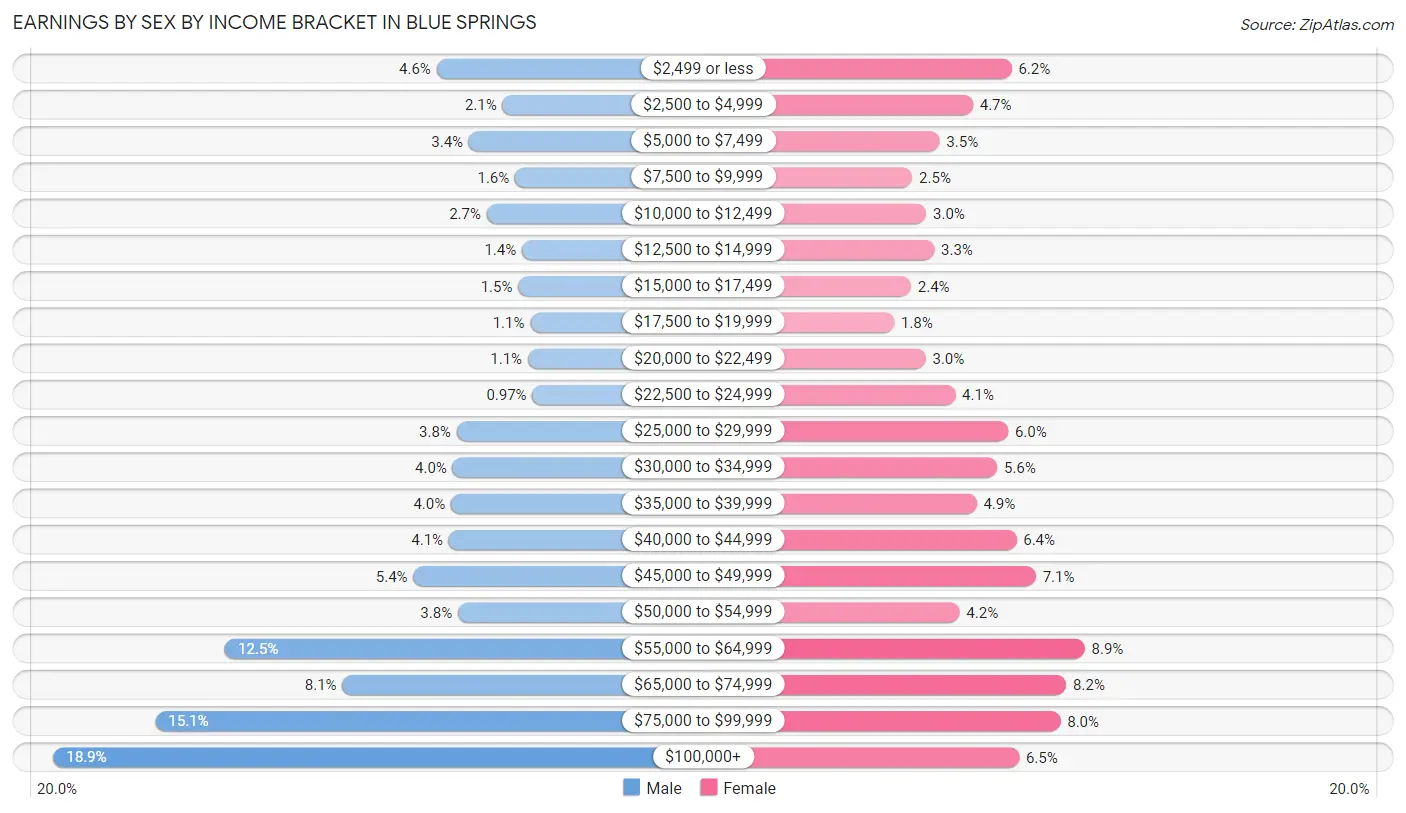
| Income | Male | Female |
| $2,499 or less | 719 (4.6%) | 996 (6.2%) |
| $2,500 to $4,999 | 330 (2.1%) | 762 (4.7%) |
| $5,000 to $7,499 | 528 (3.4%) | 561 (3.5%) |
| $7,500 to $9,999 | 256 (1.6%) | 395 (2.5%) |
| $10,000 to $12,499 | 422 (2.7%) | 480 (3.0%) |
| $12,500 to $14,999 | 214 (1.4%) | 528 (3.3%) |
| $15,000 to $17,499 | 237 (1.5%) | 387 (2.4%) |
| $17,500 to $19,999 | 165 (1.1%) | 286 (1.8%) |
| $20,000 to $22,499 | 179 (1.1%) | 476 (2.9%) |
| $22,500 to $24,999 | 153 (1.0%) | 655 (4.1%) |
| $25,000 to $29,999 | 601 (3.8%) | 976 (6.0%) |
| $30,000 to $34,999 | 625 (4.0%) | 909 (5.6%) |
| $35,000 to $39,999 | 634 (4.0%) | 785 (4.9%) |
| $40,000 to $44,999 | 646 (4.1%) | 1,025 (6.4%) |
| $45,000 to $49,999 | 856 (5.4%) | 1,143 (7.1%) |
| $50,000 to $54,999 | 592 (3.8%) | 682 (4.2%) |
| $55,000 to $64,999 | 1,969 (12.5%) | 1,439 (8.9%) |
| $65,000 to $74,999 | 1,276 (8.1%) | 1,327 (8.2%) |
| $75,000 to $99,999 | 2,381 (15.1%) | 1,292 (8.0%) |
| $100,000+ | 2,982 (18.9%) | 1,042 (6.5%) |
| Total | 15,765 (100.0%) | 16,146 (100.0%) |
Earnings by Sex by Educational Attainment in Blue Springs
Average earnings in Blue Springs are $62,764 for men and $43,361 for women, a difference of 30.9%. Men with an educational attainment of graduate degree enjoy the highest average annual earnings of $90,108, while those with high school diploma education earn the least with $55,406. Women with an educational attainment of graduate degree earn the most with the average annual earnings of $67,602, while those with less than high school education have the smallest earnings of $14,518.
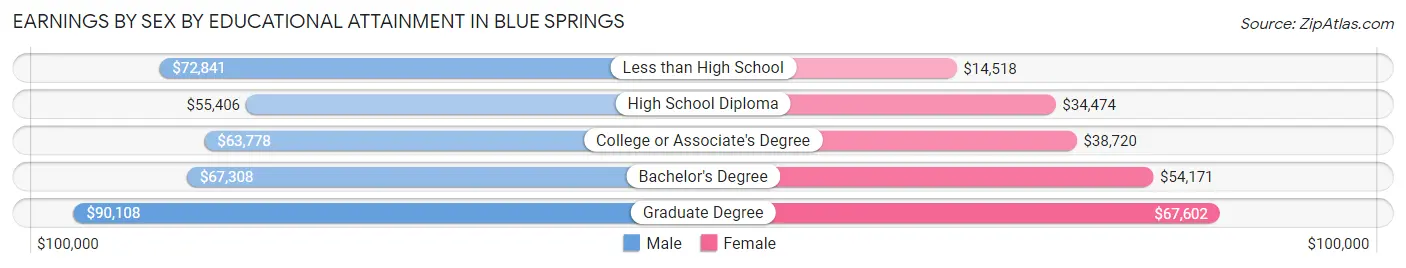
| Educational Attainment | Male Income | Female Income |
| Less than High School | $72,841 | $14,518 |
| High School Diploma | $55,406 | $34,474 |
| College or Associate's Degree | $63,778 | $38,720 |
| Bachelor's Degree | $67,308 | $54,171 |
| Graduate Degree | $90,108 | $67,602 |
| Total | $62,764 | $43,361 |
Family Income in Blue Springs
Family Income Brackets in Blue Springs
According to the Blue Springs family income data, there are 3,942 families falling into the $100,000 to $149,999 income range, which is the most common income bracket and makes up 24.4% of all families. Conversely, the $10,000 to $14,999 income bracket is the least frequent group with only 210 families (1.3%) belonging to this category.
| Income Bracket | # Families | % Families |
| Less than $10,000 | 388 | 2.4% |
| $10,000 to $14,999 | 210 | 1.3% |
| $15,000 to $24,999 | 420 | 2.6% |
| $25,000 to $34,999 | 517 | 3.2% |
| $35,000 to $49,999 | 1,454 | 9.0% |
| $50,000 to $74,999 | 2,811 | 17.4% |
| $75,000 to $99,999 | 2,714 | 16.8% |
| $100,000 to $149,999 | 3,942 | 24.4% |
| $150,000 to $199,999 | 2,181 | 13.5% |
| $200,000+ | 1,519 | 9.4% |
Family Income by Famaliy Size in Blue Springs
7+ person families (179 | 1.1%) account for the highest median family income in Blue Springs with $142,519 per family, while 2-person families (7,037 | 43.5%) have the highest median income of $43,109 per family member.
| Income Bracket | # Families | Median Income |
| 2-Person Families | 7,037 (43.5%) | $86,218 |
| 3-Person Families | 3,990 (24.7%) | $111,971 |
| 4-Person Families | 3,252 (20.1%) | $103,167 |
| 5-Person Families | 1,345 (8.3%) | $103,783 |
| 6-Person Families | 354 (2.2%) | $93,981 |
| 7+ Person Families | 179 (1.1%) | $142,519 |
| Total | 16,157 (100.0%) | $95,098 |
Family Income by Number of Earners in Blue Springs
The median family income in Blue Springs is $95,098, with families comprising 3+ earners (2,123) having the highest median family income of $153,690, while families with 1 earner (4,982) have the lowest median family income of $67,188, accounting for 13.1% and 30.8% of families, respectively.
| Number of Earners | # Families | Median Income |
| No Earners | 2,023 (12.5%) | $72,755 |
| 1 Earner | 4,982 (30.8%) | $67,188 |
| 2 Earners | 7,029 (43.5%) | $116,388 |
| 3+ Earners | 2,123 (13.1%) | $153,690 |
| Total | 16,157 (100.0%) | $95,098 |
Household Income in Blue Springs
Household Income Brackets in Blue Springs
With 4,482 households falling in the category, the $100,000 to $149,999 income range is the most frequent in Blue Springs, accounting for 20.5% of all households. In contrast, only 306 households (1.4%) fall into the $10,000 to $14,999 income bracket, making it the least populous group.
| Income Bracket | # Households | % Households |
| Less than $10,000 | 547 | 2.5% |
| $10,000 to $14,999 | 306 | 1.4% |
| $15,000 to $24,999 | 1,224 | 5.6% |
| $25,000 to $34,999 | 1,071 | 4.9% |
| $35,000 to $49,999 | 2,405 | 11.0% |
| $50,000 to $74,999 | 4,132 | 18.9% |
| $75,000 to $99,999 | 3,542 | 16.2% |
| $100,000 to $149,999 | 4,482 | 20.5% |
| $150,000 to $199,999 | 2,492 | 11.4% |
| $200,000+ | 1,662 | 7.6% |
Household Income by Householder Age in Blue Springs
The median household income in Blue Springs is $82,965, with the highest median household income of $101,968 found in the 45 to 64 years age bracket for the primary householder. A total of 8,362 households (38.3%) fall into this category. Meanwhile, the 15 to 24 years age bracket for the primary householder has the lowest median household income of $45,257, with 409 households (1.9%) in this group.
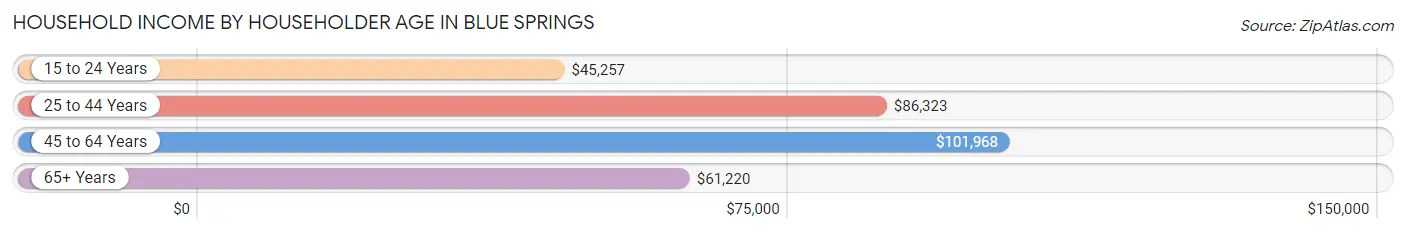
| Income Bracket | # Households | Median Income |
| 15 to 24 Years | 409 (1.9%) | $45,257 |
| 25 to 44 Years | 8,049 (36.8%) | $86,323 |
| 45 to 64 Years | 8,362 (38.3%) | $101,968 |
| 65+ Years | 5,044 (23.1%) | $61,220 |
| Total | 21,864 (100.0%) | $82,965 |
Poverty in Blue Springs
Income Below Poverty by Sex and Age in Blue Springs
With 5.9% poverty level for males and 6.9% for females among the residents of Blue Springs, 16 and 17 year old males and 15 year old females are the most vulnerable to poverty, with 159 males (20.8%) and 80 females (17.0%) in their respective age groups living below the poverty level.
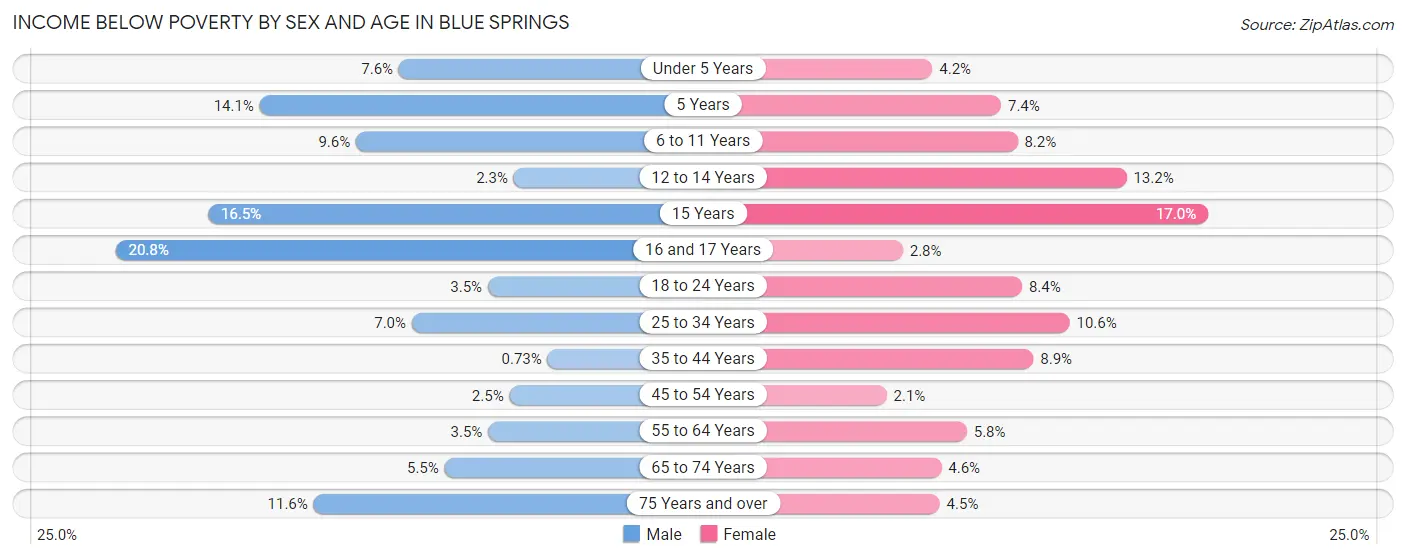
| Age Bracket | Male | Female |
| Under 5 Years | 157 (7.6%) | 95 (4.2%) |
| 5 Years | 95 (14.1%) | 28 (7.4%) |
| 6 to 11 Years | 270 (9.6%) | 183 (8.2%) |
| 12 to 14 Years | 27 (2.3%) | 212 (13.2%) |
| 15 Years | 91 (16.5%) | 80 (17.0%) |
| 16 and 17 Years | 159 (20.8%) | 31 (2.8%) |
| 18 to 24 Years | 71 (3.5%) | 154 (8.4%) |
| 25 to 34 Years | 283 (7.0%) | 416 (10.6%) |
| 35 to 44 Years | 23 (0.7%) | 373 (8.9%) |
| 45 to 54 Years | 95 (2.5%) | 80 (2.1%) |
| 55 to 64 Years | 116 (3.5%) | 224 (5.8%) |
| 65 to 74 Years | 139 (5.5%) | 131 (4.6%) |
| 75 Years and over | 151 (11.6%) | 70 (4.5%) |
| Total | 1,677 (5.9%) | 2,077 (6.9%) |
Income Above Poverty by Sex and Age in Blue Springs
According to the poverty statistics in Blue Springs, males aged 35 to 44 years and females aged 45 to 54 years are the age groups that are most secure financially, with 99.3% of males and 97.9% of females in these age groups living above the poverty line.
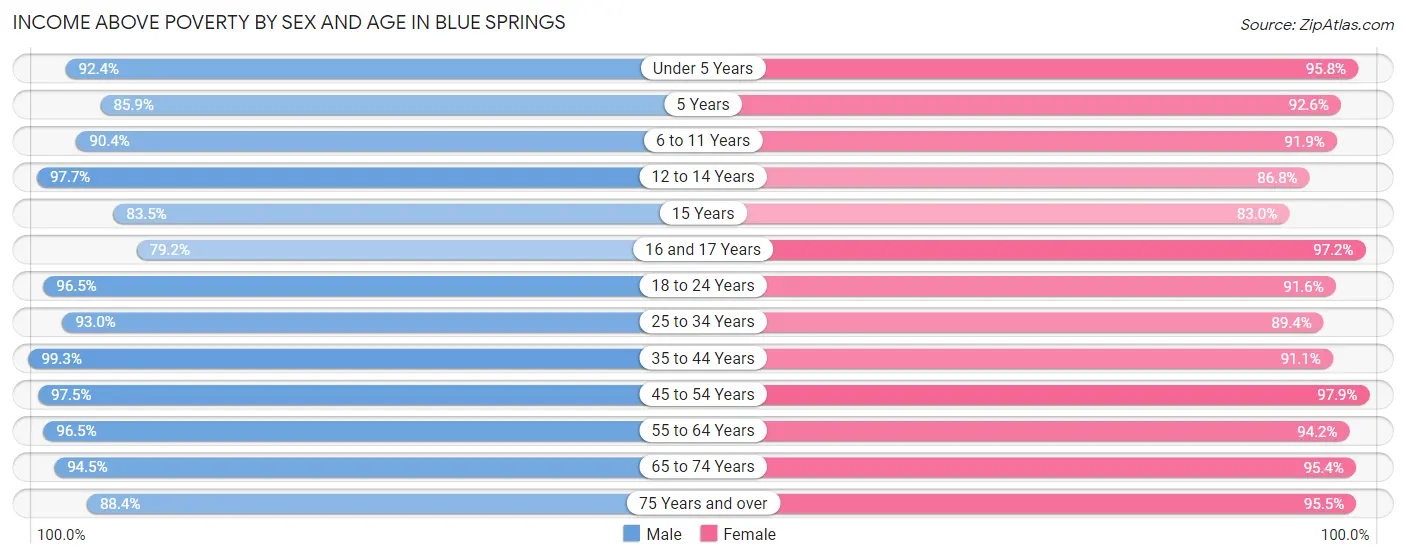
| Age Bracket | Male | Female |
| Under 5 Years | 1,901 (92.4%) | 2,169 (95.8%) |
| 5 Years | 579 (85.9%) | 351 (92.6%) |
| 6 to 11 Years | 2,537 (90.4%) | 2,062 (91.8%) |
| 12 to 14 Years | 1,145 (97.7%) | 1,393 (86.8%) |
| 15 Years | 461 (83.5%) | 391 (83.0%) |
| 16 and 17 Years | 606 (79.2%) | 1,064 (97.2%) |
| 18 to 24 Years | 1,960 (96.5%) | 1,689 (91.6%) |
| 25 to 34 Years | 3,743 (93.0%) | 3,518 (89.4%) |
| 35 to 44 Years | 3,108 (99.3%) | 3,821 (91.1%) |
| 45 to 54 Years | 3,701 (97.5%) | 3,761 (97.9%) |
| 55 to 64 Years | 3,210 (96.5%) | 3,637 (94.2%) |
| 65 to 74 Years | 2,382 (94.5%) | 2,707 (95.4%) |
| 75 Years and over | 1,152 (88.4%) | 1,471 (95.5%) |
| Total | 26,485 (94.1%) | 28,034 (93.1%) |
Income Below Poverty Among Married-Couple Families in Blue Springs
The poverty statistics for married-couple families in Blue Springs show that 2.4% or 285 of the total 12,117 families live below the poverty line. Families with no children have the highest poverty rate of 2.9%, comprising of 200 families. On the other hand, families with 5 or more children have the lowest poverty rate of 0.0%, which includes 0 families.
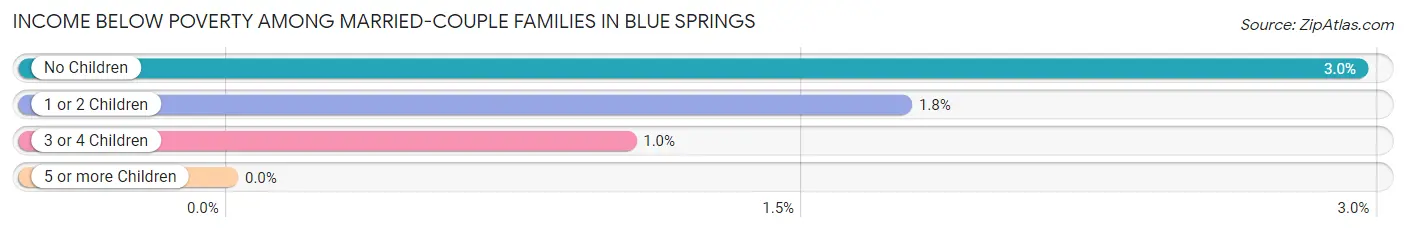
| Children | Above Poverty | Below Poverty |
| No Children | 6,588 (97.1%) | 200 (2.9%) |
| 1 or 2 Children | 4,194 (98.2%) | 75 (1.8%) |
| 3 or 4 Children | 951 (99.0%) | 10 (1.0%) |
| 5 or more Children | 99 (100.0%) | 0 (0.0%) |
| Total | 11,832 (97.7%) | 285 (2.4%) |
Income Below Poverty Among Single-Parent Households in Blue Springs
According to the poverty data in Blue Springs, 7.1% or 58 single-father households and 14.6% or 470 single-mother households are living below the poverty line. Among single-father households, those with 3 or 4 children have the highest poverty rate, with 37 households (24.5%) experiencing poverty. Likewise, among single-mother households, those with 5 or more children have the highest poverty rate, with 14 households (100.0%) falling below the poverty line.
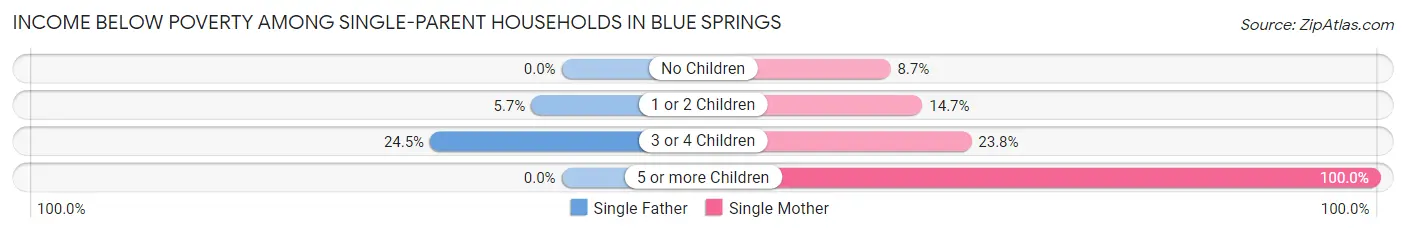
| Children | Single Father | Single Mother |
| No Children | 0 (0.0%) | 70 (8.7%) |
| 1 or 2 Children | 21 (5.7%) | 298 (14.7%) |
| 3 or 4 Children | 37 (24.5%) | 88 (23.8%) |
| 5 or more Children | 0 (0.0%) | 14 (100.0%) |
| Total | 58 (7.1%) | 470 (14.6%) |
Income Below Poverty Among Married-Couple vs Single-Parent Households in Blue Springs
The poverty data for Blue Springs shows that 285 of the married-couple family households (2.4%) and 528 of the single-parent households (13.1%) are living below the poverty level. Within the married-couple family households, those with no children have the highest poverty rate, with 200 households (2.9%) falling below the poverty line. Among the single-parent households, those with 5 or more children have the highest poverty rate, with 14 household (70.0%) living below poverty.
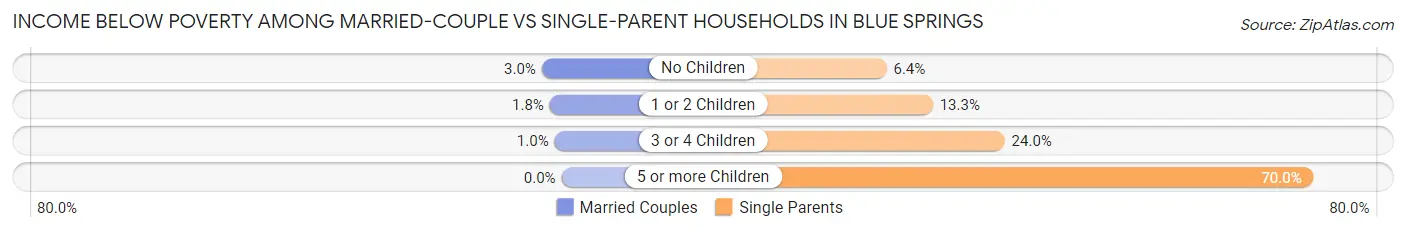
| Children | Married-Couple Families | Single-Parent Households |
| No Children | 200 (2.9%) | 70 (6.4%) |
| 1 or 2 Children | 75 (1.8%) | 319 (13.3%) |
| 3 or 4 Children | 10 (1.0%) | 125 (24.0%) |
| 5 or more Children | 0 (0.0%) | 14 (70.0%) |
| Total | 285 (2.4%) | 528 (13.1%) |
Race in Blue Springs
The most populous races in Blue Springs are White / Caucasian (49,672 | 84.6%), Hispanic or Latino (4,080 | 7.0%), and Black / African American (3,955 | 6.7%).
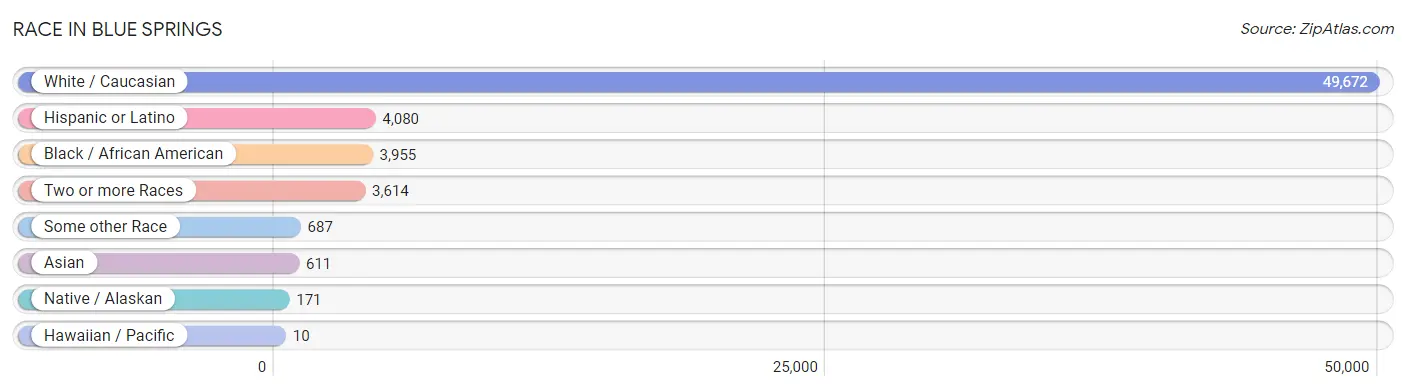
| Race | # Population | % Population |
| Asian | 611 | 1.0% |
| Black / African American | 3,955 | 6.7% |
| Hawaiian / Pacific | 10 | 0.0% |
| Hispanic or Latino | 4,080 | 7.0% |
| Native / Alaskan | 171 | 0.3% |
| White / Caucasian | 49,672 | 84.6% |
| Two or more Races | 3,614 | 6.1% |
| Some other Race | 687 | 1.2% |
| Total | 58,720 | 100.0% |
Ancestry in Blue Springs
The most populous ancestries reported in Blue Springs are German (11,145 | 19.0%), Irish (7,747 | 13.2%), English (7,663 | 13.1%), European (5,830 | 9.9%), and Mexican (2,925 | 5.0%), together accounting for 60.1% of all Blue Springs residents.
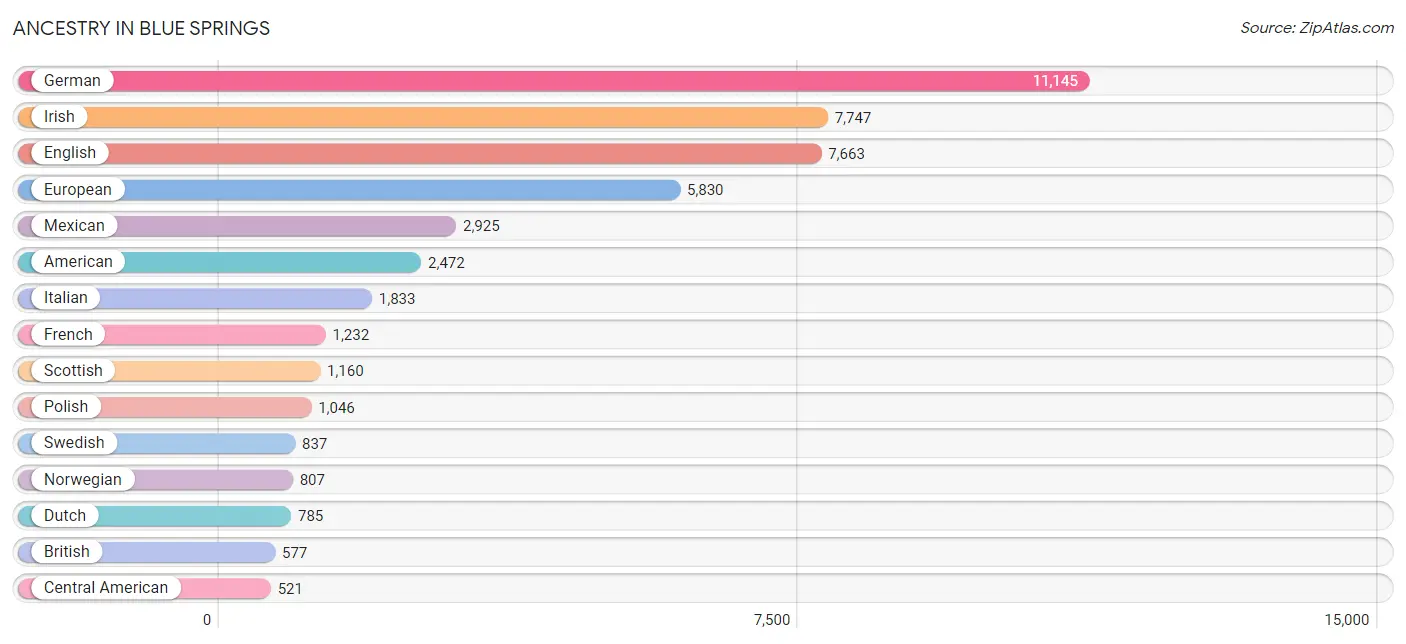
| Ancestry | # Population | % Population |
| Afghan | 11 | 0.0% |
| African | 119 | 0.2% |
| Alaska Native | 8 | 0.0% |
| American | 2,472 | 4.2% |
| Apache | 32 | 0.1% |
| Arab | 89 | 0.2% |
| Austrian | 23 | 0.0% |
| Belgian | 65 | 0.1% |
| Belizean | 4 | 0.0% |
| Bhutanese | 73 | 0.1% |
| Blackfeet | 17 | 0.0% |
| Bolivian | 16 | 0.0% |
| British | 577 | 1.0% |
| Burmese | 227 | 0.4% |
| Canadian | 48 | 0.1% |
| Central American | 521 | 0.9% |
| Central American Indian | 15 | 0.0% |
| Cherokee | 350 | 0.6% |
| Chickasaw | 25 | 0.0% |
| Choctaw | 129 | 0.2% |
| Colombian | 72 | 0.1% |
| Colville | 12 | 0.0% |
| Croatian | 74 | 0.1% |
| Cuban | 93 | 0.2% |
| Czech | 220 | 0.4% |
| Czechoslovakian | 87 | 0.2% |
| Danish | 194 | 0.3% |
| Delaware | 5 | 0.0% |
| Dominican | 33 | 0.1% |
| Dutch | 785 | 1.3% |
| Eastern European | 99 | 0.2% |
| Ecuadorian | 16 | 0.0% |
| English | 7,663 | 13.1% |
| European | 5,830 | 9.9% |
| Finnish | 174 | 0.3% |
| French | 1,232 | 2.1% |
| French Canadian | 229 | 0.4% |
| German | 11,145 | 19.0% |
| German Russian | 8 | 0.0% |
| Greek | 84 | 0.1% |
| Guamanian / Chamorro | 7 | 0.0% |
| Guatemalan | 15 | 0.0% |
| Honduran | 206 | 0.4% |
| Hungarian | 230 | 0.4% |
| Icelander | 8 | 0.0% |
| Indian (Asian) | 79 | 0.1% |
| Iranian | 8 | 0.0% |
| Iraqi | 79 | 0.1% |
| Irish | 7,747 | 13.2% |
| Iroquois | 7 | 0.0% |
| Italian | 1,833 | 3.1% |
| Jamaican | 11 | 0.0% |
| Japanese | 94 | 0.2% |
| Korean | 319 | 0.5% |
| Laotian | 5 | 0.0% |
| Lithuanian | 30 | 0.1% |
| Malaysian | 119 | 0.2% |
| Mexican | 2,925 | 5.0% |
| Moroccan | 10 | 0.0% |
| Native Hawaiian | 19 | 0.0% |
| Nigerian | 31 | 0.1% |
| Northern European | 26 | 0.0% |
| Norwegian | 807 | 1.4% |
| Pakistani | 18 | 0.0% |
| Panamanian | 56 | 0.1% |
| Peruvian | 33 | 0.1% |
| Polish | 1,046 | 1.8% |
| Portuguese | 32 | 0.1% |
| Puerto Rican | 234 | 0.4% |
| Romanian | 14 | 0.0% |
| Russian | 124 | 0.2% |
| Salvadoran | 244 | 0.4% |
| Samoan | 66 | 0.1% |
| Scandinavian | 96 | 0.2% |
| Scotch-Irish | 410 | 0.7% |
| Scottish | 1,160 | 2.0% |
| Sierra Leonean | 20 | 0.0% |
| Slovak | 18 | 0.0% |
| South American | 173 | 0.3% |
| Spaniard | 32 | 0.1% |
| Spanish | 69 | 0.1% |
| Sri Lankan | 131 | 0.2% |
| Subsaharan African | 182 | 0.3% |
| Swedish | 837 | 1.4% |
| Swiss | 119 | 0.2% |
| Thai | 62 | 0.1% |
| Trinidadian and Tobagonian | 26 | 0.0% |
| Ukrainian | 90 | 0.2% |
| Ute | 5 | 0.0% |
| Venezuelan | 36 | 0.1% |
| Welsh | 454 | 0.8% |
| Yugoslavian | 6 | 0.0% | View All 92 Rows |
Immigrants in Blue Springs
The most numerous immigrant groups reported in Blue Springs came from Latin America (578 | 1.0%), Central America (486 | 0.8%), Asia (422 | 0.7%), Mexico (308 | 0.5%), and Eastern Asia (156 | 0.3%), together accounting for 3.3% of all Blue Springs residents.
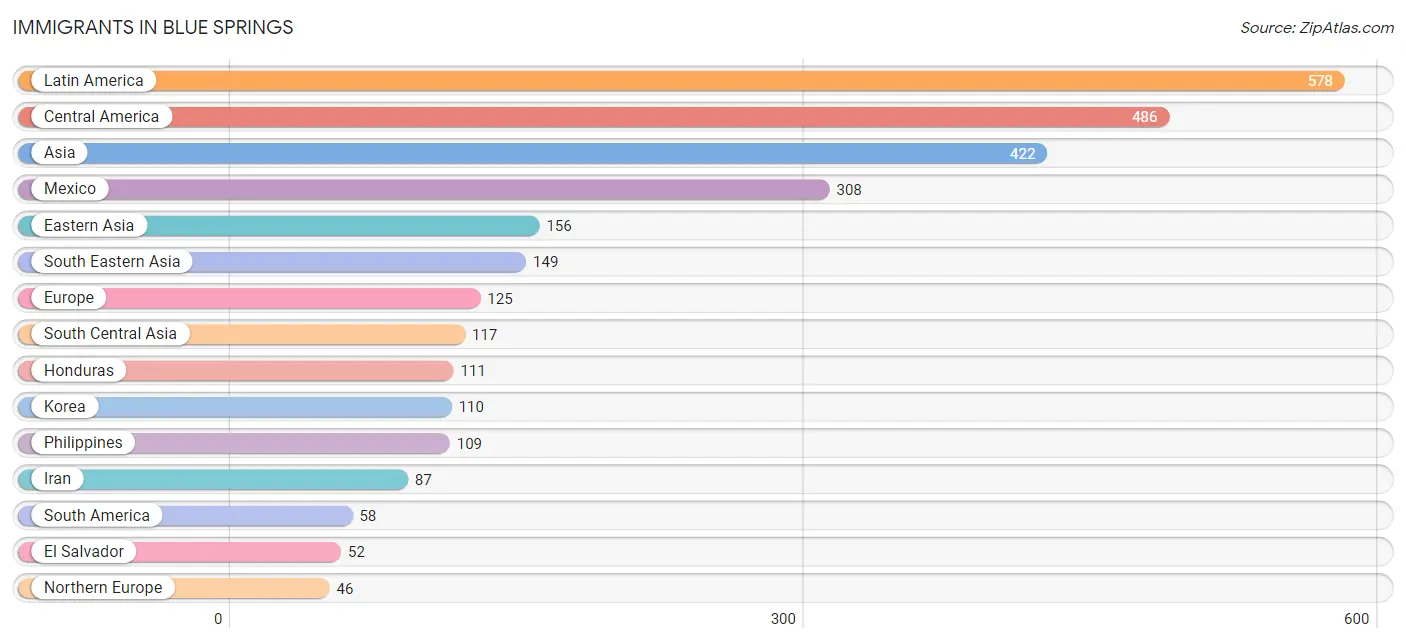
| Immigration Origin | # Population | % Population |
| Africa | 24 | 0.0% |
| Asia | 422 | 0.7% |
| Austria | 6 | 0.0% |
| Belize | 4 | 0.0% |
| Bolivia | 16 | 0.0% |
| Canada | 18 | 0.0% |
| Caribbean | 34 | 0.1% |
| Central America | 486 | 0.8% |
| China | 23 | 0.0% |
| Cuba | 19 | 0.0% |
| Dominican Republic | 4 | 0.0% |
| Eastern Asia | 156 | 0.3% |
| Eastern Europe | 38 | 0.1% |
| El Salvador | 52 | 0.1% |
| England | 29 | 0.1% |
| Europe | 125 | 0.2% |
| Germany | 35 | 0.1% |
| Guatemala | 11 | 0.0% |
| Honduras | 111 | 0.2% |
| India | 30 | 0.1% |
| Iran | 87 | 0.2% |
| Jamaica | 11 | 0.0% |
| Japan | 23 | 0.0% |
| Korea | 110 | 0.2% |
| Latin America | 578 | 1.0% |
| Mexico | 308 | 0.5% |
| Nigeria | 20 | 0.0% |
| Northern Europe | 46 | 0.1% |
| Oceania | 4 | 0.0% |
| Peru | 16 | 0.0% |
| Philippines | 109 | 0.2% |
| Romania | 14 | 0.0% |
| Sierra Leone | 4 | 0.0% |
| South America | 58 | 0.1% |
| South Central Asia | 117 | 0.2% |
| South Eastern Asia | 149 | 0.3% |
| Ukraine | 24 | 0.0% |
| Venezuela | 26 | 0.0% |
| Vietnam | 40 | 0.1% |
| Western Africa | 24 | 0.0% |
| Western Europe | 41 | 0.1% | View All 41 Rows |
Sex and Age in Blue Springs
Sex and Age in Blue Springs
The most populous age groups in Blue Springs are 5 to 9 Years (2,623 | 9.2%) for men and 10 to 14 Years (2,351 | 7.7%) for women.
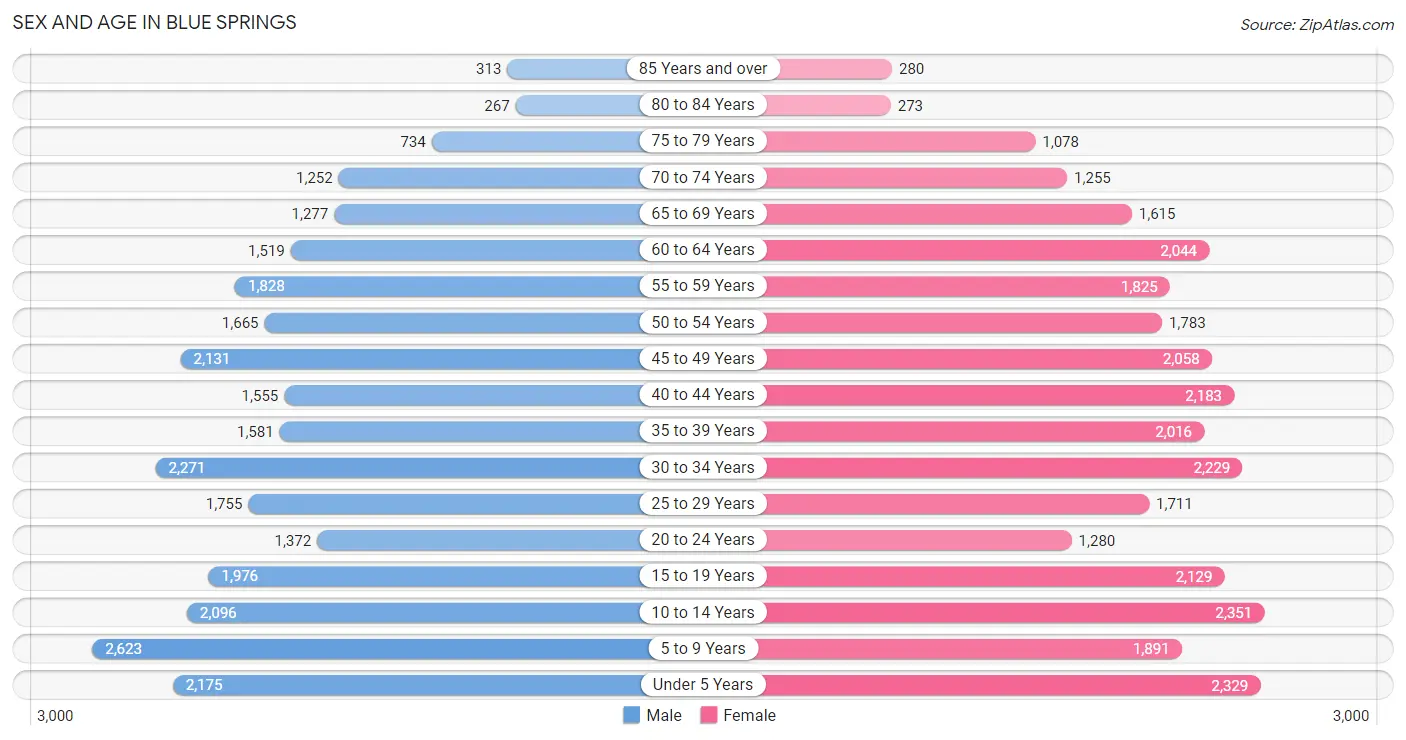
| Age Bracket | Male | Female |
| Under 5 Years | 2,175 (7.7%) | 2,329 (7.7%) |
| 5 to 9 Years | 2,623 (9.2%) | 1,891 (6.2%) |
| 10 to 14 Years | 2,096 (7.4%) | 2,351 (7.7%) |
| 15 to 19 Years | 1,976 (7.0%) | 2,129 (7.0%) |
| 20 to 24 Years | 1,372 (4.8%) | 1,280 (4.2%) |
| 25 to 29 Years | 1,755 (6.2%) | 1,711 (5.6%) |
| 30 to 34 Years | 2,271 (8.0%) | 2,229 (7.3%) |
| 35 to 39 Years | 1,581 (5.6%) | 2,016 (6.7%) |
| 40 to 44 Years | 1,555 (5.5%) | 2,183 (7.2%) |
| 45 to 49 Years | 2,131 (7.5%) | 2,058 (6.8%) |
| 50 to 54 Years | 1,665 (5.9%) | 1,783 (5.9%) |
| 55 to 59 Years | 1,828 (6.4%) | 1,825 (6.0%) |
| 60 to 64 Years | 1,519 (5.3%) | 2,044 (6.7%) |
| 65 to 69 Years | 1,277 (4.5%) | 1,615 (5.3%) |
| 70 to 74 Years | 1,252 (4.4%) | 1,255 (4.1%) |
| 75 to 79 Years | 734 (2.6%) | 1,078 (3.5%) |
| 80 to 84 Years | 267 (0.9%) | 273 (0.9%) |
| 85 Years and over | 313 (1.1%) | 280 (0.9%) |
| Total | 28,390 (100.0%) | 30,330 (100.0%) |
Families and Households in Blue Springs
Median Family Size in Blue Springs
The median family size in Blue Springs is 3.11 persons per family, with single male/father families (819 | 5.1%) accounting for the largest median family size of 3.28 persons per family. On the other hand, single female/mother families (3,221 | 19.9%) represent the smallest median family size with 2.89 persons per family.
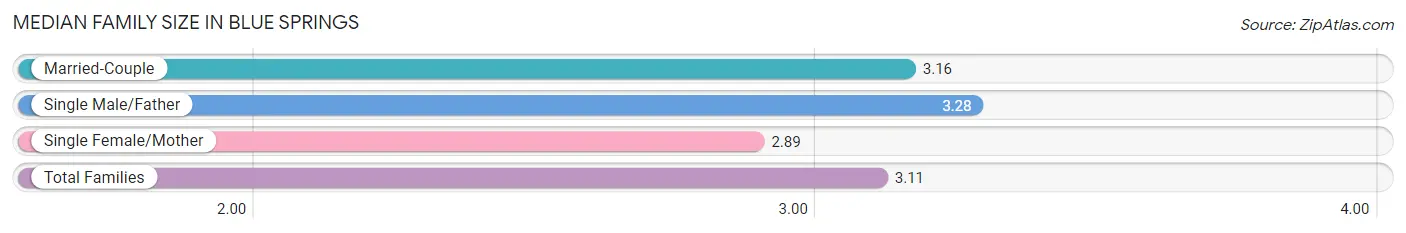
| Family Type | # Families | Family Size |
| Married-Couple | 12,117 (75.0%) | 3.16 |
| Single Male/Father | 819 (5.1%) | 3.28 |
| Single Female/Mother | 3,221 (19.9%) | 2.89 |
| Total Families | 16,157 (100.0%) | 3.11 |
Median Household Size in Blue Springs
The median household size in Blue Springs is 2.68 persons per household, with single male/father households (819 | 3.7%) accounting for the largest median household size of 3.63 persons per household. non-family households (5,707 | 26.1%) represent the smallest median household size with 1.25 persons per household.
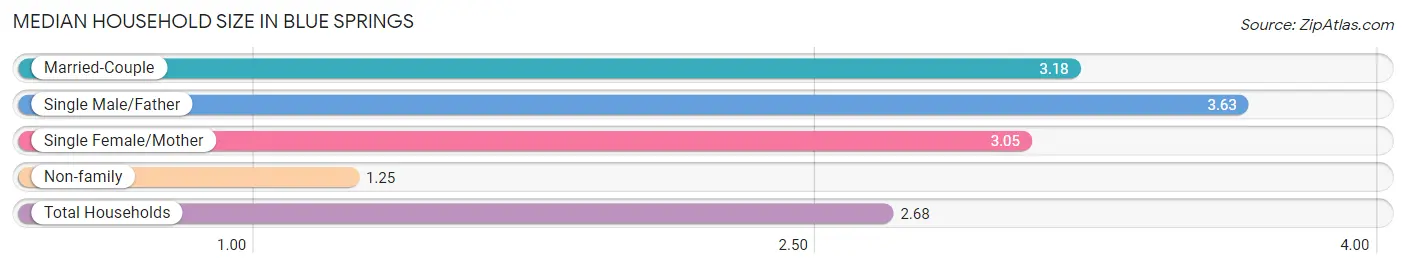
| Household Type | # Households | Household Size |
| Married-Couple | 12,117 (55.4%) | 3.18 |
| Single Male/Father | 819 (3.7%) | 3.63 |
| Single Female/Mother | 3,221 (14.7%) | 3.05 |
| Non-family | 5,707 (26.1%) | 1.25 |
| Total Households | 21,864 (100.0%) | 2.68 |
Household Size by Marriage Status in Blue Springs
Out of a total of 21,864 households in Blue Springs, 16,157 (73.9%) are family households, while 5,707 (26.1%) are nonfamily households. The most numerous type of family households are 2-person households, comprising 6,857, and the most common type of nonfamily households are 1-person households, comprising 4,686.
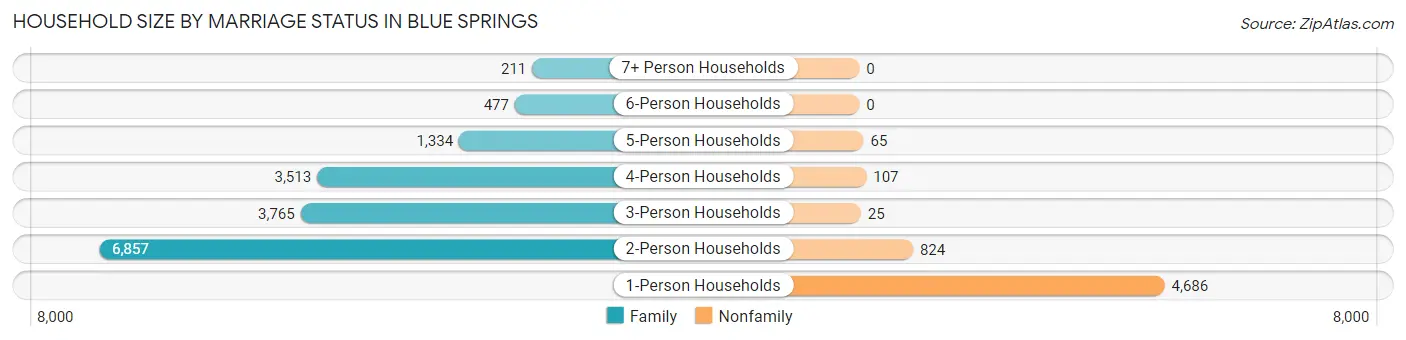
| Household Size | Family Households | Nonfamily Households |
| 1-Person Households | - | 4,686 (21.4%) |
| 2-Person Households | 6,857 (31.4%) | 824 (3.8%) |
| 3-Person Households | 3,765 (17.2%) | 25 (0.1%) |
| 4-Person Households | 3,513 (16.1%) | 107 (0.5%) |
| 5-Person Households | 1,334 (6.1%) | 65 (0.3%) |
| 6-Person Households | 477 (2.2%) | 0 (0.0%) |
| 7+ Person Households | 211 (1.0%) | 0 (0.0%) |
| Total | 16,157 (73.9%) | 5,707 (26.1%) |
Female Fertility in Blue Springs
Fertility by Age in Blue Springs
Average fertility rate in Blue Springs is 58.0 births per 1,000 women. Women in the age bracket of 20 to 34 years have the highest fertility rate with 118.0 births per 1,000 women. Women in the age bracket of 20 to 34 years acount for 75.2% of all women with births.
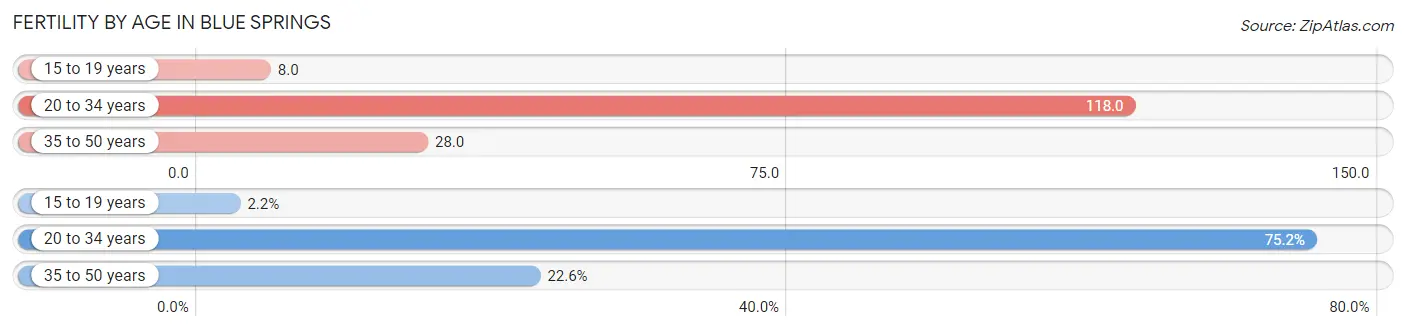
| Age Bracket | Women with Births | Births / 1,000 Women |
| 15 to 19 years | 18 (2.2%) | 8.0 |
| 20 to 34 years | 617 (75.2%) | 118.0 |
| 35 to 50 years | 185 (22.6%) | 28.0 |
| Total | 820 (100.0%) | 58.0 |
Fertility by Age by Marriage Status in Blue Springs
74.5% of women with births (820) in Blue Springs are married. The highest percentage of unmarried women with births falls into 15 to 19 years age bracket with 100.0% of them unmarried at the time of birth, while the lowest percentage of unmarried women with births belong to 35 to 50 years age bracket with 1.1% of them unmarried.
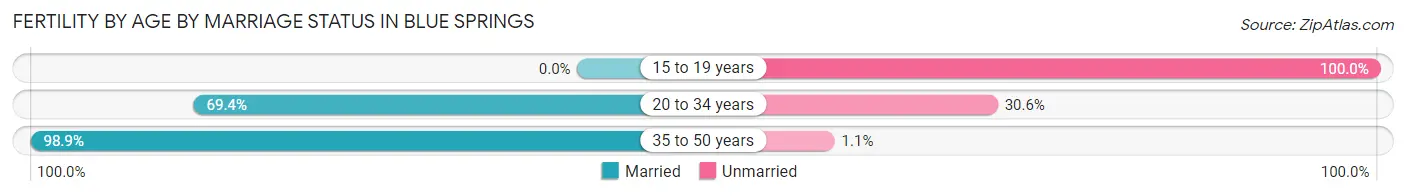
| Age Bracket | Married | Unmarried |
| 15 to 19 years | 0 (0.0%) | 18 (100.0%) |
| 20 to 34 years | 428 (69.4%) | 189 (30.6%) |
| 35 to 50 years | 183 (98.9%) | 2 (1.1%) |
| Total | 611 (74.5%) | 209 (25.5%) |
Fertility by Education in Blue Springs
Average fertility rate in Blue Springs is 58.0 births per 1,000 women. Women with the education attainment of bachelor's degree have the highest fertility rate of 103.0 births per 1,000 women, while women with the education attainment of less than high school have the lowest fertility at 16.0 births per 1,000 women. Women with the education attainment of college or associate's degree represent 37.8% of all women with births.
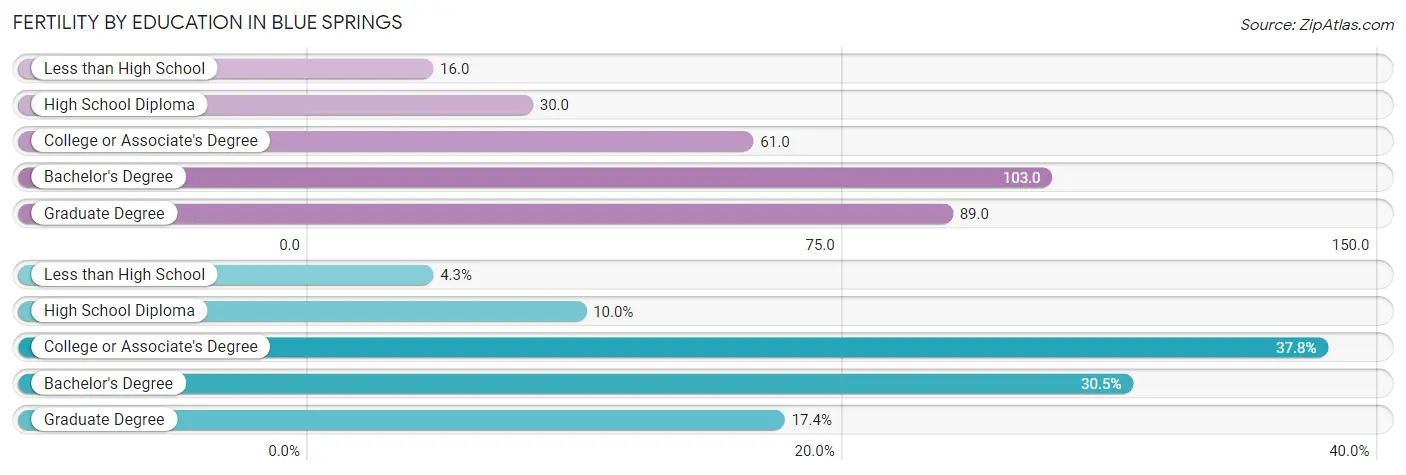
| Educational Attainment | Women with Births | Births / 1,000 Women |
| Less than High School | 35 (4.3%) | 16.0 |
| High School Diploma | 82 (10.0%) | 30.0 |
| College or Associate's Degree | 310 (37.8%) | 61.0 |
| Bachelor's Degree | 250 (30.5%) | 103.0 |
| Graduate Degree | 143 (17.4%) | 89.0 |
| Total | 820 (100.0%) | 58.0 |
Fertility by Education by Marriage Status in Blue Springs
25.5% of women with births in Blue Springs are unmarried. Women with the educational attainment of graduate degree are most likely to be married with 100.0% of them married at childbirth, while women with the educational attainment of high school diploma are least likely to be married with 87.8% of them unmarried at childbirth.
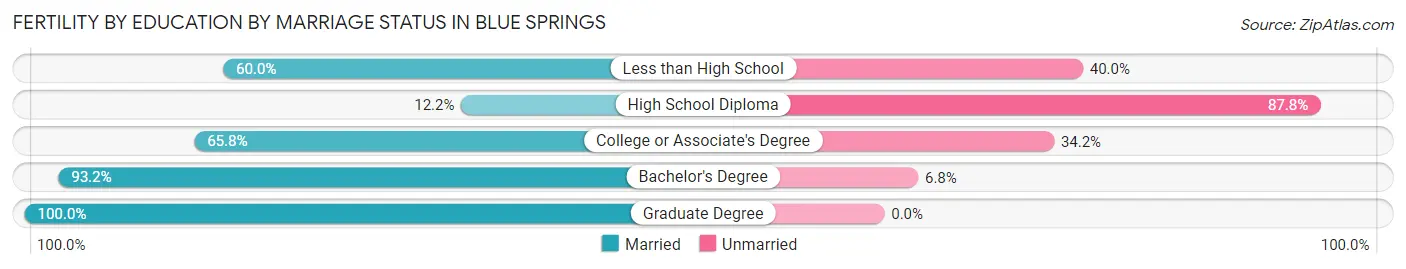
| Educational Attainment | Married | Unmarried |
| Less than High School | 21 (60.0%) | 14 (40.0%) |
| High School Diploma | 10 (12.2%) | 72 (87.8%) |
| College or Associate's Degree | 204 (65.8%) | 106 (34.2%) |
| Bachelor's Degree | 233 (93.2%) | 17 (6.8%) |
| Graduate Degree | 143 (100.0%) | 0 (0.0%) |
| Total | 611 (74.5%) | 209 (25.5%) |
Employment Characteristics in Blue Springs
Employment by Class of Employer in Blue Springs
Among the 28,948 employed individuals in Blue Springs, private company employees (19,707 | 68.1%), not-for-profit organizations (2,151 | 7.4%), and local government employees (2,134 | 7.4%) make up the most common classes of employment.
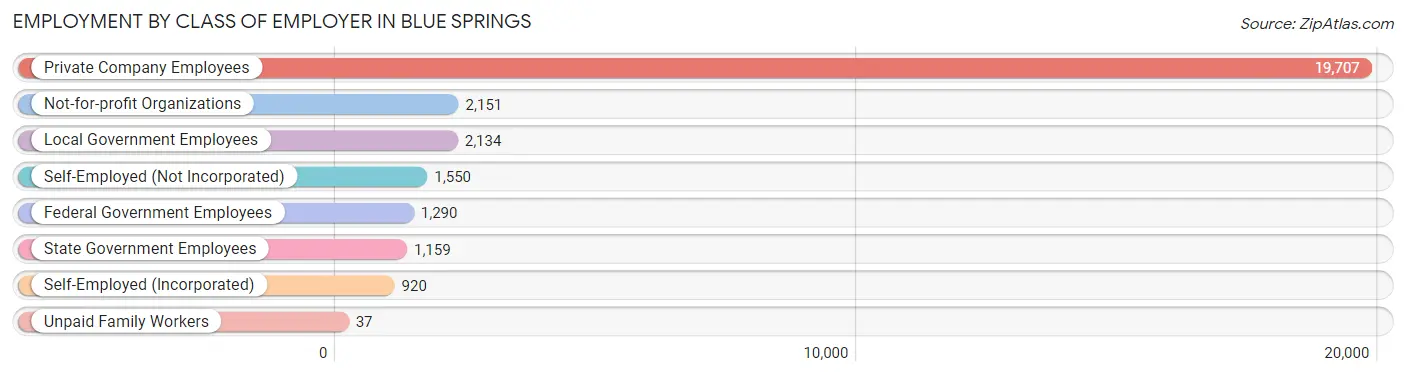
| Employer Class | # Employees | % Employees |
| Private Company Employees | 19,707 | 68.1% |
| Self-Employed (Incorporated) | 920 | 3.2% |
| Self-Employed (Not Incorporated) | 1,550 | 5.3% |
| Not-for-profit Organizations | 2,151 | 7.4% |
| Local Government Employees | 2,134 | 7.4% |
| State Government Employees | 1,159 | 4.0% |
| Federal Government Employees | 1,290 | 4.5% |
| Unpaid Family Workers | 37 | 0.1% |
| Total | 28,948 | 100.0% |
Employment Status by Age in Blue Springs
According to the labor force statistics for Blue Springs, out of the total population over 16 years of age (44,232), 69.7% or 30,830 individuals are in the labor force, with 4.0% or 1,233 of them unemployed. The age group with the highest labor force participation rate is 35 to 44 years, with 91.4% or 6,704 individuals in the labor force. Within the labor force, the 16 to 19 years age range has the highest percentage of unemployed individuals, with 8.8% or 166 of them being unemployed.
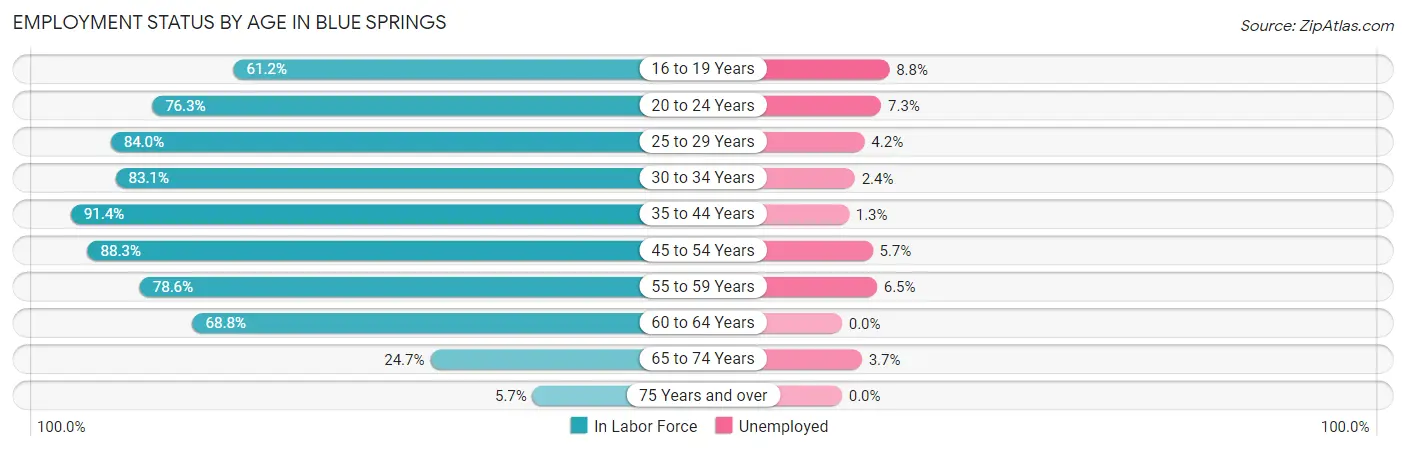
| Age Bracket | In Labor Force | Unemployed |
| 16 to 19 Years | 1,886 (61.2%) | 166 (8.8%) |
| 20 to 24 Years | 2,023 (76.3%) | 148 (7.3%) |
| 25 to 29 Years | 2,911 (84.0%) | 122 (4.2%) |
| 30 to 34 Years | 3,740 (83.1%) | 90 (2.4%) |
| 35 to 44 Years | 6,704 (91.4%) | 87 (1.3%) |
| 45 to 54 Years | 6,743 (88.3%) | 384 (5.7%) |
| 55 to 59 Years | 2,871 (78.6%) | 187 (6.5%) |
| 60 to 64 Years | 2,451 (68.8%) | 0 (0.0%) |
| 65 to 74 Years | 1,334 (24.7%) | 49 (3.7%) |
| 75 Years and over | 168 (5.7%) | 0 (0.0%) |
| Total | 30,830 (69.7%) | 1,233 (4.0%) |
Employment Status by Educational Attainment in Blue Springs
According to labor force statistics for Blue Springs, 84.3% of individuals (25,420) out of the total population between 25 and 64 years of age (30,154) are in the labor force, with 3.4% or 864 of them being unemployed. The group with the highest labor force participation rate are those with the educational attainment of bachelor's degree or higher, with 88.5% or 9,615 individuals in the labor force. Within the labor force, individuals with bachelor's degree or higher education have the highest percentage of unemployment, with 4.0% or 385 of them being unemployed.
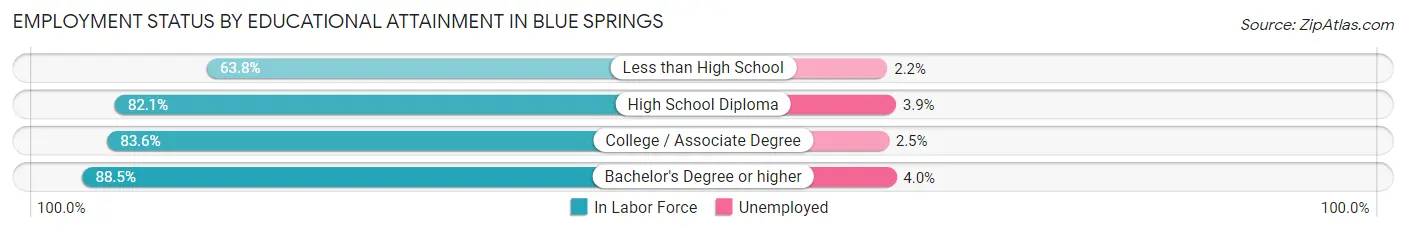
| Educational Attainment | In Labor Force | Unemployed |
| Less than High School | 646 (63.8%) | 22 (2.2%) |
| High School Diploma | 6,415 (82.1%) | 305 (3.9%) |
| College / Associate Degree | 8,748 (83.6%) | 262 (2.5%) |
| Bachelor's Degree or higher | 9,615 (88.5%) | 435 (4.0%) |
| Total | 25,420 (84.3%) | 1,025 (3.4%) |
Employment Occupations by Sex in Blue Springs
Management, Business, Science and Arts Occupations
The most common Management, Business, Science and Arts occupations in Blue Springs are Management (3,198 | 10.8%), Community & Social Service (2,518 | 8.5%), Health Diagnosing & Treating (1,884 | 6.4%), Business & Financial (1,816 | 6.1%), and Education Instruction & Library (1,711 | 5.8%).
Management, Business, Science and Arts Occupations by Sex
Within the Management, Business, Science and Arts occupations in Blue Springs, the most male-oriented occupations are Computers & Mathematics (83.2%), Computers, Engineering & Science (78.4%), and Architecture & Engineering (76.3%), while the most female-oriented occupations are Legal Services & Support (85.9%), Health Technologists (81.2%), and Health Diagnosing & Treating (80.5%).
| Occupation | Male | Female |
| Management | 1,536 (48.0%) | 1,662 (52.0%) |
| Business & Financial | 672 (37.0%) | 1,144 (63.0%) |
| Computers, Engineering & Science | 1,223 (78.4%) | 337 (21.6%) |
| Computers & Mathematics | 686 (83.2%) | 139 (16.9%) |
| Architecture & Engineering | 479 (76.3%) | 149 (23.7%) |
| Life, Physical & Social Science | 58 (54.2%) | 49 (45.8%) |
| Community & Social Service | 752 (29.9%) | 1,766 (70.1%) |
| Education, Arts & Media | 161 (46.5%) | 185 (53.5%) |
| Legal Services & Support | 38 (14.1%) | 231 (85.9%) |
| Education Instruction & Library | 439 (25.7%) | 1,272 (74.3%) |
| Arts, Media & Entertainment | 114 (59.4%) | 78 (40.6%) |
| Health Diagnosing & Treating | 367 (19.5%) | 1,517 (80.5%) |
| Health Technologists | 212 (18.8%) | 914 (81.2%) |
| Total (Category) | 4,550 (41.4%) | 6,426 (58.6%) |
| Total (Overall) | 14,576 (49.3%) | 14,986 (50.7%) |
Services Occupations
The most common Services occupations in Blue Springs are Food Preparation & Serving (1,445 | 4.9%), Healthcare Support (967 | 3.3%), Cleaning & Maintenance (958 | 3.2%), Security & Protection (851 | 2.9%), and Personal Care & Service (677 | 2.3%).
Services Occupations by Sex
Within the Services occupations in Blue Springs, the most male-oriented occupations are Law Enforcement (83.2%), Security & Protection (76.6%), and Cleaning & Maintenance (73.9%), while the most female-oriented occupations are Healthcare Support (91.7%), Personal Care & Service (88.3%), and Food Preparation & Serving (56.3%).
| Occupation | Male | Female |
| Healthcare Support | 80 (8.3%) | 887 (91.7%) |
| Security & Protection | 652 (76.6%) | 199 (23.4%) |
| Firefighting & Prevention | 286 (69.6%) | 125 (30.4%) |
| Law Enforcement | 366 (83.2%) | 74 (16.8%) |
| Food Preparation & Serving | 632 (43.7%) | 813 (56.3%) |
| Cleaning & Maintenance | 708 (73.9%) | 250 (26.1%) |
| Personal Care & Service | 79 (11.7%) | 598 (88.3%) |
| Total (Category) | 2,151 (43.9%) | 2,747 (56.1%) |
| Total (Overall) | 14,576 (49.3%) | 14,986 (50.7%) |
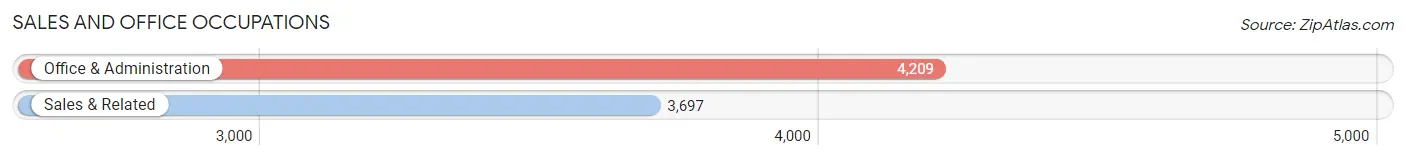
Sales and Office Occupations
The most common Sales and Office occupations in Blue Springs are Office & Administration (4,209 | 14.2%), and Sales & Related (3,697 | 12.5%).
Sales and Office Occupations by Sex
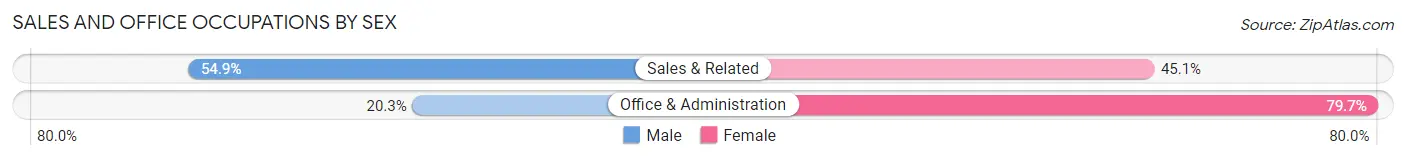
| Occupation | Male | Female |
| Sales & Related | 2,028 (54.9%) | 1,669 (45.1%) |
| Office & Administration | 855 (20.3%) | 3,354 (79.7%) |
| Total (Category) | 2,883 (36.5%) | 5,023 (63.5%) |
| Total (Overall) | 14,576 (49.3%) | 14,986 (50.7%) |
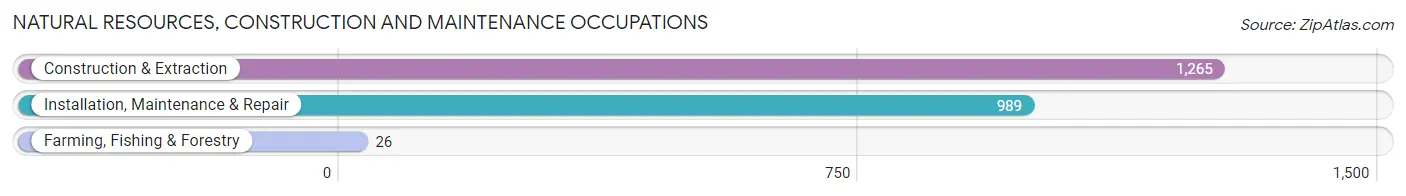
Natural Resources, Construction and Maintenance Occupations
The most common Natural Resources, Construction and Maintenance occupations in Blue Springs are Construction & Extraction (1,265 | 4.3%), Installation, Maintenance & Repair (989 | 3.4%), and Farming, Fishing & Forestry (26 | 0.1%).
Natural Resources, Construction and Maintenance Occupations by Sex
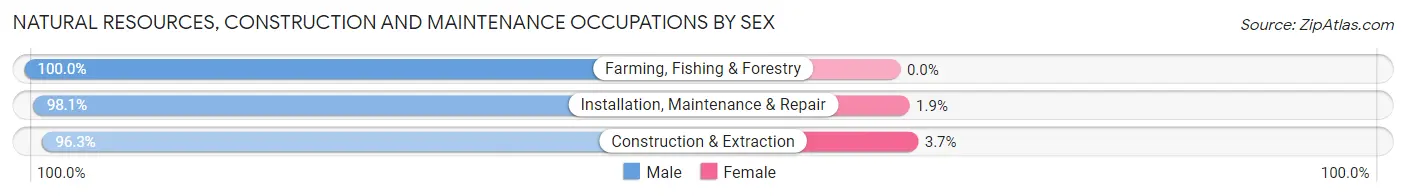
| Occupation | Male | Female |
| Farming, Fishing & Forestry | 26 (100.0%) | 0 (0.0%) |
| Construction & Extraction | 1,218 (96.3%) | 47 (3.7%) |
| Installation, Maintenance & Repair | 970 (98.1%) | 19 (1.9%) |
| Total (Category) | 2,214 (97.1%) | 66 (2.9%) |
| Total (Overall) | 14,576 (49.3%) | 14,986 (50.7%) |
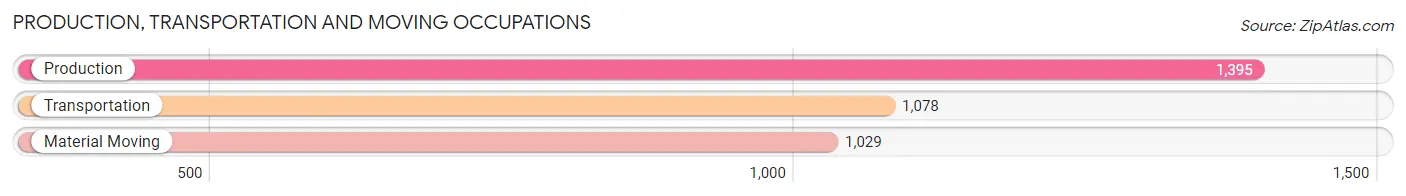
Production, Transportation and Moving Occupations
The most common Production, Transportation and Moving occupations in Blue Springs are Production (1,395 | 4.7%), Transportation (1,078 | 3.6%), and Material Moving (1,029 | 3.5%).
Production, Transportation and Moving Occupations by Sex
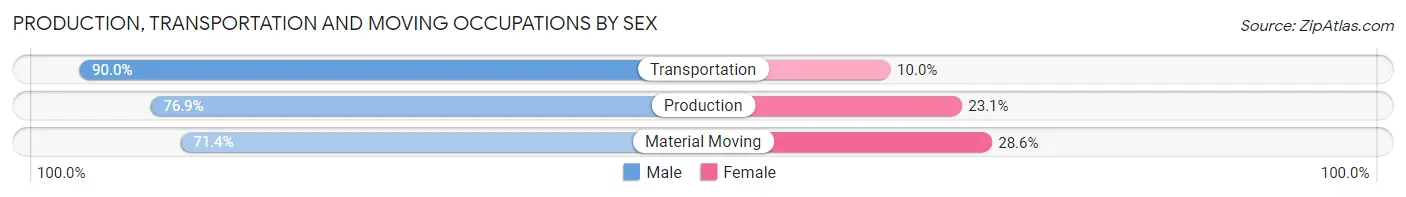
| Occupation | Male | Female |
| Production | 1,073 (76.9%) | 322 (23.1%) |
| Transportation | 970 (90.0%) | 108 (10.0%) |
| Material Moving | 735 (71.4%) | 294 (28.6%) |
| Total (Category) | 2,778 (79.3%) | 724 (20.7%) |
| Total (Overall) | 14,576 (49.3%) | 14,986 (50.7%) |
Employment Industries by Sex in Blue Springs
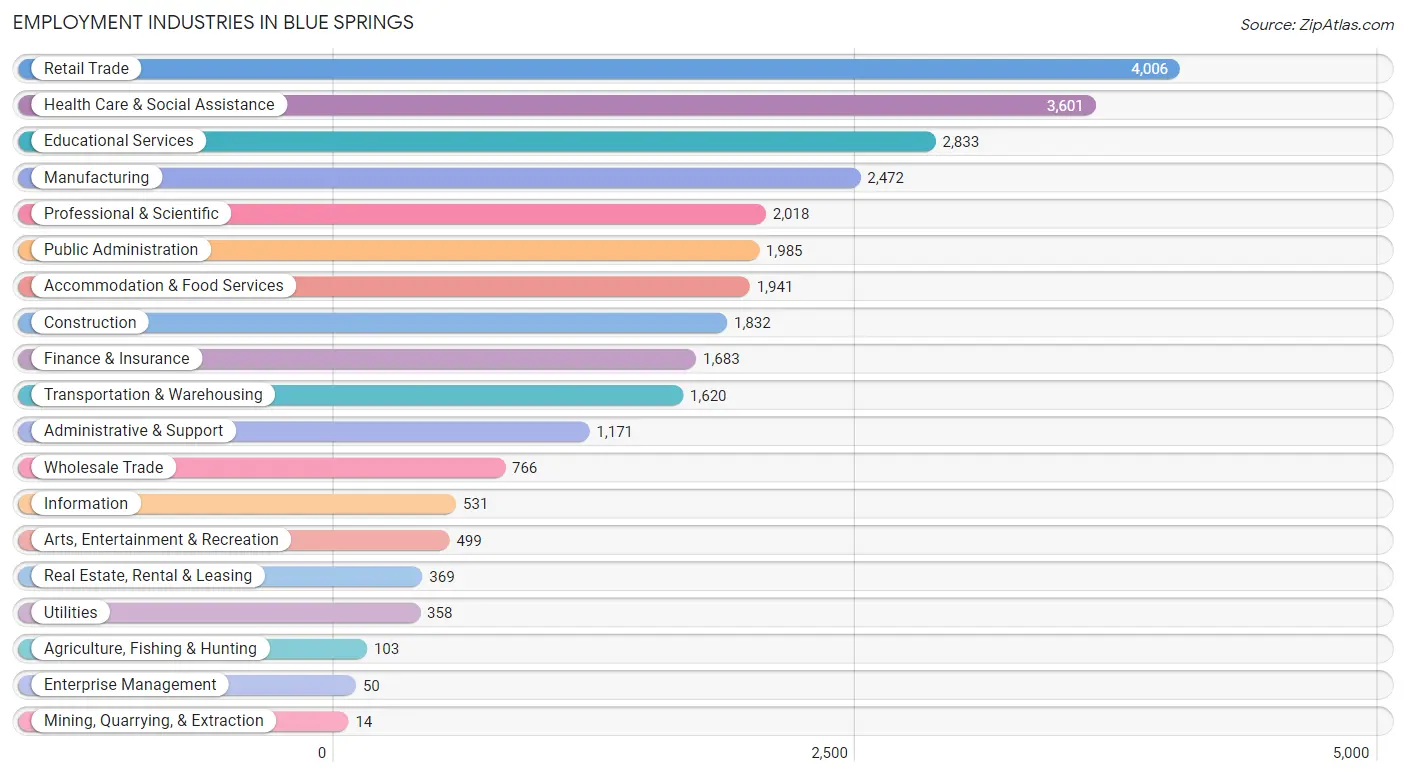
Employment Industries in Blue Springs
The major employment industries in Blue Springs include Retail Trade (4,006 | 13.6%), Health Care & Social Assistance (3,601 | 12.2%), Educational Services (2,833 | 9.6%), Manufacturing (2,472 | 8.4%), and Professional & Scientific (2,018 | 6.8%).
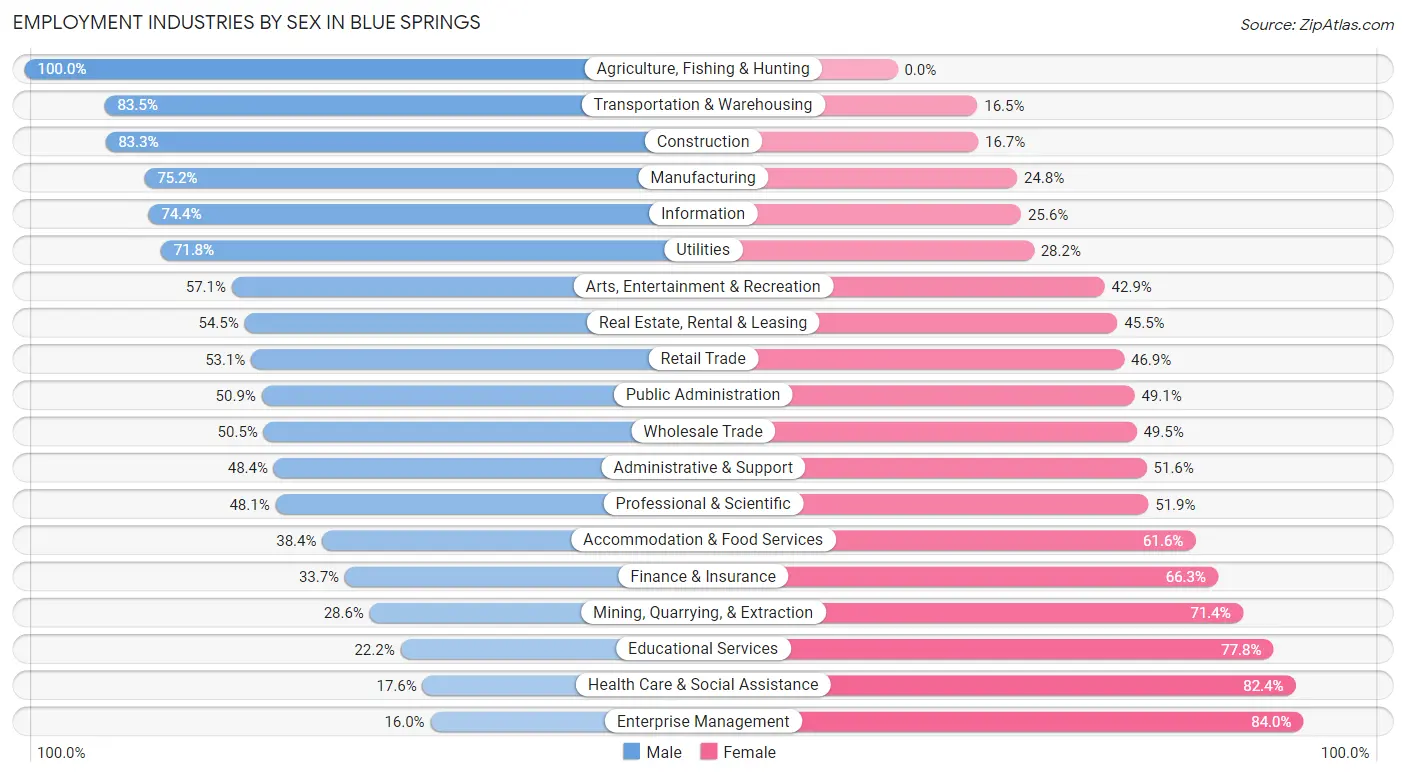
Employment Industries by Sex in Blue Springs
The Blue Springs industries that see more men than women are Agriculture, Fishing & Hunting (100.0%), Transportation & Warehousing (83.5%), and Construction (83.3%), whereas the industries that tend to have a higher number of women are Enterprise Management (84.0%), Health Care & Social Assistance (82.4%), and Educational Services (77.8%).
| Industry | Male | Female |
| Agriculture, Fishing & Hunting | 103 (100.0%) | 0 (0.0%) |
| Mining, Quarrying, & Extraction | 4 (28.6%) | 10 (71.4%) |
| Construction | 1,526 (83.3%) | 306 (16.7%) |
| Manufacturing | 1,860 (75.2%) | 612 (24.8%) |
| Wholesale Trade | 387 (50.5%) | 379 (49.5%) |
| Retail Trade | 2,127 (53.1%) | 1,879 (46.9%) |
| Transportation & Warehousing | 1,352 (83.5%) | 268 (16.5%) |
| Utilities | 257 (71.8%) | 101 (28.2%) |
| Information | 395 (74.4%) | 136 (25.6%) |
| Finance & Insurance | 567 (33.7%) | 1,116 (66.3%) |
| Real Estate, Rental & Leasing | 201 (54.5%) | 168 (45.5%) |
| Professional & Scientific | 970 (48.1%) | 1,048 (51.9%) |
| Enterprise Management | 8 (16.0%) | 42 (84.0%) |
| Administrative & Support | 567 (48.4%) | 604 (51.6%) |
| Educational Services | 629 (22.2%) | 2,204 (77.8%) |
| Health Care & Social Assistance | 635 (17.6%) | 2,966 (82.4%) |
| Arts, Entertainment & Recreation | 285 (57.1%) | 214 (42.9%) |
| Accommodation & Food Services | 745 (38.4%) | 1,196 (61.6%) |
| Public Administration | 1,011 (50.9%) | 974 (49.1%) |
| Total | 14,576 (49.3%) | 14,986 (50.7%) |
Education in Blue Springs
School Enrollment in Blue Springs
The most common levels of schooling among the 15,431 students in Blue Springs are high school (3,574 | 23.2%), middle school (3,499 | 22.7%), and elementary school (3,459 | 22.4%).
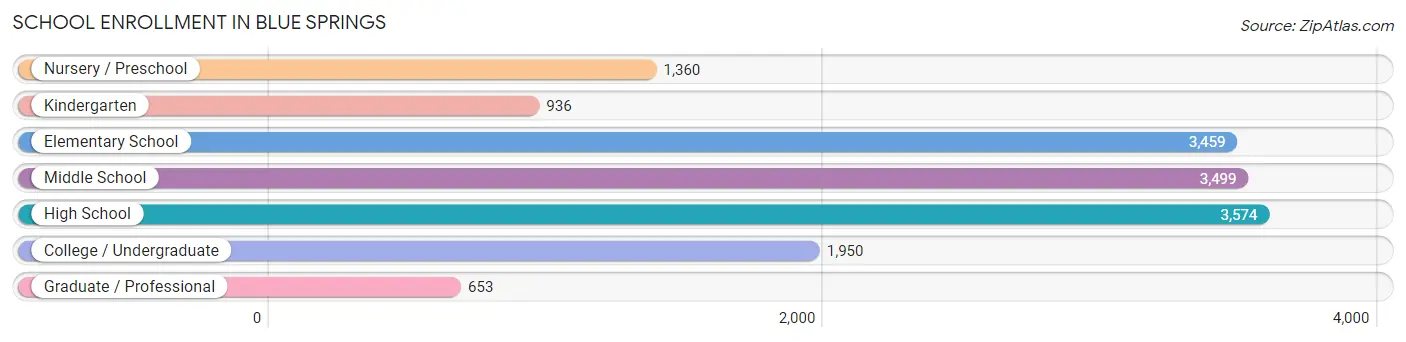
| School Level | # Students | % Students |
| Nursery / Preschool | 1,360 | 8.8% |
| Kindergarten | 936 | 6.1% |
| Elementary School | 3,459 | 22.4% |
| Middle School | 3,499 | 22.7% |
| High School | 3,574 | 23.2% |
| College / Undergraduate | 1,950 | 12.6% |
| Graduate / Professional | 653 | 4.2% |
| Total | 15,431 | 100.0% |
School Enrollment by Age by Funding Source in Blue Springs
Out of a total of 15,431 students who are enrolled in schools in Blue Springs, 1,435 (9.3%) attend a private institution, while the remaining 13,996 (90.7%) are enrolled in public schools. The age group of 3 to 4 year olds has the highest likelihood of being enrolled in private schools, with 343 (37.0% in the age bracket) enrolled. Conversely, the age group of 18 to 19 year olds has the lowest likelihood of being enrolled in a private school, with 848 (96.6% in the age bracket) attending a public institution.
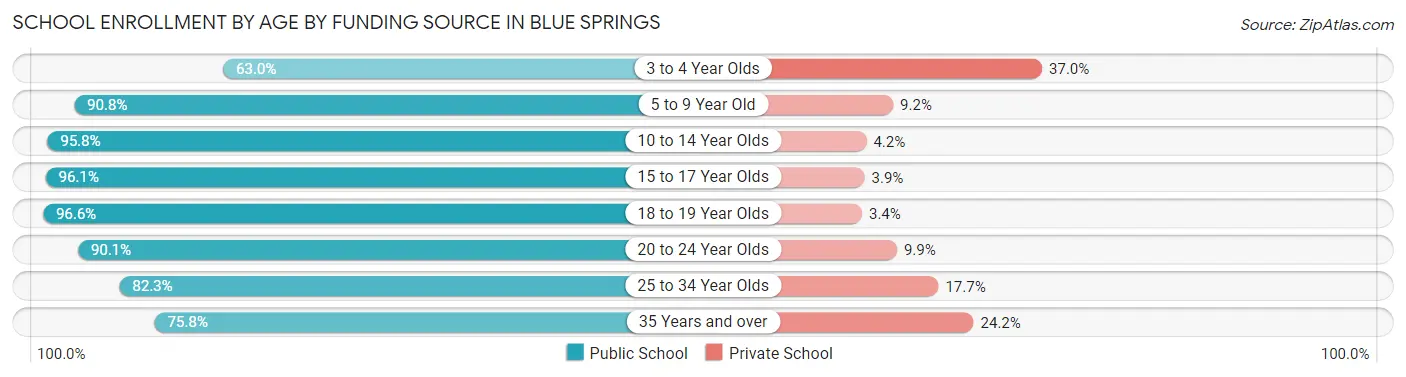
| Age Bracket | Public School | Private School |
| 3 to 4 Year Olds | 585 (63.0%) | 343 (37.0%) |
| 5 to 9 Year Old | 3,890 (90.8%) | 395 (9.2%) |
| 10 to 14 Year Olds | 3,996 (95.8%) | 177 (4.2%) |
| 15 to 17 Year Olds | 2,713 (96.1%) | 110 (3.9%) |
| 18 to 19 Year Olds | 848 (96.6%) | 30 (3.4%) |
| 20 to 24 Year Olds | 934 (90.1%) | 103 (9.9%) |
| 25 to 34 Year Olds | 457 (82.3%) | 98 (17.7%) |
| 35 Years and over | 570 (75.8%) | 182 (24.2%) |
| Total | 13,996 (90.7%) | 1,435 (9.3%) |
Educational Attainment by Field of Study in Blue Springs
Business (3,805 | 26.7%), education (2,198 | 15.4%), science & technology (1,535 | 10.8%), arts & humanities (1,365 | 9.6%), and psychology (714 | 5.0%) are the most common fields of study among 14,241 individuals in Blue Springs who have obtained a bachelor's degree or higher.
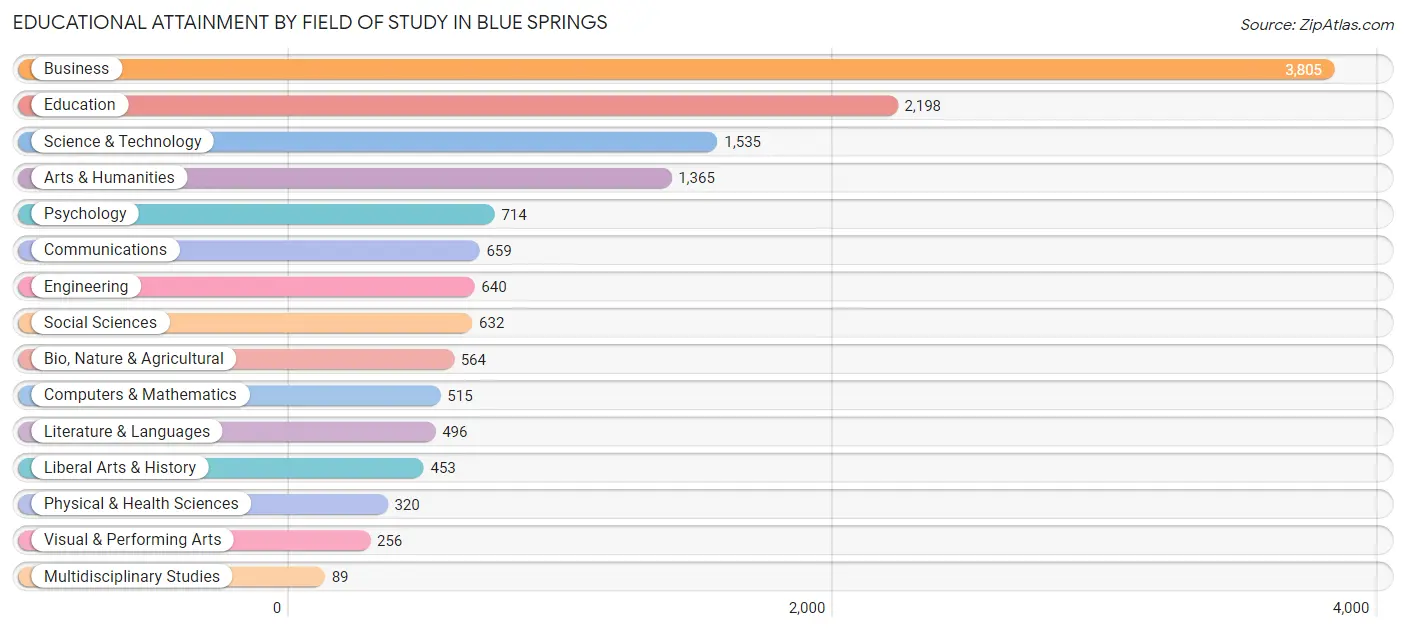
| Field of Study | # Graduates | % Graduates |
| Computers & Mathematics | 515 | 3.6% |
| Bio, Nature & Agricultural | 564 | 4.0% |
| Physical & Health Sciences | 320 | 2.2% |
| Psychology | 714 | 5.0% |
| Social Sciences | 632 | 4.4% |
| Engineering | 640 | 4.5% |
| Multidisciplinary Studies | 89 | 0.6% |
| Science & Technology | 1,535 | 10.8% |
| Business | 3,805 | 26.7% |
| Education | 2,198 | 15.4% |
| Literature & Languages | 496 | 3.5% |
| Liberal Arts & History | 453 | 3.2% |
| Visual & Performing Arts | 256 | 1.8% |
| Communications | 659 | 4.6% |
| Arts & Humanities | 1,365 | 9.6% |
| Total | 14,241 | 100.0% |
Transportation & Commute in Blue Springs
Vehicle Availability by Sex in Blue Springs
The most prevalent vehicle ownership categories in Blue Springs are males with 2 vehicles (6,396, accounting for 44.2%) and females with 2 vehicles (6,280, making up 44.2%).
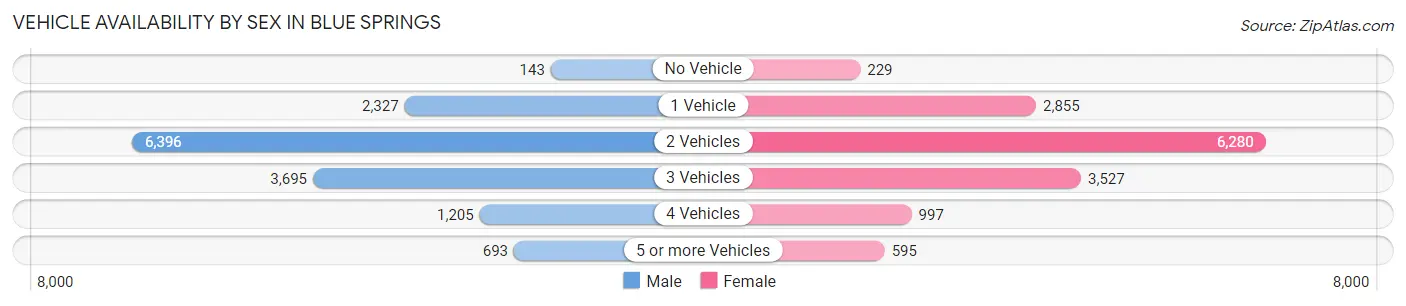
| Vehicles Available | Male | Female |
| No Vehicle | 143 (1.0%) | 229 (1.6%) |
| 1 Vehicle | 2,327 (16.1%) | 2,855 (19.7%) |
| 2 Vehicles | 6,396 (44.2%) | 6,280 (43.4%) |
| 3 Vehicles | 3,695 (25.6%) | 3,527 (24.3%) |
| 4 Vehicles | 1,205 (8.3%) | 997 (6.9%) |
| 5 or more Vehicles | 693 (4.8%) | 595 (4.1%) |
| Total | 14,459 (100.0%) | 14,483 (100.0%) |
Commute Time in Blue Springs
The most frequently occuring commute durations in Blue Springs are 30 to 34 minutes (4,251 commuters, 16.6%), 15 to 19 minutes (3,785 commuters, 14.7%), and 10 to 14 minutes (3,138 commuters, 12.2%).
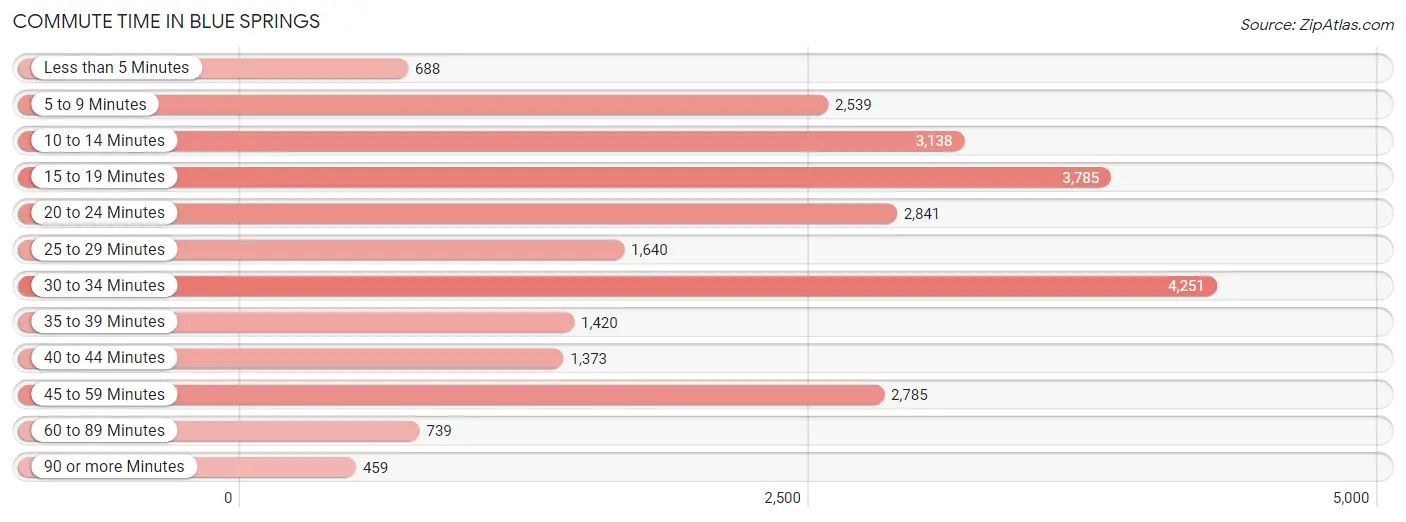
| Commute Time | # Commuters | % Commuters |
| Less than 5 Minutes | 688 | 2.7% |
| 5 to 9 Minutes | 2,539 | 9.9% |
| 10 to 14 Minutes | 3,138 | 12.2% |
| 15 to 19 Minutes | 3,785 | 14.7% |
| 20 to 24 Minutes | 2,841 | 11.1% |
| 25 to 29 Minutes | 1,640 | 6.4% |
| 30 to 34 Minutes | 4,251 | 16.6% |
| 35 to 39 Minutes | 1,420 | 5.5% |
| 40 to 44 Minutes | 1,373 | 5.3% |
| 45 to 59 Minutes | 2,785 | 10.8% |
| 60 to 89 Minutes | 739 | 2.9% |
| 90 or more Minutes | 459 | 1.8% |
Commute Time by Sex in Blue Springs
The most common commute times in Blue Springs are 30 to 34 minutes (2,520 commuters, 19.1%) for males and 15 to 19 minutes (2,030 commuters, 16.3%) for females.
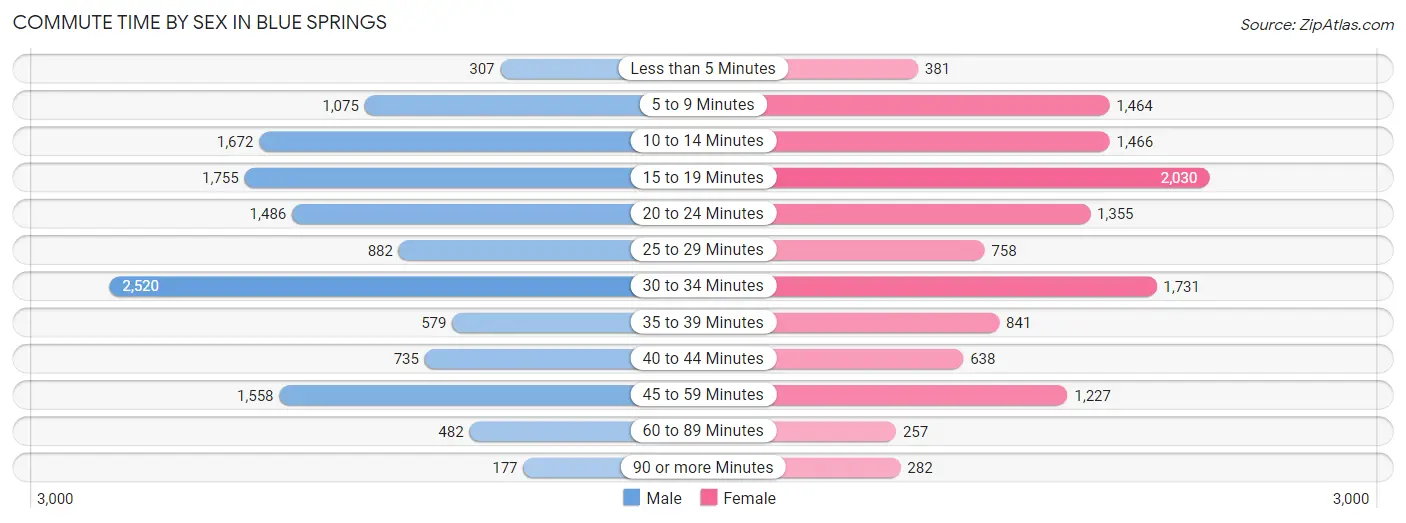
| Commute Time | Male | Female |
| Less than 5 Minutes | 307 (2.3%) | 381 (3.1%) |
| 5 to 9 Minutes | 1,075 (8.1%) | 1,464 (11.8%) |
| 10 to 14 Minutes | 1,672 (12.6%) | 1,466 (11.8%) |
| 15 to 19 Minutes | 1,755 (13.3%) | 2,030 (16.3%) |
| 20 to 24 Minutes | 1,486 (11.2%) | 1,355 (10.9%) |
| 25 to 29 Minutes | 882 (6.7%) | 758 (6.1%) |
| 30 to 34 Minutes | 2,520 (19.1%) | 1,731 (13.9%) |
| 35 to 39 Minutes | 579 (4.4%) | 841 (6.8%) |
| 40 to 44 Minutes | 735 (5.6%) | 638 (5.1%) |
| 45 to 59 Minutes | 1,558 (11.8%) | 1,227 (9.9%) |
| 60 to 89 Minutes | 482 (3.6%) | 257 (2.1%) |
| 90 or more Minutes | 177 (1.3%) | 282 (2.3%) |
Time of Departure to Work by Sex in Blue Springs
The most frequent times of departure to work in Blue Springs are 7:00 AM to 7:29 AM (1,805, 13.7%) for males and 7:00 AM to 7:29 AM (2,470, 19.9%) for females.
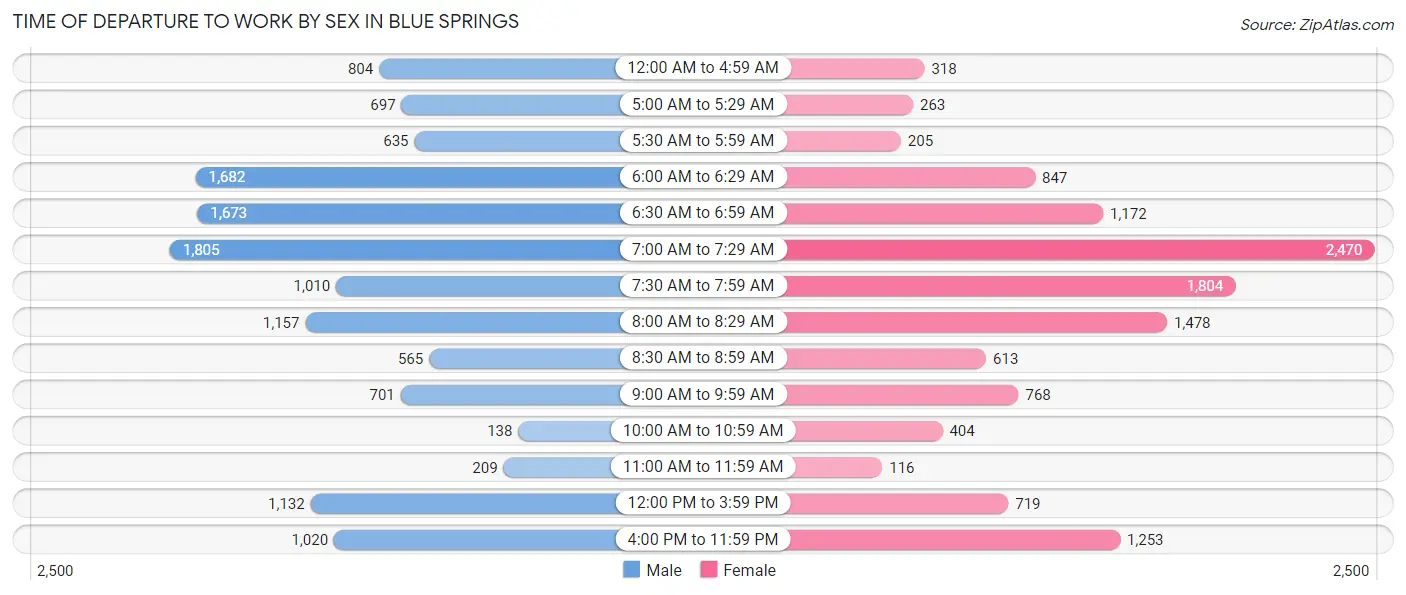
| Time of Departure | Male | Female |
| 12:00 AM to 4:59 AM | 804 (6.1%) | 318 (2.6%) |
| 5:00 AM to 5:29 AM | 697 (5.3%) | 263 (2.1%) |
| 5:30 AM to 5:59 AM | 635 (4.8%) | 205 (1.7%) |
| 6:00 AM to 6:29 AM | 1,682 (12.7%) | 847 (6.8%) |
| 6:30 AM to 6:59 AM | 1,673 (12.7%) | 1,172 (9.4%) |
| 7:00 AM to 7:29 AM | 1,805 (13.7%) | 2,470 (19.9%) |
| 7:30 AM to 7:59 AM | 1,010 (7.6%) | 1,804 (14.5%) |
| 8:00 AM to 8:29 AM | 1,157 (8.7%) | 1,478 (11.9%) |
| 8:30 AM to 8:59 AM | 565 (4.3%) | 613 (4.9%) |
| 9:00 AM to 9:59 AM | 701 (5.3%) | 768 (6.2%) |
| 10:00 AM to 10:59 AM | 138 (1.0%) | 404 (3.3%) |
| 11:00 AM to 11:59 AM | 209 (1.6%) | 116 (0.9%) |
| 12:00 PM to 3:59 PM | 1,132 (8.6%) | 719 (5.8%) |
| 4:00 PM to 11:59 PM | 1,020 (7.7%) | 1,253 (10.1%) |
| Total | 13,228 (100.0%) | 12,430 (100.0%) |
Housing Occupancy in Blue Springs
Occupancy by Ownership in Blue Springs
Of the total 21,864 dwellings in Blue Springs, owner-occupied units account for 15,072 (68.9%), while renter-occupied units make up 6,792 (31.1%).
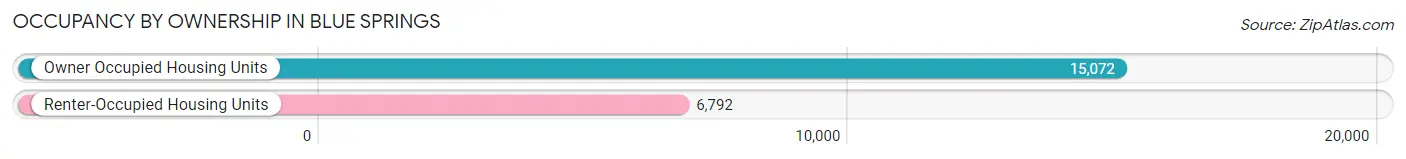
| Occupancy | # Housing Units | % Housing Units |
| Owner Occupied Housing Units | 15,072 | 68.9% |
| Renter-Occupied Housing Units | 6,792 | 31.1% |
| Total Occupied Housing Units | 21,864 | 100.0% |
Occupancy by Household Size in Blue Springs
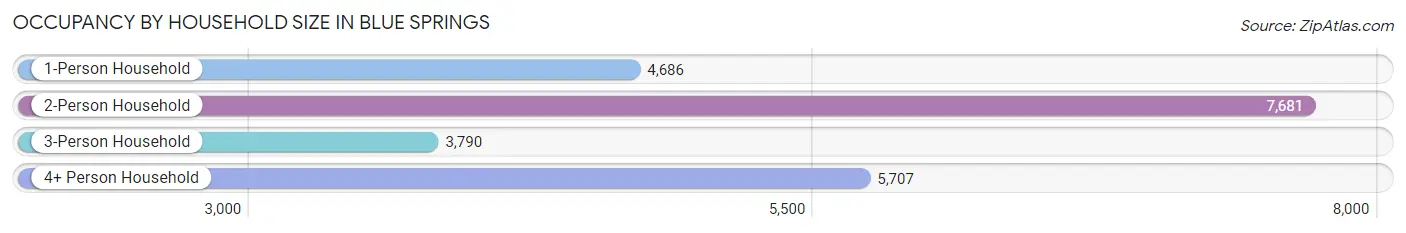
| Household Size | # Housing Units | % Housing Units |
| 1-Person Household | 4,686 | 21.4% |
| 2-Person Household | 7,681 | 35.1% |
| 3-Person Household | 3,790 | 17.3% |
| 4+ Person Household | 5,707 | 26.1% |
| Total Housing Units | 21,864 | 100.0% |
Occupancy by Ownership by Household Size in Blue Springs
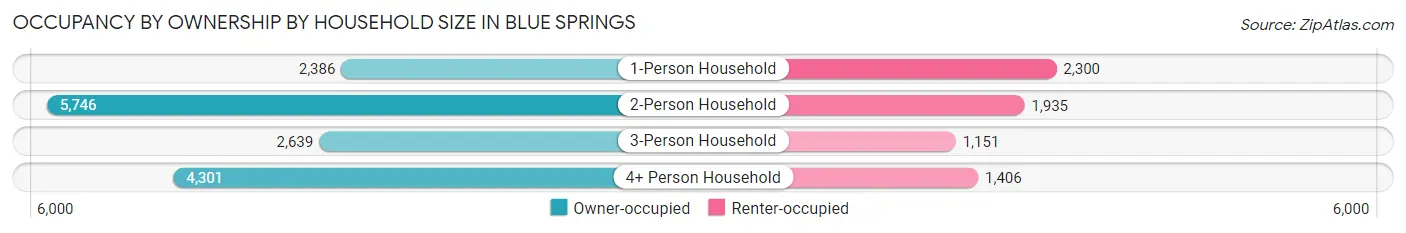
| Household Size | Owner-occupied | Renter-occupied |
| 1-Person Household | 2,386 (50.9%) | 2,300 (49.1%) |
| 2-Person Household | 5,746 (74.8%) | 1,935 (25.2%) |
| 3-Person Household | 2,639 (69.6%) | 1,151 (30.4%) |
| 4+ Person Household | 4,301 (75.4%) | 1,406 (24.6%) |
| Total Housing Units | 15,072 (68.9%) | 6,792 (31.1%) |
Occupancy by Educational Attainment in Blue Springs
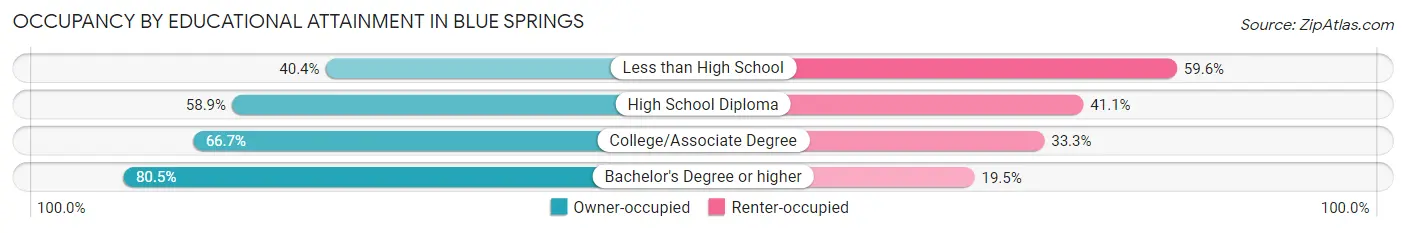
| Household Size | Owner-occupied | Renter-occupied |
| Less than High School | 262 (40.4%) | 387 (59.6%) |
| High School Diploma | 3,179 (58.9%) | 2,217 (41.1%) |
| College/Associate Degree | 5,317 (66.7%) | 2,658 (33.3%) |
| Bachelor's Degree or higher | 6,314 (80.5%) | 1,530 (19.5%) |
Occupancy by Age of Householder in Blue Springs
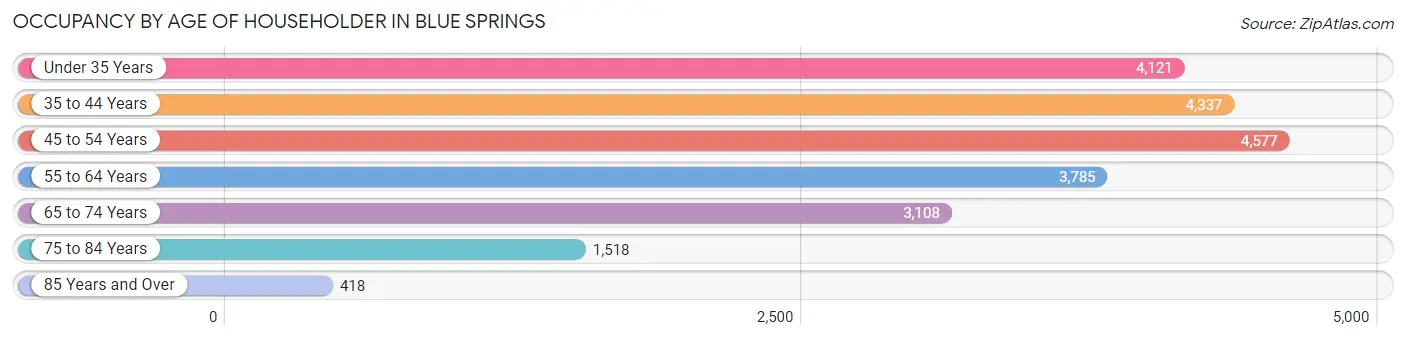
| Age Bracket | # Households | % Households |
| Under 35 Years | 4,121 | 18.9% |
| 35 to 44 Years | 4,337 | 19.8% |
| 45 to 54 Years | 4,577 | 20.9% |
| 55 to 64 Years | 3,785 | 17.3% |
| 65 to 74 Years | 3,108 | 14.2% |
| 75 to 84 Years | 1,518 | 6.9% |
| 85 Years and Over | 418 | 1.9% |
| Total | 21,864 | 100.0% |
Housing Finances in Blue Springs
Median Income by Occupancy in Blue Springs
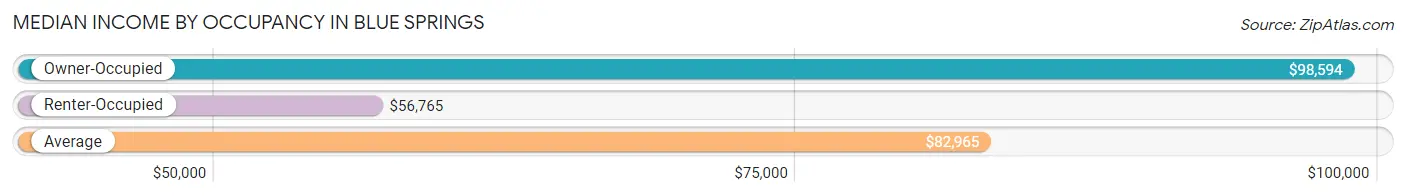
| Occupancy Type | # Households | Median Income |
| Owner-Occupied | 15,072 (68.9%) | $98,594 |
| Renter-Occupied | 6,792 (31.1%) | $56,765 |
| Average | 21,864 (100.0%) | $82,965 |
Occupancy by Householder Income Bracket in Blue Springs
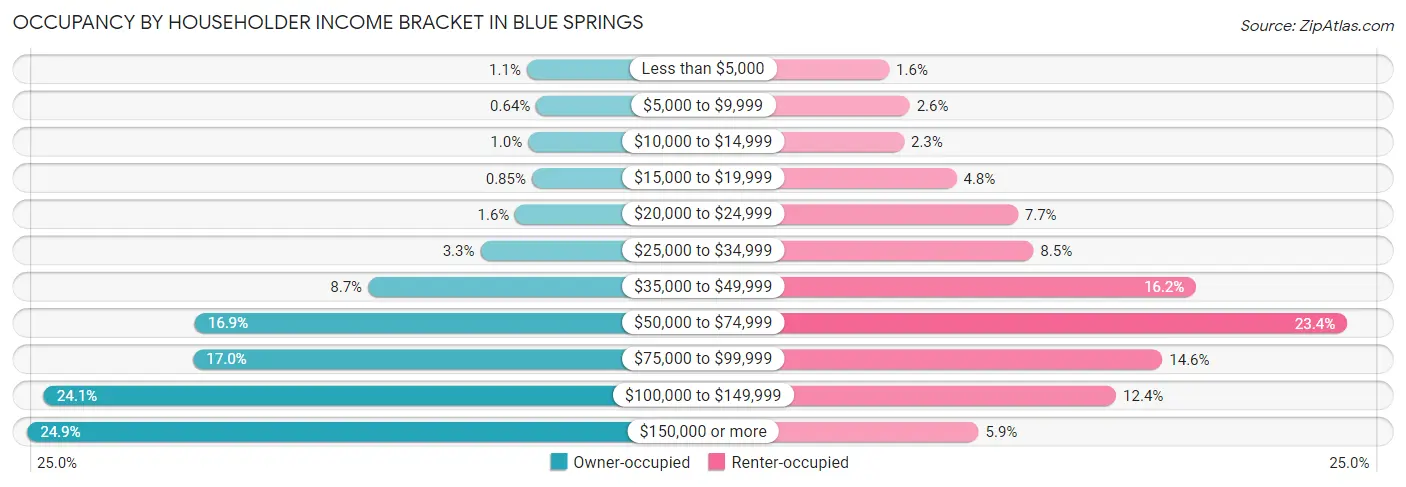
| Income Bracket | Owner-occupied | Renter-occupied |
| Less than $5,000 | 165 (1.1%) | 109 (1.6%) |
| $5,000 to $9,999 | 96 (0.6%) | 175 (2.6%) |
| $10,000 to $14,999 | 155 (1.0%) | 157 (2.3%) |
| $15,000 to $19,999 | 128 (0.9%) | 327 (4.8%) |
| $20,000 to $24,999 | 247 (1.6%) | 525 (7.7%) |
| $25,000 to $34,999 | 498 (3.3%) | 575 (8.5%) |
| $35,000 to $49,999 | 1,304 (8.6%) | 1,102 (16.2%) |
| $50,000 to $74,999 | 2,545 (16.9%) | 1,589 (23.4%) |
| $75,000 to $99,999 | 2,556 (17.0%) | 992 (14.6%) |
| $100,000 to $149,999 | 3,629 (24.1%) | 843 (12.4%) |
| $150,000 or more | 3,749 (24.9%) | 398 (5.9%) |
| Total | 15,072 (100.0%) | 6,792 (100.0%) |
Monthly Housing Cost Tiers in Blue Springs
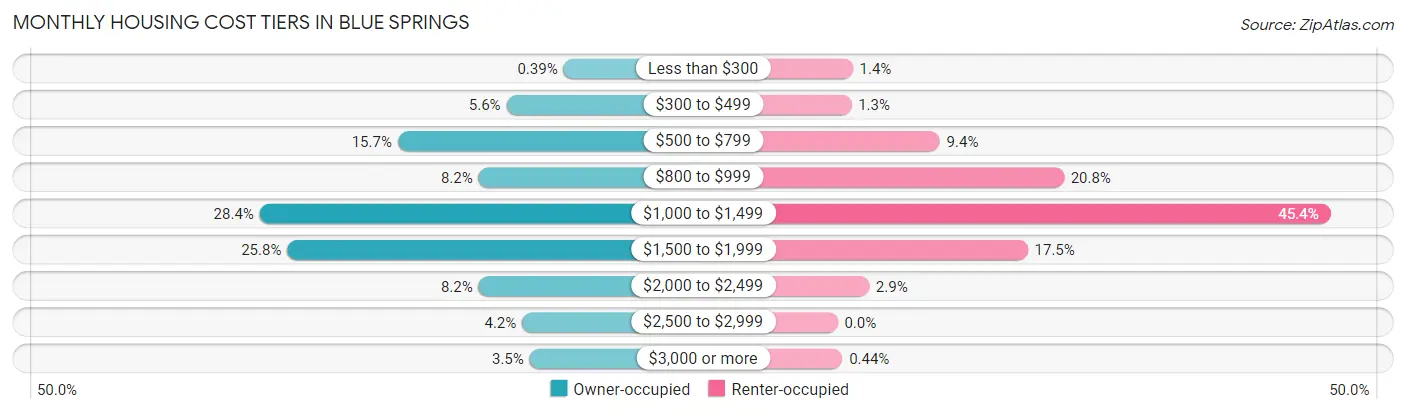
| Monthly Cost | Owner-occupied | Renter-occupied |
| Less than $300 | 59 (0.4%) | 95 (1.4%) |
| $300 to $499 | 850 (5.6%) | 86 (1.3%) |
| $500 to $799 | 2,359 (15.7%) | 639 (9.4%) |
| $800 to $999 | 1,237 (8.2%) | 1,415 (20.8%) |
| $1,000 to $1,499 | 4,275 (28.4%) | 3,083 (45.4%) |
| $1,500 to $1,999 | 3,892 (25.8%) | 1,189 (17.5%) |
| $2,000 to $2,499 | 1,238 (8.2%) | 197 (2.9%) |
| $2,500 to $2,999 | 633 (4.2%) | 0 (0.0%) |
| $3,000 or more | 529 (3.5%) | 30 (0.4%) |
| Total | 15,072 (100.0%) | 6,792 (100.0%) |
Physical Housing Characteristics in Blue Springs
Housing Structures in Blue Springs
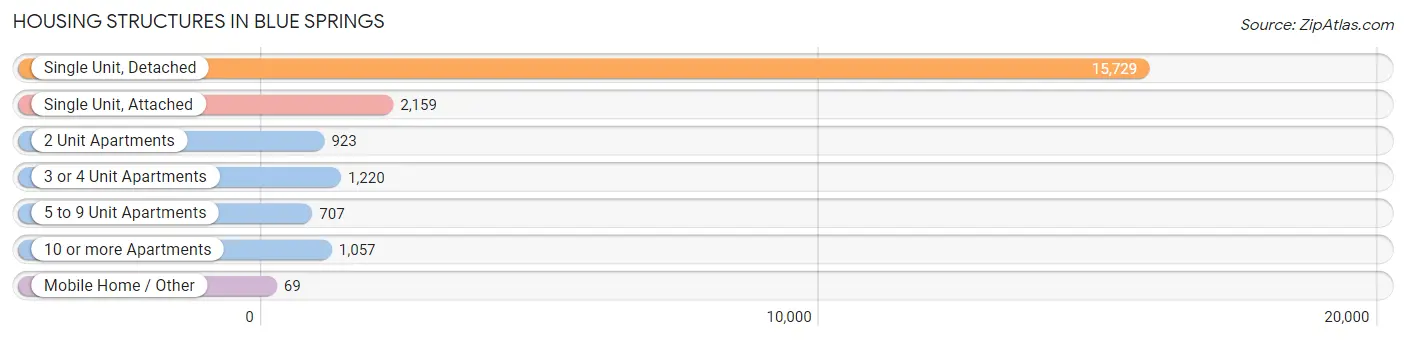
| Structure Type | # Housing Units | % Housing Units |
| Single Unit, Detached | 15,729 | 71.9% |
| Single Unit, Attached | 2,159 | 9.9% |
| 2 Unit Apartments | 923 | 4.2% |
| 3 or 4 Unit Apartments | 1,220 | 5.6% |
| 5 to 9 Unit Apartments | 707 | 3.2% |
| 10 or more Apartments | 1,057 | 4.8% |
| Mobile Home / Other | 69 | 0.3% |
| Total | 21,864 | 100.0% |
Housing Structures by Occupancy in Blue Springs
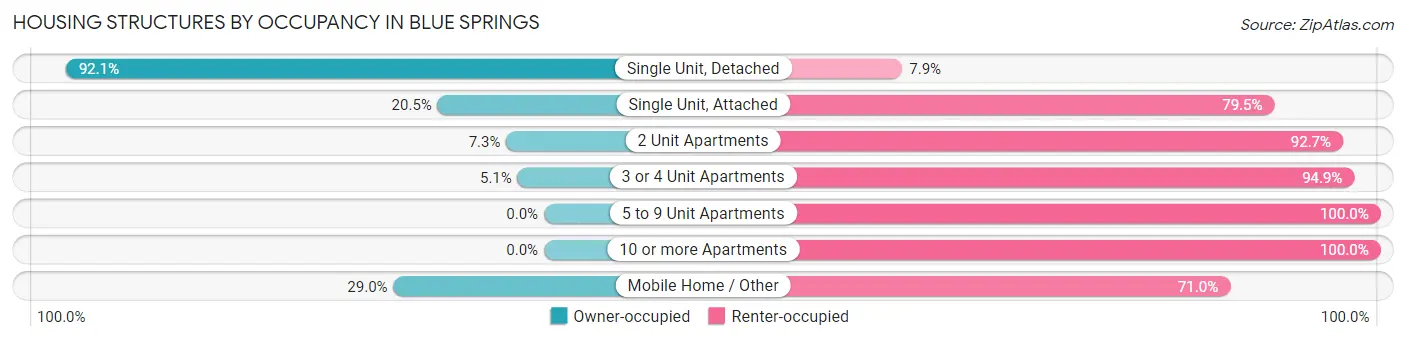
| Structure Type | Owner-occupied | Renter-occupied |
| Single Unit, Detached | 14,481 (92.1%) | 1,248 (7.9%) |
| Single Unit, Attached | 442 (20.5%) | 1,717 (79.5%) |
| 2 Unit Apartments | 67 (7.3%) | 856 (92.7%) |
| 3 or 4 Unit Apartments | 62 (5.1%) | 1,158 (94.9%) |
| 5 to 9 Unit Apartments | 0 (0.0%) | 707 (100.0%) |
| 10 or more Apartments | 0 (0.0%) | 1,057 (100.0%) |
| Mobile Home / Other | 20 (29.0%) | 49 (71.0%) |
| Total | 15,072 (68.9%) | 6,792 (31.1%) |
Housing Structures by Number of Rooms in Blue Springs
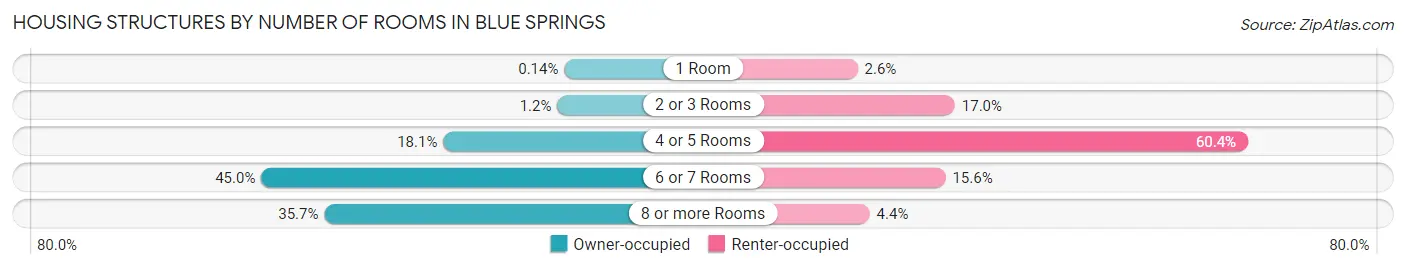
| Number of Rooms | Owner-occupied | Renter-occupied |
| 1 Room | 21 (0.1%) | 177 (2.6%) |
| 2 or 3 Rooms | 177 (1.2%) | 1,155 (17.0%) |
| 4 or 5 Rooms | 2,721 (18.0%) | 4,100 (60.4%) |
| 6 or 7 Rooms | 6,780 (45.0%) | 1,061 (15.6%) |
| 8 or more Rooms | 5,373 (35.6%) | 299 (4.4%) |
| Total | 15,072 (100.0%) | 6,792 (100.0%) |
Housing Structure by Heating Type in Blue Springs
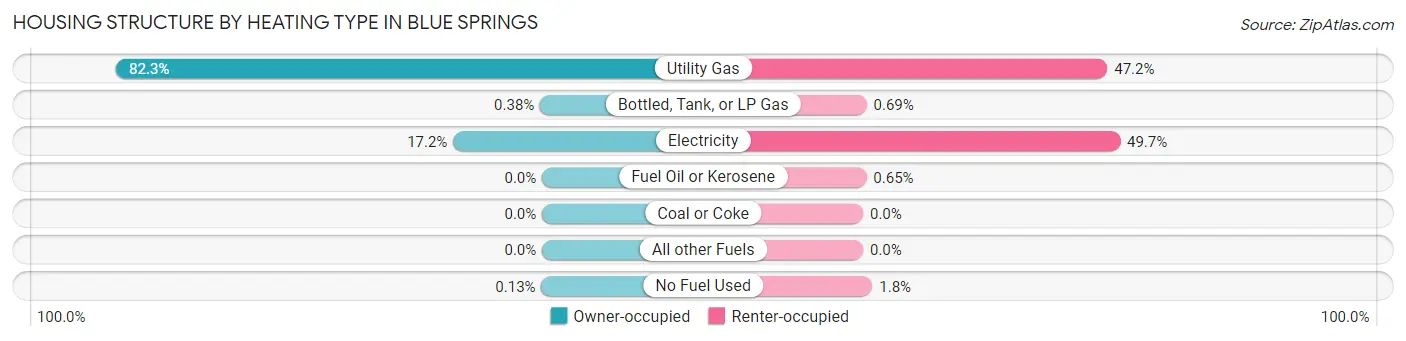
| Heating Type | Owner-occupied | Renter-occupied |
| Utility Gas | 12,407 (82.3%) | 3,206 (47.2%) |
| Bottled, Tank, or LP Gas | 57 (0.4%) | 47 (0.7%) |
| Electricity | 2,589 (17.2%) | 3,373 (49.7%) |
| Fuel Oil or Kerosene | 0 (0.0%) | 44 (0.6%) |
| Coal or Coke | 0 (0.0%) | 0 (0.0%) |
| All other Fuels | 0 (0.0%) | 0 (0.0%) |
| No Fuel Used | 19 (0.1%) | 122 (1.8%) |
| Total | 15,072 (100.0%) | 6,792 (100.0%) |
Household Vehicle Usage in Blue Springs
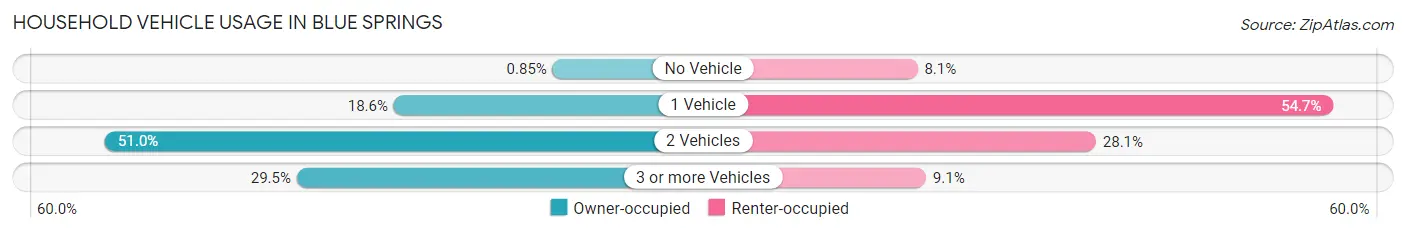
| Vehicles per Household | Owner-occupied | Renter-occupied |
| No Vehicle | 128 (0.9%) | 552 (8.1%) |
| 1 Vehicle | 2,810 (18.6%) | 3,715 (54.7%) |
| 2 Vehicles | 7,686 (51.0%) | 1,909 (28.1%) |
| 3 or more Vehicles | 4,448 (29.5%) | 616 (9.1%) |
| Total | 15,072 (100.0%) | 6,792 (100.0%) |
Real Estate & Mortgages in Blue Springs
Real Estate and Mortgage Overview in Blue Springs
| Characteristic | Without Mortgage | With Mortgage |
| Housing Units | 4,166 | 10,906 |
| Median Property Value | $224,700 | $224,600 |
| Median Household Income | $82,363 | $2,930 |
| Monthly Housing Costs | $641 | $520 |
| Real Estate Taxes | $2,886 | $88 |
Property Value by Mortgage Status in Blue Springs
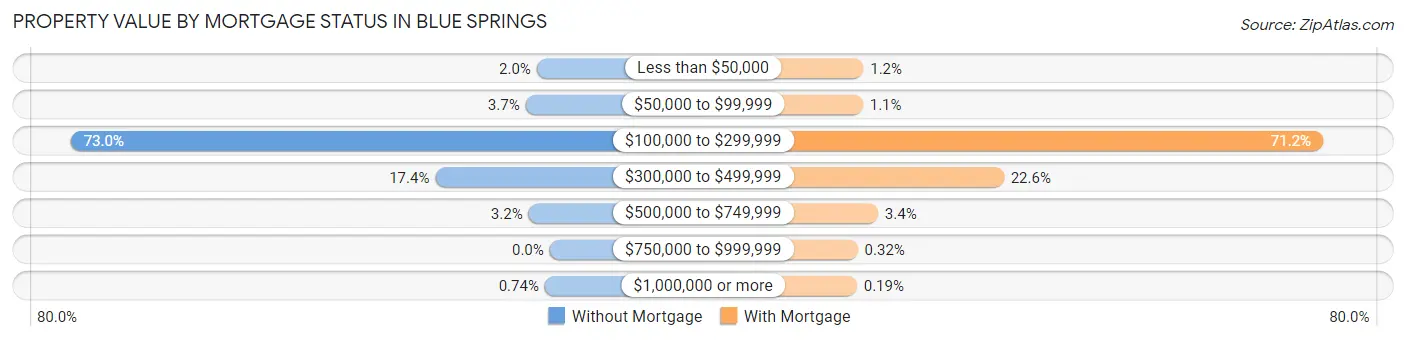
| Property Value | Without Mortgage | With Mortgage |
| Less than $50,000 | 82 (2.0%) | 129 (1.2%) |
| $50,000 to $99,999 | 153 (3.7%) | 120 (1.1%) |
| $100,000 to $299,999 | 3,040 (73.0%) | 7,766 (71.2%) |
| $300,000 to $499,999 | 726 (17.4%) | 2,463 (22.6%) |
| $500,000 to $749,999 | 134 (3.2%) | 372 (3.4%) |
| $750,000 to $999,999 | 0 (0.0%) | 35 (0.3%) |
| $1,000,000 or more | 31 (0.7%) | 21 (0.2%) |
| Total | 4,166 (100.0%) | 10,906 (100.0%) |
Household Income by Mortgage Status in Blue Springs
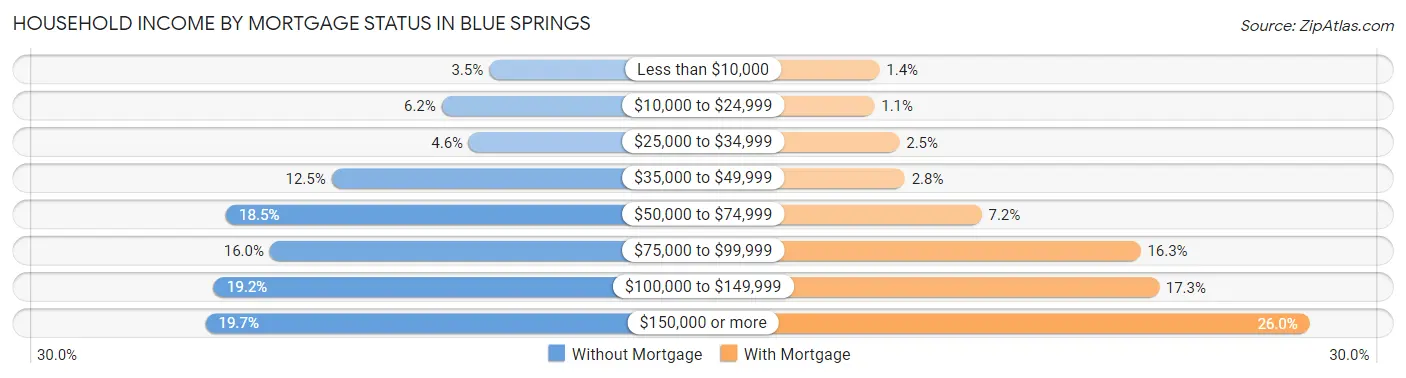
| Household Income | Without Mortgage | With Mortgage |
| Less than $10,000 | 144 (3.5%) | 148 (1.4%) |
| $10,000 to $24,999 | 257 (6.2%) | 117 (1.1%) |
| $25,000 to $34,999 | 192 (4.6%) | 273 (2.5%) |
| $35,000 to $49,999 | 519 (12.5%) | 306 (2.8%) |
| $50,000 to $74,999 | 770 (18.5%) | 785 (7.2%) |
| $75,000 to $99,999 | 666 (16.0%) | 1,775 (16.3%) |
| $100,000 to $149,999 | 799 (19.2%) | 1,890 (17.3%) |
| $150,000 or more | 819 (19.7%) | 2,830 (26.0%) |
| Total | 4,166 (100.0%) | 10,906 (100.0%) |
Property Value to Household Income Ratio in Blue Springs
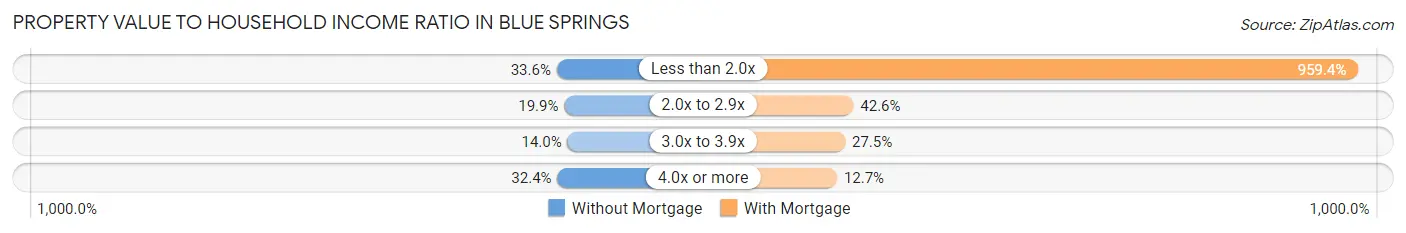
| Value-to-Income Ratio | Without Mortgage | With Mortgage |
| Less than 2.0x | 1,398 (33.6%) | 104,631 (959.4%) |
| 2.0x to 2.9x | 829 (19.9%) | 4,642 (42.6%) |
| 3.0x to 3.9x | 582 (14.0%) | 2,997 (27.5%) |
| 4.0x or more | 1,348 (32.4%) | 1,389 (12.7%) |
| Total | 4,166 (100.0%) | 10,906 (100.0%) |
Real Estate Taxes by Mortgage Status in Blue Springs
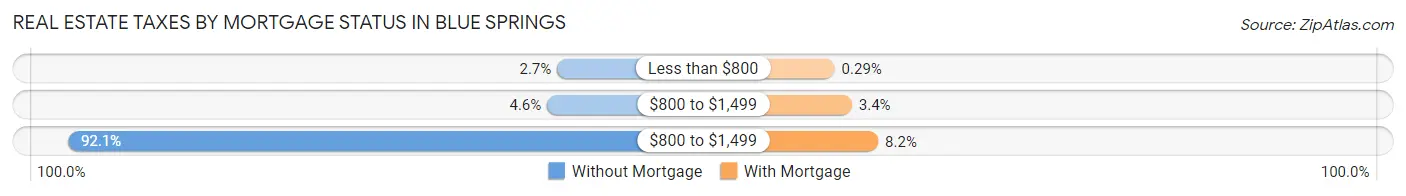
| Property Taxes | Without Mortgage | With Mortgage |
| Less than $800 | 114 (2.7%) | 32 (0.3%) |
| $800 to $1,499 | 190 (4.6%) | 374 (3.4%) |
| $800 to $1,499 | 3,836 (92.1%) | 899 (8.2%) |
| Total | 4,166 (100.0%) | 10,906 (100.0%) |
Health & Disability in Blue Springs
Health Insurance Coverage by Age in Blue Springs
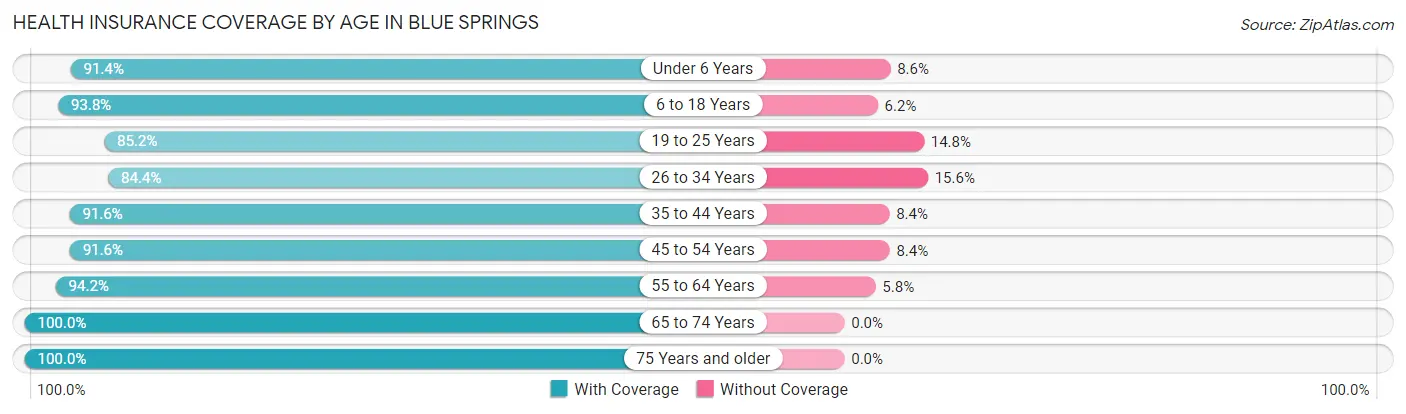
| Age Bracket | With Coverage | Without Coverage |
| Under 6 Years | 5,081 (91.4%) | 476 (8.6%) |
| 6 to 18 Years | 10,665 (93.8%) | 707 (6.2%) |
| 19 to 25 Years | 3,563 (85.2%) | 620 (14.8%) |
| 26 to 34 Years | 5,951 (84.4%) | 1,097 (15.6%) |
| 35 to 44 Years | 6,699 (91.6%) | 612 (8.4%) |
| 45 to 54 Years | 6,981 (91.6%) | 642 (8.4%) |
| 55 to 64 Years | 6,770 (94.2%) | 417 (5.8%) |
| 65 to 74 Years | 5,359 (100.0%) | 0 (0.0%) |
| 75 Years and older | 2,844 (100.0%) | 0 (0.0%) |
| Total | 53,913 (92.2%) | 4,571 (7.8%) |
Health Insurance Coverage by Citizenship Status in Blue Springs
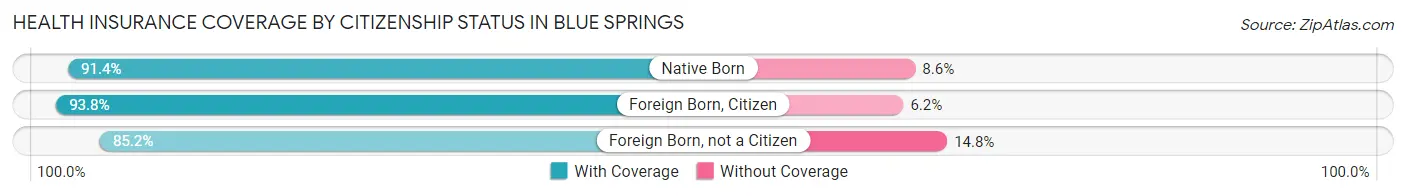
| Citizenship Status | With Coverage | Without Coverage |
| Native Born | 5,081 (91.4%) | 476 (8.6%) |
| Foreign Born, Citizen | 10,665 (93.8%) | 707 (6.2%) |
| Foreign Born, not a Citizen | 3,563 (85.2%) | 620 (14.8%) |
Health Insurance Coverage by Household Income in Blue Springs
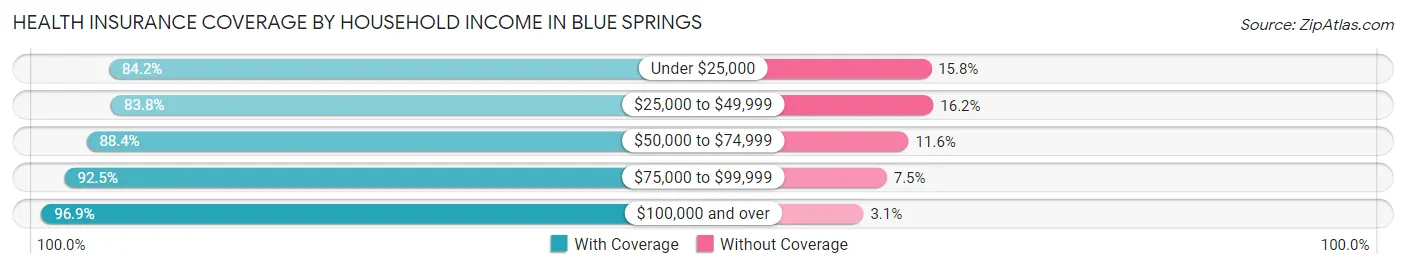
| Household Income | With Coverage | Without Coverage |
| Under $25,000 | 3,392 (84.2%) | 637 (15.8%) |
| $25,000 to $49,999 | 5,939 (83.8%) | 1,150 (16.2%) |
| $50,000 to $74,999 | 8,881 (88.4%) | 1,164 (11.6%) |
| $75,000 to $99,999 | 9,625 (92.5%) | 779 (7.5%) |
| $100,000 and over | 26,046 (96.9%) | 841 (3.1%) |
Public vs Private Health Insurance Coverage by Age in Blue Springs
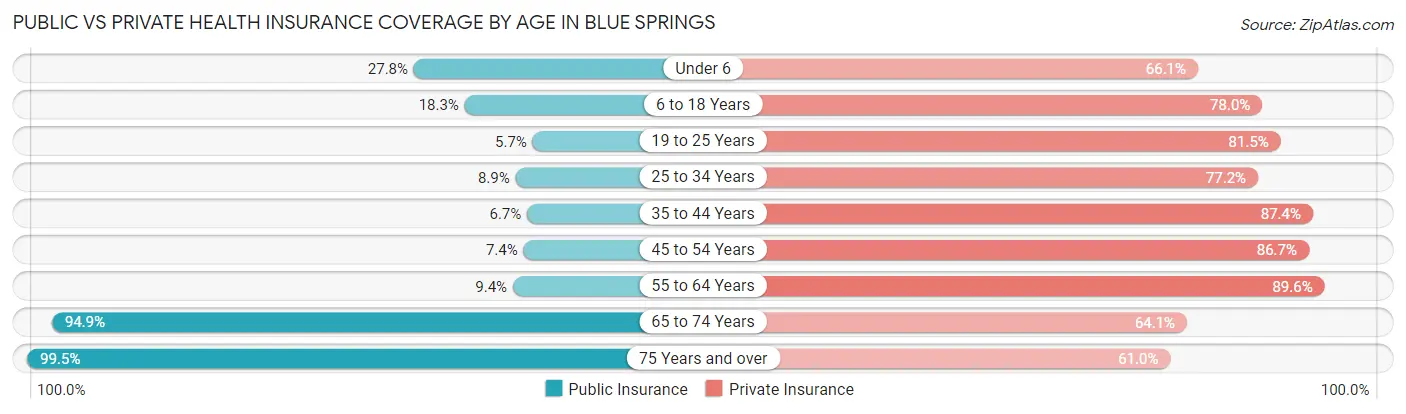
| Age Bracket | Public Insurance | Private Insurance |
| Under 6 | 1,542 (27.8%) | 3,672 (66.1%) |
| 6 to 18 Years | 2,082 (18.3%) | 8,873 (78.0%) |
| 19 to 25 Years | 238 (5.7%) | 3,407 (81.5%) |
| 25 to 34 Years | 625 (8.9%) | 5,444 (77.2%) |
| 35 to 44 Years | 492 (6.7%) | 6,391 (87.4%) |
| 45 to 54 Years | 563 (7.4%) | 6,607 (86.7%) |
| 55 to 64 Years | 673 (9.4%) | 6,439 (89.6%) |
| 65 to 74 Years | 5,088 (94.9%) | 3,433 (64.1%) |
| 75 Years and over | 2,831 (99.5%) | 1,734 (61.0%) |
| Total | 14,134 (24.2%) | 46,000 (78.6%) |
Disability Status by Sex by Age in Blue Springs
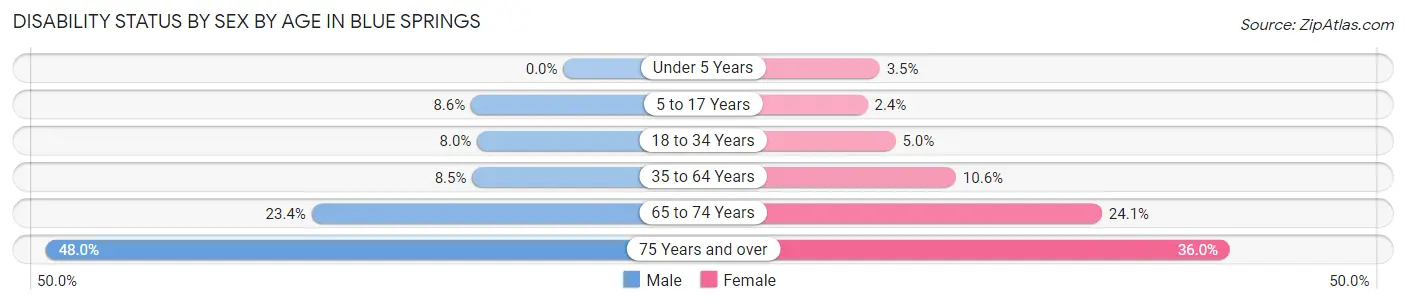
| Age Bracket | Male | Female |
| Under 5 Years | 0 (0.0%) | 82 (3.5%) |
| 5 to 17 Years | 517 (8.6%) | 139 (2.4%) |
| 18 to 34 Years | 483 (8.0%) | 288 (5.0%) |
| 35 to 64 Years | 865 (8.5%) | 1,258 (10.6%) |
| 65 to 74 Years | 589 (23.4%) | 685 (24.1%) |
| 75 Years and over | 626 (48.0%) | 555 (36.0%) |
Disability Class by Sex by Age in Blue Springs
Disability Class: Hearing Difficulty
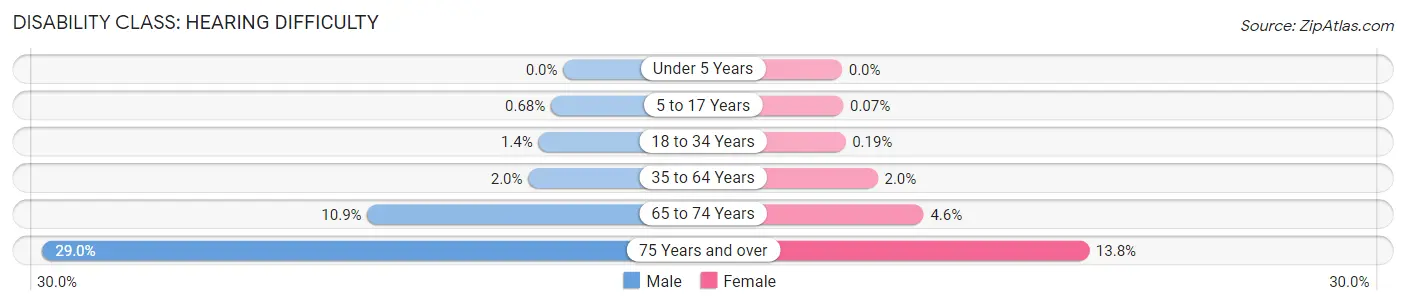
| Age Bracket | Male | Female |
| Under 5 Years | 0 (0.0%) | 0 (0.0%) |
| 5 to 17 Years | 41 (0.7%) | 4 (0.1%) |
| 18 to 34 Years | 83 (1.4%) | 11 (0.2%) |
| 35 to 64 Years | 200 (1.9%) | 236 (2.0%) |
| 65 to 74 Years | 275 (10.9%) | 129 (4.5%) |
| 75 Years and over | 378 (29.0%) | 212 (13.8%) |
Disability Class: Vision Difficulty
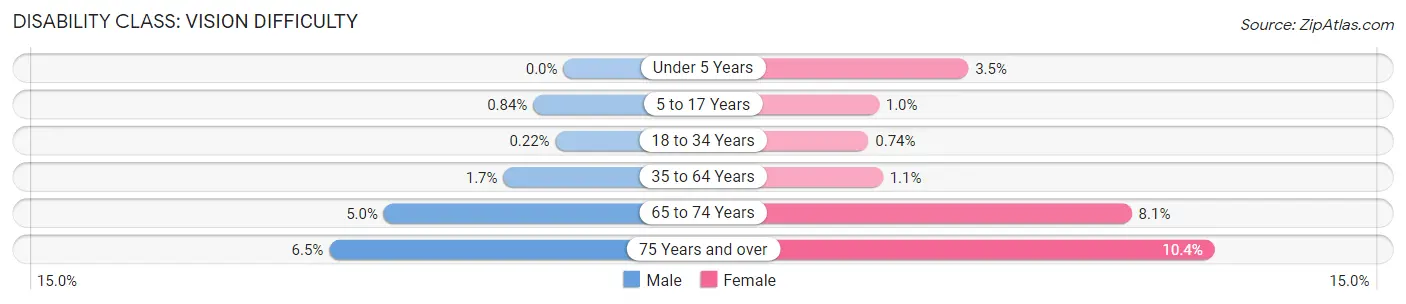
| Age Bracket | Male | Female |
| Under 5 Years | 0 (0.0%) | 82 (3.5%) |
| 5 to 17 Years | 51 (0.8%) | 60 (1.0%) |
| 18 to 34 Years | 13 (0.2%) | 43 (0.7%) |
| 35 to 64 Years | 171 (1.7%) | 136 (1.1%) |
| 65 to 74 Years | 126 (5.0%) | 229 (8.1%) |
| 75 Years and over | 85 (6.5%) | 160 (10.4%) |
Disability Class: Cognitive Difficulty
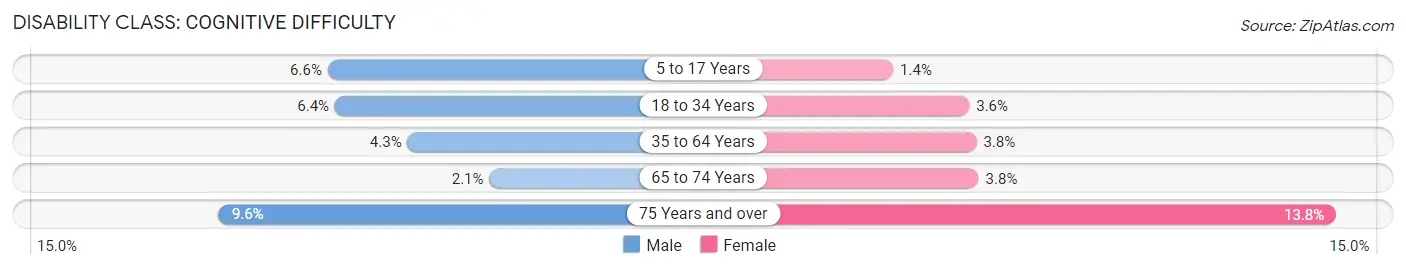
| Age Bracket | Male | Female |
| 5 to 17 Years | 396 (6.6%) | 83 (1.4%) |
| 18 to 34 Years | 384 (6.4%) | 205 (3.5%) |
| 35 to 64 Years | 444 (4.3%) | 446 (3.7%) |
| 65 to 74 Years | 52 (2.1%) | 108 (3.8%) |
| 75 Years and over | 125 (9.6%) | 212 (13.8%) |
Disability Class: Ambulatory Difficulty
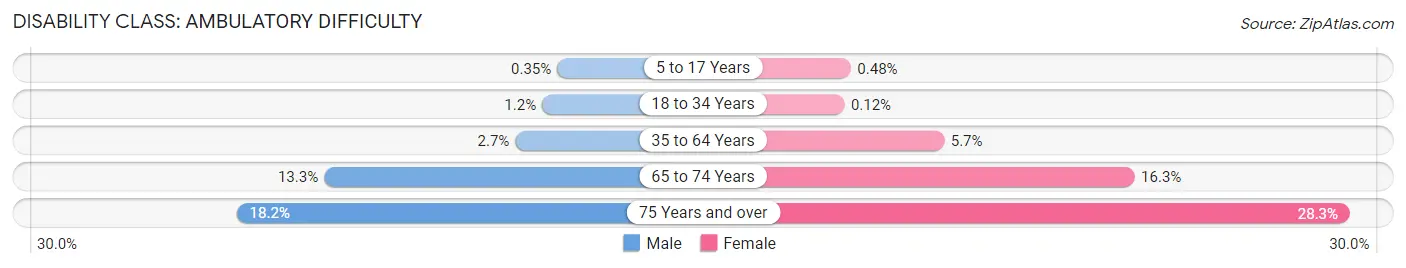
| Age Bracket | Male | Female |
| 5 to 17 Years | 21 (0.4%) | 28 (0.5%) |
| 18 to 34 Years | 72 (1.2%) | 7 (0.1%) |
| 35 to 64 Years | 274 (2.7%) | 675 (5.7%) |
| 65 to 74 Years | 336 (13.3%) | 462 (16.3%) |
| 75 Years and over | 237 (18.2%) | 436 (28.3%) |
Disability Class: Self-Care Difficulty
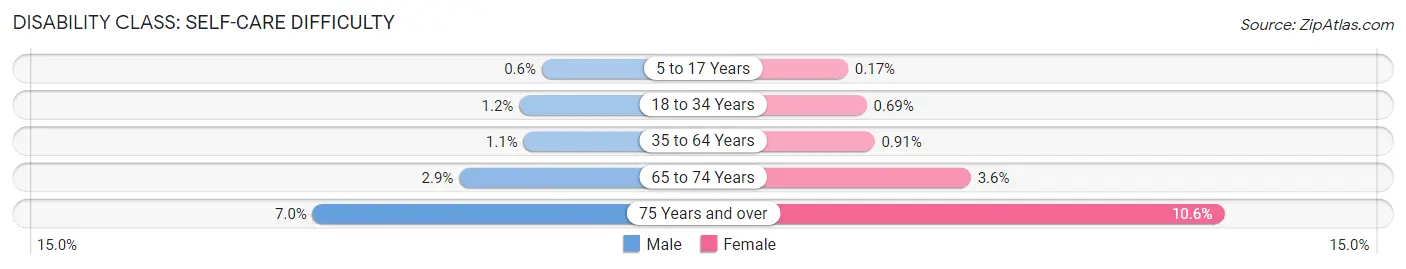
| Age Bracket | Male | Female |
| 5 to 17 Years | 36 (0.6%) | 10 (0.2%) |
| 18 to 34 Years | 74 (1.2%) | 40 (0.7%) |
| 35 to 64 Years | 114 (1.1%) | 108 (0.9%) |
| 65 to 74 Years | 73 (2.9%) | 102 (3.6%) |
| 75 Years and over | 91 (7.0%) | 164 (10.6%) |
Technology Access in Blue Springs
Computing Device Access in Blue Springs
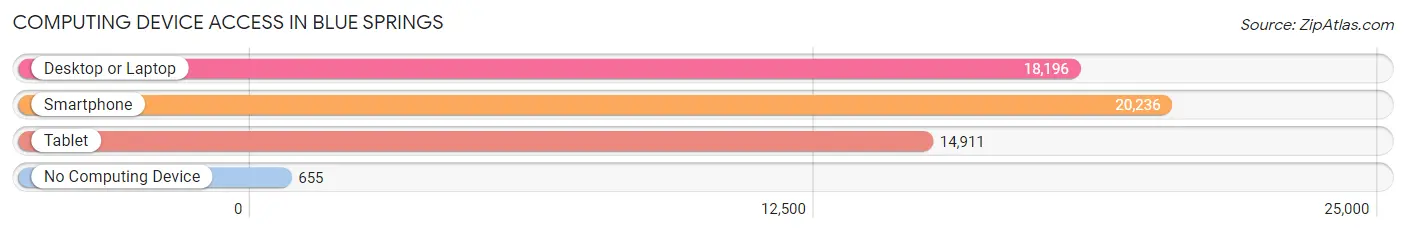
| Device Type | # Households | % Households |
| Desktop or Laptop | 18,196 | 83.2% |
| Smartphone | 20,236 | 92.5% |
| Tablet | 14,911 | 68.2% |
| No Computing Device | 655 | 3.0% |
| Total | 21,864 | 100.0% |
Internet Access in Blue Springs
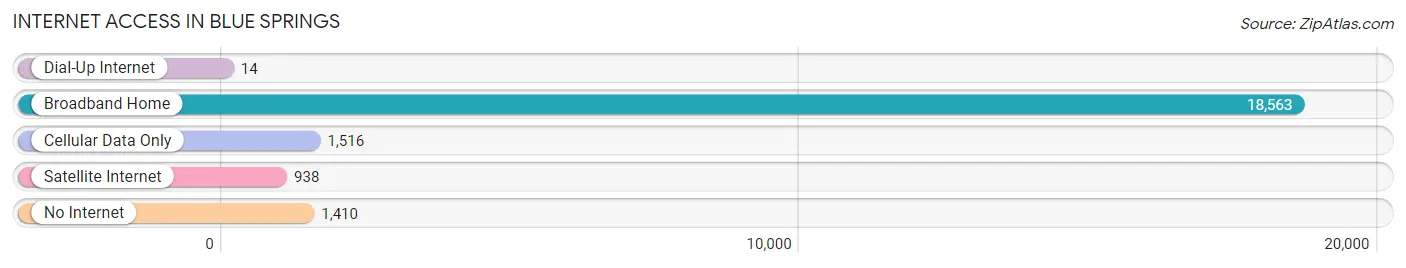
| Internet Type | # Households | % Households |
| Dial-Up Internet | 14 | 0.1% |
| Broadband Home | 18,563 | 84.9% |
| Cellular Data Only | 1,516 | 6.9% |
| Satellite Internet | 938 | 4.3% |
| No Internet | 1,410 | 6.5% |
| Total | 21,864 | 100.0% |
Blue Springs Summary
Blue Springs, Missouri is a city located in Jackson County, Missouri, United States. It is part of the Kansas City metropolitan area and is located approximately 20 miles east of downtown Kansas City. The population was estimated to be 54,239 in 2019, making it the ninth-largest city in the state of Missouri.
History
Blue Springs was founded in 1833 by a group of settlers from Kentucky and Tennessee. The city was named after a nearby spring that was said to have a blue hue. The settlers were attracted to the area due to its abundant natural resources, including timber, limestone, and coal.
In 1845, the city was incorporated and the first mayor was elected. The city quickly grew and by the late 1800s, it had become a major center for the coal mining industry. The city also became a popular destination for tourists, who were drawn to the area’s natural beauty and recreational opportunities.
In the early 1900s, the city began to experience a period of growth and development. The city’s population increased and new businesses were established. The city also became a popular destination for tourists, who were drawn to the area’s natural beauty and recreational opportunities.
In the 1950s, the city experienced a period of rapid growth and development. The population increased and new businesses were established. The city also became a popular destination for tourists, who were drawn to the area’s natural beauty and recreational opportunities.
Geography
Blue Springs is located in Jackson County, Missouri, approximately 20 miles east of downtown Kansas City. The city is situated on the western edge of the Ozark Plateau, which is characterized by rolling hills and valleys. The city is located at the intersection of Interstate 70 and US Highway 40.
The city has a total area of 24.3 square miles, of which 24.2 square miles is land and 0.1 square miles is water. The city is located in the Missouri River watershed and is bordered by the cities of Independence, Grain Valley, and Lee’s Summit.
Economy
Blue Springs has a diverse economy that is driven by a variety of industries. The city is home to a number of large employers, including the Ford Motor Company, Honeywell, and the Federal Reserve Bank of Kansas City. The city is also home to a number of small businesses, including restaurants, retail stores, and professional services.
The city’s economy is also supported by a number of educational institutions, including the University of Central Missouri, Metropolitan Community College, and the Blue Springs School District.
Demographics
As of the 2019 census, the population of Blue Springs was estimated to be 54,239. The city has a population density of 2,232 people per square mile. The median age of the population is 36.7 years, and the median household income is $63,945.
The racial makeup of the city is 79.2% White, 11.3% African American, 0.7% Native American, 2.2% Asian, 0.1% Pacific Islander, 3.7% from other races, and 3.0% from two or more races. The city is also home to a large Hispanic population, with 8.7% of the population identifying as Hispanic or Latino.
Conclusion
Blue Springs, Missouri is a city located in Jackson County, Missouri, United States. It is part of the Kansas City metropolitan area and is located approximately 20 miles east of downtown Kansas City. The city has a diverse economy that is driven by a variety of industries, including the Ford Motor Company, Honeywell, and the Federal Reserve Bank of Kansas City. The population of Blue Springs was estimated to be 54,239 in 2019, with a median age of 36.7 years and a median household income of $63,945. The city is also home to a large Hispanic population, with 8.7% of the population identifying as Hispanic or Latino.
Common Questions
What is Per Capita Income in Blue Springs?
Per Capita income in Blue Springs is $38,842.
What is the Median Family Income in Blue Springs?
Median Family Income in Blue Springs is $95,098.
What is the Median Household income in Blue Springs?
Median Household Income in Blue Springs is $82,965.
What is Income or Wage Gap in Blue Springs?
Income or Wage Gap in Blue Springs is 31.5%.
Women in Blue Springs earn 68.5 cents for every dollar earned by a man.
What is Family Income Deficit in Blue Springs?
Family Income Deficit in Blue Springs is $12,939.
Families that are below poverty line in Blue Springs earn $12,939 less on average than the poverty threshold level.
What is Inequality or Gini Index in Blue Springs?
Inequality or Gini Index in Blue Springs is 0.40.
What is the Total Population of Blue Springs?
Total Population of Blue Springs is 58,720.
What is the Total Male Population of Blue Springs?
Total Male Population of Blue Springs is 28,390.
What is the Total Female Population of Blue Springs?
Total Female Population of Blue Springs is 30,330.
What is the Ratio of Males per 100 Females in Blue Springs?
There are 93.60 Males per 100 Females in Blue Springs.
What is the Ratio of Females per 100 Males in Blue Springs?
There are 106.83 Females per 100 Males in Blue Springs.
What is the Median Population Age in Blue Springs?
Median Population Age in Blue Springs is 36.6 Years.
What is the Average Family Size in Blue Springs
Average Family Size in Blue Springs is 3.1 People.
What is the Average Household Size in Blue Springs
Average Household Size in Blue Springs is 2.7 People.
How Large is the Labor Force in Blue Springs?
There are 30,830 People in the Labor Forcein in Blue Springs.
What is the Percentage of People in the Labor Force in Blue Springs?
69.7% of People are in the Labor Force in Blue Springs.
What is the Unemployment Rate in Blue Springs?
Unemployment Rate in Blue Springs is 4.0%.