Three Rivers, MI Map & Demographics
Three Rivers Map
Three Rivers Overview
$23,980
PER CAPITA INCOME
$57,404
AVG FAMILY INCOME
$49,018
AVG HOUSEHOLD INCOME
39.8%
WAGE / INCOME GAP [ % ]
60.2¢/ $1
WAGE / INCOME GAP [ $ ]
0.39
INEQUALITY / GINI INDEX
7,923
TOTAL POPULATION
3,807
MALE POPULATION
4,116
FEMALE POPULATION
92.49
MALES / 100 FEMALES
108.12
FEMALES / 100 MALES
34.1
MEDIAN AGE
3.2
AVG FAMILY SIZE
2.5
AVG HOUSEHOLD SIZE
3,977
LABOR FORCE [ PEOPLE ]
65.5%
PERCENT IN LABOR FORCE
8.6%
UNEMPLOYMENT RATE
Three Rivers Zip Codes
Three Rivers Area Codes
Income in Three Rivers
Income Overview in Three Rivers
Per Capita Income in Three Rivers is $23,980, while median incomes of families and households are $57,404 and $49,018 respectively.
| Characteristic | Number | Measure |
| Per Capita Income | 7,923 | $23,980 |
| Median Family Income | 1,868 | $57,404 |
| Mean Family Income | 1,868 | $68,593 |
| Median Household Income | 3,173 | $49,018 |
| Mean Household Income | 3,173 | $58,343 |
| Income Deficit | 1,868 | $0 |
| Wage / Income Gap (%) | 7,923 | 39.75% |
| Wage / Income Gap ($) | 7,923 | 60.25¢ per $1 |
| Gini / Inequality Index | 7,923 | 0.39 |
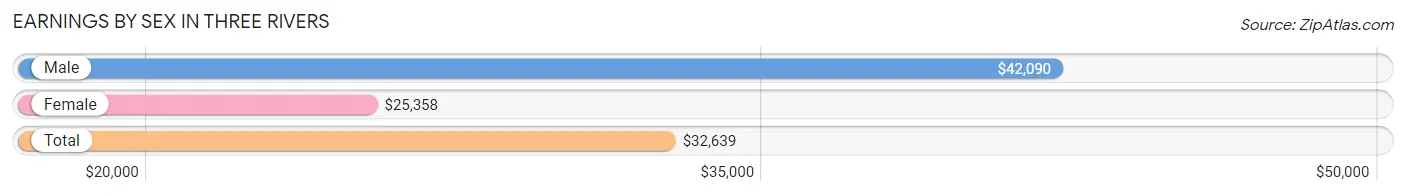
Earnings by Sex in Three Rivers
Average Earnings in Three Rivers are $32,639, $42,090 for men and $25,358 for women, a difference of 39.8%.
| Sex | Number | Average Earnings |
| Male | 1,993 (49.8%) | $42,090 |
| Female | 2,007 (50.2%) | $25,358 |
| Total | 4,000 (100.0%) | $32,639 |
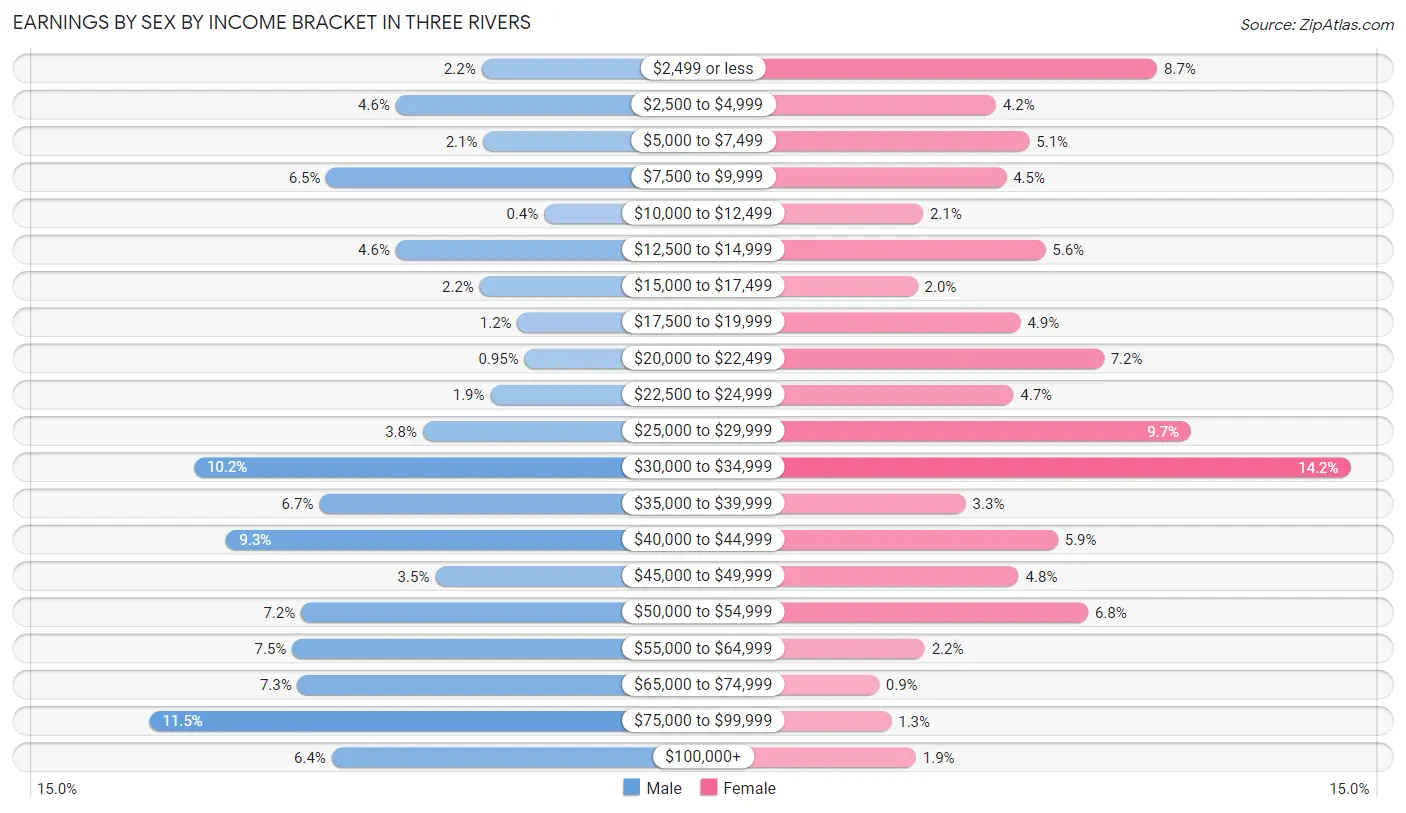
Earnings by Sex by Income Bracket in Three Rivers
The most common earnings brackets in Three Rivers are $75,000 to $99,999 for men (229 | 11.5%) and $30,000 to $34,999 for women (284 | 14.1%).
| Income | Male | Female |
| $2,499 or less | 43 (2.2%) | 175 (8.7%) |
| $2,500 to $4,999 | 91 (4.6%) | 84 (4.2%) |
| $5,000 to $7,499 | 42 (2.1%) | 103 (5.1%) |
| $7,500 to $9,999 | 130 (6.5%) | 90 (4.5%) |
| $10,000 to $12,499 | 8 (0.4%) | 43 (2.1%) |
| $12,500 to $14,999 | 91 (4.6%) | 112 (5.6%) |
| $15,000 to $17,499 | 44 (2.2%) | 40 (2.0%) |
| $17,500 to $19,999 | 23 (1.1%) | 98 (4.9%) |
| $20,000 to $22,499 | 19 (0.9%) | 145 (7.2%) |
| $22,500 to $24,999 | 38 (1.9%) | 94 (4.7%) |
| $25,000 to $29,999 | 76 (3.8%) | 194 (9.7%) |
| $30,000 to $34,999 | 204 (10.2%) | 284 (14.1%) |
| $35,000 to $39,999 | 134 (6.7%) | 67 (3.3%) |
| $40,000 to $44,999 | 186 (9.3%) | 119 (5.9%) |
| $45,000 to $49,999 | 69 (3.5%) | 97 (4.8%) |
| $50,000 to $54,999 | 144 (7.2%) | 136 (6.8%) |
| $55,000 to $64,999 | 149 (7.5%) | 44 (2.2%) |
| $65,000 to $74,999 | 146 (7.3%) | 18 (0.9%) |
| $75,000 to $99,999 | 229 (11.5%) | 25 (1.3%) |
| $100,000+ | 127 (6.4%) | 39 (1.9%) |
| Total | 1,993 (100.0%) | 2,007 (100.0%) |
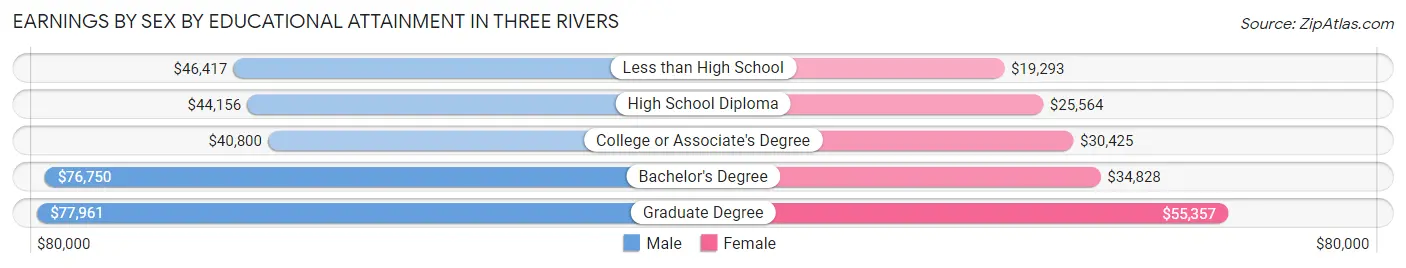
Earnings by Sex by Educational Attainment in Three Rivers
Average earnings in Three Rivers are $44,776 for men and $27,000 for women, a difference of 39.7%. Men with an educational attainment of graduate degree enjoy the highest average annual earnings of $77,961, while those with college or associate's degree education earn the least with $40,800. Women with an educational attainment of graduate degree earn the most with the average annual earnings of $55,357, while those with less than high school education have the smallest earnings of $19,293.
| Educational Attainment | Male Income | Female Income |
| Less than High School | $46,417 | $19,293 |
| High School Diploma | $44,156 | $25,564 |
| College or Associate's Degree | $40,800 | $30,425 |
| Bachelor's Degree | $76,750 | $34,828 |
| Graduate Degree | $77,961 | $55,357 |
| Total | $44,776 | $27,000 |
Family Income in Three Rivers
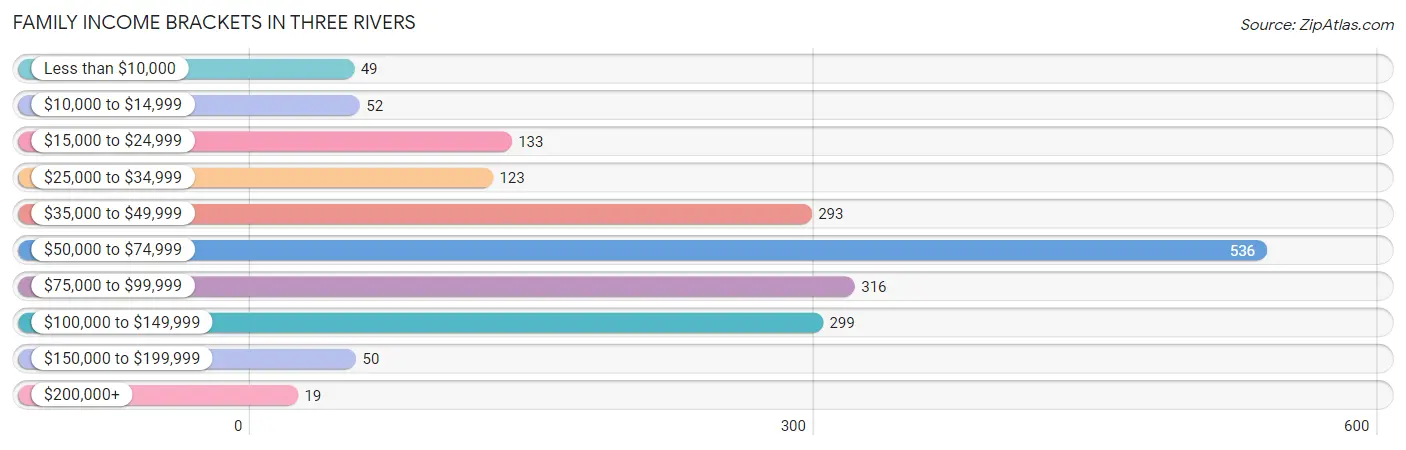
Family Income Brackets in Three Rivers
According to the Three Rivers family income data, there are 536 families falling into the $50,000 to $74,999 income range, which is the most common income bracket and makes up 28.7% of all families. Conversely, the $200,000+ income bracket is the least frequent group with only 19 families (1.0%) belonging to this category.
| Income Bracket | # Families | % Families |
| Less than $10,000 | 49 | 2.6% |
| $10,000 to $14,999 | 52 | 2.8% |
| $15,000 to $24,999 | 133 | 7.1% |
| $25,000 to $34,999 | 123 | 6.6% |
| $35,000 to $49,999 | 293 | 15.7% |
| $50,000 to $74,999 | 536 | 28.7% |
| $75,000 to $99,999 | 316 | 16.9% |
| $100,000 to $149,999 | 299 | 16.0% |
| $150,000 to $199,999 | 50 | 2.7% |
| $200,000+ | 19 | 1.0% |
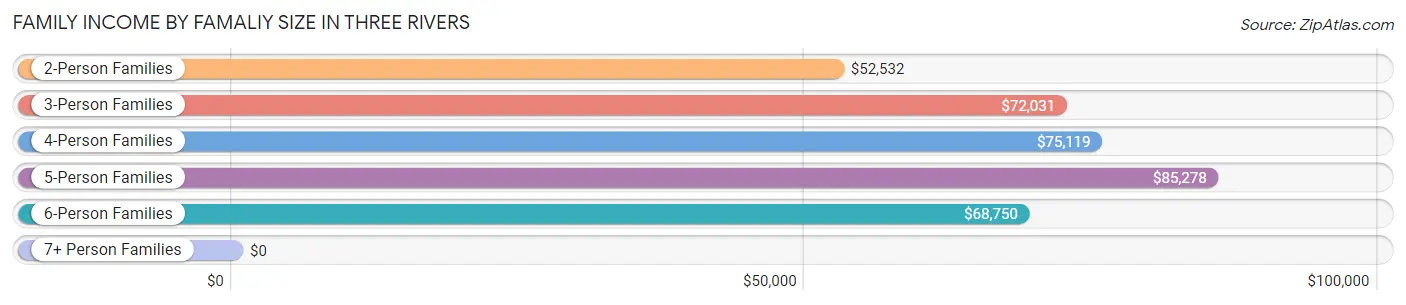
Family Income by Famaliy Size in Three Rivers
5-person families (204 | 10.9%) account for the highest median family income in Three Rivers with $85,278 per family, while 2-person families (867 | 46.4%) have the highest median income of $26,266 per family member.
| Income Bracket | # Families | Median Income |
| 2-Person Families | 867 (46.4%) | $52,532 |
| 3-Person Families | 426 (22.8%) | $72,031 |
| 4-Person Families | 282 (15.1%) | $75,119 |
| 5-Person Families | 204 (10.9%) | $85,278 |
| 6-Person Families | 70 (3.7%) | $68,750 |
| 7+ Person Families | 19 (1.0%) | $0 |
| Total | 1,868 (100.0%) | $57,404 |
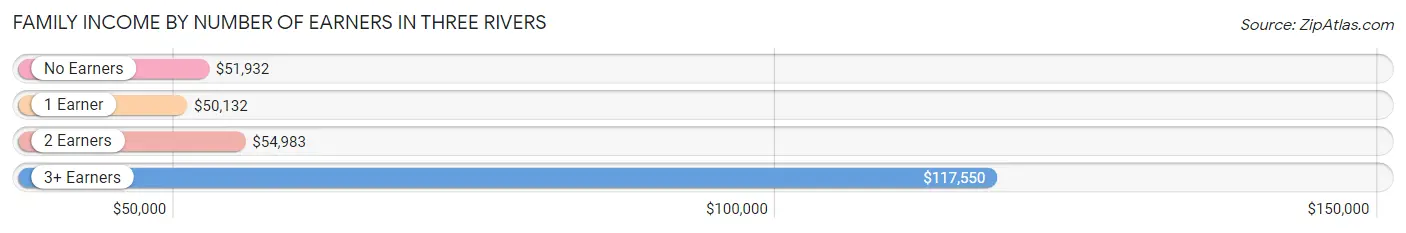
Family Income by Number of Earners in Three Rivers
The median family income in Three Rivers is $57,404, with families comprising 3+ earners (221) having the highest median family income of $117,550, while families with 1 earner (808) have the lowest median family income of $50,132, accounting for 11.8% and 43.2% of families, respectively.
| Number of Earners | # Families | Median Income |
| No Earners | 177 (9.5%) | $51,932 |
| 1 Earner | 808 (43.2%) | $50,132 |
| 2 Earners | 662 (35.4%) | $54,983 |
| 3+ Earners | 221 (11.8%) | $117,550 |
| Total | 1,868 (100.0%) | $57,404 |
Household Income in Three Rivers
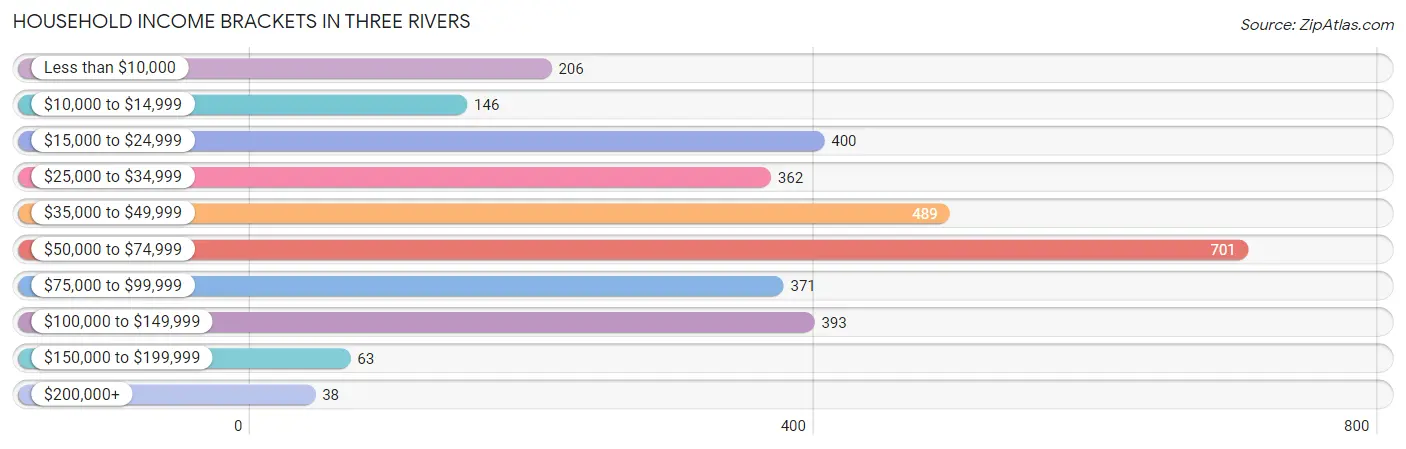
Household Income Brackets in Three Rivers
With 701 households falling in the category, the $50,000 to $74,999 income range is the most frequent in Three Rivers, accounting for 22.1% of all households. In contrast, only 38 households (1.2%) fall into the $200,000+ income bracket, making it the least populous group.
| Income Bracket | # Households | % Households |
| Less than $10,000 | 206 | 6.5% |
| $10,000 to $14,999 | 146 | 4.6% |
| $15,000 to $24,999 | 400 | 12.6% |
| $25,000 to $34,999 | 362 | 11.4% |
| $35,000 to $49,999 | 489 | 15.4% |
| $50,000 to $74,999 | 701 | 22.1% |
| $75,000 to $99,999 | 371 | 11.7% |
| $100,000 to $149,999 | 393 | 12.4% |
| $150,000 to $199,999 | 63 | 2.0% |
| $200,000+ | 38 | 1.2% |
Household Income by Householder Age in Three Rivers
The median household income in Three Rivers is $49,018, with the highest median household income of $60,761 found in the 25 to 44 years age bracket for the primary householder. A total of 1,042 households (32.8%) fall into this category. Meanwhile, the 65+ years age bracket for the primary householder has the lowest median household income of $29,261, with 832 households (26.2%) in this group.
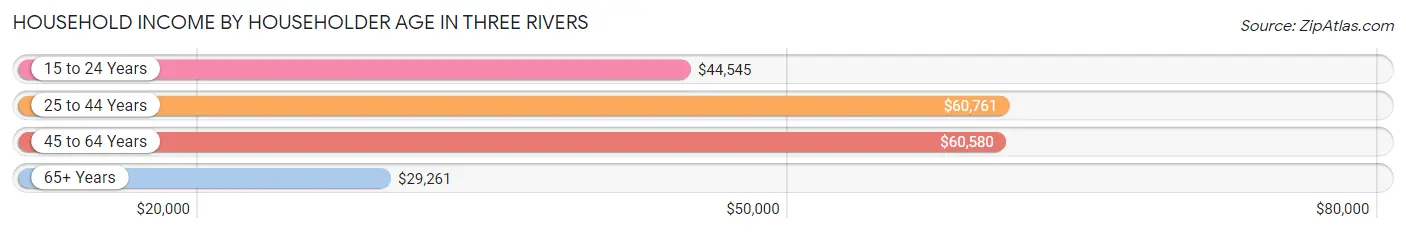
| Income Bracket | # Households | Median Income |
| 15 to 24 Years | 224 (7.1%) | $44,545 |
| 25 to 44 Years | 1,042 (32.8%) | $60,761 |
| 45 to 64 Years | 1,075 (33.9%) | $60,580 |
| 65+ Years | 832 (26.2%) | $29,261 |
| Total | 3,173 (100.0%) | $49,018 |
Poverty in Three Rivers
Income Below Poverty by Sex and Age in Three Rivers
With 14.0% poverty level for males and 14.8% for females among the residents of Three Rivers, 16 and 17 year old males and 12 to 14 year old females are the most vulnerable to poverty, with 65 males (36.7%) and 76 females (35.8%) in their respective age groups living below the poverty level.
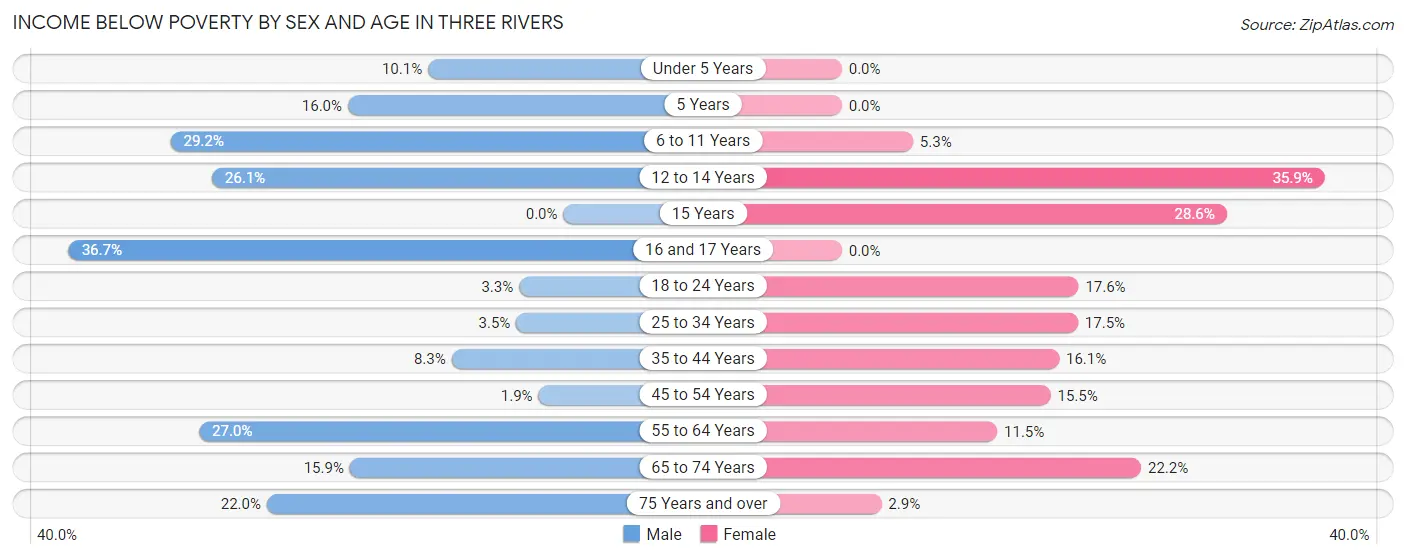
| Age Bracket | Male | Female |
| Under 5 Years | 37 (10.1%) | 0 (0.0%) |
| 5 Years | 8 (16.0%) | 0 (0.0%) |
| 6 to 11 Years | 121 (29.2%) | 21 (5.3%) |
| 12 to 14 Years | 18 (26.1%) | 76 (35.8%) |
| 15 Years | 0 (0.0%) | 10 (28.6%) |
| 16 and 17 Years | 65 (36.7%) | 0 (0.0%) |
| 18 to 24 Years | 12 (3.3%) | 71 (17.6%) |
| 25 to 34 Years | 21 (3.5%) | 112 (17.5%) |
| 35 to 44 Years | 42 (8.3%) | 85 (16.1%) |
| 45 to 54 Years | 6 (1.8%) | 51 (15.5%) |
| 55 to 64 Years | 116 (27.0%) | 64 (11.5%) |
| 65 to 74 Years | 23 (15.9%) | 104 (22.2%) |
| 75 Years and over | 48 (22.0%) | 6 (2.9%) |
| Total | 517 (14.0%) | 600 (14.8%) |
Income Above Poverty by Sex and Age in Three Rivers
According to the poverty statistics in Three Rivers, males aged 15 years and females aged under 5 years are the age groups that are most secure financially, with 100.0% of males and 100.0% of females in these age groups living above the poverty line.
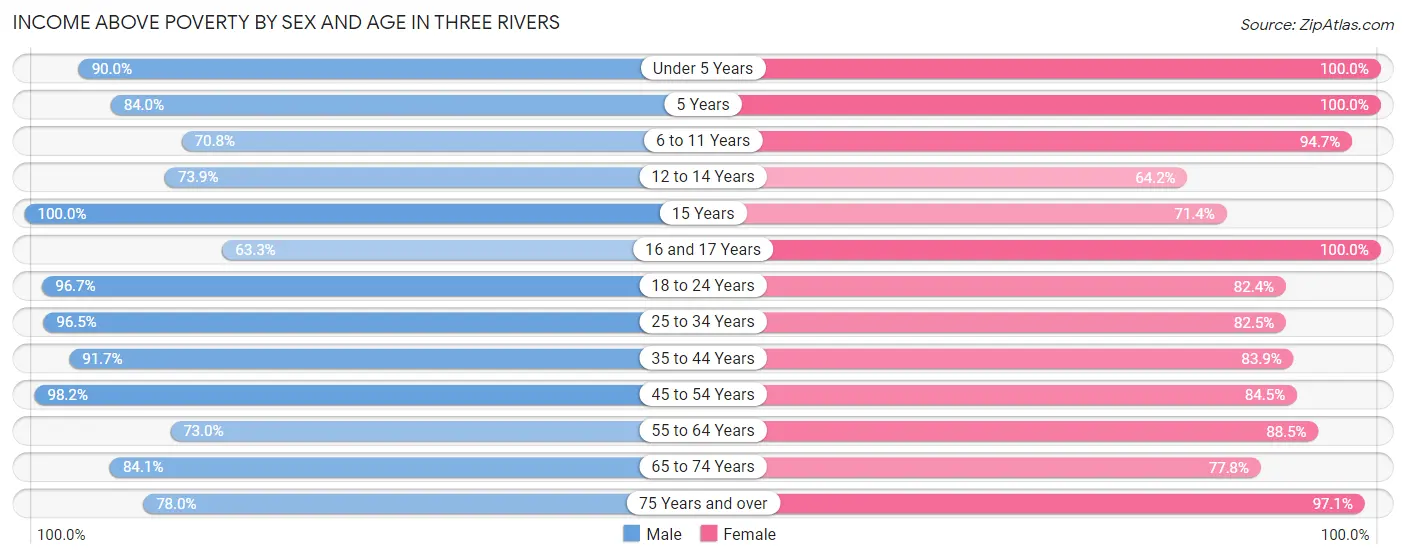
| Age Bracket | Male | Female |
| Under 5 Years | 331 (89.9%) | 197 (100.0%) |
| 5 Years | 42 (84.0%) | 48 (100.0%) |
| 6 to 11 Years | 294 (70.8%) | 377 (94.7%) |
| 12 to 14 Years | 51 (73.9%) | 136 (64.1%) |
| 15 Years | 35 (100.0%) | 25 (71.4%) |
| 16 and 17 Years | 112 (63.3%) | 47 (100.0%) |
| 18 to 24 Years | 353 (96.7%) | 333 (82.4%) |
| 25 to 34 Years | 579 (96.5%) | 527 (82.5%) |
| 35 to 44 Years | 464 (91.7%) | 442 (83.9%) |
| 45 to 54 Years | 318 (98.2%) | 278 (84.5%) |
| 55 to 64 Years | 313 (73.0%) | 491 (88.5%) |
| 65 to 74 Years | 122 (84.1%) | 364 (77.8%) |
| 75 Years and over | 170 (78.0%) | 198 (97.1%) |
| Total | 3,184 (86.0%) | 3,463 (85.2%) |
Income Below Poverty Among Married-Couple Families in Three Rivers
The poverty statistics for married-couple families in Three Rivers show that 1.7% or 16 of the total 943 families live below the poverty line. Families with 1 or 2 children have the highest poverty rate of 4.6%, comprising of 16 families. On the other hand, families with no children have the lowest poverty rate of 0.0%, which includes 0 families.
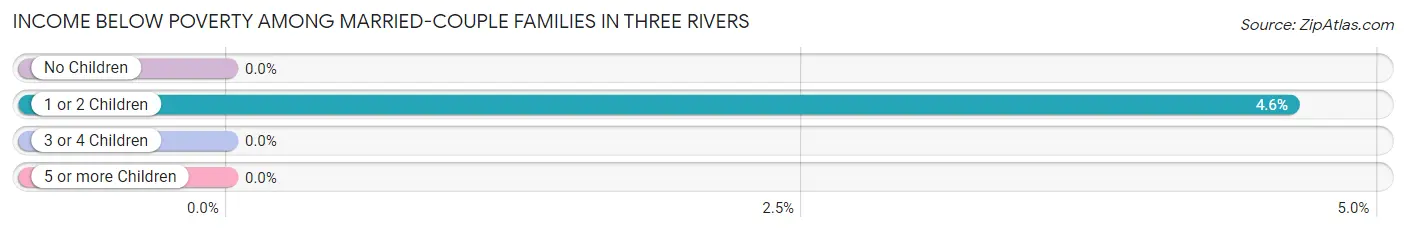
| Children | Above Poverty | Below Poverty |
| No Children | 417 (100.0%) | 0 (0.0%) |
| 1 or 2 Children | 330 (95.4%) | 16 (4.6%) |
| 3 or 4 Children | 180 (100.0%) | 0 (0.0%) |
| 5 or more Children | 0 (0.0%) | 0 (0.0%) |
| Total | 927 (98.3%) | 16 (1.7%) |
Income Below Poverty Among Single-Parent Households in Three Rivers
According to the poverty data in Three Rivers, 4.0% or 8 single-father households and 25.5% or 184 single-mother households are living below the poverty line. Among single-father households, those with 3 or 4 children have the highest poverty rate, with 8 households (50.0%) experiencing poverty. Likewise, among single-mother households, those with 3 or 4 children have the highest poverty rate, with 53 households (91.4%) falling below the poverty line.
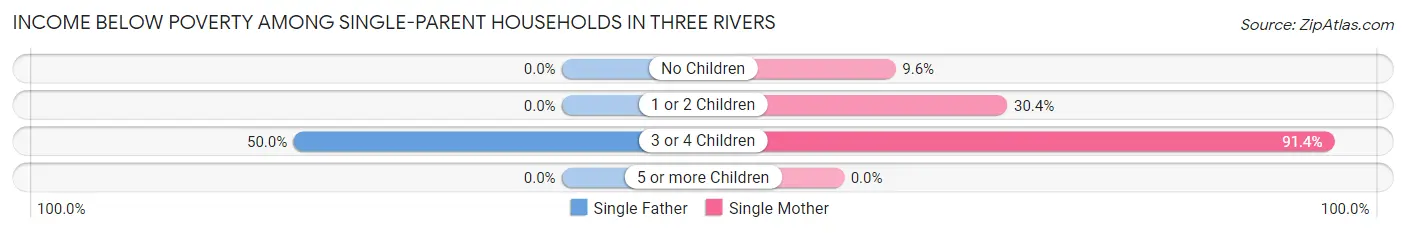
| Children | Single Father | Single Mother |
| No Children | 0 (0.0%) | 33 (9.6%) |
| 1 or 2 Children | 0 (0.0%) | 98 (30.4%) |
| 3 or 4 Children | 8 (50.0%) | 53 (91.4%) |
| 5 or more Children | 0 (0.0%) | 0 (0.0%) |
| Total | 8 (4.0%) | 184 (25.5%) |
Income Below Poverty Among Married-Couple vs Single-Parent Households in Three Rivers
The poverty data for Three Rivers shows that 16 of the married-couple family households (1.7%) and 192 of the single-parent households (20.8%) are living below the poverty level. Within the married-couple family households, those with 1 or 2 children have the highest poverty rate, with 16 households (4.6%) falling below the poverty line. Among the single-parent households, those with 3 or 4 children have the highest poverty rate, with 61 household (82.4%) living below poverty.
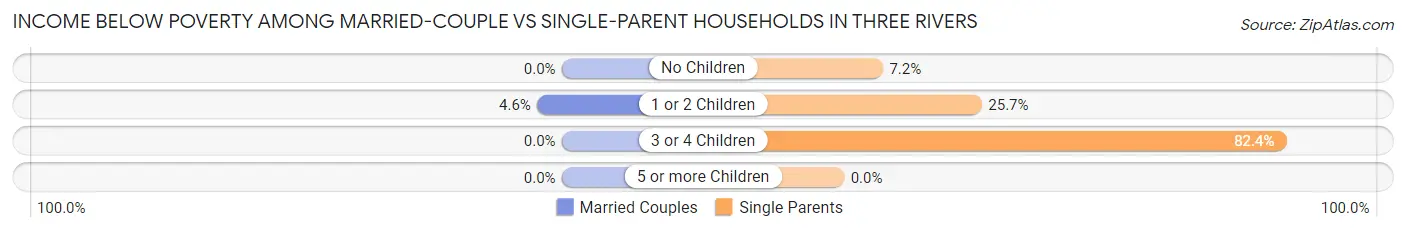
| Children | Married-Couple Families | Single-Parent Households |
| No Children | 0 (0.0%) | 33 (7.2%) |
| 1 or 2 Children | 16 (4.6%) | 98 (25.7%) |
| 3 or 4 Children | 0 (0.0%) | 61 (82.4%) |
| 5 or more Children | 0 (0.0%) | 0 (0.0%) |
| Total | 16 (1.7%) | 192 (20.8%) |
Race in Three Rivers
The most populous races in Three Rivers are White / Caucasian (6,032 | 76.1%), Two or more Races (831 | 10.5%), and Black / African American (812 | 10.2%).
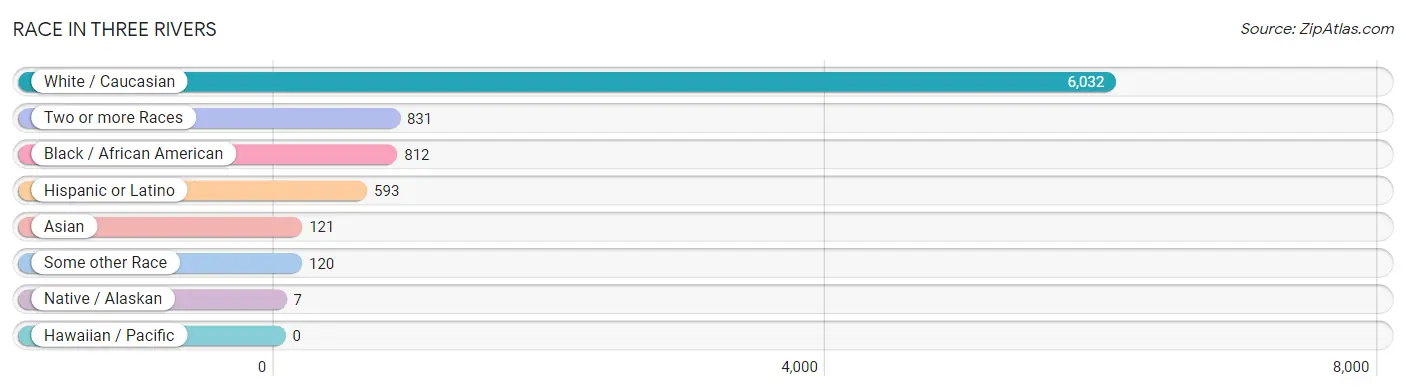
| Race | # Population | % Population |
| Asian | 121 | 1.5% |
| Black / African American | 812 | 10.2% |
| Hawaiian / Pacific | 0 | 0.0% |
| Hispanic or Latino | 593 | 7.5% |
| Native / Alaskan | 7 | 0.1% |
| White / Caucasian | 6,032 | 76.1% |
| Two or more Races | 831 | 10.5% |
| Some other Race | 120 | 1.5% |
| Total | 7,923 | 100.0% |
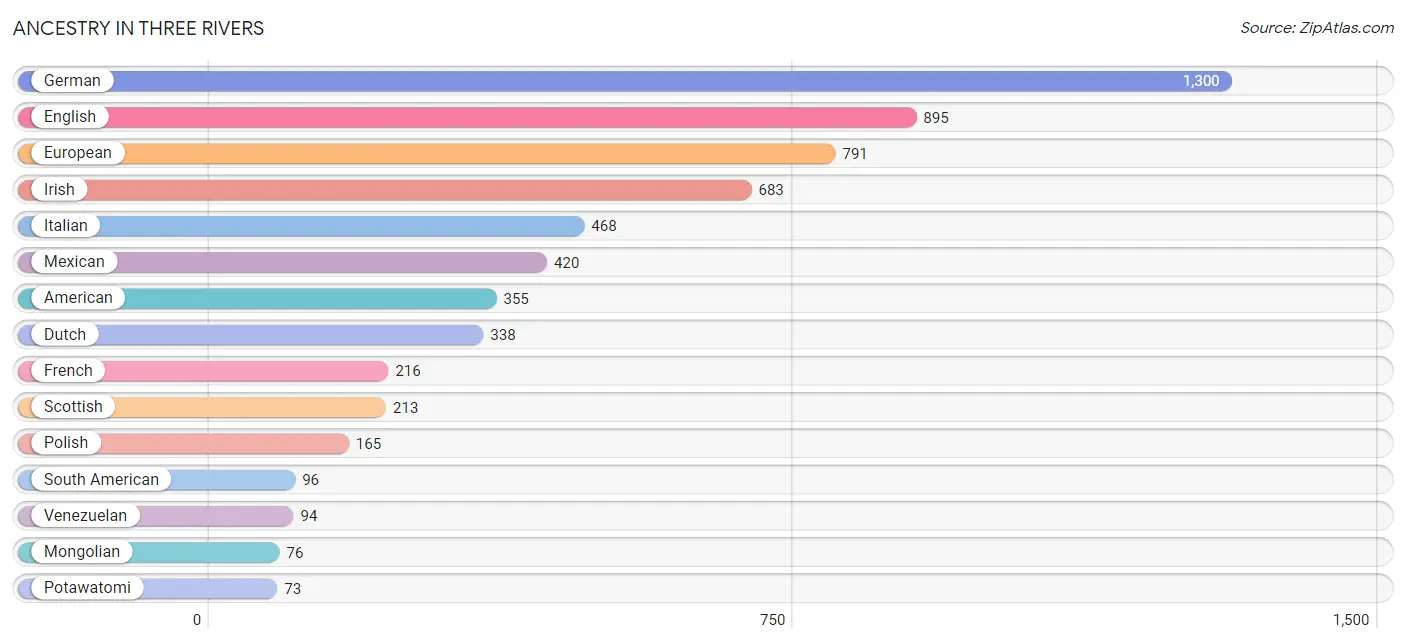
Ancestry in Three Rivers
The most populous ancestries reported in Three Rivers are German (1,300 | 16.4%), English (895 | 11.3%), European (791 | 10.0%), Irish (683 | 8.6%), and Italian (468 | 5.9%), together accounting for 52.2% of all Three Rivers residents.
| Ancestry | # Population | % Population |
| African | 8 | 0.1% |
| American | 355 | 4.5% |
| Arab | 59 | 0.7% |
| Austrian | 17 | 0.2% |
| Bhutanese | 16 | 0.2% |
| British | 2 | 0.0% |
| Bulgarian | 14 | 0.2% |
| Cherokee | 38 | 0.5% |
| Chickasaw | 3 | 0.0% |
| Chilean | 2 | 0.0% |
| Chippewa | 12 | 0.2% |
| Czech | 11 | 0.1% |
| Danish | 15 | 0.2% |
| Dutch | 338 | 4.3% |
| Eastern European | 18 | 0.2% |
| English | 895 | 11.3% |
| European | 791 | 10.0% |
| Finnish | 35 | 0.4% |
| French | 216 | 2.7% |
| French Canadian | 44 | 0.6% |
| German | 1,300 | 16.4% |
| Hungarian | 15 | 0.2% |
| Irish | 683 | 8.6% |
| Iroquois | 3 | 0.0% |
| Italian | 468 | 5.9% |
| Korean | 45 | 0.6% |
| Lebanese | 12 | 0.2% |
| Maltese | 17 | 0.2% |
| Mexican | 420 | 5.3% |
| Mongolian | 76 | 1.0% |
| Palestinian | 10 | 0.1% |
| Pennsylvania German | 29 | 0.4% |
| Polish | 165 | 2.1% |
| Potawatomi | 73 | 0.9% |
| Puerto Rican | 12 | 0.2% |
| Scandinavian | 4 | 0.1% |
| Scotch-Irish | 37 | 0.5% |
| Scottish | 213 | 2.7% |
| Shoshone | 15 | 0.2% |
| Sioux | 7 | 0.1% |
| South American | 96 | 1.2% |
| Spaniard | 3 | 0.0% |
| Spanish | 16 | 0.2% |
| Sri Lankan | 3 | 0.0% |
| Subsaharan African | 8 | 0.1% |
| Swedish | 7 | 0.1% |
| Thai | 59 | 0.7% |
| Ukrainian | 8 | 0.1% |
| Venezuelan | 94 | 1.2% | View All 49 Rows |
Immigrants in Three Rivers
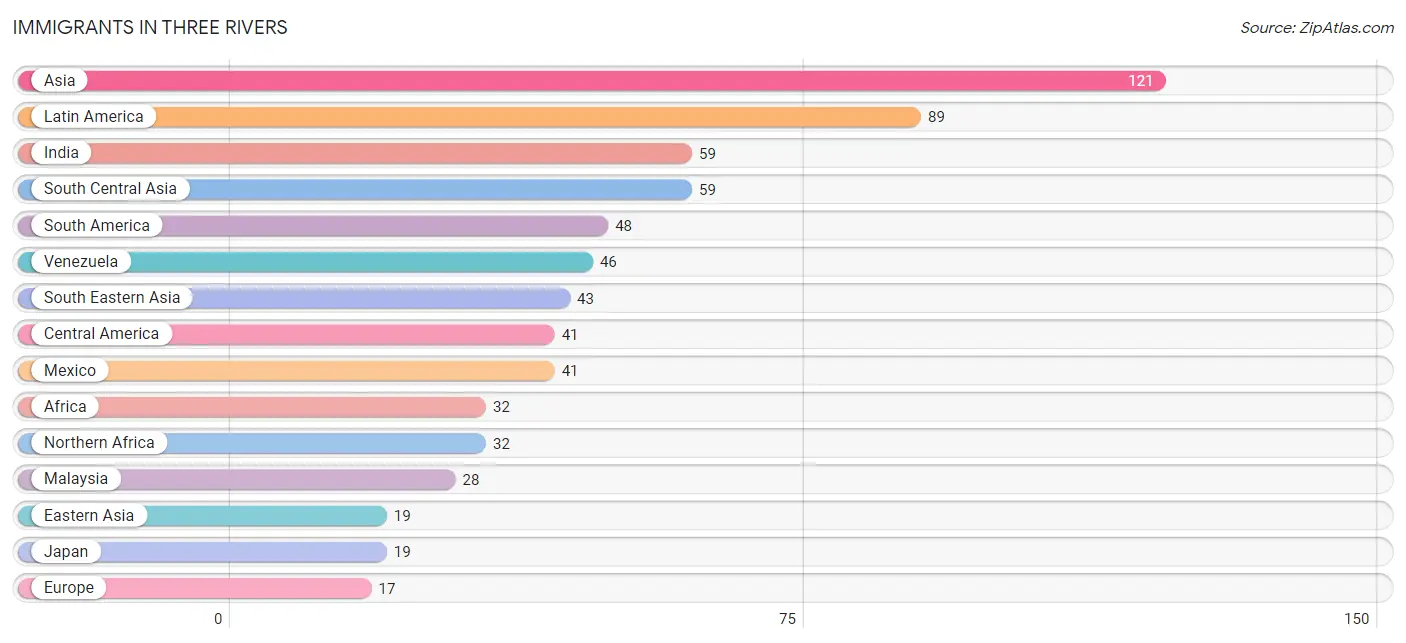
The most numerous immigrant groups reported in Three Rivers came from Asia (121 | 1.5%), Latin America (89 | 1.1%), India (59 | 0.7%), South Central Asia (59 | 0.7%), and South America (48 | 0.6%), together accounting for 4.7% of all Three Rivers residents.
| Immigration Origin | # Population | % Population |
| Africa | 32 | 0.4% |
| Asia | 121 | 1.5% |
| Canada | 9 | 0.1% |
| Central America | 41 | 0.5% |
| Chile | 2 | 0.0% |
| Eastern Asia | 19 | 0.2% |
| Europe | 17 | 0.2% |
| India | 59 | 0.7% |
| Japan | 19 | 0.2% |
| Latin America | 89 | 1.1% |
| Malaysia | 28 | 0.4% |
| Mexico | 41 | 0.5% |
| Northern Africa | 32 | 0.4% |
| Philippines | 15 | 0.2% |
| South America | 48 | 0.6% |
| South Central Asia | 59 | 0.7% |
| South Eastern Asia | 43 | 0.5% |
| Southern Europe | 17 | 0.2% |
| Venezuela | 46 | 0.6% | View All 19 Rows |
Sex and Age in Three Rivers
Sex and Age in Three Rivers
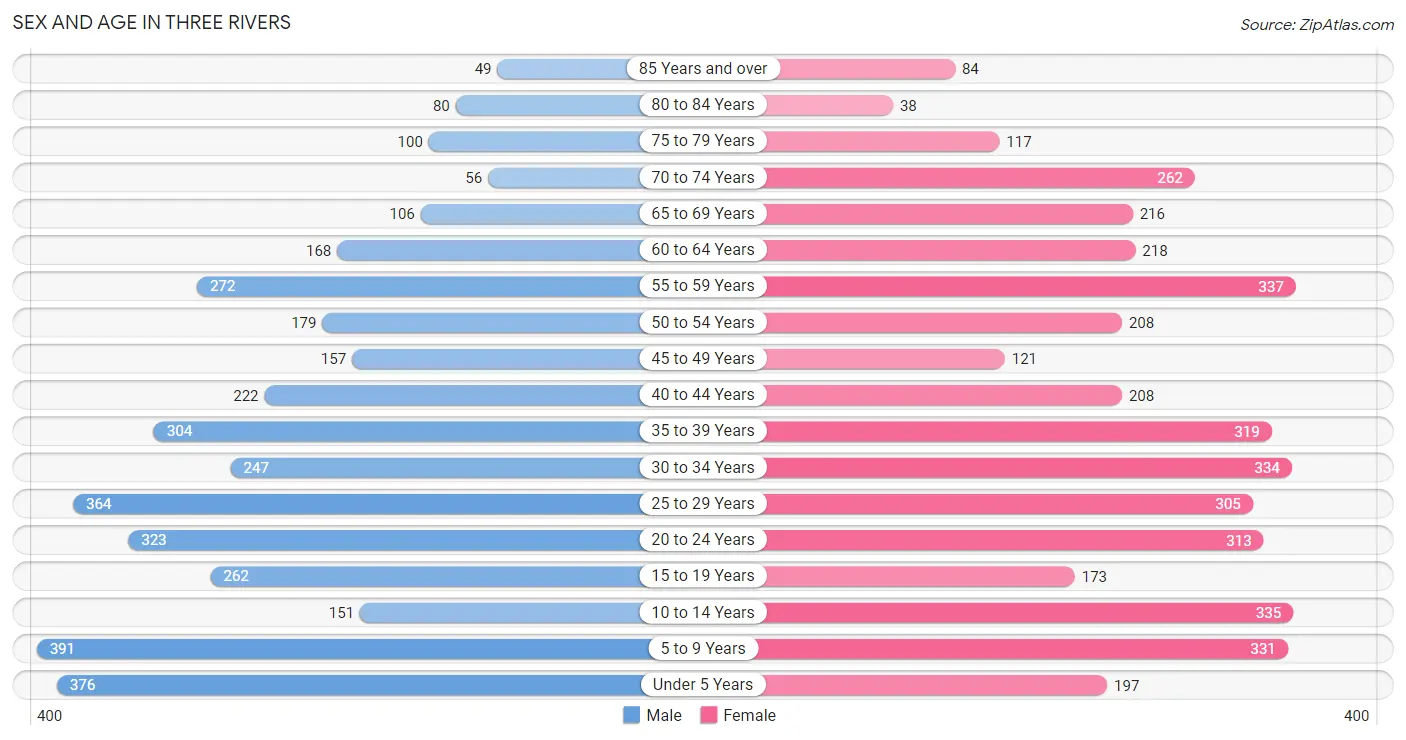
The most populous age groups in Three Rivers are 5 to 9 Years (391 | 10.3%) for men and 55 to 59 Years (337 | 8.2%) for women.
| Age Bracket | Male | Female |
| Under 5 Years | 376 (9.9%) | 197 (4.8%) |
| 5 to 9 Years | 391 (10.3%) | 331 (8.0%) |
| 10 to 14 Years | 151 (4.0%) | 335 (8.1%) |
| 15 to 19 Years | 262 (6.9%) | 173 (4.2%) |
| 20 to 24 Years | 323 (8.5%) | 313 (7.6%) |
| 25 to 29 Years | 364 (9.6%) | 305 (7.4%) |
| 30 to 34 Years | 247 (6.5%) | 334 (8.1%) |
| 35 to 39 Years | 304 (8.0%) | 319 (7.7%) |
| 40 to 44 Years | 222 (5.8%) | 208 (5.1%) |
| 45 to 49 Years | 157 (4.1%) | 121 (2.9%) |
| 50 to 54 Years | 179 (4.7%) | 208 (5.1%) |
| 55 to 59 Years | 272 (7.1%) | 337 (8.2%) |
| 60 to 64 Years | 168 (4.4%) | 218 (5.3%) |
| 65 to 69 Years | 106 (2.8%) | 216 (5.2%) |
| 70 to 74 Years | 56 (1.5%) | 262 (6.4%) |
| 75 to 79 Years | 100 (2.6%) | 117 (2.8%) |
| 80 to 84 Years | 80 (2.1%) | 38 (0.9%) |
| 85 Years and over | 49 (1.3%) | 84 (2.0%) |
| Total | 3,807 (100.0%) | 4,116 (100.0%) |
Families and Households in Three Rivers
Median Family Size in Three Rivers
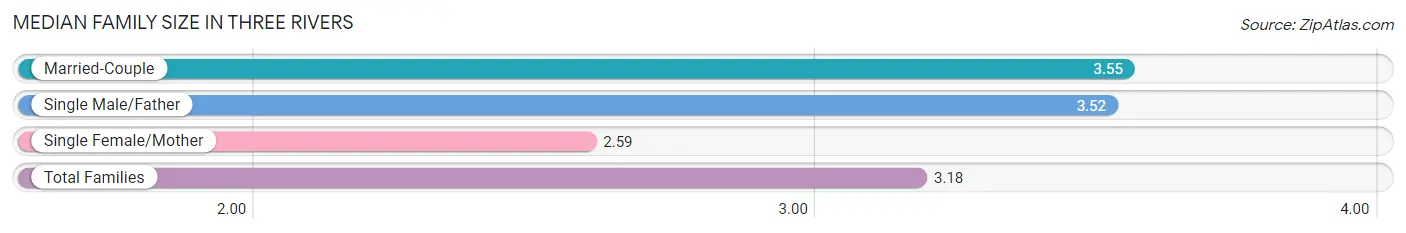
The median family size in Three Rivers is 3.18 persons per family, with married-couple families (943 | 50.5%) accounting for the largest median family size of 3.55 persons per family. On the other hand, single female/mother families (723 | 38.7%) represent the smallest median family size with 2.59 persons per family.
| Family Type | # Families | Family Size |
| Married-Couple | 943 (50.5%) | 3.55 |
| Single Male/Father | 202 (10.8%) | 3.52 |
| Single Female/Mother | 723 (38.7%) | 2.59 |
| Total Families | 1,868 (100.0%) | 3.18 |
Median Household Size in Three Rivers
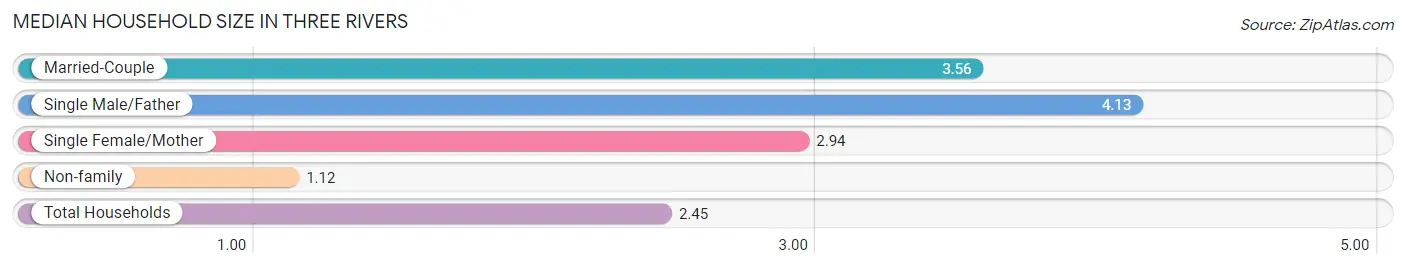
The median household size in Three Rivers is 2.45 persons per household, with single male/father households (202 | 6.4%) accounting for the largest median household size of 4.13 persons per household. non-family households (1,305 | 41.1%) represent the smallest median household size with 1.12 persons per household.
| Household Type | # Households | Household Size |
| Married-Couple | 943 (29.7%) | 3.56 |
| Single Male/Father | 202 (6.4%) | 4.13 |
| Single Female/Mother | 723 (22.8%) | 2.94 |
| Non-family | 1,305 (41.1%) | 1.12 |
| Total Households | 3,173 (100.0%) | 2.45 |
Household Size by Marriage Status in Three Rivers
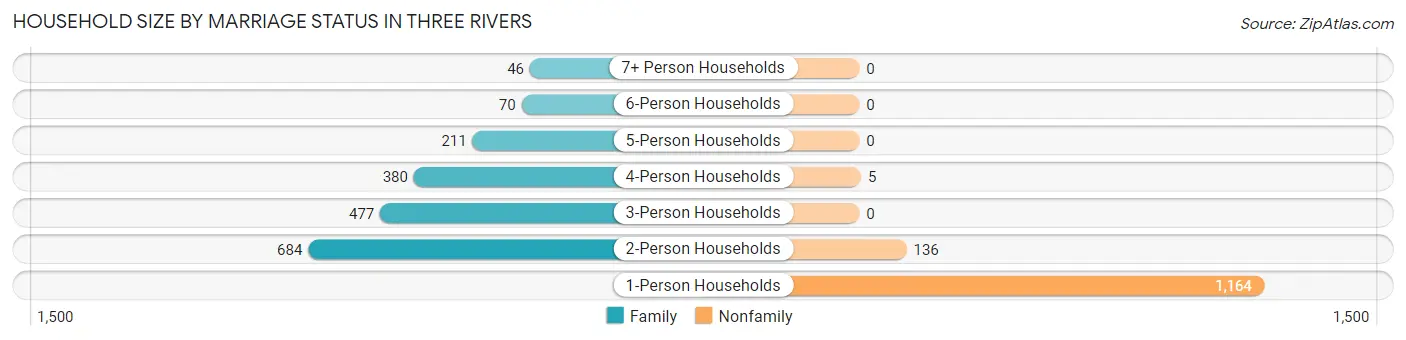
Out of a total of 3,173 households in Three Rivers, 1,868 (58.9%) are family households, while 1,305 (41.1%) are nonfamily households. The most numerous type of family households are 2-person households, comprising 684, and the most common type of nonfamily households are 1-person households, comprising 1,164.
| Household Size | Family Households | Nonfamily Households |
| 1-Person Households | - | 1,164 (36.7%) |
| 2-Person Households | 684 (21.6%) | 136 (4.3%) |
| 3-Person Households | 477 (15.0%) | 0 (0.0%) |
| 4-Person Households | 380 (12.0%) | 5 (0.2%) |
| 5-Person Households | 211 (6.7%) | 0 (0.0%) |
| 6-Person Households | 70 (2.2%) | 0 (0.0%) |
| 7+ Person Households | 46 (1.5%) | 0 (0.0%) |
| Total | 1,868 (58.9%) | 1,305 (41.1%) |
Female Fertility in Three Rivers
Fertility by Age in Three Rivers
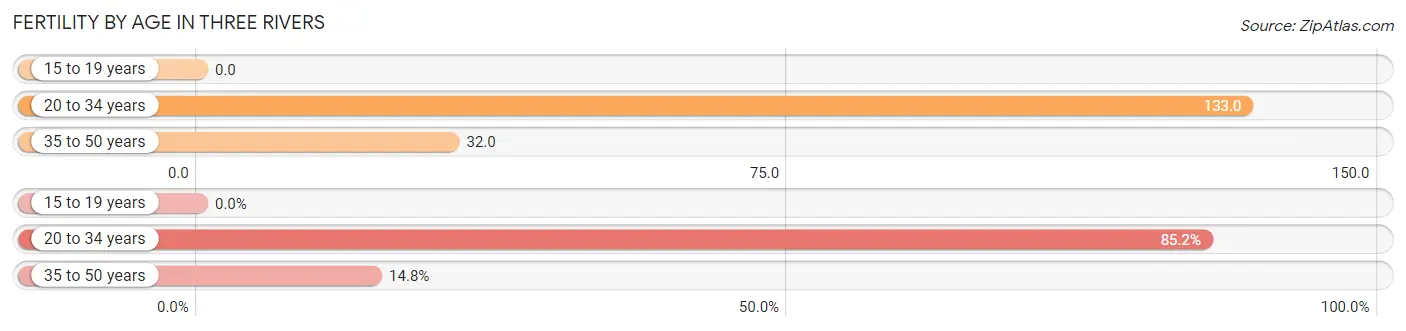
Average fertility rate in Three Rivers is 82.0 births per 1,000 women. Women in the age bracket of 20 to 34 years have the highest fertility rate with 133.0 births per 1,000 women. Women in the age bracket of 20 to 34 years acount for 85.2% of all women with births.
| Age Bracket | Women with Births | Births / 1,000 Women |
| 15 to 19 years | 0 (0.0%) | 0.0 |
| 20 to 34 years | 127 (85.2%) | 133.0 |
| 35 to 50 years | 22 (14.8%) | 32.0 |
| Total | 149 (100.0%) | 82.0 |
Fertility by Age by Marriage Status in Three Rivers
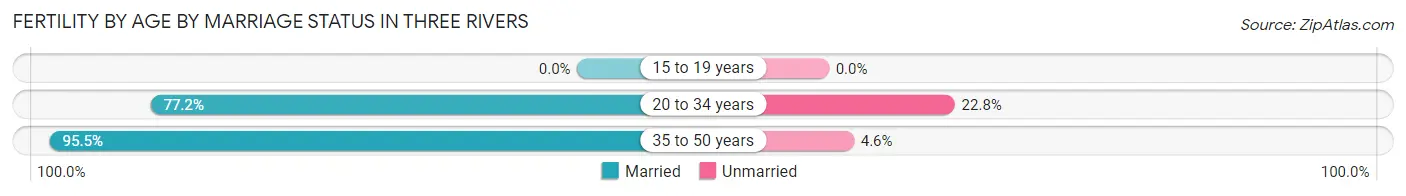
79.9% of women with births (149) in Three Rivers are married. The highest percentage of unmarried women with births falls into 20 to 34 years age bracket with 22.8% of them unmarried at the time of birth, while the lowest percentage of unmarried women with births belong to 35 to 50 years age bracket with 4.5% of them unmarried.
| Age Bracket | Married | Unmarried |
| 15 to 19 years | 0 (0.0%) | 0 (0.0%) |
| 20 to 34 years | 98 (77.2%) | 29 (22.8%) |
| 35 to 50 years | 21 (95.5%) | 1 (4.5%) |
| Total | 119 (79.9%) | 30 (20.1%) |
Fertility by Education in Three Rivers
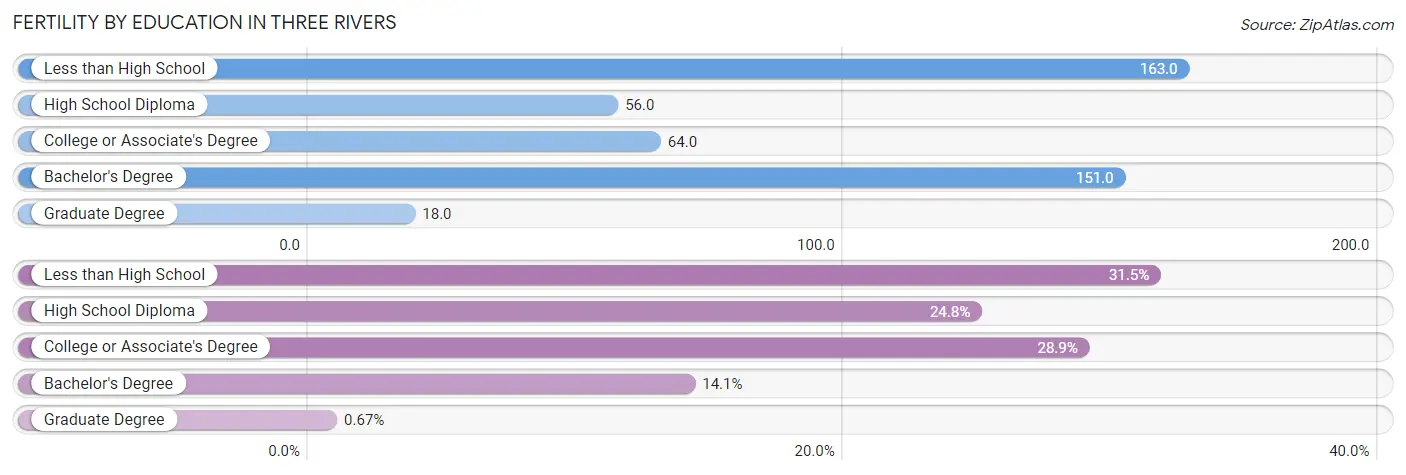
Average fertility rate in Three Rivers is 82.0 births per 1,000 women. Women with the education attainment of less than high school have the highest fertility rate of 163.0 births per 1,000 women, while women with the education attainment of graduate degree have the lowest fertility at 18.0 births per 1,000 women. Women with the education attainment of less than high school represent 31.5% of all women with births.
| Educational Attainment | Women with Births | Births / 1,000 Women |
| Less than High School | 47 (31.5%) | 163.0 |
| High School Diploma | 37 (24.8%) | 56.0 |
| College or Associate's Degree | 43 (28.9%) | 64.0 |
| Bachelor's Degree | 21 (14.1%) | 151.0 |
| Graduate Degree | 1 (0.7%) | 18.0 |
| Total | 149 (100.0%) | 82.0 |
Fertility by Education by Marriage Status in Three Rivers
20.1% of women with births in Three Rivers are unmarried. Women with the educational attainment of less than high school are most likely to be married with 100.0% of them married at childbirth, while women with the educational attainment of graduate degree are least likely to be married with 100.0% of them unmarried at childbirth.
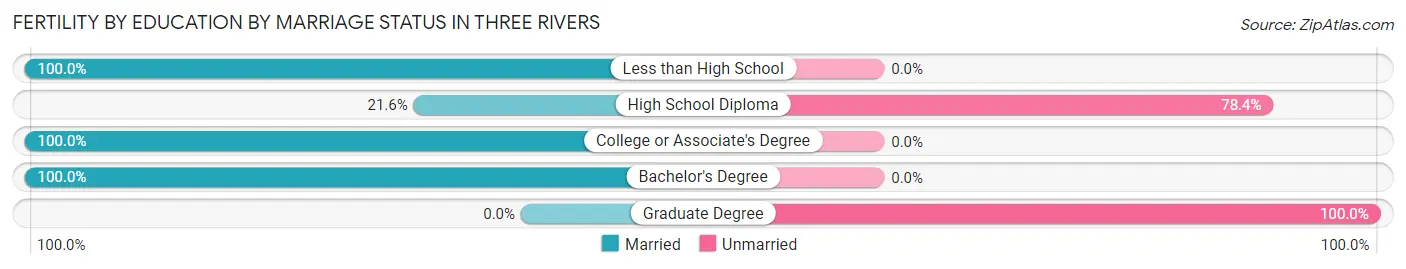
| Educational Attainment | Married | Unmarried |
| Less than High School | 47 (100.0%) | 0 (0.0%) |
| High School Diploma | 8 (21.6%) | 29 (78.4%) |
| College or Associate's Degree | 43 (100.0%) | 0 (0.0%) |
| Bachelor's Degree | 21 (100.0%) | 0 (0.0%) |
| Graduate Degree | 0 (0.0%) | 1 (100.0%) |
| Total | 119 (79.9%) | 30 (20.1%) |
Employment Characteristics in Three Rivers
Employment by Class of Employer in Three Rivers
Among the 3,584 employed individuals in Three Rivers, private company employees (2,818 | 78.6%), not-for-profit organizations (249 | 7.0%), and local government employees (180 | 5.0%) make up the most common classes of employment.
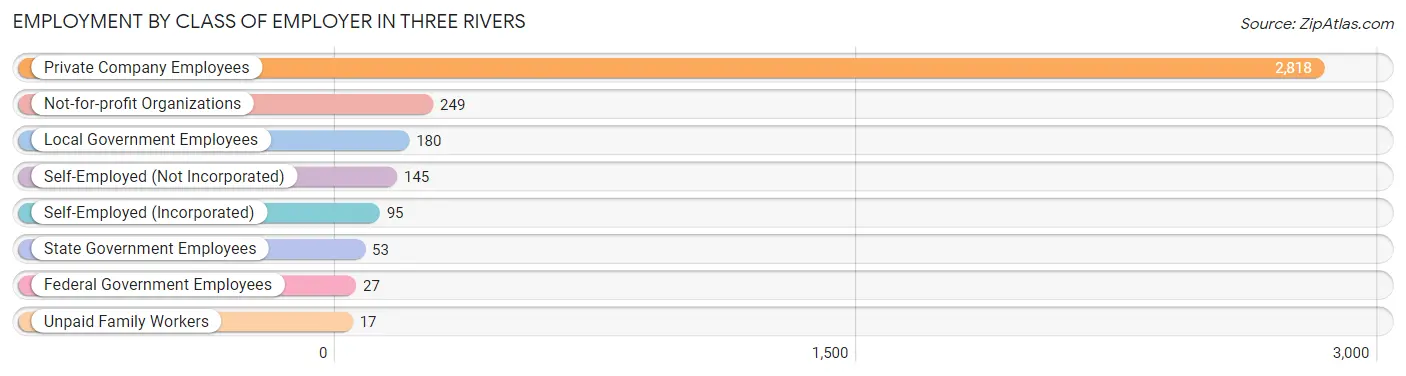
| Employer Class | # Employees | % Employees |
| Private Company Employees | 2,818 | 78.6% |
| Self-Employed (Incorporated) | 95 | 2.6% |
| Self-Employed (Not Incorporated) | 145 | 4.1% |
| Not-for-profit Organizations | 249 | 7.0% |
| Local Government Employees | 180 | 5.0% |
| State Government Employees | 53 | 1.5% |
| Federal Government Employees | 27 | 0.7% |
| Unpaid Family Workers | 17 | 0.5% |
| Total | 3,584 | 100.0% |
Employment Status by Age in Three Rivers
According to the labor force statistics for Three Rivers, out of the total population over 16 years of age (6,072), 65.5% or 3,977 individuals are in the labor force, with 8.6% or 342 of them unemployed. The age group with the highest labor force participation rate is 35 to 44 years, with 88.4% or 931 individuals in the labor force. Within the labor force, the 35 to 44 years age range has the highest percentage of unemployed individuals, with 20.3% or 189 of them being unemployed.
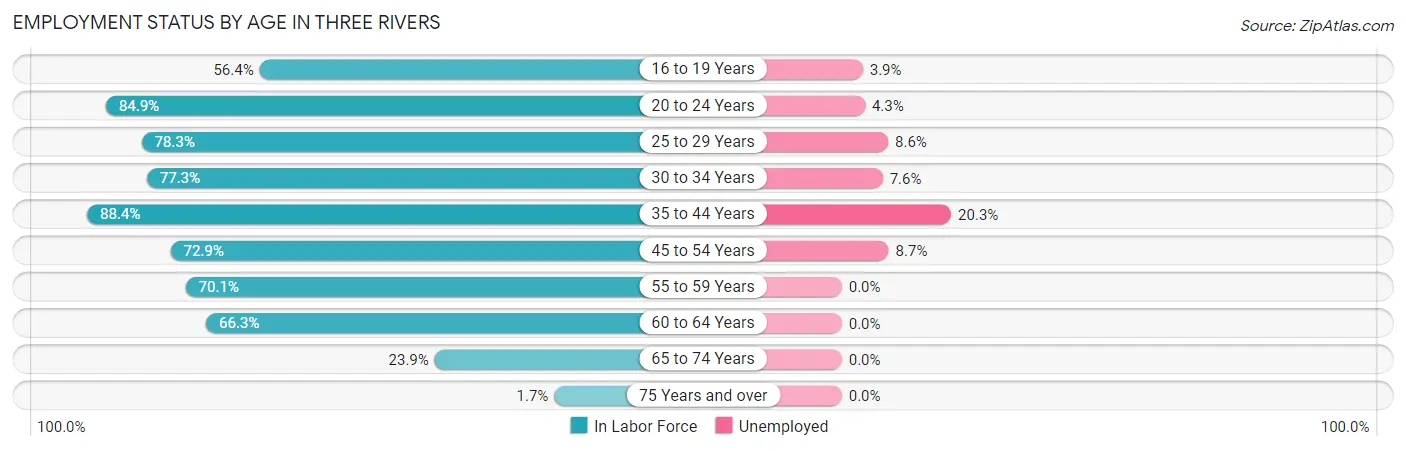
| Age Bracket | In Labor Force | Unemployed |
| 16 to 19 Years | 206 (56.4%) | 8 (3.9%) |
| 20 to 24 Years | 540 (84.9%) | 23 (4.3%) |
| 25 to 29 Years | 524 (78.3%) | 45 (8.6%) |
| 30 to 34 Years | 449 (77.3%) | 34 (7.6%) |
| 35 to 44 Years | 931 (88.4%) | 189 (20.3%) |
| 45 to 54 Years | 485 (72.9%) | 42 (8.7%) |
| 55 to 59 Years | 427 (70.1%) | 0 (0.0%) |
| 60 to 64 Years | 256 (66.3%) | 0 (0.0%) |
| 65 to 74 Years | 153 (23.9%) | 0 (0.0%) |
| 75 Years and over | 8 (1.7%) | 0 (0.0%) |
| Total | 3,977 (65.5%) | 342 (8.6%) |
Employment Status by Educational Attainment in Three Rivers
According to labor force statistics for Three Rivers, 77.5% of individuals (3,071) out of the total population between 25 and 64 years of age (3,963) are in the labor force, with 10.1% or 310 of them being unemployed. The group with the highest labor force participation rate are those with the educational attainment of high school diploma, with 81.4% or 1,262 individuals in the labor force. Within the labor force, individuals with high school diploma education have the highest percentage of unemployment, with 12.0% or 151 of them being unemployed.
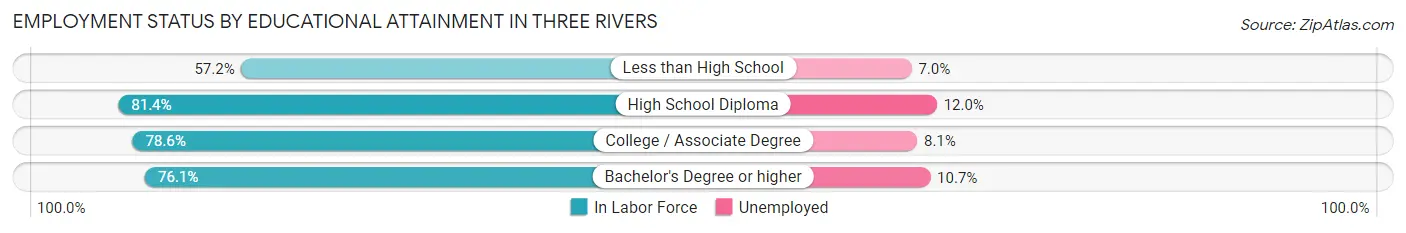
| Educational Attainment | In Labor Force | Unemployed |
| Less than High School | 187 (57.2%) | 23 (7.0%) |
| High School Diploma | 1,262 (81.4%) | 186 (12.0%) |
| College / Associate Degree | 1,117 (78.6%) | 115 (8.1%) |
| Bachelor's Degree or higher | 506 (76.1%) | 71 (10.7%) |
| Total | 3,071 (77.5%) | 400 (10.1%) |
Employment Occupations by Sex in Three Rivers
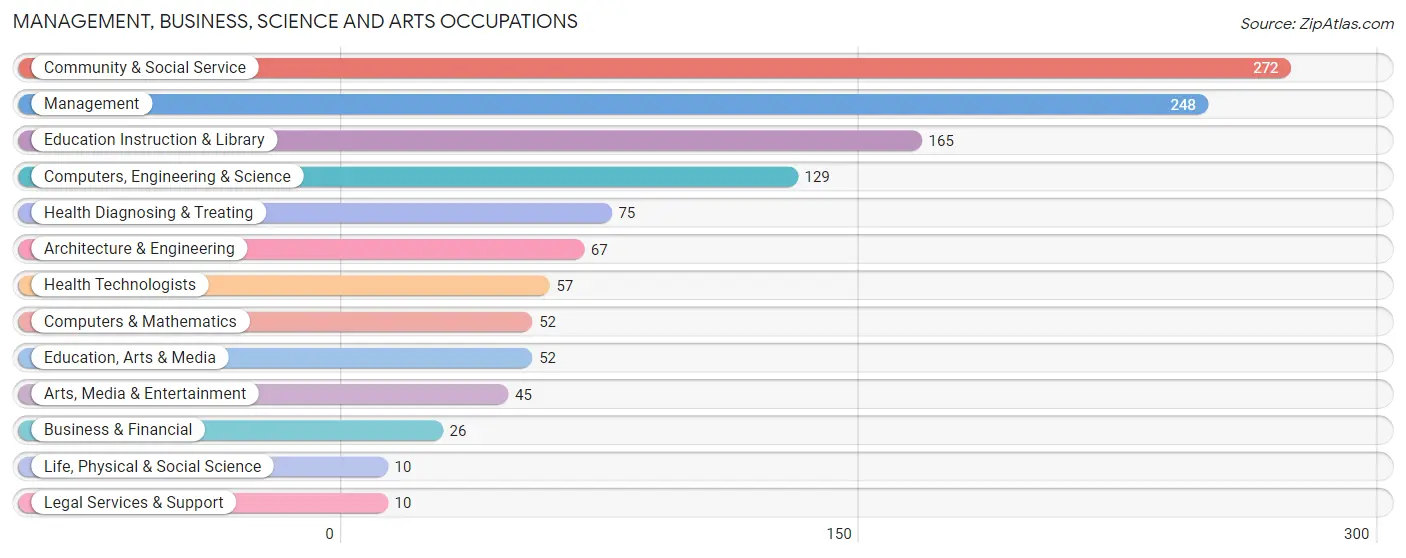
Management, Business, Science and Arts Occupations
The most common Management, Business, Science and Arts occupations in Three Rivers are Community & Social Service (272 | 7.5%), Management (248 | 6.8%), Education Instruction & Library (165 | 4.5%), Computers, Engineering & Science (129 | 3.5%), and Health Diagnosing & Treating (75 | 2.1%).
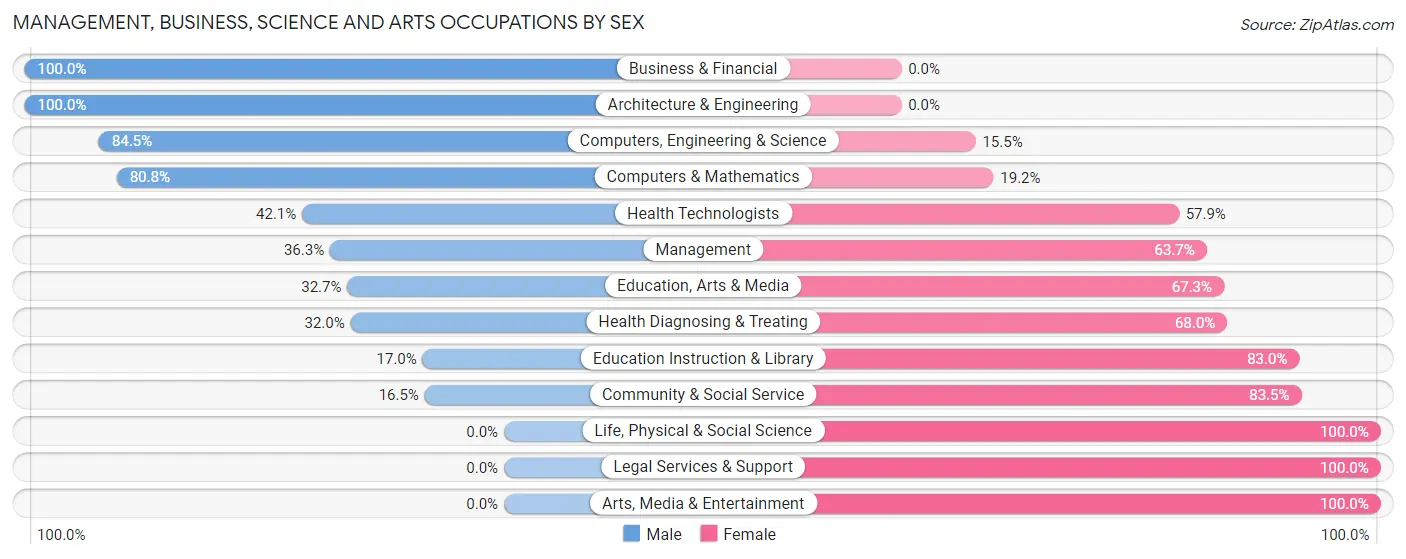
Management, Business, Science and Arts Occupations by Sex
Within the Management, Business, Science and Arts occupations in Three Rivers, the most male-oriented occupations are Business & Financial (100.0%), Architecture & Engineering (100.0%), and Computers, Engineering & Science (84.5%), while the most female-oriented occupations are Life, Physical & Social Science (100.0%), Legal Services & Support (100.0%), and Arts, Media & Entertainment (100.0%).
| Occupation | Male | Female |
| Management | 90 (36.3%) | 158 (63.7%) |
| Business & Financial | 26 (100.0%) | 0 (0.0%) |
| Computers, Engineering & Science | 109 (84.5%) | 20 (15.5%) |
| Computers & Mathematics | 42 (80.8%) | 10 (19.2%) |
| Architecture & Engineering | 67 (100.0%) | 0 (0.0%) |
| Life, Physical & Social Science | 0 (0.0%) | 10 (100.0%) |
| Community & Social Service | 45 (16.5%) | 227 (83.5%) |
| Education, Arts & Media | 17 (32.7%) | 35 (67.3%) |
| Legal Services & Support | 0 (0.0%) | 10 (100.0%) |
| Education Instruction & Library | 28 (17.0%) | 137 (83.0%) |
| Arts, Media & Entertainment | 0 (0.0%) | 45 (100.0%) |
| Health Diagnosing & Treating | 24 (32.0%) | 51 (68.0%) |
| Health Technologists | 24 (42.1%) | 33 (57.9%) |
| Total (Category) | 294 (39.2%) | 456 (60.8%) |
| Total (Overall) | 1,843 (50.7%) | 1,795 (49.3%) |
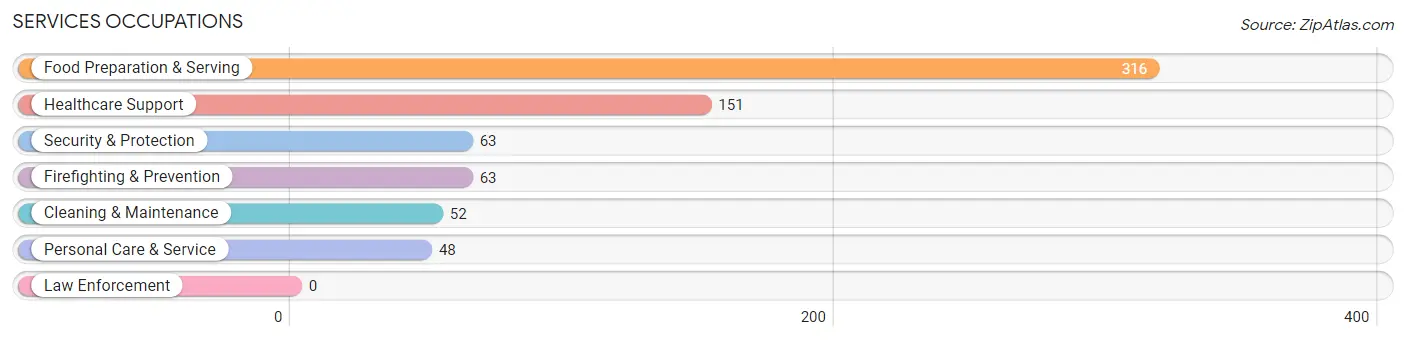
Services Occupations
The most common Services occupations in Three Rivers are Food Preparation & Serving (316 | 8.7%), Healthcare Support (151 | 4.2%), Security & Protection (63 | 1.7%), Firefighting & Prevention (63 | 1.7%), and Cleaning & Maintenance (52 | 1.4%).
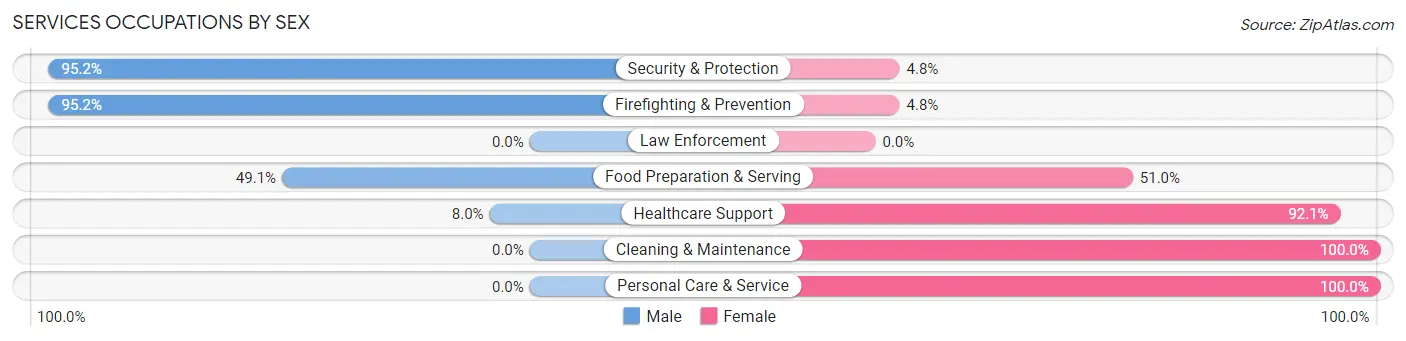
Services Occupations by Sex
Within the Services occupations in Three Rivers, the most male-oriented occupations are Security & Protection (95.2%), Firefighting & Prevention (95.2%), and Food Preparation & Serving (49.0%), while the most female-oriented occupations are Cleaning & Maintenance (100.0%), Personal Care & Service (100.0%), and Healthcare Support (92.0%).
| Occupation | Male | Female |
| Healthcare Support | 12 (8.0%) | 139 (92.0%) |
| Security & Protection | 60 (95.2%) | 3 (4.8%) |
| Firefighting & Prevention | 60 (95.2%) | 3 (4.8%) |
| Law Enforcement | 0 (0.0%) | 0 (0.0%) |
| Food Preparation & Serving | 155 (49.0%) | 161 (50.9%) |
| Cleaning & Maintenance | 0 (0.0%) | 52 (100.0%) |
| Personal Care & Service | 0 (0.0%) | 48 (100.0%) |
| Total (Category) | 227 (36.0%) | 403 (64.0%) |
| Total (Overall) | 1,843 (50.7%) | 1,795 (49.3%) |
Sales and Office Occupations
The most common Sales and Office occupations in Three Rivers are Sales & Related (328 | 9.0%), and Office & Administration (273 | 7.5%).
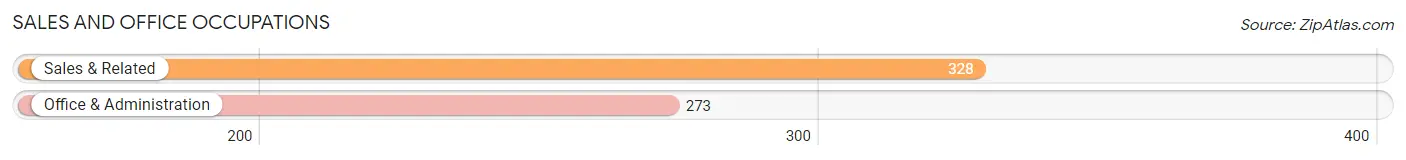
Sales and Office Occupations by Sex
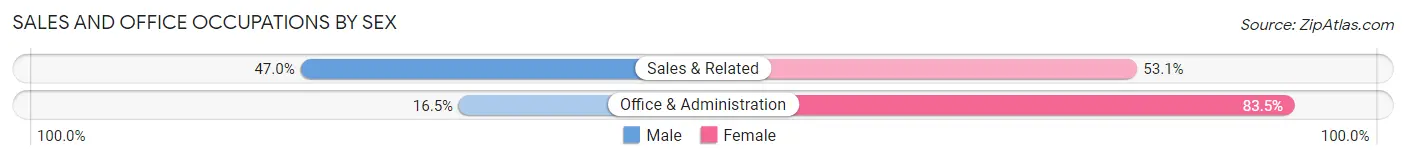
| Occupation | Male | Female |
| Sales & Related | 154 (46.9%) | 174 (53.0%) |
| Office & Administration | 45 (16.5%) | 228 (83.5%) |
| Total (Category) | 199 (33.1%) | 402 (66.9%) |
| Total (Overall) | 1,843 (50.7%) | 1,795 (49.3%) |
Natural Resources, Construction and Maintenance Occupations
The most common Natural Resources, Construction and Maintenance occupations in Three Rivers are Installation, Maintenance & Repair (159 | 4.4%), Construction & Extraction (114 | 3.1%), and Farming, Fishing & Forestry (47 | 1.3%).
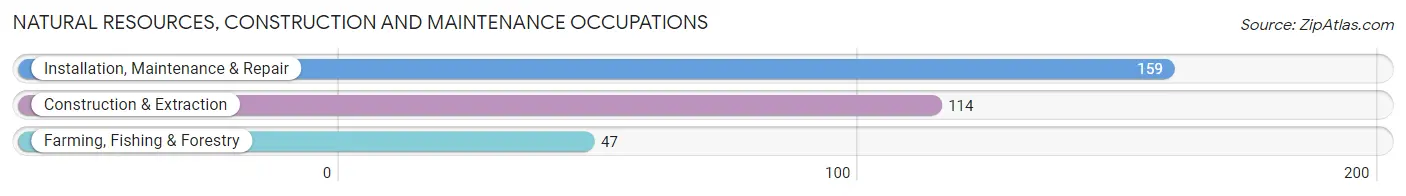
Natural Resources, Construction and Maintenance Occupations by Sex
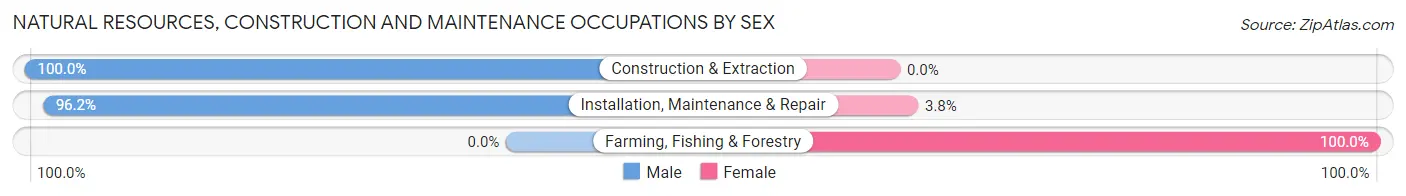
| Occupation | Male | Female |
| Farming, Fishing & Forestry | 0 (0.0%) | 47 (100.0%) |
| Construction & Extraction | 114 (100.0%) | 0 (0.0%) |
| Installation, Maintenance & Repair | 153 (96.2%) | 6 (3.8%) |
| Total (Category) | 267 (83.4%) | 53 (16.6%) |
| Total (Overall) | 1,843 (50.7%) | 1,795 (49.3%) |
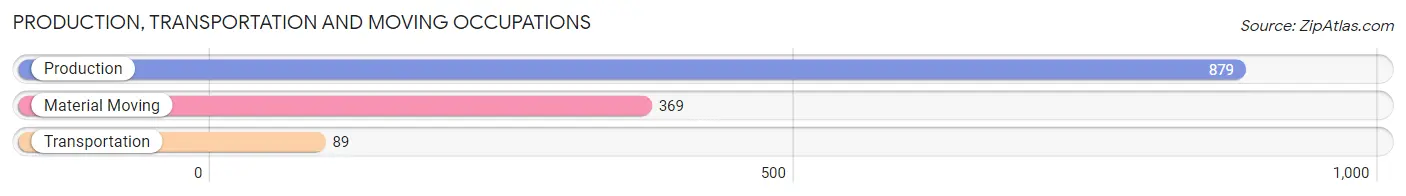
Production, Transportation and Moving Occupations
The most common Production, Transportation and Moving occupations in Three Rivers are Production (879 | 24.2%), Material Moving (369 | 10.1%), and Transportation (89 | 2.5%).
Production, Transportation and Moving Occupations by Sex
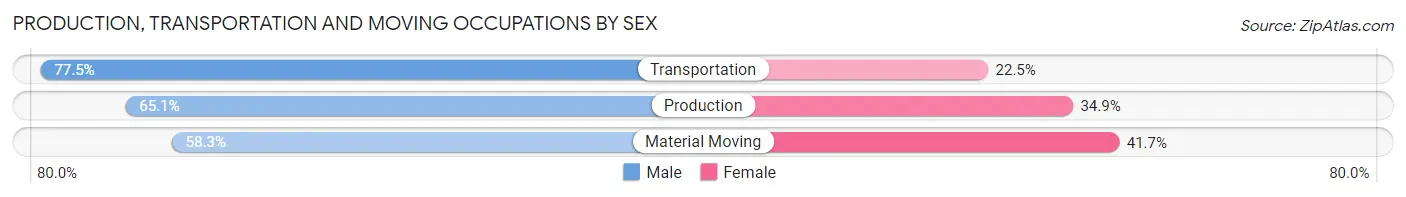
| Occupation | Male | Female |
| Production | 572 (65.1%) | 307 (34.9%) |
| Transportation | 69 (77.5%) | 20 (22.5%) |
| Material Moving | 215 (58.3%) | 154 (41.7%) |
| Total (Category) | 856 (64.0%) | 481 (36.0%) |
| Total (Overall) | 1,843 (50.7%) | 1,795 (49.3%) |
Employment Industries by Sex in Three Rivers
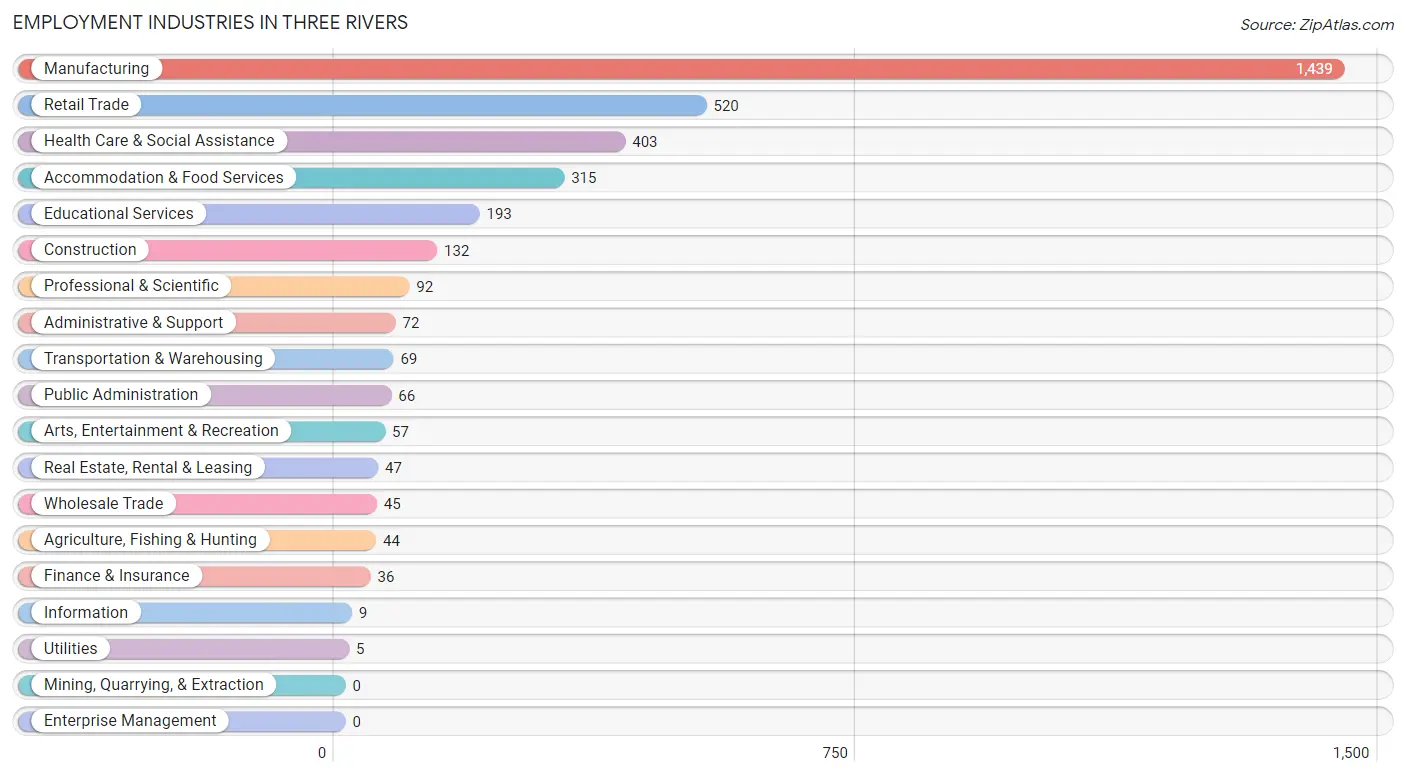
Employment Industries in Three Rivers
The major employment industries in Three Rivers include Manufacturing (1,439 | 39.6%), Retail Trade (520 | 14.3%), Health Care & Social Assistance (403 | 11.1%), Accommodation & Food Services (315 | 8.7%), and Educational Services (193 | 5.3%).
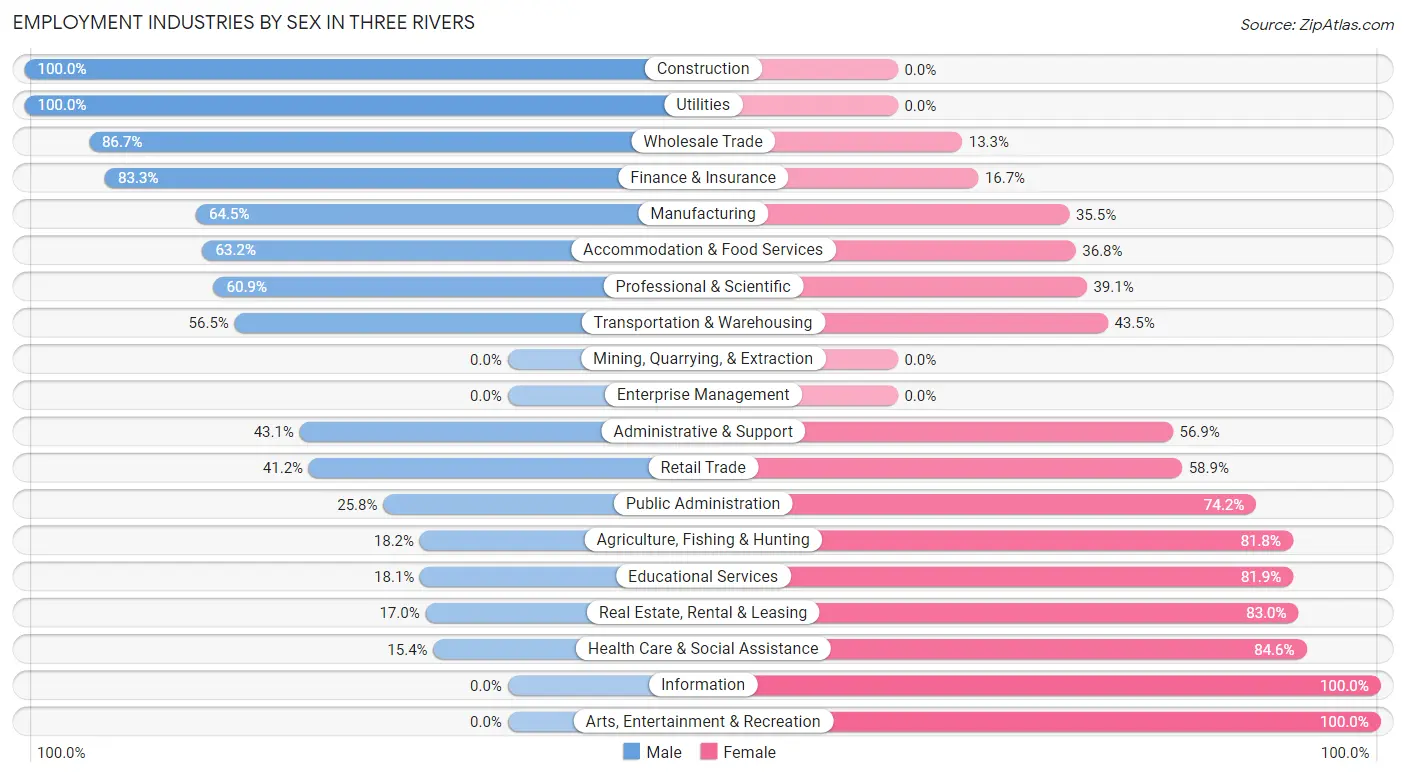
Employment Industries by Sex in Three Rivers
The Three Rivers industries that see more men than women are Construction (100.0%), Utilities (100.0%), and Wholesale Trade (86.7%), whereas the industries that tend to have a higher number of women are Information (100.0%), Arts, Entertainment & Recreation (100.0%), and Health Care & Social Assistance (84.6%).
| Industry | Male | Female |
| Agriculture, Fishing & Hunting | 8 (18.2%) | 36 (81.8%) |
| Mining, Quarrying, & Extraction | 0 (0.0%) | 0 (0.0%) |
| Construction | 132 (100.0%) | 0 (0.0%) |
| Manufacturing | 928 (64.5%) | 511 (35.5%) |
| Wholesale Trade | 39 (86.7%) | 6 (13.3%) |
| Retail Trade | 214 (41.1%) | 306 (58.9%) |
| Transportation & Warehousing | 39 (56.5%) | 30 (43.5%) |
| Utilities | 5 (100.0%) | 0 (0.0%) |
| Information | 0 (0.0%) | 9 (100.0%) |
| Finance & Insurance | 30 (83.3%) | 6 (16.7%) |
| Real Estate, Rental & Leasing | 8 (17.0%) | 39 (83.0%) |
| Professional & Scientific | 56 (60.9%) | 36 (39.1%) |
| Enterprise Management | 0 (0.0%) | 0 (0.0%) |
| Administrative & Support | 31 (43.1%) | 41 (56.9%) |
| Educational Services | 35 (18.1%) | 158 (81.9%) |
| Health Care & Social Assistance | 62 (15.4%) | 341 (84.6%) |
| Arts, Entertainment & Recreation | 0 (0.0%) | 57 (100.0%) |
| Accommodation & Food Services | 199 (63.2%) | 116 (36.8%) |
| Public Administration | 17 (25.8%) | 49 (74.2%) |
| Total | 1,843 (50.7%) | 1,795 (49.3%) |
Education in Three Rivers
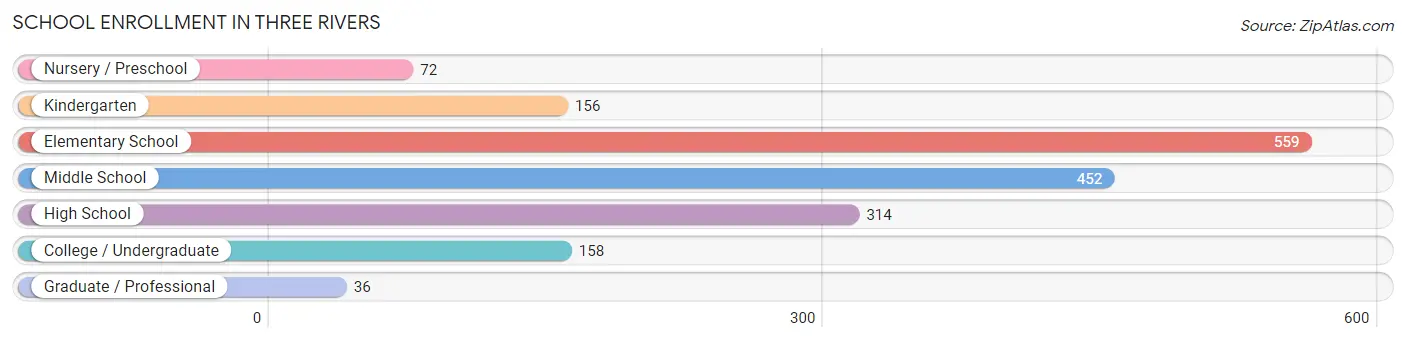
School Enrollment in Three Rivers
The most common levels of schooling among the 1,747 students in Three Rivers are elementary school (559 | 32.0%), middle school (452 | 25.9%), and high school (314 | 18.0%).
| School Level | # Students | % Students |
| Nursery / Preschool | 72 | 4.1% |
| Kindergarten | 156 | 8.9% |
| Elementary School | 559 | 32.0% |
| Middle School | 452 | 25.9% |
| High School | 314 | 18.0% |
| College / Undergraduate | 158 | 9.0% |
| Graduate / Professional | 36 | 2.1% |
| Total | 1,747 | 100.0% |
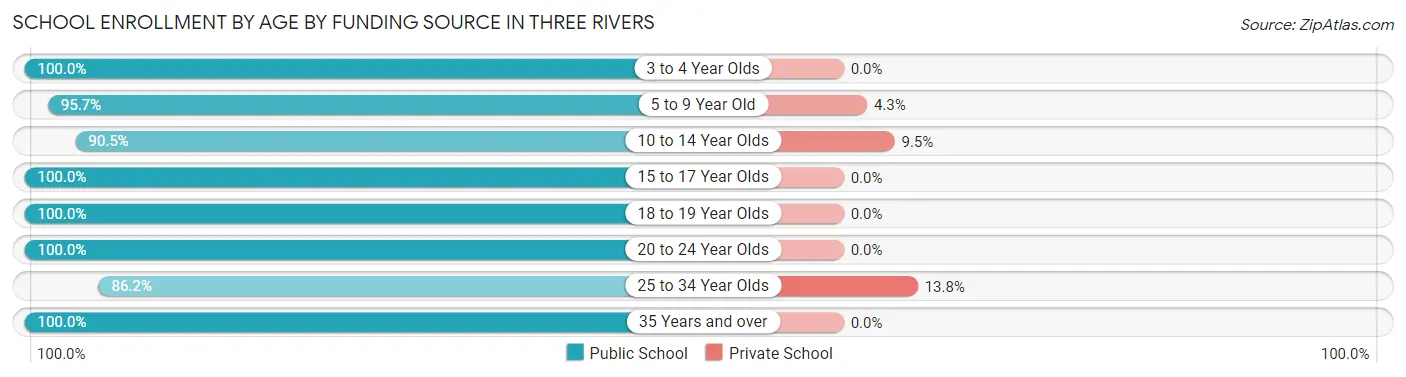
School Enrollment by Age by Funding Source in Three Rivers
Out of a total of 1,747 students who are enrolled in schools in Three Rivers, 84 (4.8%) attend a private institution, while the remaining 1,663 (95.2%) are enrolled in public schools. The age group of 25 to 34 year olds has the highest likelihood of being enrolled in private schools, with 8 (13.8% in the age bracket) enrolled. Conversely, the age group of 3 to 4 year olds has the lowest likelihood of being enrolled in a private school, with 45 (100.0% in the age bracket) attending a public institution.
| Age Bracket | Public School | Private School |
| 3 to 4 Year Olds | 45 (100.0%) | 0 (0.0%) |
| 5 to 9 Year Old | 661 (95.7%) | 30 (4.3%) |
| 10 to 14 Year Olds | 440 (90.5%) | 46 (9.5%) |
| 15 to 17 Year Olds | 287 (100.0%) | 0 (0.0%) |
| 18 to 19 Year Olds | 81 (100.0%) | 0 (0.0%) |
| 20 to 24 Year Olds | 62 (100.0%) | 0 (0.0%) |
| 25 to 34 Year Olds | 50 (86.2%) | 8 (13.8%) |
| 35 Years and over | 37 (100.0%) | 0 (0.0%) |
| Total | 1,663 (95.2%) | 84 (4.8%) |
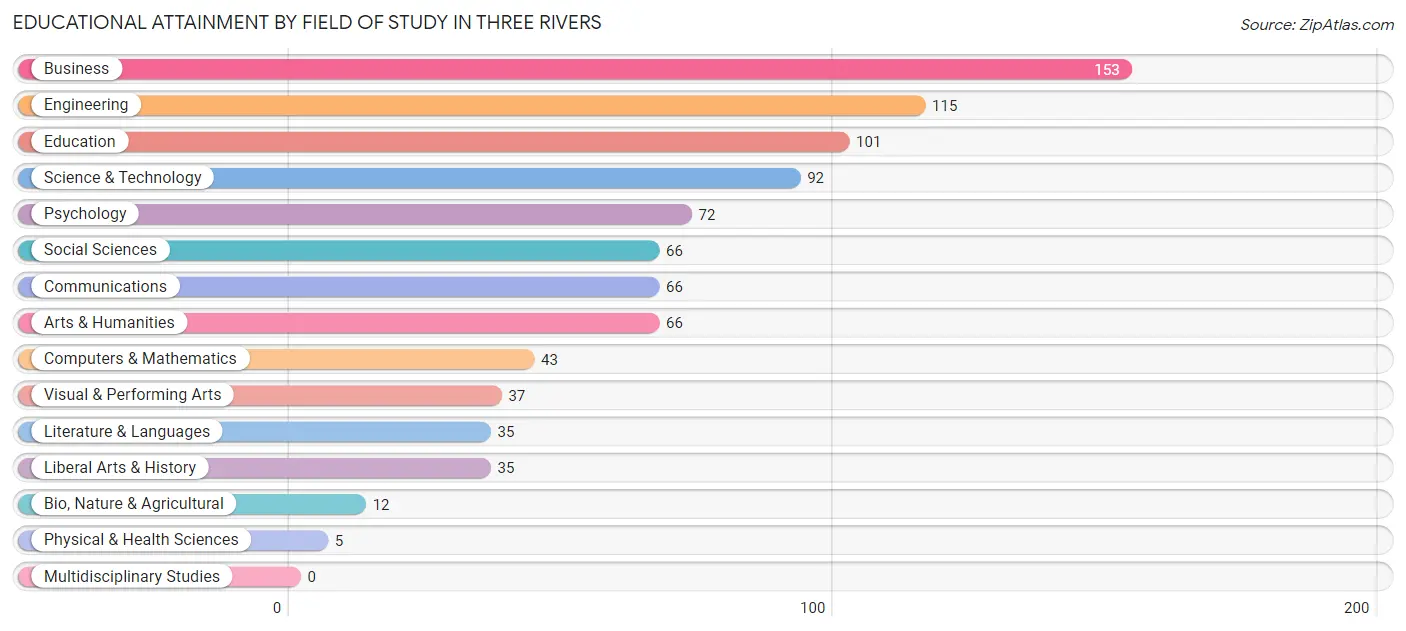
Educational Attainment by Field of Study in Three Rivers
Business (153 | 17.0%), engineering (115 | 12.8%), education (101 | 11.3%), science & technology (92 | 10.2%), and psychology (72 | 8.0%) are the most common fields of study among 898 individuals in Three Rivers who have obtained a bachelor's degree or higher.
| Field of Study | # Graduates | % Graduates |
| Computers & Mathematics | 43 | 4.8% |
| Bio, Nature & Agricultural | 12 | 1.3% |
| Physical & Health Sciences | 5 | 0.6% |
| Psychology | 72 | 8.0% |
| Social Sciences | 66 | 7.3% |
| Engineering | 115 | 12.8% |
| Multidisciplinary Studies | 0 | 0.0% |
| Science & Technology | 92 | 10.2% |
| Business | 153 | 17.0% |
| Education | 101 | 11.3% |
| Literature & Languages | 35 | 3.9% |
| Liberal Arts & History | 35 | 3.9% |
| Visual & Performing Arts | 37 | 4.1% |
| Communications | 66 | 7.3% |
| Arts & Humanities | 66 | 7.3% |
| Total | 898 | 100.0% |
Transportation & Commute in Three Rivers
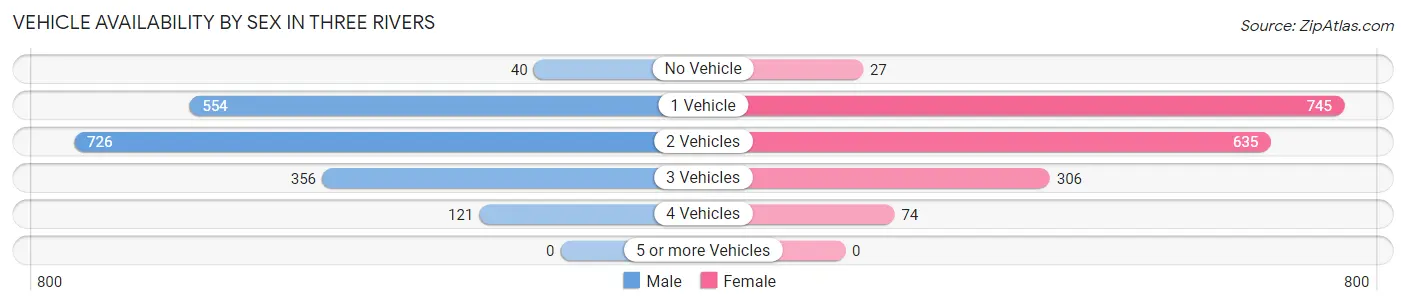
Vehicle Availability by Sex in Three Rivers
The most prevalent vehicle ownership categories in Three Rivers are males with 2 vehicles (726, accounting for 40.4%) and females with 2 vehicles (635, making up 40.6%).
| Vehicles Available | Male | Female |
| No Vehicle | 40 (2.2%) | 27 (1.5%) |
| 1 Vehicle | 554 (30.8%) | 745 (41.7%) |
| 2 Vehicles | 726 (40.4%) | 635 (35.5%) |
| 3 Vehicles | 356 (19.8%) | 306 (17.1%) |
| 4 Vehicles | 121 (6.7%) | 74 (4.1%) |
| 5 or more Vehicles | 0 (0.0%) | 0 (0.0%) |
| Total | 1,797 (100.0%) | 1,787 (100.0%) |
Commute Time in Three Rivers
The most frequently occuring commute durations in Three Rivers are 5 to 9 minutes (1,032 commuters, 29.9%), 15 to 19 minutes (469 commuters, 13.6%), and 10 to 14 minutes (399 commuters, 11.6%).
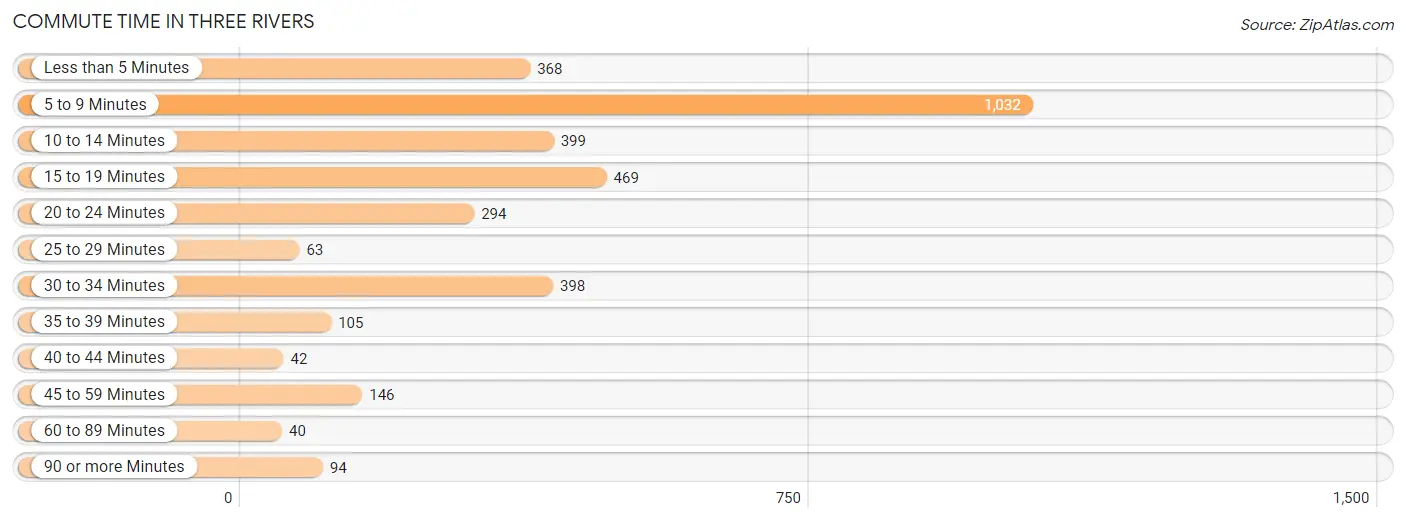
| Commute Time | # Commuters | % Commuters |
| Less than 5 Minutes | 368 | 10.7% |
| 5 to 9 Minutes | 1,032 | 29.9% |
| 10 to 14 Minutes | 399 | 11.6% |
| 15 to 19 Minutes | 469 | 13.6% |
| 20 to 24 Minutes | 294 | 8.5% |
| 25 to 29 Minutes | 63 | 1.8% |
| 30 to 34 Minutes | 398 | 11.5% |
| 35 to 39 Minutes | 105 | 3.0% |
| 40 to 44 Minutes | 42 | 1.2% |
| 45 to 59 Minutes | 146 | 4.2% |
| 60 to 89 Minutes | 40 | 1.2% |
| 90 or more Minutes | 94 | 2.7% |
Commute Time by Sex in Three Rivers
The most common commute times in Three Rivers are 5 to 9 minutes (416 commuters, 24.3%) for males and 5 to 9 minutes (616 commuters, 35.5%) for females.
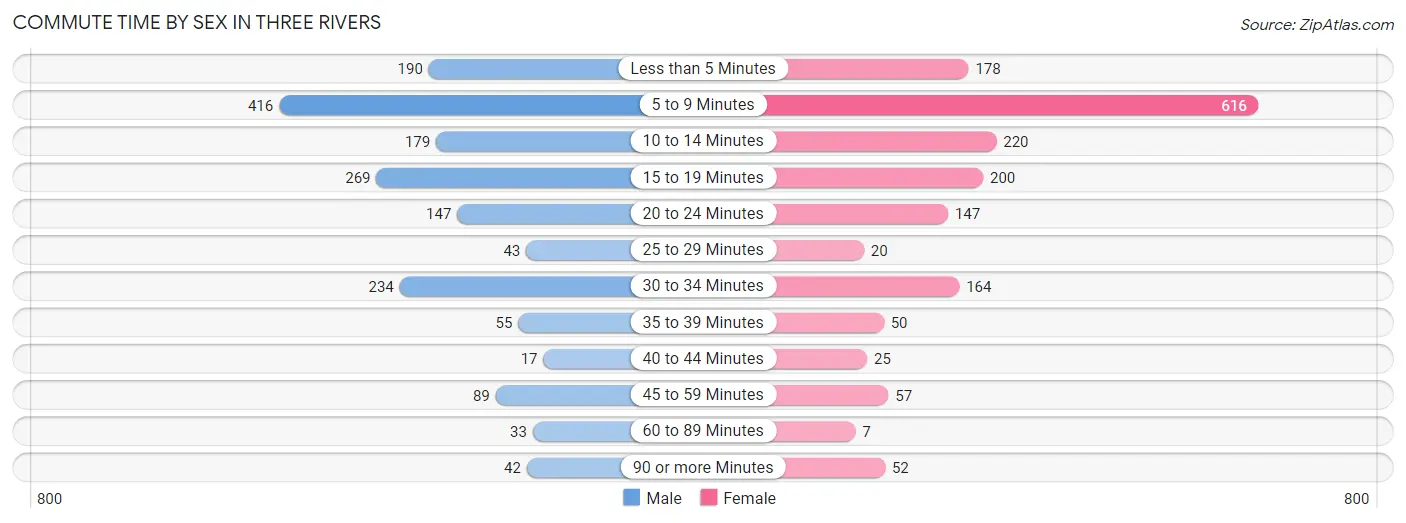
| Commute Time | Male | Female |
| Less than 5 Minutes | 190 (11.1%) | 178 (10.2%) |
| 5 to 9 Minutes | 416 (24.3%) | 616 (35.5%) |
| 10 to 14 Minutes | 179 (10.4%) | 220 (12.7%) |
| 15 to 19 Minutes | 269 (15.7%) | 200 (11.5%) |
| 20 to 24 Minutes | 147 (8.6%) | 147 (8.5%) |
| 25 to 29 Minutes | 43 (2.5%) | 20 (1.1%) |
| 30 to 34 Minutes | 234 (13.7%) | 164 (9.5%) |
| 35 to 39 Minutes | 55 (3.2%) | 50 (2.9%) |
| 40 to 44 Minutes | 17 (1.0%) | 25 (1.4%) |
| 45 to 59 Minutes | 89 (5.2%) | 57 (3.3%) |
| 60 to 89 Minutes | 33 (1.9%) | 7 (0.4%) |
| 90 or more Minutes | 42 (2.5%) | 52 (3.0%) |
Time of Departure to Work by Sex in Three Rivers
The most frequent times of departure to work in Three Rivers are 12:00 AM to 4:59 AM (295, 17.2%) for males and 12:00 PM to 3:59 PM (194, 11.2%) for females.
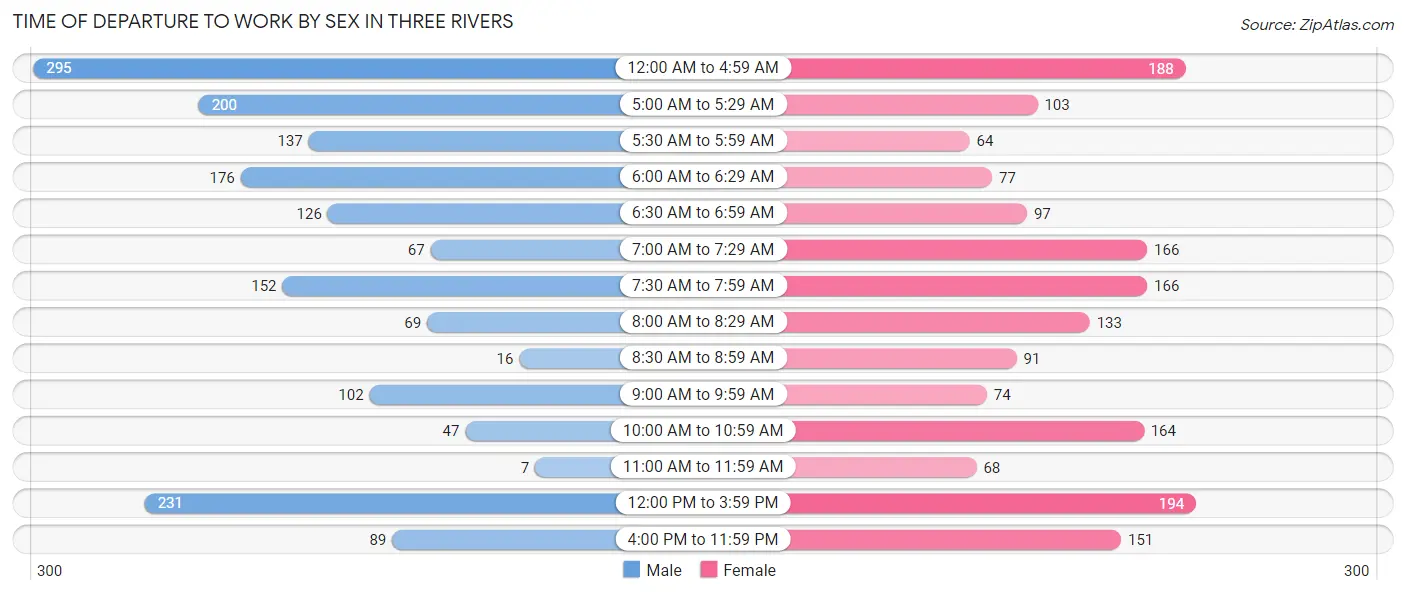
| Time of Departure | Male | Female |
| 12:00 AM to 4:59 AM | 295 (17.2%) | 188 (10.8%) |
| 5:00 AM to 5:29 AM | 200 (11.7%) | 103 (5.9%) |
| 5:30 AM to 5:59 AM | 137 (8.0%) | 64 (3.7%) |
| 6:00 AM to 6:29 AM | 176 (10.3%) | 77 (4.4%) |
| 6:30 AM to 6:59 AM | 126 (7.3%) | 97 (5.6%) |
| 7:00 AM to 7:29 AM | 67 (3.9%) | 166 (9.6%) |
| 7:30 AM to 7:59 AM | 152 (8.9%) | 166 (9.6%) |
| 8:00 AM to 8:29 AM | 69 (4.0%) | 133 (7.7%) |
| 8:30 AM to 8:59 AM | 16 (0.9%) | 91 (5.2%) |
| 9:00 AM to 9:59 AM | 102 (5.9%) | 74 (4.3%) |
| 10:00 AM to 10:59 AM | 47 (2.7%) | 164 (9.5%) |
| 11:00 AM to 11:59 AM | 7 (0.4%) | 68 (3.9%) |
| 12:00 PM to 3:59 PM | 231 (13.5%) | 194 (11.2%) |
| 4:00 PM to 11:59 PM | 89 (5.2%) | 151 (8.7%) |
| Total | 1,714 (100.0%) | 1,736 (100.0%) |
Housing Occupancy in Three Rivers
Occupancy by Ownership in Three Rivers
Of the total 3,173 dwellings in Three Rivers, owner-occupied units account for 1,590 (50.1%), while renter-occupied units make up 1,583 (49.9%).
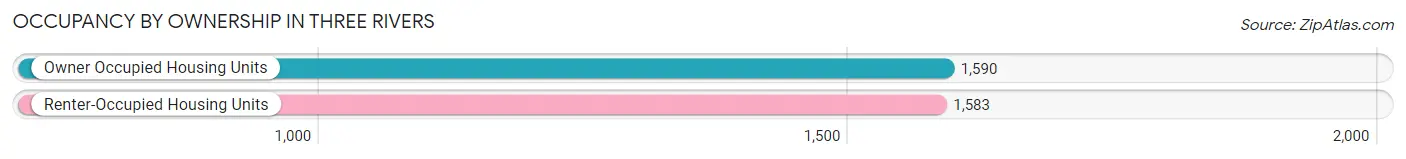
| Occupancy | # Housing Units | % Housing Units |
| Owner Occupied Housing Units | 1,590 | 50.1% |
| Renter-Occupied Housing Units | 1,583 | 49.9% |
| Total Occupied Housing Units | 3,173 | 100.0% |
Occupancy by Household Size in Three Rivers
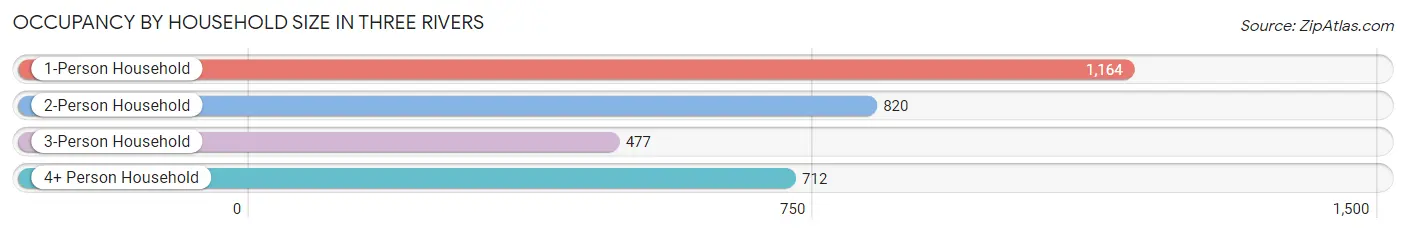
| Household Size | # Housing Units | % Housing Units |
| 1-Person Household | 1,164 | 36.7% |
| 2-Person Household | 820 | 25.8% |
| 3-Person Household | 477 | 15.0% |
| 4+ Person Household | 712 | 22.4% |
| Total Housing Units | 3,173 | 100.0% |
Occupancy by Ownership by Household Size in Three Rivers
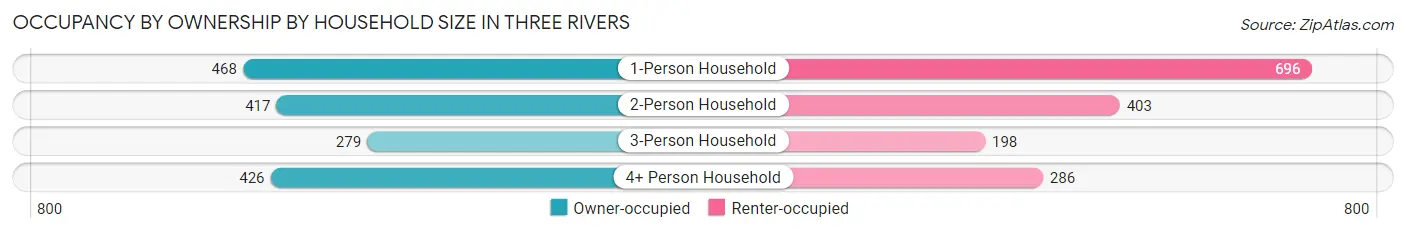
| Household Size | Owner-occupied | Renter-occupied |
| 1-Person Household | 468 (40.2%) | 696 (59.8%) |
| 2-Person Household | 417 (50.8%) | 403 (49.1%) |
| 3-Person Household | 279 (58.5%) | 198 (41.5%) |
| 4+ Person Household | 426 (59.8%) | 286 (40.2%) |
| Total Housing Units | 1,590 (50.1%) | 1,583 (49.9%) |
Occupancy by Educational Attainment in Three Rivers
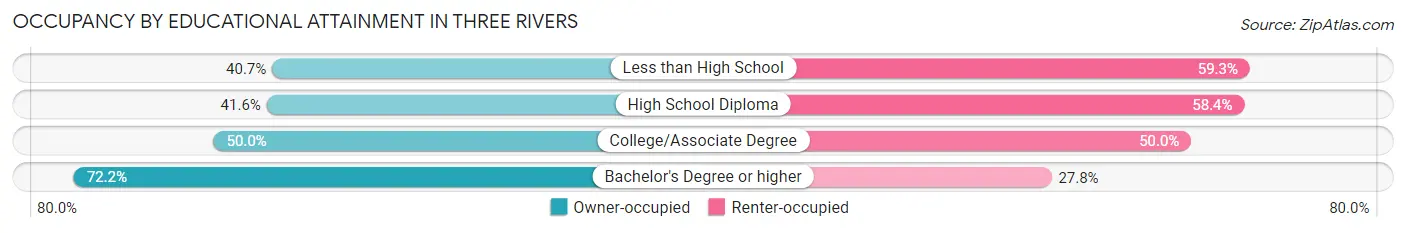
| Household Size | Owner-occupied | Renter-occupied |
| Less than High School | 66 (40.7%) | 96 (59.3%) |
| High School Diploma | 501 (41.6%) | 703 (58.4%) |
| College/Associate Degree | 636 (50.0%) | 635 (50.0%) |
| Bachelor's Degree or higher | 387 (72.2%) | 149 (27.8%) |
Occupancy by Age of Householder in Three Rivers
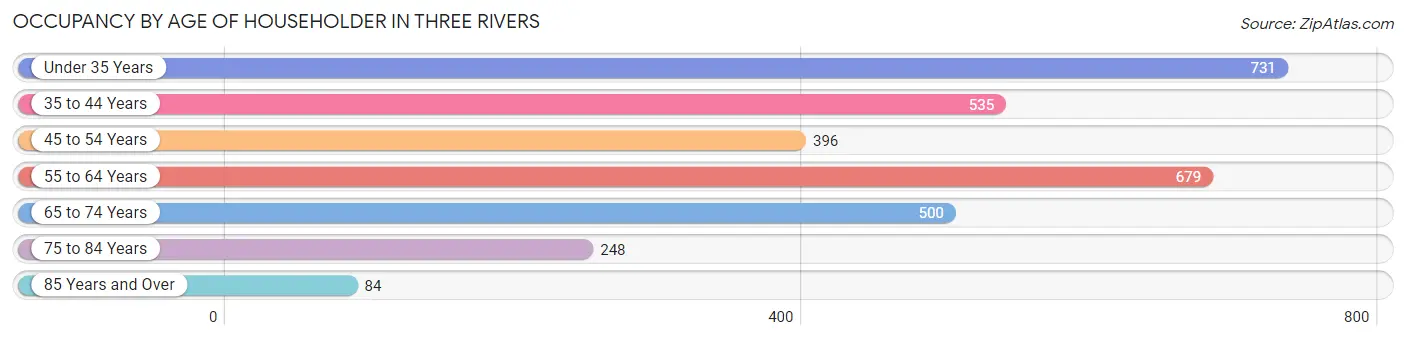
| Age Bracket | # Households | % Households |
| Under 35 Years | 731 | 23.0% |
| 35 to 44 Years | 535 | 16.9% |
| 45 to 54 Years | 396 | 12.5% |
| 55 to 64 Years | 679 | 21.4% |
| 65 to 74 Years | 500 | 15.8% |
| 75 to 84 Years | 248 | 7.8% |
| 85 Years and Over | 84 | 2.6% |
| Total | 3,173 | 100.0% |
Housing Finances in Three Rivers
Median Income by Occupancy in Three Rivers
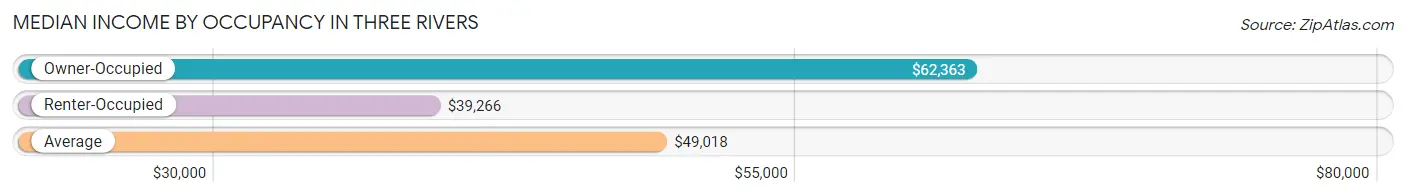
| Occupancy Type | # Households | Median Income |
| Owner-Occupied | 1,590 (50.1%) | $62,363 |
| Renter-Occupied | 1,583 (49.9%) | $39,266 |
| Average | 3,173 (100.0%) | $49,018 |
Occupancy by Householder Income Bracket in Three Rivers
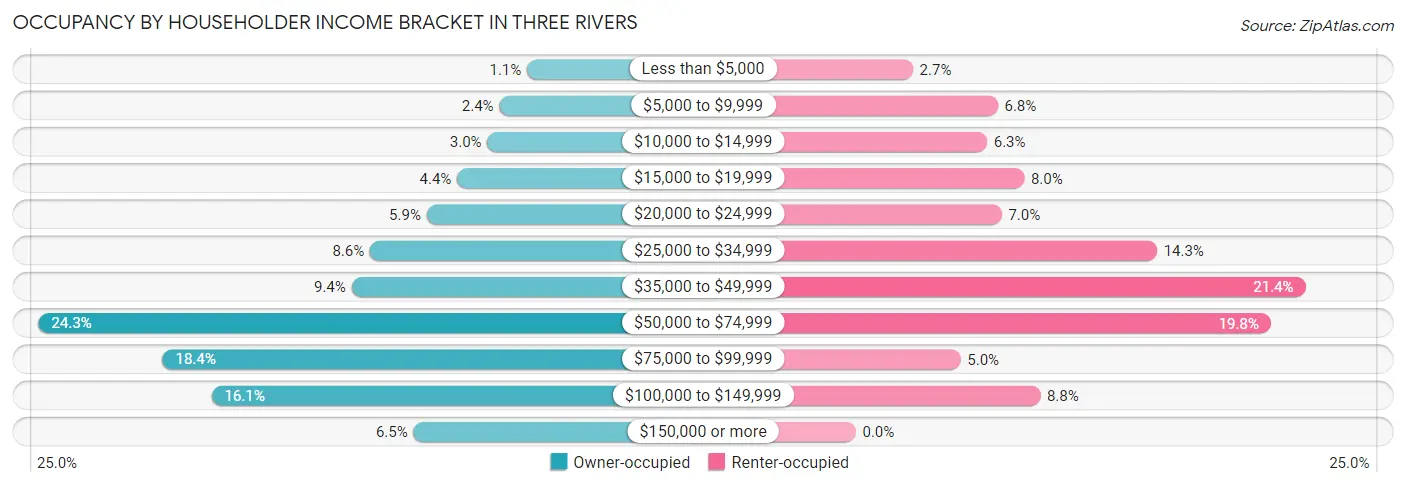
| Income Bracket | Owner-occupied | Renter-occupied |
| Less than $5,000 | 17 (1.1%) | 43 (2.7%) |
| $5,000 to $9,999 | 38 (2.4%) | 107 (6.8%) |
| $10,000 to $14,999 | 47 (3.0%) | 99 (6.2%) |
| $15,000 to $19,999 | 70 (4.4%) | 127 (8.0%) |
| $20,000 to $24,999 | 93 (5.9%) | 110 (7.0%) |
| $25,000 to $34,999 | 136 (8.6%) | 227 (14.3%) |
| $35,000 to $49,999 | 150 (9.4%) | 339 (21.4%) |
| $50,000 to $74,999 | 387 (24.3%) | 313 (19.8%) |
| $75,000 to $99,999 | 293 (18.4%) | 79 (5.0%) |
| $100,000 to $149,999 | 256 (16.1%) | 139 (8.8%) |
| $150,000 or more | 103 (6.5%) | 0 (0.0%) |
| Total | 1,590 (100.0%) | 1,583 (100.0%) |
Monthly Housing Cost Tiers in Three Rivers
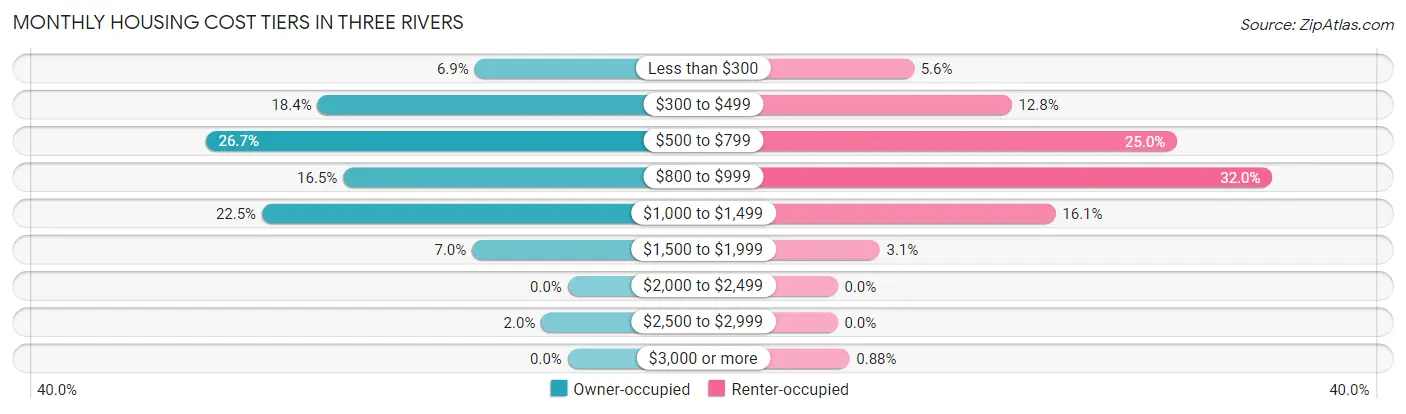
| Monthly Cost | Owner-occupied | Renter-occupied |
| Less than $300 | 109 (6.9%) | 89 (5.6%) |
| $300 to $499 | 293 (18.4%) | 203 (12.8%) |
| $500 to $799 | 424 (26.7%) | 396 (25.0%) |
| $800 to $999 | 263 (16.5%) | 507 (32.0%) |
| $1,000 to $1,499 | 358 (22.5%) | 254 (16.1%) |
| $1,500 to $1,999 | 112 (7.0%) | 49 (3.1%) |
| $2,000 to $2,499 | 0 (0.0%) | 0 (0.0%) |
| $2,500 to $2,999 | 31 (1.9%) | 0 (0.0%) |
| $3,000 or more | 0 (0.0%) | 14 (0.9%) |
| Total | 1,590 (100.0%) | 1,583 (100.0%) |
Physical Housing Characteristics in Three Rivers
Housing Structures in Three Rivers
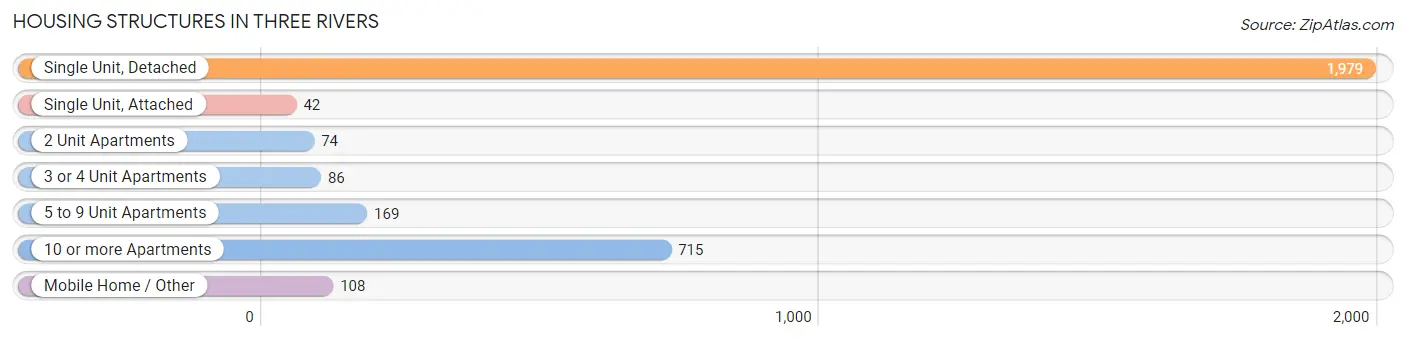
| Structure Type | # Housing Units | % Housing Units |
| Single Unit, Detached | 1,979 | 62.4% |
| Single Unit, Attached | 42 | 1.3% |
| 2 Unit Apartments | 74 | 2.3% |
| 3 or 4 Unit Apartments | 86 | 2.7% |
| 5 to 9 Unit Apartments | 169 | 5.3% |
| 10 or more Apartments | 715 | 22.5% |
| Mobile Home / Other | 108 | 3.4% |
| Total | 3,173 | 100.0% |
Housing Structures by Occupancy in Three Rivers
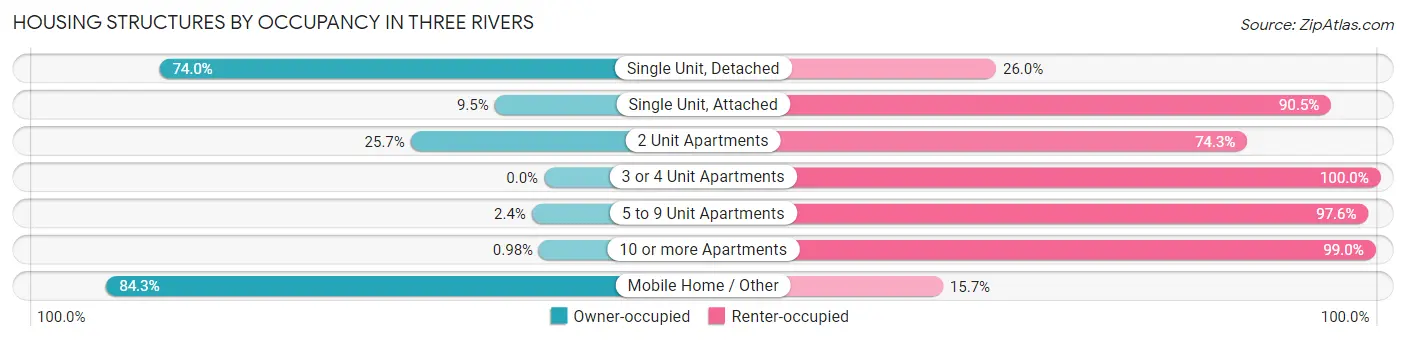
| Structure Type | Owner-occupied | Renter-occupied |
| Single Unit, Detached | 1,465 (74.0%) | 514 (26.0%) |
| Single Unit, Attached | 4 (9.5%) | 38 (90.5%) |
| 2 Unit Apartments | 19 (25.7%) | 55 (74.3%) |
| 3 or 4 Unit Apartments | 0 (0.0%) | 86 (100.0%) |
| 5 to 9 Unit Apartments | 4 (2.4%) | 165 (97.6%) |
| 10 or more Apartments | 7 (1.0%) | 708 (99.0%) |
| Mobile Home / Other | 91 (84.3%) | 17 (15.7%) |
| Total | 1,590 (50.1%) | 1,583 (49.9%) |
Housing Structures by Number of Rooms in Three Rivers
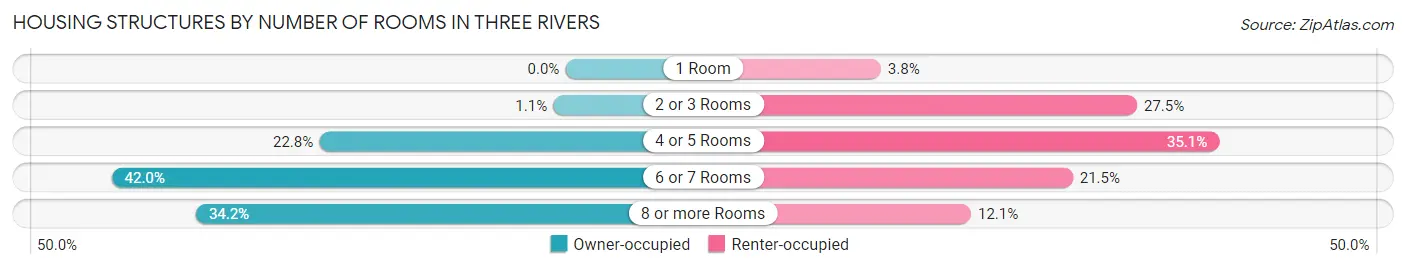
| Number of Rooms | Owner-occupied | Renter-occupied |
| 1 Room | 0 (0.0%) | 60 (3.8%) |
| 2 or 3 Rooms | 18 (1.1%) | 435 (27.5%) |
| 4 or 5 Rooms | 362 (22.8%) | 555 (35.1%) |
| 6 or 7 Rooms | 667 (41.9%) | 341 (21.5%) |
| 8 or more Rooms | 543 (34.2%) | 192 (12.1%) |
| Total | 1,590 (100.0%) | 1,583 (100.0%) |
Housing Structure by Heating Type in Three Rivers
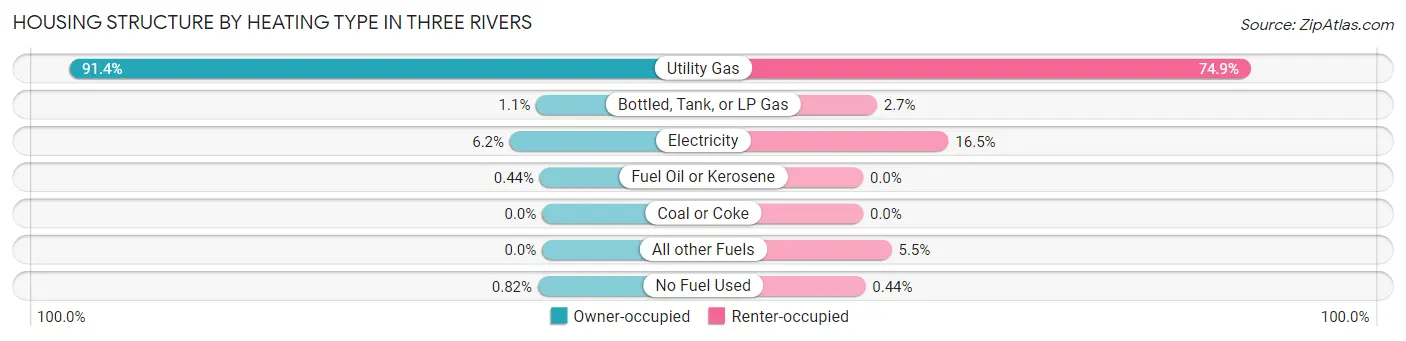
| Heating Type | Owner-occupied | Renter-occupied |
| Utility Gas | 1,453 (91.4%) | 1,186 (74.9%) |
| Bottled, Tank, or LP Gas | 18 (1.1%) | 42 (2.6%) |
| Electricity | 99 (6.2%) | 261 (16.5%) |
| Fuel Oil or Kerosene | 7 (0.4%) | 0 (0.0%) |
| Coal or Coke | 0 (0.0%) | 0 (0.0%) |
| All other Fuels | 0 (0.0%) | 87 (5.5%) |
| No Fuel Used | 13 (0.8%) | 7 (0.4%) |
| Total | 1,590 (100.0%) | 1,583 (100.0%) |
Household Vehicle Usage in Three Rivers
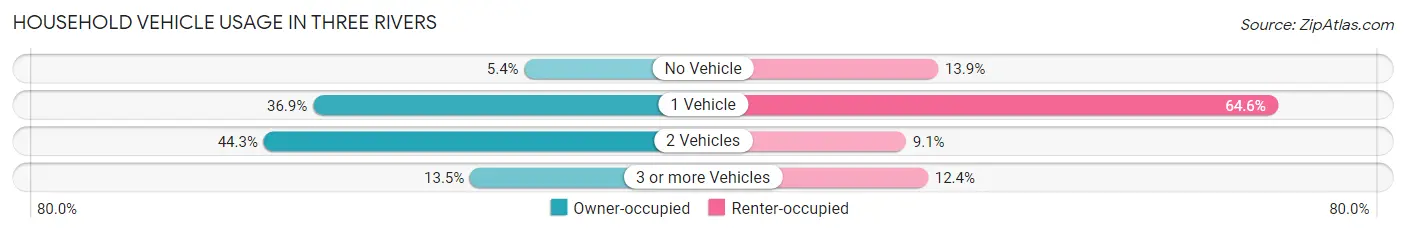
| Vehicles per Household | Owner-occupied | Renter-occupied |
| No Vehicle | 85 (5.3%) | 220 (13.9%) |
| 1 Vehicle | 587 (36.9%) | 1,023 (64.6%) |
| 2 Vehicles | 704 (44.3%) | 144 (9.1%) |
| 3 or more Vehicles | 214 (13.5%) | 196 (12.4%) |
| Total | 1,590 (100.0%) | 1,583 (100.0%) |
Real Estate & Mortgages in Three Rivers
Real Estate and Mortgage Overview in Three Rivers
| Characteristic | Without Mortgage | With Mortgage |
| Housing Units | 671 | 919 |
| Median Property Value | $100,100 | $125,300 |
| Median Household Income | $52,067 | $56 |
| Monthly Housing Costs | $463 | $0 |
| Real Estate Taxes | $1,463 | $11 |
Property Value by Mortgage Status in Three Rivers
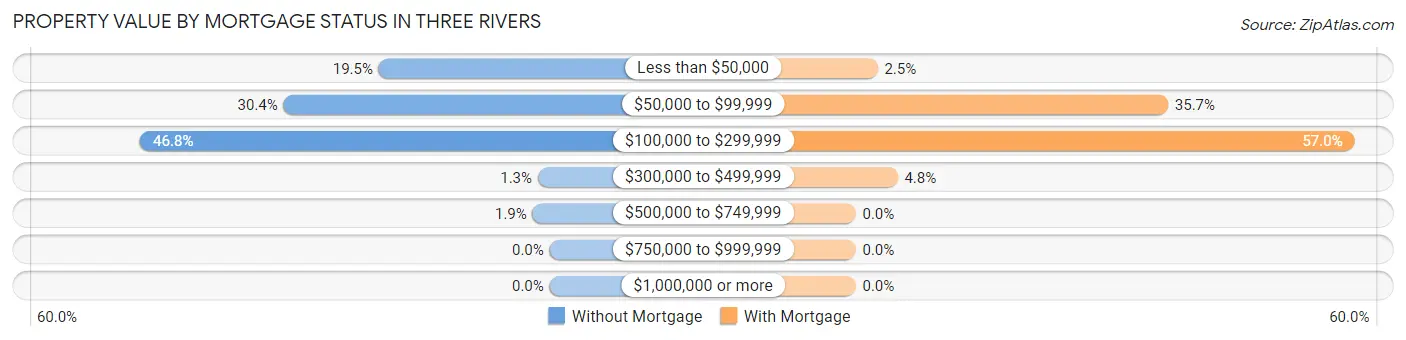
| Property Value | Without Mortgage | With Mortgage |
| Less than $50,000 | 131 (19.5%) | 23 (2.5%) |
| $50,000 to $99,999 | 204 (30.4%) | 328 (35.7%) |
| $100,000 to $299,999 | 314 (46.8%) | 524 (57.0%) |
| $300,000 to $499,999 | 9 (1.3%) | 44 (4.8%) |
| $500,000 to $749,999 | 13 (1.9%) | 0 (0.0%) |
| $750,000 to $999,999 | 0 (0.0%) | 0 (0.0%) |
| $1,000,000 or more | 0 (0.0%) | 0 (0.0%) |
| Total | 671 (100.0%) | 919 (100.0%) |
Household Income by Mortgage Status in Three Rivers
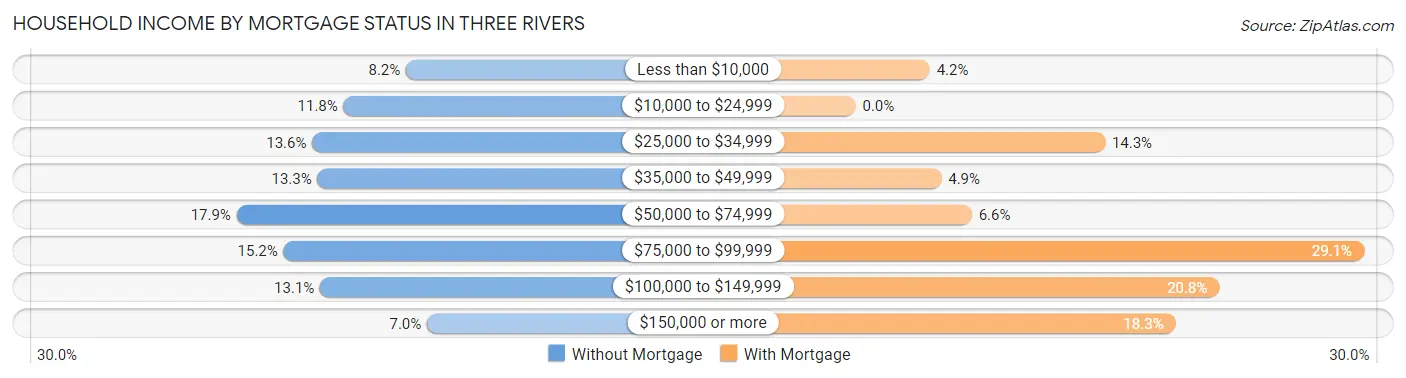
| Household Income | Without Mortgage | With Mortgage |
| Less than $10,000 | 55 (8.2%) | 39 (4.2%) |
| $10,000 to $24,999 | 79 (11.8%) | 0 (0.0%) |
| $25,000 to $34,999 | 91 (13.6%) | 131 (14.2%) |
| $35,000 to $49,999 | 89 (13.3%) | 45 (4.9%) |
| $50,000 to $74,999 | 120 (17.9%) | 61 (6.6%) |
| $75,000 to $99,999 | 102 (15.2%) | 267 (29.0%) |
| $100,000 to $149,999 | 88 (13.1%) | 191 (20.8%) |
| $150,000 or more | 47 (7.0%) | 168 (18.3%) |
| Total | 671 (100.0%) | 919 (100.0%) |
Property Value to Household Income Ratio in Three Rivers
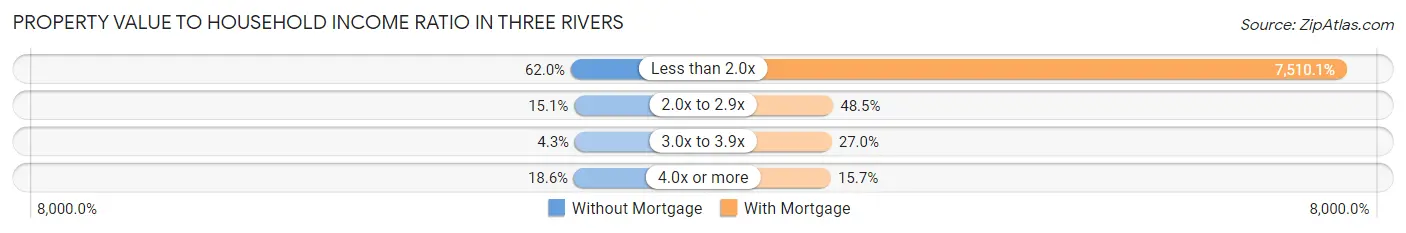
| Value-to-Income Ratio | Without Mortgage | With Mortgage |
| Less than 2.0x | 416 (62.0%) | 69,018 (7,510.1%) |
| 2.0x to 2.9x | 101 (15.0%) | 446 (48.5%) |
| 3.0x to 3.9x | 29 (4.3%) | 248 (27.0%) |
| 4.0x or more | 125 (18.6%) | 144 (15.7%) |
| Total | 671 (100.0%) | 919 (100.0%) |
Real Estate Taxes by Mortgage Status in Three Rivers
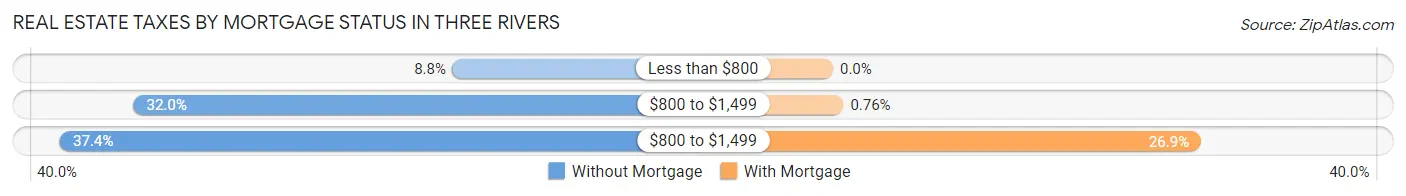
| Property Taxes | Without Mortgage | With Mortgage |
| Less than $800 | 59 (8.8%) | 0 (0.0%) |
| $800 to $1,499 | 215 (32.0%) | 7 (0.8%) |
| $800 to $1,499 | 251 (37.4%) | 247 (26.9%) |
| Total | 671 (100.0%) | 919 (100.0%) |
Health & Disability in Three Rivers
Health Insurance Coverage by Age in Three Rivers
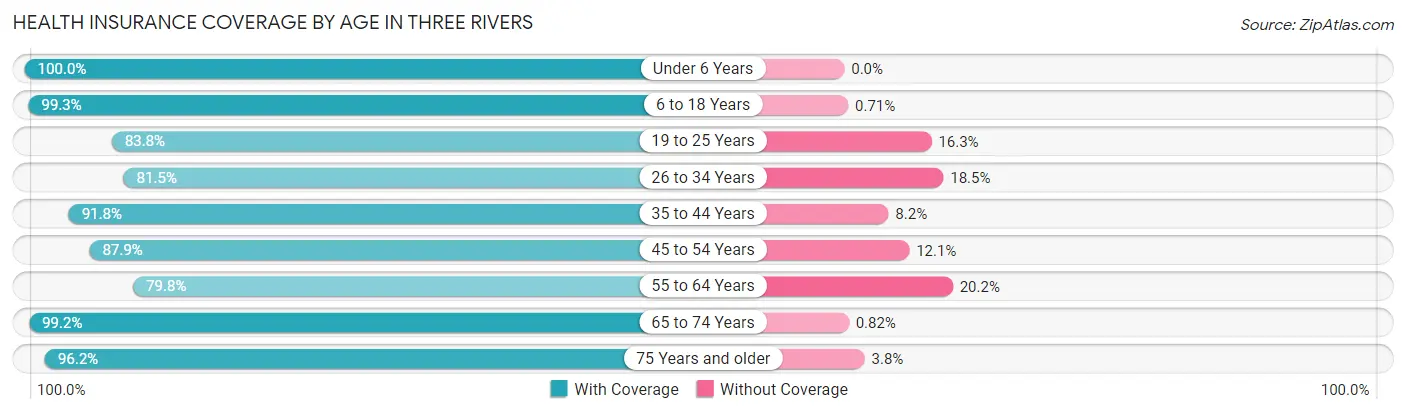
| Age Bracket | With Coverage | Without Coverage |
| Under 6 Years | 679 (100.0%) | 0 (0.0%) |
| 6 to 18 Years | 1,407 (99.3%) | 10 (0.7%) |
| 19 to 25 Years | 675 (83.8%) | 131 (16.3%) |
| 26 to 34 Years | 963 (81.5%) | 218 (18.5%) |
| 35 to 44 Years | 948 (91.8%) | 85 (8.2%) |
| 45 to 54 Years | 574 (87.9%) | 79 (12.1%) |
| 55 to 64 Years | 785 (79.8%) | 199 (20.2%) |
| 65 to 74 Years | 608 (99.2%) | 5 (0.8%) |
| 75 Years and older | 406 (96.2%) | 16 (3.8%) |
| Total | 7,045 (90.5%) | 743 (9.5%) |
Health Insurance Coverage by Citizenship Status in Three Rivers
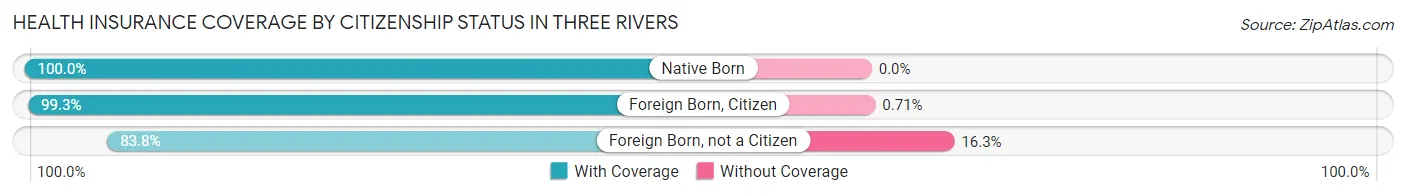
| Citizenship Status | With Coverage | Without Coverage |
| Native Born | 679 (100.0%) | 0 (0.0%) |
| Foreign Born, Citizen | 1,407 (99.3%) | 10 (0.7%) |
| Foreign Born, not a Citizen | 675 (83.8%) | 131 (16.3%) |
Health Insurance Coverage by Household Income in Three Rivers
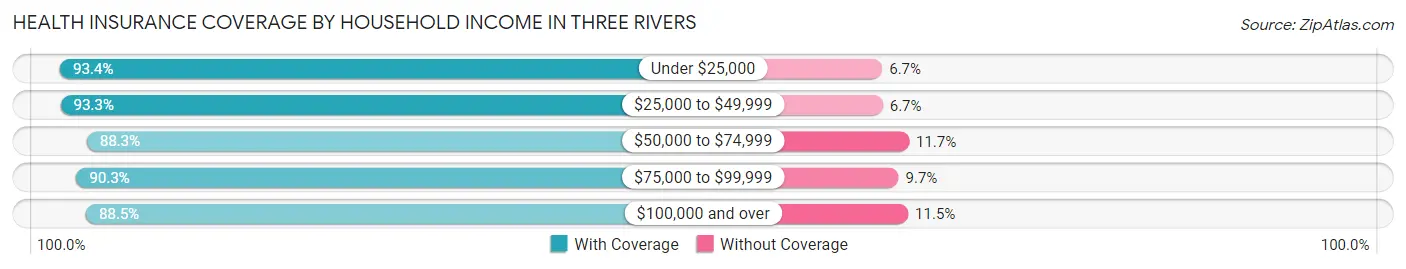
| Household Income | With Coverage | Without Coverage |
| Under $25,000 | 1,025 (93.3%) | 73 (6.7%) |
| $25,000 to $49,999 | 1,549 (93.3%) | 112 (6.7%) |
| $50,000 to $74,999 | 1,766 (88.3%) | 233 (11.7%) |
| $75,000 to $99,999 | 1,088 (90.3%) | 117 (9.7%) |
| $100,000 and over | 1,601 (88.5%) | 208 (11.5%) |
Public vs Private Health Insurance Coverage by Age in Three Rivers
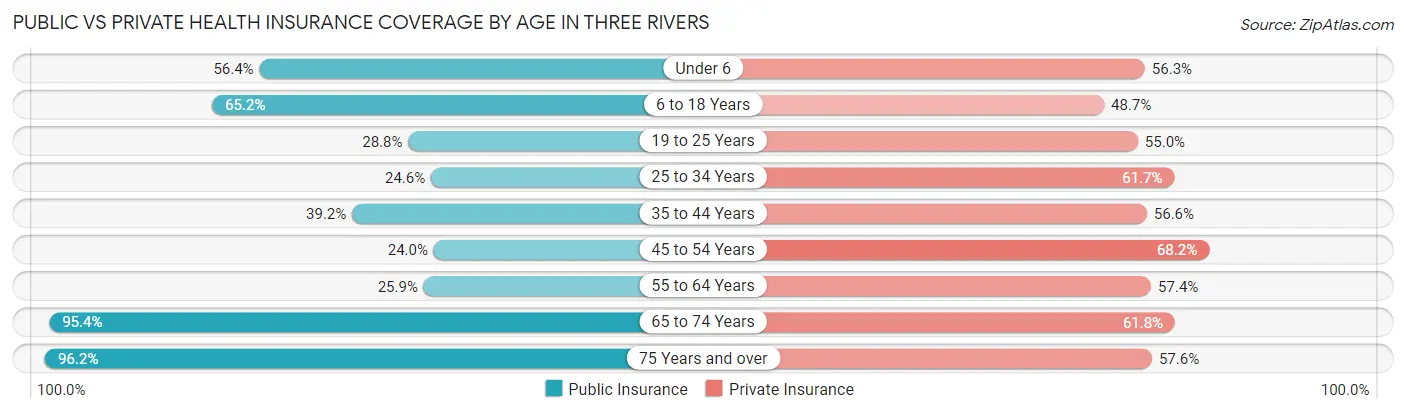
| Age Bracket | Public Insurance | Private Insurance |
| Under 6 | 383 (56.4%) | 382 (56.3%) |
| 6 to 18 Years | 924 (65.2%) | 690 (48.7%) |
| 19 to 25 Years | 232 (28.8%) | 443 (55.0%) |
| 25 to 34 Years | 290 (24.6%) | 729 (61.7%) |
| 35 to 44 Years | 405 (39.2%) | 585 (56.6%) |
| 45 to 54 Years | 157 (24.0%) | 445 (68.1%) |
| 55 to 64 Years | 255 (25.9%) | 565 (57.4%) |
| 65 to 74 Years | 585 (95.4%) | 379 (61.8%) |
| 75 Years and over | 406 (96.2%) | 243 (57.6%) |
| Total | 3,637 (46.7%) | 4,461 (57.3%) |
Disability Status by Sex by Age in Three Rivers
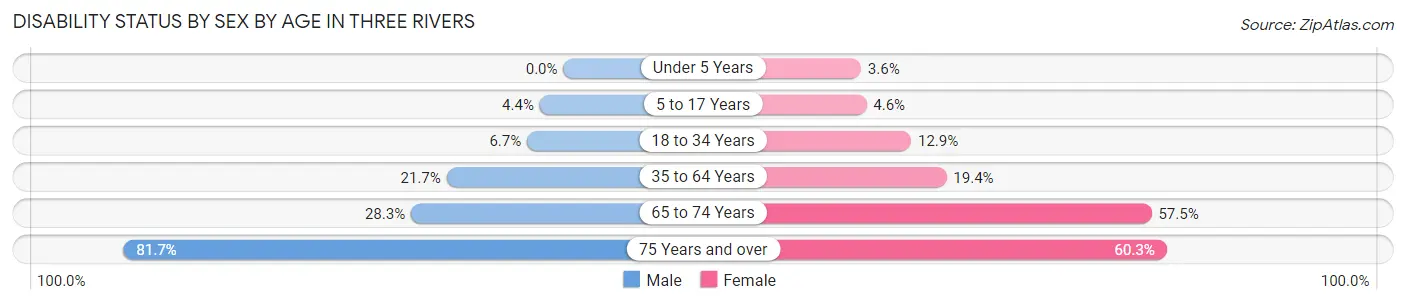
| Age Bracket | Male | Female |
| Under 5 Years | 0 (0.0%) | 7 (3.5%) |
| 5 to 17 Years | 33 (4.4%) | 34 (4.5%) |
| 18 to 34 Years | 65 (6.7%) | 134 (12.9%) |
| 35 to 64 Years | 273 (21.7%) | 274 (19.4%) |
| 65 to 74 Years | 41 (28.3%) | 269 (57.5%) |
| 75 Years and over | 178 (81.7%) | 123 (60.3%) |
Disability Class by Sex by Age in Three Rivers
Disability Class: Hearing Difficulty
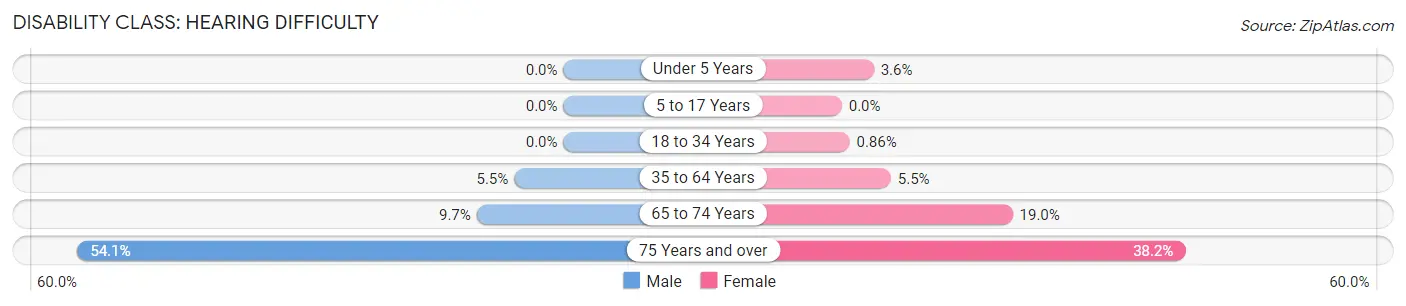
| Age Bracket | Male | Female |
| Under 5 Years | 0 (0.0%) | 7 (3.5%) |
| 5 to 17 Years | 0 (0.0%) | 0 (0.0%) |
| 18 to 34 Years | 0 (0.0%) | 9 (0.9%) |
| 35 to 64 Years | 69 (5.5%) | 77 (5.5%) |
| 65 to 74 Years | 14 (9.7%) | 89 (19.0%) |
| 75 Years and over | 118 (54.1%) | 78 (38.2%) |
Disability Class: Vision Difficulty
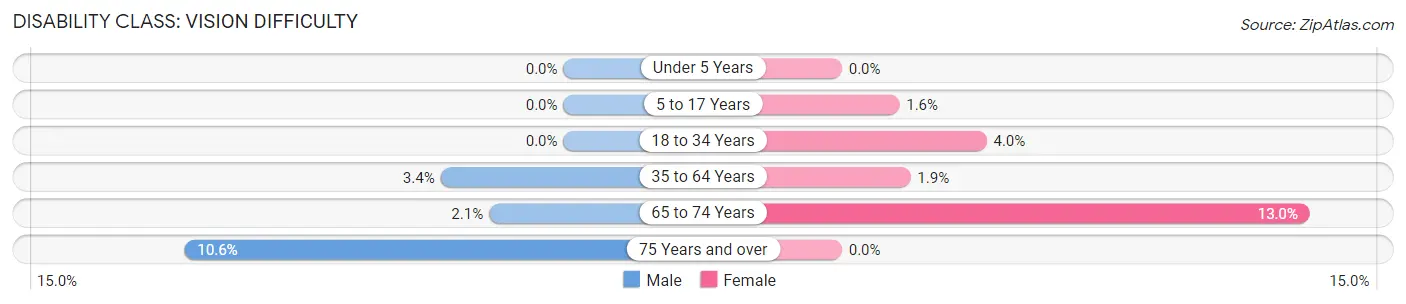
| Age Bracket | Male | Female |
| Under 5 Years | 0 (0.0%) | 0 (0.0%) |
| 5 to 17 Years | 0 (0.0%) | 12 (1.6%) |
| 18 to 34 Years | 0 (0.0%) | 42 (4.0%) |
| 35 to 64 Years | 43 (3.4%) | 27 (1.9%) |
| 65 to 74 Years | 3 (2.1%) | 61 (13.0%) |
| 75 Years and over | 23 (10.5%) | 0 (0.0%) |
Disability Class: Cognitive Difficulty
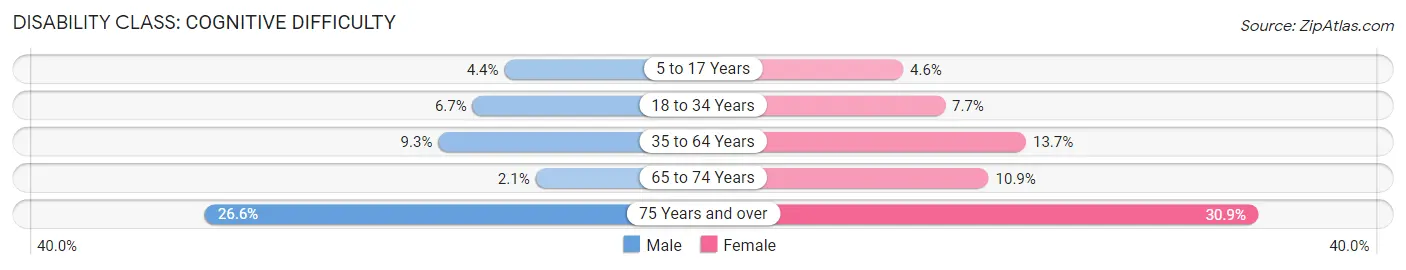
| Age Bracket | Male | Female |
| 5 to 17 Years | 33 (4.4%) | 34 (4.5%) |
| 18 to 34 Years | 65 (6.7%) | 80 (7.7%) |
| 35 to 64 Years | 117 (9.3%) | 193 (13.7%) |
| 65 to 74 Years | 3 (2.1%) | 51 (10.9%) |
| 75 Years and over | 58 (26.6%) | 63 (30.9%) |
Disability Class: Ambulatory Difficulty
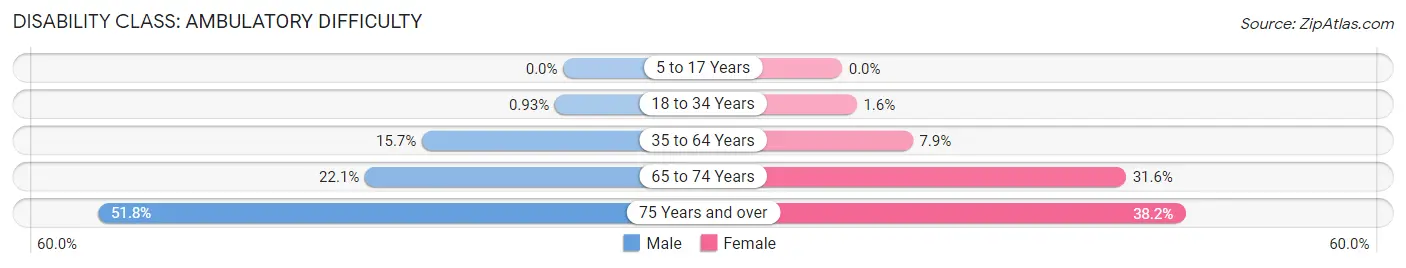
| Age Bracket | Male | Female |
| 5 to 17 Years | 0 (0.0%) | 0 (0.0%) |
| 18 to 34 Years | 9 (0.9%) | 17 (1.6%) |
| 35 to 64 Years | 198 (15.7%) | 111 (7.9%) |
| 65 to 74 Years | 32 (22.1%) | 148 (31.6%) |
| 75 Years and over | 113 (51.8%) | 78 (38.2%) |
Disability Class: Self-Care Difficulty
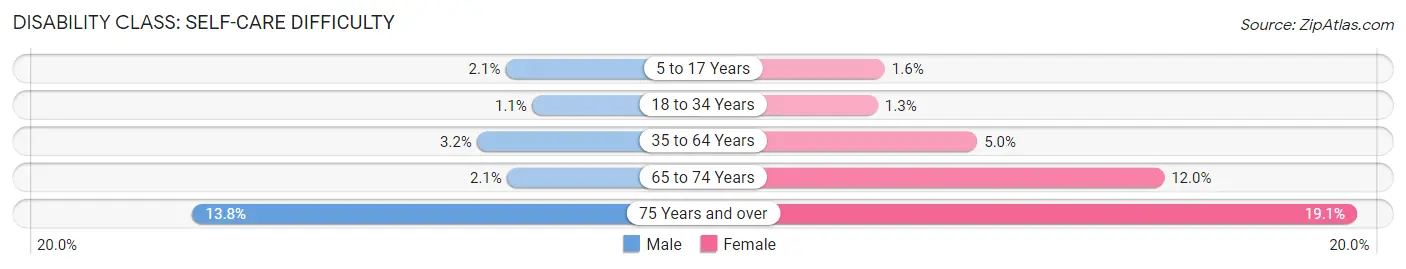
| Age Bracket | Male | Female |
| 5 to 17 Years | 16 (2.1%) | 12 (1.6%) |
| 18 to 34 Years | 11 (1.1%) | 14 (1.3%) |
| 35 to 64 Years | 40 (3.2%) | 71 (5.0%) |
| 65 to 74 Years | 3 (2.1%) | 56 (12.0%) |
| 75 Years and over | 30 (13.8%) | 39 (19.1%) |
Technology Access in Three Rivers
Computing Device Access in Three Rivers
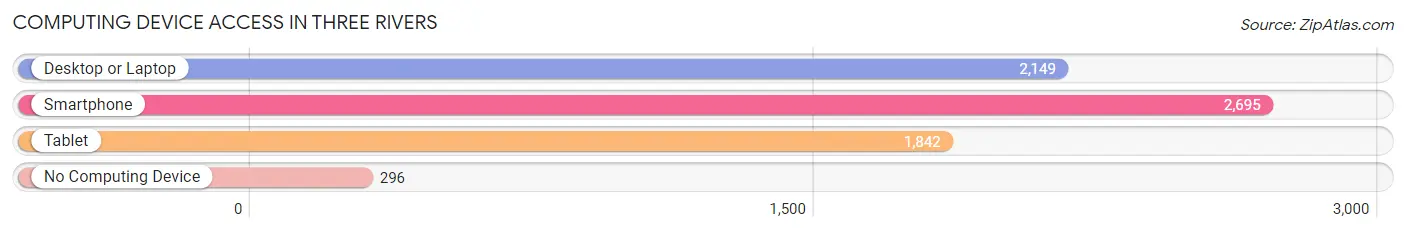
| Device Type | # Households | % Households |
| Desktop or Laptop | 2,149 | 67.7% |
| Smartphone | 2,695 | 84.9% |
| Tablet | 1,842 | 58.1% |
| No Computing Device | 296 | 9.3% |
| Total | 3,173 | 100.0% |
Internet Access in Three Rivers
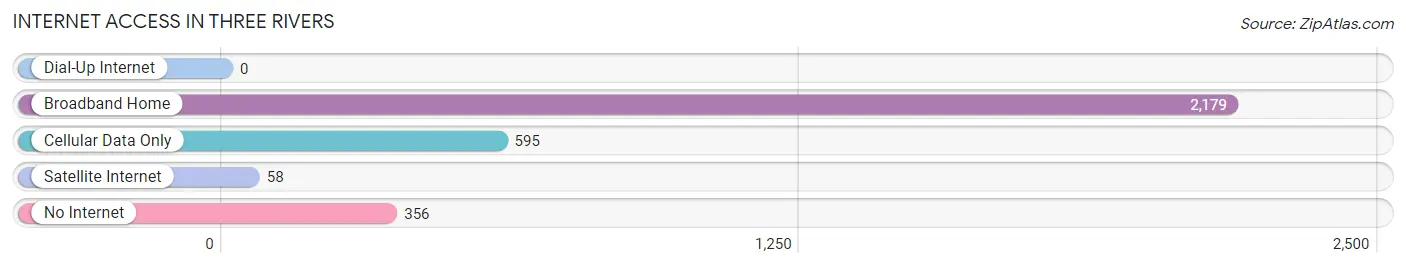
| Internet Type | # Households | % Households |
| Dial-Up Internet | 0 | 0.0% |
| Broadband Home | 2,179 | 68.7% |
| Cellular Data Only | 595 | 18.8% |
| Satellite Internet | 58 | 1.8% |
| No Internet | 356 | 11.2% |
| Total | 3,173 | 100.0% |
Three Rivers Summary
Three Rivers, Michigan is a small city located in St. Joseph County in the southwestern part of the state. It is situated on the banks of the St. Joseph River, which is the main source of water for the city. The city is home to a population of 8,633 people, according to the 2010 census.
History
The area that is now Three Rivers was first settled in the early 1800s by French-Canadian fur traders. The city was officially founded in 1832 and was named after the three rivers that converge in the area: the St. Joseph, Rocky and Portage Rivers. The city was incorporated in 1867 and was the first city in St. Joseph County.
In the late 1800s, the city became a major industrial center, with several factories and mills located in the area. The city was also home to a large number of immigrants, mostly from Germany and Ireland.
Geography
Three Rivers is located in the southwestern part of Michigan, about 40 miles east of Kalamazoo. The city is situated on the banks of the St. Joseph River, which is the main source of water for the city. The city is surrounded by rolling hills and is located in a rural area.
The city has a total area of 4.2 square miles, of which 4.1 square miles is land and 0.1 square miles is water. The city has a humid continental climate, with cold winters and hot, humid summers.
Economy
The economy of Three Rivers is largely based on manufacturing and agriculture. The city is home to several factories and mills, including a paper mill, a steel mill, and a plastics factory. The city is also home to several agricultural businesses, including dairy farms, fruit orchards, and vegetable farms.
The city is also home to several retail businesses, including restaurants, grocery stores, and clothing stores. The city is also home to several medical facilities, including a hospital and several clinics.
Demographics
According to the 2010 census, the population of Three Rivers was 8,633. The racial makeup of the city was 95.3% White, 1.2% African American, 0.7% Native American, 0.5% Asian, 0.1% Pacific Islander, 0.7% from other races, and 1.5% from two or more races. Hispanic or Latino of any race were 2.2% of the population.
The median household income in Three Rivers was $37,917, and the median family income was $45,938. The per capita income for the city was $19,845. About 11.3% of the population was below the poverty line.
Common Questions
What is Per Capita Income in Three Rivers?
Per Capita income in Three Rivers is $23,980.
What is the Median Family Income in Three Rivers?
Median Family Income in Three Rivers is $57,404.
What is the Median Household income in Three Rivers?
Median Household Income in Three Rivers is $49,018.
What is Income or Wage Gap in Three Rivers?
Income or Wage Gap in Three Rivers is 39.8%.
Women in Three Rivers earn 60.2 cents for every dollar earned by a man.
What is Inequality or Gini Index in Three Rivers?
Inequality or Gini Index in Three Rivers is 0.39.
What is the Total Population of Three Rivers?
Total Population of Three Rivers is 7,923.
What is the Total Male Population of Three Rivers?
Total Male Population of Three Rivers is 3,807.
What is the Total Female Population of Three Rivers?
Total Female Population of Three Rivers is 4,116.
What is the Ratio of Males per 100 Females in Three Rivers?
There are 92.49 Males per 100 Females in Three Rivers.
What is the Ratio of Females per 100 Males in Three Rivers?
There are 108.12 Females per 100 Males in Three Rivers.
What is the Median Population Age in Three Rivers?
Median Population Age in Three Rivers is 34.1 Years.
What is the Average Family Size in Three Rivers
Average Family Size in Three Rivers is 3.2 People.
What is the Average Household Size in Three Rivers
Average Household Size in Three Rivers is 2.5 People.
How Large is the Labor Force in Three Rivers?
There are 3,977 People in the Labor Forcein in Three Rivers.
What is the Percentage of People in the Labor Force in Three Rivers?
65.5% of People are in the Labor Force in Three Rivers.
What is the Unemployment Rate in Three Rivers?
Unemployment Rate in Three Rivers is 8.6%.