Mcdonough, GA Map & Demographics
Mcdonough Map
Mcdonough Overview
$32,712
PER CAPITA INCOME
$82,880
AVG FAMILY INCOME
$77,804
AVG HOUSEHOLD INCOME
20.9%
WAGE / INCOME GAP [ % ]
79.1¢/ $1
WAGE / INCOME GAP [ $ ]
$11,729
FAMILY INCOME DEFICIT
0.40
INEQUALITY / GINI INDEX
29,134
TOTAL POPULATION
14,694
MALE POPULATION
14,440
FEMALE POPULATION
101.76
MALES / 100 FEMALES
98.27
FEMALES / 100 MALES
31.0
MEDIAN AGE
3.5
AVG FAMILY SIZE
2.9
AVG HOUSEHOLD SIZE
15,909
LABOR FORCE [ PEOPLE ]
69.9%
PERCENT IN LABOR FORCE
6.2%
UNEMPLOYMENT RATE
Income in Mcdonough
Income Overview in Mcdonough
Per Capita Income in Mcdonough is $32,712, while median incomes of families and households are $82,880 and $77,804 respectively.
| Characteristic | Number | Measure |
| Per Capita Income | 29,134 | $32,712 |
| Median Family Income | 6,760 | $82,880 |
| Mean Family Income | 6,760 | $100,188 |
| Median Household Income | 9,695 | $77,804 |
| Mean Household Income | 9,695 | $91,588 |
| Income Deficit | 6,760 | $11,729 |
| Wage / Income Gap (%) | 29,134 | 20.89% |
| Wage / Income Gap ($) | 29,134 | 79.11¢ per $1 |
| Gini / Inequality Index | 29,134 | 0.40 |
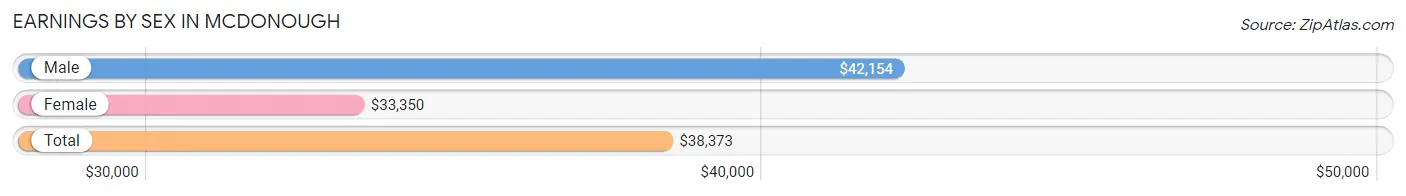
Earnings by Sex in Mcdonough
Average Earnings in Mcdonough are $38,373, $42,154 for men and $33,350 for women, a difference of 20.9%.
| Sex | Number | Average Earnings |
| Male | 8,324 (50.4%) | $42,154 |
| Female | 8,198 (49.6%) | $33,350 |
| Total | 16,522 (100.0%) | $38,373 |
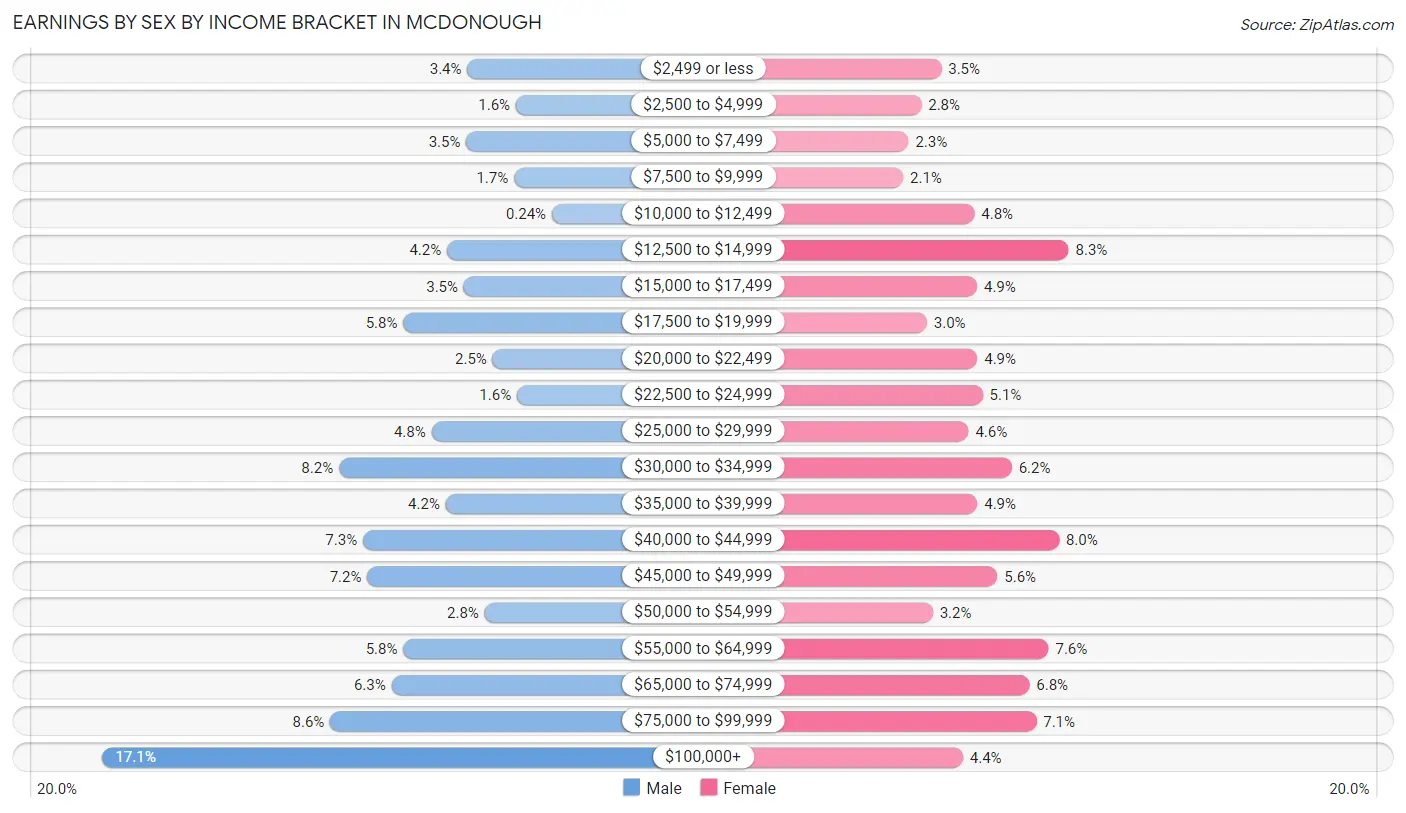
Earnings by Sex by Income Bracket in Mcdonough
The most common earnings brackets in Mcdonough are $100,000+ for men (1,422 | 17.1%) and $12,500 to $14,999 for women (681 | 8.3%).
| Income | Male | Female |
| $2,499 or less | 284 (3.4%) | 290 (3.5%) |
| $2,500 to $4,999 | 132 (1.6%) | 229 (2.8%) |
| $5,000 to $7,499 | 287 (3.5%) | 189 (2.3%) |
| $7,500 to $9,999 | 138 (1.7%) | 173 (2.1%) |
| $10,000 to $12,499 | 20 (0.2%) | 392 (4.8%) |
| $12,500 to $14,999 | 347 (4.2%) | 681 (8.3%) |
| $15,000 to $17,499 | 295 (3.5%) | 400 (4.9%) |
| $17,500 to $19,999 | 484 (5.8%) | 246 (3.0%) |
| $20,000 to $22,499 | 205 (2.5%) | 401 (4.9%) |
| $22,500 to $24,999 | 129 (1.5%) | 417 (5.1%) |
| $25,000 to $29,999 | 395 (4.8%) | 374 (4.6%) |
| $30,000 to $34,999 | 684 (8.2%) | 507 (6.2%) |
| $35,000 to $39,999 | 351 (4.2%) | 401 (4.9%) |
| $40,000 to $44,999 | 609 (7.3%) | 652 (8.0%) |
| $45,000 to $49,999 | 596 (7.2%) | 462 (5.6%) |
| $50,000 to $54,999 | 230 (2.8%) | 264 (3.2%) |
| $55,000 to $64,999 | 484 (5.8%) | 620 (7.6%) |
| $65,000 to $74,999 | 520 (6.2%) | 561 (6.8%) |
| $75,000 to $99,999 | 712 (8.6%) | 582 (7.1%) |
| $100,000+ | 1,422 (17.1%) | 357 (4.3%) |
| Total | 8,324 (100.0%) | 8,198 (100.0%) |
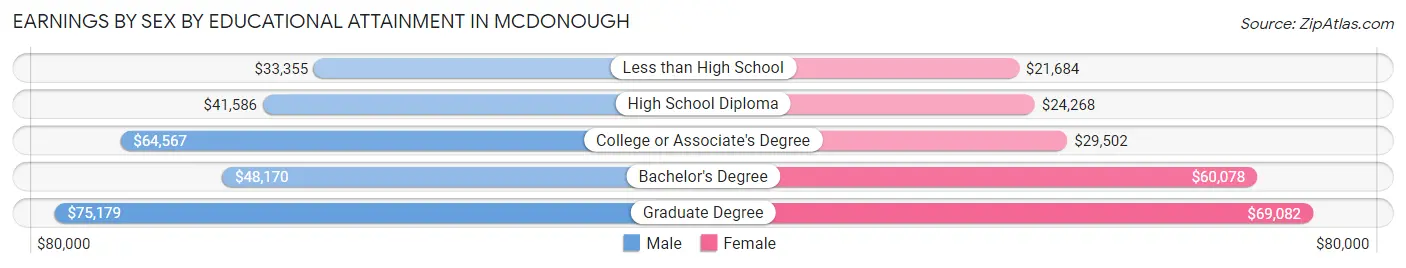
Earnings by Sex by Educational Attainment in Mcdonough
Average earnings in Mcdonough are $50,048 for men and $37,909 for women, a difference of 24.2%. Men with an educational attainment of graduate degree enjoy the highest average annual earnings of $75,179, while those with less than high school education earn the least with $33,355. Women with an educational attainment of graduate degree earn the most with the average annual earnings of $69,082, while those with less than high school education have the smallest earnings of $21,684.
| Educational Attainment | Male Income | Female Income |
| Less than High School | $33,355 | $21,684 |
| High School Diploma | $41,586 | $24,268 |
| College or Associate's Degree | $64,567 | $29,502 |
| Bachelor's Degree | $48,170 | $60,078 |
| Graduate Degree | $75,179 | $69,082 |
| Total | $50,048 | $37,909 |
Family Income in Mcdonough
Family Income Brackets in Mcdonough
According to the Mcdonough family income data, there are 1,622 families falling into the $100,000 to $149,999 income range, which is the most common income bracket and makes up 24.0% of all families. Conversely, the less than $10,000 income bracket is the least frequent group with only 108 families (1.6%) belonging to this category.
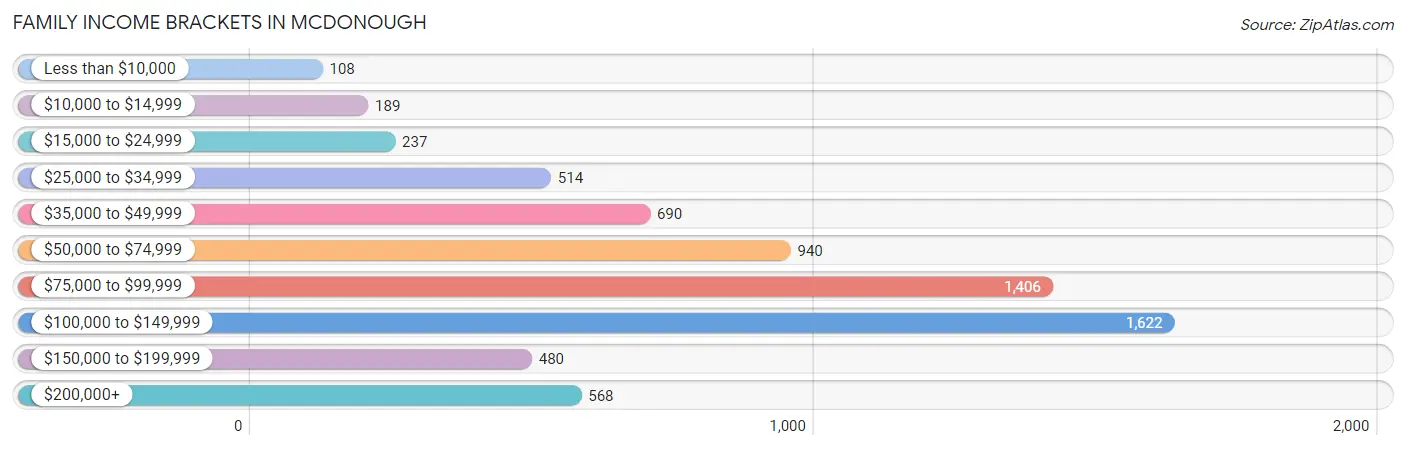
| Income Bracket | # Families | % Families |
| Less than $10,000 | 108 | 1.6% |
| $10,000 to $14,999 | 189 | 2.8% |
| $15,000 to $24,999 | 237 | 3.5% |
| $25,000 to $34,999 | 514 | 7.6% |
| $35,000 to $49,999 | 690 | 10.2% |
| $50,000 to $74,999 | 940 | 13.9% |
| $75,000 to $99,999 | 1,406 | 20.8% |
| $100,000 to $149,999 | 1,622 | 24.0% |
| $150,000 to $199,999 | 480 | 7.1% |
| $200,000+ | 568 | 8.4% |
Family Income by Famaliy Size in Mcdonough
7+ person families (36 | 0.5%) account for the highest median family income in Mcdonough with $162,955 per family, while 2-person families (2,425 | 35.9%) have the highest median income of $40,554 per family member.
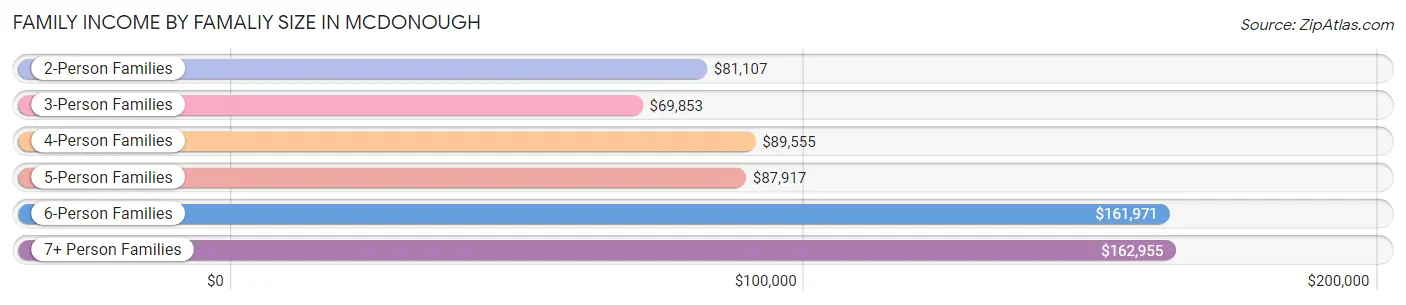
| Income Bracket | # Families | Median Income |
| 2-Person Families | 2,425 (35.9%) | $81,107 |
| 3-Person Families | 1,672 (24.7%) | $69,853 |
| 4-Person Families | 1,727 (25.6%) | $89,555 |
| 5-Person Families | 582 (8.6%) | $87,917 |
| 6-Person Families | 318 (4.7%) | $161,971 |
| 7+ Person Families | 36 (0.5%) | $162,955 |
| Total | 6,760 (100.0%) | $82,880 |
Family Income by Number of Earners in Mcdonough
The median family income in Mcdonough is $82,880, with families comprising 3+ earners (1,036) having the highest median family income of $128,485, while families with 1 earner (2,266) have the lowest median family income of $54,474, accounting for 15.3% and 33.5% of families, respectively.
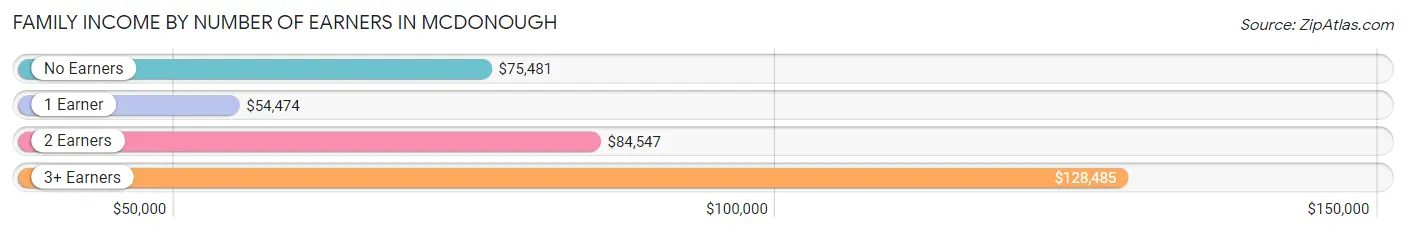
| Number of Earners | # Families | Median Income |
| No Earners | 476 (7.0%) | $75,481 |
| 1 Earner | 2,266 (33.5%) | $54,474 |
| 2 Earners | 2,982 (44.1%) | $84,547 |
| 3+ Earners | 1,036 (15.3%) | $128,485 |
| Total | 6,760 (100.0%) | $82,880 |
Household Income in Mcdonough
Household Income Brackets in Mcdonough
With 2,065 households falling in the category, the $100,000 to $149,999 income range is the most frequent in Mcdonough, accounting for 21.3% of all households. In contrast, only 213 households (2.2%) fall into the less than $10,000 income bracket, making it the least populous group.
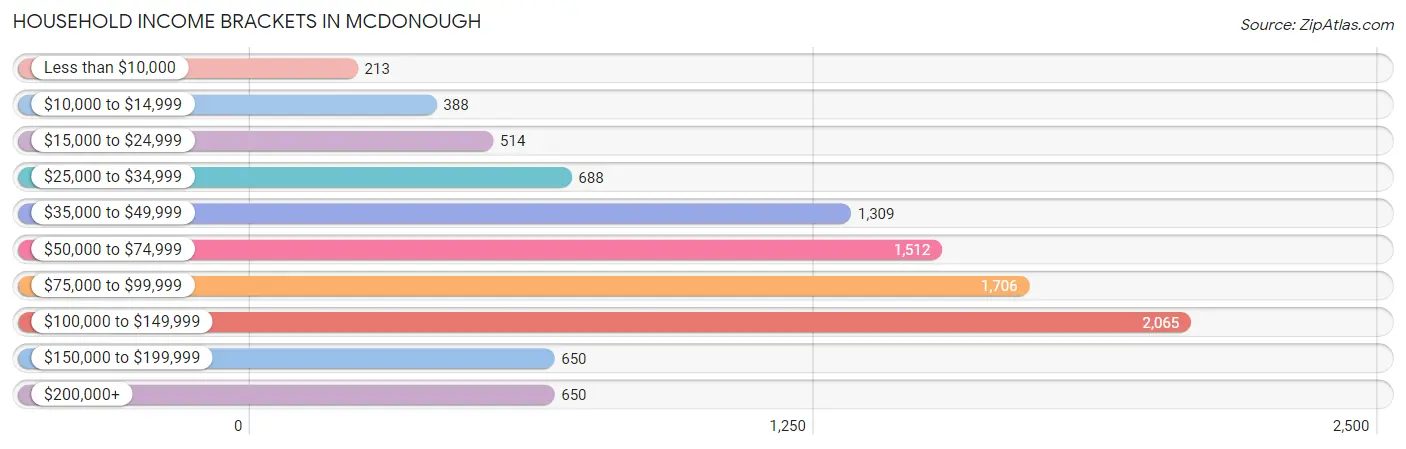
| Income Bracket | # Households | % Households |
| Less than $10,000 | 213 | 2.2% |
| $10,000 to $14,999 | 388 | 4.0% |
| $15,000 to $24,999 | 514 | 5.3% |
| $25,000 to $34,999 | 688 | 7.1% |
| $35,000 to $49,999 | 1,309 | 13.5% |
| $50,000 to $74,999 | 1,512 | 15.6% |
| $75,000 to $99,999 | 1,706 | 17.6% |
| $100,000 to $149,999 | 2,065 | 21.3% |
| $150,000 to $199,999 | 650 | 6.7% |
| $200,000+ | 650 | 6.7% |
Household Income by Householder Age in Mcdonough
The median household income in Mcdonough is $77,804, with the highest median household income of $84,084 found in the 45 to 64 years age bracket for the primary householder. A total of 3,811 households (39.3%) fall into this category. Meanwhile, the 65+ years age bracket for the primary householder has the lowest median household income of $47,500, with 1,642 households (16.9%) in this group.
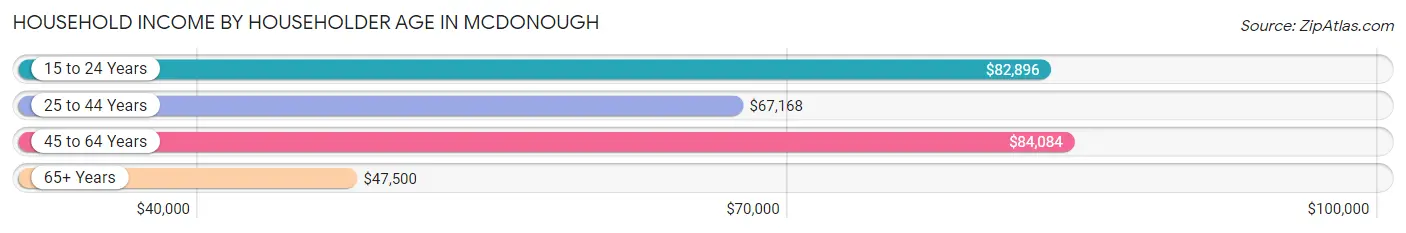
| Income Bracket | # Households | Median Income |
| 15 to 24 Years | 497 (5.1%) | $82,896 |
| 25 to 44 Years | 3,745 (38.6%) | $67,168 |
| 45 to 64 Years | 3,811 (39.3%) | $84,084 |
| 65+ Years | 1,642 (16.9%) | $47,500 |
| Total | 9,695 (100.0%) | $77,804 |
Poverty in Mcdonough
Income Below Poverty by Sex and Age in Mcdonough
With 7.1% poverty level for males and 13.7% for females among the residents of Mcdonough, 5 year old males and 5 year old females are the most vulnerable to poverty, with 80 males (33.5%) and 141 females (47.0%) in their respective age groups living below the poverty level.
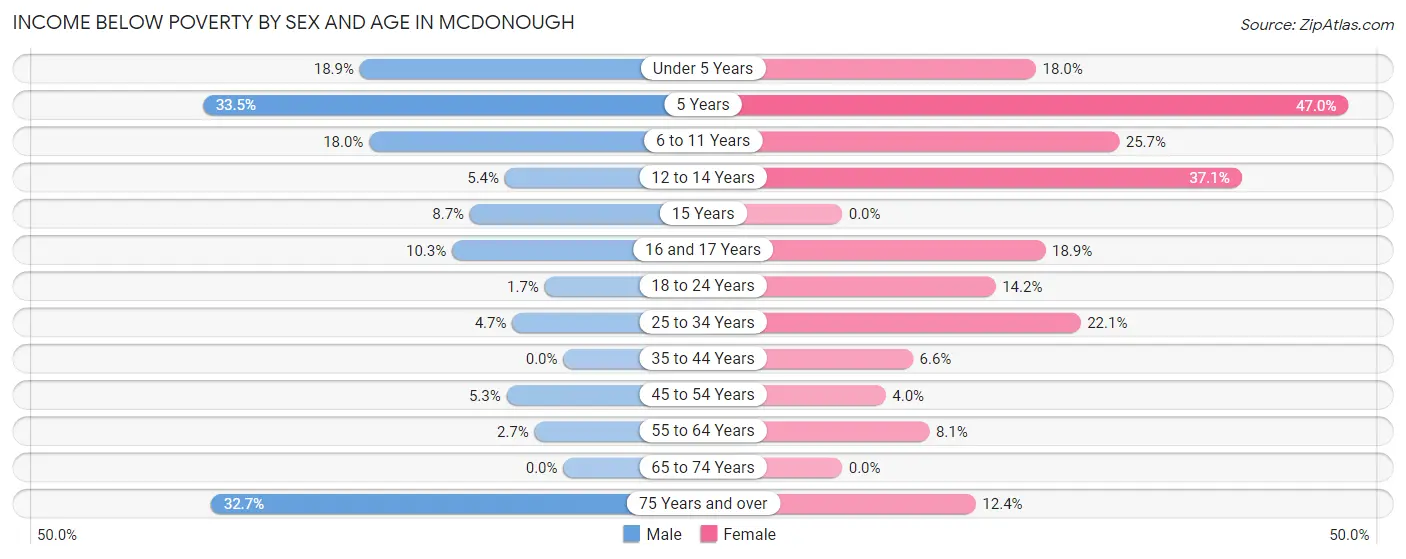
| Age Bracket | Male | Female |
| Under 5 Years | 164 (18.9%) | 174 (18.0%) |
| 5 Years | 80 (33.5%) | 141 (47.0%) |
| 6 to 11 Years | 228 (18.0%) | 173 (25.7%) |
| 12 to 14 Years | 62 (5.4%) | 194 (37.1%) |
| 15 Years | 17 (8.7%) | 0 (0.0%) |
| 16 and 17 Years | 79 (10.3%) | 116 (18.9%) |
| 18 to 24 Years | 36 (1.7%) | 224 (14.2%) |
| 25 to 34 Years | 88 (4.7%) | 478 (22.1%) |
| 35 to 44 Years | 0 (0.0%) | 132 (6.6%) |
| 45 to 54 Years | 92 (5.3%) | 90 (4.0%) |
| 55 to 64 Years | 35 (2.7%) | 137 (8.1%) |
| 65 to 74 Years | 0 (0.0%) | 0 (0.0%) |
| 75 Years and over | 125 (32.7%) | 78 (12.4%) |
| Total | 1,006 (7.1%) | 1,937 (13.7%) |
Income Above Poverty by Sex and Age in Mcdonough
According to the poverty statistics in Mcdonough, males aged 35 to 44 years and females aged 15 years are the age groups that are most secure financially, with 100.0% of males and 100.0% of females in these age groups living above the poverty line.
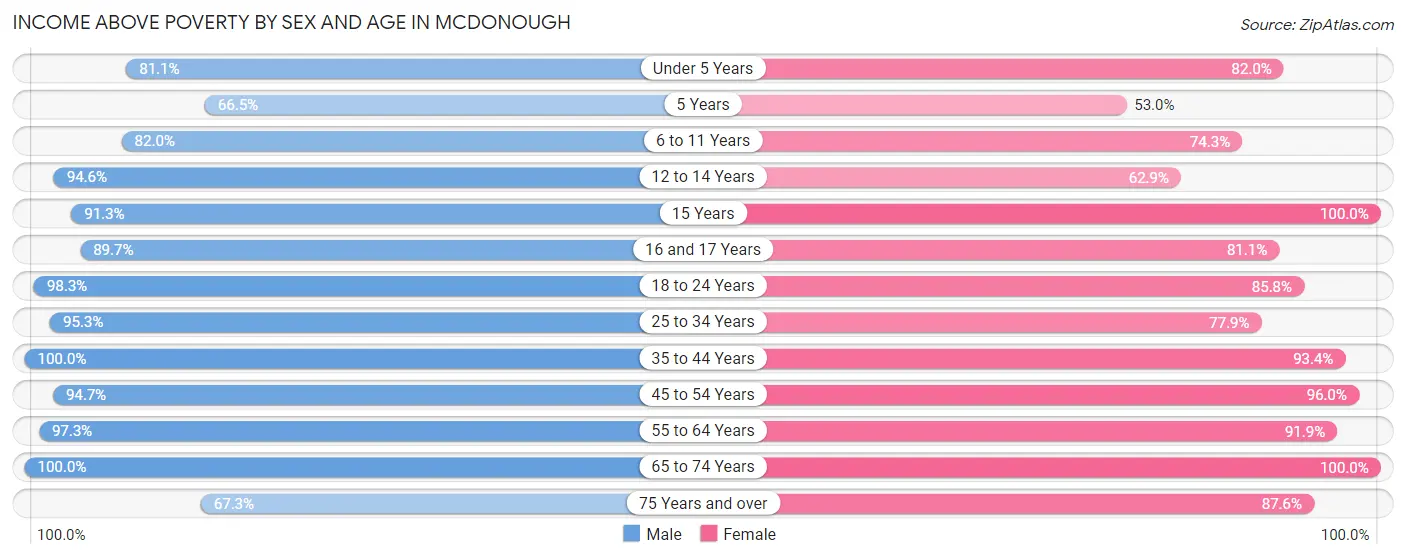
| Age Bracket | Male | Female |
| Under 5 Years | 704 (81.1%) | 793 (82.0%) |
| 5 Years | 159 (66.5%) | 159 (53.0%) |
| 6 to 11 Years | 1,037 (82.0%) | 500 (74.3%) |
| 12 to 14 Years | 1,080 (94.6%) | 329 (62.9%) |
| 15 Years | 179 (91.3%) | 175 (100.0%) |
| 16 and 17 Years | 686 (89.7%) | 499 (81.1%) |
| 18 to 24 Years | 2,041 (98.3%) | 1,349 (85.8%) |
| 25 to 34 Years | 1,768 (95.3%) | 1,682 (77.9%) |
| 35 to 44 Years | 1,655 (100.0%) | 1,878 (93.4%) |
| 45 to 54 Years | 1,654 (94.7%) | 2,140 (96.0%) |
| 55 to 64 Years | 1,278 (97.3%) | 1,556 (91.9%) |
| 65 to 74 Years | 595 (100.0%) | 622 (100.0%) |
| 75 Years and over | 257 (67.3%) | 551 (87.6%) |
| Total | 13,093 (92.9%) | 12,233 (86.3%) |
Income Below Poverty Among Married-Couple Families in Mcdonough
The poverty statistics for married-couple families in Mcdonough show that 2.5% or 107 of the total 4,263 families live below the poverty line. Families with 1 or 2 children have the highest poverty rate of 5.7%, comprising of 107 families. On the other hand, families with no children have the lowest poverty rate of 0.0%, which includes 0 families.
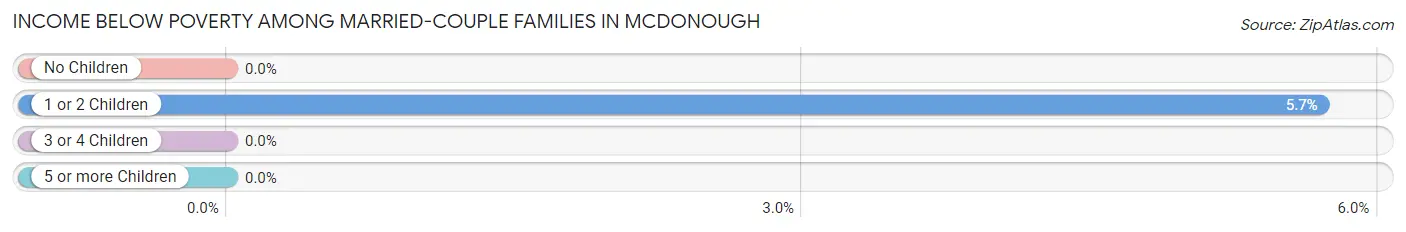
| Children | Above Poverty | Below Poverty |
| No Children | 2,004 (100.0%) | 0 (0.0%) |
| 1 or 2 Children | 1,769 (94.3%) | 107 (5.7%) |
| 3 or 4 Children | 383 (100.0%) | 0 (0.0%) |
| 5 or more Children | 0 (0.0%) | 0 (0.0%) |
| Total | 4,156 (97.5%) | 107 (2.5%) |
Income Below Poverty Among Single-Parent Households in Mcdonough
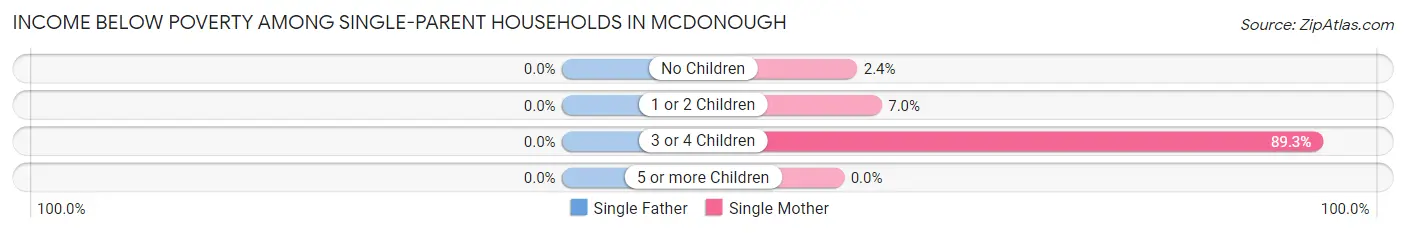
| Children | Single Father | Single Mother |
| No Children | 0 (0.0%) | 19 (2.4%) |
| 1 or 2 Children | 0 (0.0%) | 64 (7.0%) |
| 3 or 4 Children | 0 (0.0%) | 334 (89.3%) |
| 5 or more Children | 0 (0.0%) | 0 (0.0%) |
| Total | 0 (0.0%) | 417 (20.1%) |
Income Below Poverty Among Married-Couple vs Single-Parent Households in Mcdonough
The poverty data for Mcdonough shows that 107 of the married-couple family households (2.5%) and 417 of the single-parent households (16.7%) are living below the poverty level. Within the married-couple family households, those with 1 or 2 children have the highest poverty rate, with 107 households (5.7%) falling below the poverty line. Among the single-parent households, those with 3 or 4 children have the highest poverty rate, with 334 household (71.4%) living below poverty.
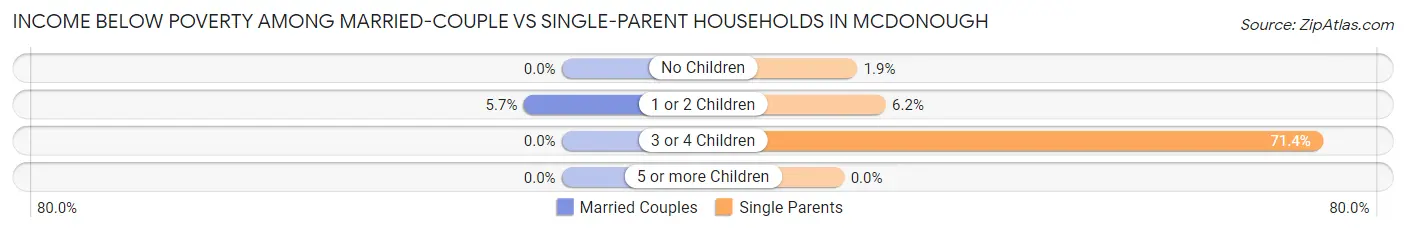
| Children | Married-Couple Families | Single-Parent Households |
| No Children | 0 (0.0%) | 19 (1.9%) |
| 1 or 2 Children | 107 (5.7%) | 64 (6.2%) |
| 3 or 4 Children | 0 (0.0%) | 334 (71.4%) |
| 5 or more Children | 0 (0.0%) | 0 (0.0%) |
| Total | 107 (2.5%) | 417 (16.7%) |
Race in Mcdonough
The most populous races in Mcdonough are Black / African American (21,131 | 72.5%), White / Caucasian (4,667 | 16.0%), and Two or more Races (2,322 | 8.0%).
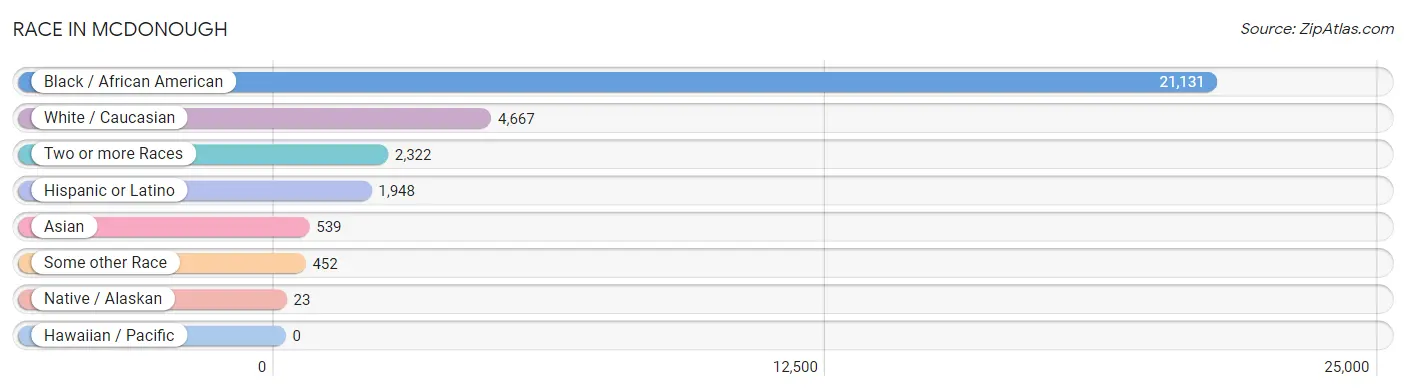
| Race | # Population | % Population |
| Asian | 539 | 1.8% |
| Black / African American | 21,131 | 72.5% |
| Hawaiian / Pacific | 0 | 0.0% |
| Hispanic or Latino | 1,948 | 6.7% |
| Native / Alaskan | 23 | 0.1% |
| White / Caucasian | 4,667 | 16.0% |
| Two or more Races | 2,322 | 8.0% |
| Some other Race | 452 | 1.5% |
| Total | 29,134 | 100.0% |
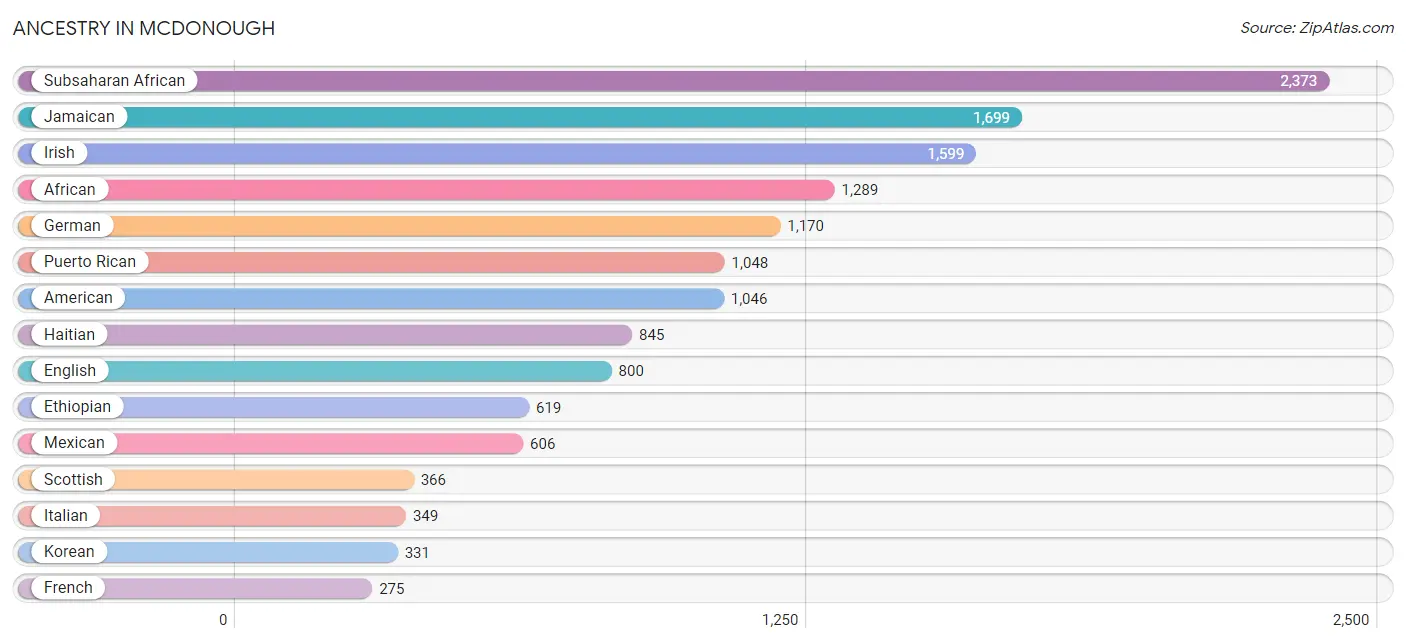
Ancestry in Mcdonough
The most populous ancestries reported in Mcdonough are Subsaharan African (2,373 | 8.2%), Jamaican (1,699 | 5.8%), Irish (1,599 | 5.5%), African (1,289 | 4.4%), and German (1,170 | 4.0%), together accounting for 27.9% of all Mcdonough residents.
| Ancestry | # Population | % Population |
| African | 1,289 | 4.4% |
| American | 1,046 | 3.6% |
| Arab | 136 | 0.5% |
| Arapaho | 100 | 0.3% |
| Bahamian | 60 | 0.2% |
| Barbadian | 60 | 0.2% |
| Bhutanese | 12 | 0.0% |
| Blackfeet | 33 | 0.1% |
| British | 41 | 0.1% |
| British West Indian | 4 | 0.0% |
| Burmese | 13 | 0.0% |
| Canadian | 52 | 0.2% |
| Central American | 85 | 0.3% |
| Cherokee | 17 | 0.1% |
| Colombian | 23 | 0.1% |
| Costa Rican | 30 | 0.1% |
| Cuban | 15 | 0.1% |
| Czech | 8 | 0.0% |
| Dominican | 106 | 0.4% |
| Dutch | 133 | 0.5% |
| Eastern European | 14 | 0.1% |
| Egyptian | 126 | 0.4% |
| English | 800 | 2.8% |
| Ethiopian | 619 | 2.1% |
| European | 120 | 0.4% |
| French | 275 | 0.9% |
| German | 1,170 | 4.0% |
| Ghanaian | 30 | 0.1% |
| Guatemalan | 9 | 0.0% |
| Guyanese | 12 | 0.0% |
| Haitian | 845 | 2.9% |
| Indian (Asian) | 33 | 0.1% |
| Irish | 1,599 | 5.5% |
| Israeli | 180 | 0.6% |
| Italian | 349 | 1.2% |
| Jamaican | 1,699 | 5.8% |
| Japanese | 126 | 0.4% |
| Korean | 331 | 1.1% |
| Liberian | 38 | 0.1% |
| Mexican | 606 | 2.1% |
| Moroccan | 10 | 0.0% |
| Nigerian | 109 | 0.4% |
| Norwegian | 8 | 0.0% |
| Panamanian | 7 | 0.0% |
| Polish | 80 | 0.3% |
| Puerto Rican | 1,048 | 3.6% |
| Russian | 4 | 0.0% |
| Salvadoran | 39 | 0.1% |
| Scandinavian | 63 | 0.2% |
| Scotch-Irish | 57 | 0.2% |
| Scottish | 366 | 1.3% |
| Sierra Leonean | 118 | 0.4% |
| South American | 88 | 0.3% |
| Sri Lankan | 129 | 0.4% |
| Subsaharan African | 2,373 | 8.2% |
| Swedish | 33 | 0.1% |
| Swiss | 13 | 0.0% |
| Thai | 173 | 0.6% |
| Trinidadian and Tobagonian | 170 | 0.6% |
| Venezuelan | 65 | 0.2% |
| Welsh | 21 | 0.1% |
| West Indian | 129 | 0.4% | View All 62 Rows |
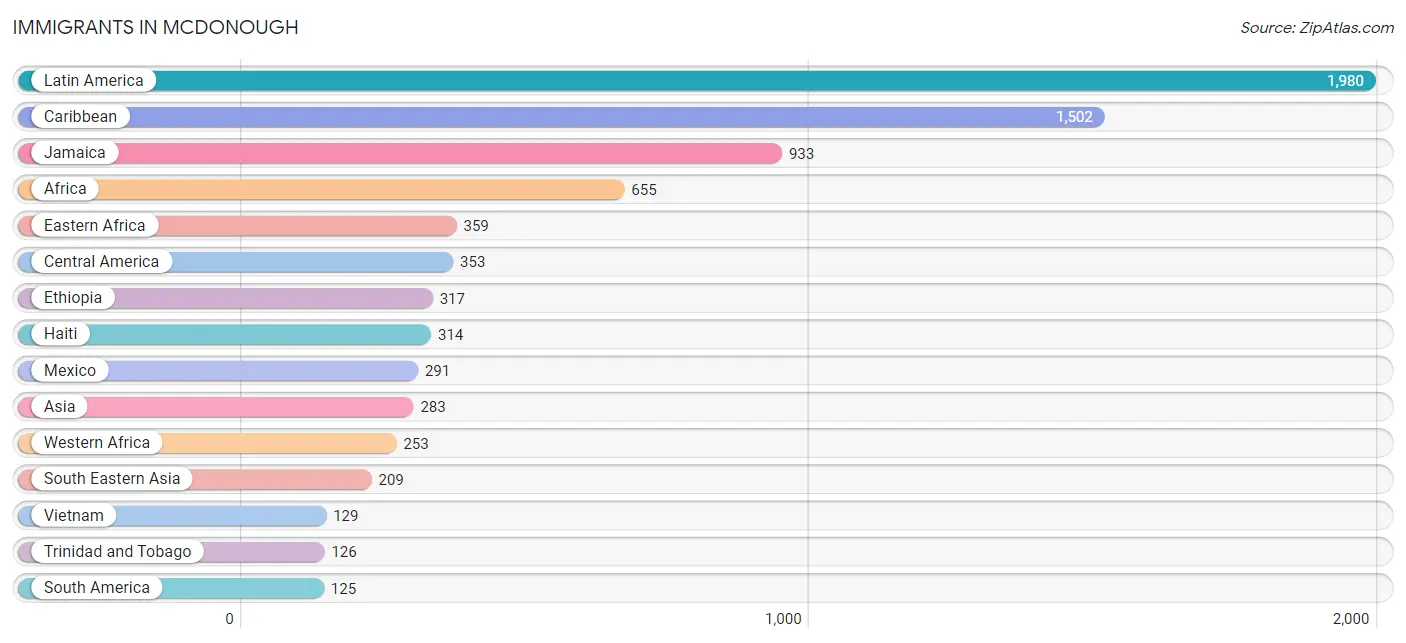
Immigrants in Mcdonough
The most numerous immigrant groups reported in Mcdonough came from Latin America (1,980 | 6.8%), Caribbean (1,502 | 5.2%), Jamaica (933 | 3.2%), Africa (655 | 2.2%), and Eastern Africa (359 | 1.2%), together accounting for 18.6% of all Mcdonough residents.
| Immigration Origin | # Population | % Population |
| Africa | 655 | 2.2% |
| Asia | 283 | 1.0% |
| Barbados | 60 | 0.2% |
| Cambodia | 30 | 0.1% |
| Canada | 109 | 0.4% |
| Caribbean | 1,502 | 5.2% |
| Central America | 353 | 1.2% |
| China | 33 | 0.1% |
| Colombia | 16 | 0.1% |
| Cuba | 4 | 0.0% |
| Eastern Africa | 359 | 1.2% |
| Eastern Asia | 36 | 0.1% |
| Egypt | 43 | 0.2% |
| El Salvador | 39 | 0.1% |
| Ethiopia | 317 | 1.1% |
| Europe | 13 | 0.0% |
| France | 13 | 0.0% |
| Ghana | 30 | 0.1% |
| Guatemala | 16 | 0.1% |
| Guyana | 70 | 0.2% |
| Haiti | 314 | 1.1% |
| India | 38 | 0.1% |
| Jamaica | 933 | 3.2% |
| Korea | 3 | 0.0% |
| Latin America | 1,980 | 6.8% |
| Liberia | 38 | 0.1% |
| Mexico | 291 | 1.0% |
| Nigeria | 113 | 0.4% |
| Northern Africa | 43 | 0.2% |
| Panama | 7 | 0.0% |
| Philippines | 50 | 0.2% |
| Sierra Leone | 72 | 0.3% |
| South America | 125 | 0.4% |
| South Central Asia | 38 | 0.1% |
| South Eastern Asia | 209 | 0.7% |
| St. Vincent and the Grenadines | 13 | 0.0% |
| Trinidad and Tobago | 126 | 0.4% |
| Venezuela | 39 | 0.1% |
| Vietnam | 129 | 0.4% |
| Western Africa | 253 | 0.9% |
| Western Europe | 13 | 0.0% | View All 41 Rows |
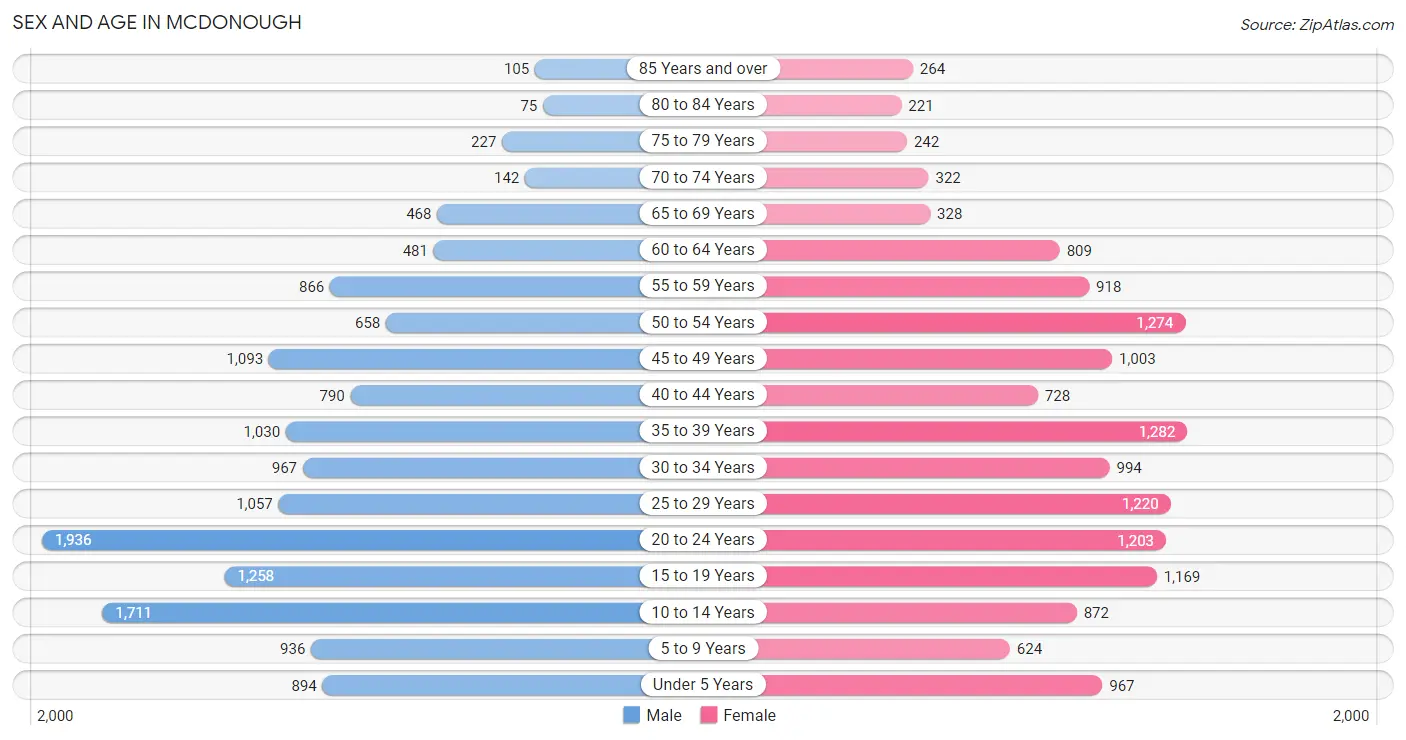
Sex and Age in Mcdonough
Sex and Age in Mcdonough
The most populous age groups in Mcdonough are 20 to 24 Years (1,936 | 13.2%) for men and 35 to 39 Years (1,282 | 8.9%) for women.
| Age Bracket | Male | Female |
| Under 5 Years | 894 (6.1%) | 967 (6.7%) |
| 5 to 9 Years | 936 (6.4%) | 624 (4.3%) |
| 10 to 14 Years | 1,711 (11.6%) | 872 (6.0%) |
| 15 to 19 Years | 1,258 (8.6%) | 1,169 (8.1%) |
| 20 to 24 Years | 1,936 (13.2%) | 1,203 (8.3%) |
| 25 to 29 Years | 1,057 (7.2%) | 1,220 (8.5%) |
| 30 to 34 Years | 967 (6.6%) | 994 (6.9%) |
| 35 to 39 Years | 1,030 (7.0%) | 1,282 (8.9%) |
| 40 to 44 Years | 790 (5.4%) | 728 (5.0%) |
| 45 to 49 Years | 1,093 (7.4%) | 1,003 (7.0%) |
| 50 to 54 Years | 658 (4.5%) | 1,274 (8.8%) |
| 55 to 59 Years | 866 (5.9%) | 918 (6.4%) |
| 60 to 64 Years | 481 (3.3%) | 809 (5.6%) |
| 65 to 69 Years | 468 (3.2%) | 328 (2.3%) |
| 70 to 74 Years | 142 (1.0%) | 322 (2.2%) |
| 75 to 79 Years | 227 (1.5%) | 242 (1.7%) |
| 80 to 84 Years | 75 (0.5%) | 221 (1.5%) |
| 85 Years and over | 105 (0.7%) | 264 (1.8%) |
| Total | 14,694 (100.0%) | 14,440 (100.0%) |
Families and Households in Mcdonough
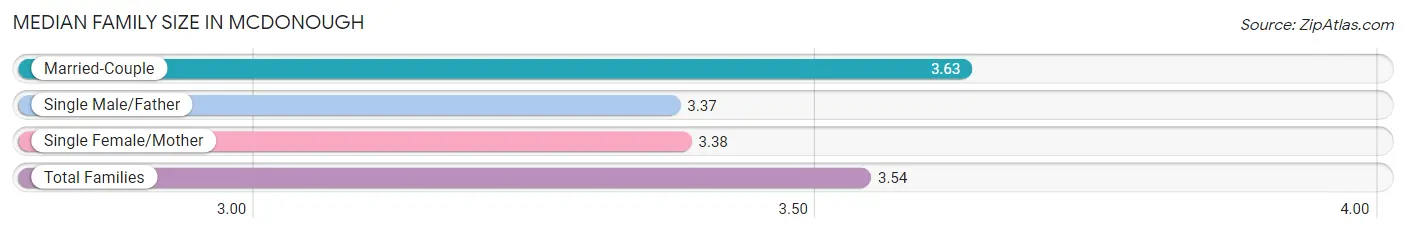
Median Family Size in Mcdonough
The median family size in Mcdonough is 3.54 persons per family, with married-couple families (4,263 | 63.1%) accounting for the largest median family size of 3.63 persons per family. On the other hand, single male/father families (423 | 6.3%) represent the smallest median family size with 3.37 persons per family.
| Family Type | # Families | Family Size |
| Married-Couple | 4,263 (63.1%) | 3.63 |
| Single Male/Father | 423 (6.3%) | 3.37 |
| Single Female/Mother | 2,074 (30.7%) | 3.38 |
| Total Families | 6,760 (100.0%) | 3.54 |
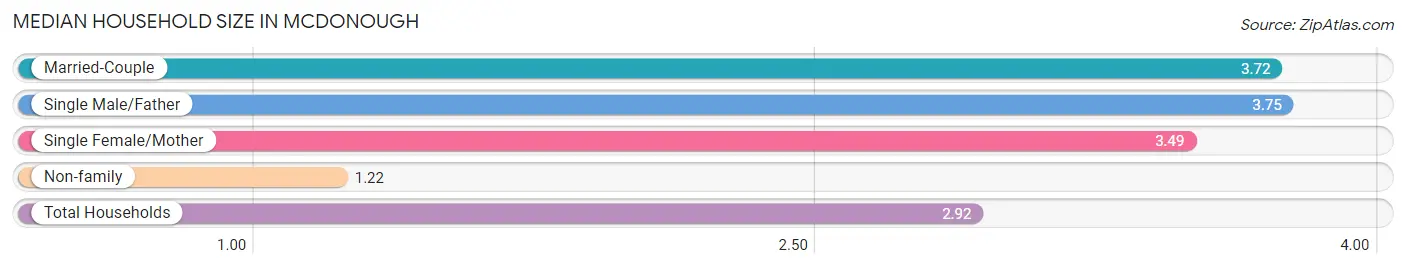
Median Household Size in Mcdonough
The median household size in Mcdonough is 2.92 persons per household, with single male/father households (423 | 4.4%) accounting for the largest median household size of 3.75 persons per household. non-family households (2,935 | 30.3%) represent the smallest median household size with 1.22 persons per household.
| Household Type | # Households | Household Size |
| Married-Couple | 4,263 (44.0%) | 3.72 |
| Single Male/Father | 423 (4.4%) | 3.75 |
| Single Female/Mother | 2,074 (21.4%) | 3.49 |
| Non-family | 2,935 (30.3%) | 1.22 |
| Total Households | 9,695 (100.0%) | 2.92 |
Household Size by Marriage Status in Mcdonough
Out of a total of 9,695 households in Mcdonough, 6,760 (69.7%) are family households, while 2,935 (30.3%) are nonfamily households. The most numerous type of family households are 2-person households, comprising 2,042, and the most common type of nonfamily households are 1-person households, comprising 2,426.
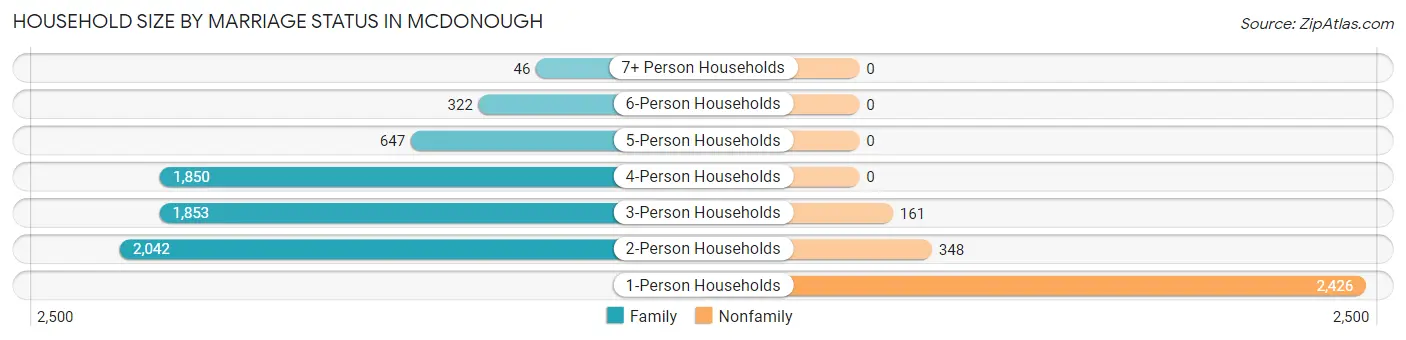
| Household Size | Family Households | Nonfamily Households |
| 1-Person Households | - | 2,426 (25.0%) |
| 2-Person Households | 2,042 (21.1%) | 348 (3.6%) |
| 3-Person Households | 1,853 (19.1%) | 161 (1.7%) |
| 4-Person Households | 1,850 (19.1%) | 0 (0.0%) |
| 5-Person Households | 647 (6.7%) | 0 (0.0%) |
| 6-Person Households | 322 (3.3%) | 0 (0.0%) |
| 7+ Person Households | 46 (0.5%) | 0 (0.0%) |
| Total | 6,760 (69.7%) | 2,935 (30.3%) |
Female Fertility in Mcdonough
Fertility by Age in Mcdonough
Average fertility rate in Mcdonough is 110.0 births per 1,000 women. Women in the age bracket of 20 to 34 years have the highest fertility rate with 177.0 births per 1,000 women. Women in the age bracket of 20 to 34 years acount for 71.1% of all women with births.
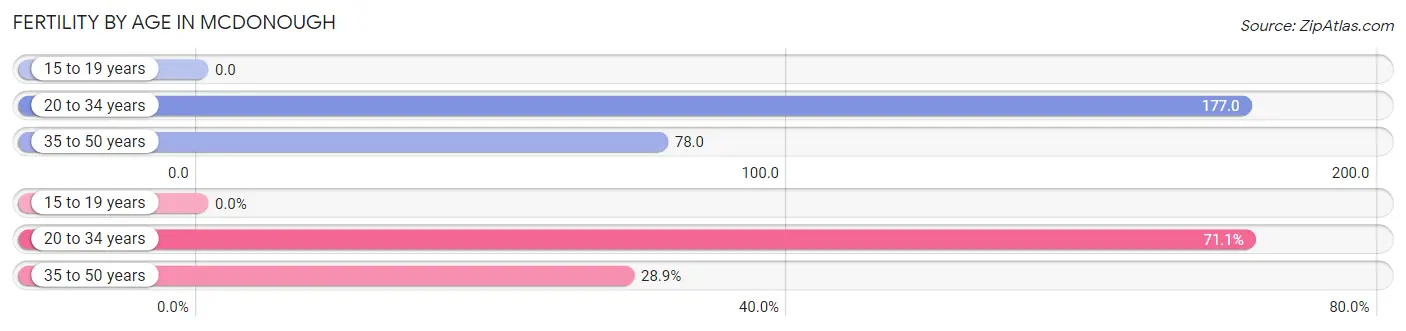
| Age Bracket | Women with Births | Births / 1,000 Women |
| 15 to 19 years | 0 (0.0%) | 0.0 |
| 20 to 34 years | 605 (71.1%) | 177.0 |
| 35 to 50 years | 246 (28.9%) | 78.0 |
| Total | 851 (100.0%) | 110.0 |
Fertility by Age by Marriage Status in Mcdonough
59.9% of women with births (851) in Mcdonough are married. The highest percentage of unmarried women with births falls into 20 to 34 years age bracket with 54.5% of them unmarried at the time of birth, while the lowest percentage of unmarried women with births belong to 35 to 50 years age bracket with 4.5% of them unmarried.
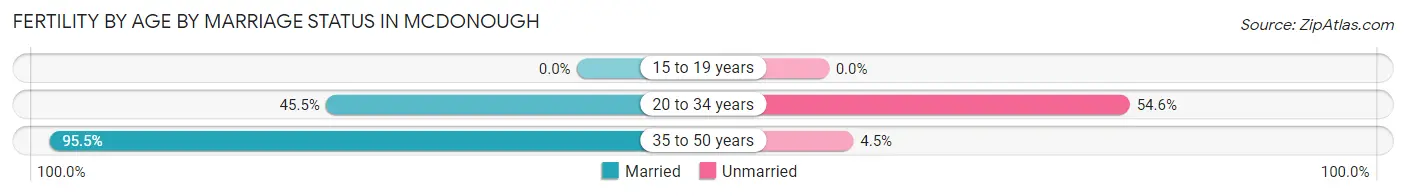
| Age Bracket | Married | Unmarried |
| 15 to 19 years | 0 (0.0%) | 0 (0.0%) |
| 20 to 34 years | 275 (45.5%) | 330 (54.5%) |
| 35 to 50 years | 235 (95.5%) | 11 (4.5%) |
| Total | 510 (59.9%) | 341 (40.1%) |
Fertility by Education in Mcdonough
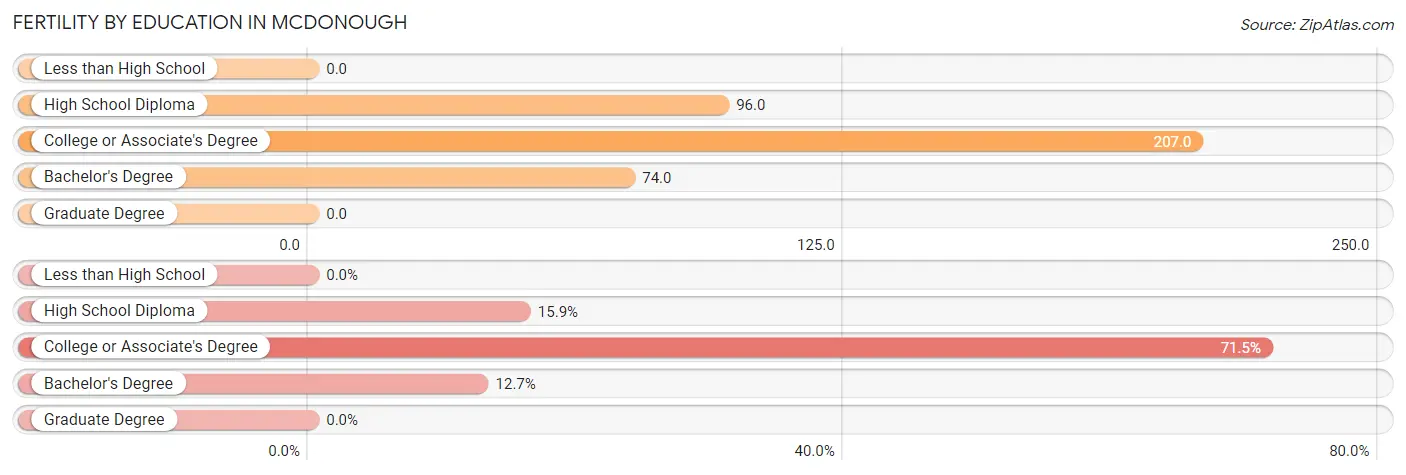
| Educational Attainment | Women with Births | Births / 1,000 Women |
| Less than High School | 0 (0.0%) | 0.0 |
| High School Diploma | 135 (15.9%) | 96.0 |
| College or Associate's Degree | 608 (71.5%) | 207.0 |
| Bachelor's Degree | 108 (12.7%) | 74.0 |
| Graduate Degree | 0 (0.0%) | 0.0 |
| Total | 851 (100.0%) | 110.0 |
Fertility by Education by Marriage Status in Mcdonough
40.1% of women with births in Mcdonough are unmarried. Women with the educational attainment of high school diploma are most likely to be married with 86.7% of them married at childbirth, while women with the educational attainment of college or associate's degree are least likely to be married with 45.9% of them unmarried at childbirth.
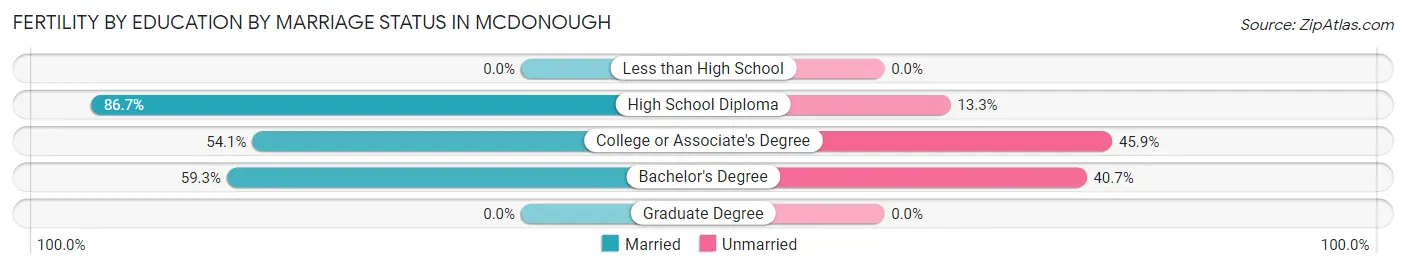
| Educational Attainment | Married | Unmarried |
| Less than High School | 0 (0.0%) | 0 (0.0%) |
| High School Diploma | 117 (86.7%) | 18 (13.3%) |
| College or Associate's Degree | 329 (54.1%) | 279 (45.9%) |
| Bachelor's Degree | 64 (59.3%) | 44 (40.7%) |
| Graduate Degree | 0 (0.0%) | 0 (0.0%) |
| Total | 510 (59.9%) | 341 (40.1%) |
Employment Characteristics in Mcdonough
Employment by Class of Employer in Mcdonough
Among the 14,135 employed individuals in Mcdonough, private company employees (10,262 | 72.6%), local government employees (1,221 | 8.6%), and self-employed (incorporated) (578 | 4.1%) make up the most common classes of employment.
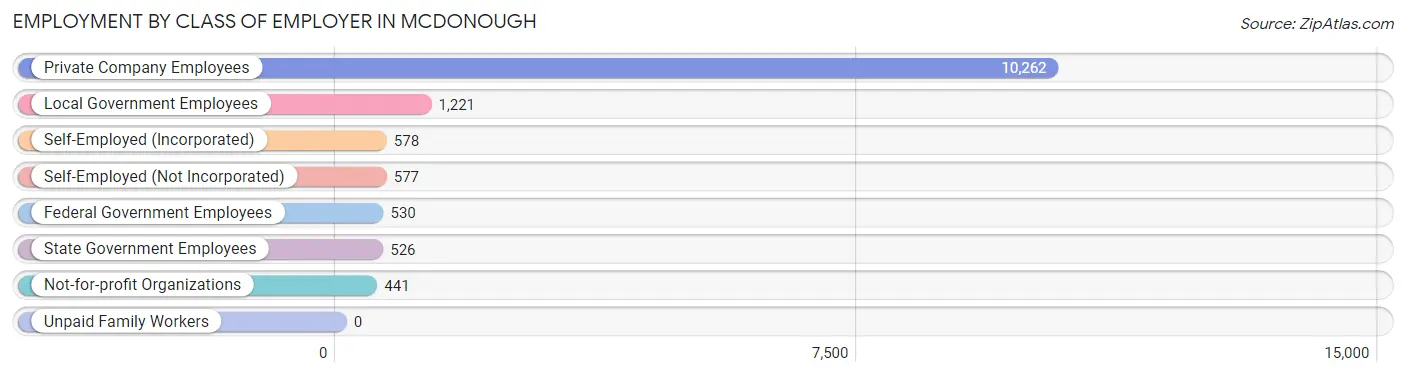
| Employer Class | # Employees | % Employees |
| Private Company Employees | 10,262 | 72.6% |
| Self-Employed (Incorporated) | 578 | 4.1% |
| Self-Employed (Not Incorporated) | 577 | 4.1% |
| Not-for-profit Organizations | 441 | 3.1% |
| Local Government Employees | 1,221 | 8.6% |
| State Government Employees | 526 | 3.7% |
| Federal Government Employees | 530 | 3.7% |
| Unpaid Family Workers | 0 | 0.0% |
| Total | 14,135 | 100.0% |
Employment Status by Age in Mcdonough
According to the labor force statistics for Mcdonough, out of the total population over 16 years of age (22,759), 69.9% or 15,909 individuals are in the labor force, with 6.2% or 986 of them unemployed. The age group with the highest labor force participation rate is 45 to 54 years, with 85.0% or 3,424 individuals in the labor force. Within the labor force, the 16 to 19 years age range has the highest percentage of unemployed individuals, with 12.9% or 68 of them being unemployed.
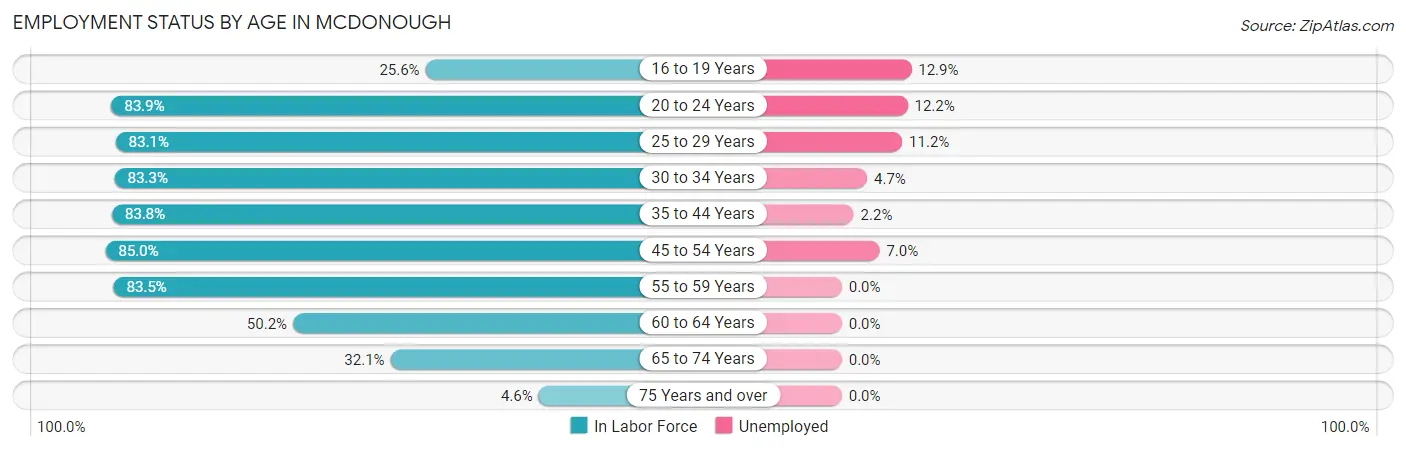
| Age Bracket | In Labor Force | Unemployed |
| 16 to 19 Years | 526 (25.6%) | 68 (12.9%) |
| 20 to 24 Years | 2,634 (83.9%) | 321 (12.2%) |
| 25 to 29 Years | 1,892 (83.1%) | 212 (11.2%) |
| 30 to 34 Years | 1,634 (83.3%) | 77 (4.7%) |
| 35 to 44 Years | 3,210 (83.8%) | 71 (2.2%) |
| 45 to 54 Years | 3,424 (85.0%) | 240 (7.0%) |
| 55 to 59 Years | 1,490 (83.5%) | 0 (0.0%) |
| 60 to 64 Years | 648 (50.2%) | 0 (0.0%) |
| 65 to 74 Years | 404 (32.1%) | 0 (0.0%) |
| 75 Years and over | 52 (4.6%) | 0 (0.0%) |
| Total | 15,909 (69.9%) | 986 (6.2%) |
Employment Status by Educational Attainment in Mcdonough
According to labor force statistics for Mcdonough, 81.1% of individuals (12,303) out of the total population between 25 and 64 years of age (15,170) are in the labor force, with 4.9% or 603 of them being unemployed. The group with the highest labor force participation rate are those with the educational attainment of college / associate degree, with 85.3% or 5,086 individuals in the labor force. Within the labor force, individuals with less than high school education have the highest percentage of unemployment, with 8.0% or 38 of them being unemployed.
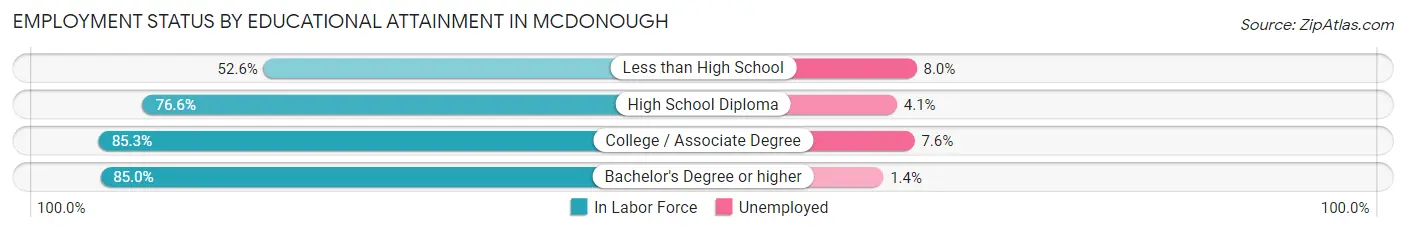
| Educational Attainment | In Labor Force | Unemployed |
| Less than High School | 473 (52.6%) | 72 (8.0%) |
| High School Diploma | 2,925 (76.6%) | 157 (4.1%) |
| College / Associate Degree | 5,086 (85.3%) | 453 (7.6%) |
| Bachelor's Degree or higher | 3,816 (85.0%) | 63 (1.4%) |
| Total | 12,303 (81.1%) | 743 (4.9%) |
Employment Occupations by Sex in Mcdonough
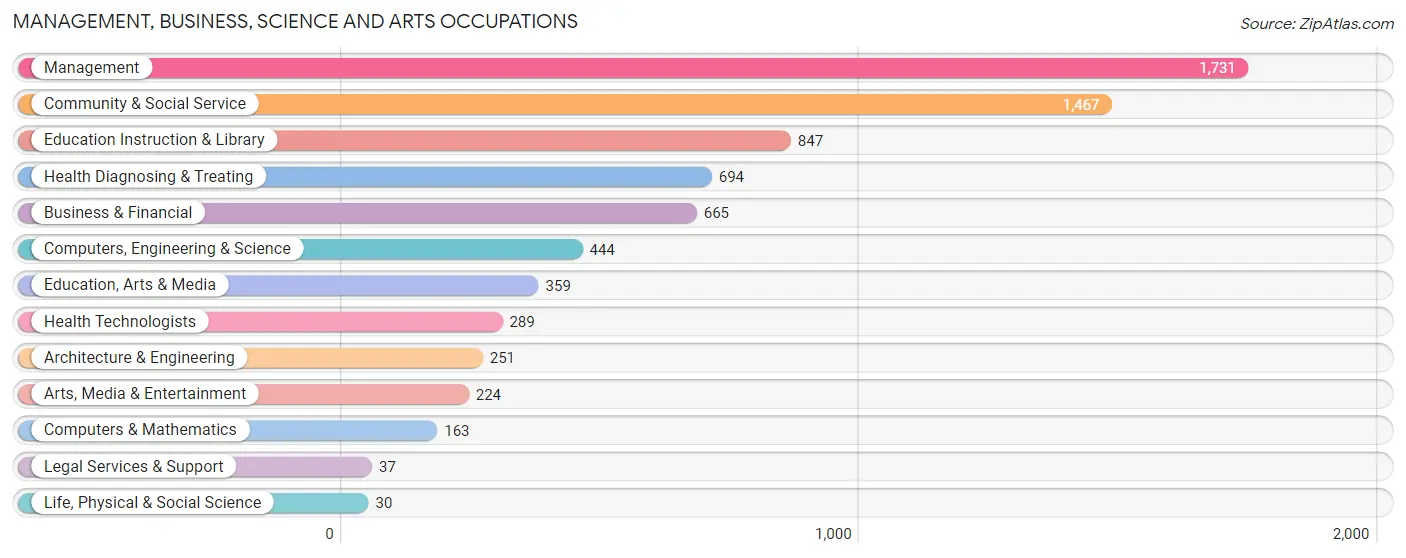
Management, Business, Science and Arts Occupations
The most common Management, Business, Science and Arts occupations in Mcdonough are Management (1,731 | 11.7%), Community & Social Service (1,467 | 9.9%), Education Instruction & Library (847 | 5.7%), Health Diagnosing & Treating (694 | 4.7%), and Business & Financial (665 | 4.5%).
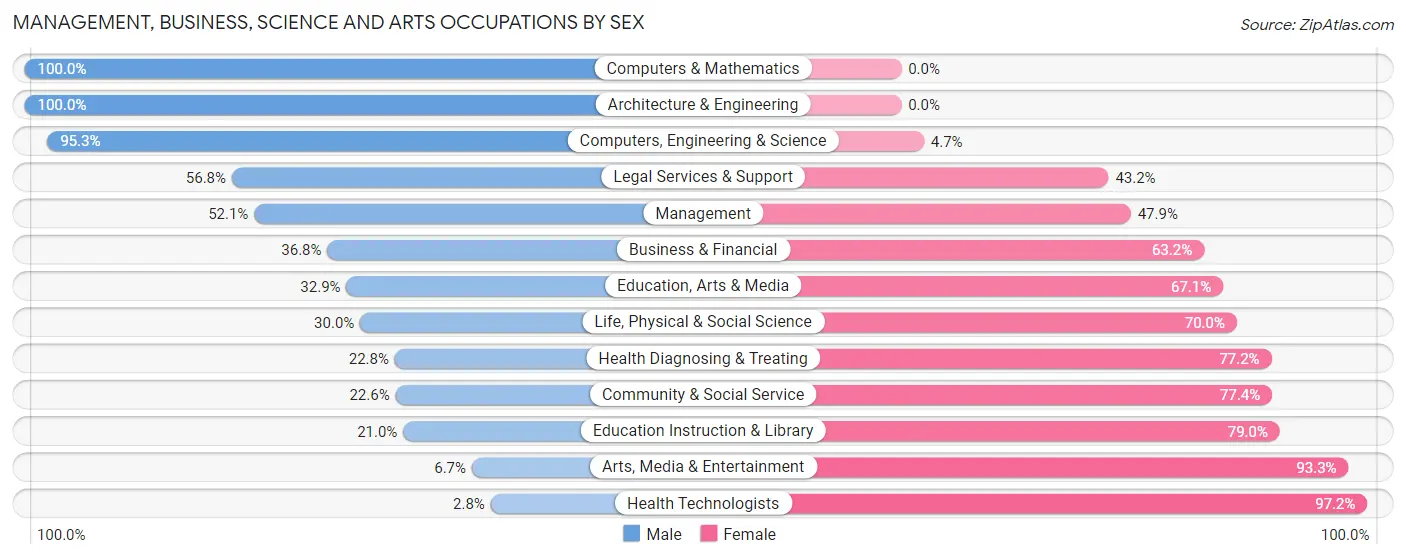
Management, Business, Science and Arts Occupations by Sex
Within the Management, Business, Science and Arts occupations in Mcdonough, the most male-oriented occupations are Computers & Mathematics (100.0%), Architecture & Engineering (100.0%), and Computers, Engineering & Science (95.3%), while the most female-oriented occupations are Health Technologists (97.2%), Arts, Media & Entertainment (93.3%), and Education Instruction & Library (79.0%).
| Occupation | Male | Female |
| Management | 902 (52.1%) | 829 (47.9%) |
| Business & Financial | 245 (36.8%) | 420 (63.2%) |
| Computers, Engineering & Science | 423 (95.3%) | 21 (4.7%) |
| Computers & Mathematics | 163 (100.0%) | 0 (0.0%) |
| Architecture & Engineering | 251 (100.0%) | 0 (0.0%) |
| Life, Physical & Social Science | 9 (30.0%) | 21 (70.0%) |
| Community & Social Service | 332 (22.6%) | 1,135 (77.4%) |
| Education, Arts & Media | 118 (32.9%) | 241 (67.1%) |
| Legal Services & Support | 21 (56.8%) | 16 (43.2%) |
| Education Instruction & Library | 178 (21.0%) | 669 (79.0%) |
| Arts, Media & Entertainment | 15 (6.7%) | 209 (93.3%) |
| Health Diagnosing & Treating | 158 (22.8%) | 536 (77.2%) |
| Health Technologists | 8 (2.8%) | 281 (97.2%) |
| Total (Category) | 2,060 (41.2%) | 2,941 (58.8%) |
| Total (Overall) | 7,429 (50.3%) | 7,340 (49.7%) |
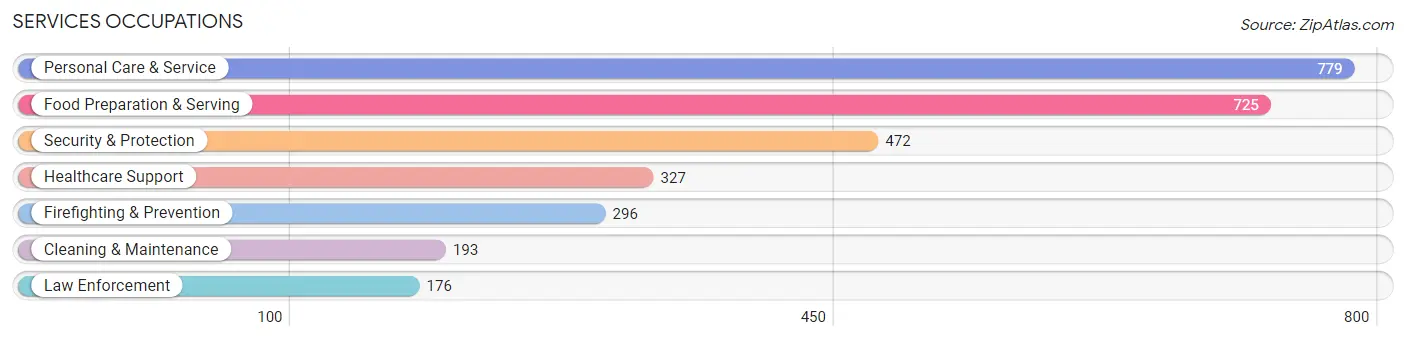
Services Occupations
The most common Services occupations in Mcdonough are Personal Care & Service (779 | 5.3%), Food Preparation & Serving (725 | 4.9%), Security & Protection (472 | 3.2%), Healthcare Support (327 | 2.2%), and Firefighting & Prevention (296 | 2.0%).
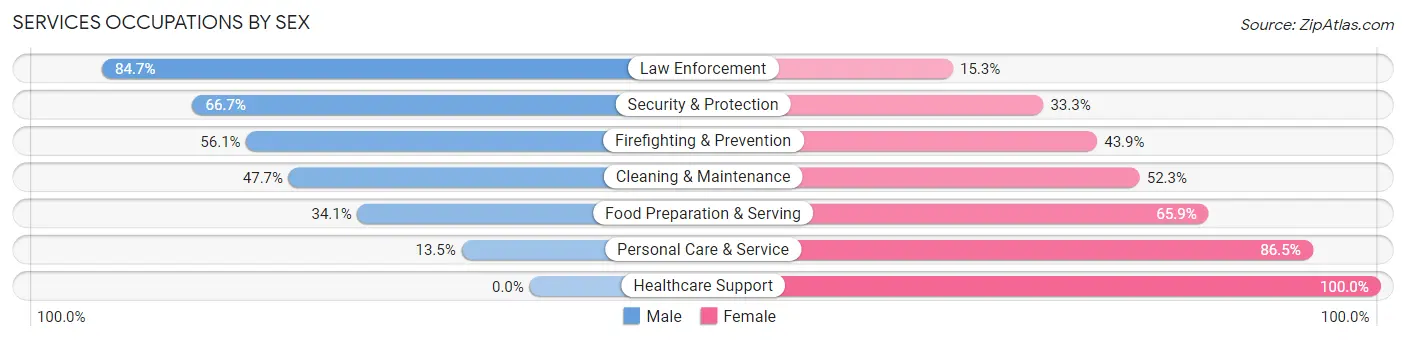
Services Occupations by Sex
Within the Services occupations in Mcdonough, the most male-oriented occupations are Law Enforcement (84.7%), Security & Protection (66.7%), and Firefighting & Prevention (56.1%), while the most female-oriented occupations are Healthcare Support (100.0%), Personal Care & Service (86.5%), and Food Preparation & Serving (65.9%).
| Occupation | Male | Female |
| Healthcare Support | 0 (0.0%) | 327 (100.0%) |
| Security & Protection | 315 (66.7%) | 157 (33.3%) |
| Firefighting & Prevention | 166 (56.1%) | 130 (43.9%) |
| Law Enforcement | 149 (84.7%) | 27 (15.3%) |
| Food Preparation & Serving | 247 (34.1%) | 478 (65.9%) |
| Cleaning & Maintenance | 92 (47.7%) | 101 (52.3%) |
| Personal Care & Service | 105 (13.5%) | 674 (86.5%) |
| Total (Category) | 759 (30.4%) | 1,737 (69.6%) |
| Total (Overall) | 7,429 (50.3%) | 7,340 (49.7%) |
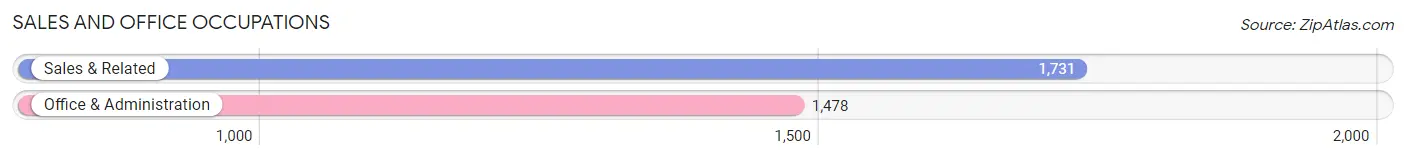
Sales and Office Occupations
The most common Sales and Office occupations in Mcdonough are Sales & Related (1,731 | 11.7%), and Office & Administration (1,478 | 10.0%).
Sales and Office Occupations by Sex
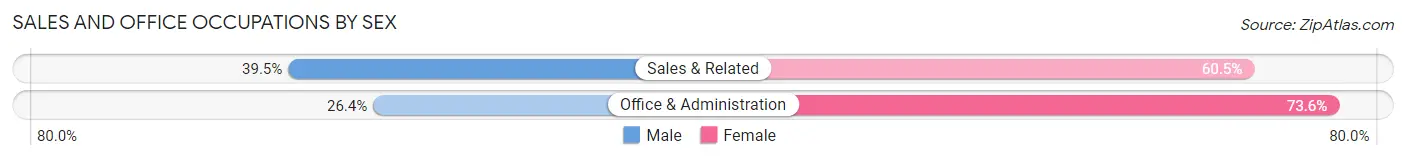
| Occupation | Male | Female |
| Sales & Related | 683 (39.5%) | 1,048 (60.5%) |
| Office & Administration | 390 (26.4%) | 1,088 (73.6%) |
| Total (Category) | 1,073 (33.4%) | 2,136 (66.6%) |
| Total (Overall) | 7,429 (50.3%) | 7,340 (49.7%) |
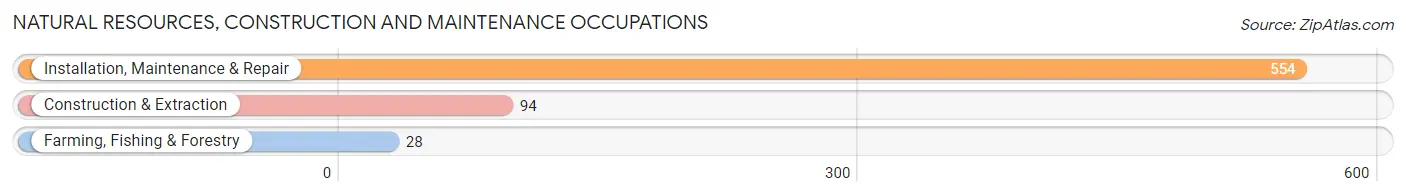
Natural Resources, Construction and Maintenance Occupations
The most common Natural Resources, Construction and Maintenance occupations in Mcdonough are Installation, Maintenance & Repair (554 | 3.7%), Construction & Extraction (94 | 0.6%), and Farming, Fishing & Forestry (28 | 0.2%).
Natural Resources, Construction and Maintenance Occupations by Sex
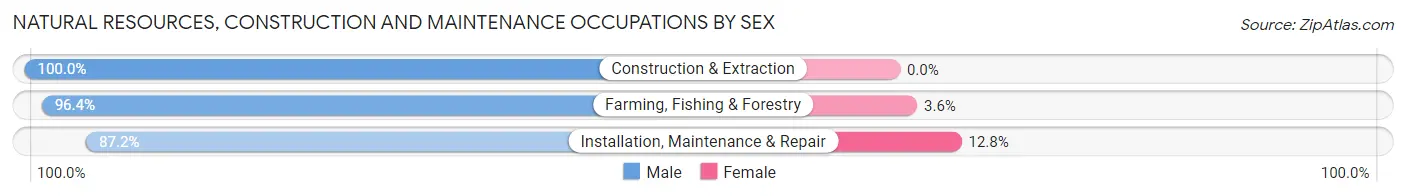
| Occupation | Male | Female |
| Farming, Fishing & Forestry | 27 (96.4%) | 1 (3.6%) |
| Construction & Extraction | 94 (100.0%) | 0 (0.0%) |
| Installation, Maintenance & Repair | 483 (87.2%) | 71 (12.8%) |
| Total (Category) | 604 (89.3%) | 72 (10.6%) |
| Total (Overall) | 7,429 (50.3%) | 7,340 (49.7%) |
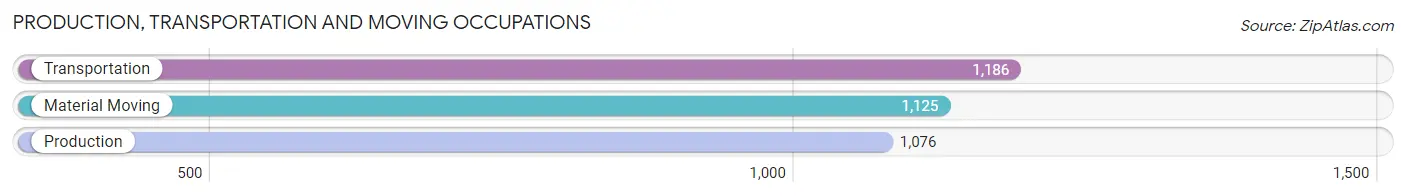
Production, Transportation and Moving Occupations
The most common Production, Transportation and Moving occupations in Mcdonough are Transportation (1,186 | 8.0%), Material Moving (1,125 | 7.6%), and Production (1,076 | 7.3%).
Production, Transportation and Moving Occupations by Sex
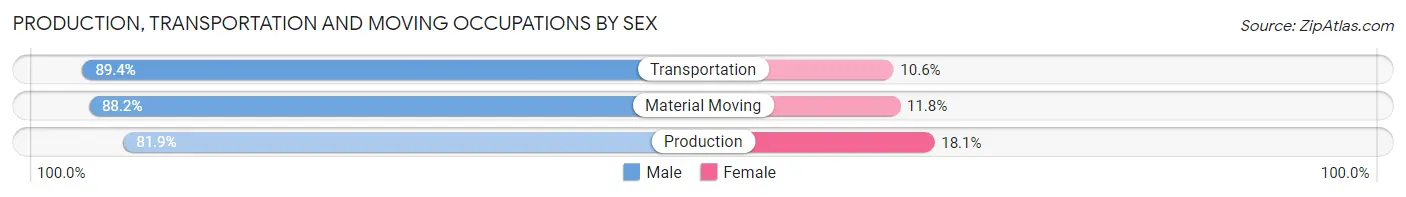
| Occupation | Male | Female |
| Production | 881 (81.9%) | 195 (18.1%) |
| Transportation | 1,060 (89.4%) | 126 (10.6%) |
| Material Moving | 992 (88.2%) | 133 (11.8%) |
| Total (Category) | 2,933 (86.6%) | 454 (13.4%) |
| Total (Overall) | 7,429 (50.3%) | 7,340 (49.7%) |
Employment Industries by Sex in Mcdonough
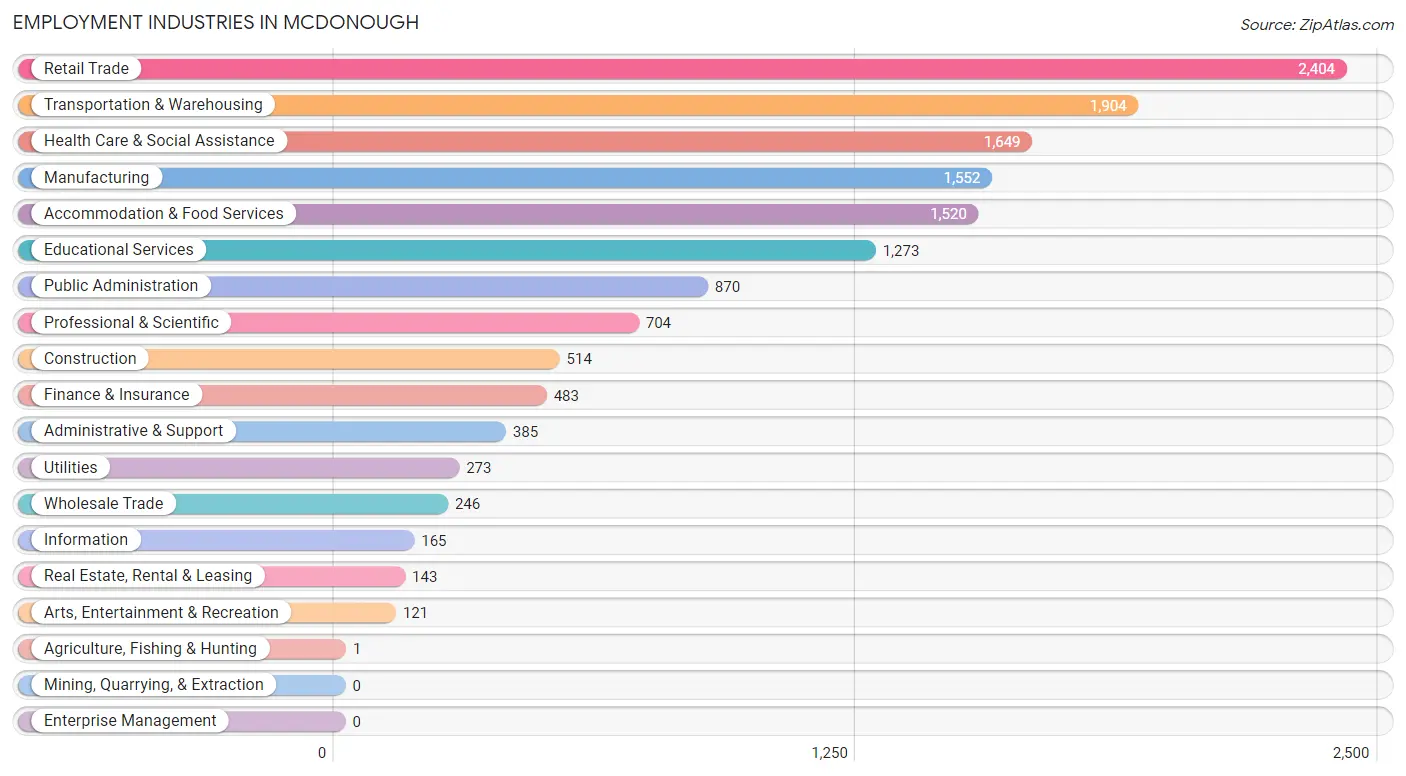
Employment Industries in Mcdonough
The major employment industries in Mcdonough include Retail Trade (2,404 | 16.3%), Transportation & Warehousing (1,904 | 12.9%), Health Care & Social Assistance (1,649 | 11.2%), Manufacturing (1,552 | 10.5%), and Accommodation & Food Services (1,520 | 10.3%).
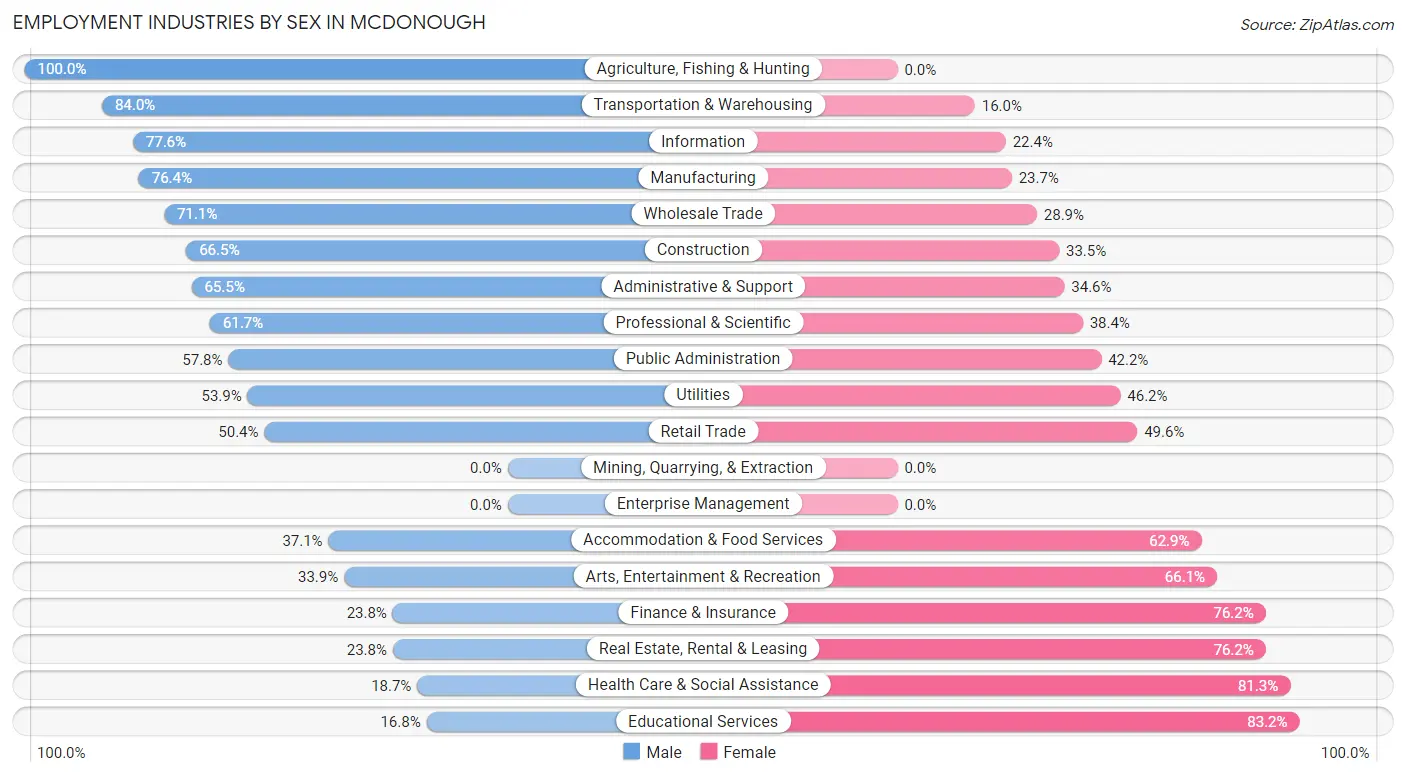
Employment Industries by Sex in Mcdonough
The Mcdonough industries that see more men than women are Agriculture, Fishing & Hunting (100.0%), Transportation & Warehousing (84.0%), and Information (77.6%), whereas the industries that tend to have a higher number of women are Educational Services (83.2%), Health Care & Social Assistance (81.3%), and Real Estate, Rental & Leasing (76.2%).
| Industry | Male | Female |
| Agriculture, Fishing & Hunting | 1 (100.0%) | 0 (0.0%) |
| Mining, Quarrying, & Extraction | 0 (0.0%) | 0 (0.0%) |
| Construction | 342 (66.5%) | 172 (33.5%) |
| Manufacturing | 1,185 (76.3%) | 367 (23.6%) |
| Wholesale Trade | 175 (71.1%) | 71 (28.9%) |
| Retail Trade | 1,211 (50.4%) | 1,193 (49.6%) |
| Transportation & Warehousing | 1,599 (84.0%) | 305 (16.0%) |
| Utilities | 147 (53.8%) | 126 (46.2%) |
| Information | 128 (77.6%) | 37 (22.4%) |
| Finance & Insurance | 115 (23.8%) | 368 (76.2%) |
| Real Estate, Rental & Leasing | 34 (23.8%) | 109 (76.2%) |
| Professional & Scientific | 434 (61.7%) | 270 (38.4%) |
| Enterprise Management | 0 (0.0%) | 0 (0.0%) |
| Administrative & Support | 252 (65.4%) | 133 (34.5%) |
| Educational Services | 214 (16.8%) | 1,059 (83.2%) |
| Health Care & Social Assistance | 309 (18.7%) | 1,340 (81.3%) |
| Arts, Entertainment & Recreation | 41 (33.9%) | 80 (66.1%) |
| Accommodation & Food Services | 564 (37.1%) | 956 (62.9%) |
| Public Administration | 503 (57.8%) | 367 (42.2%) |
| Total | 7,429 (50.3%) | 7,340 (49.7%) |
Education in Mcdonough
School Enrollment in Mcdonough
The most common levels of schooling among the 9,216 students in Mcdonough are middle school (2,386 | 25.9%), high school (2,291 | 24.9%), and college / undergraduate (2,003 | 21.7%).
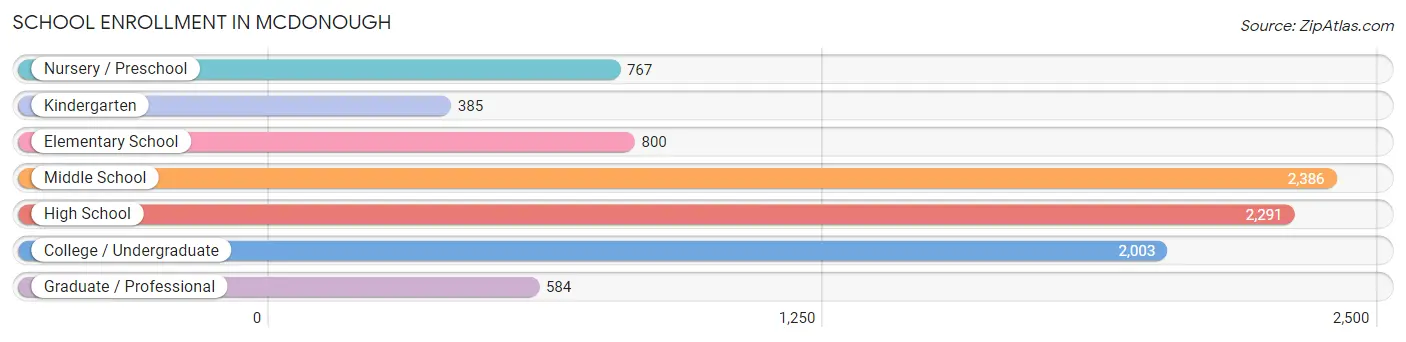
| School Level | # Students | % Students |
| Nursery / Preschool | 767 | 8.3% |
| Kindergarten | 385 | 4.2% |
| Elementary School | 800 | 8.7% |
| Middle School | 2,386 | 25.9% |
| High School | 2,291 | 24.9% |
| College / Undergraduate | 2,003 | 21.7% |
| Graduate / Professional | 584 | 6.3% |
| Total | 9,216 | 100.0% |
School Enrollment by Age by Funding Source in Mcdonough
Out of a total of 9,216 students who are enrolled in schools in Mcdonough, 1,170 (12.7%) attend a private institution, while the remaining 8,046 (87.3%) are enrolled in public schools. The age group of 3 to 4 year olds has the highest likelihood of being enrolled in private schools, with 267 (67.1% in the age bracket) enrolled. Conversely, the age group of 18 to 19 year olds has the lowest likelihood of being enrolled in a private school, with 474 (100.0% in the age bracket) attending a public institution.
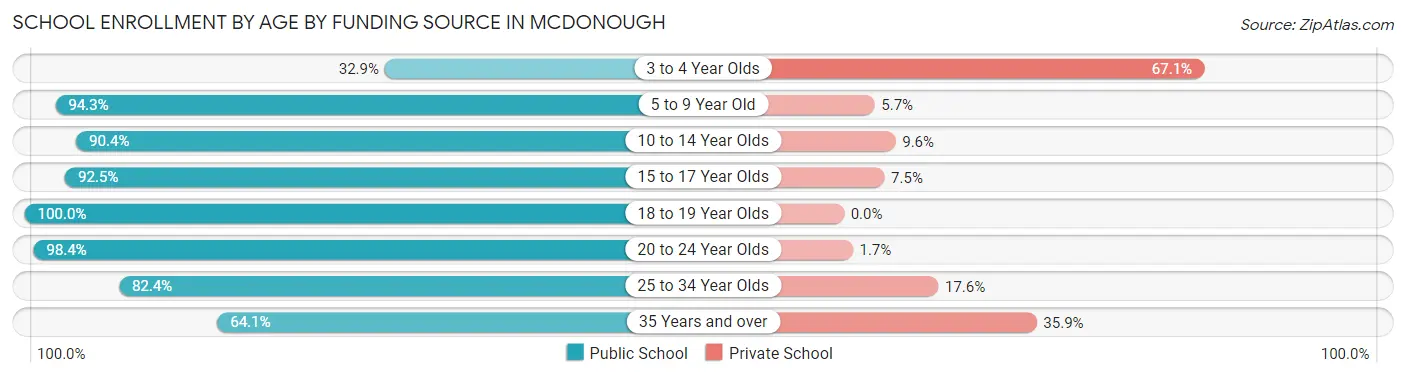
| Age Bracket | Public School | Private School |
| 3 to 4 Year Olds | 131 (32.9%) | 267 (67.1%) |
| 5 to 9 Year Old | 1,435 (94.3%) | 87 (5.7%) |
| 10 to 14 Year Olds | 2,322 (90.4%) | 247 (9.6%) |
| 15 to 17 Year Olds | 1,619 (92.5%) | 132 (7.5%) |
| 18 to 19 Year Olds | 474 (100.0%) | 0 (0.0%) |
| 20 to 24 Year Olds | 1,014 (98.4%) | 17 (1.7%) |
| 25 to 34 Year Olds | 464 (82.4%) | 99 (17.6%) |
| 35 Years and over | 582 (64.1%) | 326 (35.9%) |
| Total | 8,046 (87.3%) | 1,170 (12.7%) |
Educational Attainment by Field of Study in Mcdonough
Business (1,292 | 24.8%), arts & humanities (535 | 10.3%), science & technology (509 | 9.8%), psychology (508 | 9.8%), and social sciences (433 | 8.3%) are the most common fields of study among 5,208 individuals in Mcdonough who have obtained a bachelor's degree or higher.
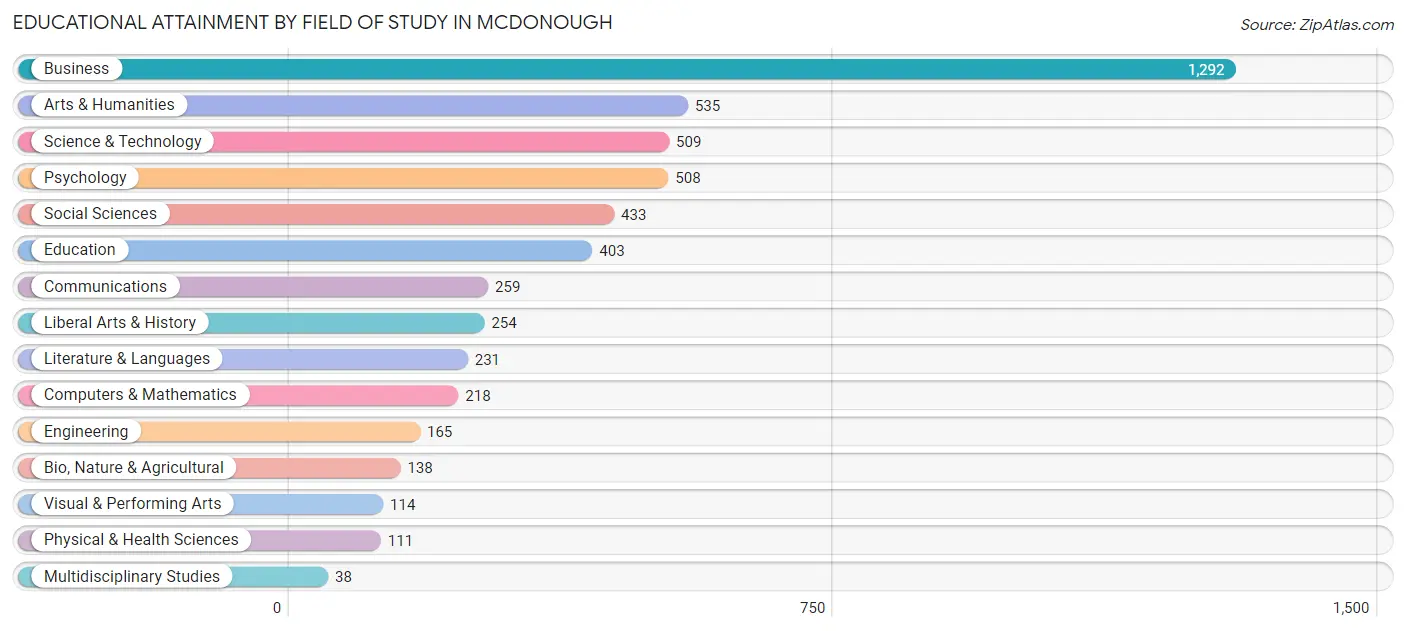
| Field of Study | # Graduates | % Graduates |
| Computers & Mathematics | 218 | 4.2% |
| Bio, Nature & Agricultural | 138 | 2.6% |
| Physical & Health Sciences | 111 | 2.1% |
| Psychology | 508 | 9.8% |
| Social Sciences | 433 | 8.3% |
| Engineering | 165 | 3.2% |
| Multidisciplinary Studies | 38 | 0.7% |
| Science & Technology | 509 | 9.8% |
| Business | 1,292 | 24.8% |
| Education | 403 | 7.7% |
| Literature & Languages | 231 | 4.4% |
| Liberal Arts & History | 254 | 4.9% |
| Visual & Performing Arts | 114 | 2.2% |
| Communications | 259 | 5.0% |
| Arts & Humanities | 535 | 10.3% |
| Total | 5,208 | 100.0% |
Transportation & Commute in Mcdonough
Vehicle Availability by Sex in Mcdonough
The most prevalent vehicle ownership categories in Mcdonough are males with 2 vehicles (2,820, accounting for 38.5%) and females with 2 vehicles (2,904, making up 41.6%).
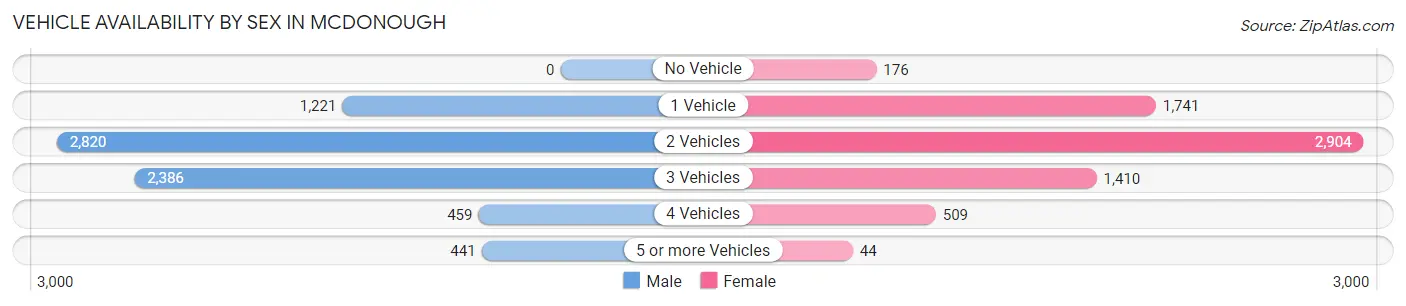
| Vehicles Available | Male | Female |
| No Vehicle | 0 (0.0%) | 176 (2.6%) |
| 1 Vehicle | 1,221 (16.7%) | 1,741 (25.7%) |
| 2 Vehicles | 2,820 (38.5%) | 2,904 (42.8%) |
| 3 Vehicles | 2,386 (32.6%) | 1,410 (20.8%) |
| 4 Vehicles | 459 (6.3%) | 509 (7.5%) |
| 5 or more Vehicles | 441 (6.0%) | 44 (0.6%) |
| Total | 7,327 (100.0%) | 6,784 (100.0%) |
Commute Time in Mcdonough
The most frequently occuring commute durations in Mcdonough are 30 to 34 minutes (1,869 commuters, 15.0%), 15 to 19 minutes (1,863 commuters, 15.0%), and 45 to 59 minutes (1,692 commuters, 13.6%).
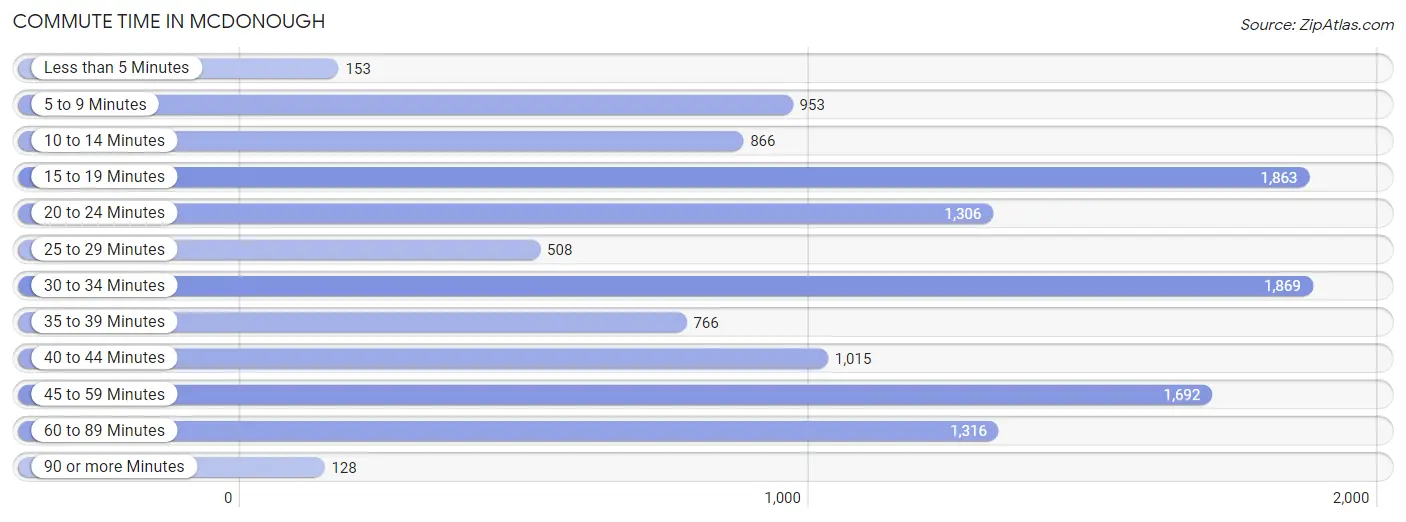
| Commute Time | # Commuters | % Commuters |
| Less than 5 Minutes | 153 | 1.2% |
| 5 to 9 Minutes | 953 | 7.7% |
| 10 to 14 Minutes | 866 | 7.0% |
| 15 to 19 Minutes | 1,863 | 15.0% |
| 20 to 24 Minutes | 1,306 | 10.5% |
| 25 to 29 Minutes | 508 | 4.1% |
| 30 to 34 Minutes | 1,869 | 15.0% |
| 35 to 39 Minutes | 766 | 6.2% |
| 40 to 44 Minutes | 1,015 | 8.2% |
| 45 to 59 Minutes | 1,692 | 13.6% |
| 60 to 89 Minutes | 1,316 | 10.6% |
| 90 or more Minutes | 128 | 1.0% |
Commute Time by Sex in Mcdonough
The most common commute times in Mcdonough are 30 to 34 minutes (1,333 commuters, 20.5%) for males and 15 to 19 minutes (1,222 commuters, 20.6%) for females.
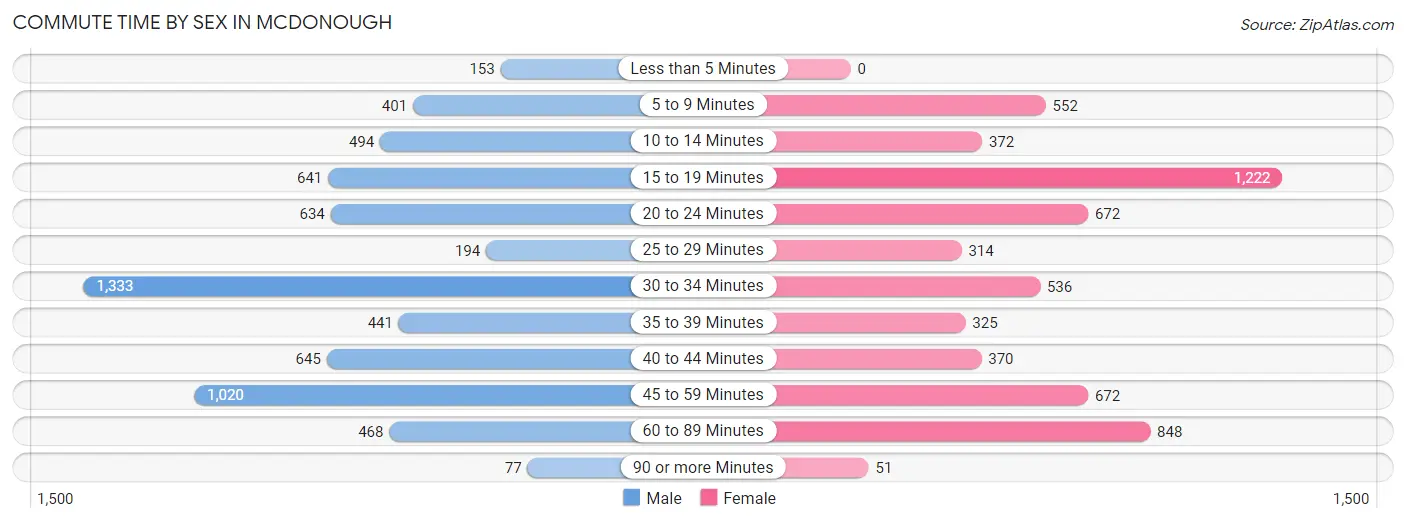
| Commute Time | Male | Female |
| Less than 5 Minutes | 153 (2.4%) | 0 (0.0%) |
| 5 to 9 Minutes | 401 (6.2%) | 552 (9.3%) |
| 10 to 14 Minutes | 494 (7.6%) | 372 (6.3%) |
| 15 to 19 Minutes | 641 (9.9%) | 1,222 (20.6%) |
| 20 to 24 Minutes | 634 (9.8%) | 672 (11.3%) |
| 25 to 29 Minutes | 194 (3.0%) | 314 (5.3%) |
| 30 to 34 Minutes | 1,333 (20.5%) | 536 (9.0%) |
| 35 to 39 Minutes | 441 (6.8%) | 325 (5.5%) |
| 40 to 44 Minutes | 645 (9.9%) | 370 (6.2%) |
| 45 to 59 Minutes | 1,020 (15.7%) | 672 (11.3%) |
| 60 to 89 Minutes | 468 (7.2%) | 848 (14.3%) |
| 90 or more Minutes | 77 (1.2%) | 51 (0.9%) |
Time of Departure to Work by Sex in Mcdonough
The most frequent times of departure to work in Mcdonough are 12:00 PM to 3:59 PM (1,078, 16.6%) for males and 6:30 AM to 6:59 AM (973, 16.4%) for females.
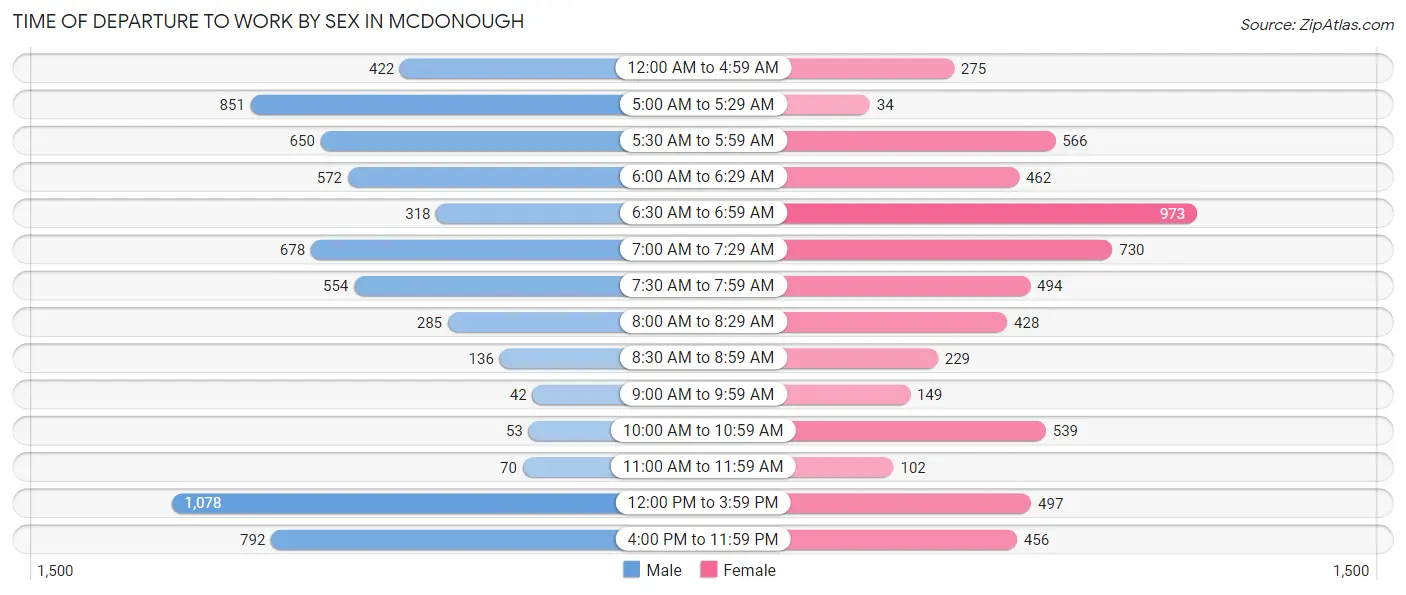
| Time of Departure | Male | Female |
| 12:00 AM to 4:59 AM | 422 (6.5%) | 275 (4.6%) |
| 5:00 AM to 5:29 AM | 851 (13.1%) | 34 (0.6%) |
| 5:30 AM to 5:59 AM | 650 (10.0%) | 566 (9.5%) |
| 6:00 AM to 6:29 AM | 572 (8.8%) | 462 (7.8%) |
| 6:30 AM to 6:59 AM | 318 (4.9%) | 973 (16.4%) |
| 7:00 AM to 7:29 AM | 678 (10.4%) | 730 (12.3%) |
| 7:30 AM to 7:59 AM | 554 (8.5%) | 494 (8.3%) |
| 8:00 AM to 8:29 AM | 285 (4.4%) | 428 (7.2%) |
| 8:30 AM to 8:59 AM | 136 (2.1%) | 229 (3.9%) |
| 9:00 AM to 9:59 AM | 42 (0.6%) | 149 (2.5%) |
| 10:00 AM to 10:59 AM | 53 (0.8%) | 539 (9.1%) |
| 11:00 AM to 11:59 AM | 70 (1.1%) | 102 (1.7%) |
| 12:00 PM to 3:59 PM | 1,078 (16.6%) | 497 (8.4%) |
| 4:00 PM to 11:59 PM | 792 (12.2%) | 456 (7.7%) |
| Total | 6,501 (100.0%) | 5,934 (100.0%) |
Housing Occupancy in Mcdonough
Occupancy by Ownership in Mcdonough
Of the total 9,695 dwellings in Mcdonough, owner-occupied units account for 4,836 (49.9%), while renter-occupied units make up 4,859 (50.1%).
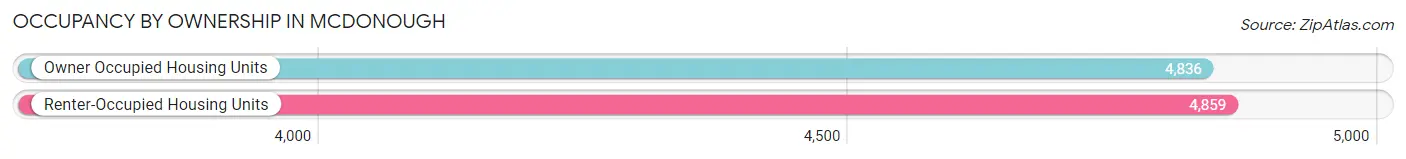
| Occupancy | # Housing Units | % Housing Units |
| Owner Occupied Housing Units | 4,836 | 49.9% |
| Renter-Occupied Housing Units | 4,859 | 50.1% |
| Total Occupied Housing Units | 9,695 | 100.0% |
Occupancy by Household Size in Mcdonough
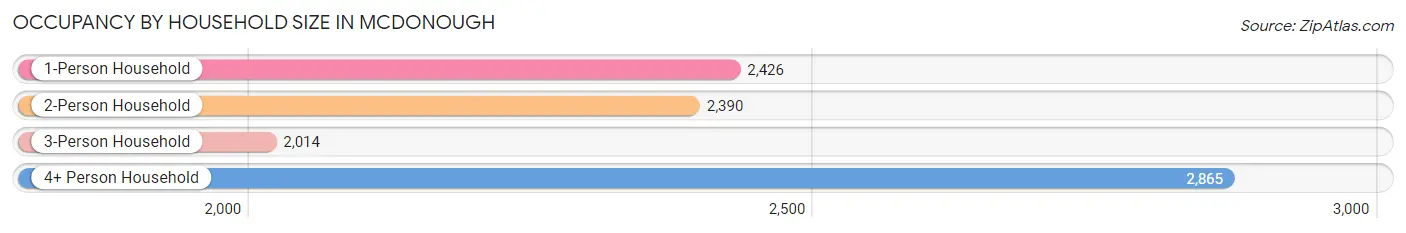
| Household Size | # Housing Units | % Housing Units |
| 1-Person Household | 2,426 | 25.0% |
| 2-Person Household | 2,390 | 24.6% |
| 3-Person Household | 2,014 | 20.8% |
| 4+ Person Household | 2,865 | 29.5% |
| Total Housing Units | 9,695 | 100.0% |
Occupancy by Ownership by Household Size in Mcdonough
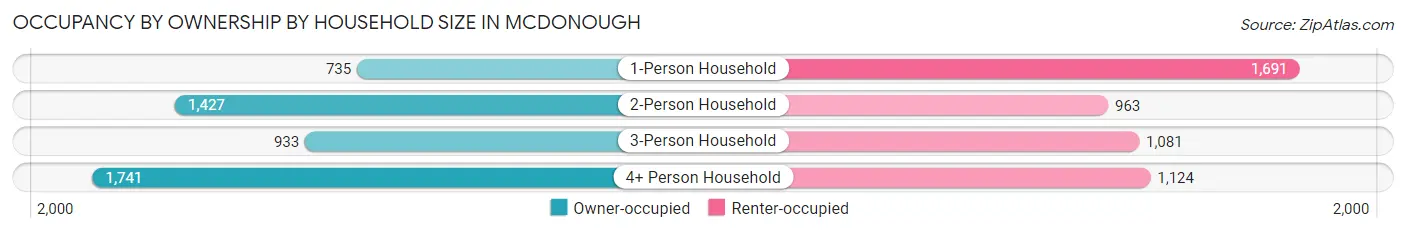
| Household Size | Owner-occupied | Renter-occupied |
| 1-Person Household | 735 (30.3%) | 1,691 (69.7%) |
| 2-Person Household | 1,427 (59.7%) | 963 (40.3%) |
| 3-Person Household | 933 (46.3%) | 1,081 (53.7%) |
| 4+ Person Household | 1,741 (60.8%) | 1,124 (39.2%) |
| Total Housing Units | 4,836 (49.9%) | 4,859 (50.1%) |
Occupancy by Educational Attainment in Mcdonough
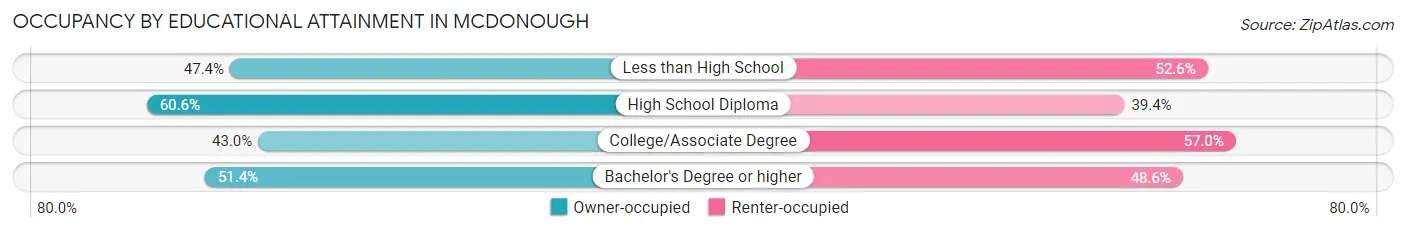
| Household Size | Owner-occupied | Renter-occupied |
| Less than High School | 297 (47.4%) | 329 (52.6%) |
| High School Diploma | 1,344 (60.6%) | 873 (39.4%) |
| College/Associate Degree | 1,663 (43.0%) | 2,208 (57.0%) |
| Bachelor's Degree or higher | 1,532 (51.4%) | 1,449 (48.6%) |
Occupancy by Age of Householder in Mcdonough
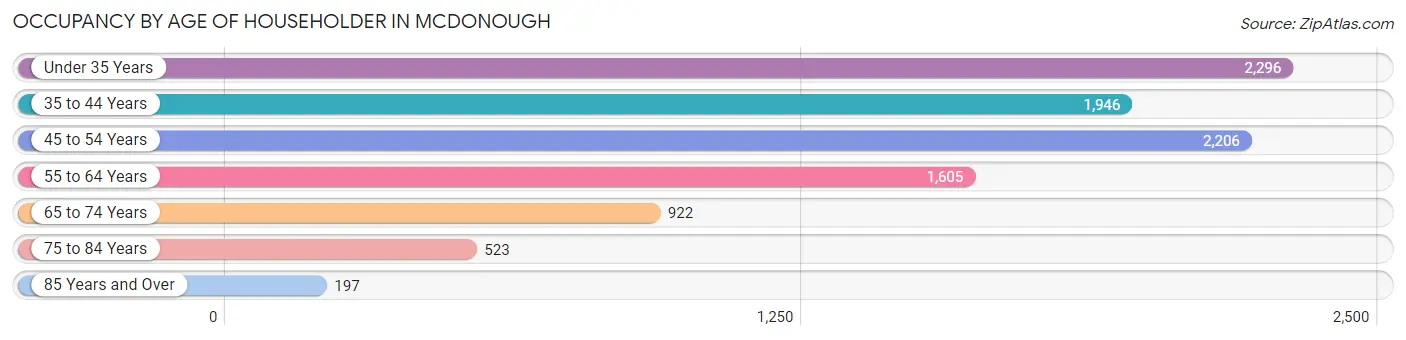
| Age Bracket | # Households | % Households |
| Under 35 Years | 2,296 | 23.7% |
| 35 to 44 Years | 1,946 | 20.1% |
| 45 to 54 Years | 2,206 | 22.8% |
| 55 to 64 Years | 1,605 | 16.6% |
| 65 to 74 Years | 922 | 9.5% |
| 75 to 84 Years | 523 | 5.4% |
| 85 Years and Over | 197 | 2.0% |
| Total | 9,695 | 100.0% |
Housing Finances in Mcdonough
Median Income by Occupancy in Mcdonough
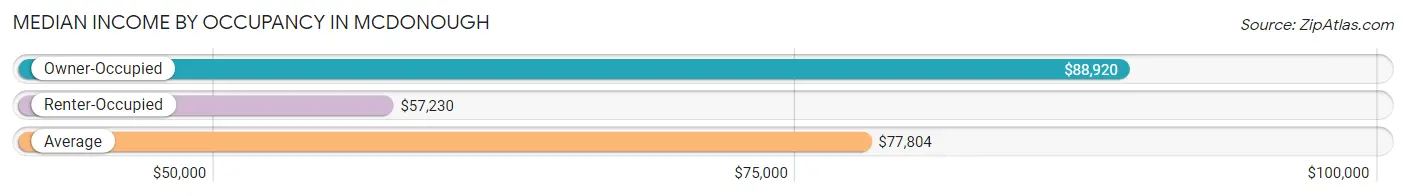
| Occupancy Type | # Households | Median Income |
| Owner-Occupied | 4,836 (49.9%) | $88,920 |
| Renter-Occupied | 4,859 (50.1%) | $57,230 |
| Average | 9,695 (100.0%) | $77,804 |
Occupancy by Householder Income Bracket in Mcdonough
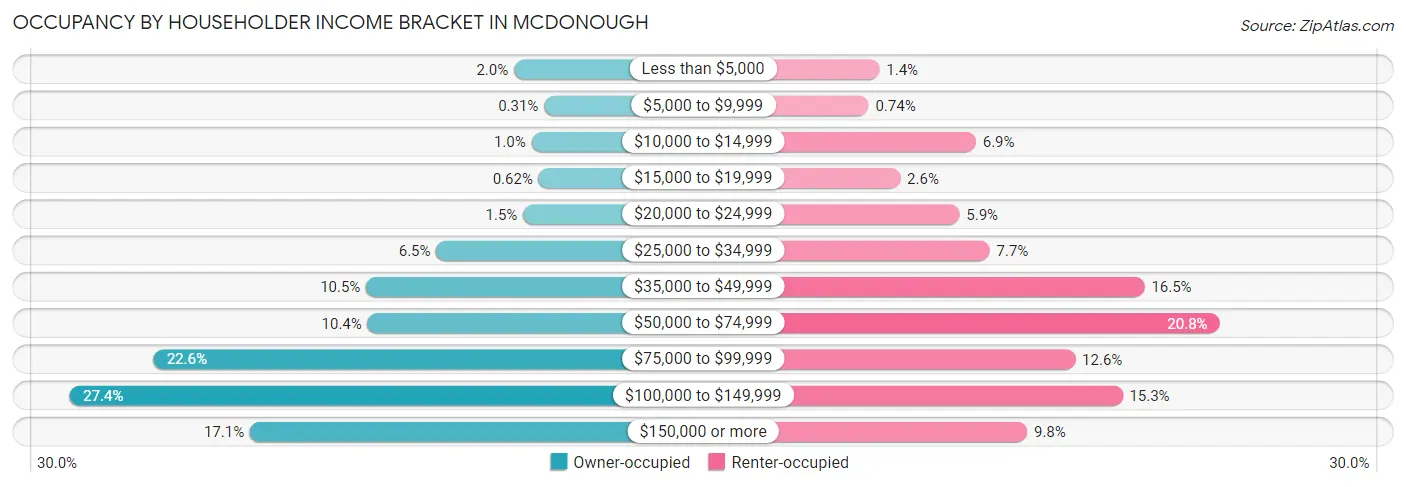
| Income Bracket | Owner-occupied | Renter-occupied |
| Less than $5,000 | 98 (2.0%) | 66 (1.4%) |
| $5,000 to $9,999 | 15 (0.3%) | 36 (0.7%) |
| $10,000 to $14,999 | 50 (1.0%) | 334 (6.9%) |
| $15,000 to $19,999 | 30 (0.6%) | 124 (2.5%) |
| $20,000 to $24,999 | 73 (1.5%) | 288 (5.9%) |
| $25,000 to $34,999 | 313 (6.5%) | 372 (7.7%) |
| $35,000 to $49,999 | 507 (10.5%) | 802 (16.5%) |
| $50,000 to $74,999 | 503 (10.4%) | 1,010 (20.8%) |
| $75,000 to $99,999 | 1,094 (22.6%) | 610 (12.6%) |
| $100,000 to $149,999 | 1,325 (27.4%) | 741 (15.2%) |
| $150,000 or more | 828 (17.1%) | 476 (9.8%) |
| Total | 4,836 (100.0%) | 4,859 (100.0%) |
Monthly Housing Cost Tiers in Mcdonough
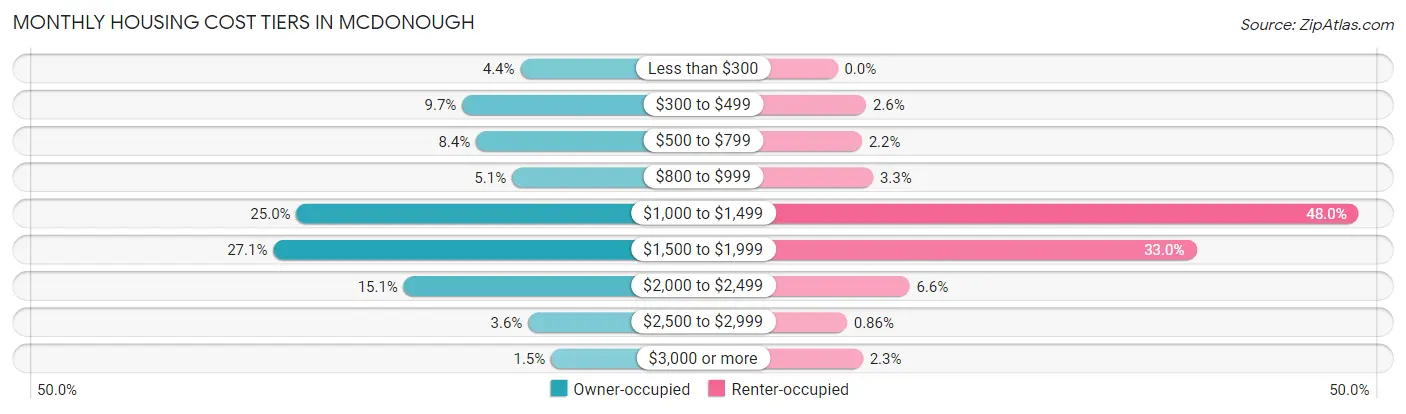
| Monthly Cost | Owner-occupied | Renter-occupied |
| Less than $300 | 211 (4.4%) | 0 (0.0%) |
| $300 to $499 | 470 (9.7%) | 128 (2.6%) |
| $500 to $799 | 408 (8.4%) | 109 (2.2%) |
| $800 to $999 | 248 (5.1%) | 159 (3.3%) |
| $1,000 to $1,499 | 1,208 (25.0%) | 2,331 (48.0%) |
| $1,500 to $1,999 | 1,311 (27.1%) | 1,605 (33.0%) |
| $2,000 to $2,499 | 730 (15.1%) | 322 (6.6%) |
| $2,500 to $2,999 | 176 (3.6%) | 42 (0.9%) |
| $3,000 or more | 74 (1.5%) | 113 (2.3%) |
| Total | 4,836 (100.0%) | 4,859 (100.0%) |
Physical Housing Characteristics in Mcdonough
Housing Structures in Mcdonough
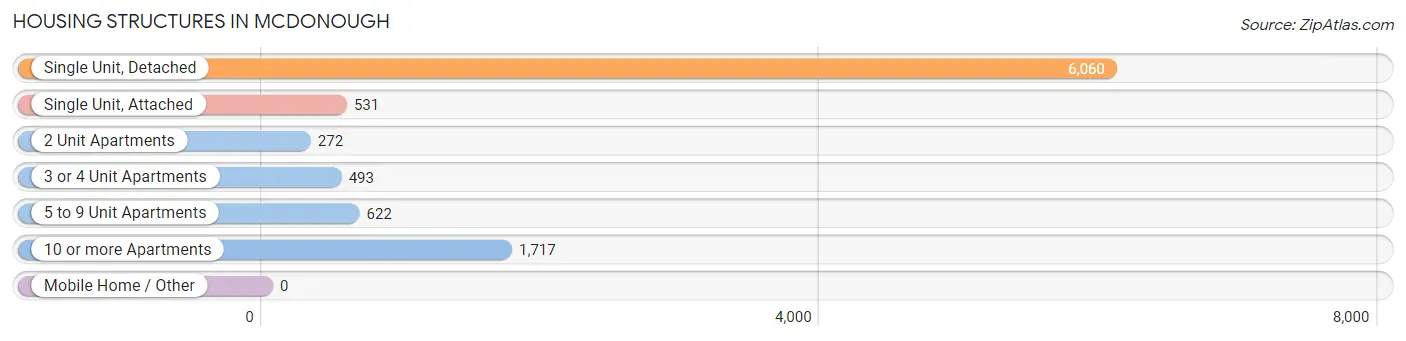
| Structure Type | # Housing Units | % Housing Units |
| Single Unit, Detached | 6,060 | 62.5% |
| Single Unit, Attached | 531 | 5.5% |
| 2 Unit Apartments | 272 | 2.8% |
| 3 or 4 Unit Apartments | 493 | 5.1% |
| 5 to 9 Unit Apartments | 622 | 6.4% |
| 10 or more Apartments | 1,717 | 17.7% |
| Mobile Home / Other | 0 | 0.0% |
| Total | 9,695 | 100.0% |
Housing Structures by Occupancy in Mcdonough
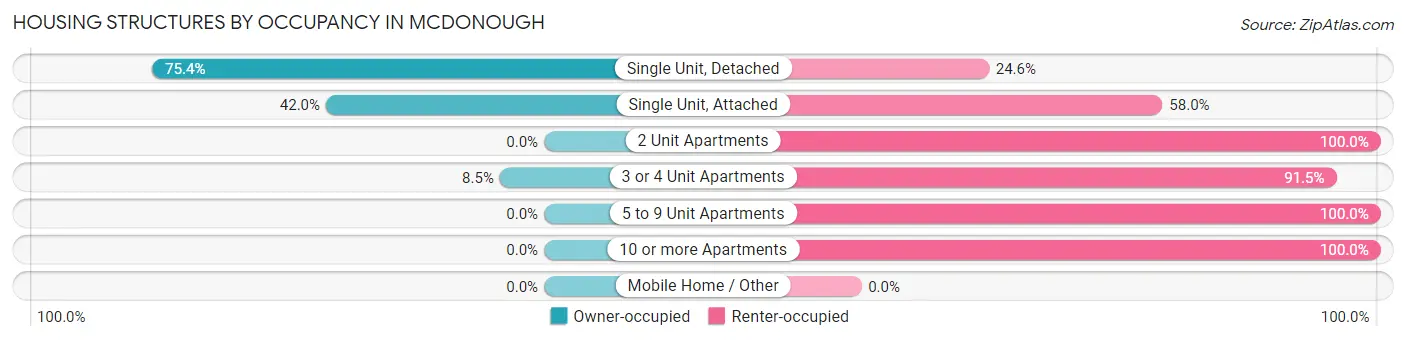
| Structure Type | Owner-occupied | Renter-occupied |
| Single Unit, Detached | 4,571 (75.4%) | 1,489 (24.6%) |
| Single Unit, Attached | 223 (42.0%) | 308 (58.0%) |
| 2 Unit Apartments | 0 (0.0%) | 272 (100.0%) |
| 3 or 4 Unit Apartments | 42 (8.5%) | 451 (91.5%) |
| 5 to 9 Unit Apartments | 0 (0.0%) | 622 (100.0%) |
| 10 or more Apartments | 0 (0.0%) | 1,717 (100.0%) |
| Mobile Home / Other | 0 (0.0%) | 0 (0.0%) |
| Total | 4,836 (49.9%) | 4,859 (50.1%) |
Housing Structures by Number of Rooms in Mcdonough
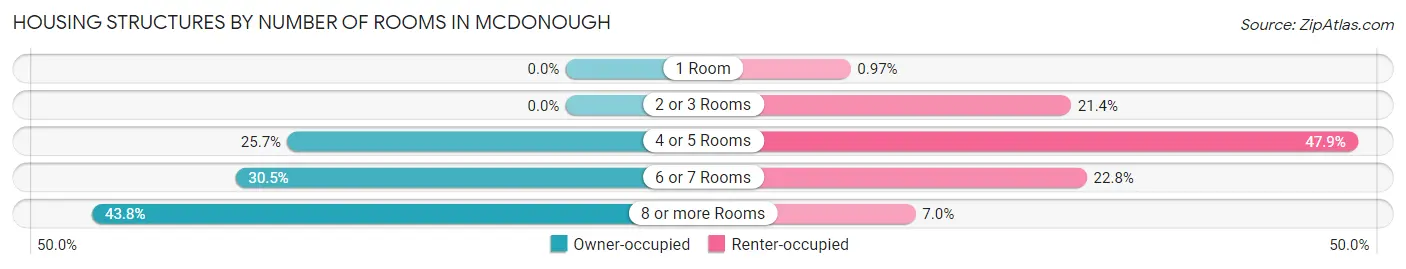
| Number of Rooms | Owner-occupied | Renter-occupied |
| 1 Room | 0 (0.0%) | 47 (1.0%) |
| 2 or 3 Rooms | 0 (0.0%) | 1,038 (21.4%) |
| 4 or 5 Rooms | 1,245 (25.7%) | 2,326 (47.9%) |
| 6 or 7 Rooms | 1,475 (30.5%) | 1,109 (22.8%) |
| 8 or more Rooms | 2,116 (43.8%) | 339 (7.0%) |
| Total | 4,836 (100.0%) | 4,859 (100.0%) |
Housing Structure by Heating Type in Mcdonough
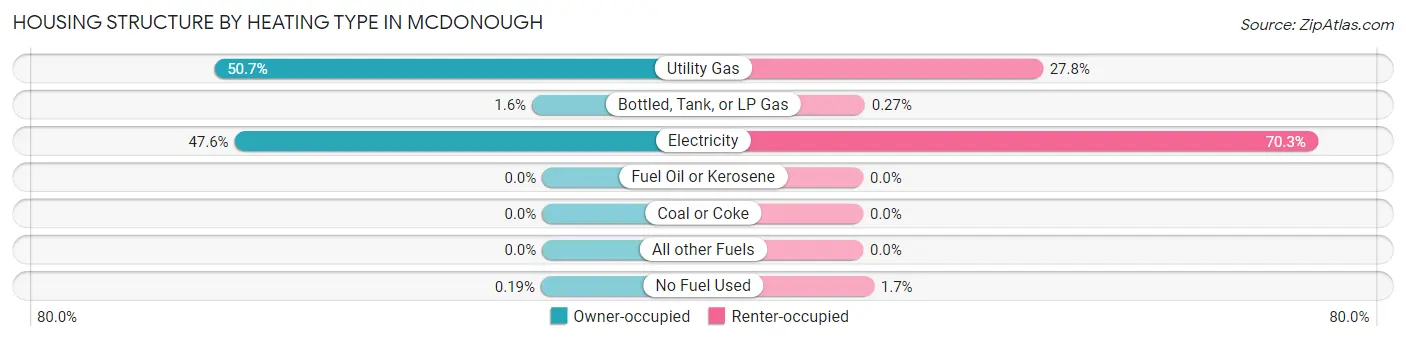
| Heating Type | Owner-occupied | Renter-occupied |
| Utility Gas | 2,451 (50.7%) | 1,350 (27.8%) |
| Bottled, Tank, or LP Gas | 76 (1.6%) | 13 (0.3%) |
| Electricity | 2,300 (47.6%) | 3,415 (70.3%) |
| Fuel Oil or Kerosene | 0 (0.0%) | 0 (0.0%) |
| Coal or Coke | 0 (0.0%) | 0 (0.0%) |
| All other Fuels | 0 (0.0%) | 0 (0.0%) |
| No Fuel Used | 9 (0.2%) | 81 (1.7%) |
| Total | 4,836 (100.0%) | 4,859 (100.0%) |
Household Vehicle Usage in Mcdonough
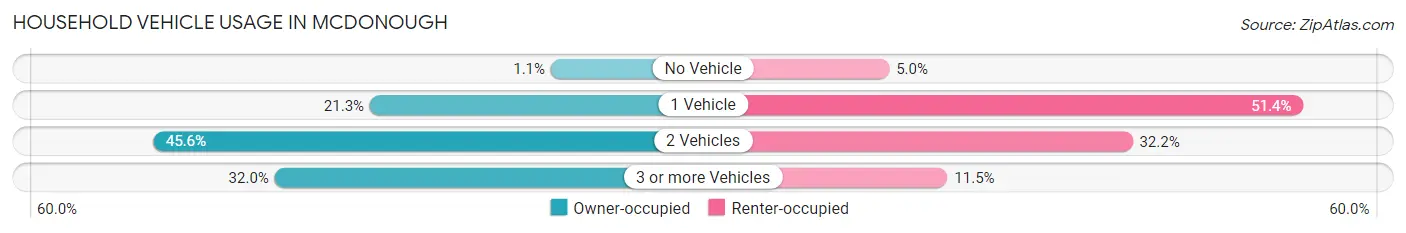
| Vehicles per Household | Owner-occupied | Renter-occupied |
| No Vehicle | 51 (1.1%) | 241 (5.0%) |
| 1 Vehicle | 1,031 (21.3%) | 2,495 (51.3%) |
| 2 Vehicles | 2,207 (45.6%) | 1,565 (32.2%) |
| 3 or more Vehicles | 1,547 (32.0%) | 558 (11.5%) |
| Total | 4,836 (100.0%) | 4,859 (100.0%) |
Real Estate & Mortgages in Mcdonough
Real Estate and Mortgage Overview in Mcdonough
| Characteristic | Without Mortgage | With Mortgage |
| Housing Units | 1,147 | 3,689 |
| Median Property Value | $182,600 | $256,800 |
| Median Household Income | $75,676 | $721 |
| Monthly Housing Costs | $454 | $74 |
| Real Estate Taxes | $1,575 | $8 |
Property Value by Mortgage Status in Mcdonough
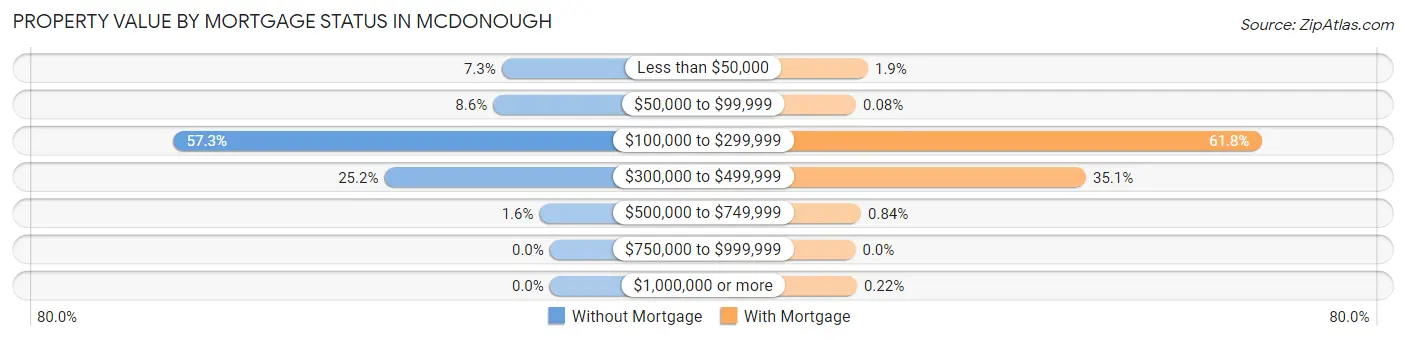
| Property Value | Without Mortgage | With Mortgage |
| Less than $50,000 | 84 (7.3%) | 70 (1.9%) |
| $50,000 to $99,999 | 99 (8.6%) | 3 (0.1%) |
| $100,000 to $299,999 | 657 (57.3%) | 2,281 (61.8%) |
| $300,000 to $499,999 | 289 (25.2%) | 1,296 (35.1%) |
| $500,000 to $749,999 | 18 (1.6%) | 31 (0.8%) |
| $750,000 to $999,999 | 0 (0.0%) | 0 (0.0%) |
| $1,000,000 or more | 0 (0.0%) | 8 (0.2%) |
| Total | 1,147 (100.0%) | 3,689 (100.0%) |
Household Income by Mortgage Status in Mcdonough
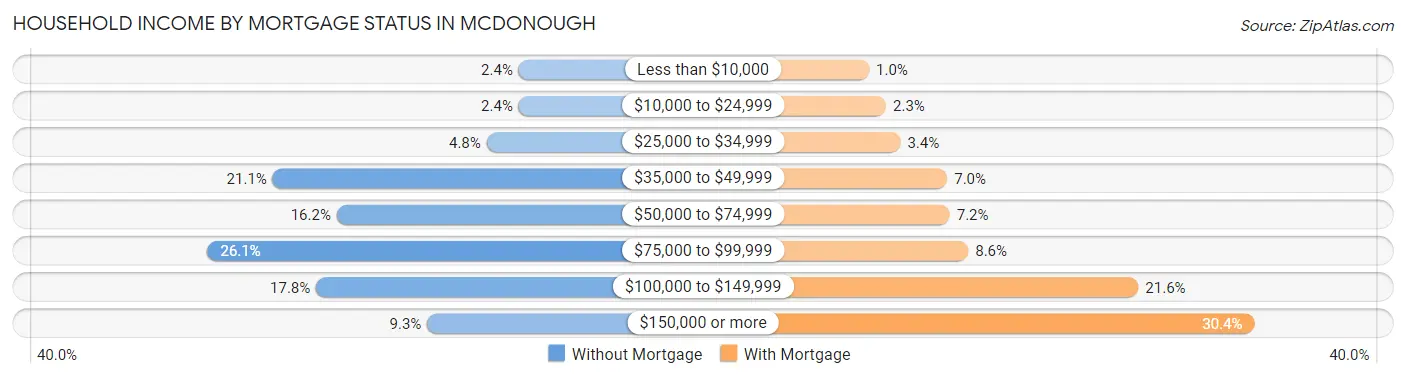
| Household Income | Without Mortgage | With Mortgage |
| Less than $10,000 | 27 (2.4%) | 38 (1.0%) |
| $10,000 to $24,999 | 27 (2.4%) | 86 (2.3%) |
| $25,000 to $34,999 | 55 (4.8%) | 126 (3.4%) |
| $35,000 to $49,999 | 242 (21.1%) | 258 (7.0%) |
| $50,000 to $74,999 | 186 (16.2%) | 265 (7.2%) |
| $75,000 to $99,999 | 299 (26.1%) | 317 (8.6%) |
| $100,000 to $149,999 | 204 (17.8%) | 795 (21.5%) |
| $150,000 or more | 107 (9.3%) | 1,121 (30.4%) |
| Total | 1,147 (100.0%) | 3,689 (100.0%) |
Property Value to Household Income Ratio in Mcdonough
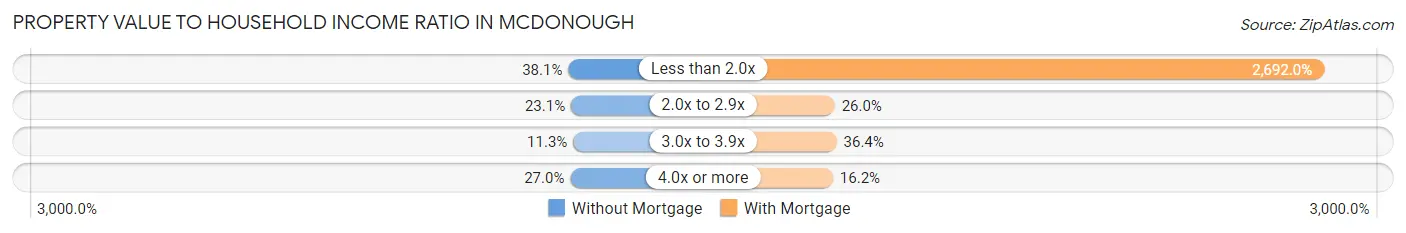
| Value-to-Income Ratio | Without Mortgage | With Mortgage |
| Less than 2.0x | 437 (38.1%) | 99,306 (2,691.9%) |
| 2.0x to 2.9x | 265 (23.1%) | 958 (26.0%) |
| 3.0x to 3.9x | 129 (11.3%) | 1,342 (36.4%) |
| 4.0x or more | 310 (27.0%) | 598 (16.2%) |
| Total | 1,147 (100.0%) | 3,689 (100.0%) |
Real Estate Taxes by Mortgage Status in Mcdonough
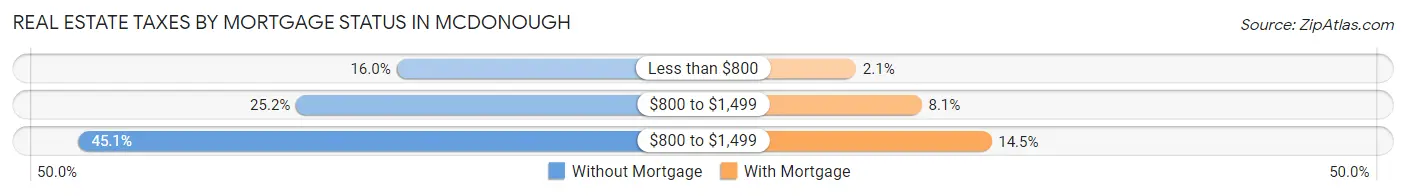
| Property Taxes | Without Mortgage | With Mortgage |
| Less than $800 | 184 (16.0%) | 77 (2.1%) |
| $800 to $1,499 | 289 (25.2%) | 298 (8.1%) |
| $800 to $1,499 | 517 (45.1%) | 533 (14.4%) |
| Total | 1,147 (100.0%) | 3,689 (100.0%) |
Health & Disability in Mcdonough
Health Insurance Coverage by Age in Mcdonough
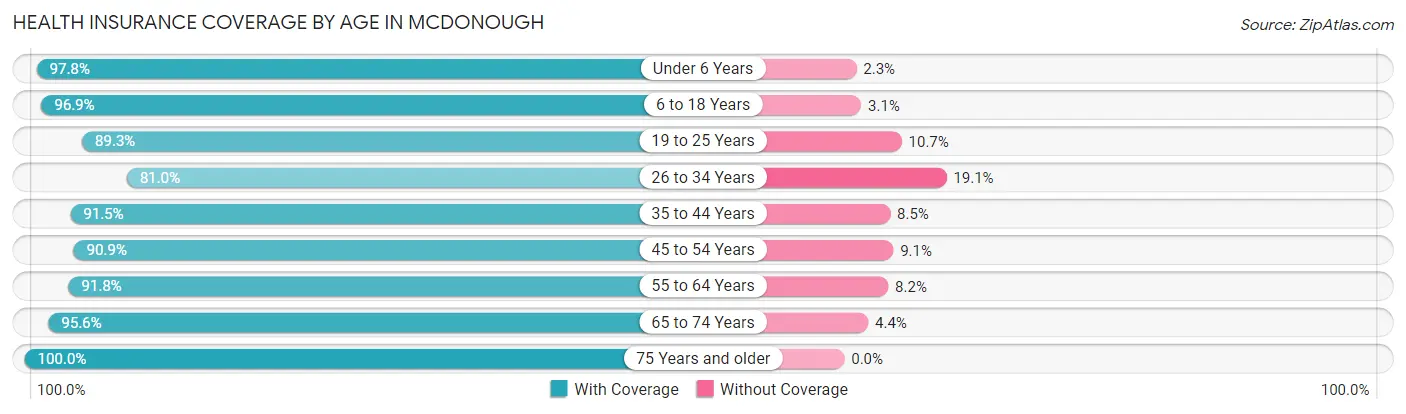
| Age Bracket | With Coverage | Without Coverage |
| Under 6 Years | 2,346 (97.8%) | 54 (2.2%) |
| 6 to 18 Years | 5,533 (96.9%) | 179 (3.1%) |
| 19 to 25 Years | 3,290 (89.3%) | 394 (10.7%) |
| 26 to 34 Years | 2,872 (80.9%) | 676 (19.1%) |
| 35 to 44 Years | 3,311 (91.5%) | 309 (8.5%) |
| 45 to 54 Years | 3,573 (90.9%) | 359 (9.1%) |
| 55 to 64 Years | 2,760 (91.8%) | 246 (8.2%) |
| 65 to 74 Years | 1,163 (95.6%) | 54 (4.4%) |
| 75 Years and older | 1,011 (100.0%) | 0 (0.0%) |
| Total | 25,859 (91.9%) | 2,271 (8.1%) |
Health Insurance Coverage by Citizenship Status in Mcdonough
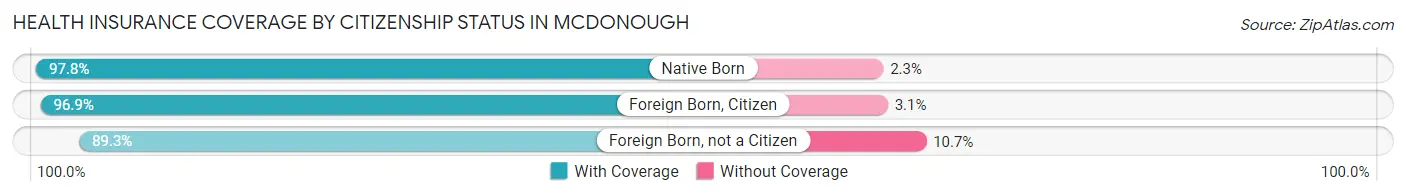
| Citizenship Status | With Coverage | Without Coverage |
| Native Born | 2,346 (97.8%) | 54 (2.2%) |
| Foreign Born, Citizen | 5,533 (96.9%) | 179 (3.1%) |
| Foreign Born, not a Citizen | 3,290 (89.3%) | 394 (10.7%) |
Health Insurance Coverage by Household Income in Mcdonough
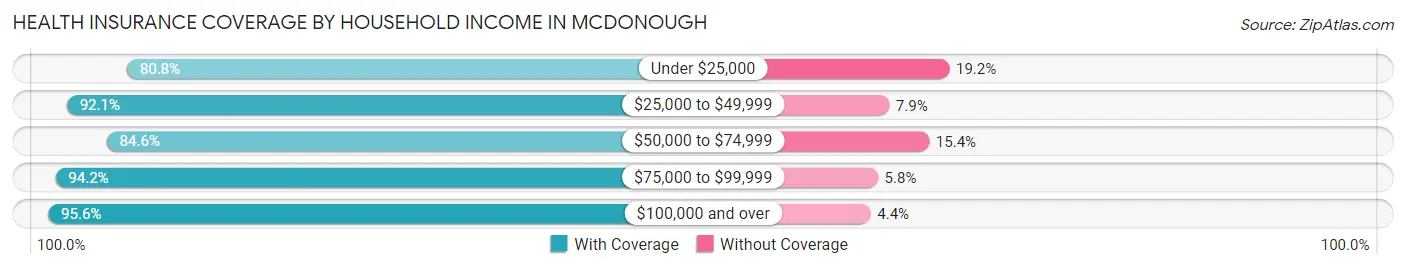
| Household Income | With Coverage | Without Coverage |
| Under $25,000 | 1,953 (80.8%) | 463 (19.2%) |
| $25,000 to $49,999 | 4,445 (92.1%) | 381 (7.9%) |
| $50,000 to $74,999 | 3,229 (84.6%) | 587 (15.4%) |
| $75,000 to $99,999 | 4,106 (94.2%) | 252 (5.8%) |
| $100,000 and over | 12,124 (95.6%) | 561 (4.4%) |
Public vs Private Health Insurance Coverage by Age in Mcdonough
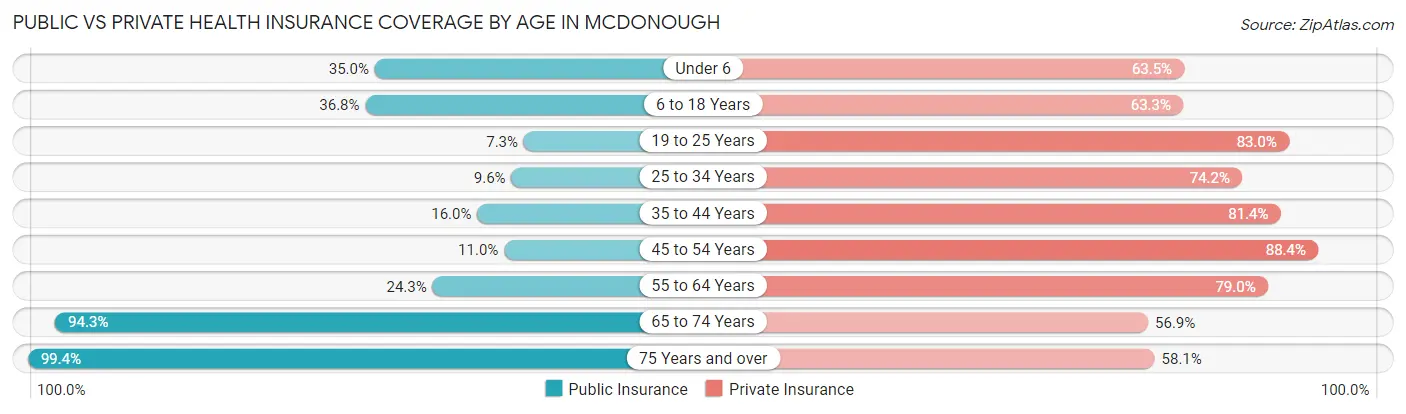
| Age Bracket | Public Insurance | Private Insurance |
| Under 6 | 840 (35.0%) | 1,524 (63.5%) |
| 6 to 18 Years | 2,099 (36.7%) | 3,615 (63.3%) |
| 19 to 25 Years | 270 (7.3%) | 3,056 (83.0%) |
| 25 to 34 Years | 342 (9.6%) | 2,634 (74.2%) |
| 35 to 44 Years | 578 (16.0%) | 2,946 (81.4%) |
| 45 to 54 Years | 432 (11.0%) | 3,474 (88.3%) |
| 55 to 64 Years | 730 (24.3%) | 2,375 (79.0%) |
| 65 to 74 Years | 1,148 (94.3%) | 692 (56.9%) |
| 75 Years and over | 1,005 (99.4%) | 587 (58.1%) |
| Total | 7,444 (26.5%) | 20,903 (74.3%) |
Disability Status by Sex by Age in Mcdonough
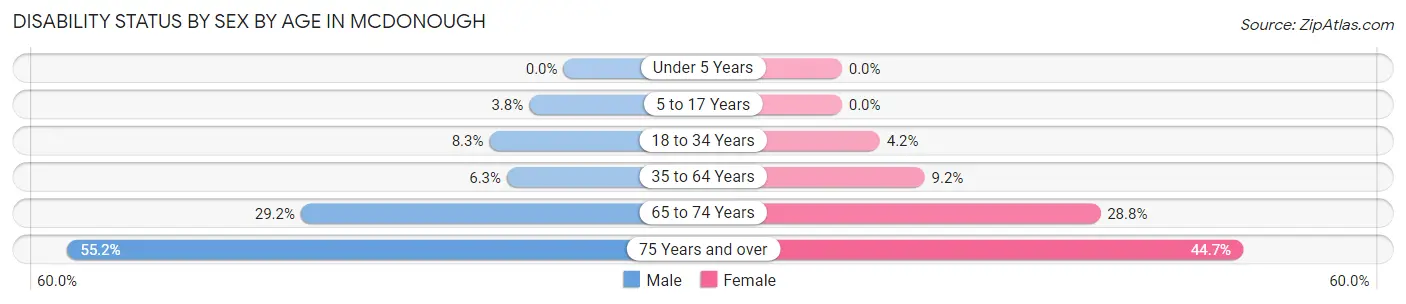
| Age Bracket | Male | Female |
| Under 5 Years | 0 (0.0%) | 0 (0.0%) |
| 5 to 17 Years | 138 (3.8%) | 0 (0.0%) |
| 18 to 34 Years | 318 (8.3%) | 158 (4.2%) |
| 35 to 64 Years | 291 (6.3%) | 547 (9.2%) |
| 65 to 74 Years | 174 (29.2%) | 179 (28.8%) |
| 75 Years and over | 211 (55.2%) | 281 (44.7%) |
Disability Class by Sex by Age in Mcdonough
Disability Class: Hearing Difficulty
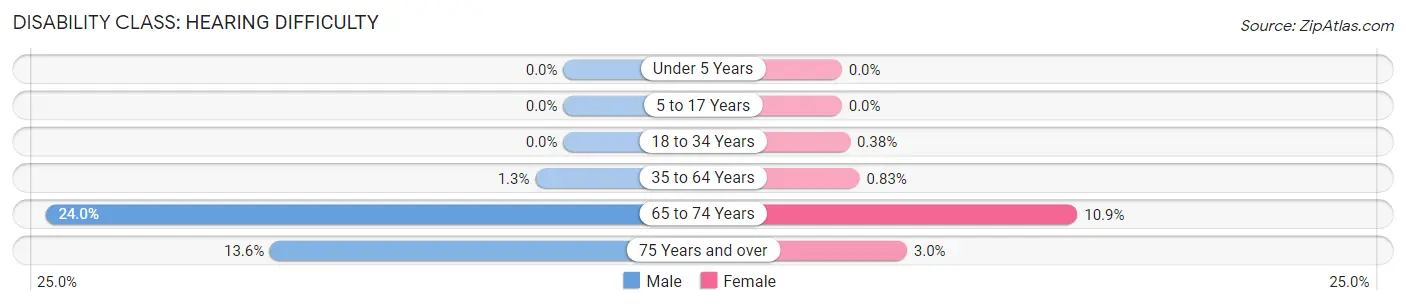
| Age Bracket | Male | Female |
| Under 5 Years | 0 (0.0%) | 0 (0.0%) |
| 5 to 17 Years | 0 (0.0%) | 0 (0.0%) |
| 18 to 34 Years | 0 (0.0%) | 14 (0.4%) |
| 35 to 64 Years | 60 (1.3%) | 49 (0.8%) |
| 65 to 74 Years | 143 (24.0%) | 68 (10.9%) |
| 75 Years and over | 52 (13.6%) | 19 (3.0%) |
Disability Class: Vision Difficulty
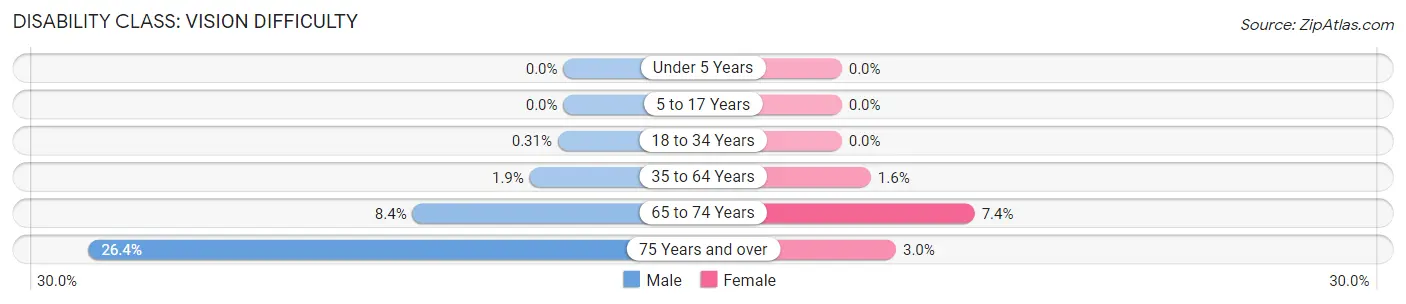
| Age Bracket | Male | Female |
| Under 5 Years | 0 (0.0%) | 0 (0.0%) |
| 5 to 17 Years | 0 (0.0%) | 0 (0.0%) |
| 18 to 34 Years | 12 (0.3%) | 0 (0.0%) |
| 35 to 64 Years | 87 (1.9%) | 96 (1.6%) |
| 65 to 74 Years | 50 (8.4%) | 46 (7.4%) |
| 75 Years and over | 101 (26.4%) | 19 (3.0%) |
Disability Class: Cognitive Difficulty
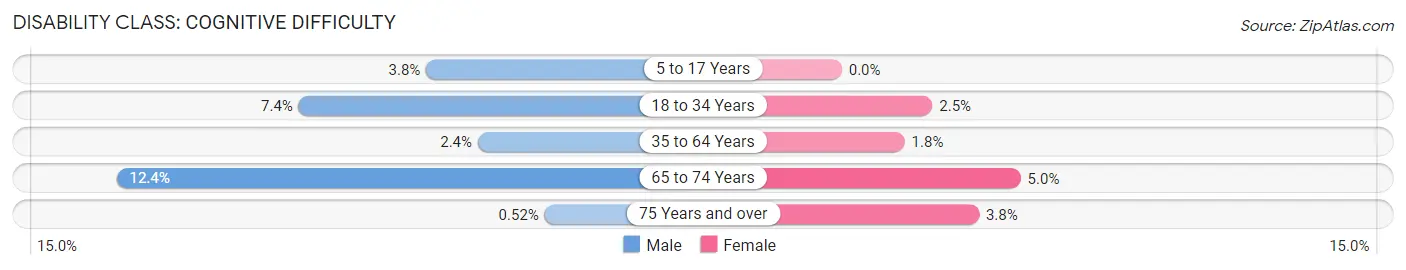
| Age Bracket | Male | Female |
| 5 to 17 Years | 138 (3.8%) | 0 (0.0%) |
| 18 to 34 Years | 284 (7.4%) | 94 (2.5%) |
| 35 to 64 Years | 110 (2.4%) | 104 (1.8%) |
| 65 to 74 Years | 74 (12.4%) | 31 (5.0%) |
| 75 Years and over | 2 (0.5%) | 24 (3.8%) |
Disability Class: Ambulatory Difficulty
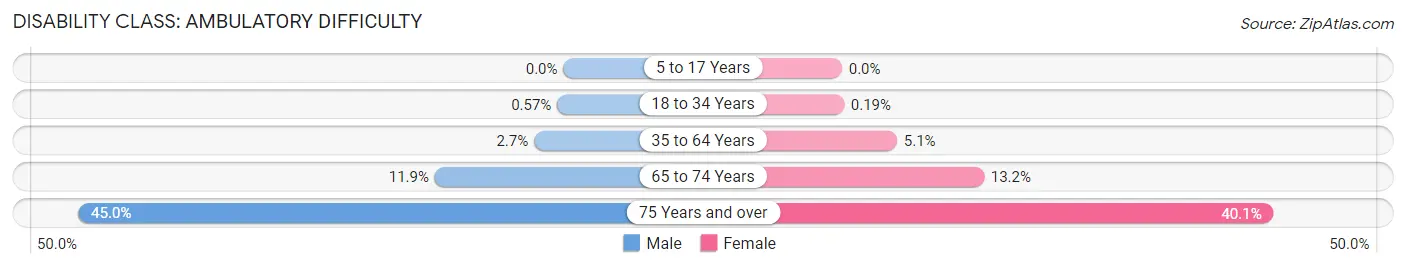
| Age Bracket | Male | Female |
| 5 to 17 Years | 0 (0.0%) | 0 (0.0%) |
| 18 to 34 Years | 22 (0.6%) | 7 (0.2%) |
| 35 to 64 Years | 126 (2.7%) | 303 (5.1%) |
| 65 to 74 Years | 71 (11.9%) | 82 (13.2%) |
| 75 Years and over | 172 (45.0%) | 252 (40.1%) |
Disability Class: Self-Care Difficulty
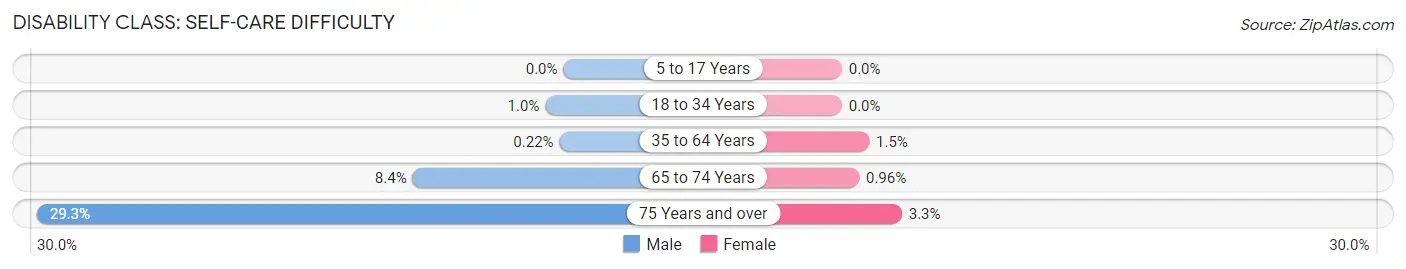
| Age Bracket | Male | Female |
| 5 to 17 Years | 0 (0.0%) | 0 (0.0%) |
| 18 to 34 Years | 39 (1.0%) | 0 (0.0%) |
| 35 to 64 Years | 10 (0.2%) | 90 (1.5%) |
| 65 to 74 Years | 50 (8.4%) | 6 (1.0%) |
| 75 Years and over | 112 (29.3%) | 21 (3.3%) |
Technology Access in Mcdonough
Computing Device Access in Mcdonough
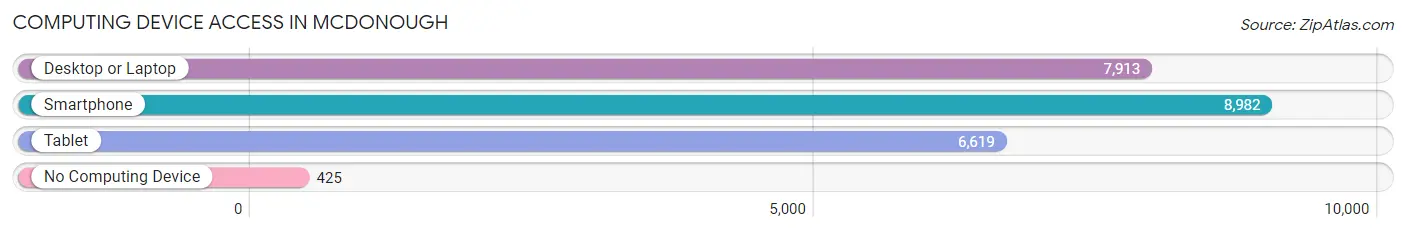
| Device Type | # Households | % Households |
| Desktop or Laptop | 7,913 | 81.6% |
| Smartphone | 8,982 | 92.6% |
| Tablet | 6,619 | 68.3% |
| No Computing Device | 425 | 4.4% |
| Total | 9,695 | 100.0% |
Internet Access in Mcdonough
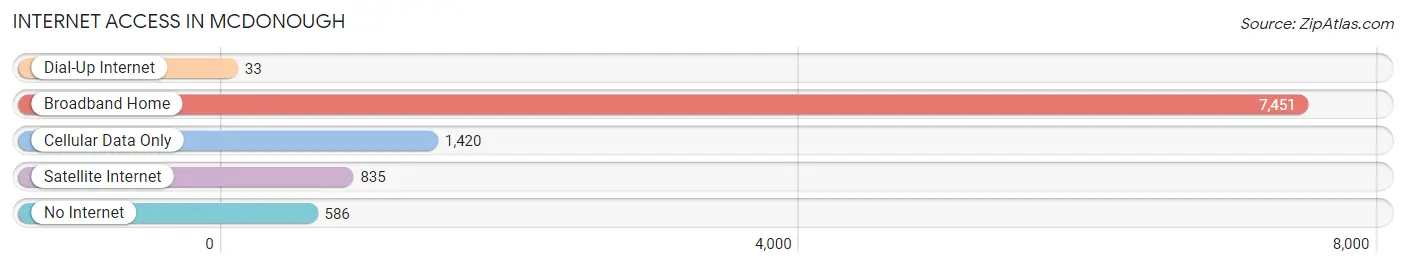
| Internet Type | # Households | % Households |
| Dial-Up Internet | 33 | 0.3% |
| Broadband Home | 7,451 | 76.8% |
| Cellular Data Only | 1,420 | 14.6% |
| Satellite Internet | 835 | 8.6% |
| No Internet | 586 | 6.0% |
| Total | 9,695 | 100.0% |
Mcdonough Summary
McDonough, Georgia is a city located in Henry County, Georgia, United States. It is part of the Atlanta metropolitan area. The population was 22,084 at the 2010 census, up from 8,493 in 2000. The city is the county seat of Henry County.
History
McDonough was founded in 1823 as seat of the newly formed Henry County. It was named for naval officer Commodore Thomas Macdonough, who defeated the British fleet at the Battle of Plattsburgh during the War of 1812. The town was originally called "Lickskillet", but the name was changed to honor Macdonough.
The town prospered during the antebellum period, and by 1860, it had become the second-largest city in Georgia. During the Civil War, the town was the site of a major battle in July 1864, when Union forces under General William T. Sherman defeated Confederate forces under General Joseph E. Johnston. After the war, the town continued to grow and prosper, and by the turn of the century, it had become a major agricultural center.
Geography
McDonough is located in the center of Henry County at 33°26′N 84°10′W (33.4333, -84.1667). It is bordered to the north by the city of Stockbridge, to the east by the city of Hampton, to the south by the city of Locust Grove, and to the west by the city of McDonough.
According to the United States Census Bureau, the city has a total area of 16.2 square miles (41.8 km2), of which 16.1 square miles (41.6 km2) is land and 0.1 square miles (0.2 km2) (0.62%) is water.
Economy
McDonough is a major economic center for Henry County and the surrounding area. The city is home to several large industrial and manufacturing companies, including TOTO USA, a manufacturer of bathroom fixtures, and the Georgia-Pacific Corporation, a major paper and wood products company. The city is also home to several retail stores, restaurants, and other businesses.
Demographics
As of the 2010 census, there were 22,084 people, 8,068 households, and 5,845 families residing in the city. The population density was 1,369.2 people per square mile (529.2/km2). There were 8,837 housing units at an average density of 551.2 per square mile (212.9/km2). The racial makeup of the city was 63.2% White, 28.2% African American, 0.3% Native American, 1.7% Asian, 0.1% Pacific Islander, 4.7% from other races, and 1.9% from two or more races. Hispanic or Latino of any race were 10.2% of the population.
There were 8,068 households, out of which 36.2% had children under the age of 18 living with them, 48.2% were married couples living together, 17.2% had a female householder with no husband present, and 28.7% were non-families. 23.2% of all households were made up of individuals, and 7.2% had someone living alone who was 65 years of age or older. The average household size was 2.72 and the average family size was 3.20.
In the city, the population was spread out, with 28.2% under the age of 18, 8.7% from 18 to 24, 33.2% from 25 to 44, 20.2% from 45 to 64, and 9.7% who were 65 years of age or older. The median age was 33 years. For every 100 females, there were 93.2 males. For every 100 females age 18 and over, there were 89.2 males.
The median income for a household in the city was $45,945, and the median income for a family was $51,845. Males had a median income of $37,813 versus $27,845 for females. The per capita income for the city was $20,945. About 8.2% of families and 10.3% of the population were below the poverty line, including 13.2% of those under age 18 and 11.2% of those age 65 or over.
Common Questions
What is Per Capita Income in Mcdonough?
Per Capita income in Mcdonough is $32,712.
What is the Median Family Income in Mcdonough?
Median Family Income in Mcdonough is $82,880.
What is the Median Household income in Mcdonough?
Median Household Income in Mcdonough is $77,804.
What is Income or Wage Gap in Mcdonough?
Income or Wage Gap in Mcdonough is 20.9%.
Women in Mcdonough earn 79.1 cents for every dollar earned by a man.
What is Family Income Deficit in Mcdonough?
Family Income Deficit in Mcdonough is $11,729.
Families that are below poverty line in Mcdonough earn $11,729 less on average than the poverty threshold level.
What is Inequality or Gini Index in Mcdonough?
Inequality or Gini Index in Mcdonough is 0.40.
What is the Total Population of Mcdonough?
Total Population of Mcdonough is 29,134.
What is the Total Male Population of Mcdonough?
Total Male Population of Mcdonough is 14,694.
What is the Total Female Population of Mcdonough?
Total Female Population of Mcdonough is 14,440.
What is the Ratio of Males per 100 Females in Mcdonough?
There are 101.76 Males per 100 Females in Mcdonough.
What is the Ratio of Females per 100 Males in Mcdonough?
There are 98.27 Females per 100 Males in Mcdonough.
What is the Median Population Age in Mcdonough?
Median Population Age in Mcdonough is 31.0 Years.
What is the Average Family Size in Mcdonough
Average Family Size in Mcdonough is 3.5 People.
What is the Average Household Size in Mcdonough
Average Household Size in Mcdonough is 2.9 People.
How Large is the Labor Force in Mcdonough?
There are 15,909 People in the Labor Forcein in Mcdonough.
What is the Percentage of People in the Labor Force in Mcdonough?
69.9% of People are in the Labor Force in Mcdonough.
What is the Unemployment Rate in Mcdonough?
Unemployment Rate in Mcdonough is 6.2%.