Roswell, GA Map & Demographics
Roswell Map
Roswell Overview
$62,878
PER CAPITA INCOME
$147,885
AVG FAMILY INCOME
$122,924
AVG HOUSEHOLD INCOME
37.1%
WAGE / INCOME GAP [ % ]
62.9¢/ $1
WAGE / INCOME GAP [ $ ]
$10,596
FAMILY INCOME DEFICIT
0.45
INEQUALITY / GINI INDEX
92,770
TOTAL POPULATION
45,640
MALE POPULATION
47,130
FEMALE POPULATION
96.84
MALES / 100 FEMALES
103.26
FEMALES / 100 MALES
40.5
MEDIAN AGE
3.1
AVG FAMILY SIZE
2.6
AVG HOUSEHOLD SIZE
51,509
LABOR FORCE [ PEOPLE ]
70.0%
PERCENT IN LABOR FORCE
4.3%
UNEMPLOYMENT RATE
Roswell Area Codes
Income in Roswell
Income Overview in Roswell
Per Capita Income in Roswell is $62,878, while median incomes of families and households are $147,885 and $122,924 respectively.
| Characteristic | Number | Measure |
| Per Capita Income | 92,770 | $62,878 |
| Median Family Income | 24,324 | $147,885 |
| Mean Family Income | 24,324 | $189,234 |
| Median Household Income | 35,435 | $122,924 |
| Mean Household Income | 35,435 | $163,080 |
| Income Deficit | 24,324 | $10,596 |
| Wage / Income Gap (%) | 92,770 | 37.14% |
| Wage / Income Gap ($) | 92,770 | 62.86¢ per $1 |
| Gini / Inequality Index | 92,770 | 0.45 |
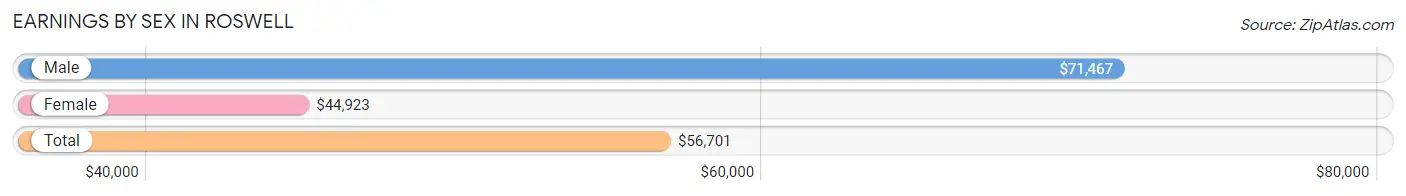
Earnings by Sex in Roswell
Average Earnings in Roswell are $56,701, $71,467 for men and $44,923 for women, a difference of 37.1%.
| Sex | Number | Average Earnings |
| Male | 29,085 (54.0%) | $71,467 |
| Female | 24,749 (46.0%) | $44,923 |
| Total | 53,834 (100.0%) | $56,701 |
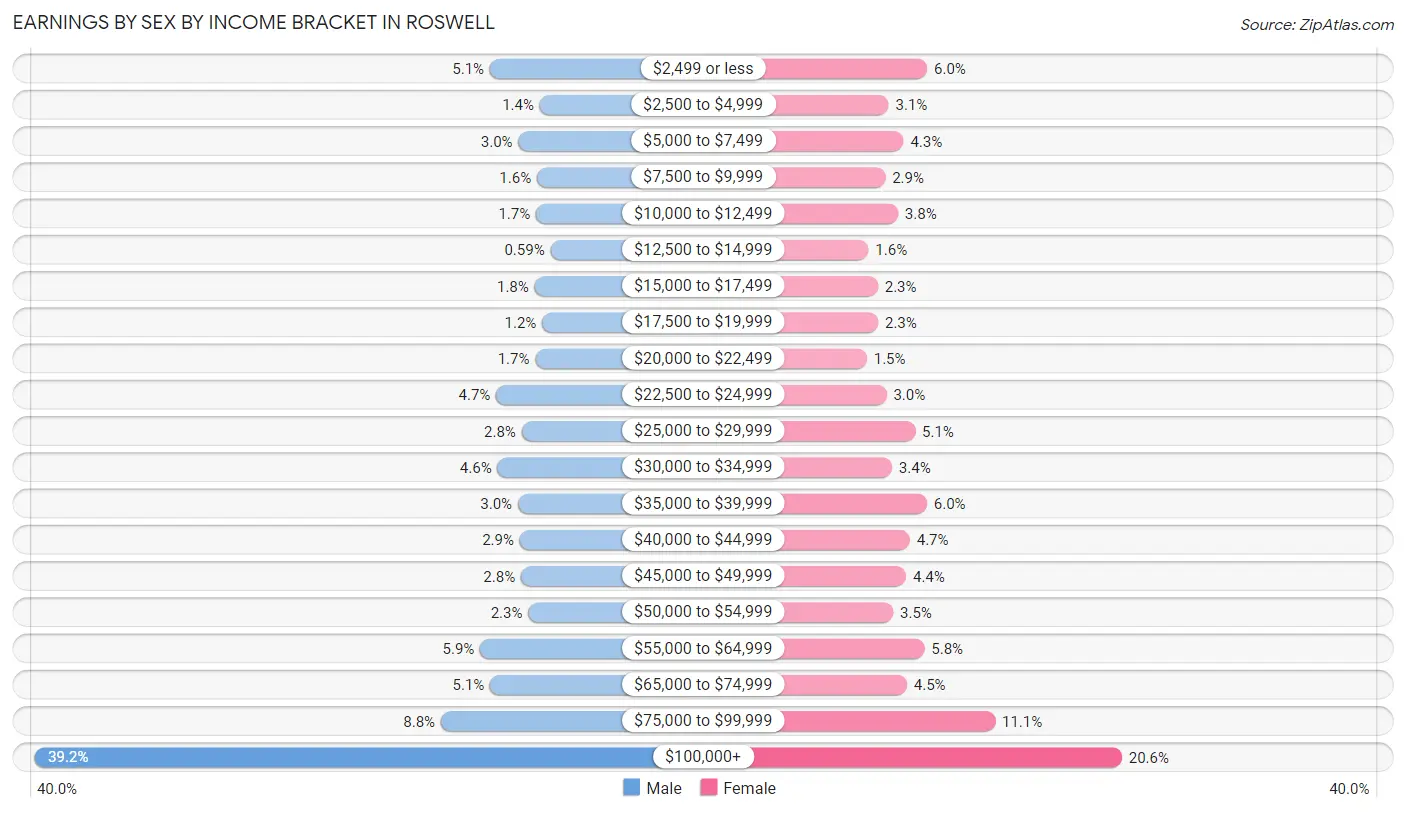
Earnings by Sex by Income Bracket in Roswell
The most common earnings brackets in Roswell are $100,000+ for men (11,406 | 39.2%) and $100,000+ for women (5,101 | 20.6%).
| Income | Male | Female |
| $2,499 or less | 1,491 (5.1%) | 1,489 (6.0%) |
| $2,500 to $4,999 | 404 (1.4%) | 775 (3.1%) |
| $5,000 to $7,499 | 870 (3.0%) | 1,051 (4.3%) |
| $7,500 to $9,999 | 464 (1.6%) | 712 (2.9%) |
| $10,000 to $12,499 | 487 (1.7%) | 948 (3.8%) |
| $12,500 to $14,999 | 172 (0.6%) | 400 (1.6%) |
| $15,000 to $17,499 | 519 (1.8%) | 575 (2.3%) |
| $17,500 to $19,999 | 351 (1.2%) | 578 (2.3%) |
| $20,000 to $22,499 | 503 (1.7%) | 370 (1.5%) |
| $22,500 to $24,999 | 1,355 (4.7%) | 734 (3.0%) |
| $25,000 to $29,999 | 799 (2.8%) | 1,266 (5.1%) |
| $30,000 to $34,999 | 1,327 (4.6%) | 837 (3.4%) |
| $35,000 to $39,999 | 880 (3.0%) | 1,484 (6.0%) |
| $40,000 to $44,999 | 841 (2.9%) | 1,167 (4.7%) |
| $45,000 to $49,999 | 813 (2.8%) | 1,100 (4.4%) |
| $50,000 to $54,999 | 654 (2.2%) | 860 (3.5%) |
| $55,000 to $64,999 | 1,705 (5.9%) | 1,439 (5.8%) |
| $65,000 to $74,999 | 1,485 (5.1%) | 1,114 (4.5%) |
| $75,000 to $99,999 | 2,559 (8.8%) | 2,749 (11.1%) |
| $100,000+ | 11,406 (39.2%) | 5,101 (20.6%) |
| Total | 29,085 (100.0%) | 24,749 (100.0%) |
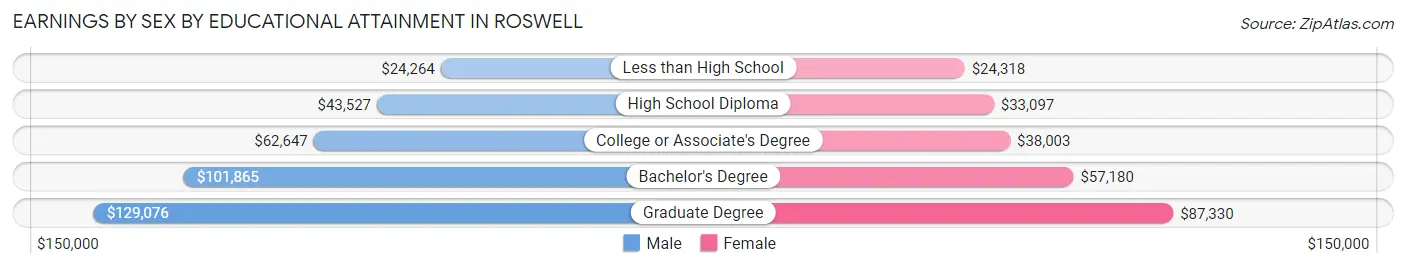
Earnings by Sex by Educational Attainment in Roswell
Average earnings in Roswell are $89,154 for men and $51,995 for women, a difference of 41.7%. Men with an educational attainment of graduate degree enjoy the highest average annual earnings of $129,076, while those with less than high school education earn the least with $24,264. Women with an educational attainment of graduate degree earn the most with the average annual earnings of $87,330, while those with less than high school education have the smallest earnings of $24,318.
| Educational Attainment | Male Income | Female Income |
| Less than High School | $24,264 | $24,318 |
| High School Diploma | $43,527 | $33,097 |
| College or Associate's Degree | $62,647 | $38,003 |
| Bachelor's Degree | $101,865 | $57,180 |
| Graduate Degree | $129,076 | $87,330 |
| Total | $89,154 | $51,995 |
Family Income in Roswell
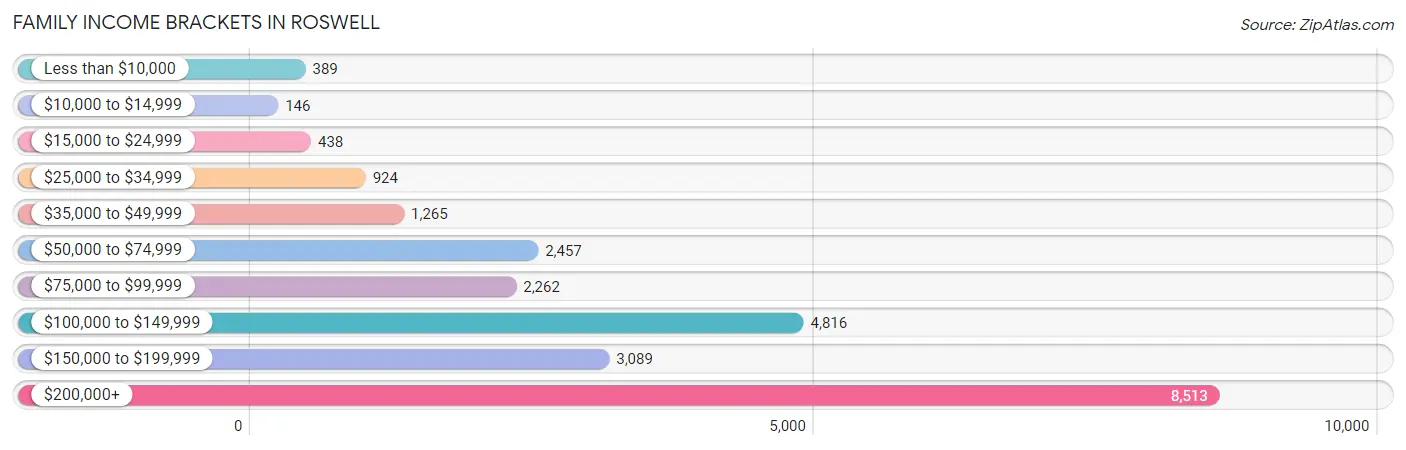
Family Income Brackets in Roswell
According to the Roswell family income data, there are 8,513 families falling into the $200,000+ income range, which is the most common income bracket and makes up 35.0% of all families. Conversely, the $10,000 to $14,999 income bracket is the least frequent group with only 146 families (0.6%) belonging to this category.
| Income Bracket | # Families | % Families |
| Less than $10,000 | 389 | 1.6% |
| $10,000 to $14,999 | 146 | 0.6% |
| $15,000 to $24,999 | 438 | 1.8% |
| $25,000 to $34,999 | 924 | 3.8% |
| $35,000 to $49,999 | 1,265 | 5.2% |
| $50,000 to $74,999 | 2,457 | 10.1% |
| $75,000 to $99,999 | 2,262 | 9.3% |
| $100,000 to $149,999 | 4,816 | 19.8% |
| $150,000 to $199,999 | 3,089 | 12.7% |
| $200,000+ | 8,513 | 35.0% |
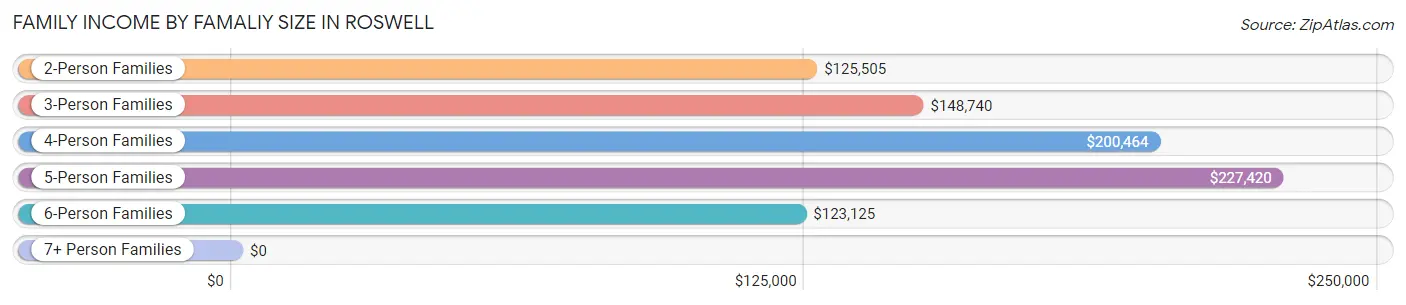
Family Income by Famaliy Size in Roswell
5-person families (1,459 | 6.0%) account for the highest median family income in Roswell with $227,420 per family, while 2-person families (11,448 | 47.1%) have the highest median income of $62,752 per family member.
| Income Bracket | # Families | Median Income |
| 2-Person Families | 11,448 (47.1%) | $125,505 |
| 3-Person Families | 4,862 (20.0%) | $148,740 |
| 4-Person Families | 5,489 (22.6%) | $200,464 |
| 5-Person Families | 1,459 (6.0%) | $227,420 |
| 6-Person Families | 785 (3.2%) | $123,125 |
| 7+ Person Families | 281 (1.2%) | $0 |
| Total | 24,324 (100.0%) | $147,885 |
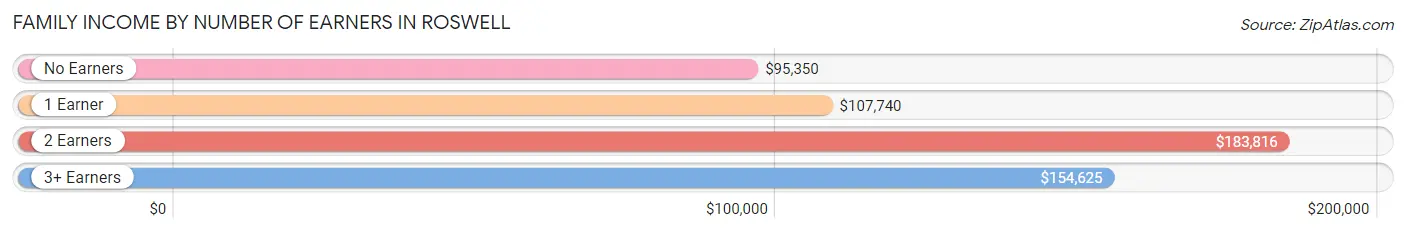
Family Income by Number of Earners in Roswell
The median family income in Roswell is $147,885, with families comprising 2 earners (11,662) having the highest median family income of $183,816, while families with no earners (2,439) have the lowest median family income of $95,350, accounting for 47.9% and 10.0% of families, respectively.
| Number of Earners | # Families | Median Income |
| No Earners | 2,439 (10.0%) | $95,350 |
| 1 Earner | 7,076 (29.1%) | $107,740 |
| 2 Earners | 11,662 (47.9%) | $183,816 |
| 3+ Earners | 3,147 (12.9%) | $154,625 |
| Total | 24,324 (100.0%) | $147,885 |
Household Income in Roswell
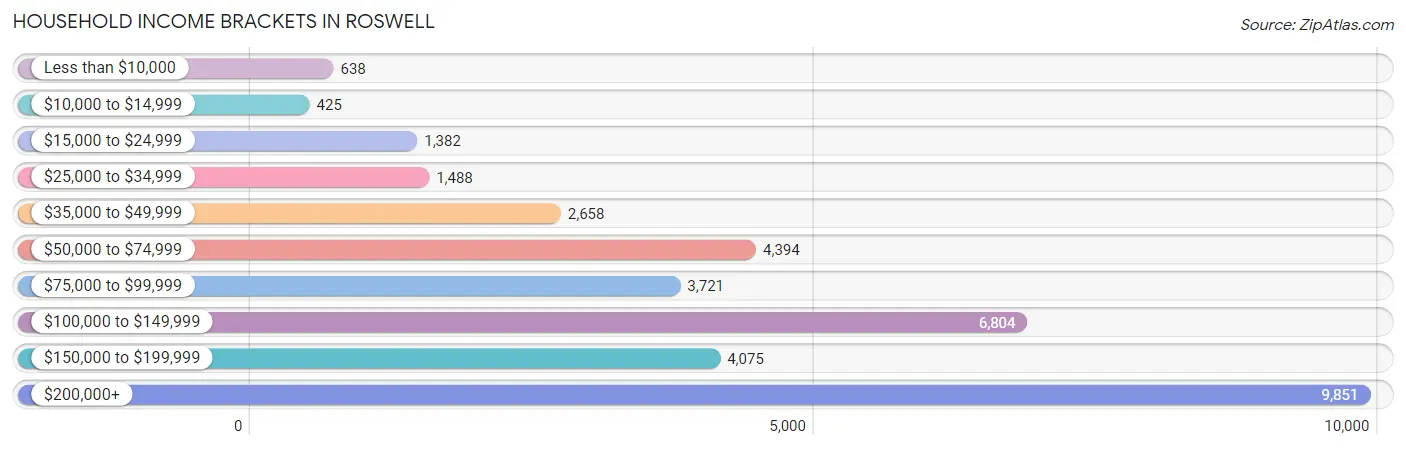
Household Income Brackets in Roswell
With 9,851 households falling in the category, the $200,000+ income range is the most frequent in Roswell, accounting for 27.8% of all households. In contrast, only 425 households (1.2%) fall into the $10,000 to $14,999 income bracket, making it the least populous group.
| Income Bracket | # Households | % Households |
| Less than $10,000 | 638 | 1.8% |
| $10,000 to $14,999 | 425 | 1.2% |
| $15,000 to $24,999 | 1,382 | 3.9% |
| $25,000 to $34,999 | 1,488 | 4.2% |
| $35,000 to $49,999 | 2,658 | 7.5% |
| $50,000 to $74,999 | 4,394 | 12.4% |
| $75,000 to $99,999 | 3,721 | 10.5% |
| $100,000 to $149,999 | 6,804 | 19.2% |
| $150,000 to $199,999 | 4,075 | 11.5% |
| $200,000+ | 9,851 | 27.8% |
Household Income by Householder Age in Roswell
The median household income in Roswell is $122,924, with the highest median household income of $150,023 found in the 45 to 64 years age bracket for the primary householder. A total of 15,135 households (42.7%) fall into this category. Meanwhile, the 15 to 24 years age bracket for the primary householder has the lowest median household income of $42,120, with 676 households (1.9%) in this group.
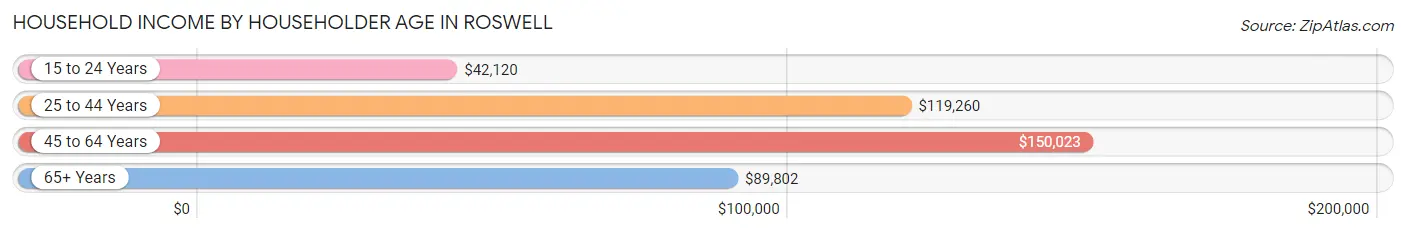
| Income Bracket | # Households | Median Income |
| 15 to 24 Years | 676 (1.9%) | $42,120 |
| 25 to 44 Years | 11,376 (32.1%) | $119,260 |
| 45 to 64 Years | 15,135 (42.7%) | $150,023 |
| 65+ Years | 8,248 (23.3%) | $89,802 |
| Total | 35,435 (100.0%) | $122,924 |
Poverty in Roswell
Income Below Poverty by Sex and Age in Roswell
With 5.9% poverty level for males and 7.2% for females among the residents of Roswell, 15 year old males and 15 year old females are the most vulnerable to poverty, with 143 males (11.7%) and 181 females (22.6%) in their respective age groups living below the poverty level.
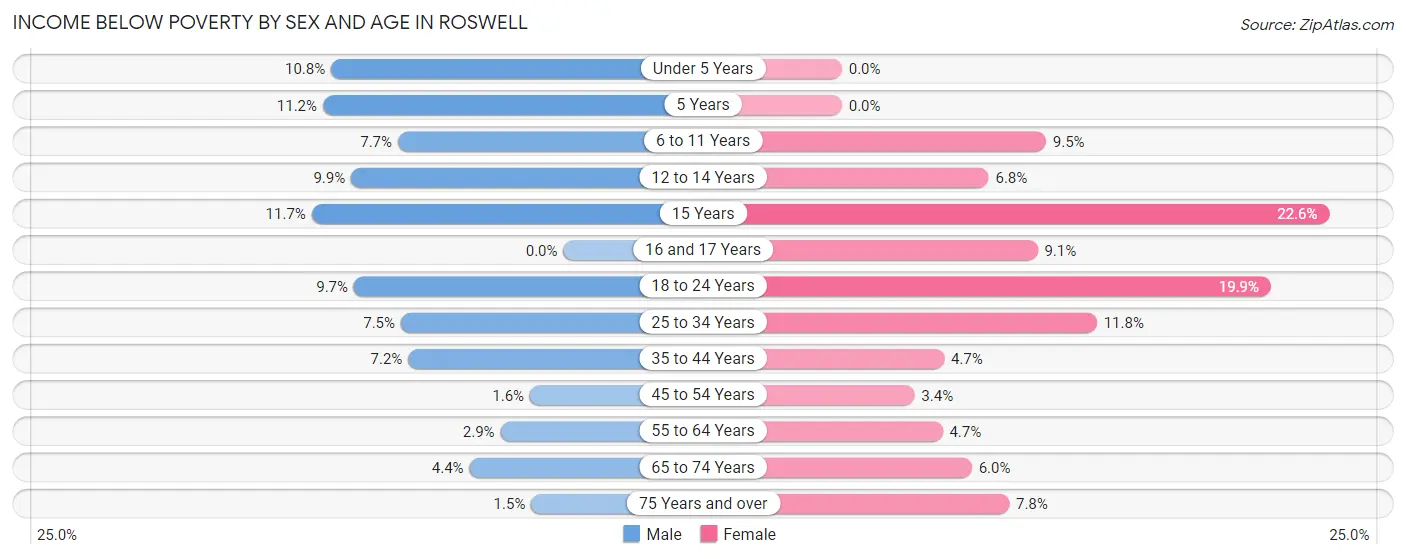
| Age Bracket | Male | Female |
| Under 5 Years | 255 (10.8%) | 0 (0.0%) |
| 5 Years | 53 (11.2%) | 0 (0.0%) |
| 6 to 11 Years | 285 (7.7%) | 316 (9.5%) |
| 12 to 14 Years | 209 (9.9%) | 135 (6.8%) |
| 15 Years | 143 (11.7%) | 181 (22.6%) |
| 16 and 17 Years | 0 (0.0%) | 176 (9.1%) |
| 18 to 24 Years | 368 (9.7%) | 581 (19.9%) |
| 25 to 34 Years | 381 (7.5%) | 598 (11.8%) |
| 35 to 44 Years | 463 (7.2%) | 331 (4.7%) |
| 45 to 54 Years | 110 (1.5%) | 237 (3.4%) |
| 55 to 64 Years | 162 (2.9%) | 304 (4.7%) |
| 65 to 74 Years | 196 (4.4%) | 262 (6.0%) |
| 75 Years and over | 28 (1.5%) | 235 (7.8%) |
| Total | 2,653 (5.9%) | 3,356 (7.2%) |
Income Above Poverty by Sex and Age in Roswell
According to the poverty statistics in Roswell, males aged 16 and 17 years and females aged under 5 years are the age groups that are most secure financially, with 100.0% of males and 100.0% of females in these age groups living above the poverty line.
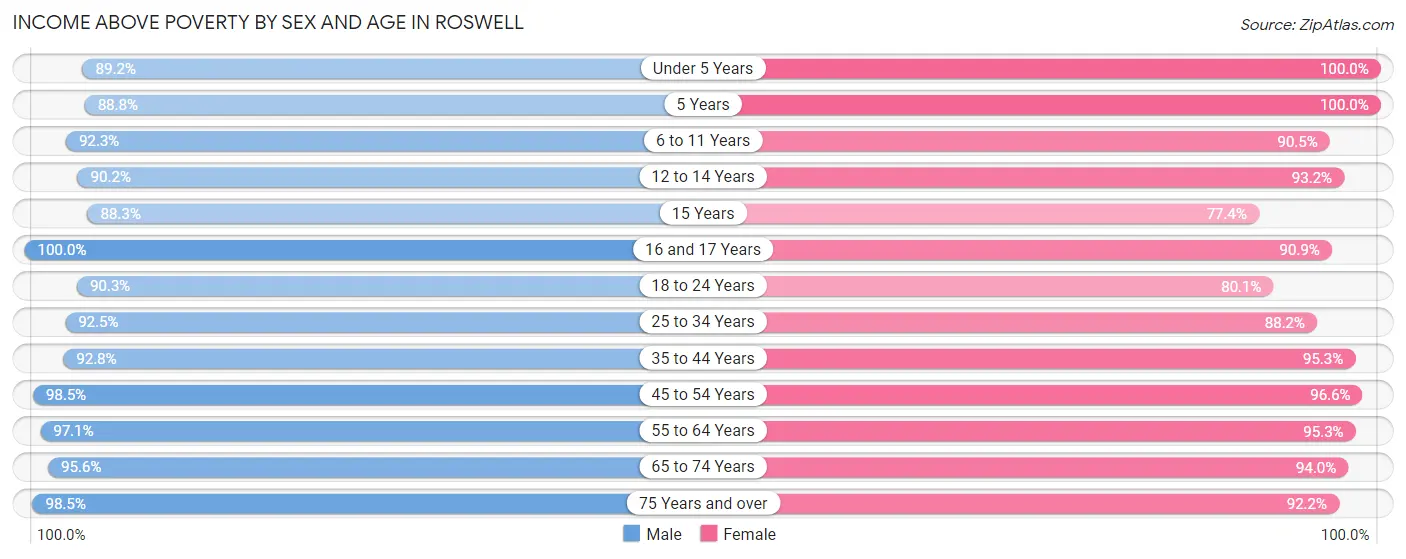
| Age Bracket | Male | Female |
| Under 5 Years | 2,110 (89.2%) | 2,306 (100.0%) |
| 5 Years | 422 (88.8%) | 544 (100.0%) |
| 6 to 11 Years | 3,425 (92.3%) | 3,022 (90.5%) |
| 12 to 14 Years | 1,913 (90.1%) | 1,848 (93.2%) |
| 15 Years | 1,081 (88.3%) | 619 (77.4%) |
| 16 and 17 Years | 1,133 (100.0%) | 1,762 (90.9%) |
| 18 to 24 Years | 3,417 (90.3%) | 2,337 (80.1%) |
| 25 to 34 Years | 4,669 (92.5%) | 4,458 (88.2%) |
| 35 to 44 Years | 5,969 (92.8%) | 6,651 (95.3%) |
| 45 to 54 Years | 6,969 (98.5%) | 6,799 (96.6%) |
| 55 to 64 Years | 5,392 (97.1%) | 6,209 (95.3%) |
| 65 to 74 Years | 4,301 (95.6%) | 4,082 (94.0%) |
| 75 Years and over | 1,856 (98.5%) | 2,794 (92.2%) |
| Total | 42,657 (94.1%) | 43,431 (92.8%) |
Income Below Poverty Among Married-Couple Families in Roswell
The poverty statistics for married-couple families in Roswell show that 2.5% or 497 of the total 19,517 families live below the poverty line. Families with 3 or 4 children have the highest poverty rate of 11.3%, comprising of 141 families. On the other hand, families with 5 or more children have the lowest poverty rate of 0.0%, which includes 0 families.
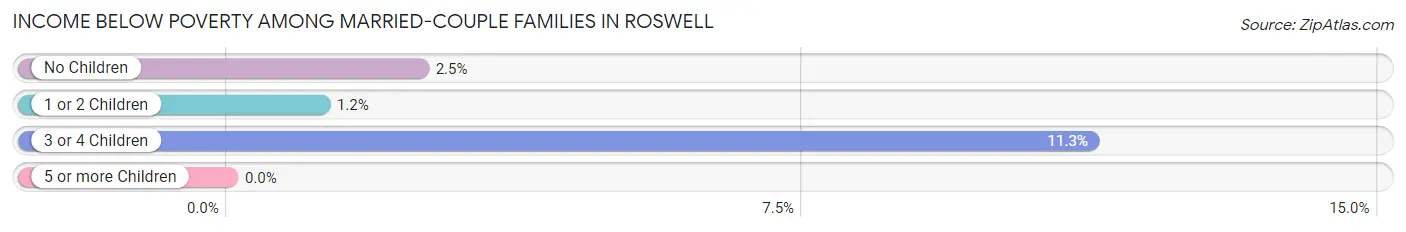
| Children | Above Poverty | Below Poverty |
| No Children | 10,555 (97.5%) | 270 (2.5%) |
| 1 or 2 Children | 7,104 (98.8%) | 86 (1.2%) |
| 3 or 4 Children | 1,112 (88.7%) | 141 (11.3%) |
| 5 or more Children | 249 (100.0%) | 0 (0.0%) |
| Total | 19,020 (97.5%) | 497 (2.5%) |
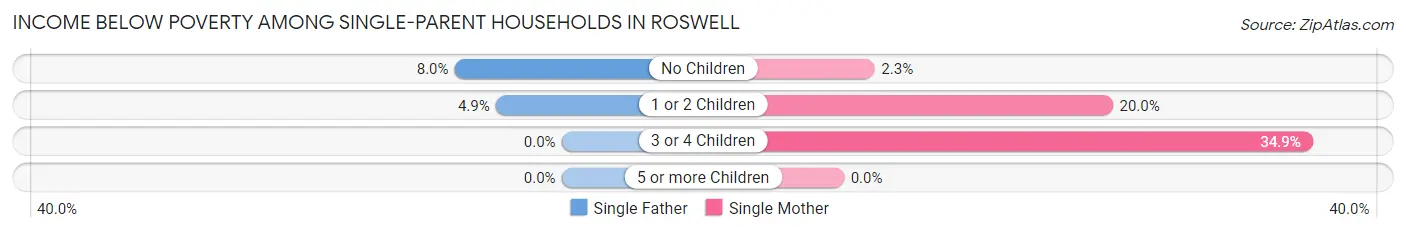
Income Below Poverty Among Single-Parent Households in Roswell
According to the poverty data in Roswell, 5.9% or 103 single-father households and 13.8% or 424 single-mother households are living below the poverty line. Among single-father households, those with no children have the highest poverty rate, with 55 households (8.0%) experiencing poverty. Likewise, among single-mother households, those with 3 or 4 children have the highest poverty rate, with 80 households (34.9%) falling below the poverty line.
| Children | Single Father | Single Mother |
| No Children | 55 (8.0%) | 29 (2.3%) |
| 1 or 2 Children | 48 (4.9%) | 315 (20.0%) |
| 3 or 4 Children | 0 (0.0%) | 80 (34.9%) |
| 5 or more Children | 0 (0.0%) | 0 (0.0%) |
| Total | 103 (5.9%) | 424 (13.8%) |
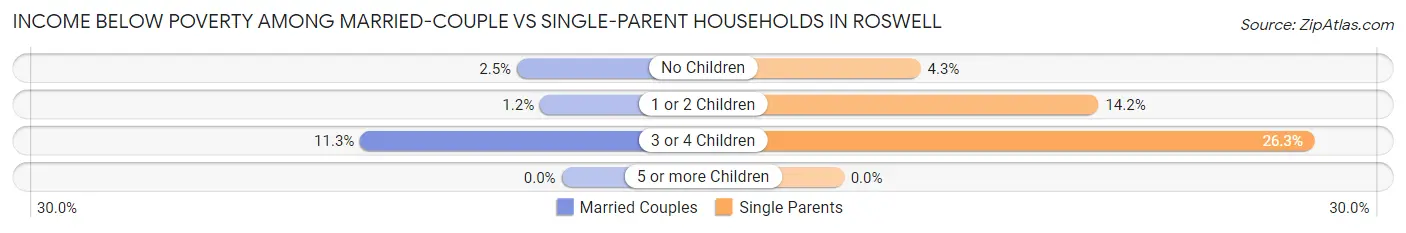
Income Below Poverty Among Married-Couple vs Single-Parent Households in Roswell
The poverty data for Roswell shows that 497 of the married-couple family households (2.5%) and 527 of the single-parent households (11.0%) are living below the poverty level. Within the married-couple family households, those with 3 or 4 children have the highest poverty rate, with 141 households (11.3%) falling below the poverty line. Among the single-parent households, those with 3 or 4 children have the highest poverty rate, with 80 household (26.3%) living below poverty.
| Children | Married-Couple Families | Single-Parent Households |
| No Children | 270 (2.5%) | 84 (4.3%) |
| 1 or 2 Children | 86 (1.2%) | 363 (14.2%) |
| 3 or 4 Children | 141 (11.3%) | 80 (26.3%) |
| 5 or more Children | 0 (0.0%) | 0 (0.0%) |
| Total | 497 (2.5%) | 527 (11.0%) |
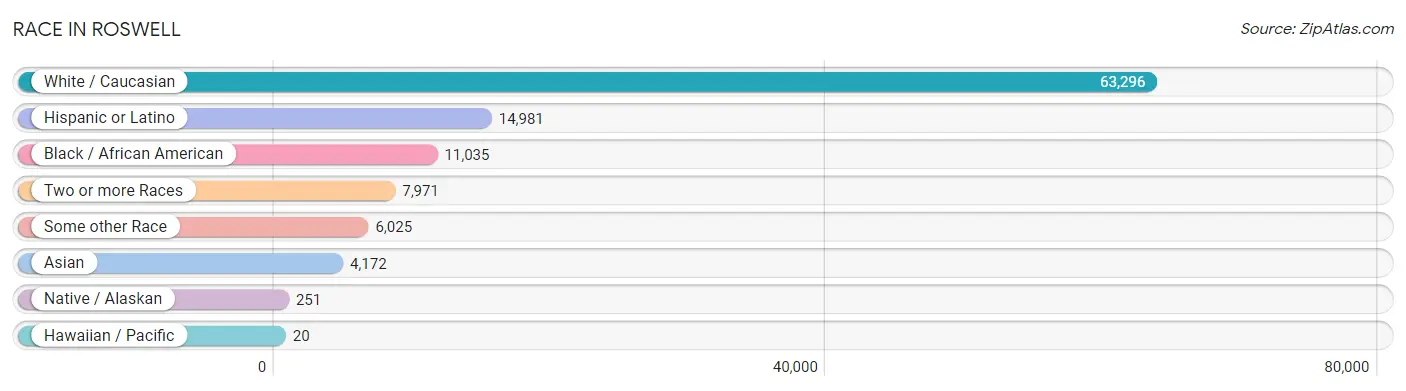
Race in Roswell
The most populous races in Roswell are White / Caucasian (63,296 | 68.2%), Hispanic or Latino (14,981 | 16.2%), and Black / African American (11,035 | 11.9%).
| Race | # Population | % Population |
| Asian | 4,172 | 4.5% |
| Black / African American | 11,035 | 11.9% |
| Hawaiian / Pacific | 20 | 0.0% |
| Hispanic or Latino | 14,981 | 16.2% |
| Native / Alaskan | 251 | 0.3% |
| White / Caucasian | 63,296 | 68.2% |
| Two or more Races | 7,971 | 8.6% |
| Some other Race | 6,025 | 6.5% |
| Total | 92,770 | 100.0% |
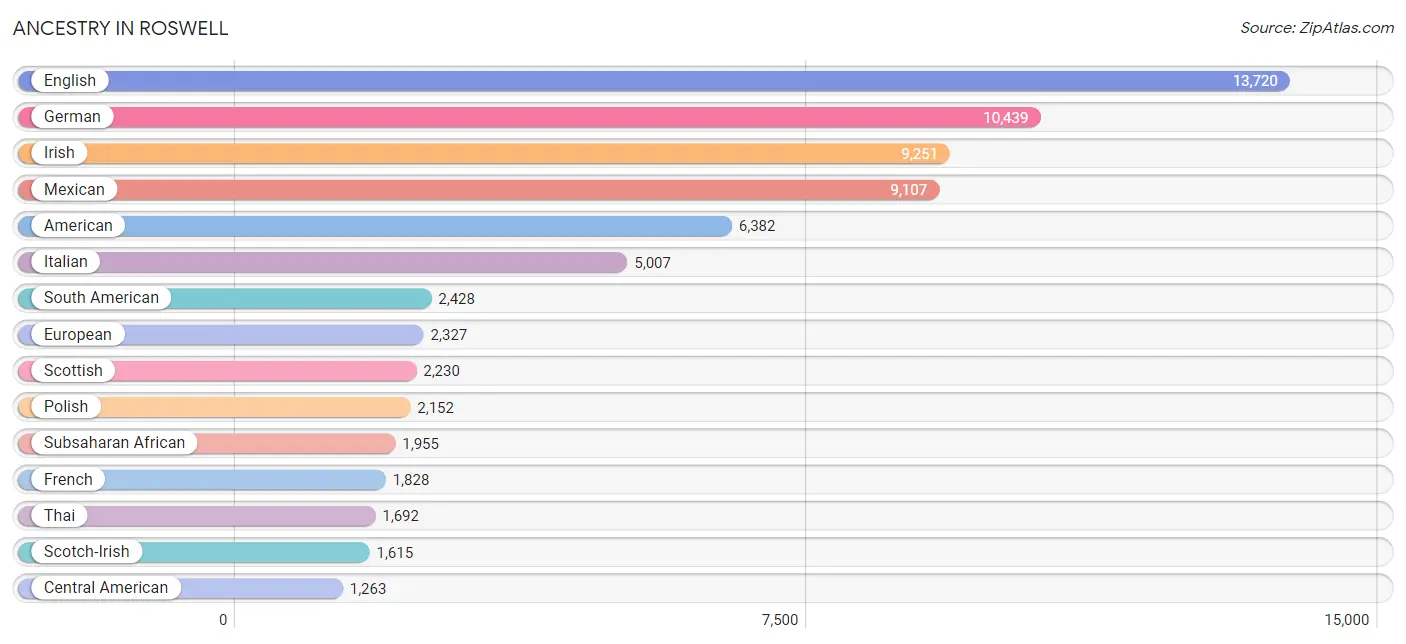
Ancestry in Roswell
The most populous ancestries reported in Roswell are English (13,720 | 14.8%), German (10,439 | 11.3%), Irish (9,251 | 10.0%), Mexican (9,107 | 9.8%), and American (6,382 | 6.9%), together accounting for 52.7% of all Roswell residents.
| Ancestry | # Population | % Population |
| Afghan | 18 | 0.0% |
| African | 1,235 | 1.3% |
| Alsatian | 33 | 0.0% |
| American | 6,382 | 6.9% |
| Apache | 11 | 0.0% |
| Arab | 605 | 0.6% |
| Argentinean | 23 | 0.0% |
| Armenian | 58 | 0.1% |
| Australian | 108 | 0.1% |
| Austrian | 246 | 0.3% |
| Bahamian | 36 | 0.0% |
| Basque | 9 | 0.0% |
| Belgian | 39 | 0.0% |
| Bhutanese | 410 | 0.4% |
| Brazilian | 739 | 0.8% |
| British | 1,115 | 1.2% |
| British West Indian | 13 | 0.0% |
| Bulgarian | 134 | 0.1% |
| Burmese | 772 | 0.8% |
| Canadian | 580 | 0.6% |
| Celtic | 28 | 0.0% |
| Central American | 1,263 | 1.4% |
| Central American Indian | 123 | 0.1% |
| Cherokee | 176 | 0.2% |
| Chippewa | 5 | 0.0% |
| Choctaw | 65 | 0.1% |
| Colombian | 1,121 | 1.2% |
| Costa Rican | 81 | 0.1% |
| Creek | 33 | 0.0% |
| Croatian | 146 | 0.2% |
| Cuban | 473 | 0.5% |
| Czech | 304 | 0.3% |
| Czechoslovakian | 55 | 0.1% |
| Danish | 322 | 0.4% |
| Dominican | 238 | 0.3% |
| Dutch | 619 | 0.7% |
| Eastern European | 536 | 0.6% |
| Ecuadorian | 95 | 0.1% |
| Egyptian | 25 | 0.0% |
| English | 13,720 | 14.8% |
| Ethiopian | 41 | 0.0% |
| European | 2,327 | 2.5% |
| Finnish | 42 | 0.1% |
| French | 1,828 | 2.0% |
| French Canadian | 830 | 0.9% |
| German | 10,439 | 11.3% |
| Ghanaian | 86 | 0.1% |
| Greek | 165 | 0.2% |
| Guamanian / Chamorro | 11 | 0.0% |
| Guatemalan | 277 | 0.3% |
| Guyanese | 42 | 0.1% |
| Haitian | 259 | 0.3% |
| Honduran | 406 | 0.4% |
| Hungarian | 522 | 0.6% |
| Icelander | 13 | 0.0% |
| Indian (Asian) | 687 | 0.7% |
| Indonesian | 31 | 0.0% |
| Iranian | 391 | 0.4% |
| Iraqi | 55 | 0.1% |
| Irish | 9,251 | 10.0% |
| Israeli | 97 | 0.1% |
| Italian | 5,007 | 5.4% |
| Jamaican | 756 | 0.8% |
| Jordanian | 23 | 0.0% |
| Kenyan | 21 | 0.0% |
| Korean | 818 | 0.9% |
| Laotian | 221 | 0.2% |
| Latvian | 56 | 0.1% |
| Lebanese | 222 | 0.2% |
| Lithuanian | 123 | 0.1% |
| Lumbee | 45 | 0.1% |
| Luxembourger | 49 | 0.1% |
| Marshallese | 64 | 0.1% |
| Mexican | 9,107 | 9.8% |
| Mexican American Indian | 68 | 0.1% |
| Moroccan | 5 | 0.0% |
| Navajo | 5 | 0.0% |
| Nigerian | 131 | 0.1% |
| Northern European | 277 | 0.3% |
| Norwegian | 813 | 0.9% |
| Pakistani | 78 | 0.1% |
| Palestinian | 96 | 0.1% |
| Panamanian | 46 | 0.1% |
| Peruvian | 252 | 0.3% |
| Polish | 2,152 | 2.3% |
| Portuguese | 268 | 0.3% |
| Puerto Rican | 733 | 0.8% |
| Romanian | 229 | 0.3% |
| Russian | 1,213 | 1.3% |
| Salvadoran | 453 | 0.5% |
| Scandinavian | 259 | 0.3% |
| Scotch-Irish | 1,615 | 1.7% |
| Scottish | 2,230 | 2.4% |
| Seminole | 28 | 0.0% |
| Serbian | 53 | 0.1% |
| Slavic | 10 | 0.0% |
| Slovak | 83 | 0.1% |
| Slovene | 46 | 0.1% |
| Somali | 35 | 0.0% |
| South African | 34 | 0.0% |
| South American | 2,428 | 2.6% |
| Spaniard | 220 | 0.2% |
| Spanish | 172 | 0.2% |
| Sri Lankan | 469 | 0.5% |
| Subsaharan African | 1,955 | 2.1% |
| Swedish | 775 | 0.8% |
| Swiss | 243 | 0.3% |
| Syrian | 15 | 0.0% |
| Thai | 1,692 | 1.8% |
| Trinidadian and Tobagonian | 64 | 0.1% |
| Turkish | 175 | 0.2% |
| Ukrainian | 415 | 0.4% |
| Uruguayan | 193 | 0.2% |
| Ute | 9 | 0.0% |
| Venezuelan | 744 | 0.8% |
| Welsh | 708 | 0.8% |
| West Indian | 128 | 0.1% | View All 117 Rows |
Immigrants in Roswell
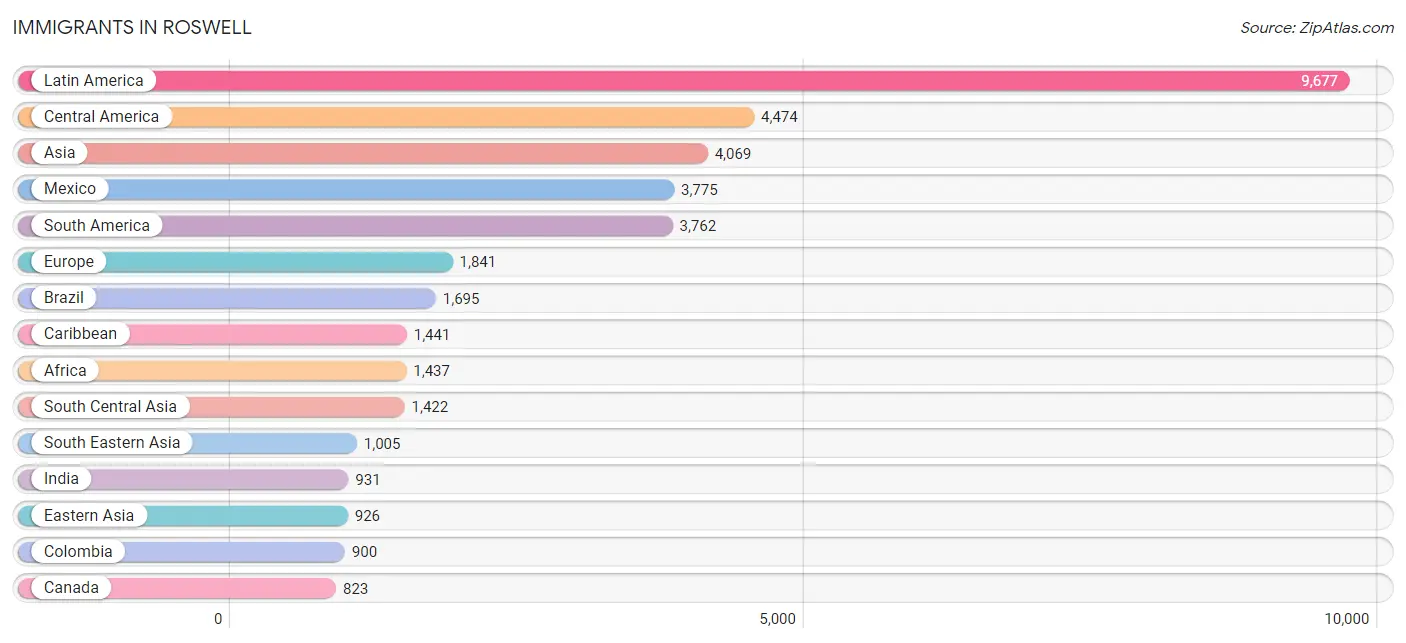
The most numerous immigrant groups reported in Roswell came from Latin America (9,677 | 10.4%), Central America (4,474 | 4.8%), Asia (4,069 | 4.4%), Mexico (3,775 | 4.1%), and South America (3,762 | 4.1%), together accounting for 27.8% of all Roswell residents.
| Immigration Origin | # Population | % Population |
| Afghanistan | 18 | 0.0% |
| Africa | 1,437 | 1.5% |
| Asia | 4,069 | 4.4% |
| Australia | 51 | 0.1% |
| Austria | 93 | 0.1% |
| Bahamas | 99 | 0.1% |
| Belarus | 43 | 0.1% |
| Belgium | 26 | 0.0% |
| Belize | 24 | 0.0% |
| Bolivia | 23 | 0.0% |
| Bosnia and Herzegovina | 13 | 0.0% |
| Brazil | 1,695 | 1.8% |
| Bulgaria | 50 | 0.1% |
| Canada | 823 | 0.9% |
| Caribbean | 1,441 | 1.5% |
| Central America | 4,474 | 4.8% |
| China | 426 | 0.5% |
| Colombia | 900 | 1.0% |
| Costa Rica | 41 | 0.0% |
| Cuba | 213 | 0.2% |
| Czechoslovakia | 76 | 0.1% |
| Dominica | 123 | 0.1% |
| Dominican Republic | 108 | 0.1% |
| Eastern Africa | 664 | 0.7% |
| Eastern Asia | 926 | 1.0% |
| Eastern Europe | 742 | 0.8% |
| Ecuador | 54 | 0.1% |
| El Salvador | 287 | 0.3% |
| England | 159 | 0.2% |
| Ethiopia | 41 | 0.0% |
| Europe | 1,841 | 2.0% |
| France | 30 | 0.0% |
| Germany | 156 | 0.2% |
| Ghana | 86 | 0.1% |
| Greece | 10 | 0.0% |
| Guatemala | 146 | 0.2% |
| Haiti | 45 | 0.1% |
| Honduras | 183 | 0.2% |
| Hong Kong | 26 | 0.0% |
| Hungary | 9 | 0.0% |
| India | 931 | 1.0% |
| Indonesia | 87 | 0.1% |
| Iran | 230 | 0.3% |
| Iraq | 45 | 0.1% |
| Ireland | 31 | 0.0% |
| Israel | 199 | 0.2% |
| Italy | 88 | 0.1% |
| Jamaica | 776 | 0.8% |
| Japan | 73 | 0.1% |
| Jordan | 47 | 0.1% |
| Kazakhstan | 21 | 0.0% |
| Kenya | 235 | 0.3% |
| Korea | 427 | 0.5% |
| Kuwait | 80 | 0.1% |
| Laos | 8 | 0.0% |
| Latin America | 9,677 | 10.4% |
| Latvia | 16 | 0.0% |
| Lebanon | 32 | 0.0% |
| Malaysia | 207 | 0.2% |
| Mexico | 3,775 | 4.1% |
| Micronesia | 20 | 0.0% |
| Middle Africa | 92 | 0.1% |
| Moldova | 40 | 0.0% |
| Morocco | 25 | 0.0% |
| Nepal | 153 | 0.2% |
| Netherlands | 34 | 0.0% |
| Nigeria | 198 | 0.2% |
| Northern Africa | 168 | 0.2% |
| Northern Europe | 563 | 0.6% |
| Oceania | 71 | 0.1% |
| Pakistan | 65 | 0.1% |
| Panama | 18 | 0.0% |
| Peru | 237 | 0.3% |
| Philippines | 420 | 0.4% |
| Poland | 38 | 0.0% |
| Portugal | 48 | 0.1% |
| Romania | 131 | 0.1% |
| Russia | 234 | 0.3% |
| Saudi Arabia | 83 | 0.1% |
| Senegal | 15 | 0.0% |
| Singapore | 20 | 0.0% |
| South Africa | 56 | 0.1% |
| South America | 3,762 | 4.1% |
| South Central Asia | 1,422 | 1.5% |
| South Eastern Asia | 1,005 | 1.1% |
| Southern Europe | 197 | 0.2% |
| Spain | 51 | 0.1% |
| St. Vincent and the Grenadines | 13 | 0.0% |
| Sudan | 79 | 0.1% |
| Syria | 151 | 0.2% |
| Taiwan | 52 | 0.1% |
| Thailand | 51 | 0.1% |
| Trinidad and Tobago | 64 | 0.1% |
| Turkey | 52 | 0.1% |
| Ukraine | 16 | 0.0% |
| Uruguay | 93 | 0.1% |
| Uzbekistan | 4 | 0.0% |
| Venezuela | 760 | 0.8% |
| Vietnam | 181 | 0.2% |
| Western Africa | 411 | 0.4% |
| Western Asia | 716 | 0.8% |
| Western Europe | 339 | 0.4% |
| Zaire | 92 | 0.1% |
| Zimbabwe | 14 | 0.0% | View All 104 Rows |
Sex and Age in Roswell
Sex and Age in Roswell
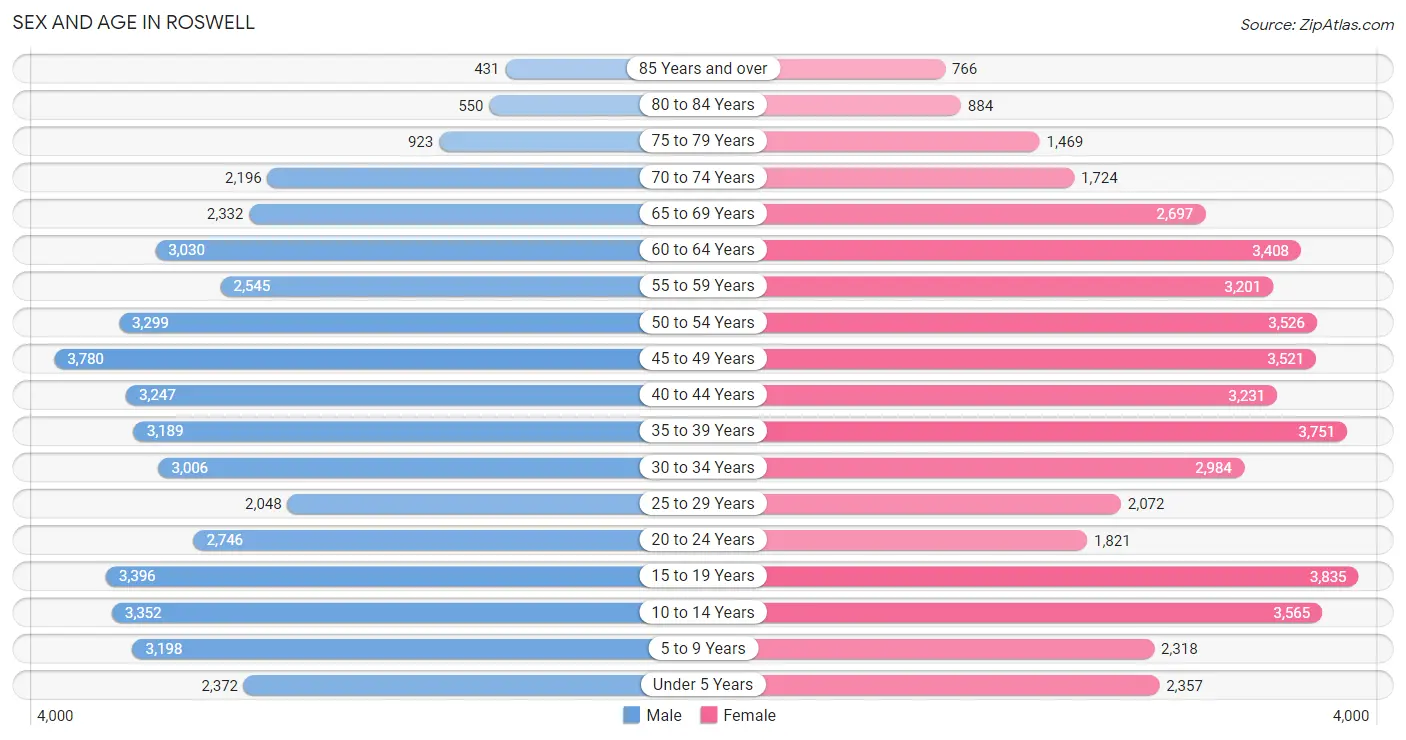
The most populous age groups in Roswell are 45 to 49 Years (3,780 | 8.3%) for men and 15 to 19 Years (3,835 | 8.1%) for women.
| Age Bracket | Male | Female |
| Under 5 Years | 2,372 (5.2%) | 2,357 (5.0%) |
| 5 to 9 Years | 3,198 (7.0%) | 2,318 (4.9%) |
| 10 to 14 Years | 3,352 (7.3%) | 3,565 (7.6%) |
| 15 to 19 Years | 3,396 (7.4%) | 3,835 (8.1%) |
| 20 to 24 Years | 2,746 (6.0%) | 1,821 (3.9%) |
| 25 to 29 Years | 2,048 (4.5%) | 2,072 (4.4%) |
| 30 to 34 Years | 3,006 (6.6%) | 2,984 (6.3%) |
| 35 to 39 Years | 3,189 (7.0%) | 3,751 (8.0%) |
| 40 to 44 Years | 3,247 (7.1%) | 3,231 (6.9%) |
| 45 to 49 Years | 3,780 (8.3%) | 3,521 (7.5%) |
| 50 to 54 Years | 3,299 (7.2%) | 3,526 (7.5%) |
| 55 to 59 Years | 2,545 (5.6%) | 3,201 (6.8%) |
| 60 to 64 Years | 3,030 (6.6%) | 3,408 (7.2%) |
| 65 to 69 Years | 2,332 (5.1%) | 2,697 (5.7%) |
| 70 to 74 Years | 2,196 (4.8%) | 1,724 (3.7%) |
| 75 to 79 Years | 923 (2.0%) | 1,469 (3.1%) |
| 80 to 84 Years | 550 (1.2%) | 884 (1.9%) |
| 85 Years and over | 431 (0.9%) | 766 (1.6%) |
| Total | 45,640 (100.0%) | 47,130 (100.0%) |
Families and Households in Roswell
Median Family Size in Roswell
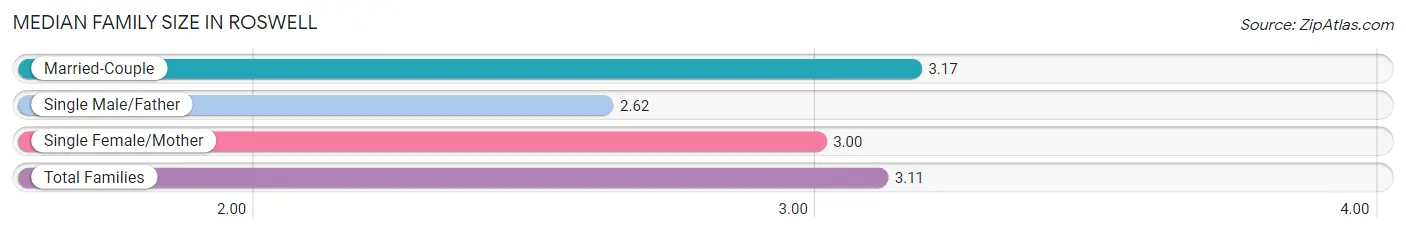
The median family size in Roswell is 3.11 persons per family, with married-couple families (19,517 | 80.2%) accounting for the largest median family size of 3.17 persons per family. On the other hand, single male/father families (1,741 | 7.2%) represent the smallest median family size with 2.62 persons per family.
| Family Type | # Families | Family Size |
| Married-Couple | 19,517 (80.2%) | 3.17 |
| Single Male/Father | 1,741 (7.2%) | 2.62 |
| Single Female/Mother | 3,066 (12.6%) | 3.00 |
| Total Families | 24,324 (100.0%) | 3.11 |
Median Household Size in Roswell
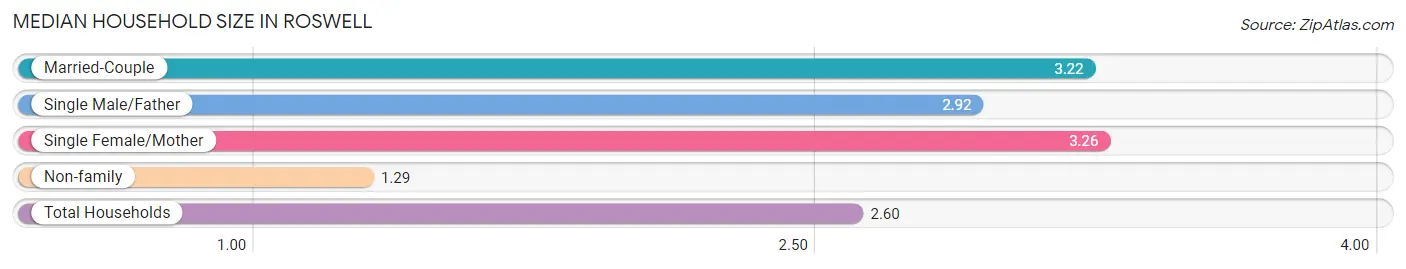
The median household size in Roswell is 2.60 persons per household, with single female/mother households (3,066 | 8.6%) accounting for the largest median household size of 3.26 persons per household. non-family households (11,111 | 31.4%) represent the smallest median household size with 1.29 persons per household.
| Household Type | # Households | Household Size |
| Married-Couple | 19,517 (55.1%) | 3.22 |
| Single Male/Father | 1,741 (4.9%) | 2.92 |
| Single Female/Mother | 3,066 (8.6%) | 3.26 |
| Non-family | 11,111 (31.4%) | 1.29 |
| Total Households | 35,435 (100.0%) | 2.60 |
Household Size by Marriage Status in Roswell
Out of a total of 35,435 households in Roswell, 24,324 (68.6%) are family households, while 11,111 (31.4%) are nonfamily households. The most numerous type of family households are 2-person households, comprising 10,575, and the most common type of nonfamily households are 1-person households, comprising 8,648.
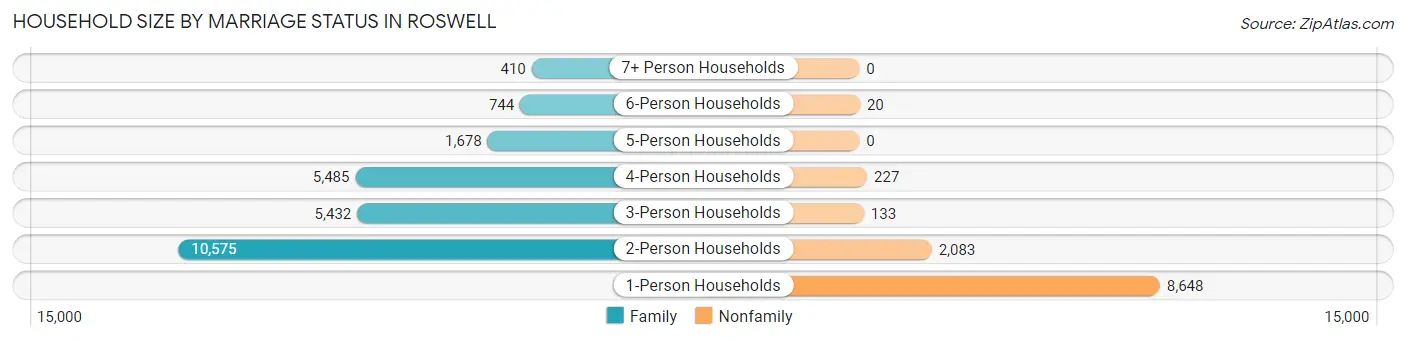
| Household Size | Family Households | Nonfamily Households |
| 1-Person Households | - | 8,648 (24.4%) |
| 2-Person Households | 10,575 (29.8%) | 2,083 (5.9%) |
| 3-Person Households | 5,432 (15.3%) | 133 (0.4%) |
| 4-Person Households | 5,485 (15.5%) | 227 (0.6%) |
| 5-Person Households | 1,678 (4.7%) | 0 (0.0%) |
| 6-Person Households | 744 (2.1%) | 20 (0.1%) |
| 7+ Person Households | 410 (1.2%) | 0 (0.0%) |
| Total | 24,324 (68.6%) | 11,111 (31.4%) |
Female Fertility in Roswell
Fertility by Age in Roswell
Average fertility rate in Roswell is 45.0 births per 1,000 women. Women in the age bracket of 20 to 34 years have the highest fertility rate with 71.0 births per 1,000 women. Women in the age bracket of 20 to 34 years acount for 50.0% of all women with births.
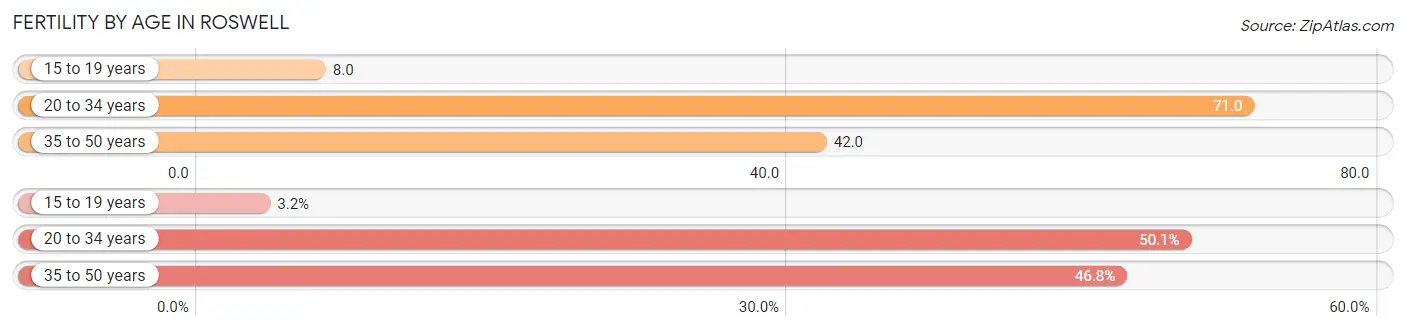
| Age Bracket | Women with Births | Births / 1,000 Women |
| 15 to 19 years | 31 (3.2%) | 8.0 |
| 20 to 34 years | 490 (50.0%) | 71.0 |
| 35 to 50 years | 458 (46.8%) | 42.0 |
| Total | 979 (100.0%) | 45.0 |
Fertility by Age by Marriage Status in Roswell
79.4% of women with births (979) in Roswell are married. The highest percentage of unmarried women with births falls into 15 to 19 years age bracket with 100.0% of them unmarried at the time of birth, while the lowest percentage of unmarried women with births belong to 35 to 50 years age bracket with 1.7% of them unmarried.
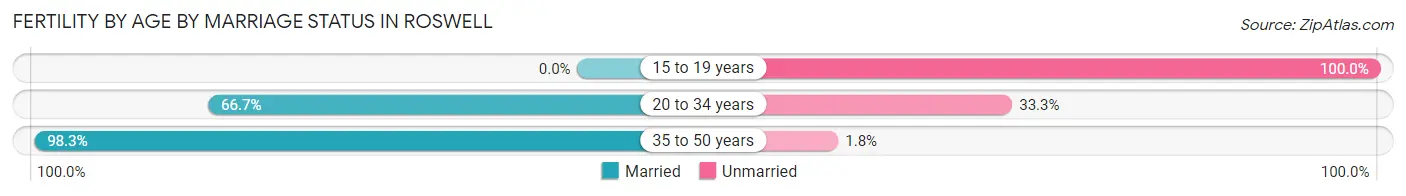
| Age Bracket | Married | Unmarried |
| 15 to 19 years | 0 (0.0%) | 31 (100.0%) |
| 20 to 34 years | 327 (66.7%) | 163 (33.3%) |
| 35 to 50 years | 450 (98.3%) | 8 (1.8%) |
| Total | 777 (79.4%) | 202 (20.6%) |
Fertility by Education in Roswell
Average fertility rate in Roswell is 45.0 births per 1,000 women. Women with the education attainment of bachelor's degree have the highest fertility rate of 68.0 births per 1,000 women, while women with the education attainment of less than high school have the lowest fertility at 16.0 births per 1,000 women. Women with the education attainment of bachelor's degree represent 52.1% of all women with births.
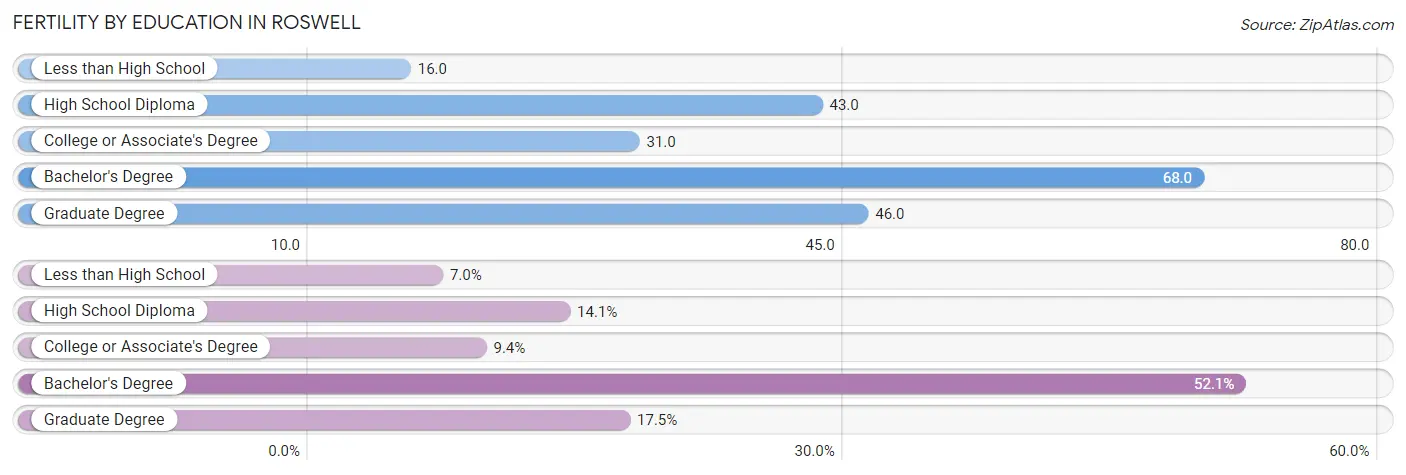
| Educational Attainment | Women with Births | Births / 1,000 Women |
| Less than High School | 68 (7.0%) | 16.0 |
| High School Diploma | 138 (14.1%) | 43.0 |
| College or Associate's Degree | 92 (9.4%) | 31.0 |
| Bachelor's Degree | 510 (52.1%) | 68.0 |
| Graduate Degree | 171 (17.5%) | 46.0 |
| Total | 979 (100.0%) | 45.0 |
Fertility by Education by Marriage Status in Roswell
20.6% of women with births in Roswell are unmarried. Women with the educational attainment of graduate degree are most likely to be married with 100.0% of them married at childbirth, while women with the educational attainment of high school diploma are least likely to be married with 65.2% of them unmarried at childbirth.
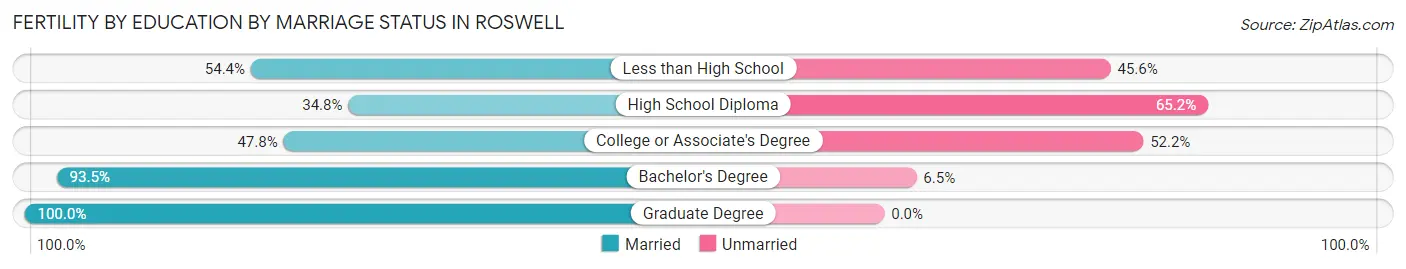
| Educational Attainment | Married | Unmarried |
| Less than High School | 37 (54.4%) | 31 (45.6%) |
| High School Diploma | 48 (34.8%) | 90 (65.2%) |
| College or Associate's Degree | 44 (47.8%) | 48 (52.2%) |
| Bachelor's Degree | 477 (93.5%) | 33 (6.5%) |
| Graduate Degree | 171 (100.0%) | 0 (0.0%) |
| Total | 777 (79.4%) | 202 (20.6%) |
Employment Characteristics in Roswell
Employment by Class of Employer in Roswell
Among the 48,720 employed individuals in Roswell, private company employees (35,712 | 73.3%), self-employed (not incorporated) (3,300 | 6.8%), and self-employed (incorporated) (3,133 | 6.4%) make up the most common classes of employment.
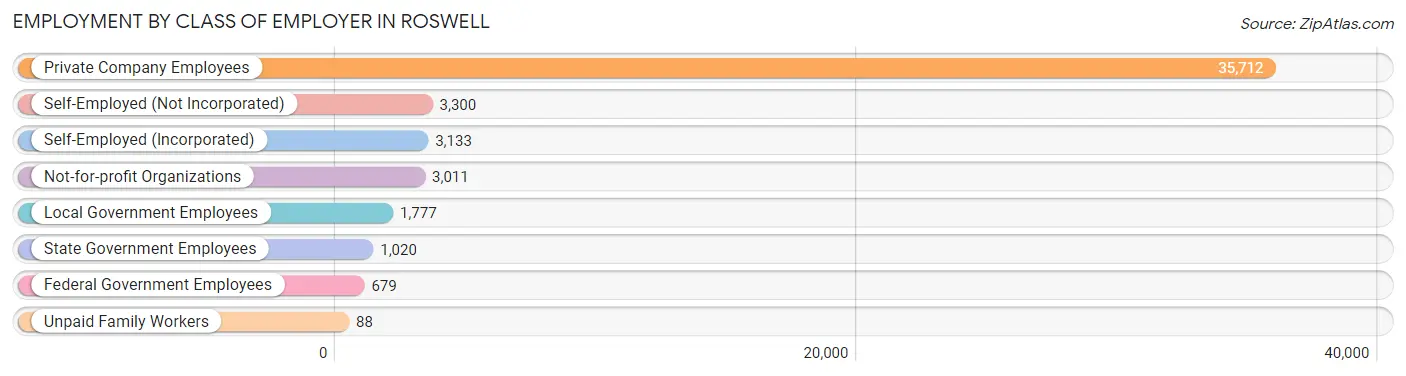
| Employer Class | # Employees | % Employees |
| Private Company Employees | 35,712 | 73.3% |
| Self-Employed (Incorporated) | 3,133 | 6.4% |
| Self-Employed (Not Incorporated) | 3,300 | 6.8% |
| Not-for-profit Organizations | 3,011 | 6.2% |
| Local Government Employees | 1,777 | 3.6% |
| State Government Employees | 1,020 | 2.1% |
| Federal Government Employees | 679 | 1.4% |
| Unpaid Family Workers | 88 | 0.2% |
| Total | 48,720 | 100.0% |
Employment Status by Age in Roswell
According to the labor force statistics for Roswell, out of the total population over 16 years of age (73,584), 70.0% or 51,509 individuals are in the labor force, with 4.3% or 2,215 of them unemployed. The age group with the highest labor force participation rate is 25 to 29 years, with 92.3% or 3,803 individuals in the labor force. Within the labor force, the 16 to 19 years age range has the highest percentage of unemployed individuals, with 15.0% or 354 of them being unemployed.
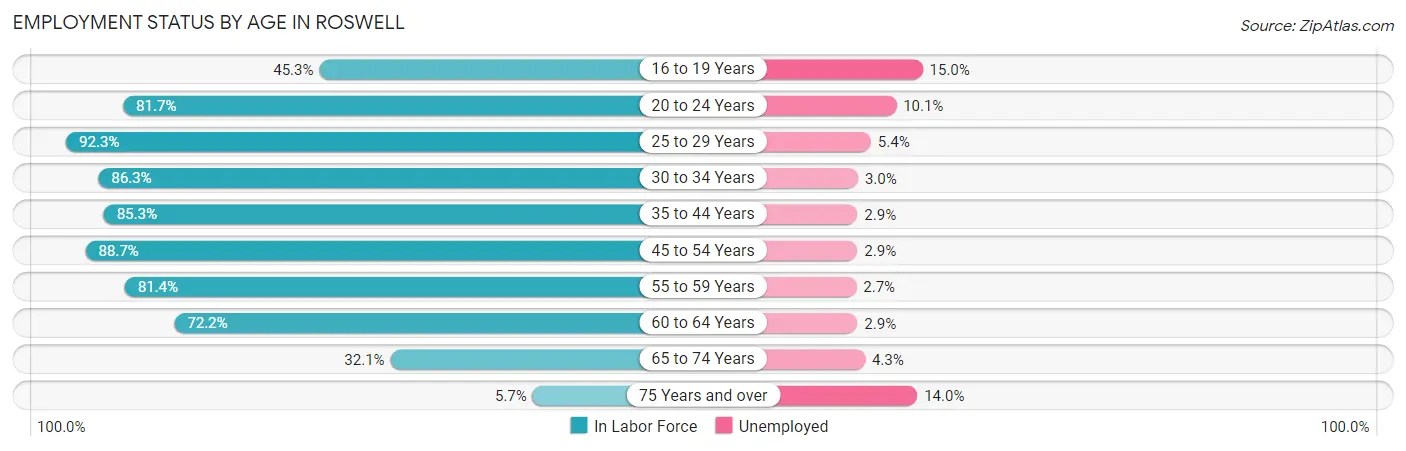
| Age Bracket | In Labor Force | Unemployed |
| 16 to 19 Years | 2,359 (45.3%) | 354 (15.0%) |
| 20 to 24 Years | 3,731 (81.7%) | 377 (10.1%) |
| 25 to 29 Years | 3,803 (92.3%) | 205 (5.4%) |
| 30 to 34 Years | 5,169 (86.3%) | 155 (3.0%) |
| 35 to 44 Years | 11,446 (85.3%) | 332 (2.9%) |
| 45 to 54 Years | 12,530 (88.7%) | 363 (2.9%) |
| 55 to 59 Years | 4,677 (81.4%) | 126 (2.7%) |
| 60 to 64 Years | 4,648 (72.2%) | 135 (2.9%) |
| 65 to 74 Years | 2,873 (32.1%) | 124 (4.3%) |
| 75 Years and over | 286 (5.7%) | 40 (14.0%) |
| Total | 51,509 (70.0%) | 2,215 (4.3%) |
Employment Status by Educational Attainment in Roswell
According to labor force statistics for Roswell, 84.8% of individuals (42,263) out of the total population between 25 and 64 years of age (49,838) are in the labor force, with 3.1% or 1,310 of them being unemployed. The group with the highest labor force participation rate are those with the educational attainment of bachelor's degree or higher, with 87.1% or 27,909 individuals in the labor force. Within the labor force, individuals with less than high school education have the highest percentage of unemployment, with 3.4% or 61 of them being unemployed.
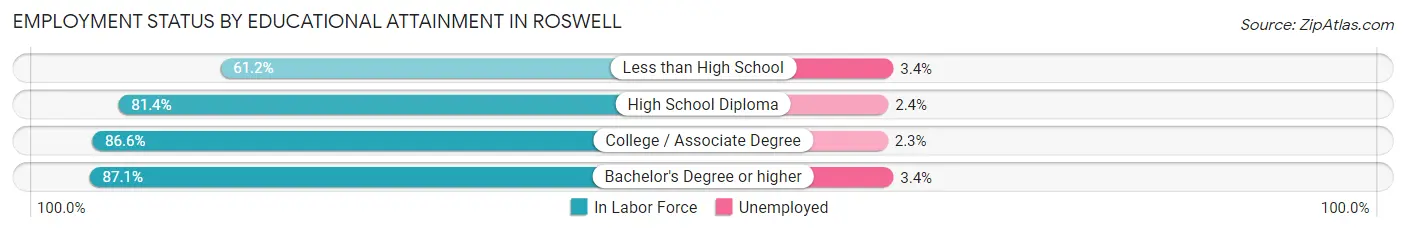
| Educational Attainment | In Labor Force | Unemployed |
| Less than High School | 1,794 (61.2%) | 100 (3.4%) |
| High School Diploma | 4,970 (81.4%) | 147 (2.4%) |
| College / Associate Degree | 7,585 (86.6%) | 201 (2.3%) |
| Bachelor's Degree or higher | 27,909 (87.1%) | 1,089 (3.4%) |
| Total | 42,263 (84.8%) | 1,545 (3.1%) |
Employment Occupations by Sex in Roswell
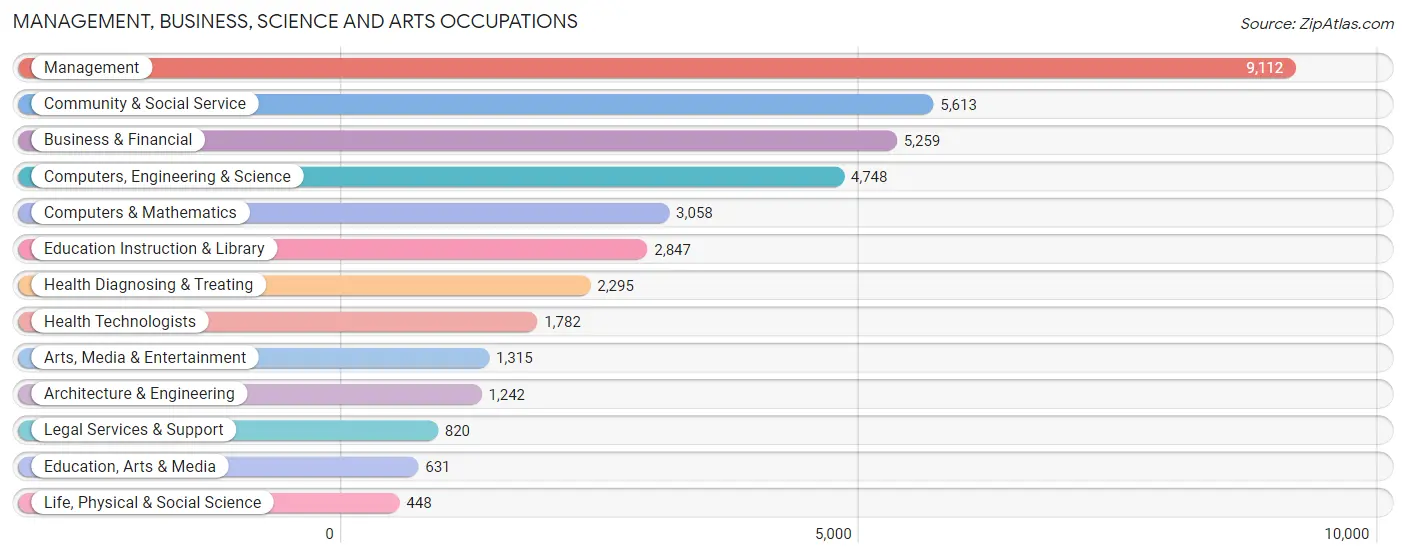
Management, Business, Science and Arts Occupations
The most common Management, Business, Science and Arts occupations in Roswell are Management (9,112 | 18.5%), Community & Social Service (5,613 | 11.4%), Business & Financial (5,259 | 10.7%), Computers, Engineering & Science (4,748 | 9.6%), and Computers & Mathematics (3,058 | 6.2%).
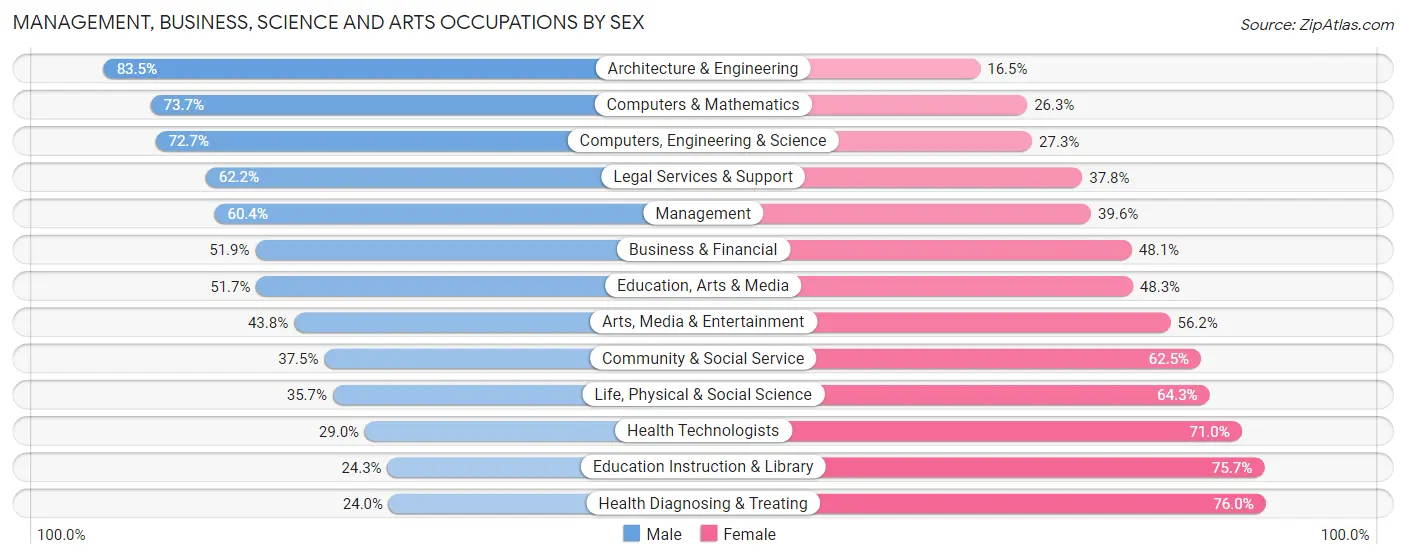
Management, Business, Science and Arts Occupations by Sex
Within the Management, Business, Science and Arts occupations in Roswell, the most male-oriented occupations are Architecture & Engineering (83.5%), Computers & Mathematics (73.7%), and Computers, Engineering & Science (72.7%), while the most female-oriented occupations are Health Diagnosing & Treating (76.0%), Education Instruction & Library (75.7%), and Health Technologists (71.0%).
| Occupation | Male | Female |
| Management | 5,501 (60.4%) | 3,611 (39.6%) |
| Business & Financial | 2,728 (51.9%) | 2,531 (48.1%) |
| Computers, Engineering & Science | 3,451 (72.7%) | 1,297 (27.3%) |
| Computers & Mathematics | 2,254 (73.7%) | 804 (26.3%) |
| Architecture & Engineering | 1,037 (83.5%) | 205 (16.5%) |
| Life, Physical & Social Science | 160 (35.7%) | 288 (64.3%) |
| Community & Social Service | 2,104 (37.5%) | 3,509 (62.5%) |
| Education, Arts & Media | 326 (51.7%) | 305 (48.3%) |
| Legal Services & Support | 510 (62.2%) | 310 (37.8%) |
| Education Instruction & Library | 692 (24.3%) | 2,155 (75.7%) |
| Arts, Media & Entertainment | 576 (43.8%) | 739 (56.2%) |
| Health Diagnosing & Treating | 551 (24.0%) | 1,744 (76.0%) |
| Health Technologists | 517 (29.0%) | 1,265 (71.0%) |
| Total (Category) | 14,335 (53.0%) | 12,692 (47.0%) |
| Total (Overall) | 26,820 (54.4%) | 22,445 (45.6%) |
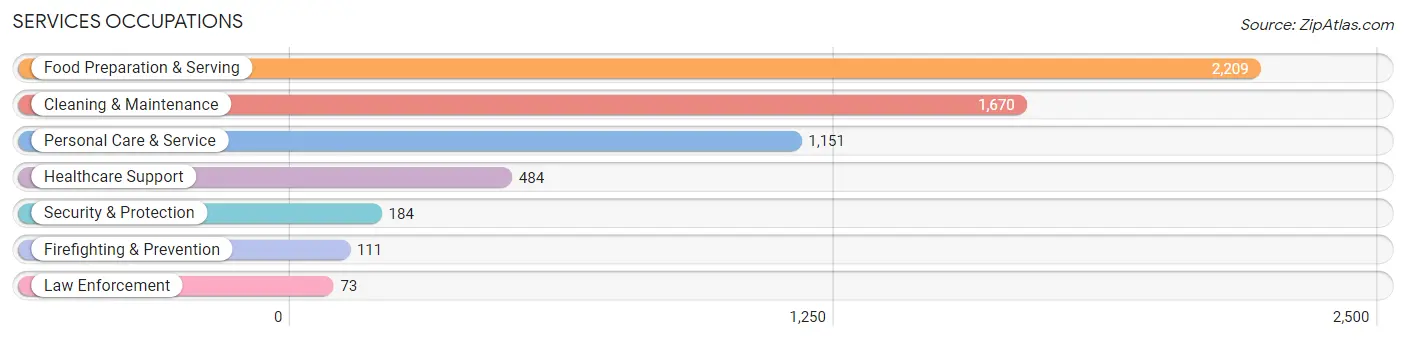
Services Occupations
The most common Services occupations in Roswell are Food Preparation & Serving (2,209 | 4.5%), Cleaning & Maintenance (1,670 | 3.4%), Personal Care & Service (1,151 | 2.3%), Healthcare Support (484 | 1.0%), and Security & Protection (184 | 0.4%).
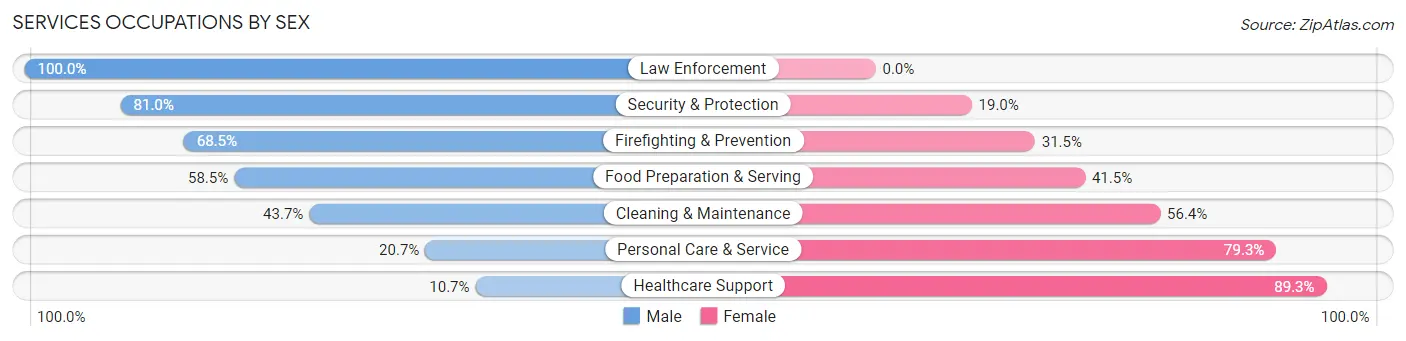
Services Occupations by Sex
Within the Services occupations in Roswell, the most male-oriented occupations are Law Enforcement (100.0%), Security & Protection (81.0%), and Firefighting & Prevention (68.5%), while the most female-oriented occupations are Healthcare Support (89.3%), Personal Care & Service (79.3%), and Cleaning & Maintenance (56.4%).
| Occupation | Male | Female |
| Healthcare Support | 52 (10.7%) | 432 (89.3%) |
| Security & Protection | 149 (81.0%) | 35 (19.0%) |
| Firefighting & Prevention | 76 (68.5%) | 35 (31.5%) |
| Law Enforcement | 73 (100.0%) | 0 (0.0%) |
| Food Preparation & Serving | 1,293 (58.5%) | 916 (41.5%) |
| Cleaning & Maintenance | 729 (43.6%) | 941 (56.4%) |
| Personal Care & Service | 238 (20.7%) | 913 (79.3%) |
| Total (Category) | 2,461 (43.2%) | 3,237 (56.8%) |
| Total (Overall) | 26,820 (54.4%) | 22,445 (45.6%) |
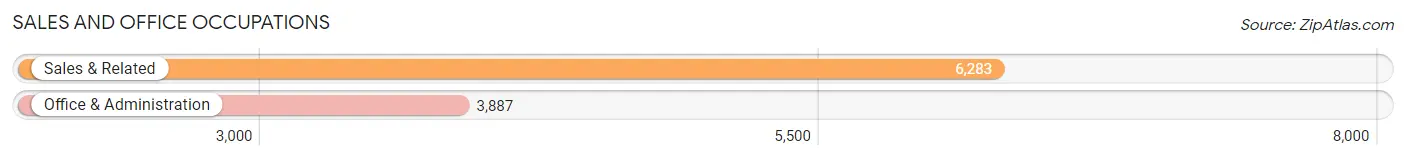
Sales and Office Occupations
The most common Sales and Office occupations in Roswell are Sales & Related (6,283 | 12.8%), and Office & Administration (3,887 | 7.9%).
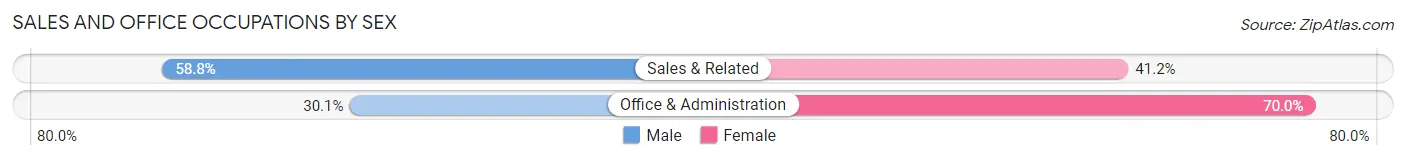
Sales and Office Occupations by Sex
| Occupation | Male | Female |
| Sales & Related | 3,694 (58.8%) | 2,589 (41.2%) |
| Office & Administration | 1,168 (30.0%) | 2,719 (70.0%) |
| Total (Category) | 4,862 (47.8%) | 5,308 (52.2%) |
| Total (Overall) | 26,820 (54.4%) | 22,445 (45.6%) |
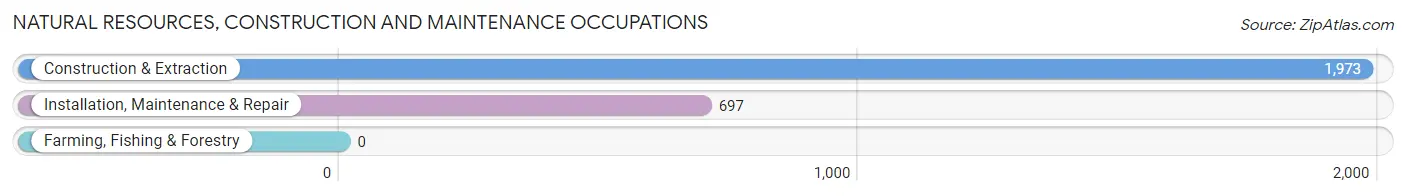
Natural Resources, Construction and Maintenance Occupations
The most common Natural Resources, Construction and Maintenance occupations in Roswell are Construction & Extraction (1,973 | 4.0%), and Installation, Maintenance & Repair (697 | 1.4%).
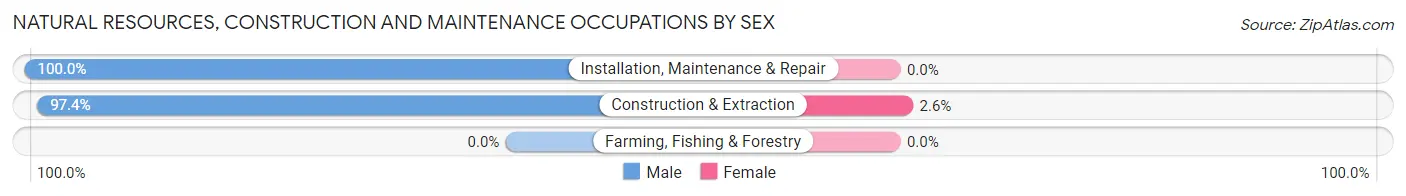
Natural Resources, Construction and Maintenance Occupations by Sex
| Occupation | Male | Female |
| Farming, Fishing & Forestry | 0 (0.0%) | 0 (0.0%) |
| Construction & Extraction | 1,921 (97.4%) | 52 (2.6%) |
| Installation, Maintenance & Repair | 697 (100.0%) | 0 (0.0%) |
| Total (Category) | 2,618 (98.1%) | 52 (1.9%) |
| Total (Overall) | 26,820 (54.4%) | 22,445 (45.6%) |
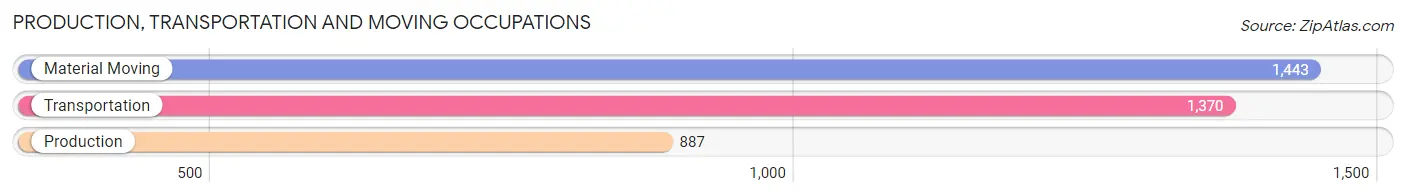
Production, Transportation and Moving Occupations
The most common Production, Transportation and Moving occupations in Roswell are Material Moving (1,443 | 2.9%), Transportation (1,370 | 2.8%), and Production (887 | 1.8%).
Production, Transportation and Moving Occupations by Sex
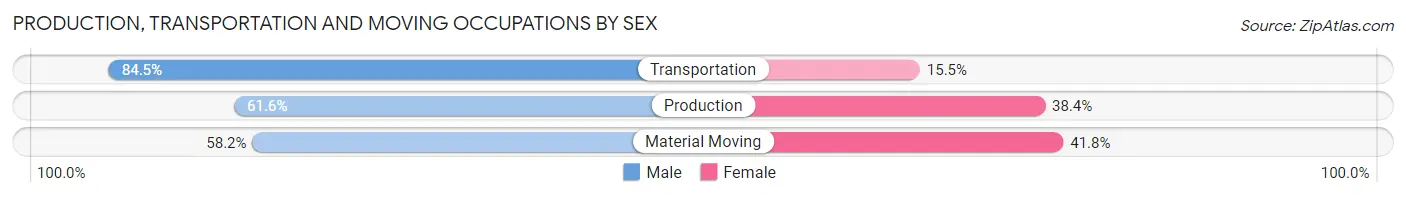
| Occupation | Male | Female |
| Production | 546 (61.6%) | 341 (38.4%) |
| Transportation | 1,158 (84.5%) | 212 (15.5%) |
| Material Moving | 840 (58.2%) | 603 (41.8%) |
| Total (Category) | 2,544 (68.8%) | 1,156 (31.2%) |
| Total (Overall) | 26,820 (54.4%) | 22,445 (45.6%) |
Employment Industries by Sex in Roswell
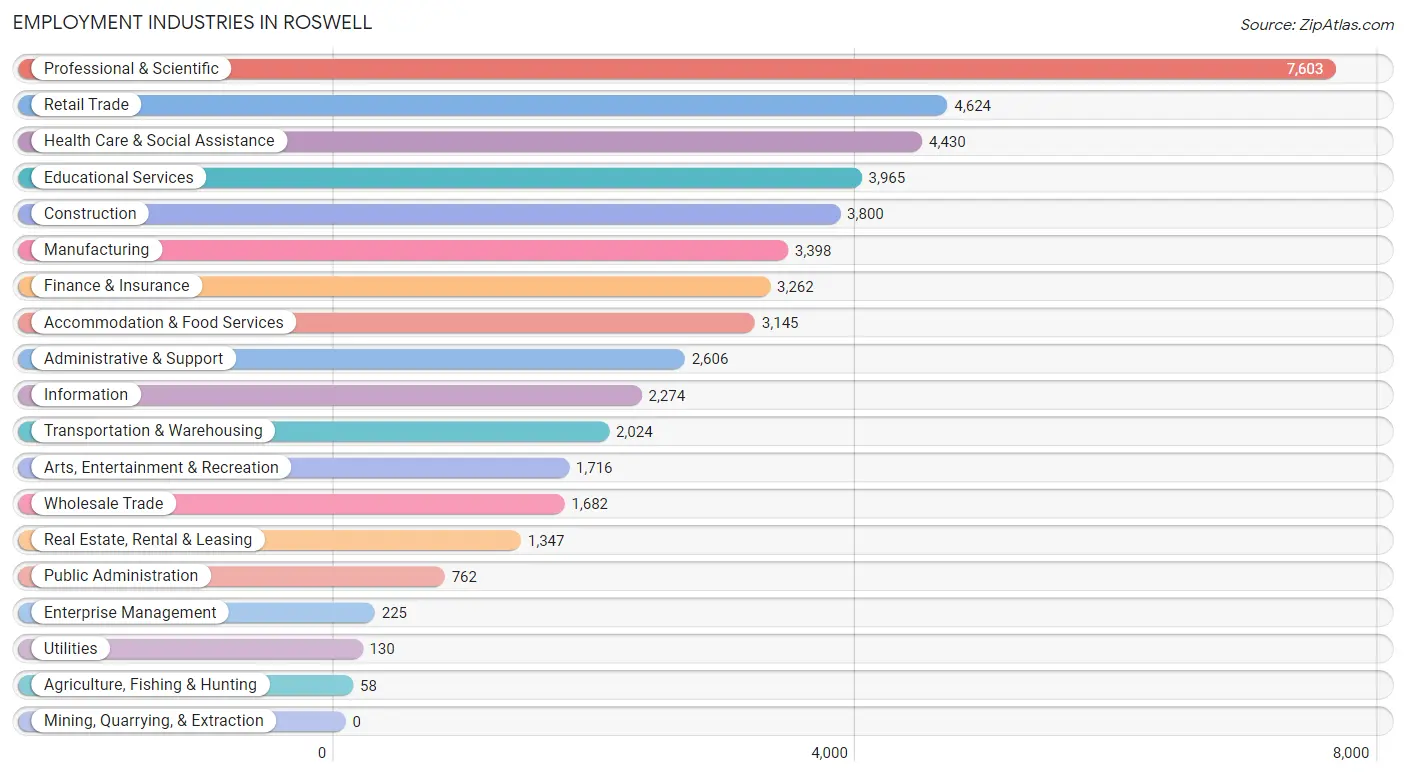
Employment Industries in Roswell
The major employment industries in Roswell include Professional & Scientific (7,603 | 15.4%), Retail Trade (4,624 | 9.4%), Health Care & Social Assistance (4,430 | 9.0%), Educational Services (3,965 | 8.1%), and Construction (3,800 | 7.7%).
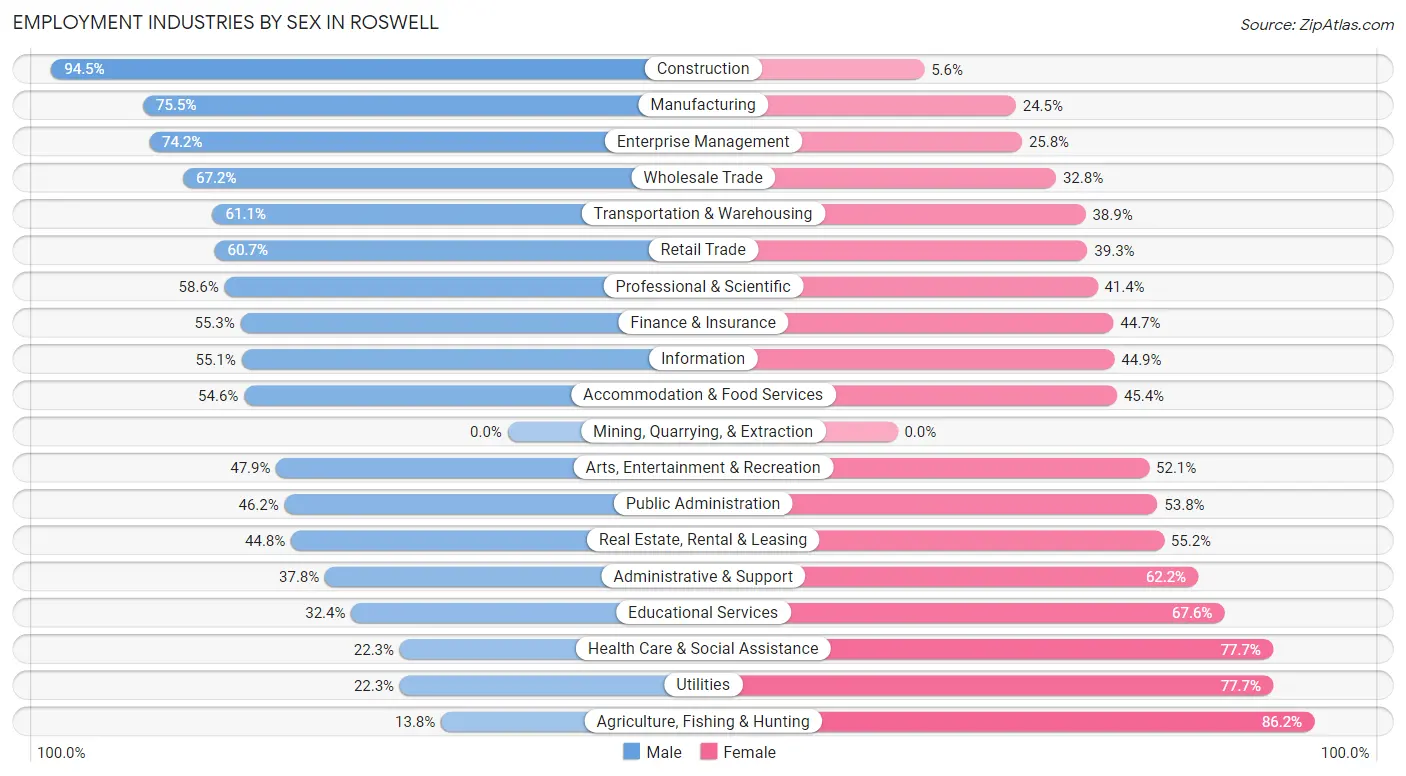
Employment Industries by Sex in Roswell
The Roswell industries that see more men than women are Construction (94.5%), Manufacturing (75.5%), and Enterprise Management (74.2%), whereas the industries that tend to have a higher number of women are Agriculture, Fishing & Hunting (86.2%), Utilities (77.7%), and Health Care & Social Assistance (77.7%).
| Industry | Male | Female |
| Agriculture, Fishing & Hunting | 8 (13.8%) | 50 (86.2%) |
| Mining, Quarrying, & Extraction | 0 (0.0%) | 0 (0.0%) |
| Construction | 3,589 (94.5%) | 211 (5.6%) |
| Manufacturing | 2,565 (75.5%) | 833 (24.5%) |
| Wholesale Trade | 1,130 (67.2%) | 552 (32.8%) |
| Retail Trade | 2,806 (60.7%) | 1,818 (39.3%) |
| Transportation & Warehousing | 1,236 (61.1%) | 788 (38.9%) |
| Utilities | 29 (22.3%) | 101 (77.7%) |
| Information | 1,253 (55.1%) | 1,021 (44.9%) |
| Finance & Insurance | 1,804 (55.3%) | 1,458 (44.7%) |
| Real Estate, Rental & Leasing | 604 (44.8%) | 743 (55.2%) |
| Professional & Scientific | 4,455 (58.6%) | 3,148 (41.4%) |
| Enterprise Management | 167 (74.2%) | 58 (25.8%) |
| Administrative & Support | 985 (37.8%) | 1,621 (62.2%) |
| Educational Services | 1,284 (32.4%) | 2,681 (67.6%) |
| Health Care & Social Assistance | 989 (22.3%) | 3,441 (77.7%) |
| Arts, Entertainment & Recreation | 822 (47.9%) | 894 (52.1%) |
| Accommodation & Food Services | 1,716 (54.6%) | 1,429 (45.4%) |
| Public Administration | 352 (46.2%) | 410 (53.8%) |
| Total | 26,820 (54.4%) | 22,445 (45.6%) |
Education in Roswell
School Enrollment in Roswell
The most common levels of schooling among the 23,858 students in Roswell are high school (6,727 | 28.2%), middle school (5,372 | 22.5%), and elementary school (4,963 | 20.8%).
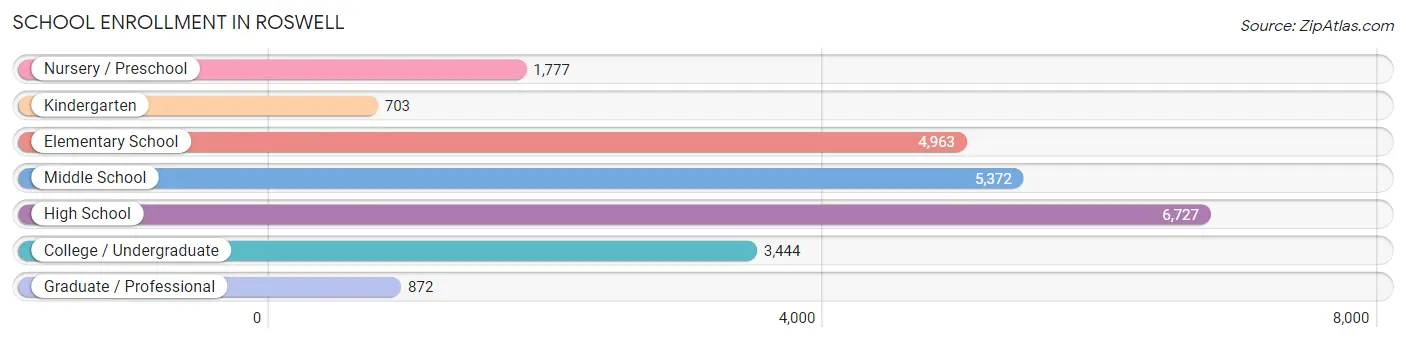
| School Level | # Students | % Students |
| Nursery / Preschool | 1,777 | 7.4% |
| Kindergarten | 703 | 2.9% |
| Elementary School | 4,963 | 20.8% |
| Middle School | 5,372 | 22.5% |
| High School | 6,727 | 28.2% |
| College / Undergraduate | 3,444 | 14.4% |
| Graduate / Professional | 872 | 3.6% |
| Total | 23,858 | 100.0% |
School Enrollment by Age by Funding Source in Roswell
Out of a total of 23,858 students who are enrolled in schools in Roswell, 5,201 (21.8%) attend a private institution, while the remaining 18,657 (78.2%) are enrolled in public schools. The age group of 3 to 4 year olds has the highest likelihood of being enrolled in private schools, with 749 (56.7% in the age bracket) enrolled. Conversely, the age group of 15 to 17 year olds has the lowest likelihood of being enrolled in a private school, with 4,259 (86.9% in the age bracket) attending a public institution.
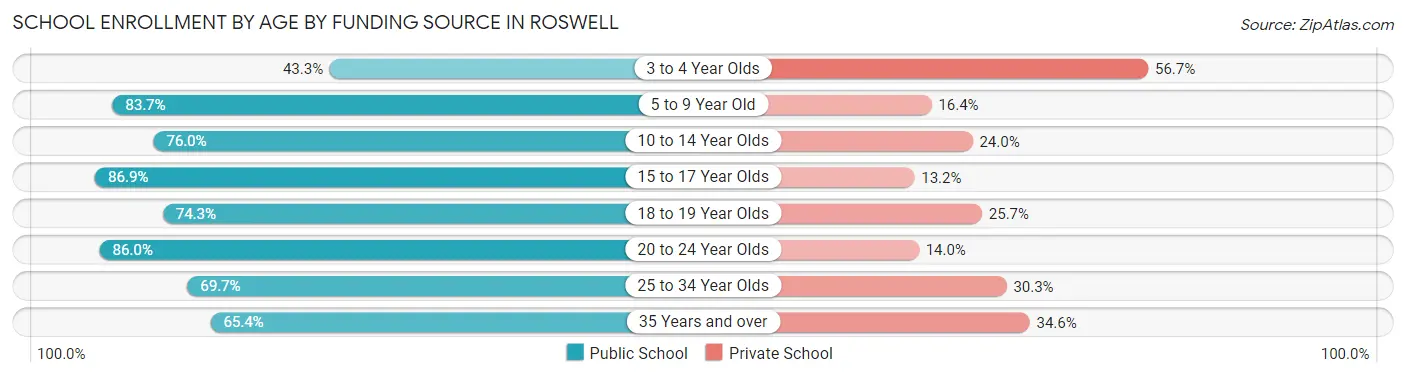
| Age Bracket | Public School | Private School |
| 3 to 4 Year Olds | 572 (43.3%) | 749 (56.7%) |
| 5 to 9 Year Old | 4,431 (83.7%) | 866 (16.4%) |
| 10 to 14 Year Olds | 5,246 (76.0%) | 1,656 (24.0%) |
| 15 to 17 Year Olds | 4,259 (86.9%) | 645 (13.2%) |
| 18 to 19 Year Olds | 1,186 (74.3%) | 411 (25.7%) |
| 20 to 24 Year Olds | 1,725 (86.0%) | 280 (14.0%) |
| 25 to 34 Year Olds | 570 (69.7%) | 248 (30.3%) |
| 35 Years and over | 663 (65.4%) | 351 (34.6%) |
| Total | 18,657 (78.2%) | 5,201 (21.8%) |
Educational Attainment by Field of Study in Roswell
Business (11,275 | 26.2%), social sciences (3,555 | 8.3%), engineering (3,525 | 8.2%), education (3,255 | 7.6%), and science & technology (3,189 | 7.4%) are the most common fields of study among 43,065 individuals in Roswell who have obtained a bachelor's degree or higher.
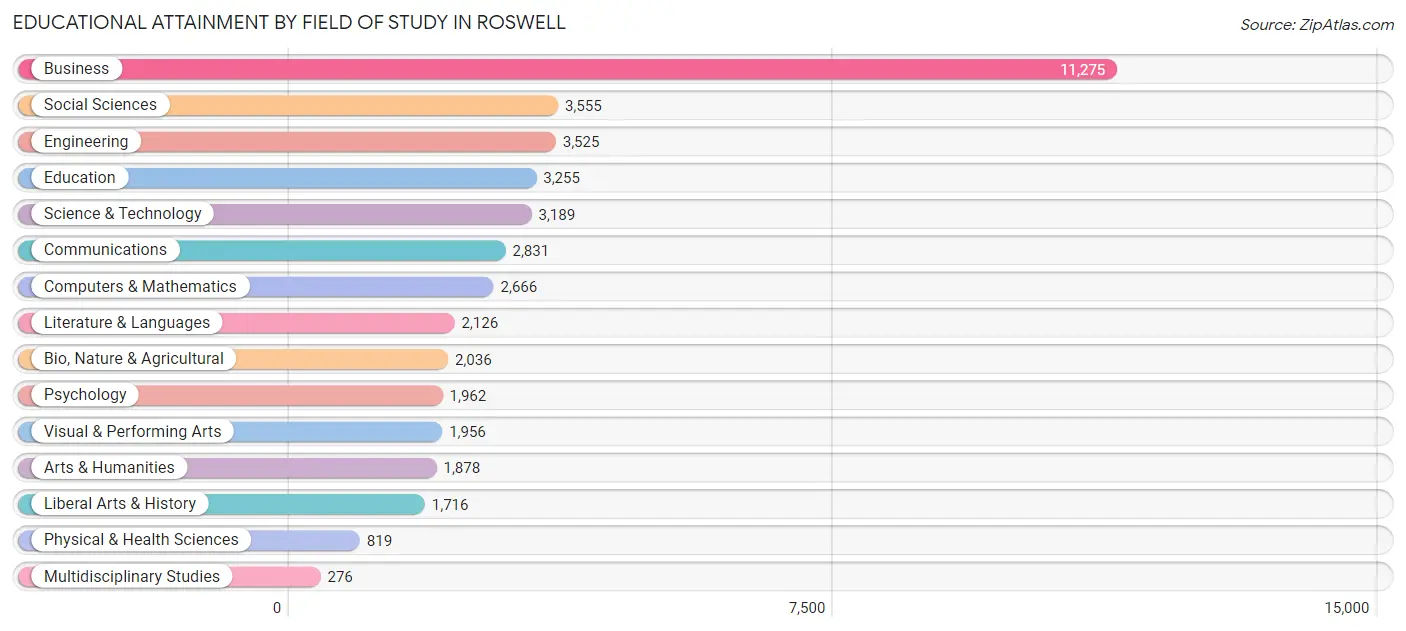
| Field of Study | # Graduates | % Graduates |
| Computers & Mathematics | 2,666 | 6.2% |
| Bio, Nature & Agricultural | 2,036 | 4.7% |
| Physical & Health Sciences | 819 | 1.9% |
| Psychology | 1,962 | 4.6% |
| Social Sciences | 3,555 | 8.3% |
| Engineering | 3,525 | 8.2% |
| Multidisciplinary Studies | 276 | 0.6% |
| Science & Technology | 3,189 | 7.4% |
| Business | 11,275 | 26.2% |
| Education | 3,255 | 7.6% |
| Literature & Languages | 2,126 | 4.9% |
| Liberal Arts & History | 1,716 | 4.0% |
| Visual & Performing Arts | 1,956 | 4.5% |
| Communications | 2,831 | 6.6% |
| Arts & Humanities | 1,878 | 4.4% |
| Total | 43,065 | 100.0% |
Transportation & Commute in Roswell
Vehicle Availability by Sex in Roswell
The most prevalent vehicle ownership categories in Roswell are males with 2 vehicles (13,195, accounting for 49.5%) and females with 2 vehicles (10,252, making up 59.9%).
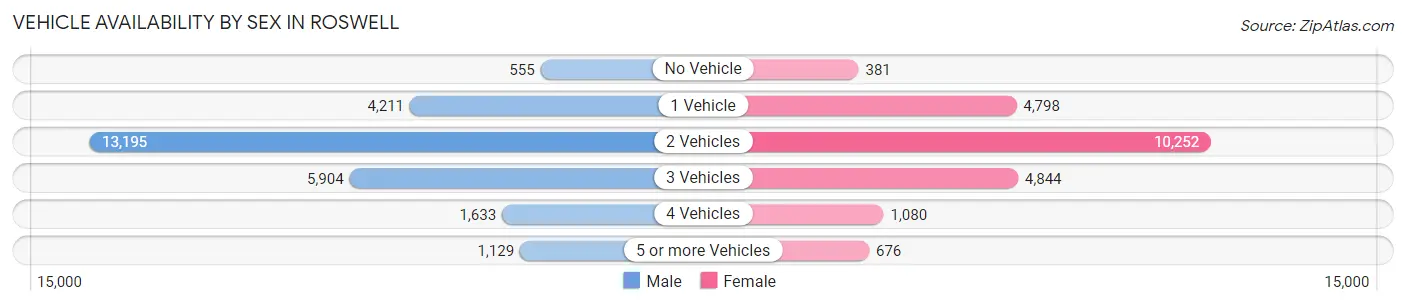
| Vehicles Available | Male | Female |
| No Vehicle | 555 (2.1%) | 381 (1.7%) |
| 1 Vehicle | 4,211 (15.8%) | 4,798 (21.8%) |
| 2 Vehicles | 13,195 (49.5%) | 10,252 (46.5%) |
| 3 Vehicles | 5,904 (22.2%) | 4,844 (22.0%) |
| 4 Vehicles | 1,633 (6.1%) | 1,080 (4.9%) |
| 5 or more Vehicles | 1,129 (4.2%) | 676 (3.1%) |
| Total | 26,627 (100.0%) | 22,031 (100.0%) |
Commute Time in Roswell
The most frequently occuring commute durations in Roswell are 30 to 34 minutes (5,625 commuters, 15.4%), 20 to 24 minutes (5,435 commuters, 14.9%), and 45 to 59 minutes (4,854 commuters, 13.3%).
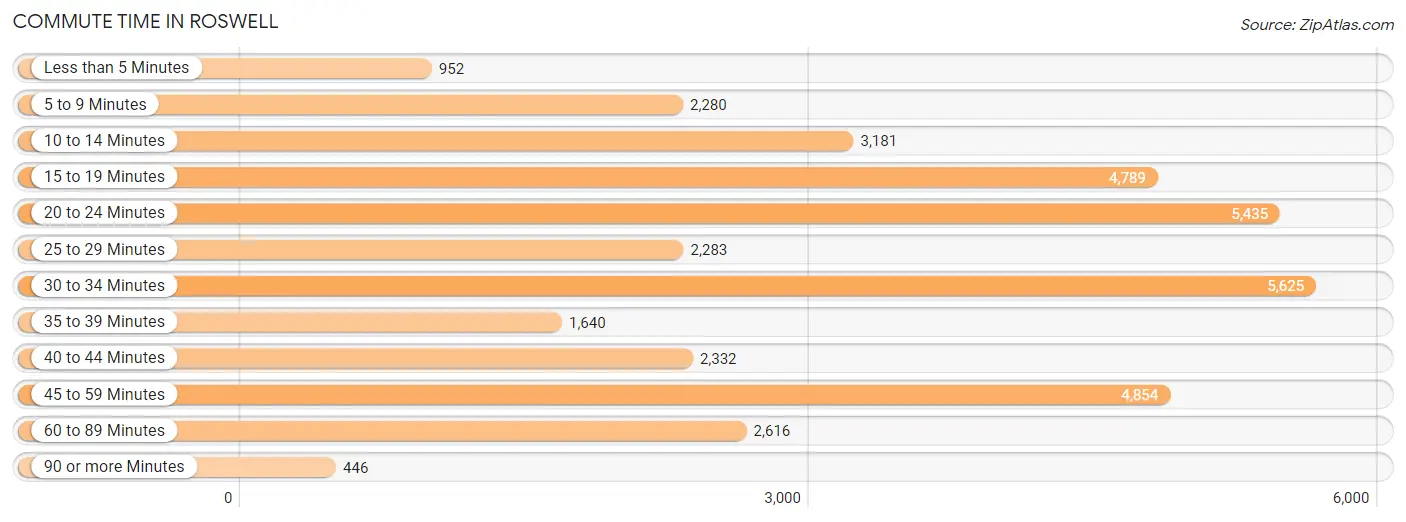
| Commute Time | # Commuters | % Commuters |
| Less than 5 Minutes | 952 | 2.6% |
| 5 to 9 Minutes | 2,280 | 6.3% |
| 10 to 14 Minutes | 3,181 | 8.7% |
| 15 to 19 Minutes | 4,789 | 13.1% |
| 20 to 24 Minutes | 5,435 | 14.9% |
| 25 to 29 Minutes | 2,283 | 6.3% |
| 30 to 34 Minutes | 5,625 | 15.4% |
| 35 to 39 Minutes | 1,640 | 4.5% |
| 40 to 44 Minutes | 2,332 | 6.4% |
| 45 to 59 Minutes | 4,854 | 13.3% |
| 60 to 89 Minutes | 2,616 | 7.2% |
| 90 or more Minutes | 446 | 1.2% |
Commute Time by Sex in Roswell
The most common commute times in Roswell are 45 to 59 minutes (3,097 commuters, 15.5%) for males and 30 to 34 minutes (2,820 commuters, 17.2%) for females.
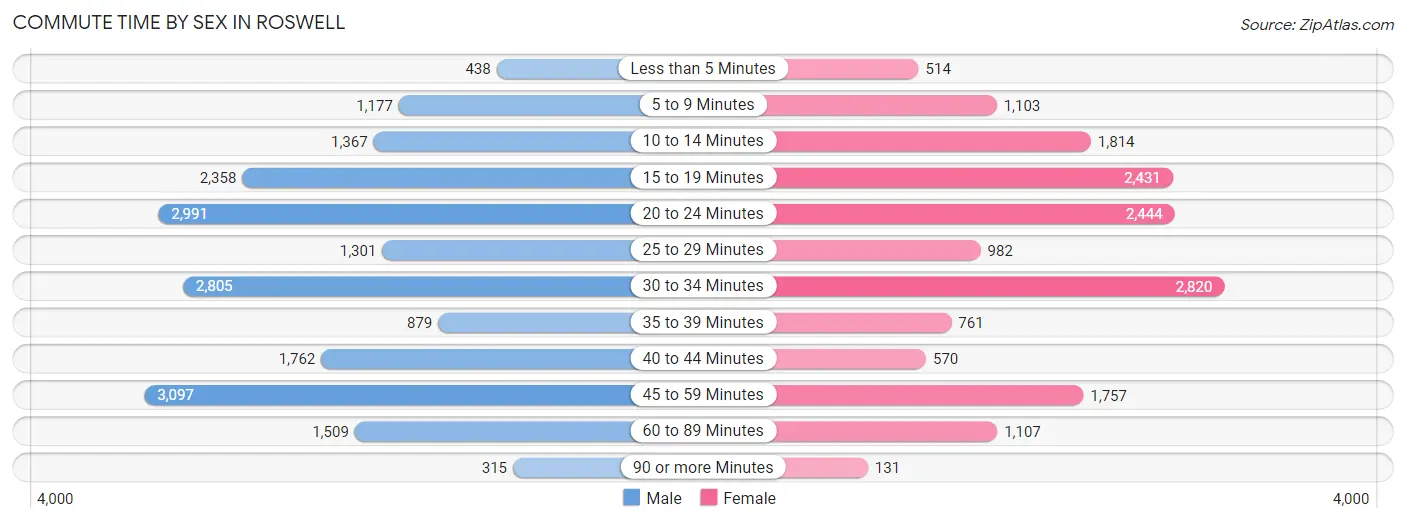
| Commute Time | Male | Female |
| Less than 5 Minutes | 438 (2.2%) | 514 (3.1%) |
| 5 to 9 Minutes | 1,177 (5.9%) | 1,103 (6.7%) |
| 10 to 14 Minutes | 1,367 (6.8%) | 1,814 (11.0%) |
| 15 to 19 Minutes | 2,358 (11.8%) | 2,431 (14.8%) |
| 20 to 24 Minutes | 2,991 (15.0%) | 2,444 (14.9%) |
| 25 to 29 Minutes | 1,301 (6.5%) | 982 (6.0%) |
| 30 to 34 Minutes | 2,805 (14.0%) | 2,820 (17.2%) |
| 35 to 39 Minutes | 879 (4.4%) | 761 (4.6%) |
| 40 to 44 Minutes | 1,762 (8.8%) | 570 (3.5%) |
| 45 to 59 Minutes | 3,097 (15.5%) | 1,757 (10.7%) |
| 60 to 89 Minutes | 1,509 (7.5%) | 1,107 (6.7%) |
| 90 or more Minutes | 315 (1.6%) | 131 (0.8%) |
Time of Departure to Work by Sex in Roswell
The most frequent times of departure to work in Roswell are 8:00 AM to 8:29 AM (3,507, 17.5%) for males and 8:00 AM to 8:29 AM (3,265, 19.9%) for females.
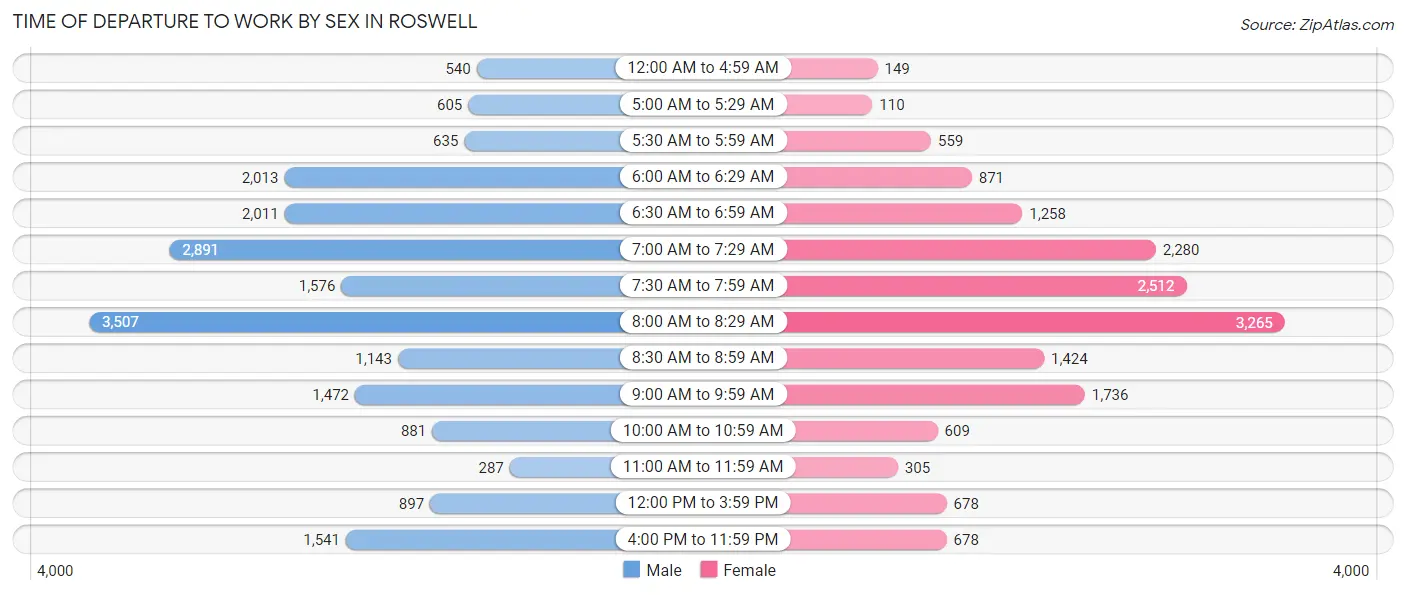
| Time of Departure | Male | Female |
| 12:00 AM to 4:59 AM | 540 (2.7%) | 149 (0.9%) |
| 5:00 AM to 5:29 AM | 605 (3.0%) | 110 (0.7%) |
| 5:30 AM to 5:59 AM | 635 (3.2%) | 559 (3.4%) |
| 6:00 AM to 6:29 AM | 2,013 (10.1%) | 871 (5.3%) |
| 6:30 AM to 6:59 AM | 2,011 (10.1%) | 1,258 (7.6%) |
| 7:00 AM to 7:29 AM | 2,891 (14.5%) | 2,280 (13.9%) |
| 7:30 AM to 7:59 AM | 1,576 (7.9%) | 2,512 (15.3%) |
| 8:00 AM to 8:29 AM | 3,507 (17.5%) | 3,265 (19.9%) |
| 8:30 AM to 8:59 AM | 1,143 (5.7%) | 1,424 (8.7%) |
| 9:00 AM to 9:59 AM | 1,472 (7.4%) | 1,736 (10.6%) |
| 10:00 AM to 10:59 AM | 881 (4.4%) | 609 (3.7%) |
| 11:00 AM to 11:59 AM | 287 (1.4%) | 305 (1.9%) |
| 12:00 PM to 3:59 PM | 897 (4.5%) | 678 (4.1%) |
| 4:00 PM to 11:59 PM | 1,541 (7.7%) | 678 (4.1%) |
| Total | 19,999 (100.0%) | 16,434 (100.0%) |
Housing Occupancy in Roswell
Occupancy by Ownership in Roswell
Of the total 35,435 dwellings in Roswell, owner-occupied units account for 25,075 (70.8%), while renter-occupied units make up 10,360 (29.2%).
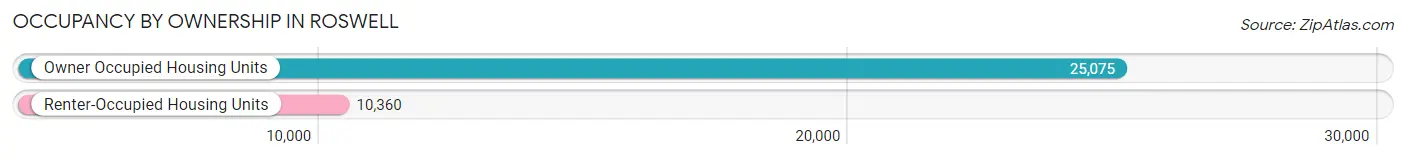
| Occupancy | # Housing Units | % Housing Units |
| Owner Occupied Housing Units | 25,075 | 70.8% |
| Renter-Occupied Housing Units | 10,360 | 29.2% |
| Total Occupied Housing Units | 35,435 | 100.0% |
Occupancy by Household Size in Roswell
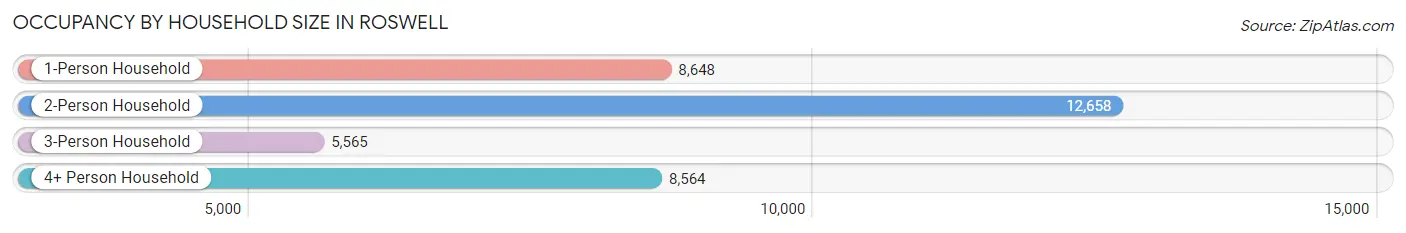
| Household Size | # Housing Units | % Housing Units |
| 1-Person Household | 8,648 | 24.4% |
| 2-Person Household | 12,658 | 35.7% |
| 3-Person Household | 5,565 | 15.7% |
| 4+ Person Household | 8,564 | 24.2% |
| Total Housing Units | 35,435 | 100.0% |
Occupancy by Ownership by Household Size in Roswell
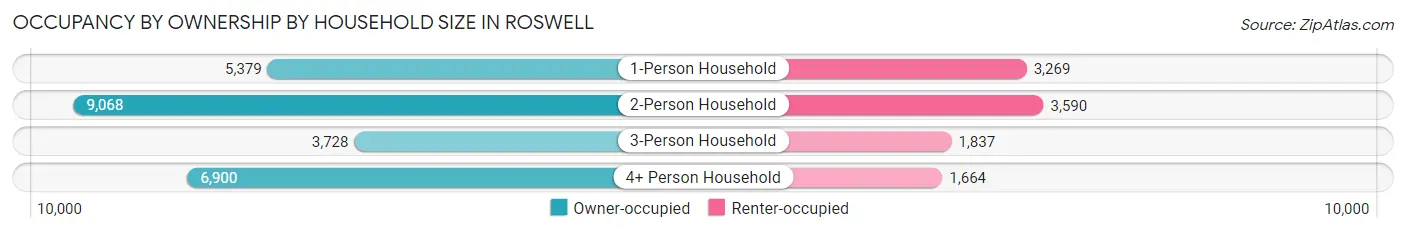
| Household Size | Owner-occupied | Renter-occupied |
| 1-Person Household | 5,379 (62.2%) | 3,269 (37.8%) |
| 2-Person Household | 9,068 (71.6%) | 3,590 (28.4%) |
| 3-Person Household | 3,728 (67.0%) | 1,837 (33.0%) |
| 4+ Person Household | 6,900 (80.6%) | 1,664 (19.4%) |
| Total Housing Units | 25,075 (70.8%) | 10,360 (29.2%) |
Occupancy by Educational Attainment in Roswell
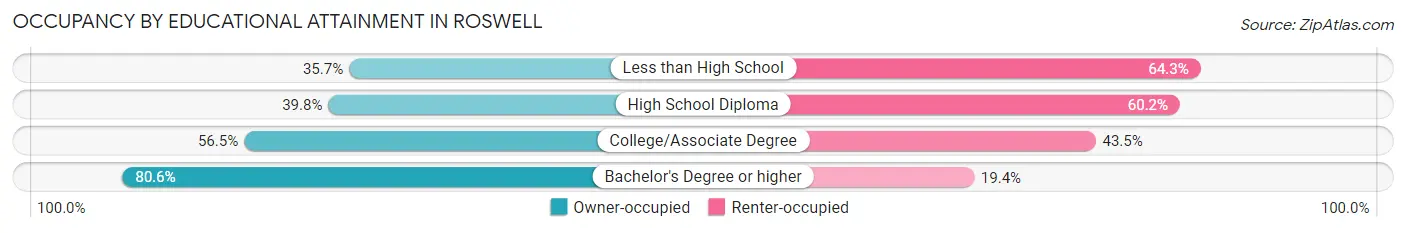
| Household Size | Owner-occupied | Renter-occupied |
| Less than High School | 480 (35.7%) | 865 (64.3%) |
| High School Diploma | 1,250 (39.8%) | 1,891 (60.2%) |
| College/Associate Degree | 3,761 (56.5%) | 2,896 (43.5%) |
| Bachelor's Degree or higher | 19,584 (80.6%) | 4,708 (19.4%) |
Occupancy by Age of Householder in Roswell
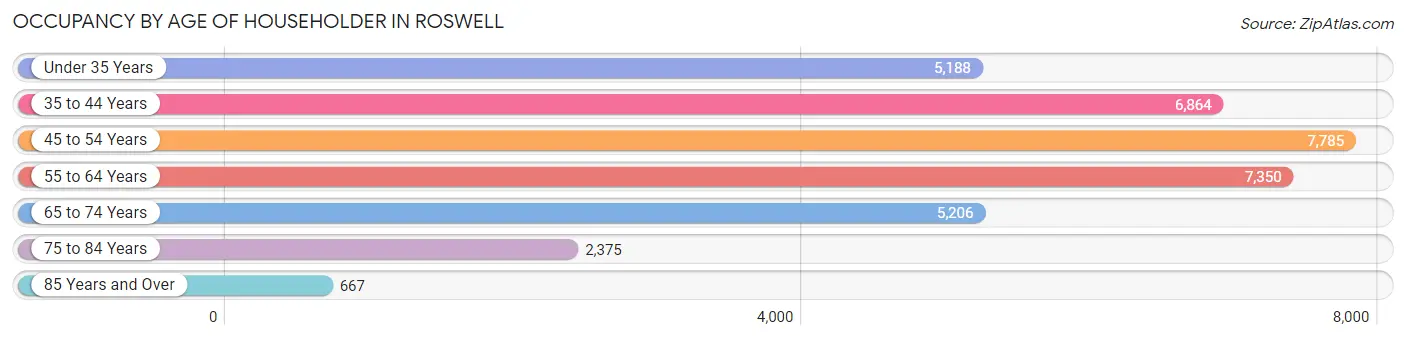
| Age Bracket | # Households | % Households |
| Under 35 Years | 5,188 | 14.6% |
| 35 to 44 Years | 6,864 | 19.4% |
| 45 to 54 Years | 7,785 | 22.0% |
| 55 to 64 Years | 7,350 | 20.7% |
| 65 to 74 Years | 5,206 | 14.7% |
| 75 to 84 Years | 2,375 | 6.7% |
| 85 Years and Over | 667 | 1.9% |
| Total | 35,435 | 100.0% |
Housing Finances in Roswell
Median Income by Occupancy in Roswell
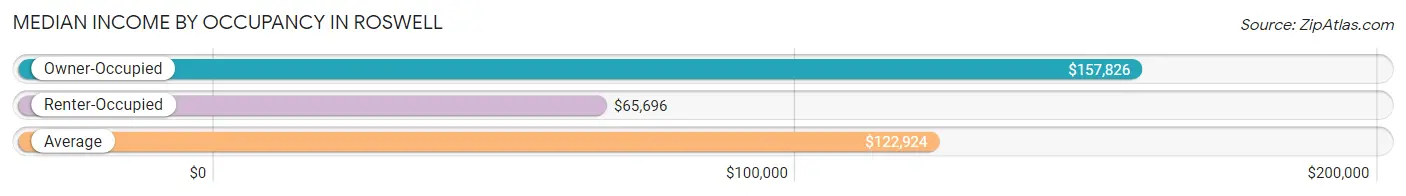
| Occupancy Type | # Households | Median Income |
| Owner-Occupied | 25,075 (70.8%) | $157,826 |
| Renter-Occupied | 10,360 (29.2%) | $65,696 |
| Average | 35,435 (100.0%) | $122,924 |
Occupancy by Householder Income Bracket in Roswell
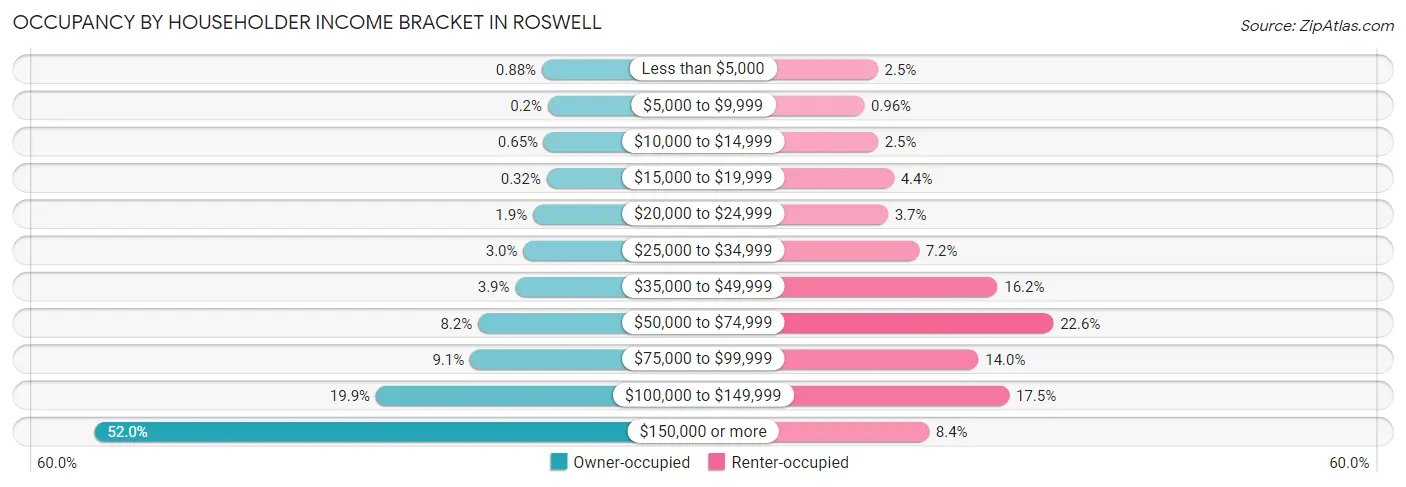
| Income Bracket | Owner-occupied | Renter-occupied |
| Less than $5,000 | 221 (0.9%) | 261 (2.5%) |
| $5,000 to $9,999 | 51 (0.2%) | 99 (1.0%) |
| $10,000 to $14,999 | 163 (0.6%) | 263 (2.5%) |
| $15,000 to $19,999 | 79 (0.3%) | 452 (4.4%) |
| $20,000 to $24,999 | 476 (1.9%) | 381 (3.7%) |
| $25,000 to $34,999 | 751 (3.0%) | 748 (7.2%) |
| $35,000 to $49,999 | 981 (3.9%) | 1,678 (16.2%) |
| $50,000 to $74,999 | 2,052 (8.2%) | 2,340 (22.6%) |
| $75,000 to $99,999 | 2,280 (9.1%) | 1,453 (14.0%) |
| $100,000 to $149,999 | 4,978 (19.9%) | 1,817 (17.5%) |
| $150,000 or more | 13,043 (52.0%) | 868 (8.4%) |
| Total | 25,075 (100.0%) | 10,360 (100.0%) |
Monthly Housing Cost Tiers in Roswell
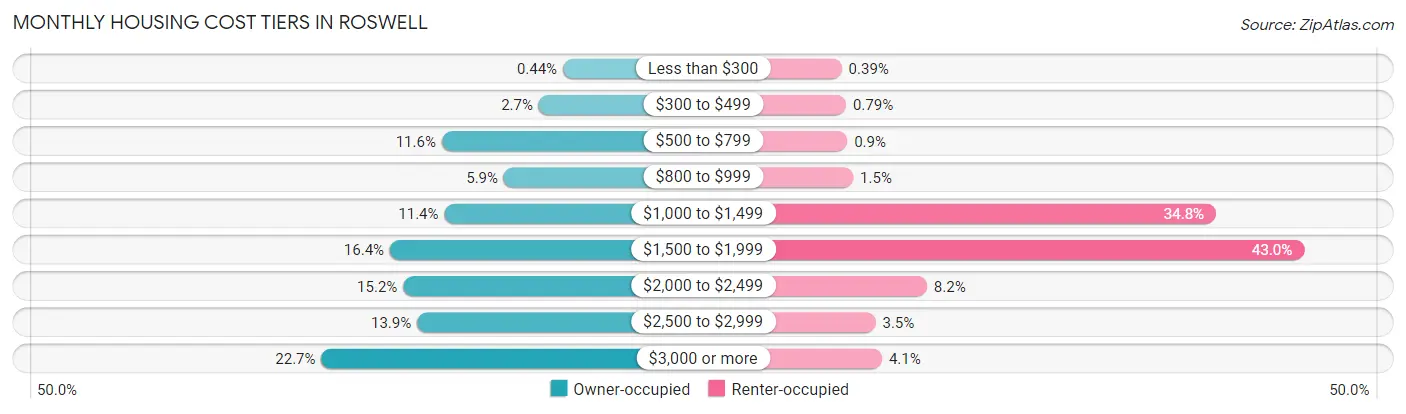
| Monthly Cost | Owner-occupied | Renter-occupied |
| Less than $300 | 110 (0.4%) | 40 (0.4%) |
| $300 to $499 | 666 (2.7%) | 82 (0.8%) |
| $500 to $799 | 2,909 (11.6%) | 93 (0.9%) |
| $800 to $999 | 1,474 (5.9%) | 150 (1.5%) |
| $1,000 to $1,499 | 2,848 (11.4%) | 3,609 (34.8%) |
| $1,500 to $1,999 | 4,105 (16.4%) | 4,450 (42.9%) |
| $2,000 to $2,499 | 3,798 (15.1%) | 854 (8.2%) |
| $2,500 to $2,999 | 3,478 (13.9%) | 364 (3.5%) |
| $3,000 or more | 5,687 (22.7%) | 425 (4.1%) |
| Total | 25,075 (100.0%) | 10,360 (100.0%) |
Physical Housing Characteristics in Roswell
Housing Structures in Roswell
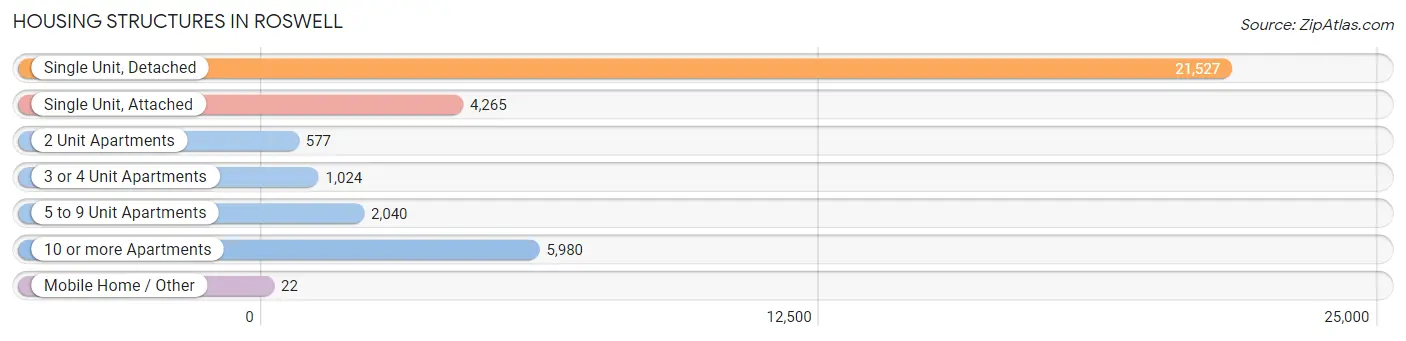
| Structure Type | # Housing Units | % Housing Units |
| Single Unit, Detached | 21,527 | 60.8% |
| Single Unit, Attached | 4,265 | 12.0% |
| 2 Unit Apartments | 577 | 1.6% |
| 3 or 4 Unit Apartments | 1,024 | 2.9% |
| 5 to 9 Unit Apartments | 2,040 | 5.8% |
| 10 or more Apartments | 5,980 | 16.9% |
| Mobile Home / Other | 22 | 0.1% |
| Total | 35,435 | 100.0% |
Housing Structures by Occupancy in Roswell
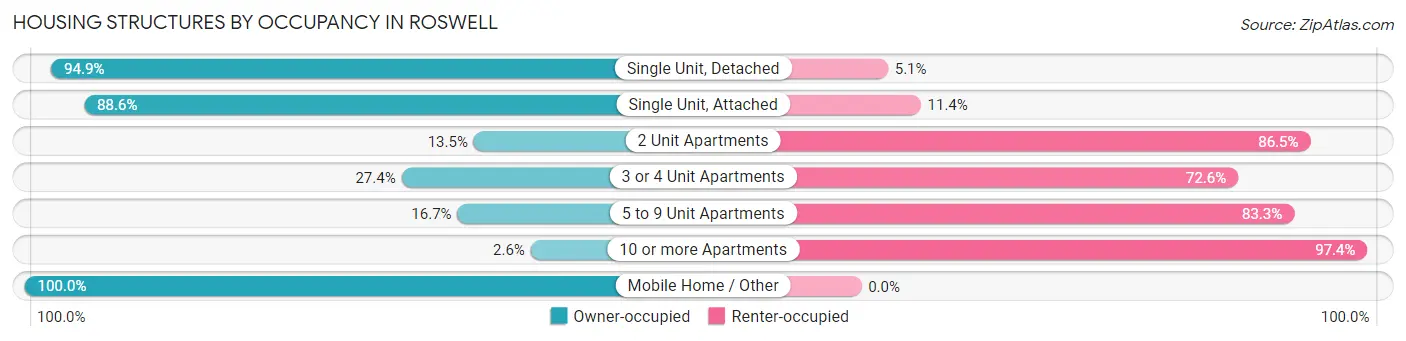
| Structure Type | Owner-occupied | Renter-occupied |
| Single Unit, Detached | 20,424 (94.9%) | 1,103 (5.1%) |
| Single Unit, Attached | 3,777 (88.6%) | 488 (11.4%) |
| 2 Unit Apartments | 78 (13.5%) | 499 (86.5%) |
| 3 or 4 Unit Apartments | 281 (27.4%) | 743 (72.6%) |
| 5 to 9 Unit Apartments | 340 (16.7%) | 1,700 (83.3%) |
| 10 or more Apartments | 153 (2.6%) | 5,827 (97.4%) |
| Mobile Home / Other | 22 (100.0%) | 0 (0.0%) |
| Total | 25,075 (70.8%) | 10,360 (29.2%) |
Housing Structures by Number of Rooms in Roswell
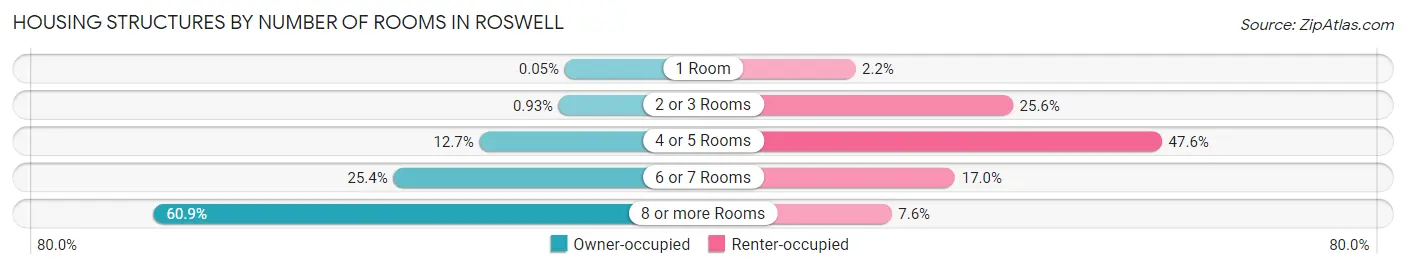
| Number of Rooms | Owner-occupied | Renter-occupied |
| 1 Room | 12 (0.1%) | 232 (2.2%) |
| 2 or 3 Rooms | 234 (0.9%) | 2,647 (25.6%) |
| 4 or 5 Rooms | 3,182 (12.7%) | 4,932 (47.6%) |
| 6 or 7 Rooms | 6,372 (25.4%) | 1,761 (17.0%) |
| 8 or more Rooms | 15,275 (60.9%) | 788 (7.6%) |
| Total | 25,075 (100.0%) | 10,360 (100.0%) |
Housing Structure by Heating Type in Roswell
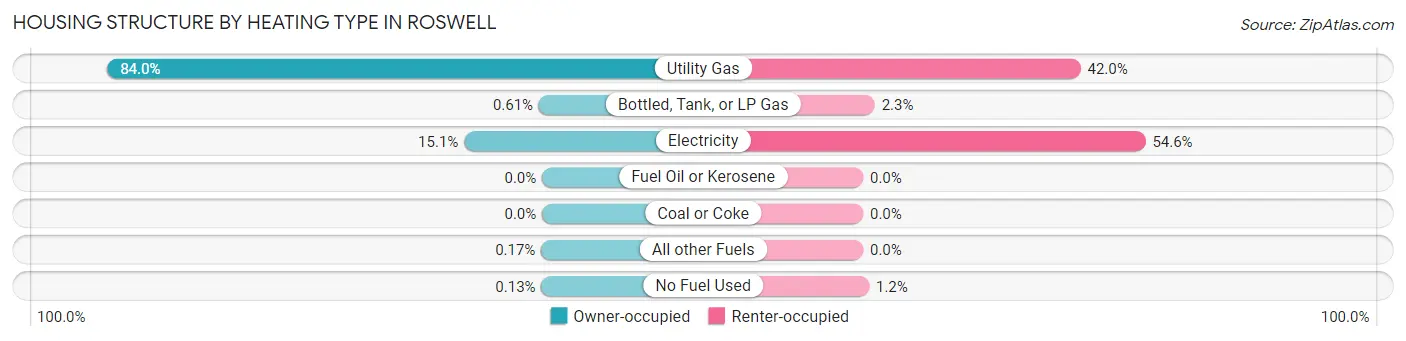
| Heating Type | Owner-occupied | Renter-occupied |
| Utility Gas | 21,071 (84.0%) | 4,354 (42.0%) |
| Bottled, Tank, or LP Gas | 152 (0.6%) | 233 (2.2%) |
| Electricity | 3,776 (15.1%) | 5,653 (54.6%) |
| Fuel Oil or Kerosene | 0 (0.0%) | 0 (0.0%) |
| Coal or Coke | 0 (0.0%) | 0 (0.0%) |
| All other Fuels | 43 (0.2%) | 0 (0.0%) |
| No Fuel Used | 33 (0.1%) | 120 (1.2%) |
| Total | 25,075 (100.0%) | 10,360 (100.0%) |
Household Vehicle Usage in Roswell
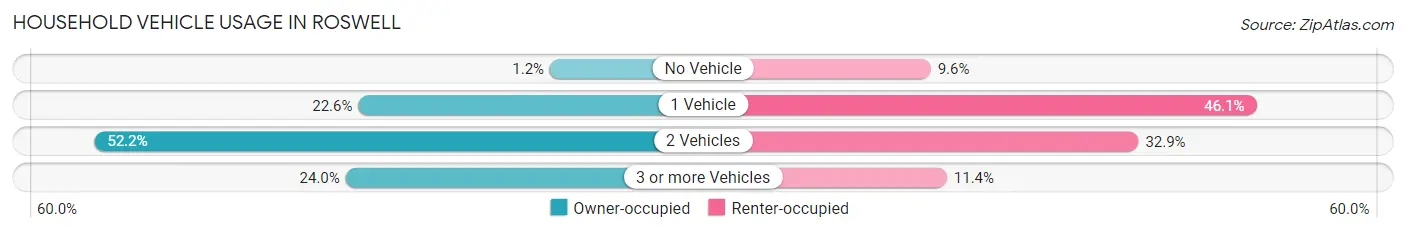
| Vehicles per Household | Owner-occupied | Renter-occupied |
| No Vehicle | 289 (1.1%) | 996 (9.6%) |
| 1 Vehicle | 5,672 (22.6%) | 4,775 (46.1%) |
| 2 Vehicles | 13,087 (52.2%) | 3,406 (32.9%) |
| 3 or more Vehicles | 6,027 (24.0%) | 1,183 (11.4%) |
| Total | 25,075 (100.0%) | 10,360 (100.0%) |
Real Estate & Mortgages in Roswell
Real Estate and Mortgage Overview in Roswell
| Characteristic | Without Mortgage | With Mortgage |
| Housing Units | 6,477 | 18,598 |
| Median Property Value | $463,200 | $486,000 |
| Median Household Income | $110,733 | $10,835 |
| Monthly Housing Costs | $774 | $5,584 |
| Real Estate Taxes | $3,912 | $105 |
Property Value by Mortgage Status in Roswell
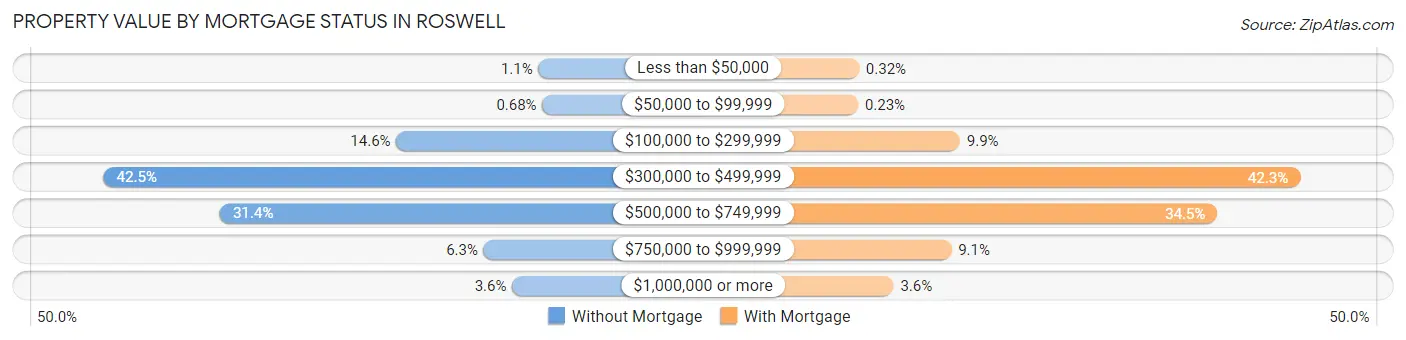
| Property Value | Without Mortgage | With Mortgage |
| Less than $50,000 | 68 (1.1%) | 60 (0.3%) |
| $50,000 to $99,999 | 44 (0.7%) | 43 (0.2%) |
| $100,000 to $299,999 | 945 (14.6%) | 1,847 (9.9%) |
| $300,000 to $499,999 | 2,751 (42.5%) | 7,875 (42.3%) |
| $500,000 to $749,999 | 2,033 (31.4%) | 6,407 (34.4%) |
| $750,000 to $999,999 | 406 (6.3%) | 1,695 (9.1%) |
| $1,000,000 or more | 230 (3.5%) | 671 (3.6%) |
| Total | 6,477 (100.0%) | 18,598 (100.0%) |
Household Income by Mortgage Status in Roswell
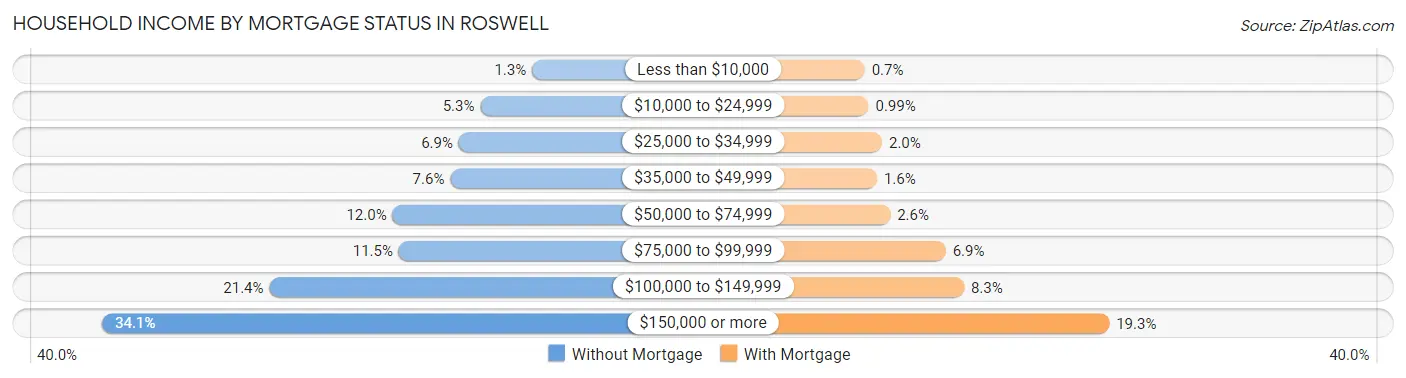
| Household Income | Without Mortgage | With Mortgage |
| Less than $10,000 | 87 (1.3%) | 130 (0.7%) |
| $10,000 to $24,999 | 342 (5.3%) | 185 (1.0%) |
| $25,000 to $34,999 | 448 (6.9%) | 376 (2.0%) |
| $35,000 to $49,999 | 490 (7.6%) | 303 (1.6%) |
| $50,000 to $74,999 | 775 (12.0%) | 491 (2.6%) |
| $75,000 to $99,999 | 744 (11.5%) | 1,277 (6.9%) |
| $100,000 to $149,999 | 1,383 (21.3%) | 1,536 (8.3%) |
| $150,000 or more | 2,208 (34.1%) | 3,595 (19.3%) |
| Total | 6,477 (100.0%) | 18,598 (100.0%) |
Property Value to Household Income Ratio in Roswell
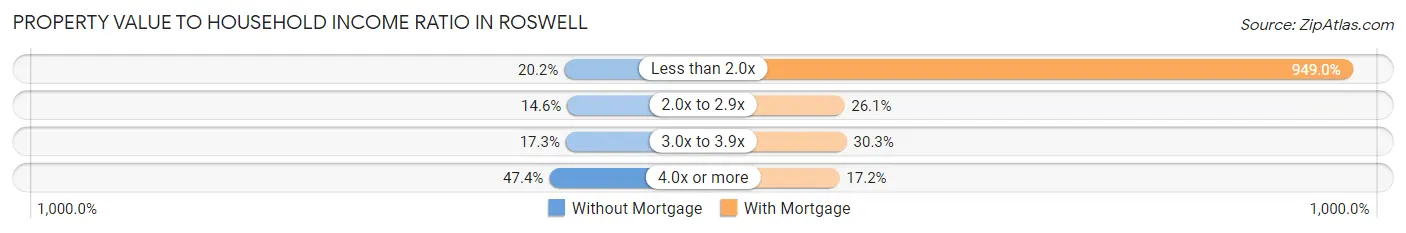
| Value-to-Income Ratio | Without Mortgage | With Mortgage |
| Less than 2.0x | 1,306 (20.2%) | 176,502 (949.0%) |
| 2.0x to 2.9x | 948 (14.6%) | 4,847 (26.1%) |
| 3.0x to 3.9x | 1,118 (17.3%) | 5,630 (30.3%) |
| 4.0x or more | 3,069 (47.4%) | 3,200 (17.2%) |
| Total | 6,477 (100.0%) | 18,598 (100.0%) |
Real Estate Taxes by Mortgage Status in Roswell
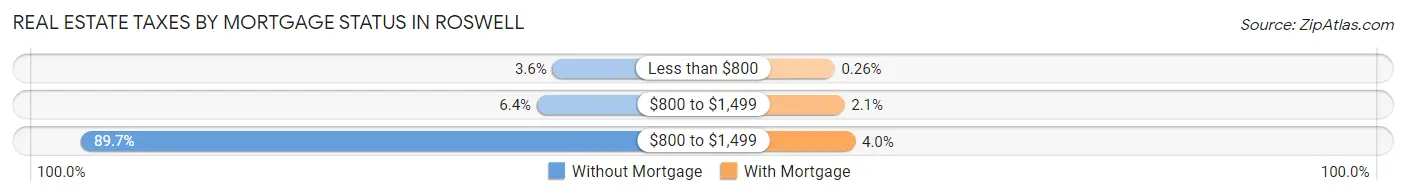
| Property Taxes | Without Mortgage | With Mortgage |
| Less than $800 | 231 (3.6%) | 48 (0.3%) |
| $800 to $1,499 | 416 (6.4%) | 382 (2.1%) |
| $800 to $1,499 | 5,807 (89.7%) | 745 (4.0%) |
| Total | 6,477 (100.0%) | 18,598 (100.0%) |
Health & Disability in Roswell
Health Insurance Coverage by Age in Roswell
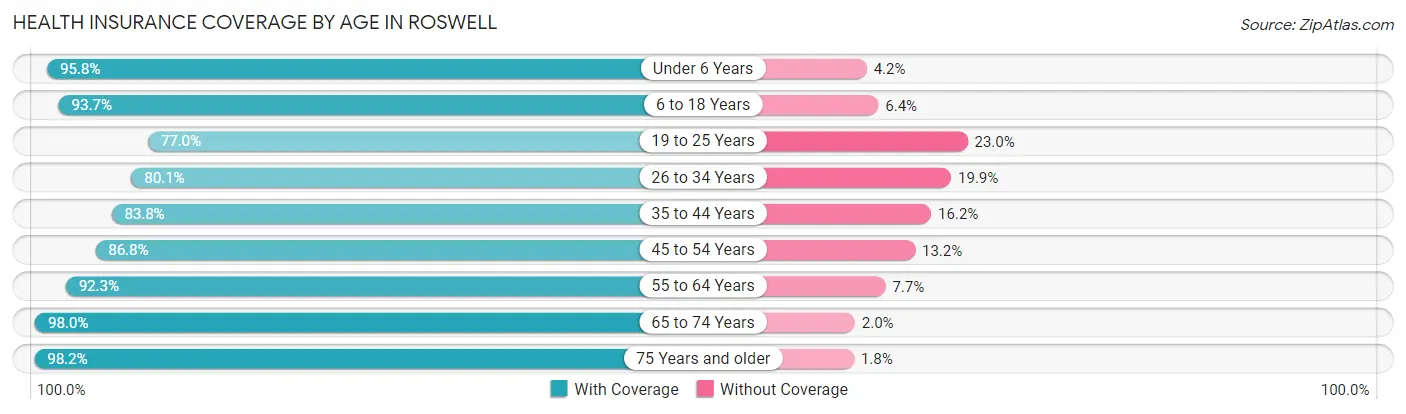
| Age Bracket | With Coverage | Without Coverage |
| Under 6 Years | 5,508 (95.8%) | 240 (4.2%) |
| 6 to 18 Years | 16,804 (93.6%) | 1,140 (6.4%) |
| 19 to 25 Years | 4,733 (77.0%) | 1,412 (23.0%) |
| 26 to 34 Years | 7,355 (80.1%) | 1,829 (19.9%) |
| 35 to 44 Years | 11,233 (83.8%) | 2,172 (16.2%) |
| 45 to 54 Years | 12,253 (86.8%) | 1,862 (13.2%) |
| 55 to 64 Years | 11,140 (92.3%) | 927 (7.7%) |
| 65 to 74 Years | 8,668 (98.0%) | 173 (2.0%) |
| 75 Years and older | 4,824 (98.2%) | 89 (1.8%) |
| Total | 82,518 (89.3%) | 9,844 (10.7%) |
Health Insurance Coverage by Citizenship Status in Roswell
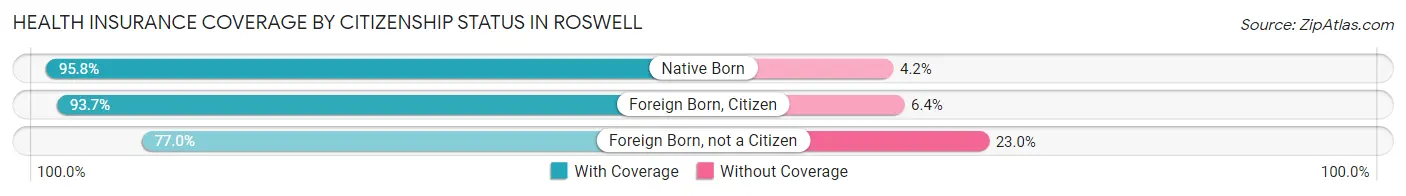
| Citizenship Status | With Coverage | Without Coverage |
| Native Born | 5,508 (95.8%) | 240 (4.2%) |
| Foreign Born, Citizen | 16,804 (93.6%) | 1,140 (6.4%) |
| Foreign Born, not a Citizen | 4,733 (77.0%) | 1,412 (23.0%) |
Health Insurance Coverage by Household Income in Roswell
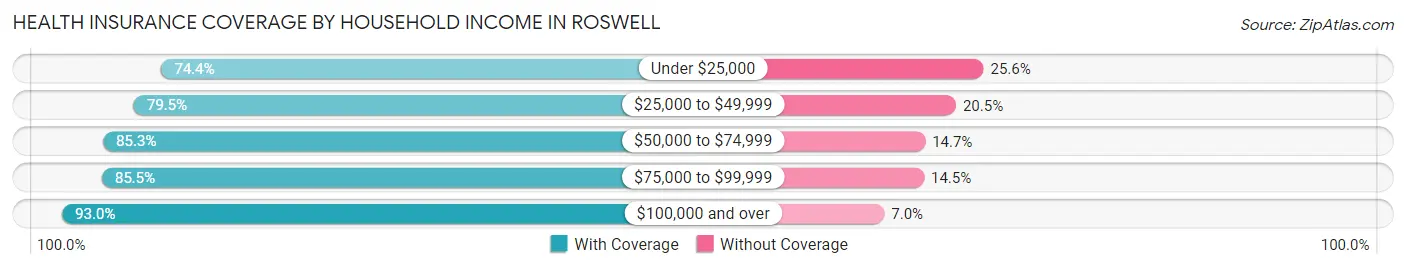
| Household Income | With Coverage | Without Coverage |
| Under $25,000 | 3,217 (74.4%) | 1,108 (25.6%) |
| $25,000 to $49,999 | 6,941 (79.5%) | 1,785 (20.5%) |
| $50,000 to $74,999 | 7,764 (85.3%) | 1,337 (14.7%) |
| $75,000 to $99,999 | 7,173 (85.5%) | 1,214 (14.5%) |
| $100,000 and over | 57,274 (93.0%) | 4,338 (7.0%) |
Public vs Private Health Insurance Coverage by Age in Roswell
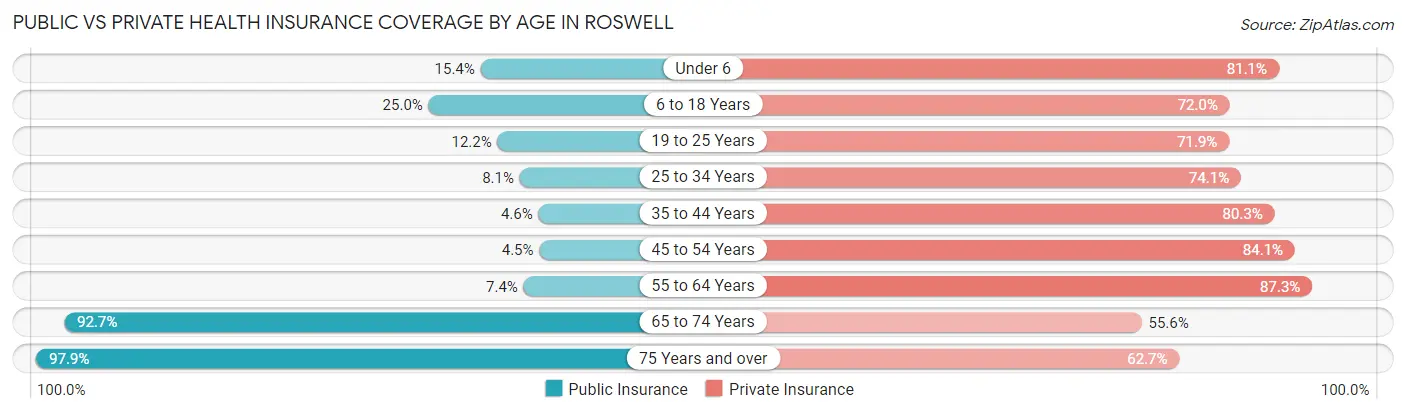
| Age Bracket | Public Insurance | Private Insurance |
| Under 6 | 883 (15.4%) | 4,663 (81.1%) |
| 6 to 18 Years | 4,486 (25.0%) | 12,920 (72.0%) |
| 19 to 25 Years | 751 (12.2%) | 4,418 (71.9%) |
| 25 to 34 Years | 743 (8.1%) | 6,805 (74.1%) |
| 35 to 44 Years | 616 (4.6%) | 10,770 (80.3%) |
| 45 to 54 Years | 628 (4.4%) | 11,871 (84.1%) |
| 55 to 64 Years | 889 (7.4%) | 10,534 (87.3%) |
| 65 to 74 Years | 8,194 (92.7%) | 4,919 (55.6%) |
| 75 Years and over | 4,808 (97.9%) | 3,078 (62.6%) |
| Total | 21,998 (23.8%) | 69,978 (75.8%) |
Disability Status by Sex by Age in Roswell
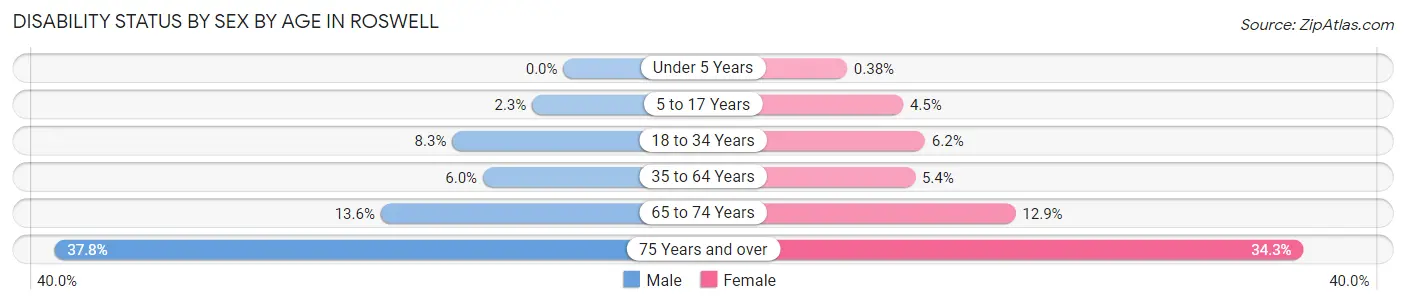
| Age Bracket | Male | Female |
| Under 5 Years | 0 (0.0%) | 9 (0.4%) |
| 5 to 17 Years | 207 (2.3%) | 391 (4.5%) |
| 18 to 34 Years | 725 (8.3%) | 492 (6.2%) |
| 35 to 64 Years | 1,138 (6.0%) | 1,114 (5.4%) |
| 65 to 74 Years | 610 (13.6%) | 560 (12.9%) |
| 75 Years and over | 712 (37.8%) | 1,038 (34.3%) |
Disability Class by Sex by Age in Roswell
Disability Class: Hearing Difficulty
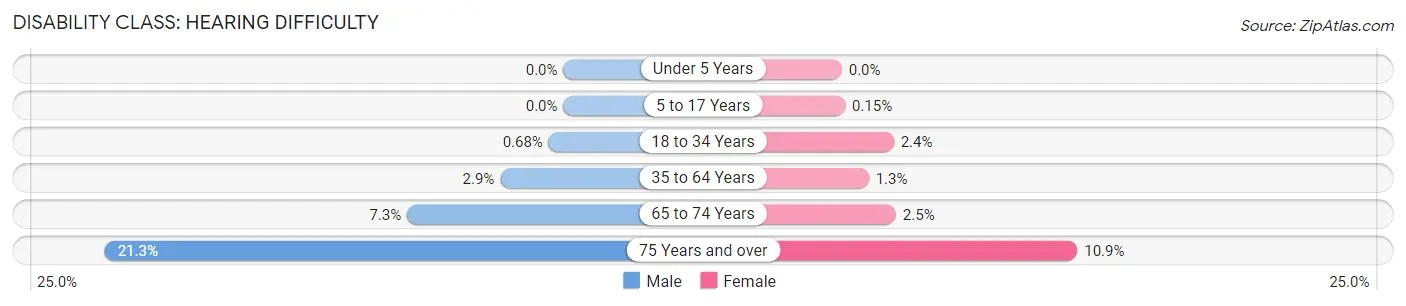
| Age Bracket | Male | Female |
| Under 5 Years | 0 (0.0%) | 0 (0.0%) |
| 5 to 17 Years | 0 (0.0%) | 13 (0.2%) |
| 18 to 34 Years | 60 (0.7%) | 192 (2.4%) |
| 35 to 64 Years | 559 (2.9%) | 257 (1.3%) |
| 65 to 74 Years | 326 (7.2%) | 109 (2.5%) |
| 75 Years and over | 401 (21.3%) | 331 (10.9%) |
Disability Class: Vision Difficulty
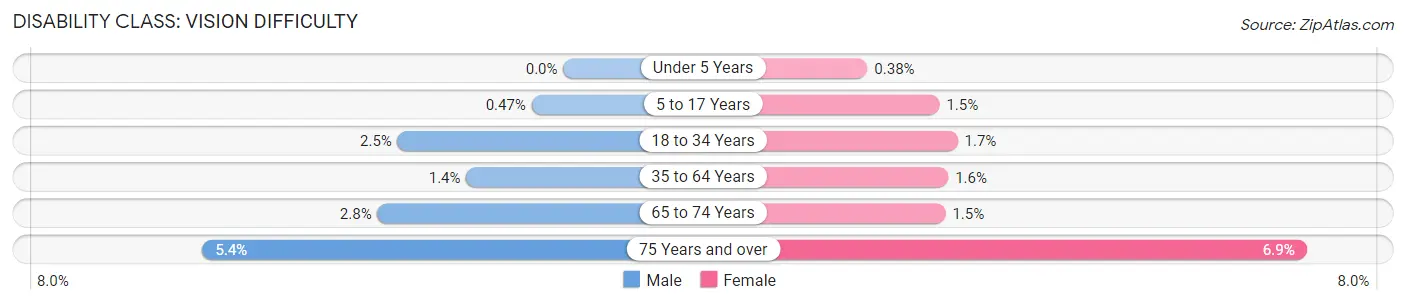
| Age Bracket | Male | Female |
| Under 5 Years | 0 (0.0%) | 9 (0.4%) |
| 5 to 17 Years | 42 (0.5%) | 125 (1.5%) |
| 18 to 34 Years | 216 (2.5%) | 137 (1.7%) |
| 35 to 64 Years | 274 (1.4%) | 324 (1.6%) |
| 65 to 74 Years | 124 (2.8%) | 67 (1.5%) |
| 75 Years and over | 101 (5.4%) | 209 (6.9%) |
Disability Class: Cognitive Difficulty
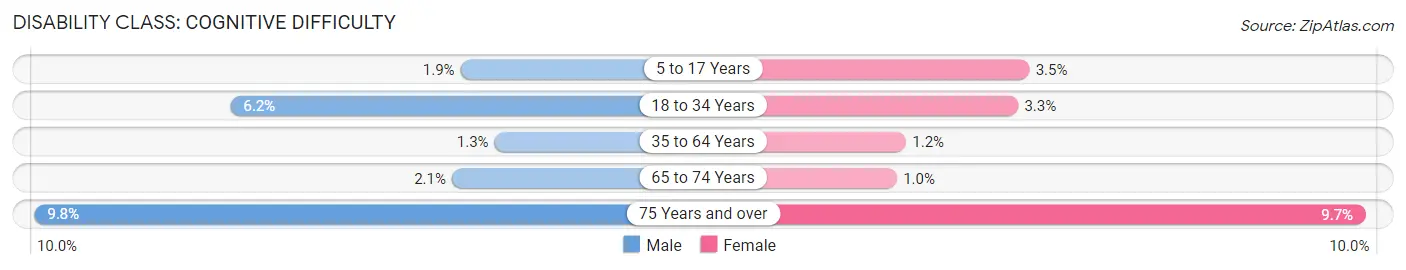
| Age Bracket | Male | Female |
| 5 to 17 Years | 170 (1.9%) | 299 (3.5%) |
| 18 to 34 Years | 543 (6.2%) | 260 (3.3%) |
| 35 to 64 Years | 243 (1.3%) | 242 (1.2%) |
| 65 to 74 Years | 93 (2.1%) | 44 (1.0%) |
| 75 Years and over | 185 (9.8%) | 294 (9.7%) |
Disability Class: Ambulatory Difficulty
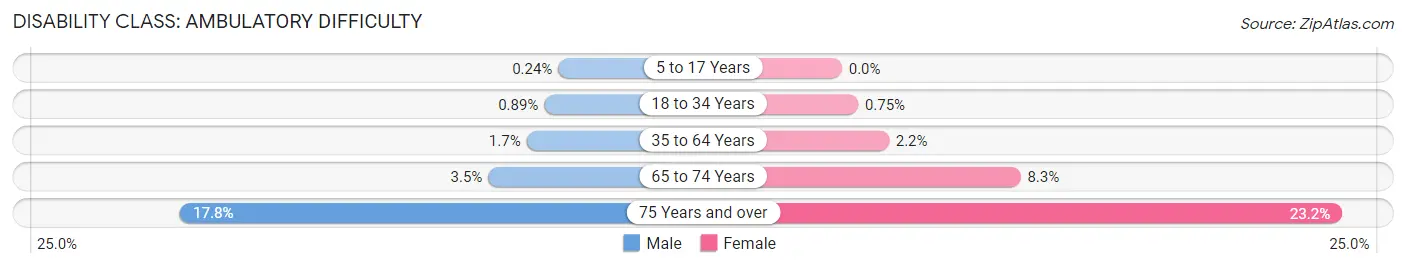
| Age Bracket | Male | Female |
| 5 to 17 Years | 21 (0.2%) | 0 (0.0%) |
| 18 to 34 Years | 78 (0.9%) | 60 (0.7%) |
| 35 to 64 Years | 326 (1.7%) | 447 (2.2%) |
| 65 to 74 Years | 157 (3.5%) | 360 (8.3%) |
| 75 Years and over | 335 (17.8%) | 703 (23.2%) |
Disability Class: Self-Care Difficulty
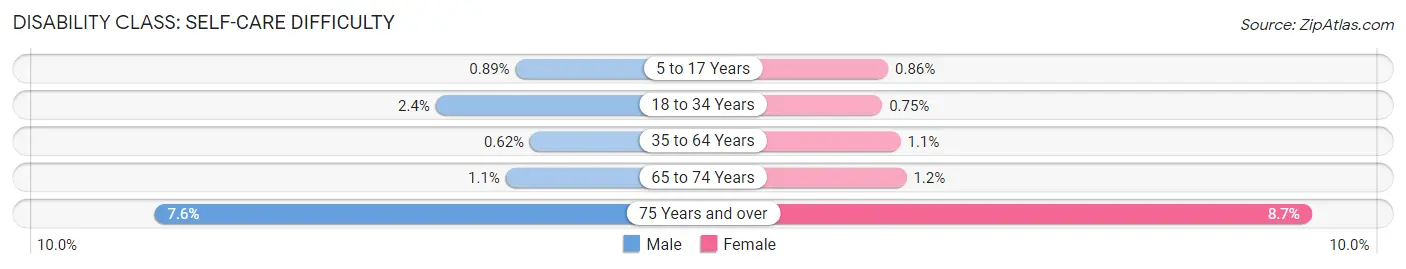
| Age Bracket | Male | Female |
| 5 to 17 Years | 79 (0.9%) | 74 (0.9%) |
| 18 to 34 Years | 208 (2.4%) | 60 (0.7%) |
| 35 to 64 Years | 118 (0.6%) | 224 (1.1%) |
| 65 to 74 Years | 48 (1.1%) | 52 (1.2%) |
| 75 Years and over | 143 (7.6%) | 264 (8.7%) |
Technology Access in Roswell
Computing Device Access in Roswell
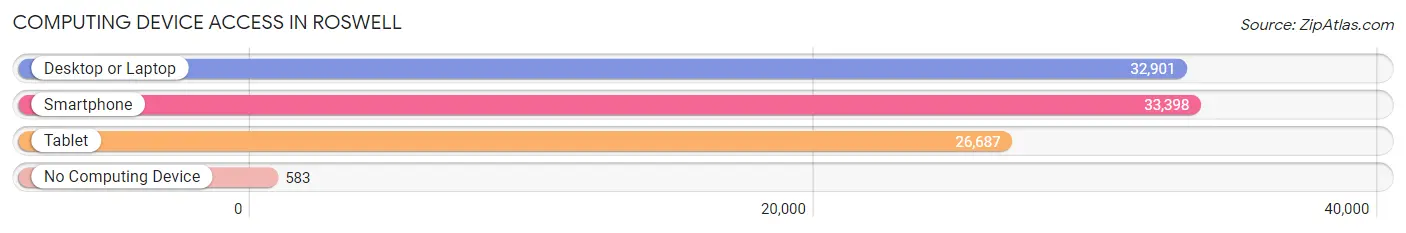
| Device Type | # Households | % Households |
| Desktop or Laptop | 32,901 | 92.8% |
| Smartphone | 33,398 | 94.3% |
| Tablet | 26,687 | 75.3% |
| No Computing Device | 583 | 1.7% |
| Total | 35,435 | 100.0% |
Internet Access in Roswell
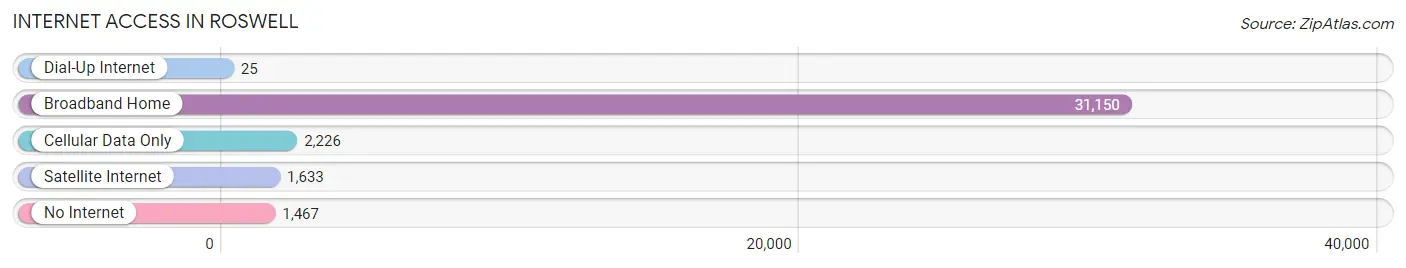
| Internet Type | # Households | % Households |
| Dial-Up Internet | 25 | 0.1% |
| Broadband Home | 31,150 | 87.9% |
| Cellular Data Only | 2,226 | 6.3% |
| Satellite Internet | 1,633 | 4.6% |
| No Internet | 1,467 | 4.1% |
| Total | 35,435 | 100.0% |
Roswell Summary
Roswell, Georgia is a city located in northern Fulton County, Georgia, United States. It is an affluent suburb of Atlanta, located about 20 miles north of the city. The population was 88,346 as of the 2019 census, making it the seventh-largest city in Georgia.
History
Roswell was founded in 1839 by Roswell King, a cotton planter from South Carolina. He named the city after his father, Roswell King, Sr., who had been a member of the Georgia legislature. The city was incorporated in 1854 and became a popular summer resort for wealthy Atlantans.
In the late 1800s, Roswell was a popular destination for wealthy Atlantans, who built grand homes in the area. The city was also home to a number of prominent families, including the Barretts, the Kings, the Bullochs, and the Johnsons.
During the Civil War, Roswell was the site of a major battle between Union and Confederate forces. The Battle of Roswell was fought on July 8, 1864, and resulted in a Confederate victory.
Geography
Roswell is located in northern Fulton County, Georgia, about 20 miles north of Atlanta. It is situated on the Chattahoochee River, which forms the border between Fulton and Cobb counties. The city covers an area of 24.2 square miles, with a population density of 3,637 people per square mile.
The city is divided into several distinct neighborhoods, including Historic Roswell, East Roswell, and Roswell North. The city is also home to several parks, including Roswell Mill Park, Vickery Creek Park, and Riverside Park.
Economy
Roswell is home to a number of major employers, including Northside Hospital, Home Depot, and the Fulton County School System. The city is also home to a number of corporate headquarters, including Chick-fil-A, Primerica, and the Atlanta Falcons.
The city's economy is largely driven by the service sector, with a number of restaurants, retail stores, and professional services located in the city. The city is also home to a number of technology companies, including IBM, AT&T, and Microsoft.
Demographics
As of the 2019 census, the population of Roswell was 88,346. The racial makeup of the city was 73.2% White, 11.3% African American, 0.3% Native American, 8.2% Asian, and 4.2% from other races. The median household income was $90,945, and the median age was 38.
Roswell is home to a number of religious institutions, including churches, synagogues, and mosques. The city is also home to a number of private schools, including the Roswell International School and the Roswell Montessori School.
Conclusion
Roswell, Georgia is an affluent suburb of Atlanta located in northern Fulton County. The city was founded in 1839 and has a rich history, including a major battle during the Civil War. The city is home to a number of major employers, including Northside Hospital, Home Depot, and the Fulton County School System. The population of Roswell was 88,346 as of the 2019 census, with a median household income of $90,945. The city is home to a number of religious institutions, private schools, and technology companies.
Common Questions
What is Per Capita Income in Roswell?
Per Capita income in Roswell is $62,878.
What is the Median Family Income in Roswell?
Median Family Income in Roswell is $147,885.
What is the Median Household income in Roswell?
Median Household Income in Roswell is $122,924.
What is Income or Wage Gap in Roswell?
Income or Wage Gap in Roswell is 37.1%.
Women in Roswell earn 62.9 cents for every dollar earned by a man.
What is Family Income Deficit in Roswell?
Family Income Deficit in Roswell is $10,596.
Families that are below poverty line in Roswell earn $10,596 less on average than the poverty threshold level.
What is Inequality or Gini Index in Roswell?
Inequality or Gini Index in Roswell is 0.45.
What is the Total Population of Roswell?
Total Population of Roswell is 92,770.
What is the Total Male Population of Roswell?
Total Male Population of Roswell is 45,640.
What is the Total Female Population of Roswell?
Total Female Population of Roswell is 47,130.
What is the Ratio of Males per 100 Females in Roswell?
There are 96.84 Males per 100 Females in Roswell.
What is the Ratio of Females per 100 Males in Roswell?
There are 103.26 Females per 100 Males in Roswell.
What is the Median Population Age in Roswell?
Median Population Age in Roswell is 40.5 Years.
What is the Average Family Size in Roswell
Average Family Size in Roswell is 3.1 People.
What is the Average Household Size in Roswell
Average Household Size in Roswell is 2.6 People.
How Large is the Labor Force in Roswell?
There are 51,509 People in the Labor Forcein in Roswell.
What is the Percentage of People in the Labor Force in Roswell?
70.0% of People are in the Labor Force in Roswell.
What is the Unemployment Rate in Roswell?
Unemployment Rate in Roswell is 4.3%.