Norman, OK Map & Demographics
Norman Map
Norman Overview
$35,650
PER CAPITA INCOME
$91,927
AVG FAMILY INCOME
$62,849
AVG HOUSEHOLD INCOME
29.7%
WAGE / INCOME GAP [ % ]
70.3¢/ $1
WAGE / INCOME GAP [ $ ]
$10,775
FAMILY INCOME DEFICIT
0.47
INEQUALITY / GINI INDEX
127,701
TOTAL POPULATION
63,213
MALE POPULATION
64,488
FEMALE POPULATION
98.02
MALES / 100 FEMALES
102.02
FEMALES / 100 MALES
31.0
MEDIAN AGE
2.9
AVG FAMILY SIZE
2.3
AVG HOUSEHOLD SIZE
69,071
LABOR FORCE [ PEOPLE ]
64.4%
PERCENT IN LABOR FORCE
5.8%
UNEMPLOYMENT RATE
Norman Area Codes
Income in Norman
Income Overview in Norman
Per Capita Income in Norman is $35,650, while median incomes of families and households are $91,927 and $62,849 respectively.
| Characteristic | Number | Measure |
| Per Capita Income | 127,701 | $35,650 |
| Median Family Income | 28,880 | $91,927 |
| Mean Family Income | 28,880 | $113,374 |
| Median Household Income | 51,336 | $62,849 |
| Mean Household Income | 51,336 | $86,121 |
| Income Deficit | 28,880 | $10,775 |
| Wage / Income Gap (%) | 127,701 | 29.74% |
| Wage / Income Gap ($) | 127,701 | 70.26¢ per $1 |
| Gini / Inequality Index | 127,701 | 0.47 |
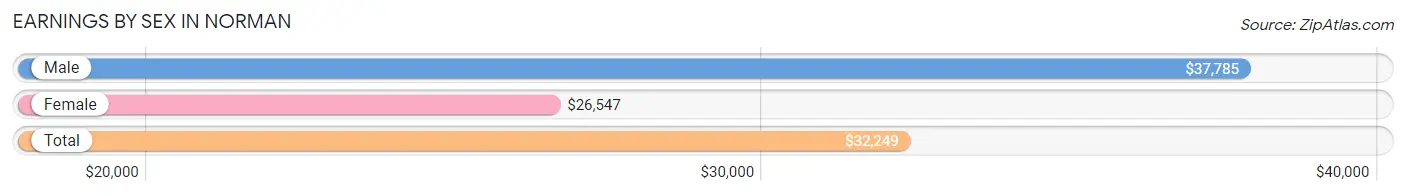
Earnings by Sex in Norman
Average Earnings in Norman are $32,249, $37,785 for men and $26,547 for women, a difference of 29.7%.
| Sex | Number | Average Earnings |
| Male | 39,573 (52.4%) | $37,785 |
| Female | 35,993 (47.6%) | $26,547 |
| Total | 75,566 (100.0%) | $32,249 |
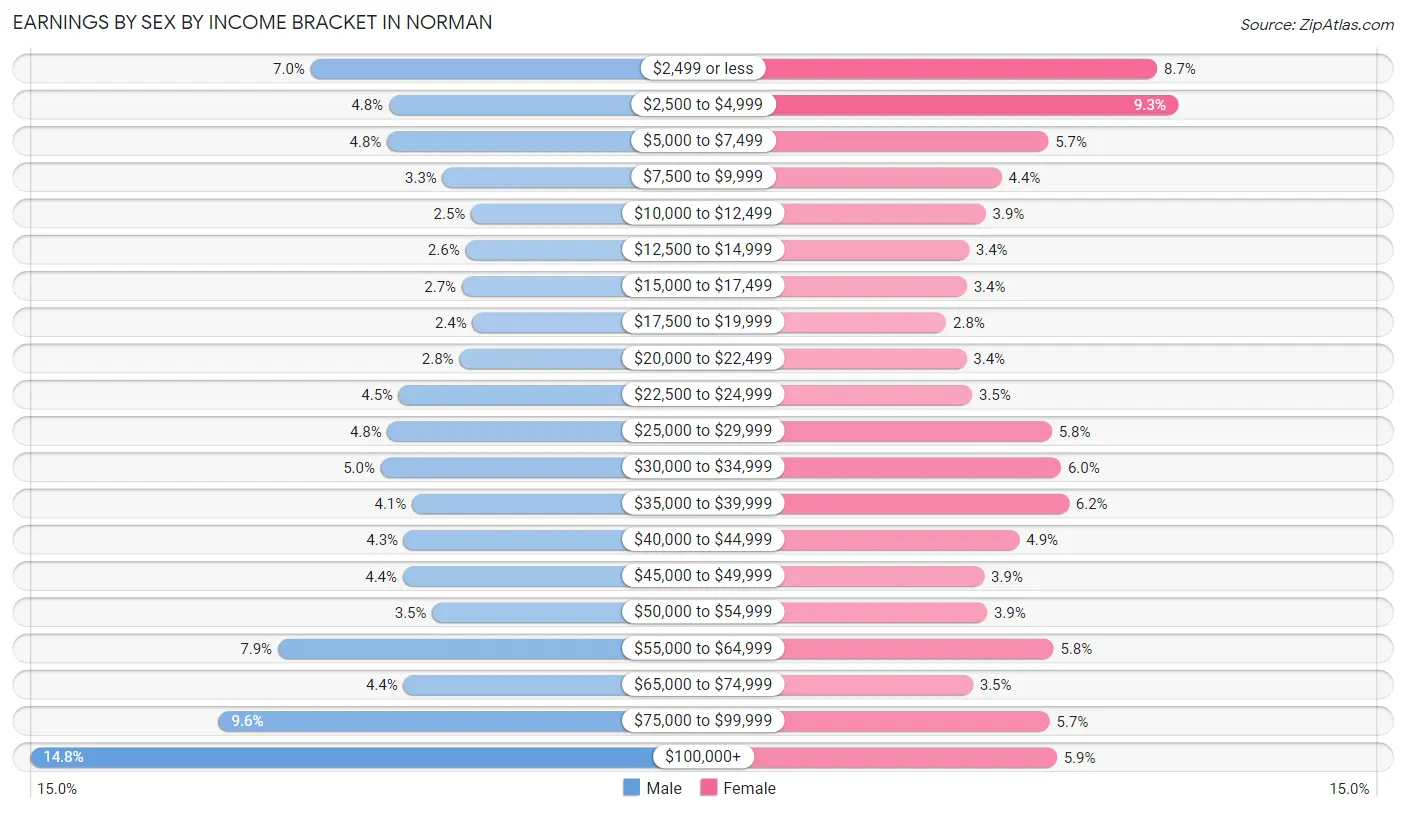
Earnings by Sex by Income Bracket in Norman
The most common earnings brackets in Norman are $100,000+ for men (5,872 | 14.8%) and $2,500 to $4,999 for women (3,347 | 9.3%).
| Income | Male | Female |
| $2,499 or less | 2,755 (7.0%) | 3,140 (8.7%) |
| $2,500 to $4,999 | 1,883 (4.8%) | 3,347 (9.3%) |
| $5,000 to $7,499 | 1,903 (4.8%) | 2,038 (5.7%) |
| $7,500 to $9,999 | 1,287 (3.3%) | 1,567 (4.3%) |
| $10,000 to $12,499 | 969 (2.5%) | 1,402 (3.9%) |
| $12,500 to $14,999 | 1,034 (2.6%) | 1,236 (3.4%) |
| $15,000 to $17,499 | 1,074 (2.7%) | 1,212 (3.4%) |
| $17,500 to $19,999 | 953 (2.4%) | 1,005 (2.8%) |
| $20,000 to $22,499 | 1,102 (2.8%) | 1,208 (3.4%) |
| $22,500 to $24,999 | 1,773 (4.5%) | 1,266 (3.5%) |
| $25,000 to $29,999 | 1,901 (4.8%) | 2,073 (5.8%) |
| $30,000 to $34,999 | 1,973 (5.0%) | 2,165 (6.0%) |
| $35,000 to $39,999 | 1,626 (4.1%) | 2,246 (6.2%) |
| $40,000 to $44,999 | 1,718 (4.3%) | 1,745 (4.9%) |
| $45,000 to $49,999 | 1,730 (4.4%) | 1,389 (3.9%) |
| $50,000 to $54,999 | 1,400 (3.5%) | 1,417 (3.9%) |
| $55,000 to $64,999 | 3,119 (7.9%) | 2,092 (5.8%) |
| $65,000 to $74,999 | 1,723 (4.3%) | 1,273 (3.5%) |
| $75,000 to $99,999 | 3,778 (9.6%) | 2,050 (5.7%) |
| $100,000+ | 5,872 (14.8%) | 2,122 (5.9%) |
| Total | 39,573 (100.0%) | 35,993 (100.0%) |
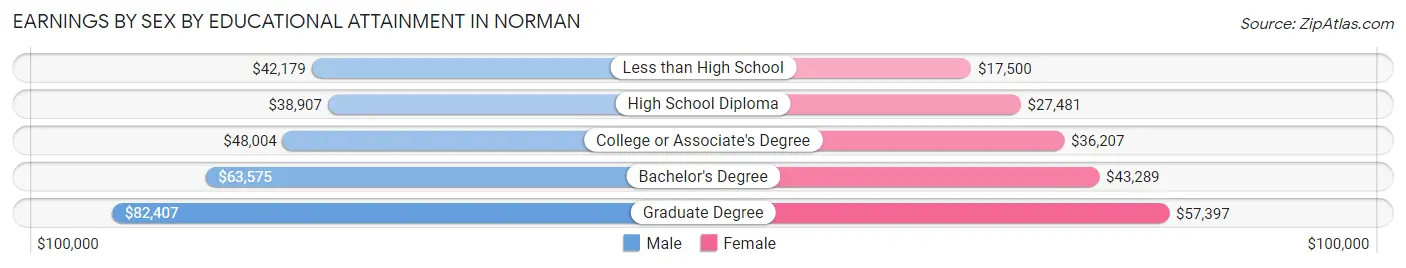
Earnings by Sex by Educational Attainment in Norman
Average earnings in Norman are $55,319 for men and $39,898 for women, a difference of 27.9%. Men with an educational attainment of graduate degree enjoy the highest average annual earnings of $82,407, while those with high school diploma education earn the least with $38,907. Women with an educational attainment of graduate degree earn the most with the average annual earnings of $57,397, while those with less than high school education have the smallest earnings of $17,500.
| Educational Attainment | Male Income | Female Income |
| Less than High School | $42,179 | $17,500 |
| High School Diploma | $38,907 | $27,481 |
| College or Associate's Degree | $48,004 | $36,207 |
| Bachelor's Degree | $63,575 | $43,289 |
| Graduate Degree | $82,407 | $57,397 |
| Total | $55,319 | $39,898 |
Family Income in Norman
Family Income Brackets in Norman
According to the Norman family income data, there are 6,816 families falling into the $100,000 to $149,999 income range, which is the most common income bracket and makes up 23.6% of all families. Conversely, the $10,000 to $14,999 income bracket is the least frequent group with only 404 families (1.4%) belonging to this category.
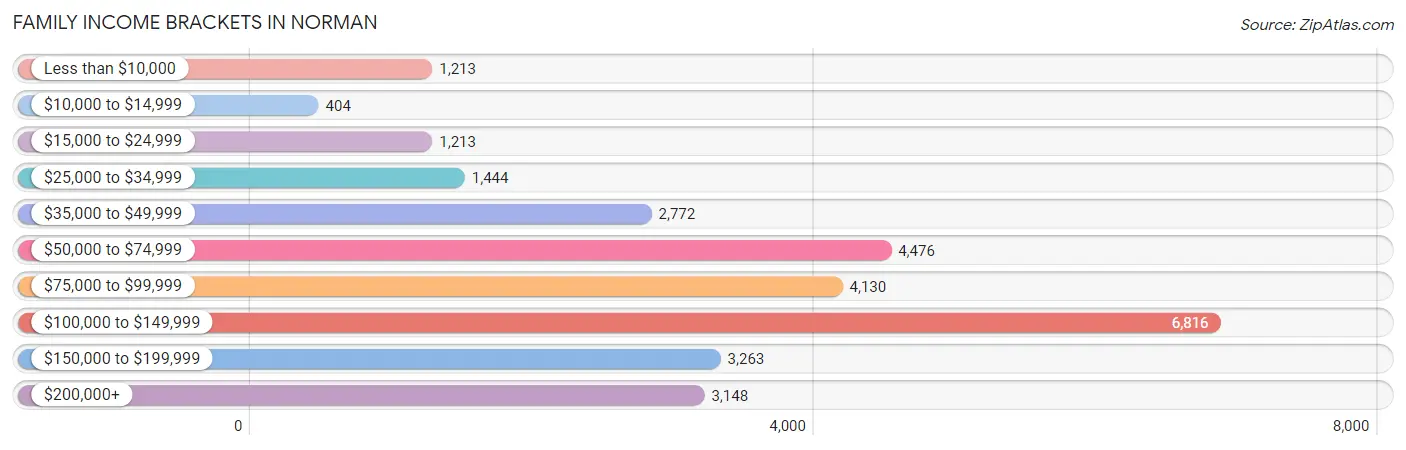
| Income Bracket | # Families | % Families |
| Less than $10,000 | 1,213 | 4.2% |
| $10,000 to $14,999 | 404 | 1.4% |
| $15,000 to $24,999 | 1,213 | 4.2% |
| $25,000 to $34,999 | 1,444 | 5.0% |
| $35,000 to $49,999 | 2,772 | 9.6% |
| $50,000 to $74,999 | 4,476 | 15.5% |
| $75,000 to $99,999 | 4,130 | 14.3% |
| $100,000 to $149,999 | 6,816 | 23.6% |
| $150,000 to $199,999 | 3,263 | 11.3% |
| $200,000+ | 3,148 | 10.9% |
Family Income by Famaliy Size in Norman
4-person families (4,676 | 16.2%) account for the highest median family income in Norman with $121,619 per family, while 2-person families (14,765 | 51.1%) have the highest median income of $41,557 per family member.
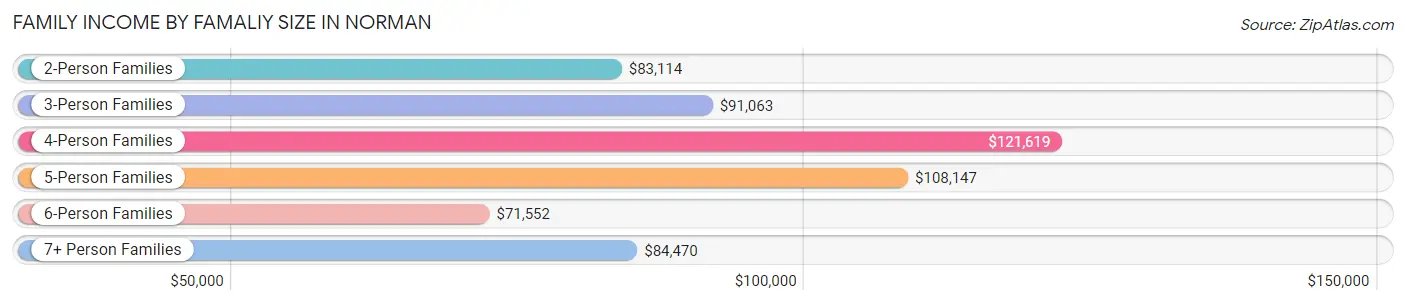
| Income Bracket | # Families | Median Income |
| 2-Person Families | 14,765 (51.1%) | $83,114 |
| 3-Person Families | 6,249 (21.6%) | $91,063 |
| 4-Person Families | 4,676 (16.2%) | $121,619 |
| 5-Person Families | 2,052 (7.1%) | $108,147 |
| 6-Person Families | 670 (2.3%) | $71,552 |
| 7+ Person Families | 468 (1.6%) | $84,470 |
| Total | 28,880 (100.0%) | $91,927 |
Family Income by Number of Earners in Norman
The median family income in Norman is $91,927, with families comprising 3+ earners (2,462) having the highest median family income of $126,573, while families with no earners (3,432) have the lowest median family income of $55,872, accounting for 8.5% and 11.9% of families, respectively.
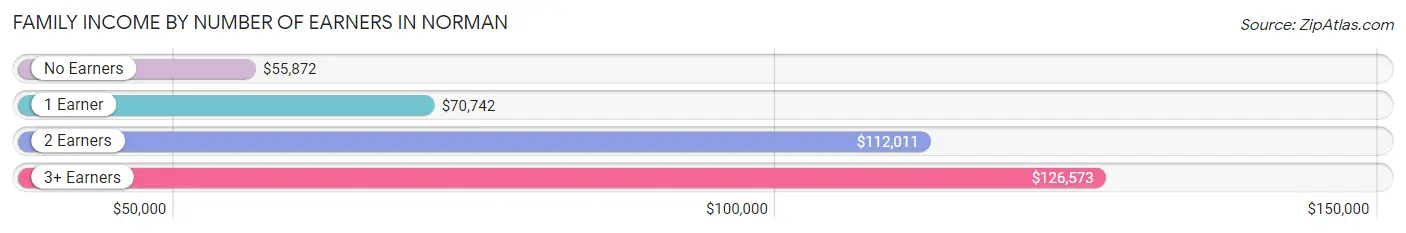
| Number of Earners | # Families | Median Income |
| No Earners | 3,432 (11.9%) | $55,872 |
| 1 Earner | 9,867 (34.2%) | $70,742 |
| 2 Earners | 13,119 (45.4%) | $112,011 |
| 3+ Earners | 2,462 (8.5%) | $126,573 |
| Total | 28,880 (100.0%) | $91,927 |
Household Income in Norman
Household Income Brackets in Norman
With 8,881 households falling in the category, the $50,000 to $74,999 income range is the most frequent in Norman, accounting for 17.3% of all households. In contrast, only 1,489 households (2.9%) fall into the $10,000 to $14,999 income bracket, making it the least populous group.
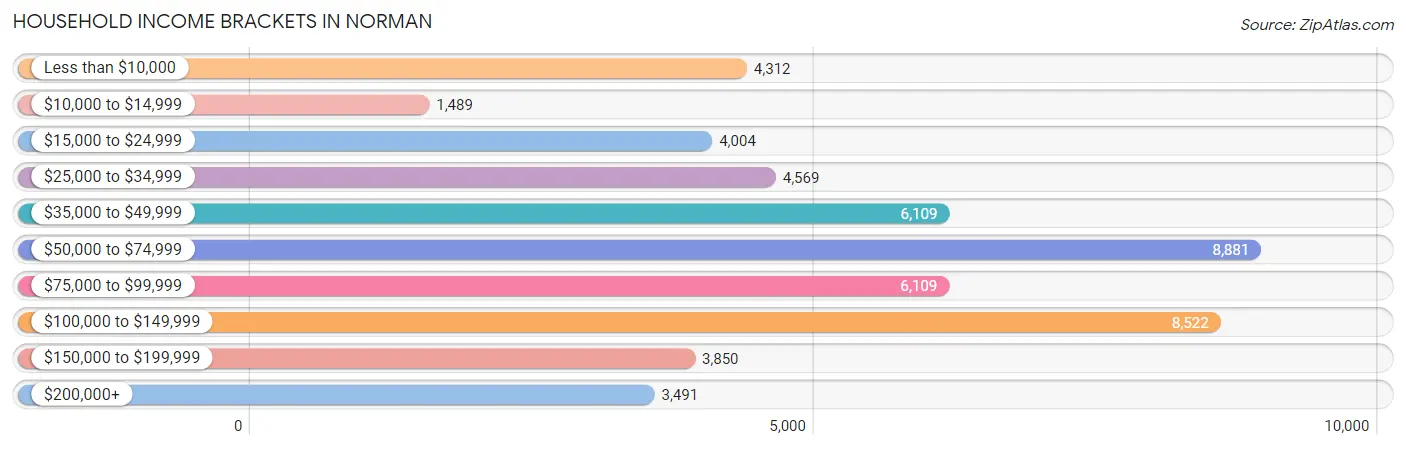
| Income Bracket | # Households | % Households |
| Less than $10,000 | 4,312 | 8.4% |
| $10,000 to $14,999 | 1,489 | 2.9% |
| $15,000 to $24,999 | 4,004 | 7.8% |
| $25,000 to $34,999 | 4,569 | 8.9% |
| $35,000 to $49,999 | 6,109 | 11.9% |
| $50,000 to $74,999 | 8,881 | 17.3% |
| $75,000 to $99,999 | 6,109 | 11.9% |
| $100,000 to $149,999 | 8,522 | 16.6% |
| $150,000 to $199,999 | 3,850 | 7.5% |
| $200,000+ | 3,491 | 6.8% |
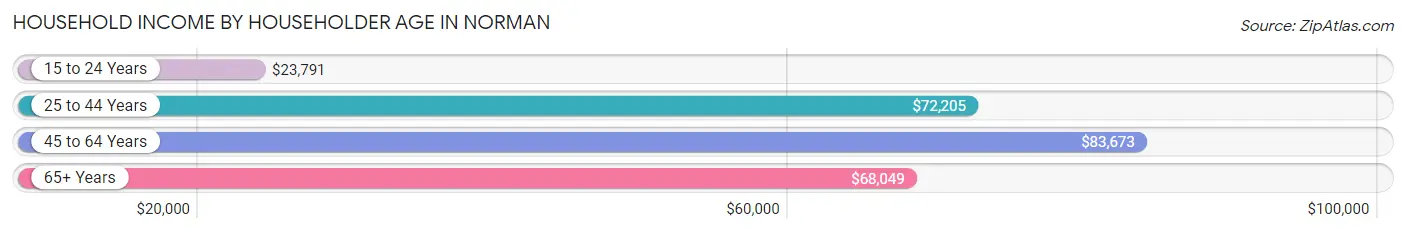
Household Income by Householder Age in Norman
The median household income in Norman is $62,849, with the highest median household income of $83,673 found in the 45 to 64 years age bracket for the primary householder. A total of 14,108 households (27.5%) fall into this category. Meanwhile, the 15 to 24 years age bracket for the primary householder has the lowest median household income of $23,791, with 8,093 households (15.8%) in this group.
| Income Bracket | # Households | Median Income |
| 15 to 24 Years | 8,093 (15.8%) | $23,791 |
| 25 to 44 Years | 18,071 (35.2%) | $72,205 |
| 45 to 64 Years | 14,108 (27.5%) | $83,673 |
| 65+ Years | 11,064 (21.5%) | $68,049 |
| Total | 51,336 (100.0%) | $62,849 |
Poverty in Norman
Income Below Poverty by Sex and Age in Norman
With 17.5% poverty level for males and 18.0% for females among the residents of Norman, 18 to 24 year old males and 18 to 24 year old females are the most vulnerable to poverty, with 5,388 males (46.6%) and 5,890 females (51.0%) in their respective age groups living below the poverty level.
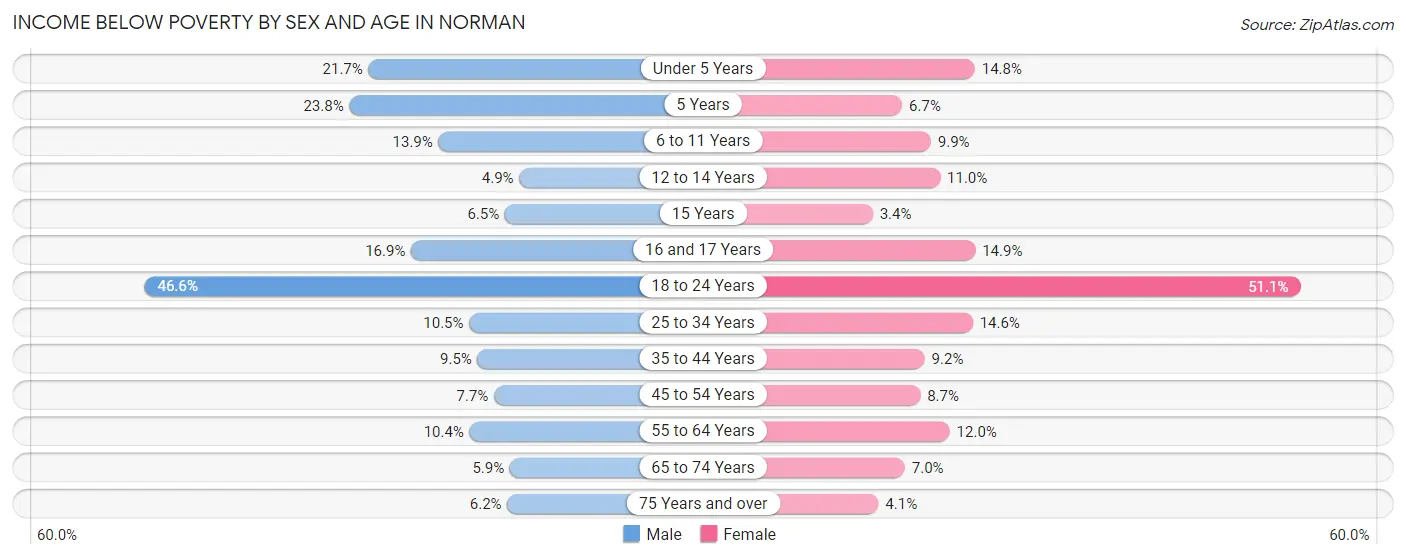
| Age Bracket | Male | Female |
| Under 5 Years | 623 (21.7%) | 349 (14.8%) |
| 5 Years | 191 (23.8%) | 51 (6.7%) |
| 6 to 11 Years | 502 (13.9%) | 348 (9.9%) |
| 12 to 14 Years | 102 (4.9%) | 234 (11.0%) |
| 15 Years | 58 (6.5%) | 30 (3.4%) |
| 16 and 17 Years | 217 (16.9%) | 196 (14.9%) |
| 18 to 24 Years | 5,388 (46.6%) | 5,890 (51.0%) |
| 25 to 34 Years | 917 (10.5%) | 1,204 (14.6%) |
| 35 to 44 Years | 777 (9.5%) | 744 (9.2%) |
| 45 to 54 Years | 414 (7.7%) | 516 (8.7%) |
| 55 to 64 Years | 629 (10.4%) | 767 (12.0%) |
| 65 to 74 Years | 283 (5.9%) | 372 (7.0%) |
| 75 Years and over | 163 (6.2%) | 167 (4.1%) |
| Total | 10,264 (17.5%) | 10,868 (18.0%) |
Income Above Poverty by Sex and Age in Norman
According to the poverty statistics in Norman, males aged 12 to 14 years and females aged 15 years are the age groups that are most secure financially, with 95.1% of males and 96.6% of females in these age groups living above the poverty line.
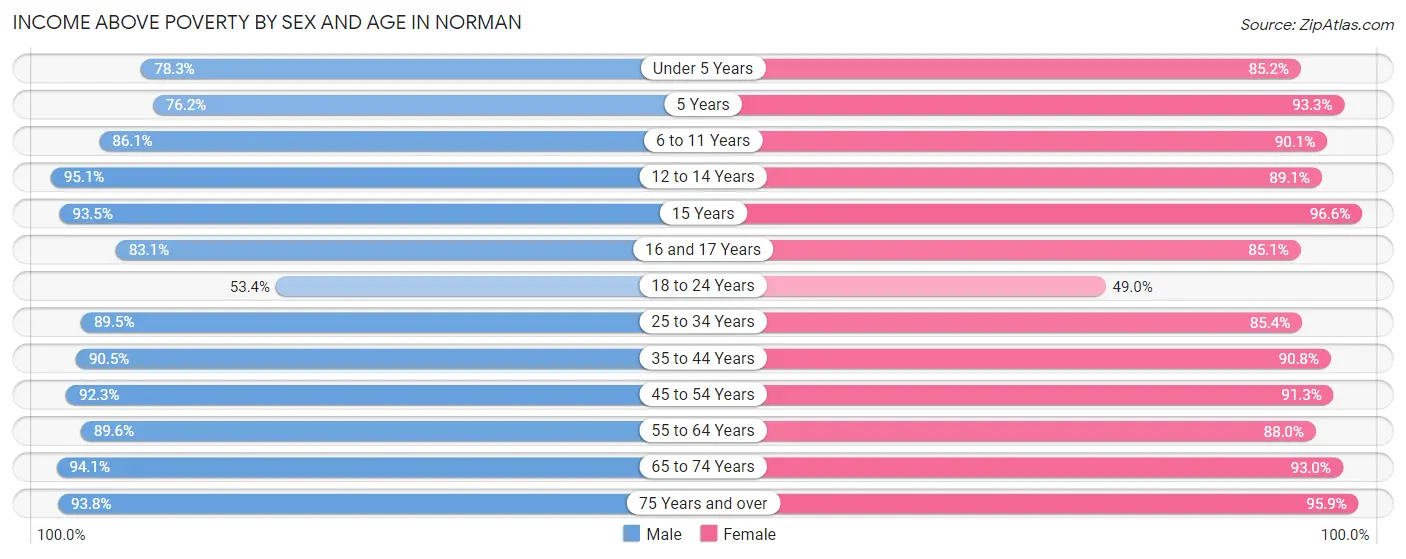
| Age Bracket | Male | Female |
| Under 5 Years | 2,249 (78.3%) | 2,008 (85.2%) |
| 5 Years | 611 (76.2%) | 708 (93.3%) |
| 6 to 11 Years | 3,113 (86.1%) | 3,160 (90.1%) |
| 12 to 14 Years | 1,984 (95.1%) | 1,903 (89.0%) |
| 15 Years | 835 (93.5%) | 842 (96.6%) |
| 16 and 17 Years | 1,064 (83.1%) | 1,123 (85.1%) |
| 18 to 24 Years | 6,164 (53.4%) | 5,648 (48.9%) |
| 25 to 34 Years | 7,842 (89.5%) | 7,053 (85.4%) |
| 35 to 44 Years | 7,367 (90.5%) | 7,319 (90.8%) |
| 45 to 54 Years | 4,955 (92.3%) | 5,396 (91.3%) |
| 55 to 64 Years | 5,401 (89.6%) | 5,620 (88.0%) |
| 65 to 74 Years | 4,480 (94.1%) | 4,929 (93.0%) |
| 75 Years and over | 2,455 (93.8%) | 3,926 (95.9%) |
| Total | 48,520 (82.5%) | 49,635 (82.0%) |
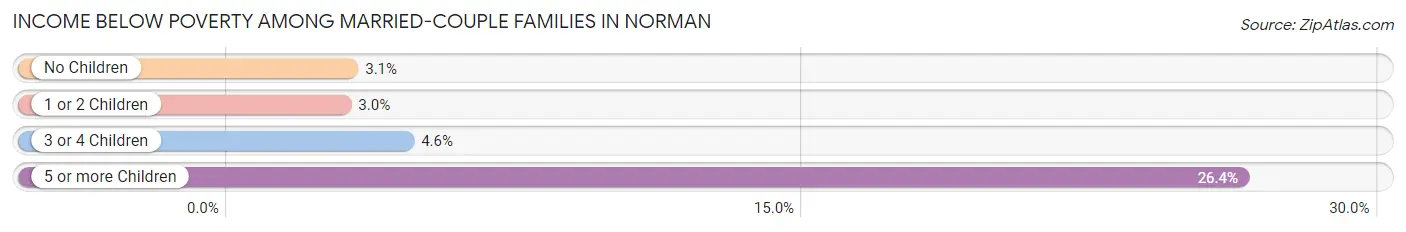
Income Below Poverty Among Married-Couple Families in Norman
The poverty statistics for married-couple families in Norman show that 3.6% or 756 of the total 21,237 families live below the poverty line. Families with 5 or more children have the highest poverty rate of 26.4%, comprising of 84 families. On the other hand, families with 1 or 2 children have the lowest poverty rate of 3.0%, which includes 210 families.
| Children | Above Poverty | Below Poverty |
| No Children | 11,557 (96.9%) | 375 (3.1%) |
| 1 or 2 Children | 6,887 (97.0%) | 210 (3.0%) |
| 3 or 4 Children | 1,803 (95.4%) | 87 (4.6%) |
| 5 or more Children | 234 (73.6%) | 84 (26.4%) |
| Total | 20,481 (96.4%) | 756 (3.6%) |
Income Below Poverty Among Single-Parent Households in Norman
According to the poverty data in Norman, 24.8% or 610 single-father households and 25.0% or 1,294 single-mother households are living below the poverty line. Among single-father households, those with 3 or 4 children have the highest poverty rate, with 38 households (50.0%) experiencing poverty. Likewise, among single-mother households, those with 3 or 4 children have the highest poverty rate, with 180 households (39.8%) falling below the poverty line.
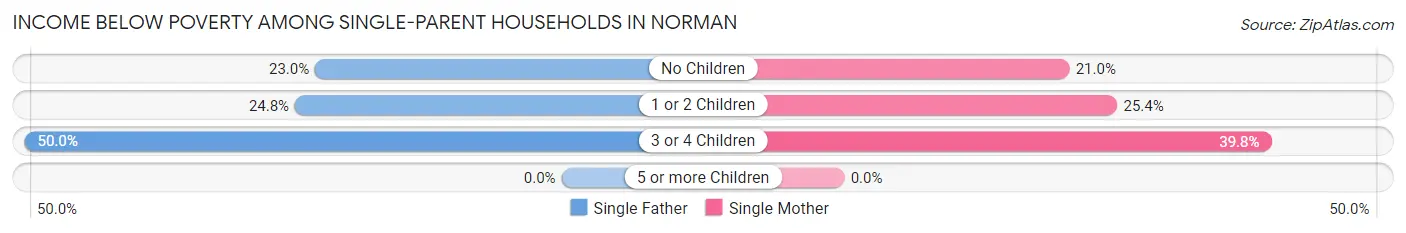
| Children | Single Father | Single Mother |
| No Children | 255 (23.0%) | 373 (21.0%) |
| 1 or 2 Children | 317 (24.8%) | 741 (25.4%) |
| 3 or 4 Children | 38 (50.0%) | 180 (39.8%) |
| 5 or more Children | 0 (0.0%) | 0 (0.0%) |
| Total | 610 (24.8%) | 1,294 (25.0%) |
Income Below Poverty Among Married-Couple vs Single-Parent Households in Norman
The poverty data for Norman shows that 756 of the married-couple family households (3.6%) and 1,904 of the single-parent households (24.9%) are living below the poverty level. Within the married-couple family households, those with 5 or more children have the highest poverty rate, with 84 households (26.4%) falling below the poverty line. Among the single-parent households, those with 3 or 4 children have the highest poverty rate, with 218 household (41.3%) living below poverty.
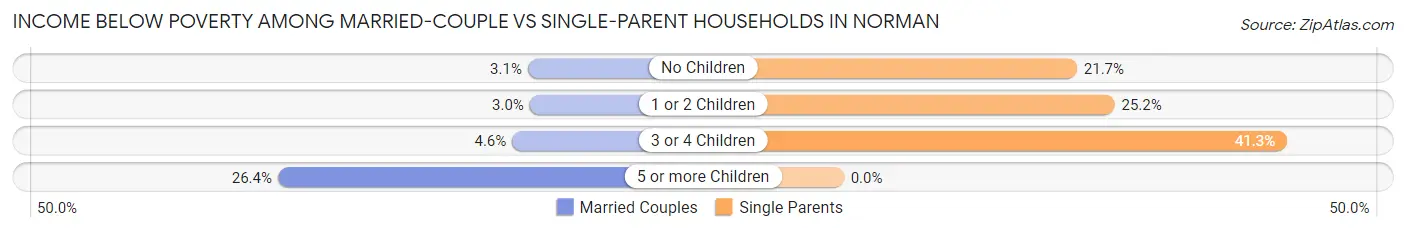
| Children | Married-Couple Families | Single-Parent Households |
| No Children | 375 (3.1%) | 628 (21.7%) |
| 1 or 2 Children | 210 (3.0%) | 1,058 (25.2%) |
| 3 or 4 Children | 87 (4.6%) | 218 (41.3%) |
| 5 or more Children | 84 (26.4%) | 0 (0.0%) |
| Total | 756 (3.6%) | 1,904 (24.9%) |
Race in Norman
The most populous races in Norman are White / Caucasian (93,634 | 73.3%), Two or more Races (13,634 | 10.7%), and Hispanic or Latino (10,926 | 8.6%).
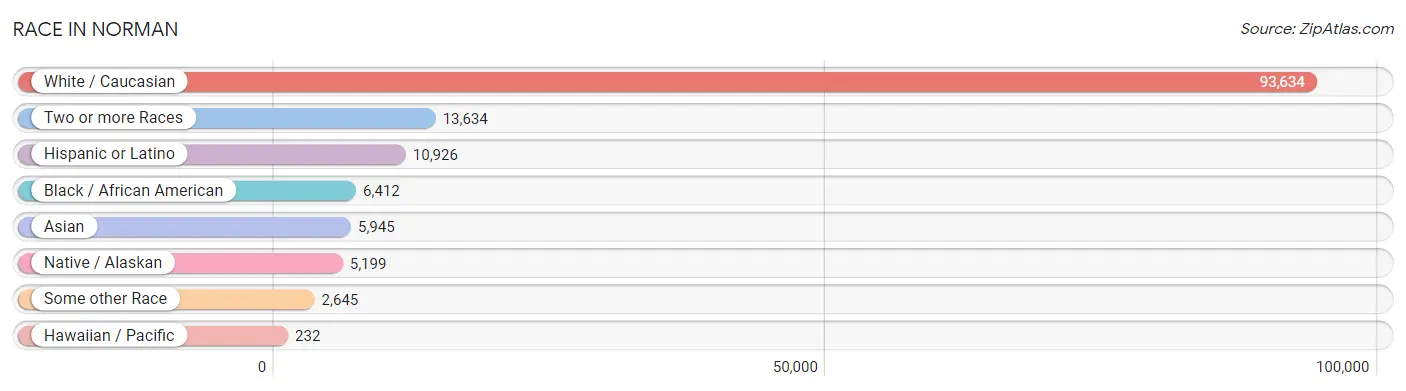
| Race | # Population | % Population |
| Asian | 5,945 | 4.7% |
| Black / African American | 6,412 | 5.0% |
| Hawaiian / Pacific | 232 | 0.2% |
| Hispanic or Latino | 10,926 | 8.6% |
| Native / Alaskan | 5,199 | 4.1% |
| White / Caucasian | 93,634 | 73.3% |
| Two or more Races | 13,634 | 10.7% |
| Some other Race | 2,645 | 2.1% |
| Total | 127,701 | 100.0% |
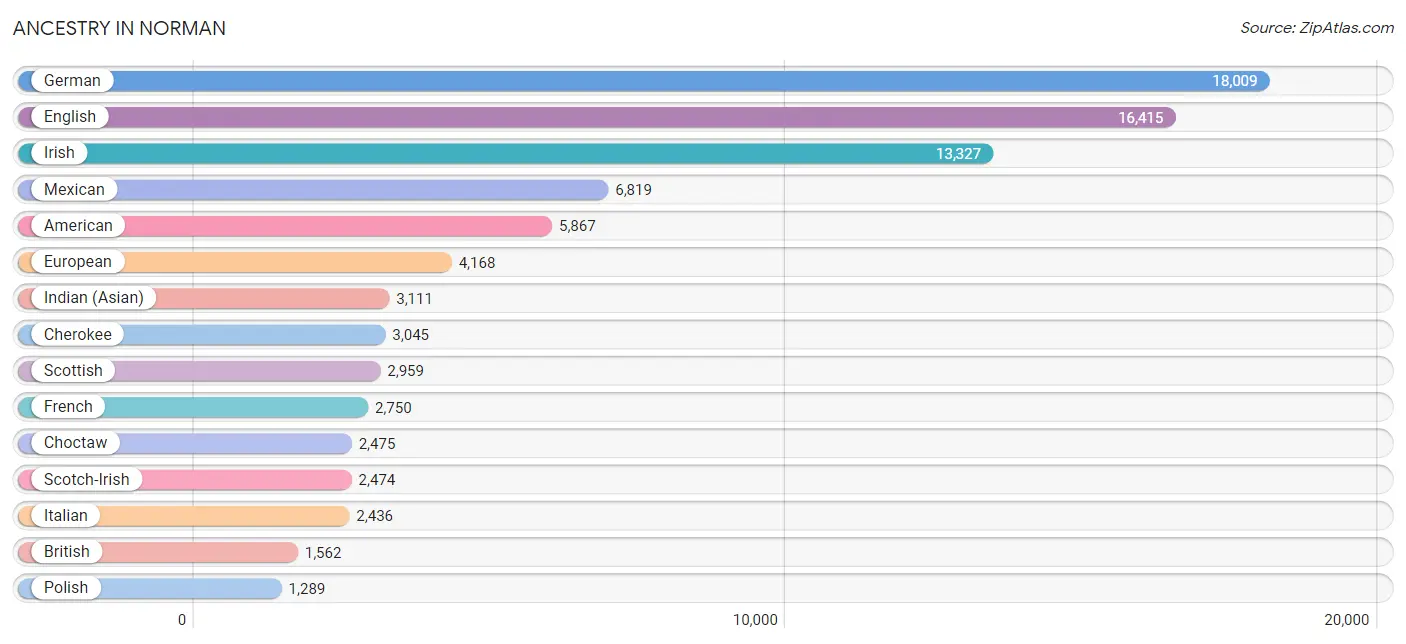
Ancestry in Norman
The most populous ancestries reported in Norman are German (18,009 | 14.1%), English (16,415 | 12.9%), Irish (13,327 | 10.4%), Mexican (6,819 | 5.3%), and American (5,867 | 4.6%), together accounting for 47.3% of all Norman residents.
| Ancestry | # Population | % Population |
| Afghan | 28 | 0.0% |
| African | 562 | 0.4% |
| Alsatian | 23 | 0.0% |
| American | 5,867 | 4.6% |
| Apache | 15 | 0.0% |
| Arab | 747 | 0.6% |
| Arapaho | 6 | 0.0% |
| Argentinean | 148 | 0.1% |
| Armenian | 8 | 0.0% |
| Australian | 29 | 0.0% |
| Austrian | 39 | 0.0% |
| Bahamian | 55 | 0.0% |
| Bangladeshi | 15 | 0.0% |
| Belgian | 161 | 0.1% |
| Belizean | 15 | 0.0% |
| Bhutanese | 472 | 0.4% |
| Blackfeet | 41 | 0.0% |
| Bolivian | 49 | 0.0% |
| Brazilian | 71 | 0.1% |
| British | 1,562 | 1.2% |
| Bulgarian | 15 | 0.0% |
| Burmese | 504 | 0.4% |
| Cajun | 28 | 0.0% |
| Canadian | 266 | 0.2% |
| Celtic | 67 | 0.1% |
| Central American | 1,244 | 1.0% |
| Central American Indian | 148 | 0.1% |
| Cherokee | 3,045 | 2.4% |
| Cheyenne | 75 | 0.1% |
| Chickasaw | 1,134 | 0.9% |
| Chippewa | 11 | 0.0% |
| Choctaw | 2,475 | 1.9% |
| Colombian | 275 | 0.2% |
| Comanche | 207 | 0.2% |
| Costa Rican | 10 | 0.0% |
| Creek | 865 | 0.7% |
| Croatian | 30 | 0.0% |
| Crow | 25 | 0.0% |
| Cuban | 119 | 0.1% |
| Czech | 616 | 0.5% |
| Czechoslovakian | 23 | 0.0% |
| Danish | 262 | 0.2% |
| Delaware | 46 | 0.0% |
| Dutch | 1,150 | 0.9% |
| Dutch West Indian | 165 | 0.1% |
| Eastern European | 497 | 0.4% |
| Ecuadorian | 19 | 0.0% |
| English | 16,415 | 12.9% |
| European | 4,168 | 3.3% |
| Finnish | 143 | 0.1% |
| French | 2,750 | 2.1% |
| French American Indian | 6 | 0.0% |
| French Canadian | 229 | 0.2% |
| German | 18,009 | 14.1% |
| German Russian | 7 | 0.0% |
| Ghanaian | 50 | 0.0% |
| Greek | 313 | 0.3% |
| Guamanian / Chamorro | 39 | 0.0% |
| Guatemalan | 170 | 0.1% |
| Haitian | 49 | 0.0% |
| Honduran | 42 | 0.0% |
| Hungarian | 275 | 0.2% |
| Indian (Asian) | 3,111 | 2.4% |
| Inupiat | 13 | 0.0% |
| Iranian | 795 | 0.6% |
| Iraqi | 45 | 0.0% |
| Irish | 13,327 | 10.4% |
| Iroquois | 11 | 0.0% |
| Israeli | 12 | 0.0% |
| Italian | 2,436 | 1.9% |
| Jamaican | 55 | 0.0% |
| Japanese | 18 | 0.0% |
| Jordanian | 28 | 0.0% |
| Kenyan | 134 | 0.1% |
| Kiowa | 298 | 0.2% |
| Korean | 470 | 0.4% |
| Laotian | 63 | 0.1% |
| Lebanese | 290 | 0.2% |
| Lithuanian | 16 | 0.0% |
| Macedonian | 16 | 0.0% |
| Malaysian | 147 | 0.1% |
| Mexican | 6,819 | 5.3% |
| Mexican American Indian | 72 | 0.1% |
| Mongolian | 28 | 0.0% |
| Moroccan | 110 | 0.1% |
| Native Hawaiian | 286 | 0.2% |
| Navajo | 65 | 0.1% |
| New Zealander | 4 | 0.0% |
| Nigerian | 3 | 0.0% |
| Northern European | 277 | 0.2% |
| Norwegian | 1,164 | 0.9% |
| Osage | 136 | 0.1% |
| Ottawa | 11 | 0.0% |
| Pakistani | 461 | 0.4% |
| Paraguayan | 9 | 0.0% |
| Pennsylvania German | 22 | 0.0% |
| Peruvian | 57 | 0.0% |
| Polish | 1,289 | 1.0% |
| Portuguese | 275 | 0.2% |
| Potawatomi | 377 | 0.3% |
| Pueblo | 2 | 0.0% |
| Puerto Rican | 724 | 0.6% |
| Puget Sound Salish | 96 | 0.1% |
| Romanian | 80 | 0.1% |
| Russian | 589 | 0.5% |
| Salvadoran | 1,022 | 0.8% |
| Samoan | 28 | 0.0% |
| Scandinavian | 539 | 0.4% |
| Scotch-Irish | 2,474 | 1.9% |
| Scottish | 2,959 | 2.3% |
| Seminole | 307 | 0.2% |
| Sierra Leonean | 2 | 0.0% |
| Sioux | 196 | 0.2% |
| Slovak | 107 | 0.1% |
| Slovene | 119 | 0.1% |
| South American | 672 | 0.5% |
| South American Indian | 7 | 0.0% |
| Spaniard | 779 | 0.6% |
| Spanish | 190 | 0.2% |
| Spanish American | 2 | 0.0% |
| Sri Lankan | 783 | 0.6% |
| Subsaharan African | 823 | 0.6% |
| Swedish | 1,132 | 0.9% |
| Swiss | 272 | 0.2% |
| Syrian | 51 | 0.0% |
| Thai | 1,253 | 1.0% |
| Turkish | 159 | 0.1% |
| Ugandan | 22 | 0.0% |
| Ukrainian | 132 | 0.1% |
| Venezuelan | 115 | 0.1% |
| Welsh | 1,138 | 0.9% |
| West Indian | 31 | 0.0% |
| Yugoslavian | 15 | 0.0% |
| Zimbabwean | 5 | 0.0% | View All 134 Rows |
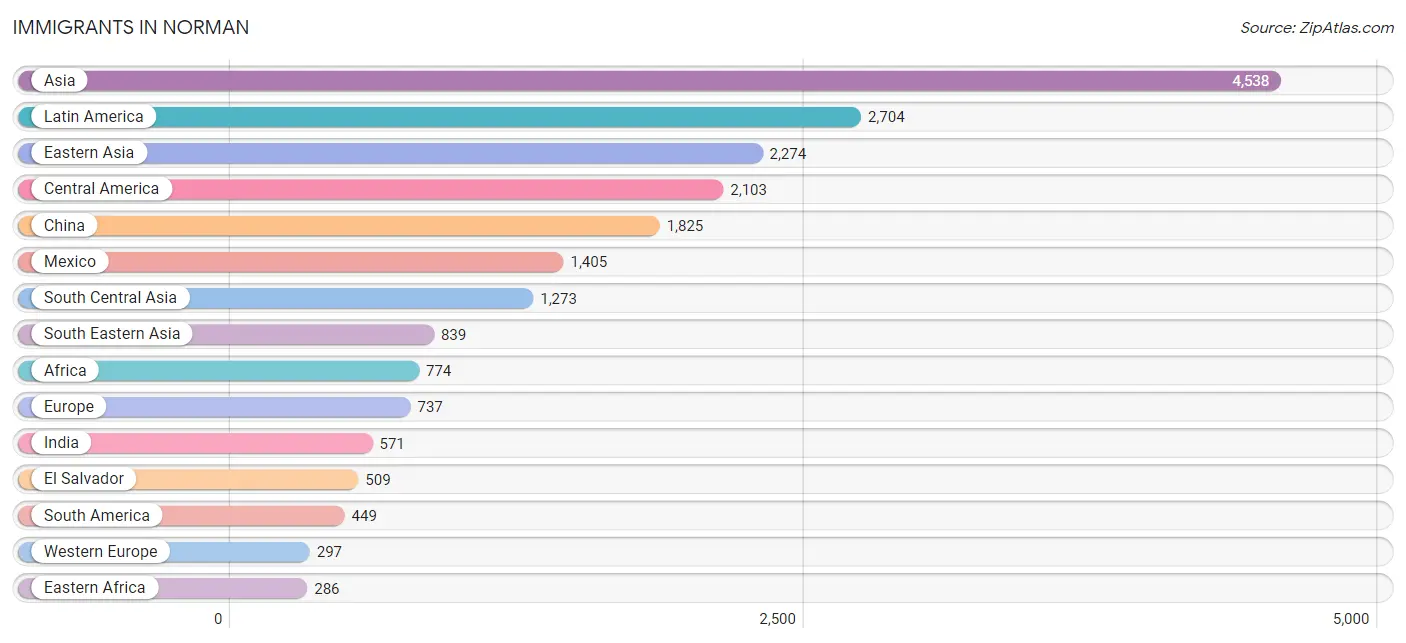
Immigrants in Norman
The most numerous immigrant groups reported in Norman came from Asia (4,538 | 3.5%), Latin America (2,704 | 2.1%), Eastern Asia (2,274 | 1.8%), Central America (2,103 | 1.7%), and China (1,825 | 1.4%), together accounting for 10.5% of all Norman residents.
| Immigration Origin | # Population | % Population |
| Afghanistan | 66 | 0.1% |
| Africa | 774 | 0.6% |
| Argentina | 92 | 0.1% |
| Asia | 4,538 | 3.5% |
| Australia | 31 | 0.0% |
| Bahamas | 70 | 0.1% |
| Bangladesh | 115 | 0.1% |
| Belize | 15 | 0.0% |
| Bolivia | 36 | 0.0% |
| Brazil | 34 | 0.0% |
| Cambodia | 6 | 0.0% |
| Cameroon | 1 | 0.0% |
| Canada | 232 | 0.2% |
| Caribbean | 152 | 0.1% |
| Central America | 2,103 | 1.7% |
| China | 1,825 | 1.4% |
| Colombia | 155 | 0.1% |
| Congo | 39 | 0.0% |
| Costa Rica | 10 | 0.0% |
| Cuba | 10 | 0.0% |
| Czechoslovakia | 11 | 0.0% |
| Eastern Africa | 286 | 0.2% |
| Eastern Asia | 2,274 | 1.8% |
| Eastern Europe | 210 | 0.2% |
| El Salvador | 509 | 0.4% |
| England | 86 | 0.1% |
| Europe | 737 | 0.6% |
| France | 9 | 0.0% |
| Germany | 235 | 0.2% |
| Ghana | 38 | 0.0% |
| Guatemala | 129 | 0.1% |
| Haiti | 36 | 0.0% |
| Honduras | 35 | 0.0% |
| Hong Kong | 25 | 0.0% |
| India | 571 | 0.4% |
| Indonesia | 63 | 0.1% |
| Iran | 260 | 0.2% |
| Iraq | 45 | 0.0% |
| Ireland | 13 | 0.0% |
| Israel | 11 | 0.0% |
| Italy | 3 | 0.0% |
| Jamaica | 36 | 0.0% |
| Japan | 170 | 0.1% |
| Kenya | 208 | 0.2% |
| Korea | 279 | 0.2% |
| Laos | 180 | 0.1% |
| Latin America | 2,704 | 2.1% |
| Lebanon | 17 | 0.0% |
| Malaysia | 39 | 0.0% |
| Mexico | 1,405 | 1.1% |
| Middle Africa | 82 | 0.1% |
| Morocco | 45 | 0.0% |
| Nepal | 56 | 0.0% |
| Netherlands | 42 | 0.0% |
| Nigeria | 28 | 0.0% |
| Northern Africa | 129 | 0.1% |
| Northern Europe | 189 | 0.2% |
| Norway | 12 | 0.0% |
| Oceania | 88 | 0.1% |
| Pakistan | 112 | 0.1% |
| Peru | 67 | 0.1% |
| Philippines | 241 | 0.2% |
| Poland | 32 | 0.0% |
| Romania | 11 | 0.0% |
| Russia | 49 | 0.0% |
| Scotland | 24 | 0.0% |
| Sierra Leone | 104 | 0.1% |
| South America | 449 | 0.4% |
| South Central Asia | 1,273 | 1.0% |
| South Eastern Asia | 839 | 0.7% |
| Southern Europe | 41 | 0.0% |
| Spain | 38 | 0.0% |
| Sri Lanka | 27 | 0.0% |
| Sudan | 34 | 0.0% |
| Thailand | 211 | 0.2% |
| Turkey | 42 | 0.0% |
| Uganda | 10 | 0.0% |
| Ukraine | 15 | 0.0% |
| Uzbekistan | 54 | 0.0% |
| Venezuela | 56 | 0.0% |
| Vietnam | 99 | 0.1% |
| Western Africa | 209 | 0.2% |
| Western Asia | 134 | 0.1% |
| Western Europe | 297 | 0.2% |
| Zaire | 42 | 0.0% |
| Zimbabwe | 41 | 0.0% | View All 86 Rows |
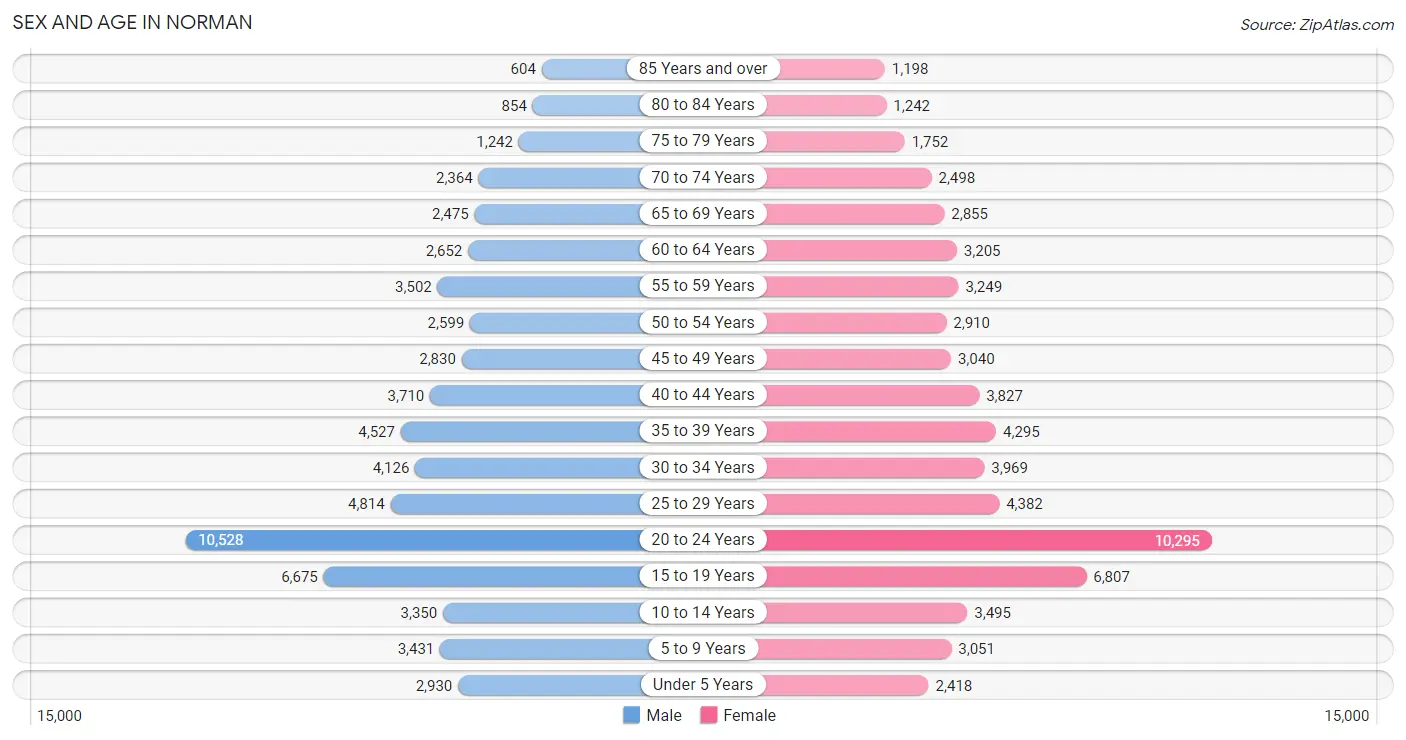
Sex and Age in Norman
Sex and Age in Norman
The most populous age groups in Norman are 20 to 24 Years (10,528 | 16.7%) for men and 20 to 24 Years (10,295 | 16.0%) for women.
| Age Bracket | Male | Female |
| Under 5 Years | 2,930 (4.6%) | 2,418 (3.7%) |
| 5 to 9 Years | 3,431 (5.4%) | 3,051 (4.7%) |
| 10 to 14 Years | 3,350 (5.3%) | 3,495 (5.4%) |
| 15 to 19 Years | 6,675 (10.6%) | 6,807 (10.6%) |
| 20 to 24 Years | 10,528 (16.7%) | 10,295 (16.0%) |
| 25 to 29 Years | 4,814 (7.6%) | 4,382 (6.8%) |
| 30 to 34 Years | 4,126 (6.5%) | 3,969 (6.1%) |
| 35 to 39 Years | 4,527 (7.2%) | 4,295 (6.7%) |
| 40 to 44 Years | 3,710 (5.9%) | 3,827 (5.9%) |
| 45 to 49 Years | 2,830 (4.5%) | 3,040 (4.7%) |
| 50 to 54 Years | 2,599 (4.1%) | 2,910 (4.5%) |
| 55 to 59 Years | 3,502 (5.5%) | 3,249 (5.0%) |
| 60 to 64 Years | 2,652 (4.2%) | 3,205 (5.0%) |
| 65 to 69 Years | 2,475 (3.9%) | 2,855 (4.4%) |
| 70 to 74 Years | 2,364 (3.7%) | 2,498 (3.9%) |
| 75 to 79 Years | 1,242 (2.0%) | 1,752 (2.7%) |
| 80 to 84 Years | 854 (1.3%) | 1,242 (1.9%) |
| 85 Years and over | 604 (1.0%) | 1,198 (1.9%) |
| Total | 63,213 (100.0%) | 64,488 (100.0%) |
Families and Households in Norman
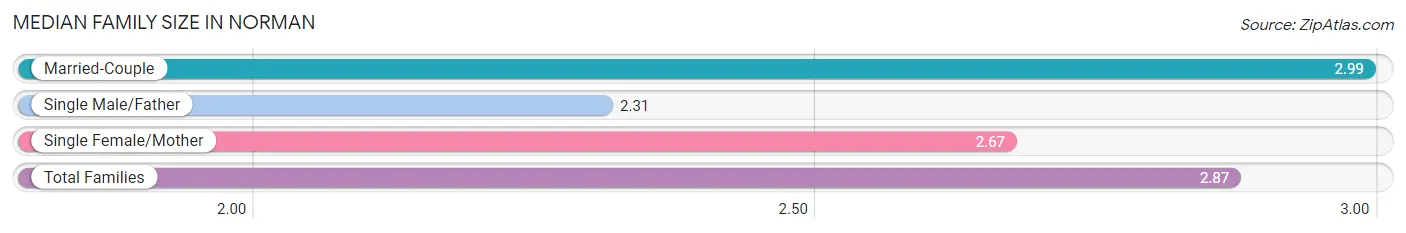
Median Family Size in Norman
The median family size in Norman is 2.87 persons per family, with married-couple families (21,237 | 73.5%) accounting for the largest median family size of 2.99 persons per family. On the other hand, single male/father families (2,464 | 8.5%) represent the smallest median family size with 2.31 persons per family.
| Family Type | # Families | Family Size |
| Married-Couple | 21,237 (73.5%) | 2.99 |
| Single Male/Father | 2,464 (8.5%) | 2.31 |
| Single Female/Mother | 5,179 (17.9%) | 2.67 |
| Total Families | 28,880 (100.0%) | 2.87 |
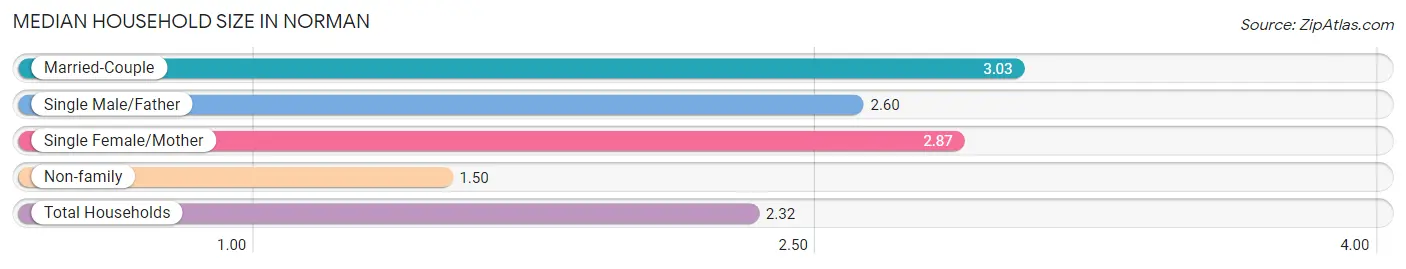
Median Household Size in Norman
The median household size in Norman is 2.32 persons per household, with married-couple households (21,237 | 41.4%) accounting for the largest median household size of 3.03 persons per household. non-family households (22,456 | 43.7%) represent the smallest median household size with 1.50 persons per household.
| Household Type | # Households | Household Size |
| Married-Couple | 21,237 (41.4%) | 3.03 |
| Single Male/Father | 2,464 (4.8%) | 2.60 |
| Single Female/Mother | 5,179 (10.1%) | 2.87 |
| Non-family | 22,456 (43.7%) | 1.50 |
| Total Households | 51,336 (100.0%) | 2.32 |
Household Size by Marriage Status in Norman
Out of a total of 51,336 households in Norman, 28,880 (56.3%) are family households, while 22,456 (43.7%) are nonfamily households. The most numerous type of family households are 2-person households, comprising 13,607, and the most common type of nonfamily households are 1-person households, comprising 16,269.
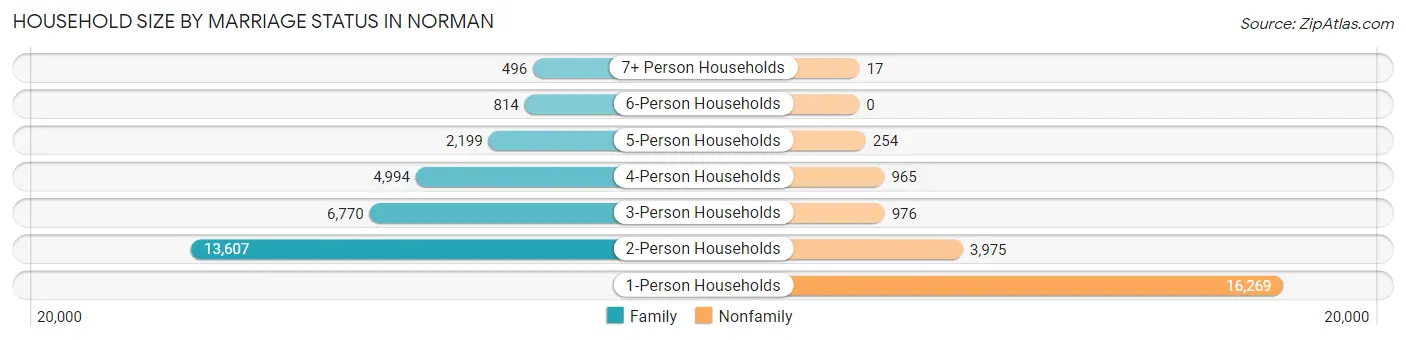
| Household Size | Family Households | Nonfamily Households |
| 1-Person Households | - | 16,269 (31.7%) |
| 2-Person Households | 13,607 (26.5%) | 3,975 (7.7%) |
| 3-Person Households | 6,770 (13.2%) | 976 (1.9%) |
| 4-Person Households | 4,994 (9.7%) | 965 (1.9%) |
| 5-Person Households | 2,199 (4.3%) | 254 (0.5%) |
| 6-Person Households | 814 (1.6%) | 0 (0.0%) |
| 7+ Person Households | 496 (1.0%) | 17 (0.0%) |
| Total | 28,880 (56.3%) | 22,456 (43.7%) |
Female Fertility in Norman
Fertility by Age in Norman
Average fertility rate in Norman is 40.0 births per 1,000 women. Women in the age bracket of 20 to 34 years have the highest fertility rate with 58.0 births per 1,000 women. Women in the age bracket of 20 to 34 years acount for 73.1% of all women with births.
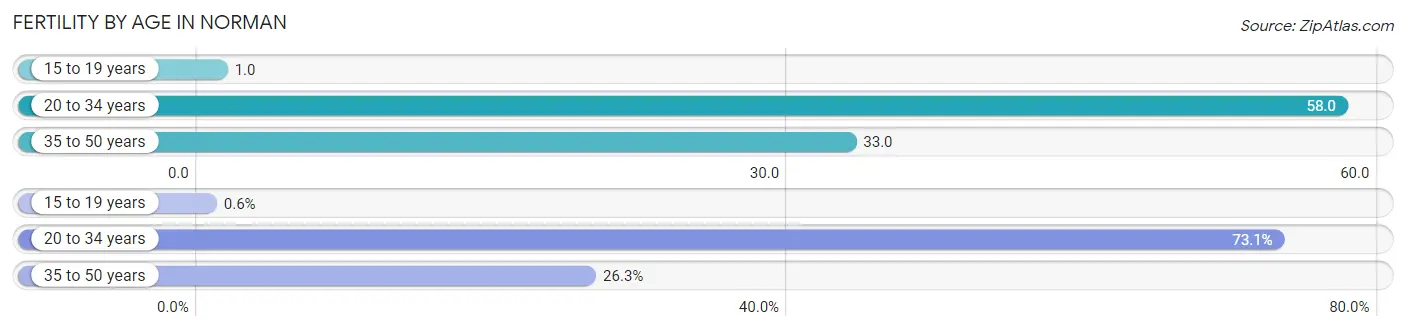
| Age Bracket | Women with Births | Births / 1,000 Women |
| 15 to 19 years | 9 (0.6%) | 1.0 |
| 20 to 34 years | 1,087 (73.1%) | 58.0 |
| 35 to 50 years | 392 (26.3%) | 33.0 |
| Total | 1,488 (100.0%) | 40.0 |
Fertility by Age by Marriage Status in Norman
91.7% of women with births (1,488) in Norman are married. The highest percentage of unmarried women with births falls into 15 to 19 years age bracket with 100.0% of them unmarried at the time of birth, while the lowest percentage of unmarried women with births belong to 35 to 50 years age bracket with 2.3% of them unmarried.
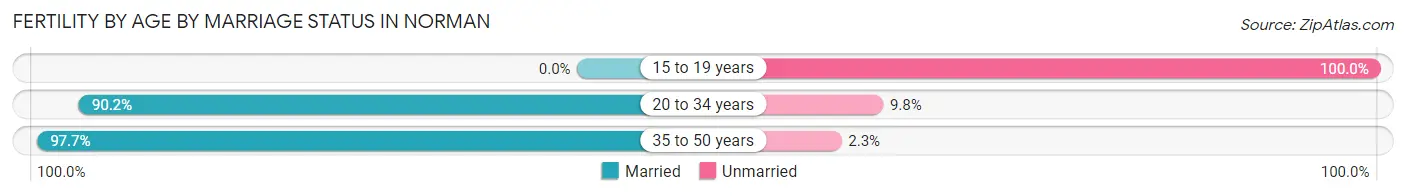
| Age Bracket | Married | Unmarried |
| 15 to 19 years | 0 (0.0%) | 9 (100.0%) |
| 20 to 34 years | 980 (90.2%) | 107 (9.8%) |
| 35 to 50 years | 383 (97.7%) | 9 (2.3%) |
| Total | 1,364 (91.7%) | 124 (8.3%) |
Fertility by Education in Norman
Average fertility rate in Norman is 40.0 births per 1,000 women. Women with the education attainment of graduate degree have the highest fertility rate of 64.0 births per 1,000 women, while women with the education attainment of high school diploma have the lowest fertility at 27.0 births per 1,000 women. Women with the education attainment of college or associate's degree represent 45.4% of all women with births.
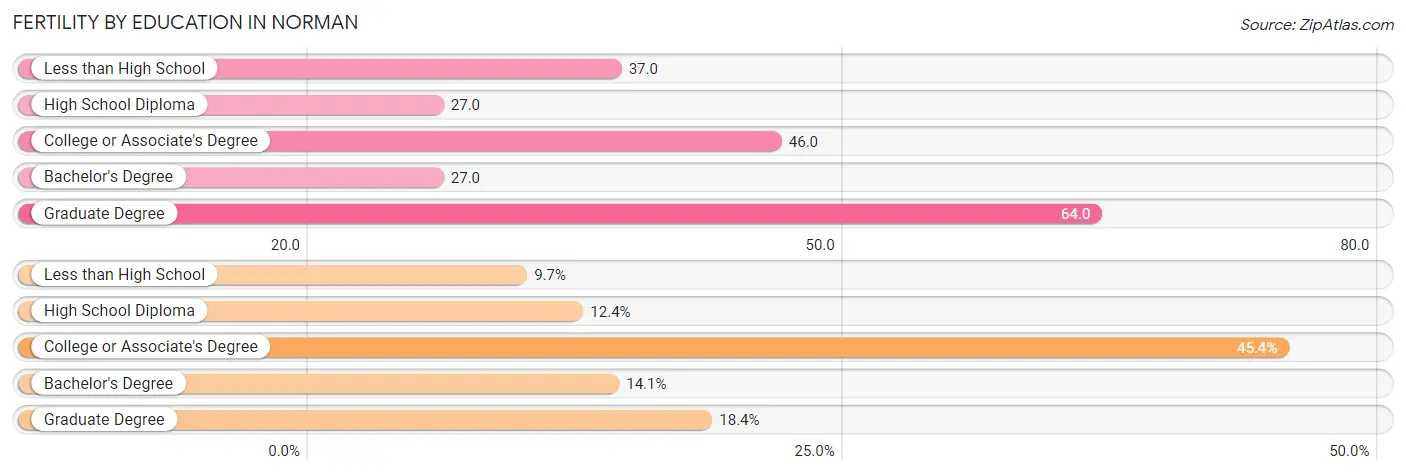
| Educational Attainment | Women with Births | Births / 1,000 Women |
| Less than High School | 145 (9.7%) | 37.0 |
| High School Diploma | 184 (12.4%) | 27.0 |
| College or Associate's Degree | 676 (45.4%) | 46.0 |
| Bachelor's Degree | 209 (14.1%) | 27.0 |
| Graduate Degree | 274 (18.4%) | 64.0 |
| Total | 1,488 (100.0%) | 40.0 |
Fertility by Education by Marriage Status in Norman
8.3% of women with births in Norman are unmarried. Women with the educational attainment of bachelor's degree are most likely to be married with 100.0% of them married at childbirth, while women with the educational attainment of less than high school are least likely to be married with 27.6% of them unmarried at childbirth.
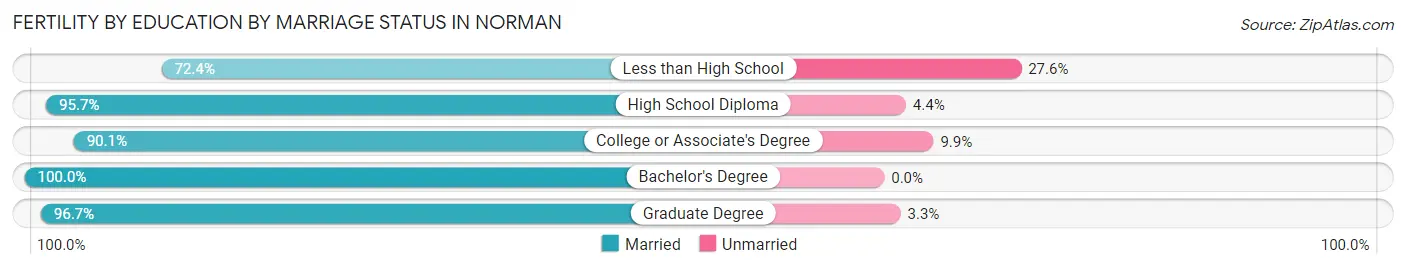
| Educational Attainment | Married | Unmarried |
| Less than High School | 105 (72.4%) | 40 (27.6%) |
| High School Diploma | 176 (95.7%) | 8 (4.3%) |
| College or Associate's Degree | 609 (90.1%) | 67 (9.9%) |
| Bachelor's Degree | 209 (100.0%) | 0 (0.0%) |
| Graduate Degree | 265 (96.7%) | 9 (3.3%) |
| Total | 1,364 (91.7%) | 124 (8.3%) |
Employment Characteristics in Norman
Employment by Class of Employer in Norman
Among the 63,763 employed individuals in Norman, private company employees (37,715 | 59.2%), state government employees (8,219 | 12.9%), and not-for-profit organizations (5,569 | 8.7%) make up the most common classes of employment.
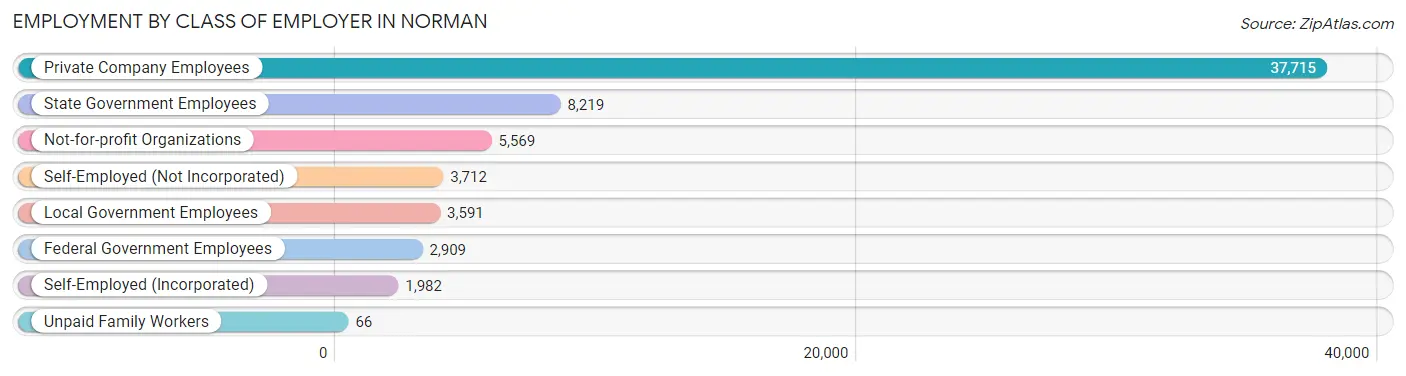
| Employer Class | # Employees | % Employees |
| Private Company Employees | 37,715 | 59.2% |
| Self-Employed (Incorporated) | 1,982 | 3.1% |
| Self-Employed (Not Incorporated) | 3,712 | 5.8% |
| Not-for-profit Organizations | 5,569 | 8.7% |
| Local Government Employees | 3,591 | 5.6% |
| State Government Employees | 8,219 | 12.9% |
| Federal Government Employees | 2,909 | 4.6% |
| Unpaid Family Workers | 66 | 0.1% |
| Total | 63,763 | 100.0% |
Employment Status by Age in Norman
According to the labor force statistics for Norman, out of the total population over 16 years of age (107,253), 64.4% or 69,071 individuals are in the labor force, with 5.8% or 4,006 of them unemployed. The age group with the highest labor force participation rate is 35 to 44 years, with 84.2% or 13,774 individuals in the labor force. Within the labor force, the 16 to 19 years age range has the highest percentage of unemployed individuals, with 20.4% or 972 of them being unemployed.
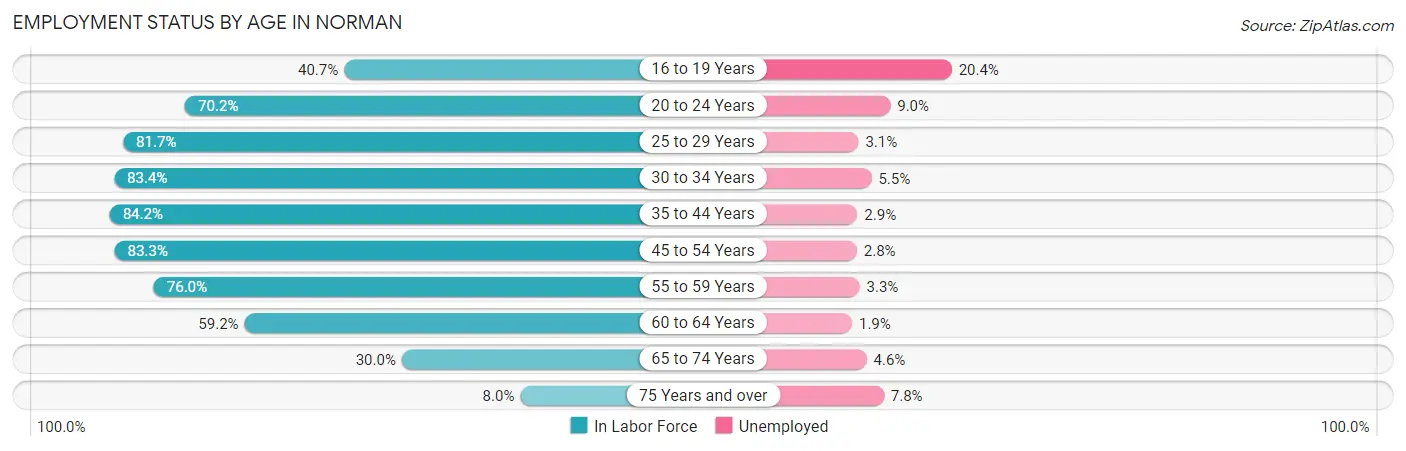
| Age Bracket | In Labor Force | Unemployed |
| 16 to 19 Years | 4,766 (40.7%) | 972 (20.4%) |
| 20 to 24 Years | 14,618 (70.2%) | 1,316 (9.0%) |
| 25 to 29 Years | 7,513 (81.7%) | 233 (3.1%) |
| 30 to 34 Years | 6,751 (83.4%) | 371 (5.5%) |
| 35 to 44 Years | 13,774 (84.2%) | 399 (2.9%) |
| 45 to 54 Years | 9,479 (83.3%) | 265 (2.8%) |
| 55 to 59 Years | 5,131 (76.0%) | 169 (3.3%) |
| 60 to 64 Years | 3,467 (59.2%) | 66 (1.9%) |
| 65 to 74 Years | 3,058 (30.0%) | 141 (4.6%) |
| 75 Years and over | 551 (8.0%) | 43 (7.8%) |
| Total | 69,071 (64.4%) | 4,006 (5.8%) |
Employment Status by Educational Attainment in Norman
According to labor force statistics for Norman, 80.0% of individuals (46,110) out of the total population between 25 and 64 years of age (57,637) are in the labor force, with 3.3% or 1,522 of them being unemployed. The group with the highest labor force participation rate are those with the educational attainment of bachelor's degree or higher, with 86.9% or 22,425 individuals in the labor force. Within the labor force, individuals with less than high school education have the highest percentage of unemployment, with 6.3% or 138 of them being unemployed.
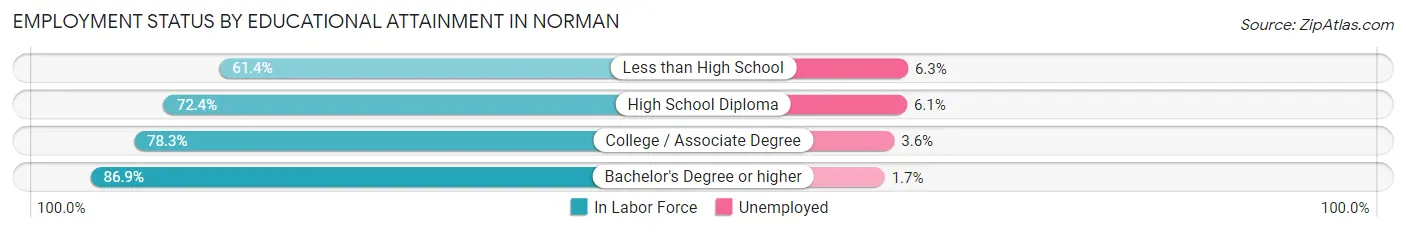
| Educational Attainment | In Labor Force | Unemployed |
| Less than High School | 2,197 (61.4%) | 225 (6.3%) |
| High School Diploma | 7,738 (72.4%) | 652 (6.1%) |
| College / Associate Degree | 13,753 (78.3%) | 632 (3.6%) |
| Bachelor's Degree or higher | 22,425 (86.9%) | 439 (1.7%) |
| Total | 46,110 (80.0%) | 1,902 (3.3%) |
Employment Occupations by Sex in Norman
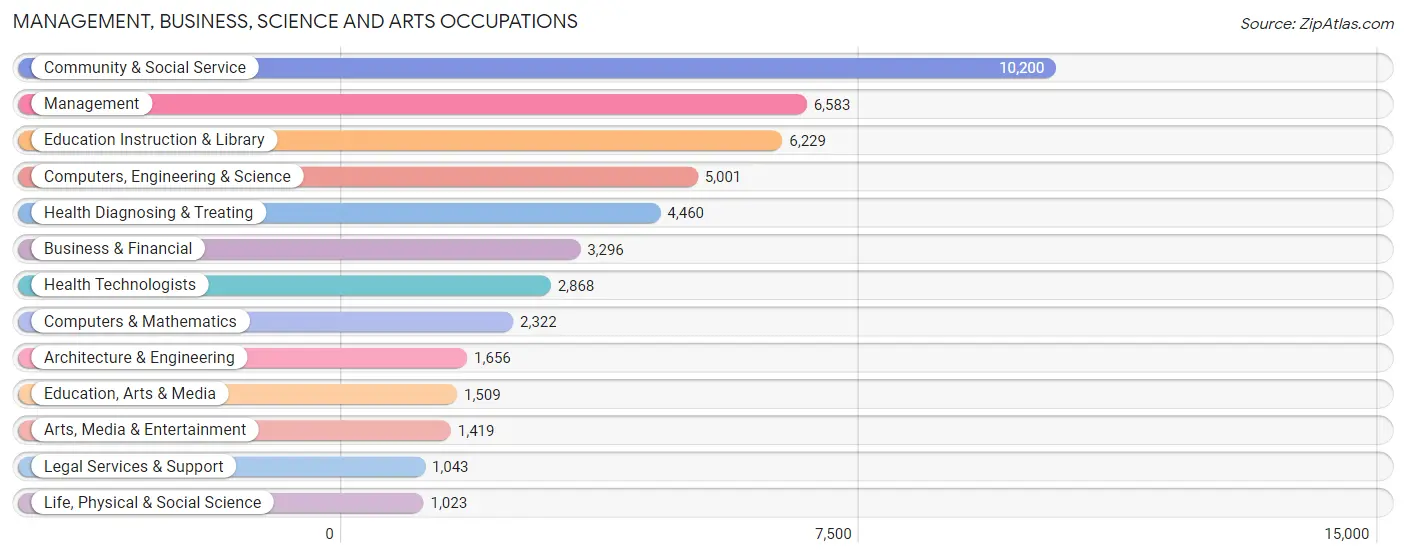
Management, Business, Science and Arts Occupations
The most common Management, Business, Science and Arts occupations in Norman are Community & Social Service (10,200 | 15.8%), Management (6,583 | 10.2%), Education Instruction & Library (6,229 | 9.7%), Computers, Engineering & Science (5,001 | 7.7%), and Health Diagnosing & Treating (4,460 | 6.9%).
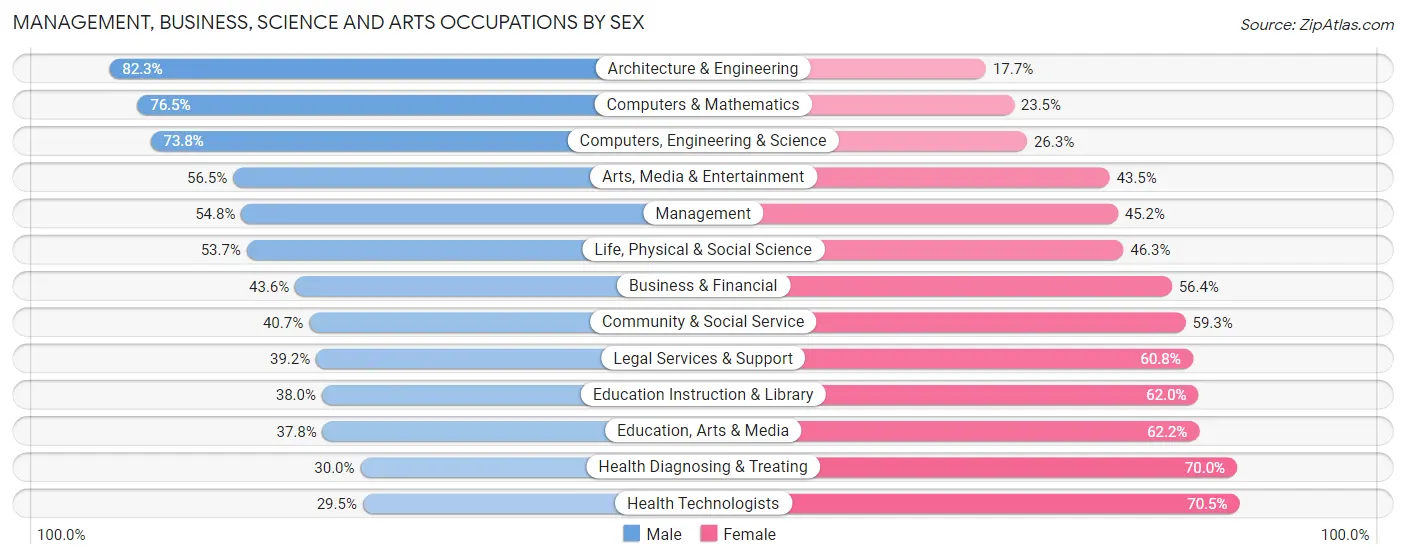
Management, Business, Science and Arts Occupations by Sex
Within the Management, Business, Science and Arts occupations in Norman, the most male-oriented occupations are Architecture & Engineering (82.3%), Computers & Mathematics (76.5%), and Computers, Engineering & Science (73.8%), while the most female-oriented occupations are Health Technologists (70.5%), Health Diagnosing & Treating (70.0%), and Education, Arts & Media (62.2%).
| Occupation | Male | Female |
| Management | 3,608 (54.8%) | 2,975 (45.2%) |
| Business & Financial | 1,436 (43.6%) | 1,860 (56.4%) |
| Computers, Engineering & Science | 3,688 (73.8%) | 1,313 (26.3%) |
| Computers & Mathematics | 1,776 (76.5%) | 546 (23.5%) |
| Architecture & Engineering | 1,363 (82.3%) | 293 (17.7%) |
| Life, Physical & Social Science | 549 (53.7%) | 474 (46.3%) |
| Community & Social Service | 4,149 (40.7%) | 6,051 (59.3%) |
| Education, Arts & Media | 571 (37.8%) | 938 (62.2%) |
| Legal Services & Support | 409 (39.2%) | 634 (60.8%) |
| Education Instruction & Library | 2,367 (38.0%) | 3,862 (62.0%) |
| Arts, Media & Entertainment | 802 (56.5%) | 617 (43.5%) |
| Health Diagnosing & Treating | 1,336 (30.0%) | 3,124 (70.0%) |
| Health Technologists | 845 (29.5%) | 2,023 (70.5%) |
| Total (Category) | 14,217 (48.1%) | 15,323 (51.9%) |
| Total (Overall) | 33,638 (52.1%) | 30,880 (47.9%) |
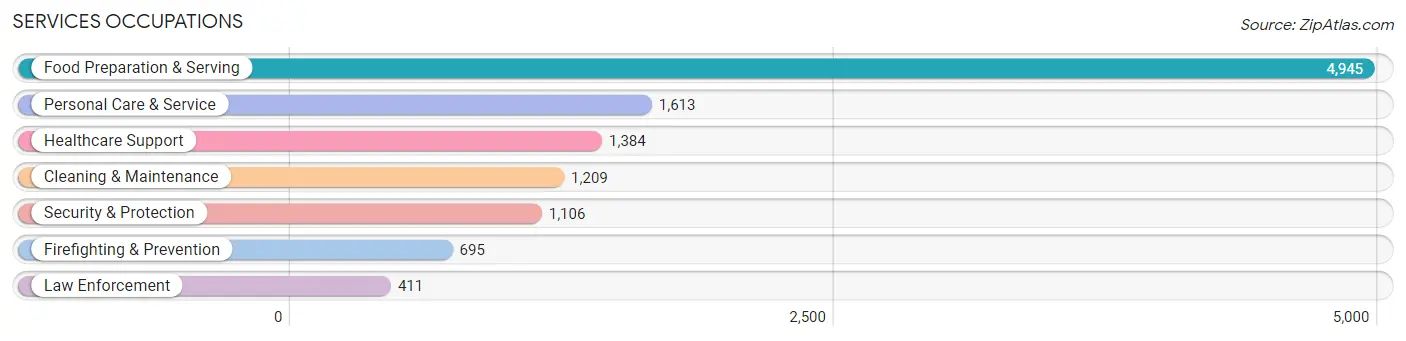
Services Occupations
The most common Services occupations in Norman are Food Preparation & Serving (4,945 | 7.7%), Personal Care & Service (1,613 | 2.5%), Healthcare Support (1,384 | 2.1%), Cleaning & Maintenance (1,209 | 1.9%), and Security & Protection (1,106 | 1.7%).
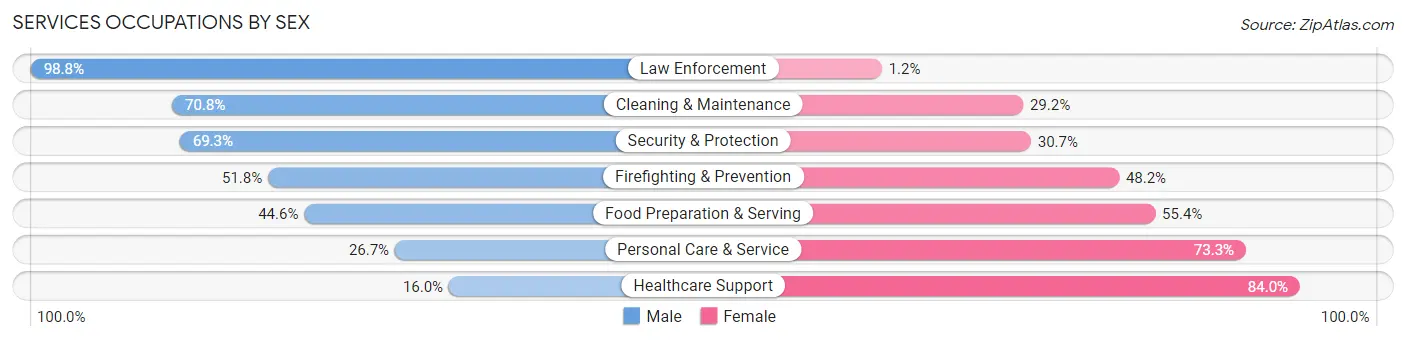
Services Occupations by Sex
Within the Services occupations in Norman, the most male-oriented occupations are Law Enforcement (98.8%), Cleaning & Maintenance (70.8%), and Security & Protection (69.3%), while the most female-oriented occupations are Healthcare Support (84.0%), Personal Care & Service (73.3%), and Food Preparation & Serving (55.4%).
| Occupation | Male | Female |
| Healthcare Support | 221 (16.0%) | 1,163 (84.0%) |
| Security & Protection | 766 (69.3%) | 340 (30.7%) |
| Firefighting & Prevention | 360 (51.8%) | 335 (48.2%) |
| Law Enforcement | 406 (98.8%) | 5 (1.2%) |
| Food Preparation & Serving | 2,207 (44.6%) | 2,738 (55.4%) |
| Cleaning & Maintenance | 856 (70.8%) | 353 (29.2%) |
| Personal Care & Service | 430 (26.7%) | 1,183 (73.3%) |
| Total (Category) | 4,480 (43.7%) | 5,777 (56.3%) |
| Total (Overall) | 33,638 (52.1%) | 30,880 (47.9%) |
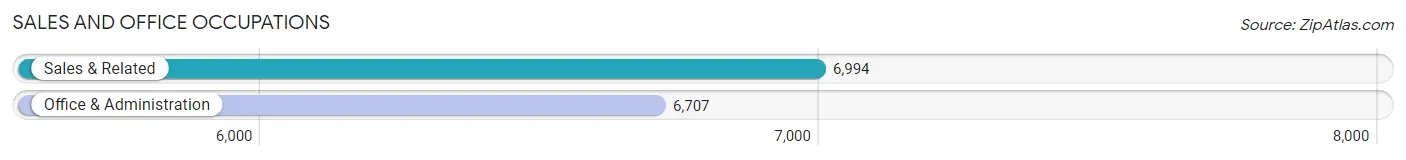
Sales and Office Occupations
The most common Sales and Office occupations in Norman are Sales & Related (6,994 | 10.8%), and Office & Administration (6,707 | 10.4%).
Sales and Office Occupations by Sex
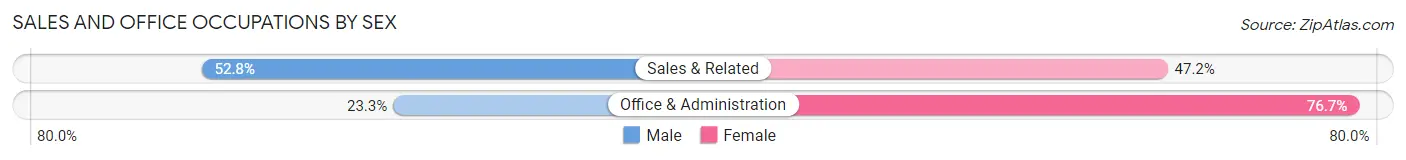
| Occupation | Male | Female |
| Sales & Related | 3,690 (52.8%) | 3,304 (47.2%) |
| Office & Administration | 1,564 (23.3%) | 5,143 (76.7%) |
| Total (Category) | 5,254 (38.4%) | 8,447 (61.7%) |
| Total (Overall) | 33,638 (52.1%) | 30,880 (47.9%) |
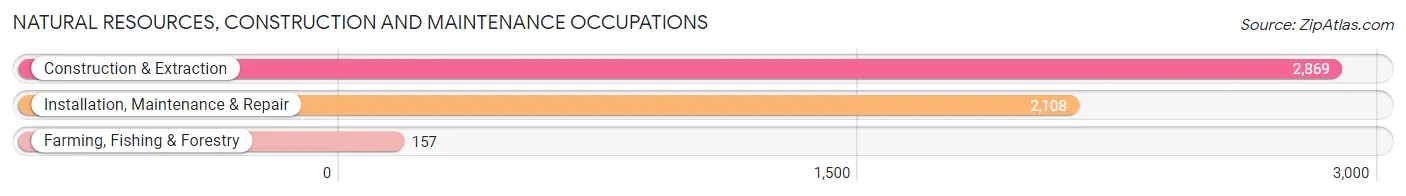
Natural Resources, Construction and Maintenance Occupations
The most common Natural Resources, Construction and Maintenance occupations in Norman are Construction & Extraction (2,869 | 4.4%), Installation, Maintenance & Repair (2,108 | 3.3%), and Farming, Fishing & Forestry (157 | 0.2%).
Natural Resources, Construction and Maintenance Occupations by Sex
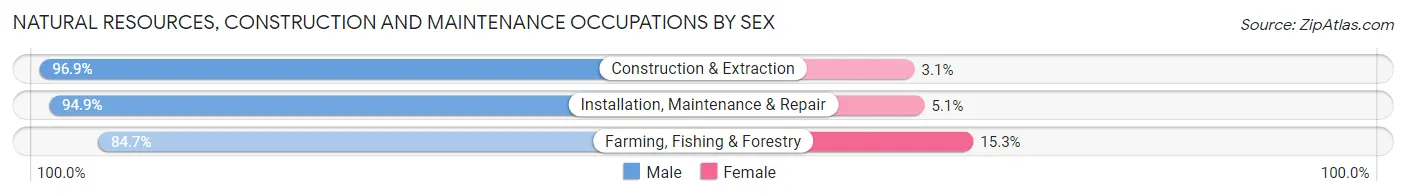
| Occupation | Male | Female |
| Farming, Fishing & Forestry | 133 (84.7%) | 24 (15.3%) |
| Construction & Extraction | 2,781 (96.9%) | 88 (3.1%) |
| Installation, Maintenance & Repair | 2,000 (94.9%) | 108 (5.1%) |
| Total (Category) | 4,914 (95.7%) | 220 (4.3%) |
| Total (Overall) | 33,638 (52.1%) | 30,880 (47.9%) |
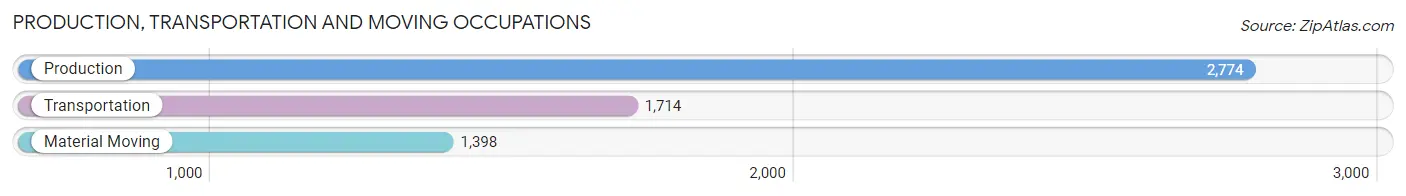
Production, Transportation and Moving Occupations
The most common Production, Transportation and Moving occupations in Norman are Production (2,774 | 4.3%), Transportation (1,714 | 2.7%), and Material Moving (1,398 | 2.2%).
Production, Transportation and Moving Occupations by Sex
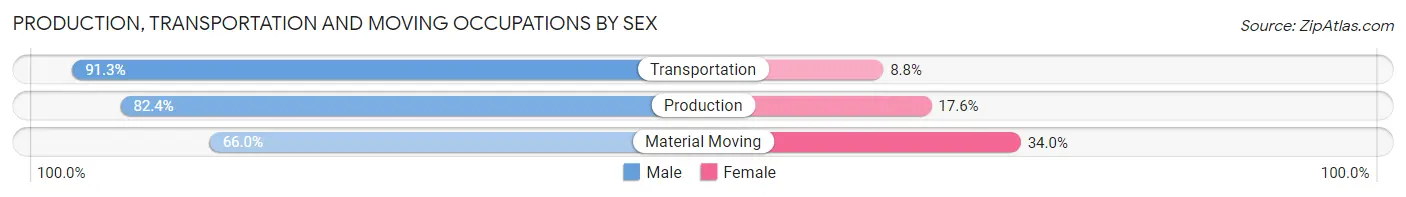
| Occupation | Male | Female |
| Production | 2,286 (82.4%) | 488 (17.6%) |
| Transportation | 1,564 (91.2%) | 150 (8.7%) |
| Material Moving | 923 (66.0%) | 475 (34.0%) |
| Total (Category) | 4,773 (81.1%) | 1,113 (18.9%) |
| Total (Overall) | 33,638 (52.1%) | 30,880 (47.9%) |
Employment Industries by Sex in Norman
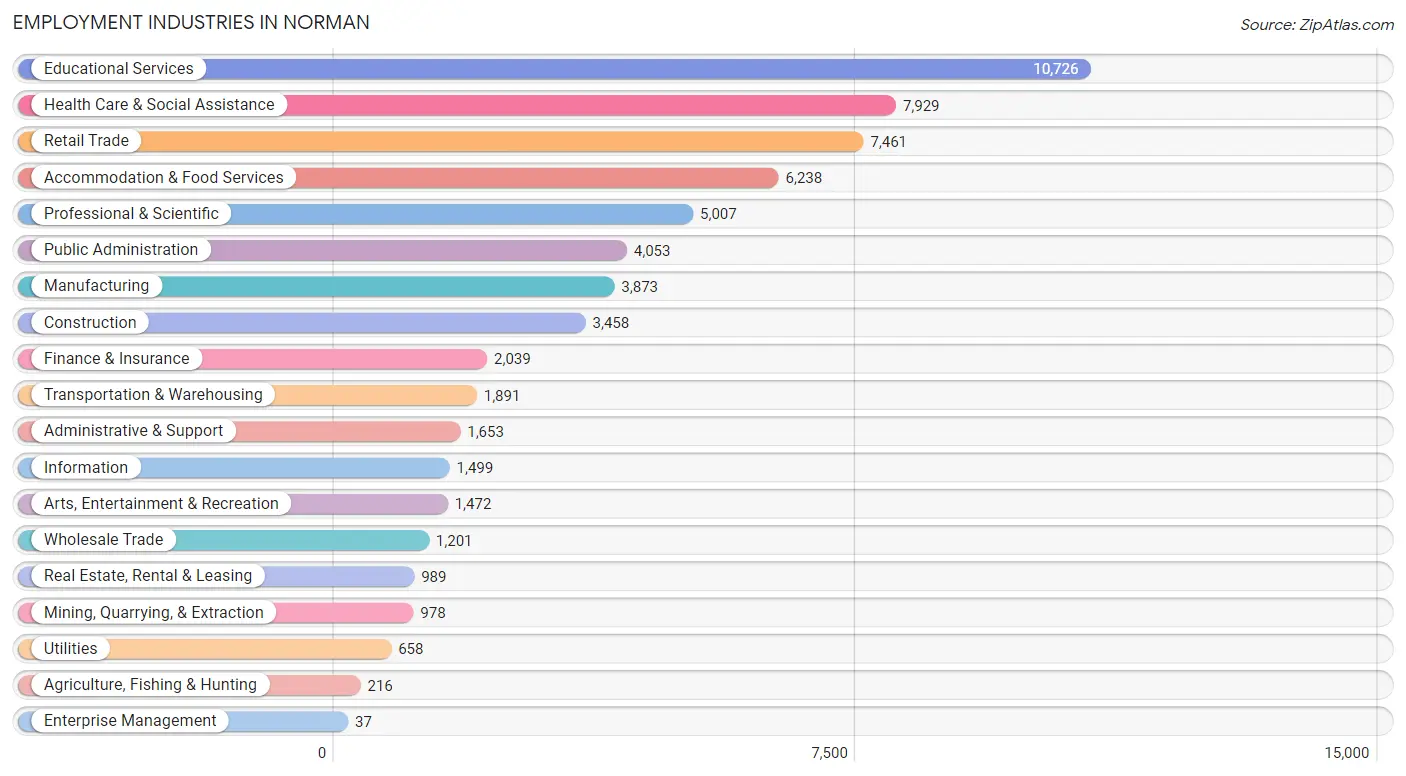
Employment Industries in Norman
The major employment industries in Norman include Educational Services (10,726 | 16.6%), Health Care & Social Assistance (7,929 | 12.3%), Retail Trade (7,461 | 11.6%), Accommodation & Food Services (6,238 | 9.7%), and Professional & Scientific (5,007 | 7.8%).
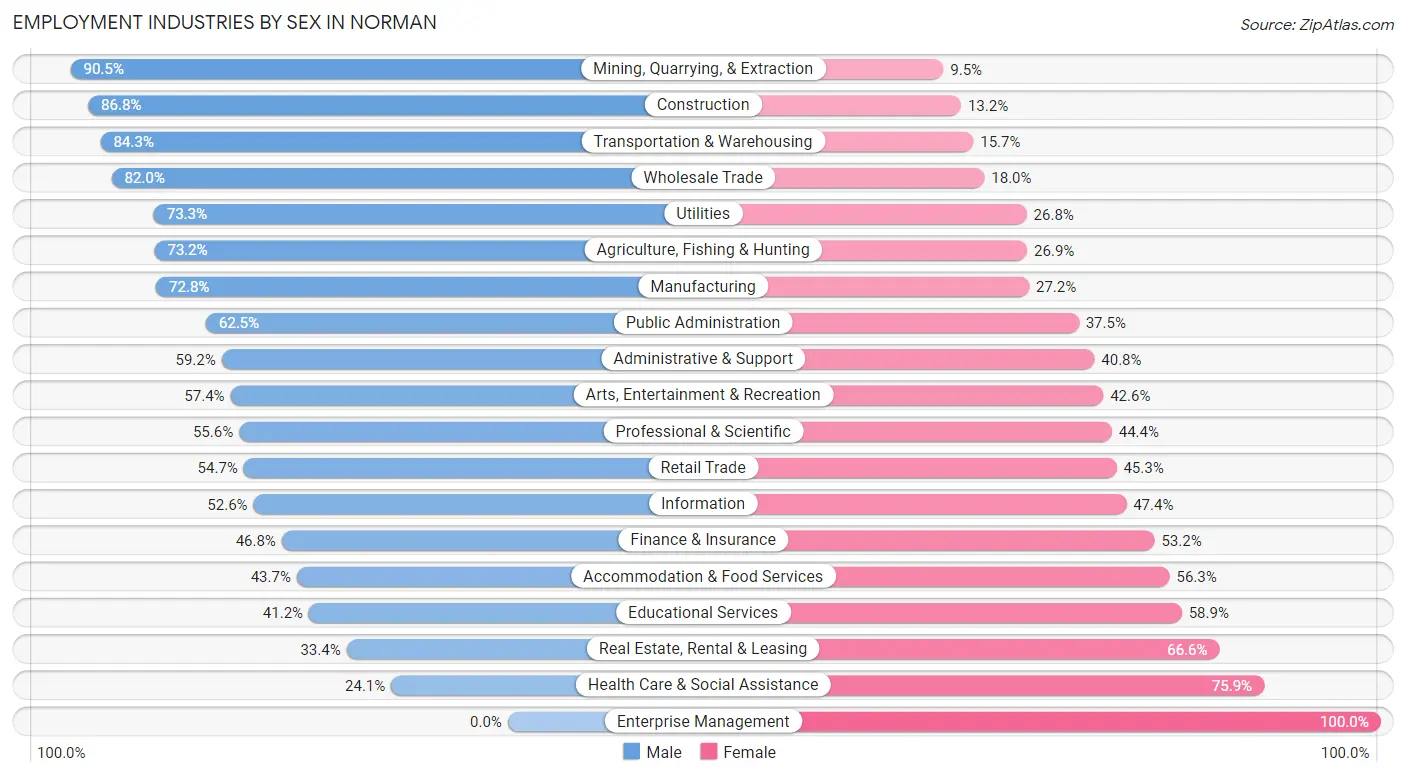
Employment Industries by Sex in Norman
The Norman industries that see more men than women are Mining, Quarrying, & Extraction (90.5%), Construction (86.8%), and Transportation & Warehousing (84.3%), whereas the industries that tend to have a higher number of women are Enterprise Management (100.0%), Health Care & Social Assistance (75.9%), and Real Estate, Rental & Leasing (66.6%).
| Industry | Male | Female |
| Agriculture, Fishing & Hunting | 158 (73.2%) | 58 (26.9%) |
| Mining, Quarrying, & Extraction | 885 (90.5%) | 93 (9.5%) |
| Construction | 3,003 (86.8%) | 455 (13.2%) |
| Manufacturing | 2,818 (72.8%) | 1,055 (27.2%) |
| Wholesale Trade | 985 (82.0%) | 216 (18.0%) |
| Retail Trade | 4,078 (54.7%) | 3,383 (45.3%) |
| Transportation & Warehousing | 1,594 (84.3%) | 297 (15.7%) |
| Utilities | 482 (73.3%) | 176 (26.8%) |
| Information | 789 (52.6%) | 710 (47.4%) |
| Finance & Insurance | 954 (46.8%) | 1,085 (53.2%) |
| Real Estate, Rental & Leasing | 330 (33.4%) | 659 (66.6%) |
| Professional & Scientific | 2,785 (55.6%) | 2,222 (44.4%) |
| Enterprise Management | 0 (0.0%) | 37 (100.0%) |
| Administrative & Support | 979 (59.2%) | 674 (40.8%) |
| Educational Services | 4,414 (41.1%) | 6,312 (58.9%) |
| Health Care & Social Assistance | 1,914 (24.1%) | 6,015 (75.9%) |
| Arts, Entertainment & Recreation | 845 (57.4%) | 627 (42.6%) |
| Accommodation & Food Services | 2,724 (43.7%) | 3,514 (56.3%) |
| Public Administration | 2,532 (62.5%) | 1,521 (37.5%) |
| Total | 33,638 (52.1%) | 30,880 (47.9%) |
Education in Norman
School Enrollment in Norman
The most common levels of schooling among the 43,201 students in Norman are college / undergraduate (20,638 | 47.8%), high school (5,515 | 12.8%), and middle school (5,163 | 11.9%).
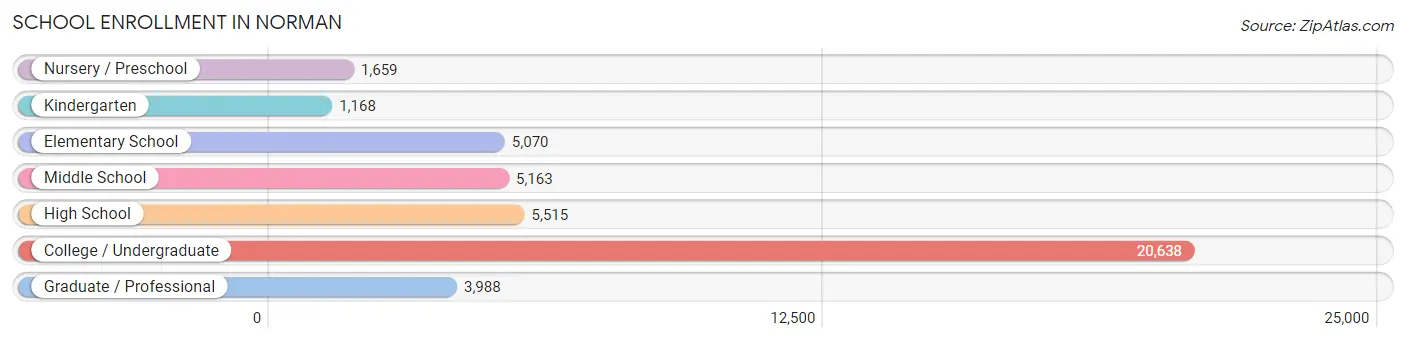
| School Level | # Students | % Students |
| Nursery / Preschool | 1,659 | 3.8% |
| Kindergarten | 1,168 | 2.7% |
| Elementary School | 5,070 | 11.7% |
| Middle School | 5,163 | 11.9% |
| High School | 5,515 | 12.8% |
| College / Undergraduate | 20,638 | 47.8% |
| Graduate / Professional | 3,988 | 9.2% |
| Total | 43,201 | 100.0% |
School Enrollment by Age by Funding Source in Norman
Out of a total of 43,201 students who are enrolled in schools in Norman, 3,283 (7.6%) attend a private institution, while the remaining 39,918 (92.4%) are enrolled in public schools. The age group of 3 to 4 year olds has the highest likelihood of being enrolled in private schools, with 343 (40.4% in the age bracket) enrolled. Conversely, the age group of 20 to 24 year olds has the lowest likelihood of being enrolled in a private school, with 12,805 (97.1% in the age bracket) attending a public institution.
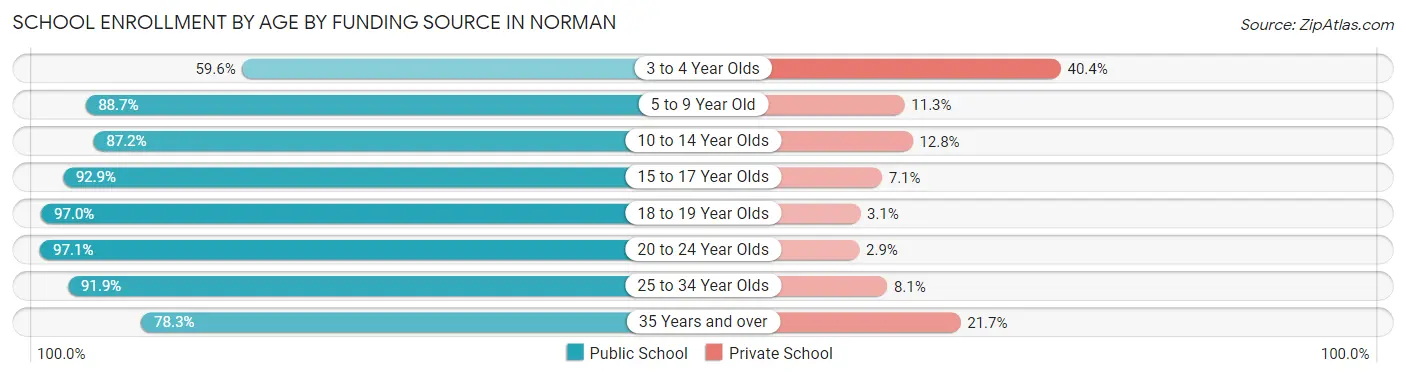
| Age Bracket | Public School | Private School |
| 3 to 4 Year Olds | 506 (59.6%) | 343 (40.4%) |
| 5 to 9 Year Old | 5,510 (88.7%) | 702 (11.3%) |
| 10 to 14 Year Olds | 5,753 (87.2%) | 845 (12.8%) |
| 15 to 17 Year Olds | 3,823 (92.9%) | 292 (7.1%) |
| 18 to 19 Year Olds | 7,870 (97.0%) | 248 (3.0%) |
| 20 to 24 Year Olds | 12,805 (97.1%) | 380 (2.9%) |
| 25 to 34 Year Olds | 2,712 (91.9%) | 238 (8.1%) |
| 35 Years and over | 919 (78.3%) | 255 (21.7%) |
| Total | 39,918 (92.4%) | 3,283 (7.6%) |
Educational Attainment by Field of Study in Norman
Business (6,252 | 17.0%), education (4,872 | 13.2%), science & technology (3,430 | 9.3%), engineering (2,767 | 7.5%), and social sciences (2,733 | 7.4%) are the most common fields of study among 36,882 individuals in Norman who have obtained a bachelor's degree or higher.
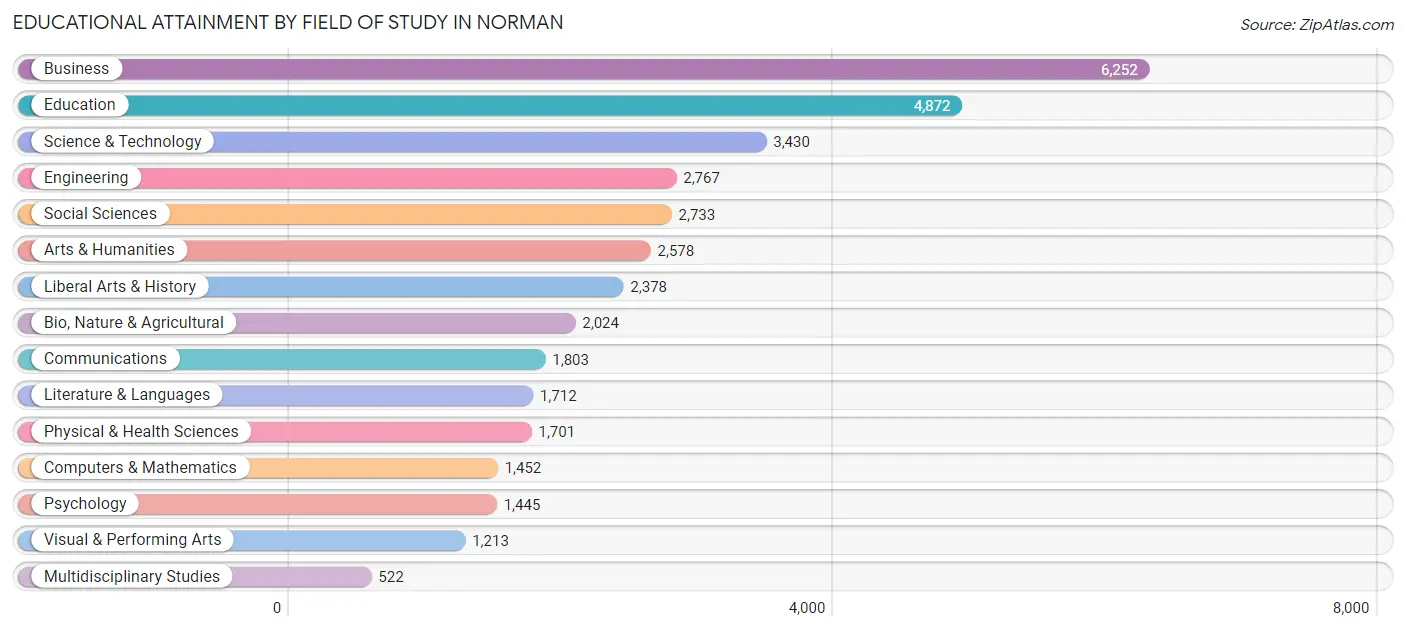
| Field of Study | # Graduates | % Graduates |
| Computers & Mathematics | 1,452 | 3.9% |
| Bio, Nature & Agricultural | 2,024 | 5.5% |
| Physical & Health Sciences | 1,701 | 4.6% |
| Psychology | 1,445 | 3.9% |
| Social Sciences | 2,733 | 7.4% |
| Engineering | 2,767 | 7.5% |
| Multidisciplinary Studies | 522 | 1.4% |
| Science & Technology | 3,430 | 9.3% |
| Business | 6,252 | 17.0% |
| Education | 4,872 | 13.2% |
| Literature & Languages | 1,712 | 4.6% |
| Liberal Arts & History | 2,378 | 6.5% |
| Visual & Performing Arts | 1,213 | 3.3% |
| Communications | 1,803 | 4.9% |
| Arts & Humanities | 2,578 | 7.0% |
| Total | 36,882 | 100.0% |
Transportation & Commute in Norman
Vehicle Availability by Sex in Norman
The most prevalent vehicle ownership categories in Norman are males with 2 vehicles (15,050, accounting for 46.0%) and females with 2 vehicles (12,287, making up 51.7%).
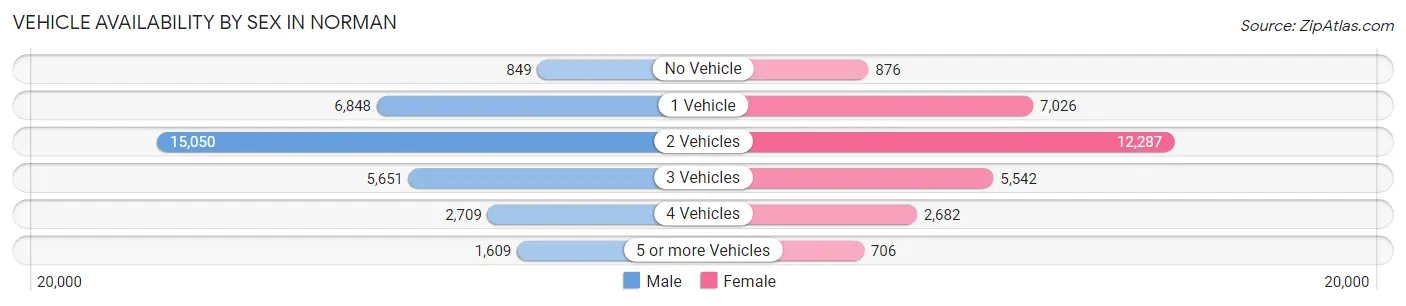
| Vehicles Available | Male | Female |
| No Vehicle | 849 (2.6%) | 876 (3.0%) |
| 1 Vehicle | 6,848 (20.9%) | 7,026 (24.1%) |
| 2 Vehicles | 15,050 (46.0%) | 12,287 (42.2%) |
| 3 Vehicles | 5,651 (17.3%) | 5,542 (19.0%) |
| 4 Vehicles | 2,709 (8.3%) | 2,682 (9.2%) |
| 5 or more Vehicles | 1,609 (4.9%) | 706 (2.4%) |
| Total | 32,716 (100.0%) | 29,119 (100.0%) |
Commute Time in Norman
The most frequently occuring commute durations in Norman are 15 to 19 minutes (10,521 commuters, 18.2%), 10 to 14 minutes (10,138 commuters, 17.5%), and 5 to 9 minutes (7,760 commuters, 13.4%).
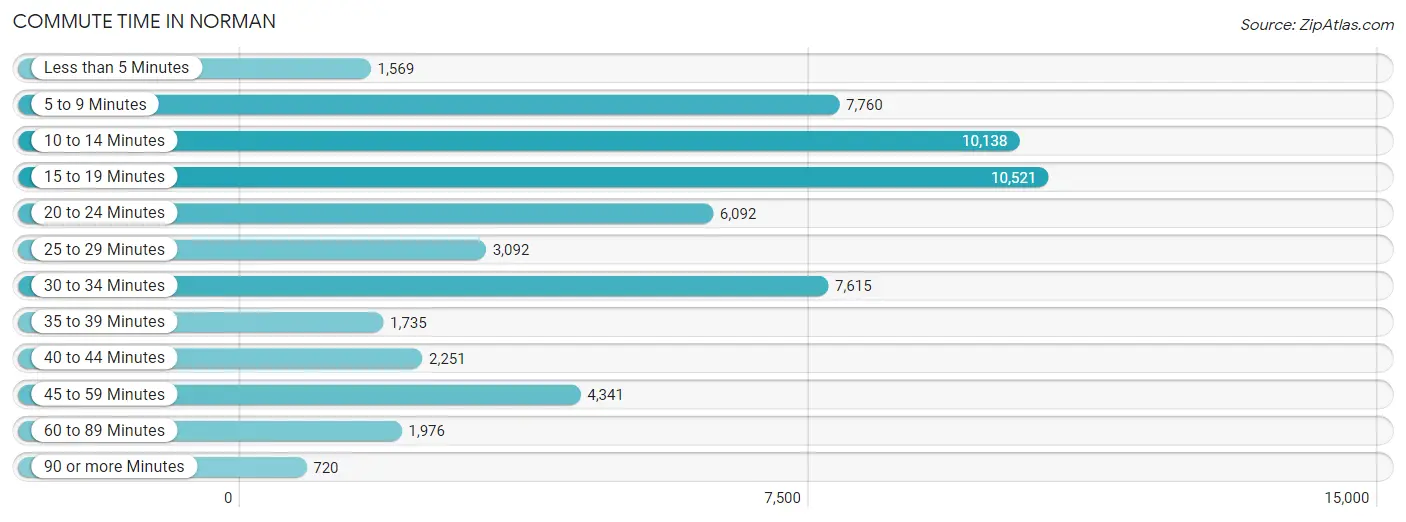
| Commute Time | # Commuters | % Commuters |
| Less than 5 Minutes | 1,569 | 2.7% |
| 5 to 9 Minutes | 7,760 | 13.4% |
| 10 to 14 Minutes | 10,138 | 17.5% |
| 15 to 19 Minutes | 10,521 | 18.2% |
| 20 to 24 Minutes | 6,092 | 10.5% |
| 25 to 29 Minutes | 3,092 | 5.3% |
| 30 to 34 Minutes | 7,615 | 13.2% |
| 35 to 39 Minutes | 1,735 | 3.0% |
| 40 to 44 Minutes | 2,251 | 3.9% |
| 45 to 59 Minutes | 4,341 | 7.5% |
| 60 to 89 Minutes | 1,976 | 3.4% |
| 90 or more Minutes | 720 | 1.3% |
Commute Time by Sex in Norman
The most common commute times in Norman are 10 to 14 minutes (5,039 commuters, 16.3%) for males and 15 to 19 minutes (5,541 commuters, 20.6%) for females.
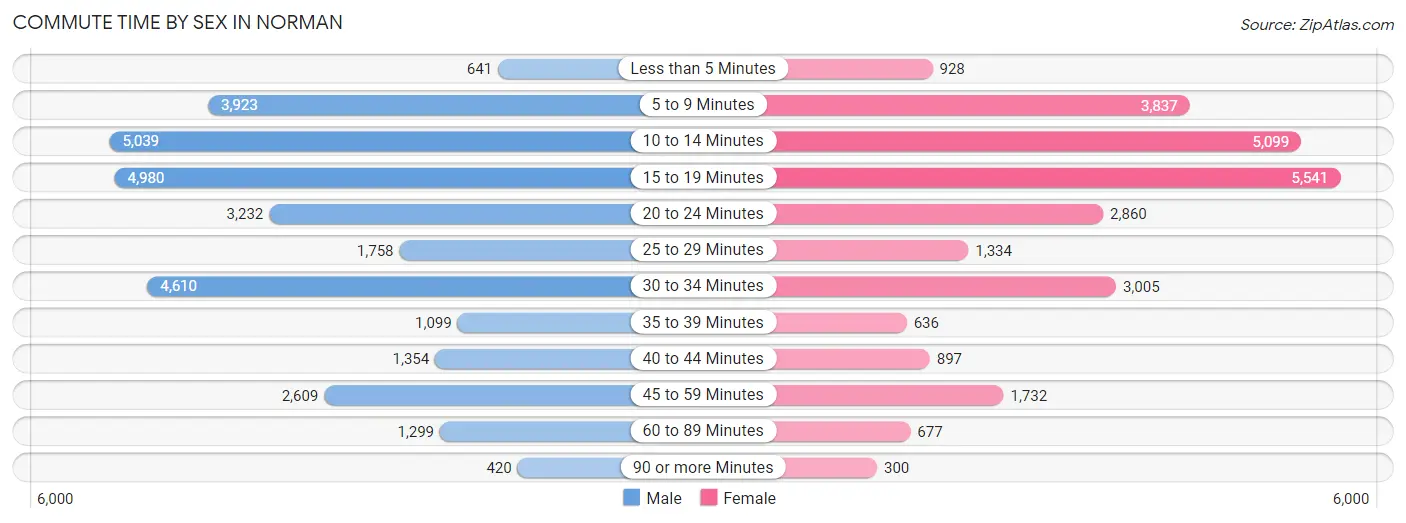
| Commute Time | Male | Female |
| Less than 5 Minutes | 641 (2.1%) | 928 (3.5%) |
| 5 to 9 Minutes | 3,923 (12.7%) | 3,837 (14.3%) |
| 10 to 14 Minutes | 5,039 (16.3%) | 5,099 (19.0%) |
| 15 to 19 Minutes | 4,980 (16.1%) | 5,541 (20.6%) |
| 20 to 24 Minutes | 3,232 (10.4%) | 2,860 (10.6%) |
| 25 to 29 Minutes | 1,758 (5.7%) | 1,334 (5.0%) |
| 30 to 34 Minutes | 4,610 (14.9%) | 3,005 (11.2%) |
| 35 to 39 Minutes | 1,099 (3.5%) | 636 (2.4%) |
| 40 to 44 Minutes | 1,354 (4.4%) | 897 (3.3%) |
| 45 to 59 Minutes | 2,609 (8.4%) | 1,732 (6.5%) |
| 60 to 89 Minutes | 1,299 (4.2%) | 677 (2.5%) |
| 90 or more Minutes | 420 (1.4%) | 300 (1.1%) |
Time of Departure to Work by Sex in Norman
The most frequent times of departure to work in Norman are 7:30 AM to 7:59 AM (4,218, 13.6%) for males and 7:30 AM to 7:59 AM (4,000, 14.9%) for females.
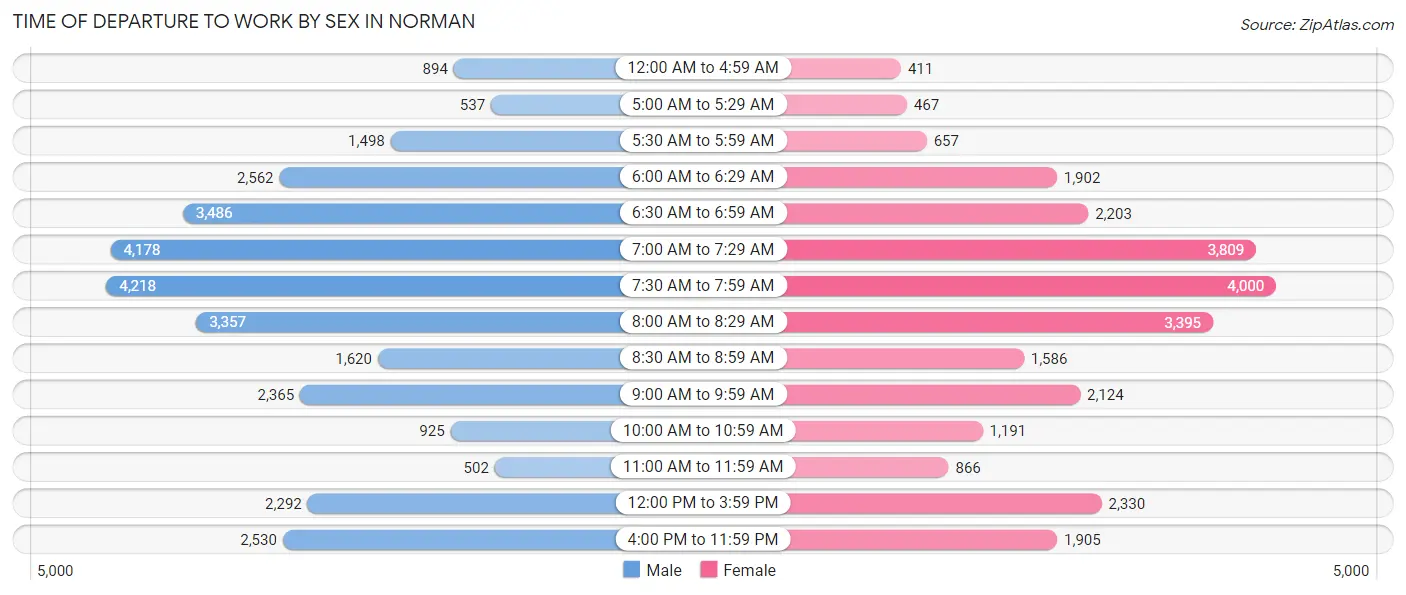
| Time of Departure | Male | Female |
| 12:00 AM to 4:59 AM | 894 (2.9%) | 411 (1.5%) |
| 5:00 AM to 5:29 AM | 537 (1.7%) | 467 (1.7%) |
| 5:30 AM to 5:59 AM | 1,498 (4.8%) | 657 (2.5%) |
| 6:00 AM to 6:29 AM | 2,562 (8.3%) | 1,902 (7.1%) |
| 6:30 AM to 6:59 AM | 3,486 (11.3%) | 2,203 (8.2%) |
| 7:00 AM to 7:29 AM | 4,178 (13.5%) | 3,809 (14.2%) |
| 7:30 AM to 7:59 AM | 4,218 (13.6%) | 4,000 (14.9%) |
| 8:00 AM to 8:29 AM | 3,357 (10.8%) | 3,395 (12.7%) |
| 8:30 AM to 8:59 AM | 1,620 (5.2%) | 1,586 (5.9%) |
| 9:00 AM to 9:59 AM | 2,365 (7.6%) | 2,124 (7.9%) |
| 10:00 AM to 10:59 AM | 925 (3.0%) | 1,191 (4.4%) |
| 11:00 AM to 11:59 AM | 502 (1.6%) | 866 (3.2%) |
| 12:00 PM to 3:59 PM | 2,292 (7.4%) | 2,330 (8.7%) |
| 4:00 PM to 11:59 PM | 2,530 (8.2%) | 1,905 (7.1%) |
| Total | 30,964 (100.0%) | 26,846 (100.0%) |
Housing Occupancy in Norman
Occupancy by Ownership in Norman
Of the total 51,336 dwellings in Norman, owner-occupied units account for 26,888 (52.4%), while renter-occupied units make up 24,448 (47.6%).
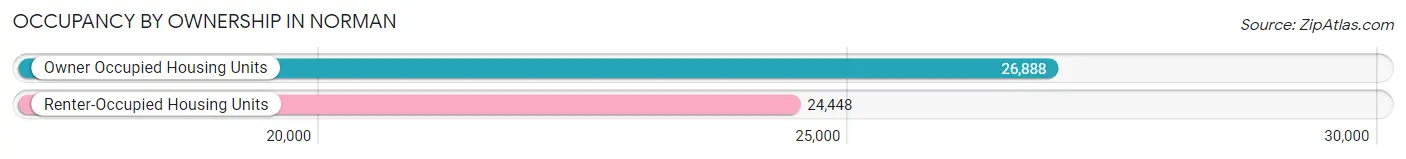
| Occupancy | # Housing Units | % Housing Units |
| Owner Occupied Housing Units | 26,888 | 52.4% |
| Renter-Occupied Housing Units | 24,448 | 47.6% |
| Total Occupied Housing Units | 51,336 | 100.0% |
Occupancy by Household Size in Norman
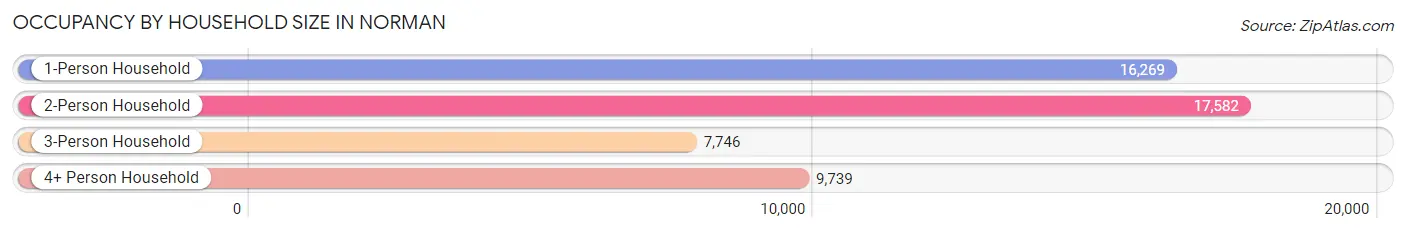
| Household Size | # Housing Units | % Housing Units |
| 1-Person Household | 16,269 | 31.7% |
| 2-Person Household | 17,582 | 34.3% |
| 3-Person Household | 7,746 | 15.1% |
| 4+ Person Household | 9,739 | 19.0% |
| Total Housing Units | 51,336 | 100.0% |
Occupancy by Ownership by Household Size in Norman
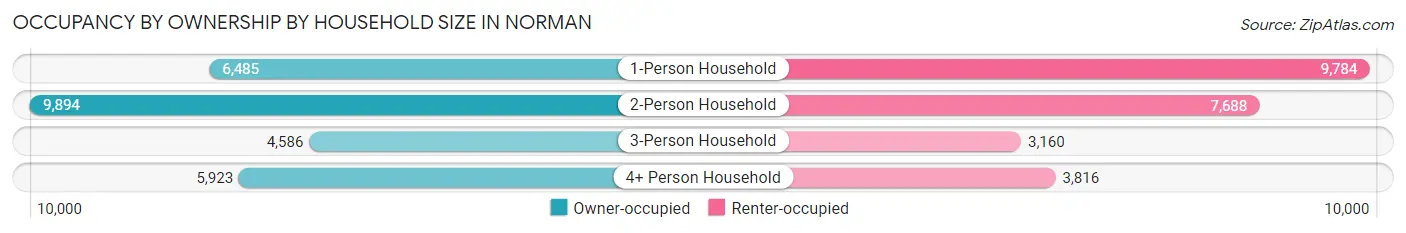
| Household Size | Owner-occupied | Renter-occupied |
| 1-Person Household | 6,485 (39.9%) | 9,784 (60.1%) |
| 2-Person Household | 9,894 (56.3%) | 7,688 (43.7%) |
| 3-Person Household | 4,586 (59.2%) | 3,160 (40.8%) |
| 4+ Person Household | 5,923 (60.8%) | 3,816 (39.2%) |
| Total Housing Units | 26,888 (52.4%) | 24,448 (47.6%) |
Occupancy by Educational Attainment in Norman
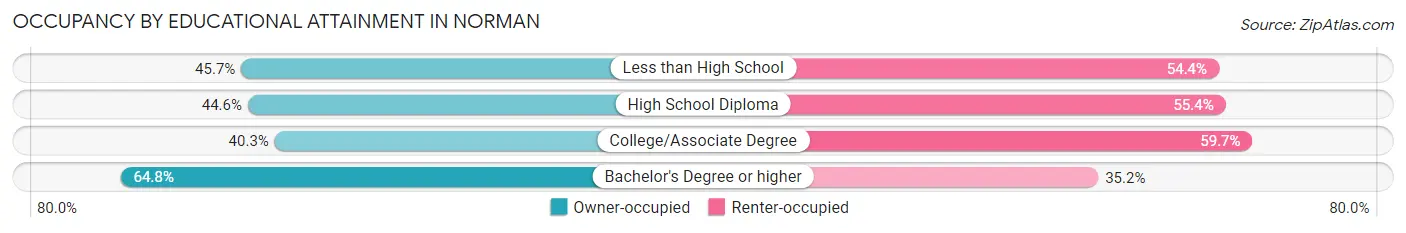
| Household Size | Owner-occupied | Renter-occupied |
| Less than High School | 1,017 (45.7%) | 1,211 (54.3%) |
| High School Diploma | 3,549 (44.6%) | 4,408 (55.4%) |
| College/Associate Degree | 7,157 (40.3%) | 10,585 (59.7%) |
| Bachelor's Degree or higher | 15,165 (64.8%) | 8,244 (35.2%) |
Occupancy by Age of Householder in Norman
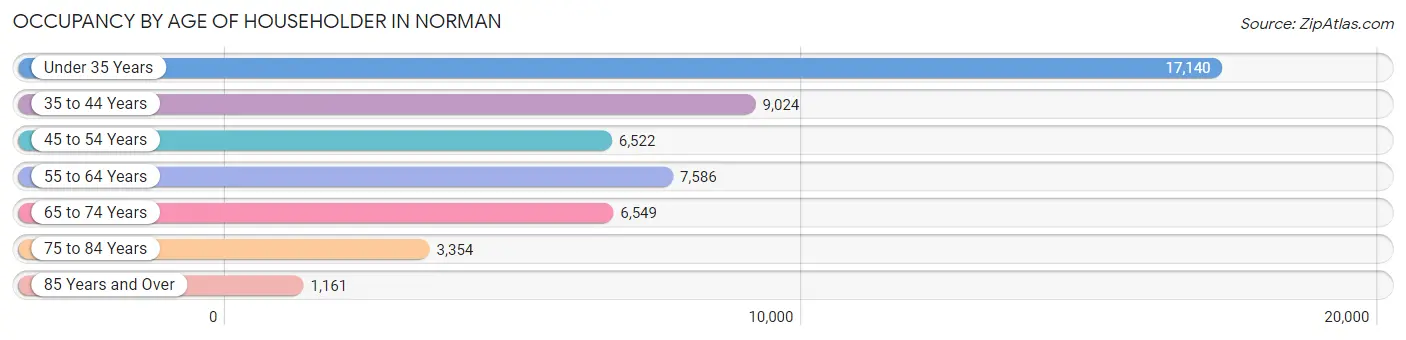
| Age Bracket | # Households | % Households |
| Under 35 Years | 17,140 | 33.4% |
| 35 to 44 Years | 9,024 | 17.6% |
| 45 to 54 Years | 6,522 | 12.7% |
| 55 to 64 Years | 7,586 | 14.8% |
| 65 to 74 Years | 6,549 | 12.8% |
| 75 to 84 Years | 3,354 | 6.5% |
| 85 Years and Over | 1,161 | 2.3% |
| Total | 51,336 | 100.0% |
Housing Finances in Norman
Median Income by Occupancy in Norman
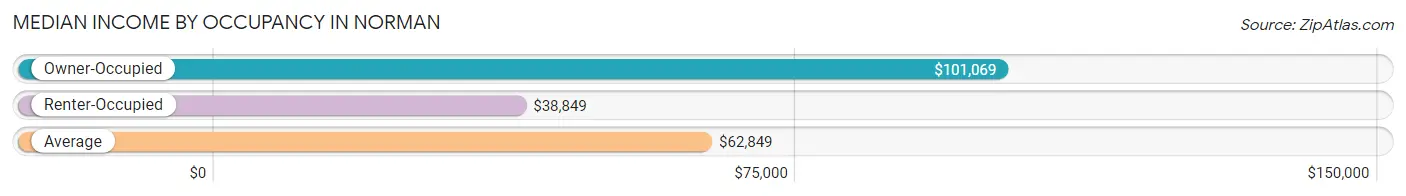
| Occupancy Type | # Households | Median Income |
| Owner-Occupied | 26,888 (52.4%) | $101,069 |
| Renter-Occupied | 24,448 (47.6%) | $38,849 |
| Average | 51,336 (100.0%) | $62,849 |
Occupancy by Householder Income Bracket in Norman
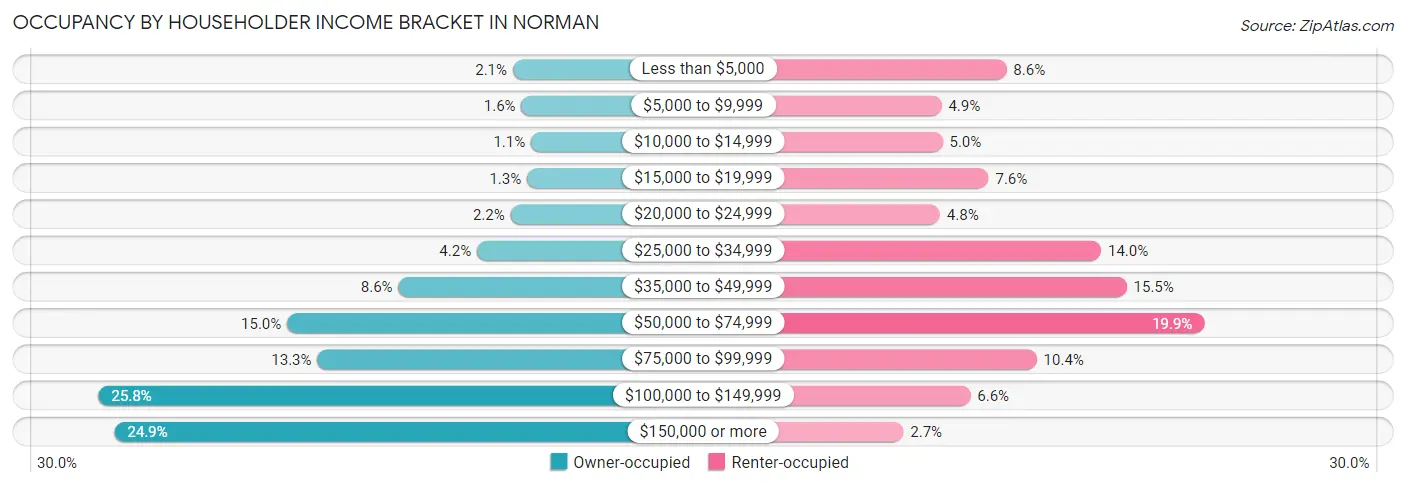
| Income Bracket | Owner-occupied | Renter-occupied |
| Less than $5,000 | 565 (2.1%) | 2,107 (8.6%) |
| $5,000 to $9,999 | 432 (1.6%) | 1,200 (4.9%) |
| $10,000 to $14,999 | 284 (1.1%) | 1,215 (5.0%) |
| $15,000 to $19,999 | 348 (1.3%) | 1,857 (7.6%) |
| $20,000 to $24,999 | 599 (2.2%) | 1,179 (4.8%) |
| $25,000 to $34,999 | 1,117 (4.2%) | 3,431 (14.0%) |
| $35,000 to $49,999 | 2,324 (8.6%) | 3,786 (15.5%) |
| $50,000 to $74,999 | 4,032 (15.0%) | 4,871 (19.9%) |
| $75,000 to $99,999 | 3,569 (13.3%) | 2,530 (10.3%) |
| $100,000 to $149,999 | 6,931 (25.8%) | 1,605 (6.6%) |
| $150,000 or more | 6,687 (24.9%) | 667 (2.7%) |
| Total | 26,888 (100.0%) | 24,448 (100.0%) |
Monthly Housing Cost Tiers in Norman
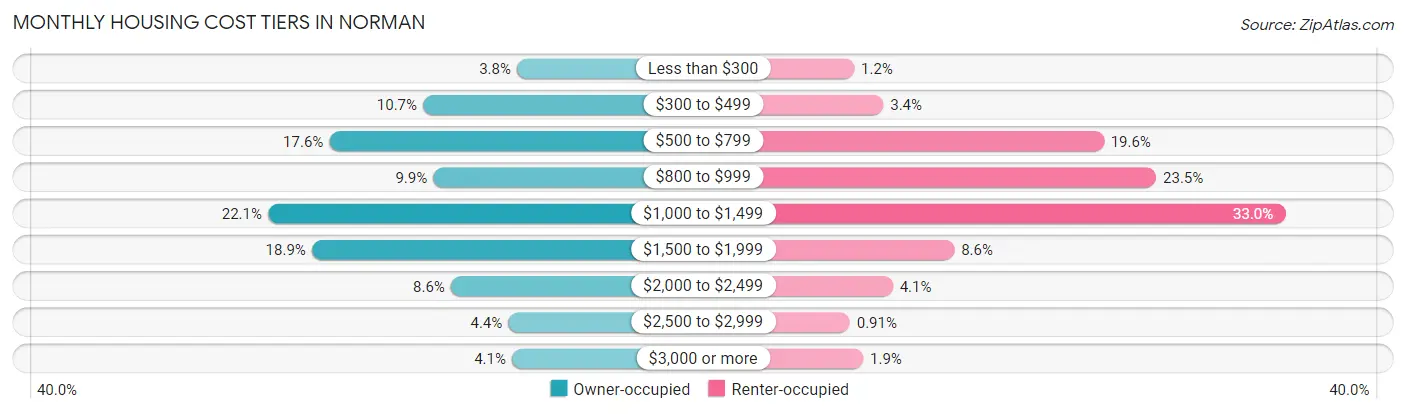
| Monthly Cost | Owner-occupied | Renter-occupied |
| Less than $300 | 1,009 (3.7%) | 301 (1.2%) |
| $300 to $499 | 2,868 (10.7%) | 827 (3.4%) |
| $500 to $799 | 4,725 (17.6%) | 4,794 (19.6%) |
| $800 to $999 | 2,668 (9.9%) | 5,739 (23.5%) |
| $1,000 to $1,499 | 5,940 (22.1%) | 8,060 (33.0%) |
| $1,500 to $1,999 | 5,071 (18.9%) | 2,103 (8.6%) |
| $2,000 to $2,499 | 2,319 (8.6%) | 994 (4.1%) |
| $2,500 to $2,999 | 1,181 (4.4%) | 223 (0.9%) |
| $3,000 or more | 1,107 (4.1%) | 462 (1.9%) |
| Total | 26,888 (100.0%) | 24,448 (100.0%) |
Physical Housing Characteristics in Norman
Housing Structures in Norman
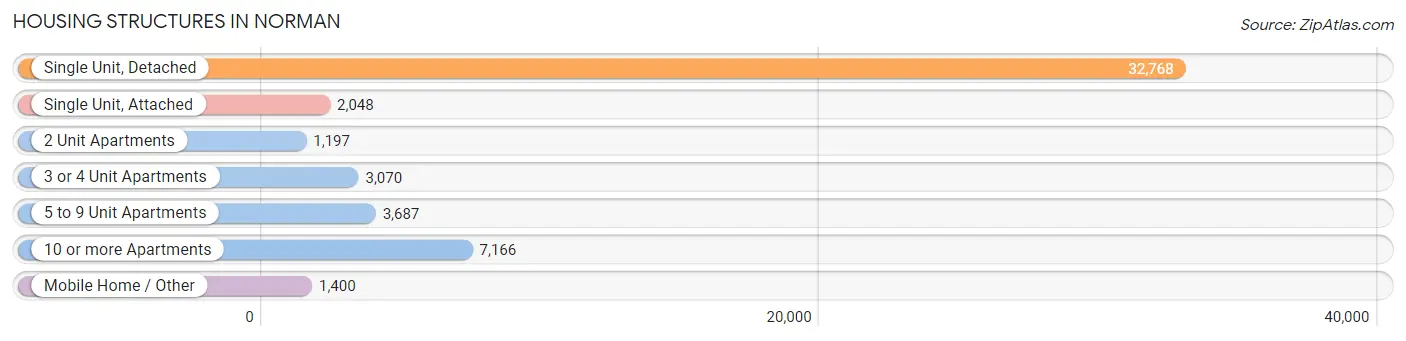
| Structure Type | # Housing Units | % Housing Units |
| Single Unit, Detached | 32,768 | 63.8% |
| Single Unit, Attached | 2,048 | 4.0% |
| 2 Unit Apartments | 1,197 | 2.3% |
| 3 or 4 Unit Apartments | 3,070 | 6.0% |
| 5 to 9 Unit Apartments | 3,687 | 7.2% |
| 10 or more Apartments | 7,166 | 14.0% |
| Mobile Home / Other | 1,400 | 2.7% |
| Total | 51,336 | 100.0% |
Housing Structures by Occupancy in Norman
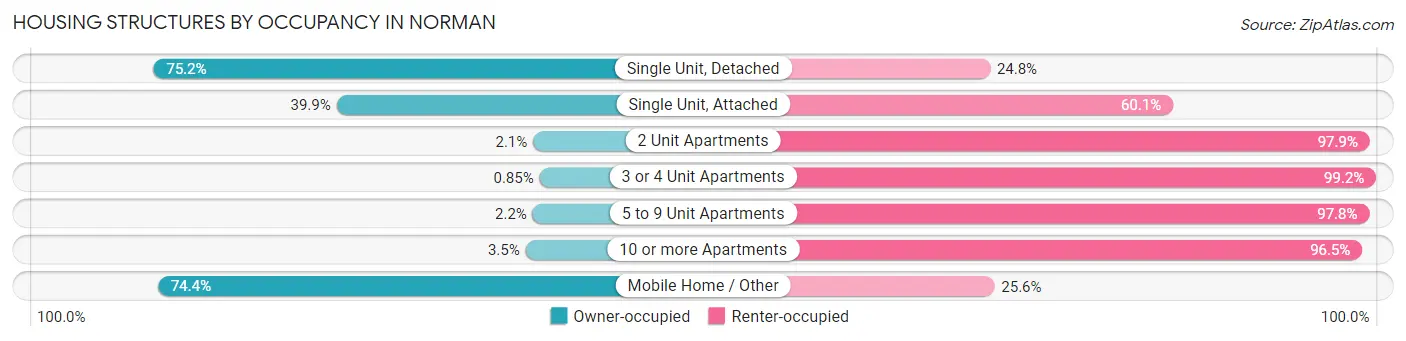
| Structure Type | Owner-occupied | Renter-occupied |
| Single Unit, Detached | 24,644 (75.2%) | 8,124 (24.8%) |
| Single Unit, Attached | 818 (39.9%) | 1,230 (60.1%) |
| 2 Unit Apartments | 25 (2.1%) | 1,172 (97.9%) |
| 3 or 4 Unit Apartments | 26 (0.9%) | 3,044 (99.2%) |
| 5 to 9 Unit Apartments | 80 (2.2%) | 3,607 (97.8%) |
| 10 or more Apartments | 254 (3.5%) | 6,912 (96.5%) |
| Mobile Home / Other | 1,041 (74.4%) | 359 (25.6%) |
| Total | 26,888 (52.4%) | 24,448 (47.6%) |
Housing Structures by Number of Rooms in Norman
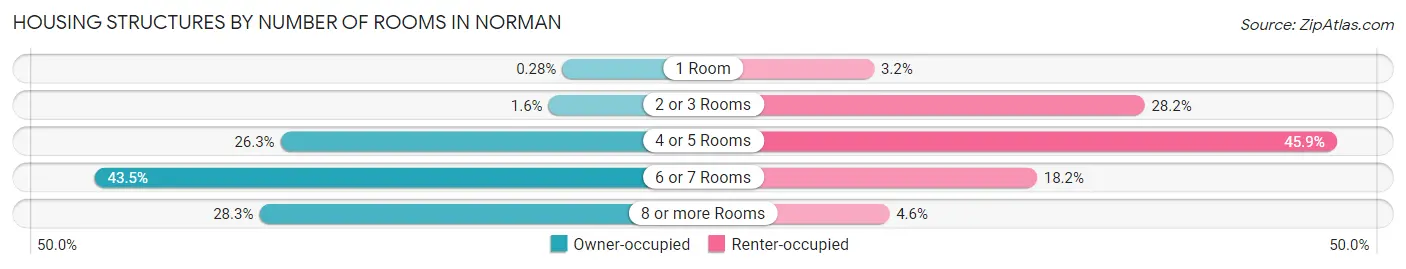
| Number of Rooms | Owner-occupied | Renter-occupied |
| 1 Room | 76 (0.3%) | 769 (3.2%) |
| 2 or 3 Rooms | 418 (1.5%) | 6,886 (28.2%) |
| 4 or 5 Rooms | 7,082 (26.3%) | 11,226 (45.9%) |
| 6 or 7 Rooms | 11,702 (43.5%) | 4,453 (18.2%) |
| 8 or more Rooms | 7,610 (28.3%) | 1,114 (4.6%) |
| Total | 26,888 (100.0%) | 24,448 (100.0%) |
Housing Structure by Heating Type in Norman
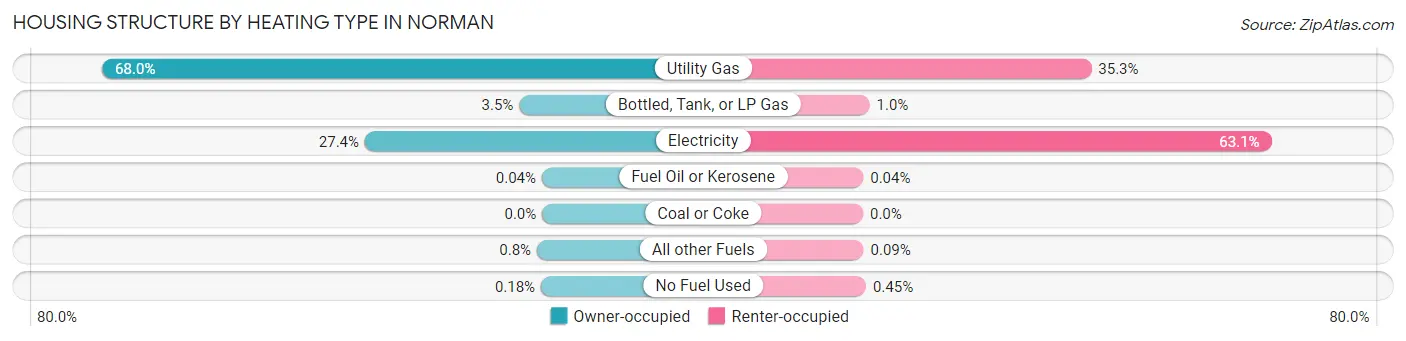
| Heating Type | Owner-occupied | Renter-occupied |
| Utility Gas | 18,292 (68.0%) | 8,628 (35.3%) |
| Bottled, Tank, or LP Gas | 953 (3.5%) | 246 (1.0%) |
| Electricity | 7,366 (27.4%) | 15,432 (63.1%) |
| Fuel Oil or Kerosene | 12 (0.0%) | 10 (0.0%) |
| Coal or Coke | 0 (0.0%) | 0 (0.0%) |
| All other Fuels | 216 (0.8%) | 23 (0.1%) |
| No Fuel Used | 49 (0.2%) | 109 (0.4%) |
| Total | 26,888 (100.0%) | 24,448 (100.0%) |
Household Vehicle Usage in Norman
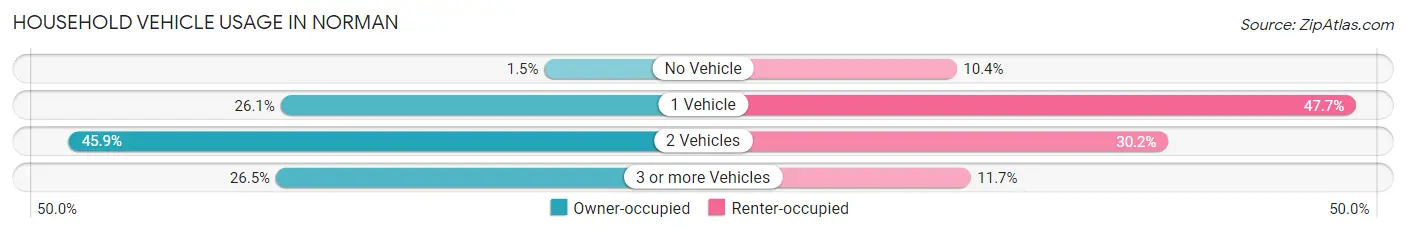
| Vehicles per Household | Owner-occupied | Renter-occupied |
| No Vehicle | 397 (1.5%) | 2,542 (10.4%) |
| 1 Vehicle | 7,018 (26.1%) | 11,665 (47.7%) |
| 2 Vehicles | 12,337 (45.9%) | 7,379 (30.2%) |
| 3 or more Vehicles | 7,136 (26.5%) | 2,862 (11.7%) |
| Total | 26,888 (100.0%) | 24,448 (100.0%) |
Real Estate & Mortgages in Norman
Real Estate and Mortgage Overview in Norman
| Characteristic | Without Mortgage | With Mortgage |
| Housing Units | 10,815 | 16,073 |
| Median Property Value | $222,300 | $226,500 |
| Median Household Income | $75,960 | $4,570 |
| Monthly Housing Costs | $586 | $1,107 |
| Real Estate Taxes | $2,284 | $562 |
Property Value by Mortgage Status in Norman
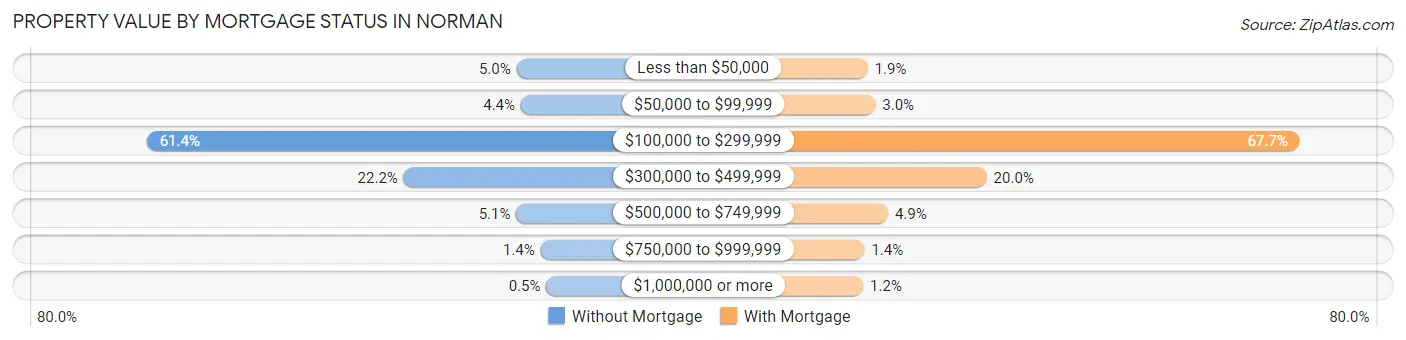
| Property Value | Without Mortgage | With Mortgage |
| Less than $50,000 | 545 (5.0%) | 298 (1.8%) |
| $50,000 to $99,999 | 474 (4.4%) | 486 (3.0%) |
| $100,000 to $299,999 | 6,639 (61.4%) | 10,878 (67.7%) |
| $300,000 to $499,999 | 2,405 (22.2%) | 3,212 (20.0%) |
| $500,000 to $749,999 | 549 (5.1%) | 794 (4.9%) |
| $750,000 to $999,999 | 149 (1.4%) | 219 (1.4%) |
| $1,000,000 or more | 54 (0.5%) | 186 (1.2%) |
| Total | 10,815 (100.0%) | 16,073 (100.0%) |
Household Income by Mortgage Status in Norman
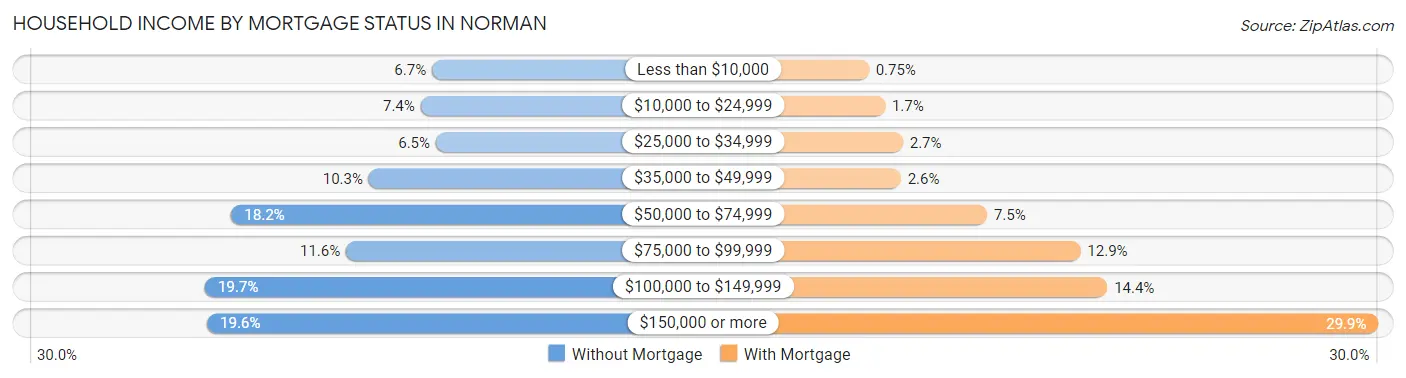
| Household Income | Without Mortgage | With Mortgage |
| Less than $10,000 | 727 (6.7%) | 120 (0.7%) |
| $10,000 to $24,999 | 797 (7.4%) | 270 (1.7%) |
| $25,000 to $34,999 | 703 (6.5%) | 434 (2.7%) |
| $35,000 to $49,999 | 1,117 (10.3%) | 414 (2.6%) |
| $50,000 to $74,999 | 1,966 (18.2%) | 1,207 (7.5%) |
| $75,000 to $99,999 | 1,258 (11.6%) | 2,066 (12.9%) |
| $100,000 to $149,999 | 2,130 (19.7%) | 2,311 (14.4%) |
| $150,000 or more | 2,117 (19.6%) | 4,801 (29.9%) |
| Total | 10,815 (100.0%) | 16,073 (100.0%) |
Property Value to Household Income Ratio in Norman
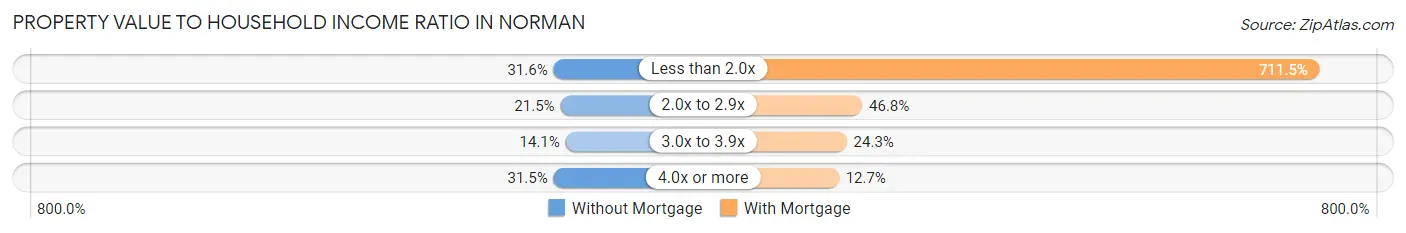
| Value-to-Income Ratio | Without Mortgage | With Mortgage |
| Less than 2.0x | 3,417 (31.6%) | 114,352 (711.4%) |
| 2.0x to 2.9x | 2,330 (21.5%) | 7,514 (46.8%) |
| 3.0x to 3.9x | 1,524 (14.1%) | 3,909 (24.3%) |
| 4.0x or more | 3,405 (31.5%) | 2,044 (12.7%) |
| Total | 10,815 (100.0%) | 16,073 (100.0%) |
Real Estate Taxes by Mortgage Status in Norman
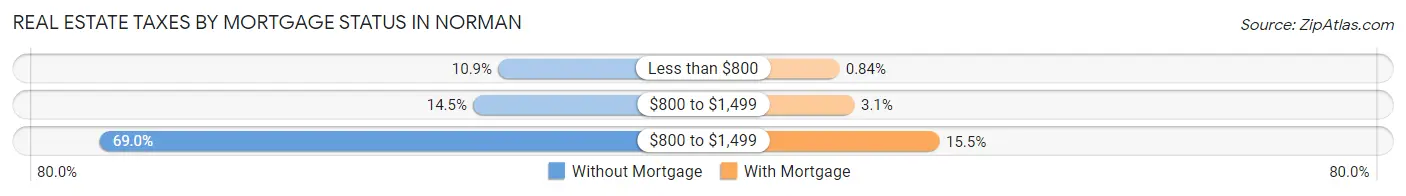
| Property Taxes | Without Mortgage | With Mortgage |
| Less than $800 | 1,173 (10.8%) | 135 (0.8%) |
| $800 to $1,499 | 1,569 (14.5%) | 493 (3.1%) |
| $800 to $1,499 | 7,463 (69.0%) | 2,490 (15.5%) |
| Total | 10,815 (100.0%) | 16,073 (100.0%) |
Health & Disability in Norman
Health Insurance Coverage by Age in Norman
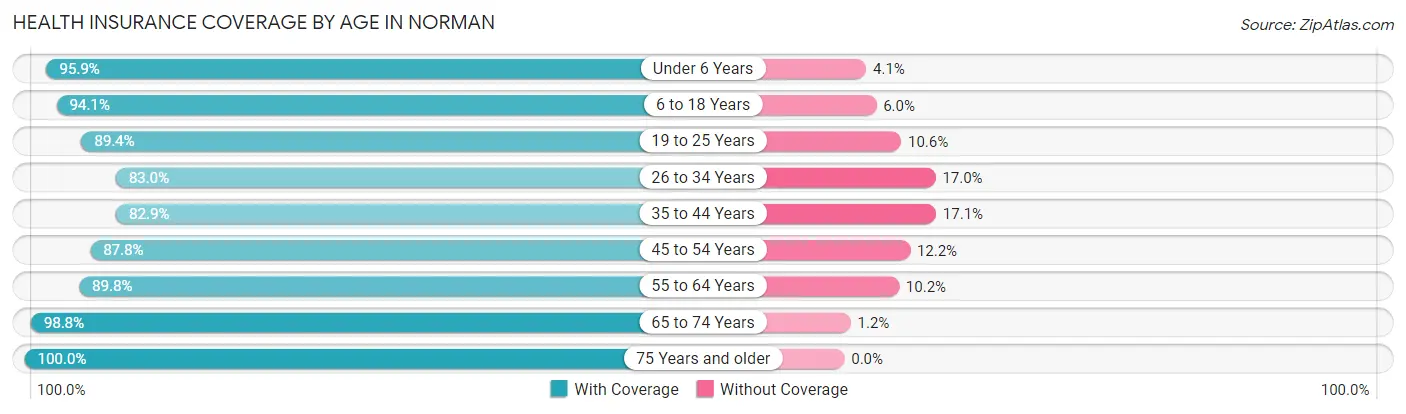
| Age Bracket | With Coverage | Without Coverage |
| Under 6 Years | 6,655 (95.9%) | 282 (4.1%) |
| 6 to 18 Years | 18,778 (94.1%) | 1,189 (5.9%) |
| 19 to 25 Years | 24,590 (89.4%) | 2,914 (10.6%) |
| 26 to 34 Years | 12,401 (83.0%) | 2,540 (17.0%) |
| 35 to 44 Years | 13,401 (82.9%) | 2,761 (17.1%) |
| 45 to 54 Years | 9,878 (87.8%) | 1,378 (12.2%) |
| 55 to 64 Years | 11,153 (89.8%) | 1,264 (10.2%) |
| 65 to 74 Years | 9,946 (98.8%) | 118 (1.2%) |
| 75 Years and older | 6,711 (100.0%) | 0 (0.0%) |
| Total | 113,513 (90.1%) | 12,446 (9.9%) |
Health Insurance Coverage by Citizenship Status in Norman
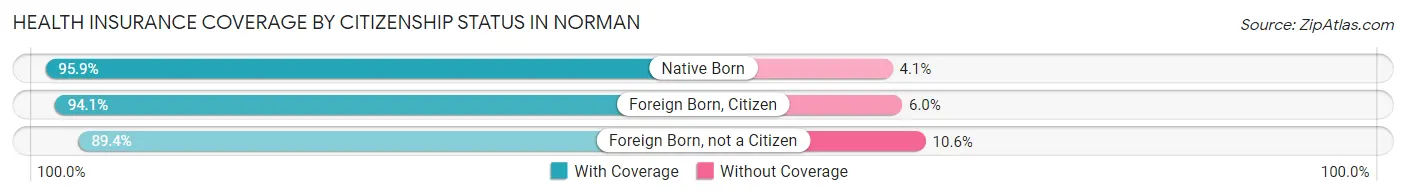
| Citizenship Status | With Coverage | Without Coverage |
| Native Born | 6,655 (95.9%) | 282 (4.1%) |
| Foreign Born, Citizen | 18,778 (94.1%) | 1,189 (5.9%) |
| Foreign Born, not a Citizen | 24,590 (89.4%) | 2,914 (10.6%) |
Health Insurance Coverage by Household Income in Norman
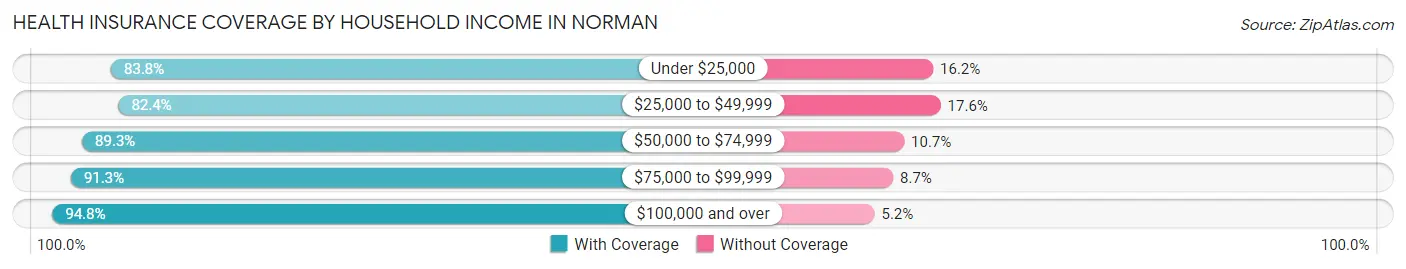
| Household Income | With Coverage | Without Coverage |
| Under $25,000 | 13,918 (83.8%) | 2,685 (16.2%) |
| $25,000 to $49,999 | 17,242 (82.4%) | 3,681 (17.6%) |
| $50,000 to $74,999 | 18,088 (89.3%) | 2,176 (10.7%) |
| $75,000 to $99,999 | 14,315 (91.3%) | 1,359 (8.7%) |
| $100,000 and over | 42,880 (94.8%) | 2,354 (5.2%) |
Public vs Private Health Insurance Coverage by Age in Norman
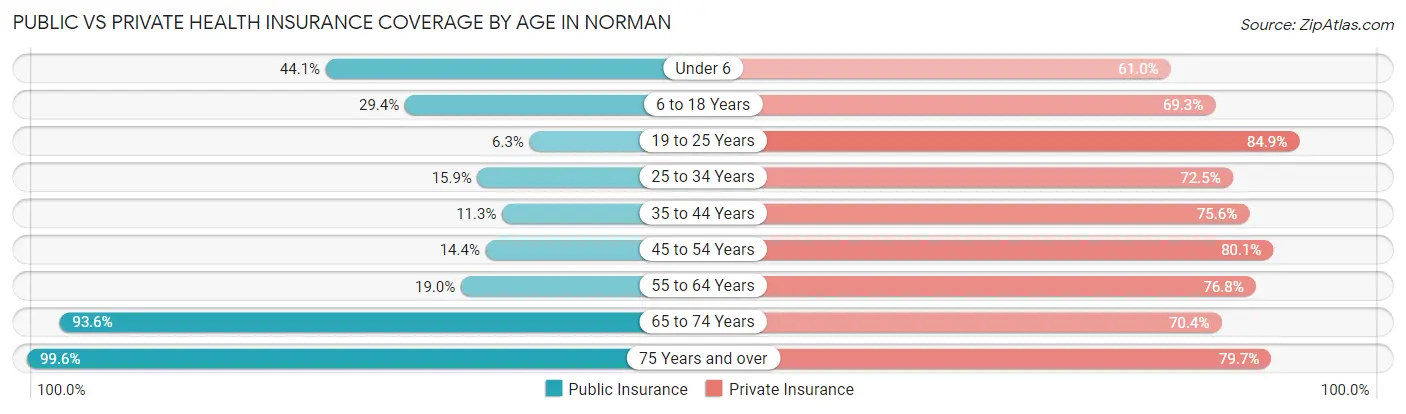
| Age Bracket | Public Insurance | Private Insurance |
| Under 6 | 3,057 (44.1%) | 4,231 (61.0%) |
| 6 to 18 Years | 5,869 (29.4%) | 13,833 (69.3%) |
| 19 to 25 Years | 1,720 (6.2%) | 23,345 (84.9%) |
| 25 to 34 Years | 2,376 (15.9%) | 10,834 (72.5%) |
| 35 to 44 Years | 1,833 (11.3%) | 12,214 (75.6%) |
| 45 to 54 Years | 1,622 (14.4%) | 9,013 (80.1%) |
| 55 to 64 Years | 2,358 (19.0%) | 9,534 (76.8%) |
| 65 to 74 Years | 9,415 (93.5%) | 7,087 (70.4%) |
| 75 Years and over | 6,681 (99.6%) | 5,348 (79.7%) |
| Total | 34,931 (27.7%) | 95,439 (75.8%) |
Disability Status by Sex by Age in Norman
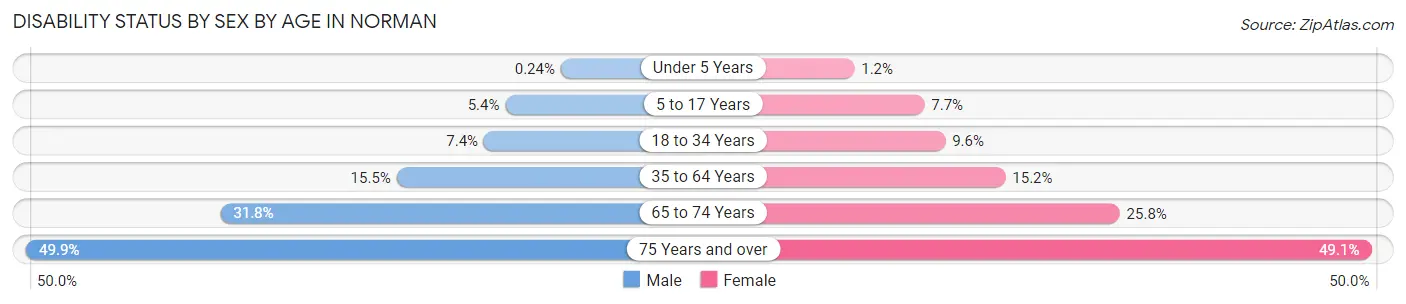
| Age Bracket | Male | Female |
| Under 5 Years | 7 (0.2%) | 28 (1.2%) |
| 5 to 17 Years | 484 (5.4%) | 670 (7.7%) |
| 18 to 34 Years | 1,708 (7.4%) | 2,219 (9.6%) |
| 35 to 64 Years | 3,015 (15.5%) | 3,089 (15.2%) |
| 65 to 74 Years | 1,516 (31.8%) | 1,367 (25.8%) |
| 75 Years and over | 1,305 (49.8%) | 2,011 (49.1%) |
Disability Class by Sex by Age in Norman
Disability Class: Hearing Difficulty
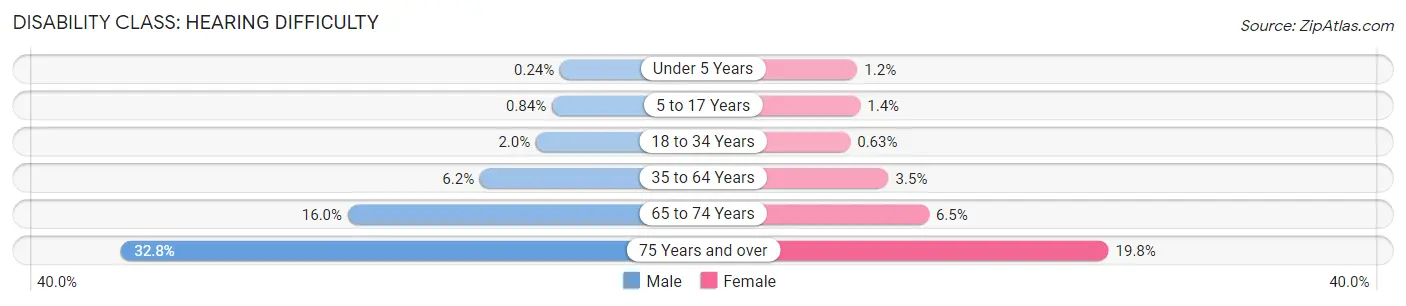
| Age Bracket | Male | Female |
| Under 5 Years | 7 (0.2%) | 28 (1.2%) |
| 5 to 17 Years | 75 (0.8%) | 121 (1.4%) |
| 18 to 34 Years | 469 (2.0%) | 145 (0.6%) |
| 35 to 64 Years | 1,207 (6.2%) | 707 (3.5%) |
| 65 to 74 Years | 762 (16.0%) | 343 (6.5%) |
| 75 Years and over | 859 (32.8%) | 811 (19.8%) |
Disability Class: Vision Difficulty
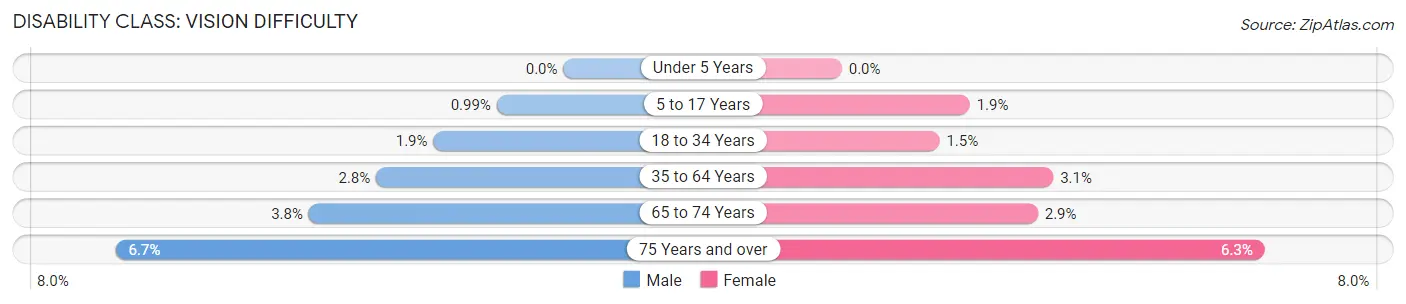
| Age Bracket | Male | Female |
| Under 5 Years | 0 (0.0%) | 0 (0.0%) |
| 5 to 17 Years | 89 (1.0%) | 166 (1.9%) |
| 18 to 34 Years | 446 (1.9%) | 336 (1.5%) |
| 35 to 64 Years | 541 (2.8%) | 639 (3.1%) |
| 65 to 74 Years | 180 (3.8%) | 154 (2.9%) |
| 75 Years and over | 174 (6.7%) | 257 (6.3%) |
Disability Class: Cognitive Difficulty
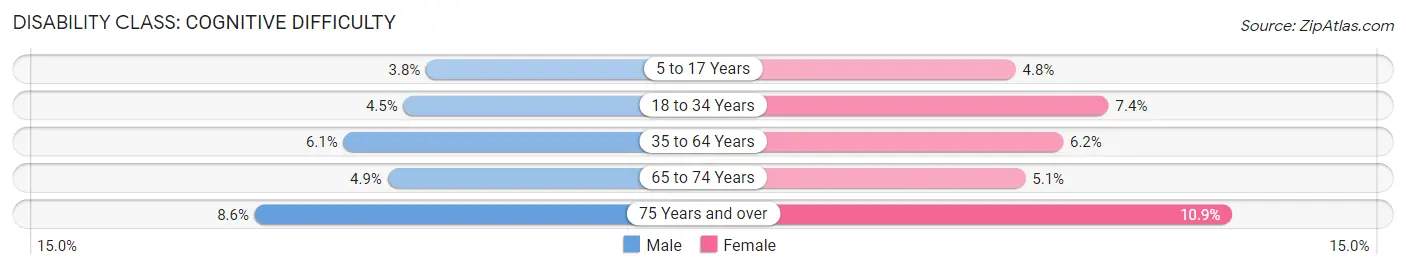
| Age Bracket | Male | Female |
| 5 to 17 Years | 343 (3.8%) | 423 (4.8%) |
| 18 to 34 Years | 1,031 (4.4%) | 1,717 (7.4%) |
| 35 to 64 Years | 1,193 (6.1%) | 1,254 (6.2%) |
| 65 to 74 Years | 233 (4.9%) | 271 (5.1%) |
| 75 Years and over | 225 (8.6%) | 445 (10.9%) |
Disability Class: Ambulatory Difficulty

| Age Bracket | Male | Female |
| 5 to 17 Years | 0 (0.0%) | 55 (0.6%) |
| 18 to 34 Years | 155 (0.7%) | 329 (1.4%) |
| 35 to 64 Years | 1,234 (6.3%) | 1,601 (7.9%) |
| 65 to 74 Years | 768 (16.1%) | 1,088 (20.5%) |
| 75 Years and over | 676 (25.8%) | 1,356 (33.1%) |
Disability Class: Self-Care Difficulty
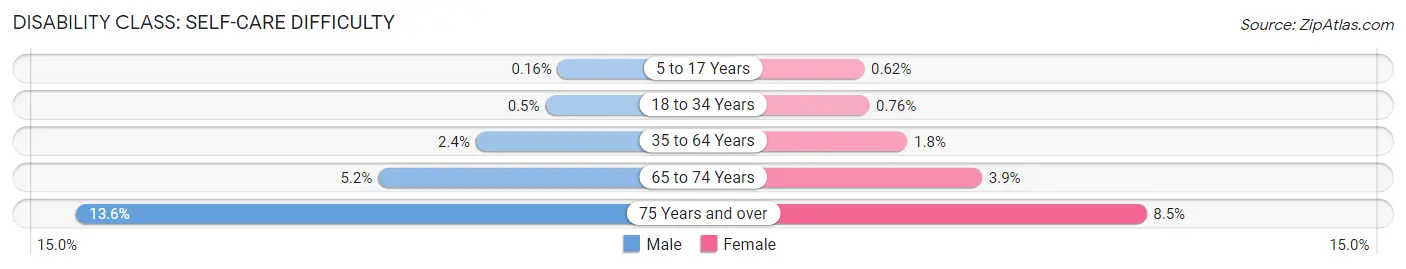
| Age Bracket | Male | Female |
| 5 to 17 Years | 14 (0.2%) | 54 (0.6%) |
| 18 to 34 Years | 116 (0.5%) | 175 (0.8%) |
| 35 to 64 Years | 475 (2.4%) | 371 (1.8%) |
| 65 to 74 Years | 246 (5.2%) | 207 (3.9%) |
| 75 Years and over | 355 (13.6%) | 347 (8.5%) |
Technology Access in Norman
Computing Device Access in Norman
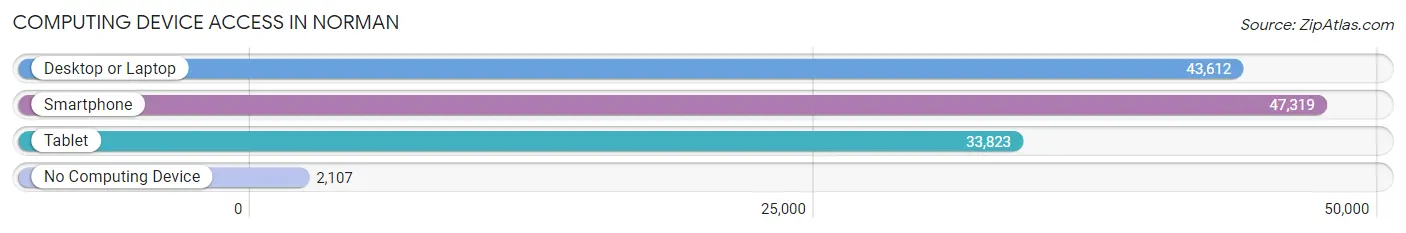
| Device Type | # Households | % Households |
| Desktop or Laptop | 43,612 | 85.0% |
| Smartphone | 47,319 | 92.2% |
| Tablet | 33,823 | 65.9% |
| No Computing Device | 2,107 | 4.1% |
| Total | 51,336 | 100.0% |
Internet Access in Norman
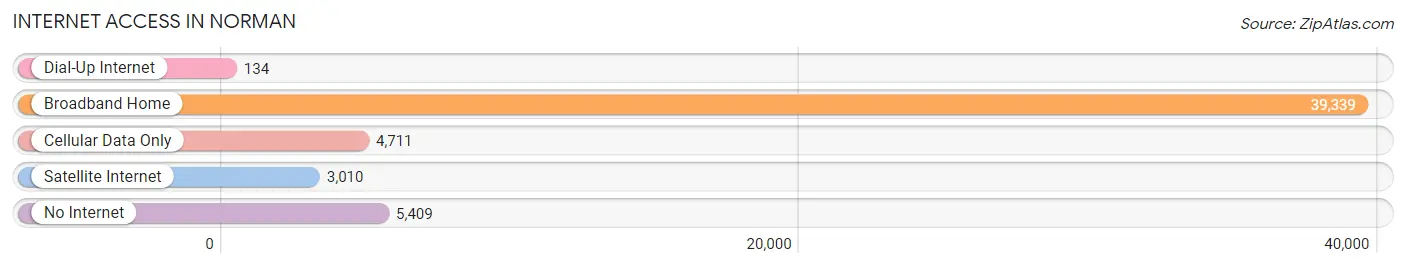
| Internet Type | # Households | % Households |
| Dial-Up Internet | 134 | 0.3% |
| Broadband Home | 39,339 | 76.6% |
| Cellular Data Only | 4,711 | 9.2% |
| Satellite Internet | 3,010 | 5.9% |
| No Internet | 5,409 | 10.5% |
| Total | 51,336 | 100.0% |
Norman Summary
Norman, Oklahoma is a city located in Cleveland County, Oklahoma, United States. It is the county seat of Cleveland County and the third-largest city in the state. The population was 110,925 at the 2010 census, making it the sixth-largest city in Oklahoma. Norman is located just south of Oklahoma City, and is part of the Oklahoma City metropolitan area.
History
Norman was founded in 1889, when the Atchison, Topeka and Santa Fe Railway was extended to the area. It was named in honor of Abner Norman, who had been the Santa Fe's land agent for the area. The city was incorporated in 1891.
In the early 1900s, Norman was a thriving agricultural center, with cotton, corn, and wheat being the main crops. The city also had a thriving business district, with several banks, stores, and other businesses.
In the 1920s, the University of Oklahoma was established in Norman, and the city quickly became a college town. The university has grown to become one of the largest in the state, and is now the city's largest employer.
Geography
Norman is located in central Oklahoma, about 20 miles south of Oklahoma City. It is situated in the rolling hills of the Sandstone Hills region of the state. The city is located on the Canadian River, which flows through the city.
The city has a total area of 87.2 square miles, of which 86.9 square miles is land and 0.3 square miles is water.
Economy
Norman's economy is largely driven by the University of Oklahoma, which is the city's largest employer. Other major employers include the Norman Regional Health System, the Norman Public Schools, and the City of Norman.
The city also has a thriving retail sector, with several shopping centers and malls. The city is also home to several manufacturing companies, including the Boeing Company, which has a large facility in the city.
Demographics
As of the 2010 census, there were 110,925 people, 43,817 households, and 25,845 families residing in the city. The population density was 1,277.3 people per square mile. The racial makeup of the city was 73.2% White, 11.2% African American, 5.2% Native American, 4.2% Asian, 0.1% Pacific Islander, 3.2% from other races, and 3.1% from two or more races. Hispanic or Latino of any race were 8.7% of the population.
The median income for a household in the city was $41,945, and the median income for a family was $54,817. The per capita income for the city was $22,845. About 11.2% of families and 17.2% of the population were below the poverty line, including 22.2% of those under age 18 and 8.7% of those age 65 or over.
Common Questions
What is Per Capita Income in Norman?
Per Capita income in Norman is $35,650.
What is the Median Family Income in Norman?
Median Family Income in Norman is $91,927.
What is the Median Household income in Norman?
Median Household Income in Norman is $62,849.
What is Income or Wage Gap in Norman?
Income or Wage Gap in Norman is 29.7%.
Women in Norman earn 70.3 cents for every dollar earned by a man.
What is Family Income Deficit in Norman?
Family Income Deficit in Norman is $10,775.
Families that are below poverty line in Norman earn $10,775 less on average than the poverty threshold level.
What is Inequality or Gini Index in Norman?
Inequality or Gini Index in Norman is 0.47.
What is the Total Population of Norman?
Total Population of Norman is 127,701.
What is the Total Male Population of Norman?
Total Male Population of Norman is 63,213.
What is the Total Female Population of Norman?
Total Female Population of Norman is 64,488.
What is the Ratio of Males per 100 Females in Norman?
There are 98.02 Males per 100 Females in Norman.
What is the Ratio of Females per 100 Males in Norman?
There are 102.02 Females per 100 Males in Norman.
What is the Median Population Age in Norman?
Median Population Age in Norman is 31.0 Years.
What is the Average Family Size in Norman
Average Family Size in Norman is 2.9 People.
What is the Average Household Size in Norman
Average Household Size in Norman is 2.3 People.
How Large is the Labor Force in Norman?
There are 69,071 People in the Labor Forcein in Norman.
What is the Percentage of People in the Labor Force in Norman?
64.4% of People are in the Labor Force in Norman.
What is the Unemployment Rate in Norman?
Unemployment Rate in Norman is 5.8%.