Lakewood, CO Map & Demographics
Lakewood Map
Lakewood Overview
$48,299
PER CAPITA INCOME
$105,748
AVG FAMILY INCOME
$82,786
AVG HOUSEHOLD INCOME
24.9%
WAGE / INCOME GAP [ % ]
75.1¢/ $1
WAGE / INCOME GAP [ $ ]
$10,296
FAMILY INCOME DEFICIT
0.44
INEQUALITY / GINI INDEX
156,149
TOTAL POPULATION
77,838
MALE POPULATION
78,311
FEMALE POPULATION
99.40
MALES / 100 FEMALES
100.61
FEMALES / 100 MALES
38.1
MEDIAN AGE
2.9
AVG FAMILY SIZE
2.3
AVG HOUSEHOLD SIZE
91,084
LABOR FORCE [ PEOPLE ]
68.5%
PERCENT IN LABOR FORCE
4.4%
UNEMPLOYMENT RATE
Income in Lakewood
Income Overview in Lakewood
Per Capita Income in Lakewood is $48,299, while median incomes of families and households are $105,748 and $82,786 respectively.
| Characteristic | Number | Measure |
| Per Capita Income | 156,149 | $48,299 |
| Median Family Income | 37,728 | $105,748 |
| Mean Family Income | 37,728 | $132,536 |
| Median Household Income | 68,111 | $82,786 |
| Mean Household Income | 68,111 | $108,333 |
| Income Deficit | 37,728 | $10,296 |
| Wage / Income Gap (%) | 156,149 | 24.92% |
| Wage / Income Gap ($) | 156,149 | 75.08¢ per $1 |
| Gini / Inequality Index | 156,149 | 0.44 |
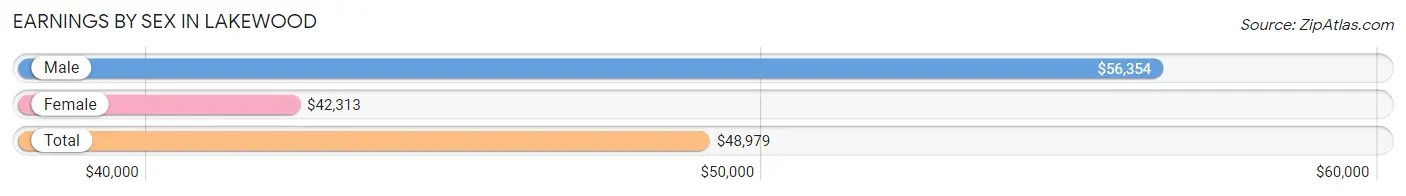
Earnings by Sex in Lakewood
Average Earnings in Lakewood are $48,979, $56,354 for men and $42,313 for women, a difference of 24.9%.
| Sex | Number | Average Earnings |
| Male | 49,468 (52.6%) | $56,354 |
| Female | 44,503 (47.4%) | $42,313 |
| Total | 93,971 (100.0%) | $48,979 |
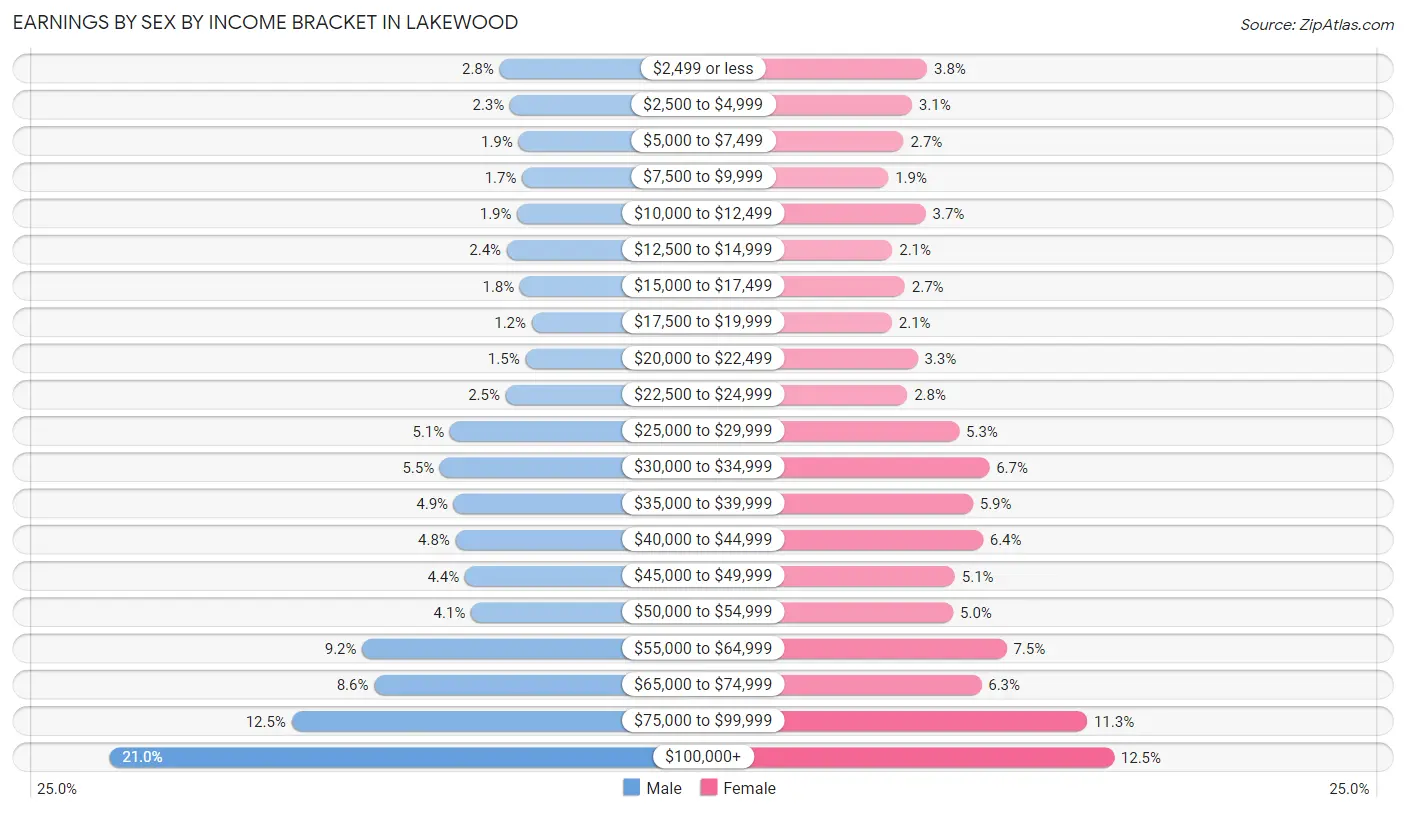
Earnings by Sex by Income Bracket in Lakewood
The most common earnings brackets in Lakewood are $100,000+ for men (10,402 | 21.0%) and $100,000+ for women (5,567 | 12.5%).
| Income | Male | Female |
| $2,499 or less | 1,361 (2.8%) | 1,673 (3.8%) |
| $2,500 to $4,999 | 1,118 (2.3%) | 1,359 (3.0%) |
| $5,000 to $7,499 | 919 (1.9%) | 1,186 (2.7%) |
| $7,500 to $9,999 | 835 (1.7%) | 864 (1.9%) |
| $10,000 to $12,499 | 950 (1.9%) | 1,641 (3.7%) |
| $12,500 to $14,999 | 1,193 (2.4%) | 946 (2.1%) |
| $15,000 to $17,499 | 887 (1.8%) | 1,212 (2.7%) |
| $17,500 to $19,999 | 613 (1.2%) | 940 (2.1%) |
| $20,000 to $22,499 | 763 (1.5%) | 1,474 (3.3%) |
| $22,500 to $24,999 | 1,215 (2.5%) | 1,258 (2.8%) |
| $25,000 to $29,999 | 2,507 (5.1%) | 2,343 (5.3%) |
| $30,000 to $34,999 | 2,743 (5.5%) | 2,968 (6.7%) |
| $35,000 to $39,999 | 2,421 (4.9%) | 2,627 (5.9%) |
| $40,000 to $44,999 | 2,377 (4.8%) | 2,833 (6.4%) |
| $45,000 to $49,999 | 2,160 (4.4%) | 2,253 (5.1%) |
| $50,000 to $54,999 | 2,020 (4.1%) | 2,218 (5.0%) |
| $55,000 to $64,999 | 4,542 (9.2%) | 3,331 (7.5%) |
| $65,000 to $74,999 | 4,262 (8.6%) | 2,802 (6.3%) |
| $75,000 to $99,999 | 6,180 (12.5%) | 5,008 (11.3%) |
| $100,000+ | 10,402 (21.0%) | 5,567 (12.5%) |
| Total | 49,468 (100.0%) | 44,503 (100.0%) |
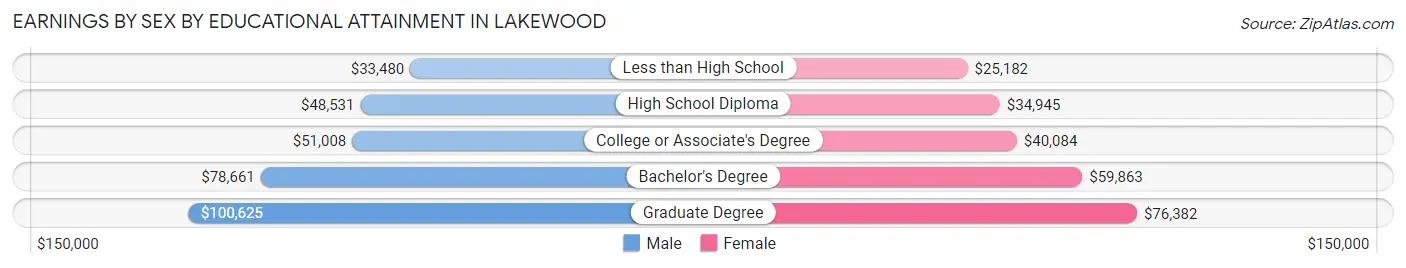
Earnings by Sex by Educational Attainment in Lakewood
Average earnings in Lakewood are $60,813 for men and $47,908 for women, a difference of 21.2%. Men with an educational attainment of graduate degree enjoy the highest average annual earnings of $100,625, while those with less than high school education earn the least with $33,480. Women with an educational attainment of graduate degree earn the most with the average annual earnings of $76,382, while those with less than high school education have the smallest earnings of $25,182.
| Educational Attainment | Male Income | Female Income |
| Less than High School | $33,480 | $25,182 |
| High School Diploma | $48,531 | $34,945 |
| College or Associate's Degree | $51,008 | $40,084 |
| Bachelor's Degree | $78,661 | $59,863 |
| Graduate Degree | $100,625 | $76,382 |
| Total | $60,813 | $47,908 |
Family Income in Lakewood
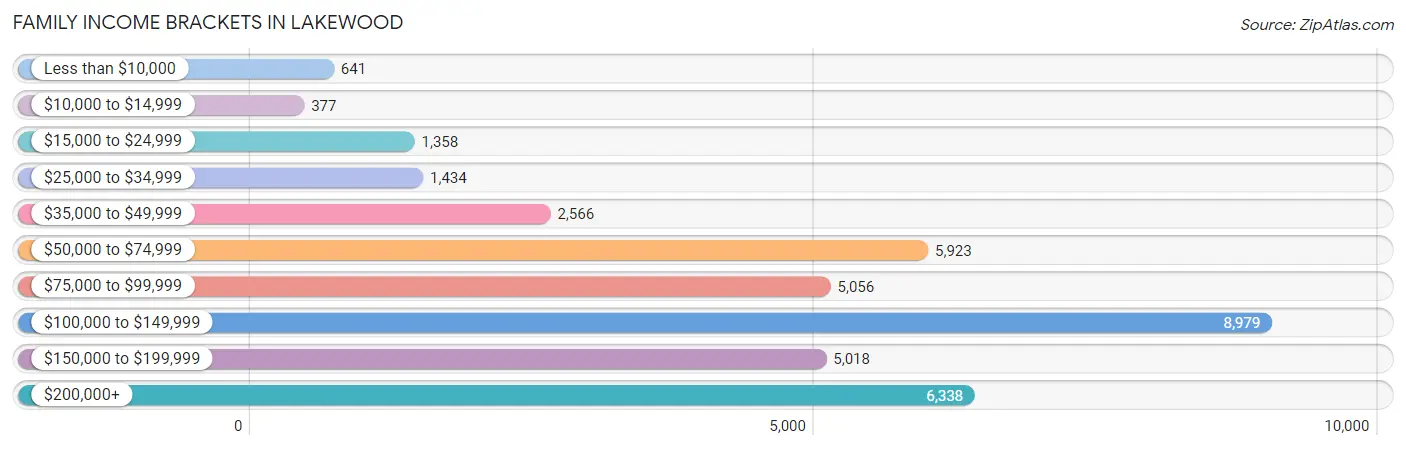
Family Income Brackets in Lakewood
According to the Lakewood family income data, there are 8,979 families falling into the $100,000 to $149,999 income range, which is the most common income bracket and makes up 23.8% of all families. Conversely, the $10,000 to $14,999 income bracket is the least frequent group with only 377 families (1.0%) belonging to this category.
| Income Bracket | # Families | % Families |
| Less than $10,000 | 641 | 1.7% |
| $10,000 to $14,999 | 377 | 1.0% |
| $15,000 to $24,999 | 1,358 | 3.6% |
| $25,000 to $34,999 | 1,434 | 3.8% |
| $35,000 to $49,999 | 2,566 | 6.8% |
| $50,000 to $74,999 | 5,923 | 15.7% |
| $75,000 to $99,999 | 5,056 | 13.4% |
| $100,000 to $149,999 | 8,979 | 23.8% |
| $150,000 to $199,999 | 5,018 | 13.3% |
| $200,000+ | 6,338 | 16.8% |
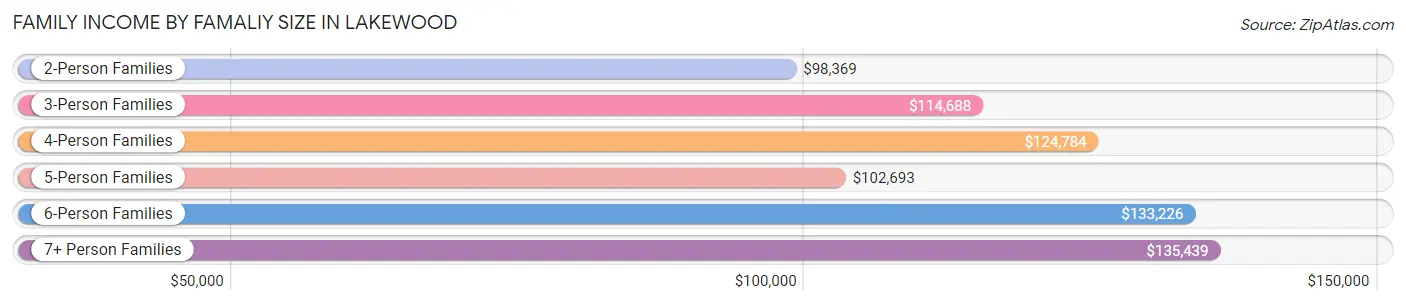
Family Income by Famaliy Size in Lakewood
7+ person families (381 | 1.0%) account for the highest median family income in Lakewood with $135,439 per family, while 2-person families (19,773 | 52.4%) have the highest median income of $49,184 per family member.
| Income Bracket | # Families | Median Income |
| 2-Person Families | 19,773 (52.4%) | $98,369 |
| 3-Person Families | 8,419 (22.3%) | $114,688 |
| 4-Person Families | 6,146 (16.3%) | $124,784 |
| 5-Person Families | 2,285 (6.1%) | $102,693 |
| 6-Person Families | 724 (1.9%) | $133,226 |
| 7+ Person Families | 381 (1.0%) | $135,439 |
| Total | 37,728 (100.0%) | $105,748 |
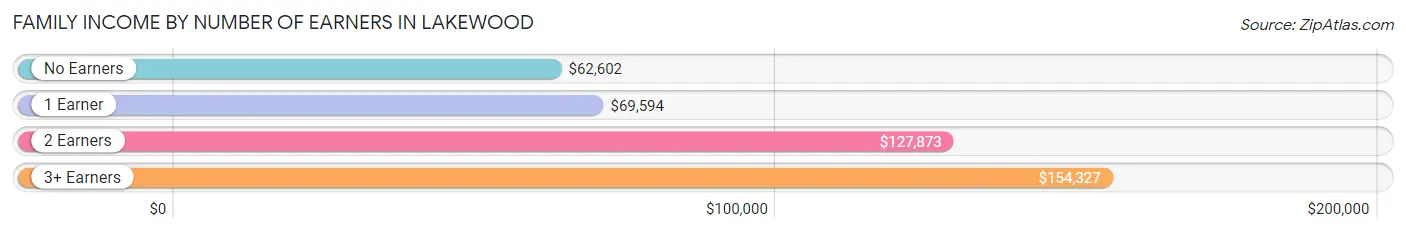
Family Income by Number of Earners in Lakewood
The median family income in Lakewood is $105,748, with families comprising 3+ earners (3,813) having the highest median family income of $154,327, while families with no earners (4,990) have the lowest median family income of $62,602, accounting for 10.1% and 13.2% of families, respectively.
| Number of Earners | # Families | Median Income |
| No Earners | 4,990 (13.2%) | $62,602 |
| 1 Earner | 11,043 (29.3%) | $69,594 |
| 2 Earners | 17,882 (47.4%) | $127,873 |
| 3+ Earners | 3,813 (10.1%) | $154,327 |
| Total | 37,728 (100.0%) | $105,748 |
Household Income in Lakewood
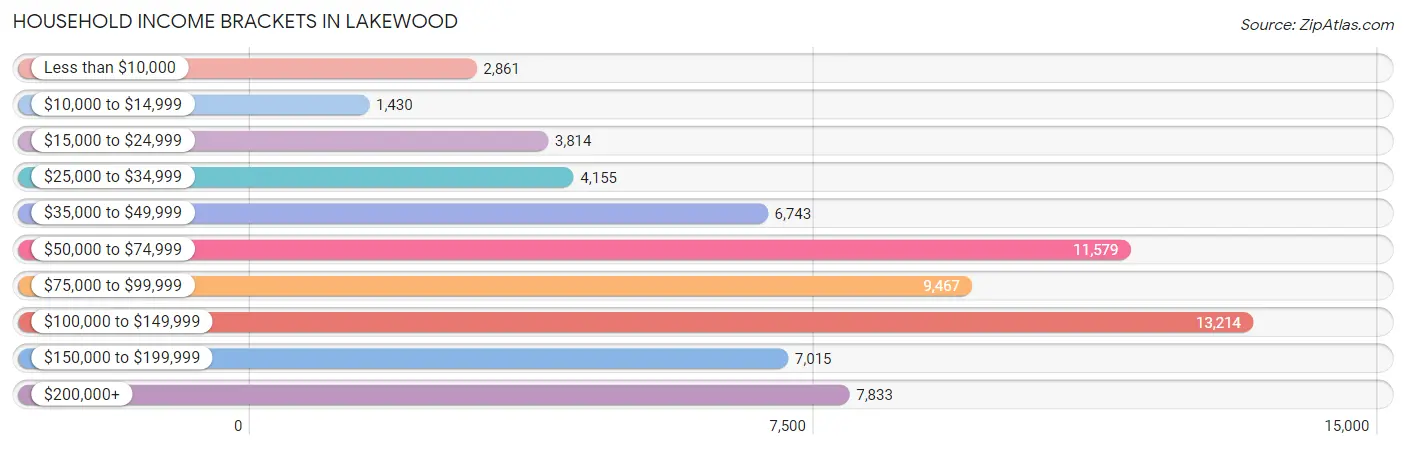
Household Income Brackets in Lakewood
With 13,214 households falling in the category, the $100,000 to $149,999 income range is the most frequent in Lakewood, accounting for 19.4% of all households. In contrast, only 1,430 households (2.1%) fall into the $10,000 to $14,999 income bracket, making it the least populous group.
| Income Bracket | # Households | % Households |
| Less than $10,000 | 2,861 | 4.2% |
| $10,000 to $14,999 | 1,430 | 2.1% |
| $15,000 to $24,999 | 3,814 | 5.6% |
| $25,000 to $34,999 | 4,155 | 6.1% |
| $35,000 to $49,999 | 6,743 | 9.9% |
| $50,000 to $74,999 | 11,579 | 17.0% |
| $75,000 to $99,999 | 9,467 | 13.9% |
| $100,000 to $149,999 | 13,214 | 19.4% |
| $150,000 to $199,999 | 7,015 | 10.3% |
| $200,000+ | 7,833 | 11.5% |
Household Income by Householder Age in Lakewood
The median household income in Lakewood is $82,786, with the highest median household income of $96,958 found in the 25 to 44 years age bracket for the primary householder. A total of 25,735 households (37.8%) fall into this category. Meanwhile, the 15 to 24 years age bracket for the primary householder has the lowest median household income of $57,639, with 3,034 households (4.4%) in this group.
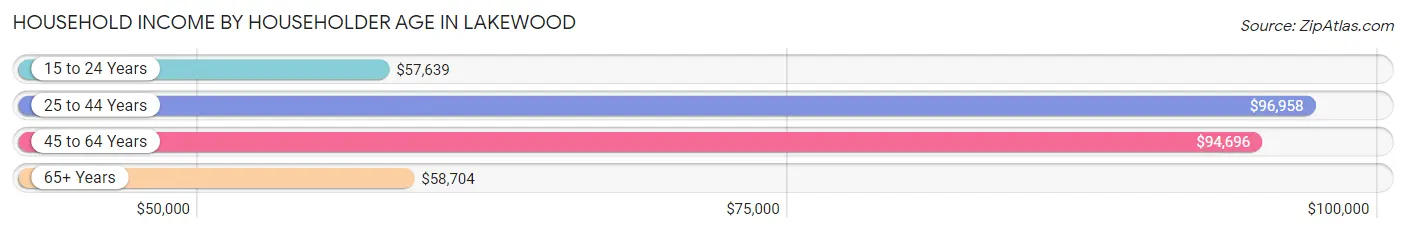
| Income Bracket | # Households | Median Income |
| 15 to 24 Years | 3,034 (4.4%) | $57,639 |
| 25 to 44 Years | 25,735 (37.8%) | $96,958 |
| 45 to 64 Years | 21,818 (32.0%) | $94,696 |
| 65+ Years | 17,524 (25.7%) | $58,704 |
| Total | 68,111 (100.0%) | $82,786 |
Poverty in Lakewood
Income Below Poverty by Sex and Age in Lakewood
With 8.3% poverty level for males and 9.3% for females among the residents of Lakewood, 18 to 24 year old males and 18 to 24 year old females are the most vulnerable to poverty, with 1,229 males (18.4%) and 1,081 females (16.0%) in their respective age groups living below the poverty level.
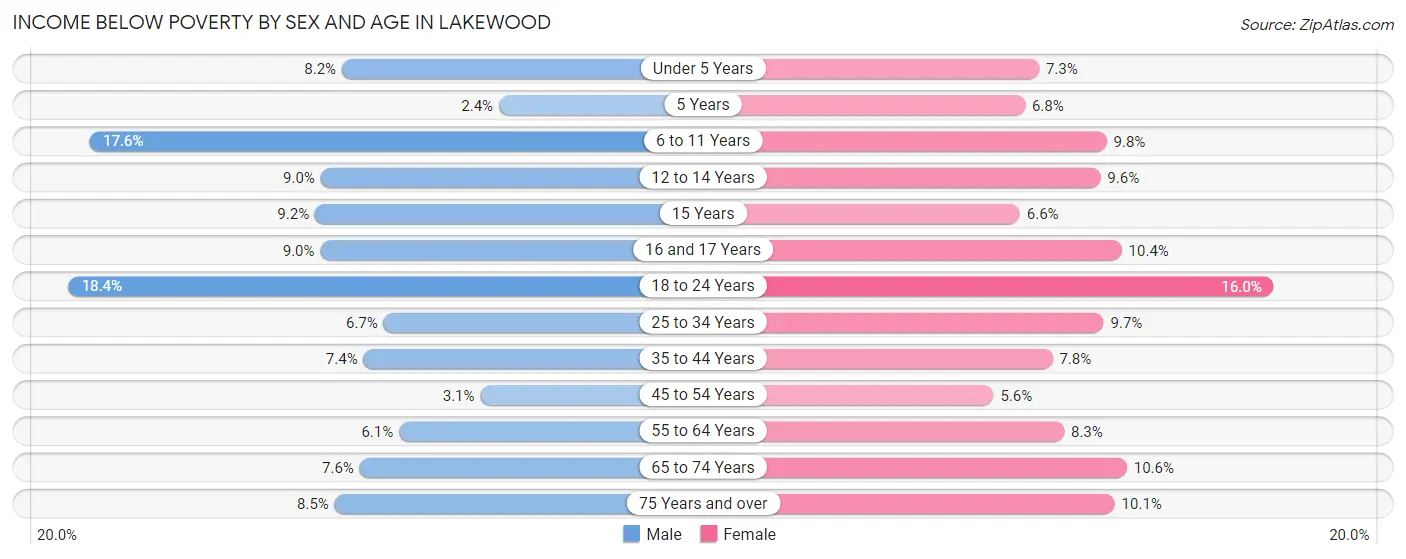
| Age Bracket | Male | Female |
| Under 5 Years | 331 (8.2%) | 265 (7.3%) |
| 5 Years | 17 (2.4%) | 53 (6.8%) |
| 6 to 11 Years | 662 (17.6%) | 381 (9.8%) |
| 12 to 14 Years | 233 (9.0%) | 203 (9.6%) |
| 15 Years | 58 (9.2%) | 41 (6.6%) |
| 16 and 17 Years | 146 (9.0%) | 141 (10.4%) |
| 18 to 24 Years | 1,229 (18.4%) | 1,081 (16.0%) |
| 25 to 34 Years | 1,041 (6.7%) | 1,366 (9.7%) |
| 35 to 44 Years | 876 (7.4%) | 805 (7.8%) |
| 45 to 54 Years | 259 (3.1%) | 486 (5.6%) |
| 55 to 64 Years | 559 (6.1%) | 856 (8.3%) |
| 65 to 74 Years | 507 (7.6%) | 842 (10.6%) |
| 75 Years and over | 406 (8.5%) | 685 (10.1%) |
| Total | 6,324 (8.3%) | 7,205 (9.3%) |
Income Above Poverty by Sex and Age in Lakewood
According to the poverty statistics in Lakewood, males aged 5 years and females aged 45 to 54 years are the age groups that are most secure financially, with 97.6% of males and 94.4% of females in these age groups living above the poverty line.
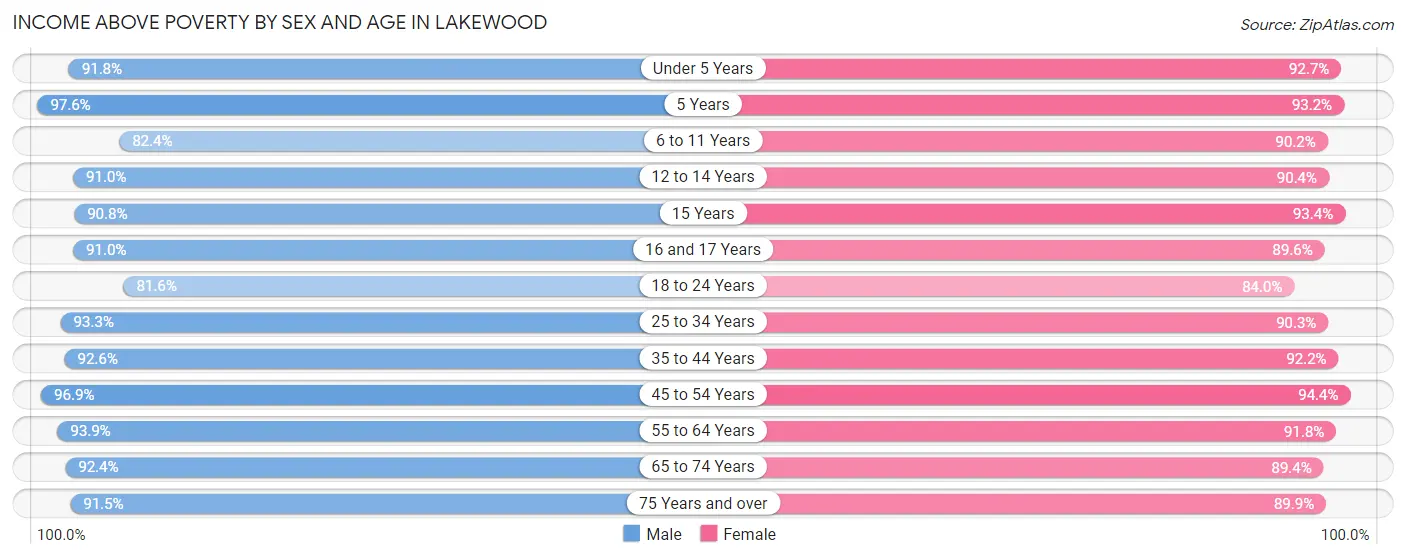
| Age Bracket | Male | Female |
| Under 5 Years | 3,696 (91.8%) | 3,356 (92.7%) |
| 5 Years | 693 (97.6%) | 726 (93.2%) |
| 6 to 11 Years | 3,106 (82.4%) | 3,494 (90.2%) |
| 12 to 14 Years | 2,354 (91.0%) | 1,912 (90.4%) |
| 15 Years | 571 (90.8%) | 579 (93.4%) |
| 16 and 17 Years | 1,472 (91.0%) | 1,216 (89.6%) |
| 18 to 24 Years | 5,464 (81.6%) | 5,662 (84.0%) |
| 25 to 34 Years | 14,566 (93.3%) | 12,681 (90.3%) |
| 35 to 44 Years | 10,922 (92.6%) | 9,490 (92.2%) |
| 45 to 54 Years | 8,160 (96.9%) | 8,143 (94.4%) |
| 55 to 64 Years | 8,606 (93.9%) | 9,515 (91.7%) |
| 65 to 74 Years | 6,203 (92.4%) | 7,118 (89.4%) |
| 75 Years and over | 4,378 (91.5%) | 6,080 (89.9%) |
| Total | 70,191 (91.7%) | 69,972 (90.7%) |
Income Below Poverty Among Married-Couple Families in Lakewood
The poverty statistics for married-couple families in Lakewood show that 2.6% or 721 of the total 27,679 families live below the poverty line. Families with 1 or 2 children have the highest poverty rate of 5.0%, comprising of 423 families. On the other hand, families with 5 or more children have the lowest poverty rate of 0.0%, which includes 0 families.
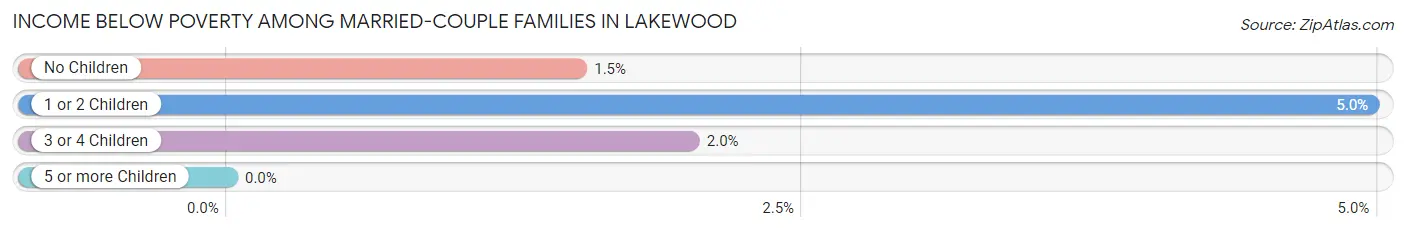
| Children | Above Poverty | Below Poverty |
| No Children | 17,361 (98.5%) | 268 (1.5%) |
| 1 or 2 Children | 8,084 (95.0%) | 423 (5.0%) |
| 3 or 4 Children | 1,459 (98.0%) | 30 (2.0%) |
| 5 or more Children | 54 (100.0%) | 0 (0.0%) |
| Total | 26,958 (97.4%) | 721 (2.6%) |
Income Below Poverty Among Single-Parent Households in Lakewood
According to the poverty data in Lakewood, 4.6% or 160 single-father households and 16.8% or 1,098 single-mother households are living below the poverty line. Among single-father households, those with 1 or 2 children have the highest poverty rate, with 123 households (7.3%) experiencing poverty. Likewise, among single-mother households, those with 5 or more children have the highest poverty rate, with 108 households (100.0%) falling below the poverty line.
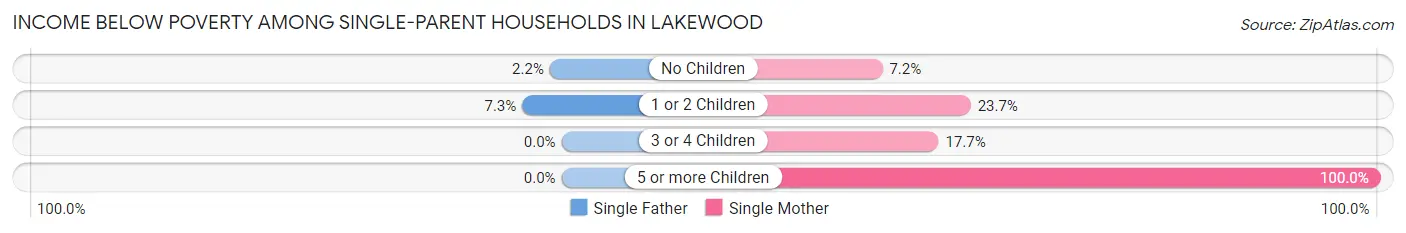
| Children | Single Father | Single Mother |
| No Children | 37 (2.2%) | 219 (7.2%) |
| 1 or 2 Children | 123 (7.3%) | 671 (23.7%) |
| 3 or 4 Children | 0 (0.0%) | 100 (17.7%) |
| 5 or more Children | 0 (0.0%) | 108 (100.0%) |
| Total | 160 (4.6%) | 1,098 (16.8%) |
Income Below Poverty Among Married-Couple vs Single-Parent Households in Lakewood
The poverty data for Lakewood shows that 721 of the married-couple family households (2.6%) and 1,258 of the single-parent households (12.5%) are living below the poverty level. Within the married-couple family households, those with 1 or 2 children have the highest poverty rate, with 423 households (5.0%) falling below the poverty line. Among the single-parent households, those with 5 or more children have the highest poverty rate, with 108 household (100.0%) living below poverty.
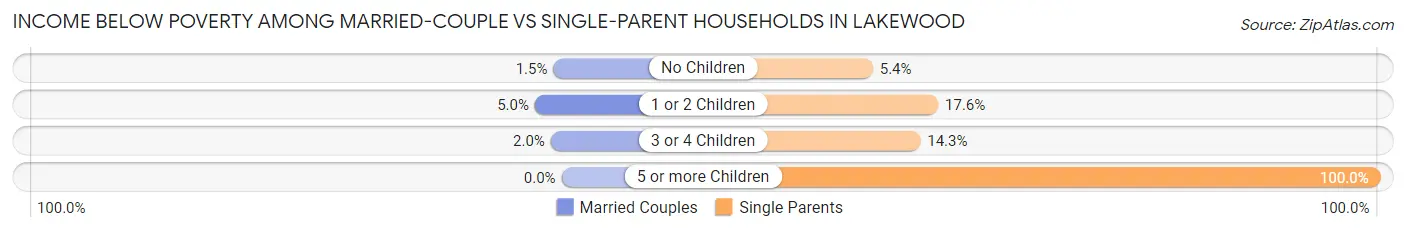
| Children | Married-Couple Families | Single-Parent Households |
| No Children | 268 (1.5%) | 256 (5.4%) |
| 1 or 2 Children | 423 (5.0%) | 794 (17.6%) |
| 3 or 4 Children | 30 (2.0%) | 100 (14.3%) |
| 5 or more Children | 0 (0.0%) | 108 (100.0%) |
| Total | 721 (2.6%) | 1,258 (12.5%) |
Race in Lakewood
The most populous races in Lakewood are White / Caucasian (122,796 | 78.6%), Hispanic or Latino (35,021 | 22.4%), and Two or more Races (16,707 | 10.7%).
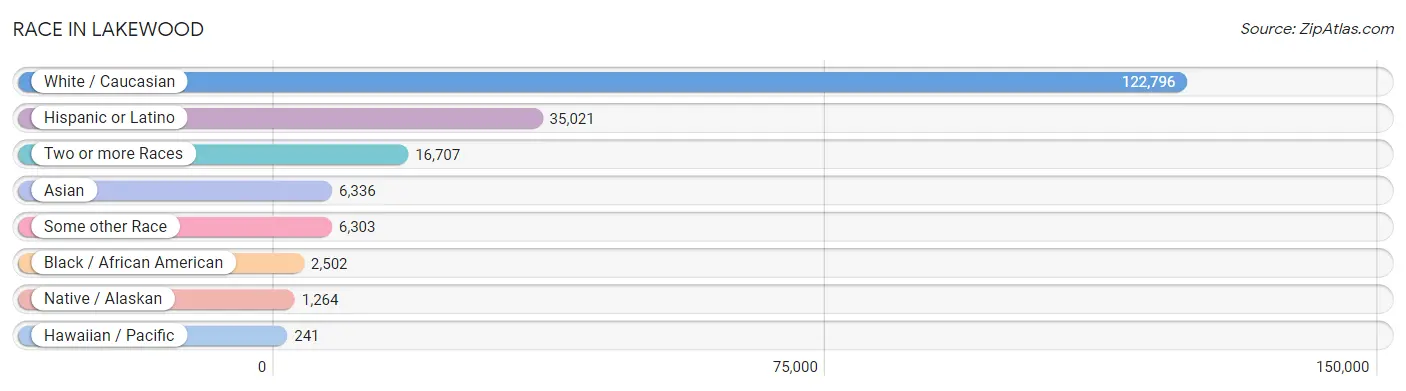
| Race | # Population | % Population |
| Asian | 6,336 | 4.1% |
| Black / African American | 2,502 | 1.6% |
| Hawaiian / Pacific | 241 | 0.2% |
| Hispanic or Latino | 35,021 | 22.4% |
| Native / Alaskan | 1,264 | 0.8% |
| White / Caucasian | 122,796 | 78.6% |
| Two or more Races | 16,707 | 10.7% |
| Some other Race | 6,303 | 4.0% |
| Total | 156,149 | 100.0% |
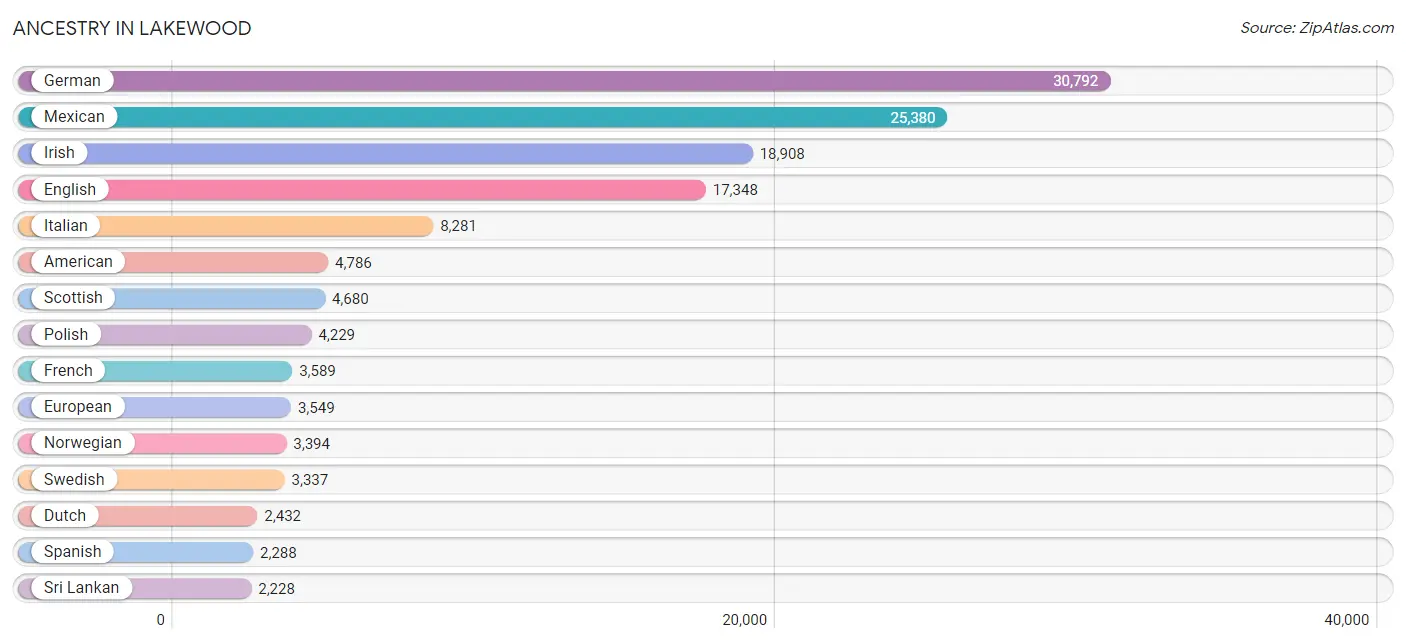
Ancestry in Lakewood
The most populous ancestries reported in Lakewood are German (30,792 | 19.7%), Mexican (25,380 | 16.3%), Irish (18,908 | 12.1%), English (17,348 | 11.1%), and Italian (8,281 | 5.3%), together accounting for 64.5% of all Lakewood residents.
| Ancestry | # Population | % Population |
| Afghan | 12 | 0.0% |
| African | 335 | 0.2% |
| Albanian | 9 | 0.0% |
| Alsatian | 8 | 0.0% |
| American | 4,786 | 3.1% |
| Apache | 469 | 0.3% |
| Arab | 428 | 0.3% |
| Argentinean | 62 | 0.0% |
| Armenian | 79 | 0.1% |
| Assyrian / Chaldean / Syriac | 14 | 0.0% |
| Australian | 40 | 0.0% |
| Austrian | 590 | 0.4% |
| Bangladeshi | 27 | 0.0% |
| Barbadian | 20 | 0.0% |
| Basque | 45 | 0.0% |
| Belgian | 148 | 0.1% |
| Bhutanese | 877 | 0.6% |
| Blackfeet | 145 | 0.1% |
| Bolivian | 41 | 0.0% |
| Brazilian | 139 | 0.1% |
| British | 1,169 | 0.7% |
| Bulgarian | 57 | 0.0% |
| Burmese | 1,010 | 0.6% |
| Cajun | 5 | 0.0% |
| Cambodian | 28 | 0.0% |
| Canadian | 381 | 0.2% |
| Celtic | 59 | 0.0% |
| Central American | 999 | 0.6% |
| Central American Indian | 122 | 0.1% |
| Cherokee | 324 | 0.2% |
| Chickasaw | 44 | 0.0% |
| Chilean | 238 | 0.2% |
| Chippewa | 45 | 0.0% |
| Choctaw | 25 | 0.0% |
| Colombian | 229 | 0.2% |
| Comanche | 5 | 0.0% |
| Costa Rican | 190 | 0.1% |
| Croatian | 164 | 0.1% |
| Crow | 12 | 0.0% |
| Cuban | 519 | 0.3% |
| Czech | 1,030 | 0.7% |
| Czechoslovakian | 126 | 0.1% |
| Danish | 1,272 | 0.8% |
| Delaware | 8 | 0.0% |
| Dominican | 38 | 0.0% |
| Dutch | 2,432 | 1.6% |
| Eastern European | 502 | 0.3% |
| Ecuadorian | 182 | 0.1% |
| Egyptian | 98 | 0.1% |
| English | 17,348 | 11.1% |
| Estonian | 78 | 0.1% |
| Ethiopian | 10 | 0.0% |
| European | 3,549 | 2.3% |
| Filipino | 184 | 0.1% |
| Finnish | 396 | 0.3% |
| French | 3,589 | 2.3% |
| French Canadian | 483 | 0.3% |
| German | 30,792 | 19.7% |
| German Russian | 46 | 0.0% |
| Ghanaian | 4 | 0.0% |
| Greek | 388 | 0.3% |
| Guamanian / Chamorro | 63 | 0.0% |
| Guatemalan | 462 | 0.3% |
| Haitian | 26 | 0.0% |
| Honduran | 171 | 0.1% |
| Hopi | 193 | 0.1% |
| Hungarian | 413 | 0.3% |
| Icelander | 31 | 0.0% |
| Indian (Asian) | 1,745 | 1.1% |
| Indonesian | 34 | 0.0% |
| Iranian | 272 | 0.2% |
| Iraqi | 12 | 0.0% |
| Irish | 18,908 | 12.1% |
| Iroquois | 10 | 0.0% |
| Israeli | 46 | 0.0% |
| Italian | 8,281 | 5.3% |
| Jamaican | 30 | 0.0% |
| Japanese | 148 | 0.1% |
| Kenyan | 22 | 0.0% |
| Korean | 1,063 | 0.7% |
| Laotian | 17 | 0.0% |
| Latvian | 40 | 0.0% |
| Lebanese | 94 | 0.1% |
| Lithuanian | 396 | 0.3% |
| Lumbee | 19 | 0.0% |
| Luxembourger | 31 | 0.0% |
| Malaysian | 44 | 0.0% |
| Maltese | 23 | 0.0% |
| Menominee | 6 | 0.0% |
| Mexican | 25,380 | 16.3% |
| Mexican American Indian | 279 | 0.2% |
| Moroccan | 63 | 0.0% |
| Native Hawaiian | 287 | 0.2% |
| Navajo | 543 | 0.4% |
| New Zealander | 33 | 0.0% |
| Nicaraguan | 35 | 0.0% |
| Nigerian | 167 | 0.1% |
| Northern European | 539 | 0.4% |
| Norwegian | 3,394 | 2.2% |
| Okinawan | 10 | 0.0% |
| Osage | 24 | 0.0% |
| Pakistani | 79 | 0.1% |
| Palestinian | 28 | 0.0% |
| Panamanian | 47 | 0.0% |
| Paraguayan | 85 | 0.1% |
| Pennsylvania German | 104 | 0.1% |
| Peruvian | 294 | 0.2% |
| Polish | 4,229 | 2.7% |
| Portuguese | 746 | 0.5% |
| Potawatomi | 4 | 0.0% |
| Pueblo | 49 | 0.0% |
| Puerto Rican | 967 | 0.6% |
| Romanian | 255 | 0.2% |
| Russian | 1,645 | 1.1% |
| Salvadoran | 94 | 0.1% |
| Samoan | 108 | 0.1% |
| Scandinavian | 1,216 | 0.8% |
| Scotch-Irish | 1,807 | 1.2% |
| Scottish | 4,680 | 3.0% |
| Serbian | 132 | 0.1% |
| Sierra Leonean | 10 | 0.0% |
| Sioux | 477 | 0.3% |
| Slavic | 96 | 0.1% |
| Slovak | 333 | 0.2% |
| Slovene | 122 | 0.1% |
| South African | 37 | 0.0% |
| South American | 1,266 | 0.8% |
| South American Indian | 28 | 0.0% |
| Spaniard | 1,643 | 1.1% |
| Spanish | 2,288 | 1.5% |
| Spanish American | 46 | 0.0% |
| Spanish American Indian | 18 | 0.0% |
| Sri Lankan | 2,228 | 1.4% |
| Subsaharan African | 634 | 0.4% |
| Swedish | 3,337 | 2.1% |
| Swiss | 732 | 0.5% |
| Syrian | 47 | 0.0% |
| Thai | 982 | 0.6% |
| Turkish | 51 | 0.0% |
| Ukrainian | 433 | 0.3% |
| Ute | 11 | 0.0% |
| Venezuelan | 135 | 0.1% |
| Welsh | 1,110 | 0.7% |
| West Indian | 68 | 0.0% |
| Yugoslavian | 157 | 0.1% | View All 145 Rows |
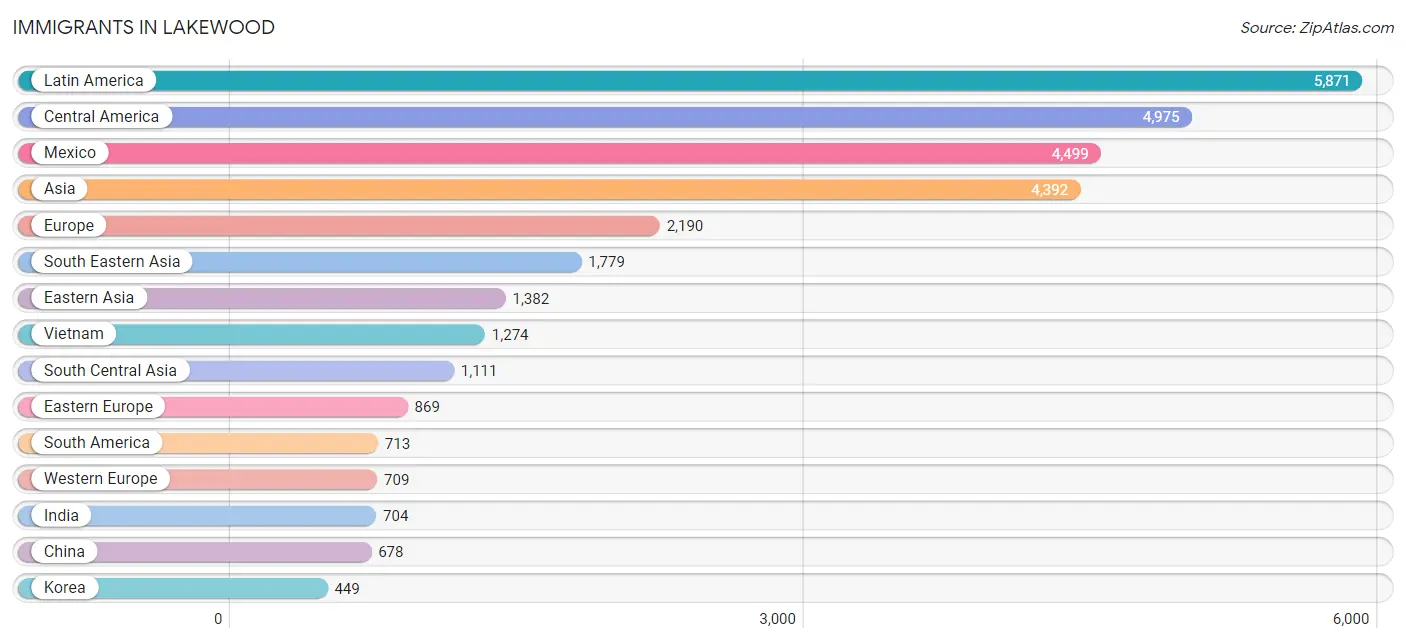
Immigrants in Lakewood
The most numerous immigrant groups reported in Lakewood came from Latin America (5,871 | 3.8%), Central America (4,975 | 3.2%), Mexico (4,499 | 2.9%), Asia (4,392 | 2.8%), and Europe (2,190 | 1.4%), together accounting for 14.0% of all Lakewood residents.
| Immigration Origin | # Population | % Population |
| Afghanistan | 19 | 0.0% |
| Africa | 427 | 0.3% |
| Albania | 8 | 0.0% |
| Argentina | 13 | 0.0% |
| Armenia | 13 | 0.0% |
| Asia | 4,392 | 2.8% |
| Australia | 53 | 0.0% |
| Austria | 10 | 0.0% |
| Belarus | 27 | 0.0% |
| Belgium | 13 | 0.0% |
| Bolivia | 42 | 0.0% |
| Bosnia and Herzegovina | 49 | 0.0% |
| Brazil | 227 | 0.2% |
| Bulgaria | 39 | 0.0% |
| Cambodia | 20 | 0.0% |
| Canada | 352 | 0.2% |
| Caribbean | 183 | 0.1% |
| Central America | 4,975 | 3.2% |
| Chile | 67 | 0.0% |
| China | 678 | 0.4% |
| Colombia | 81 | 0.1% |
| Costa Rica | 38 | 0.0% |
| Croatia | 27 | 0.0% |
| Cuba | 137 | 0.1% |
| Czechoslovakia | 33 | 0.0% |
| Eastern Africa | 208 | 0.1% |
| Eastern Asia | 1,382 | 0.9% |
| Eastern Europe | 869 | 0.6% |
| Ecuador | 69 | 0.0% |
| Egypt | 41 | 0.0% |
| El Salvador | 48 | 0.0% |
| England | 202 | 0.1% |
| Ethiopia | 10 | 0.0% |
| Europe | 2,190 | 1.4% |
| France | 189 | 0.1% |
| Germany | 439 | 0.3% |
| Greece | 17 | 0.0% |
| Guatemala | 254 | 0.2% |
| Haiti | 6 | 0.0% |
| Honduras | 120 | 0.1% |
| Hong Kong | 45 | 0.0% |
| Hungary | 52 | 0.0% |
| India | 704 | 0.4% |
| Indonesia | 22 | 0.0% |
| Iran | 113 | 0.1% |
| Iraq | 27 | 0.0% |
| Ireland | 16 | 0.0% |
| Israel | 9 | 0.0% |
| Italy | 103 | 0.1% |
| Jamaica | 23 | 0.0% |
| Japan | 244 | 0.2% |
| Kenya | 22 | 0.0% |
| Korea | 449 | 0.3% |
| Laos | 21 | 0.0% |
| Latin America | 5,871 | 3.8% |
| Lithuania | 56 | 0.0% |
| Mexico | 4,499 | 2.9% |
| Moldova | 9 | 0.0% |
| Morocco | 15 | 0.0% |
| Nepal | 93 | 0.1% |
| Netherlands | 58 | 0.0% |
| Nicaragua | 16 | 0.0% |
| Nigeria | 24 | 0.0% |
| Northern Africa | 132 | 0.1% |
| Northern Europe | 436 | 0.3% |
| Oceania | 67 | 0.0% |
| Pakistan | 66 | 0.0% |
| Peru | 85 | 0.1% |
| Philippines | 288 | 0.2% |
| Poland | 180 | 0.1% |
| Portugal | 9 | 0.0% |
| Romania | 47 | 0.0% |
| Russia | 219 | 0.1% |
| Saudi Arabia | 26 | 0.0% |
| Scotland | 19 | 0.0% |
| Serbia | 5 | 0.0% |
| Singapore | 22 | 0.0% |
| South Africa | 58 | 0.0% |
| South America | 713 | 0.5% |
| South Central Asia | 1,111 | 0.7% |
| South Eastern Asia | 1,779 | 1.1% |
| Southern Europe | 176 | 0.1% |
| Spain | 47 | 0.0% |
| Sri Lanka | 4 | 0.0% |
| Sweden | 9 | 0.0% |
| Syria | 34 | 0.0% |
| Taiwan | 34 | 0.0% |
| Thailand | 110 | 0.1% |
| Turkey | 11 | 0.0% |
| Uganda | 167 | 0.1% |
| Ukraine | 56 | 0.0% |
| Uzbekistan | 52 | 0.0% |
| Venezuela | 44 | 0.0% |
| Vietnam | 1,274 | 0.8% |
| Western Africa | 24 | 0.0% |
| Western Asia | 120 | 0.1% |
| Western Europe | 709 | 0.4% | View All 97 Rows |
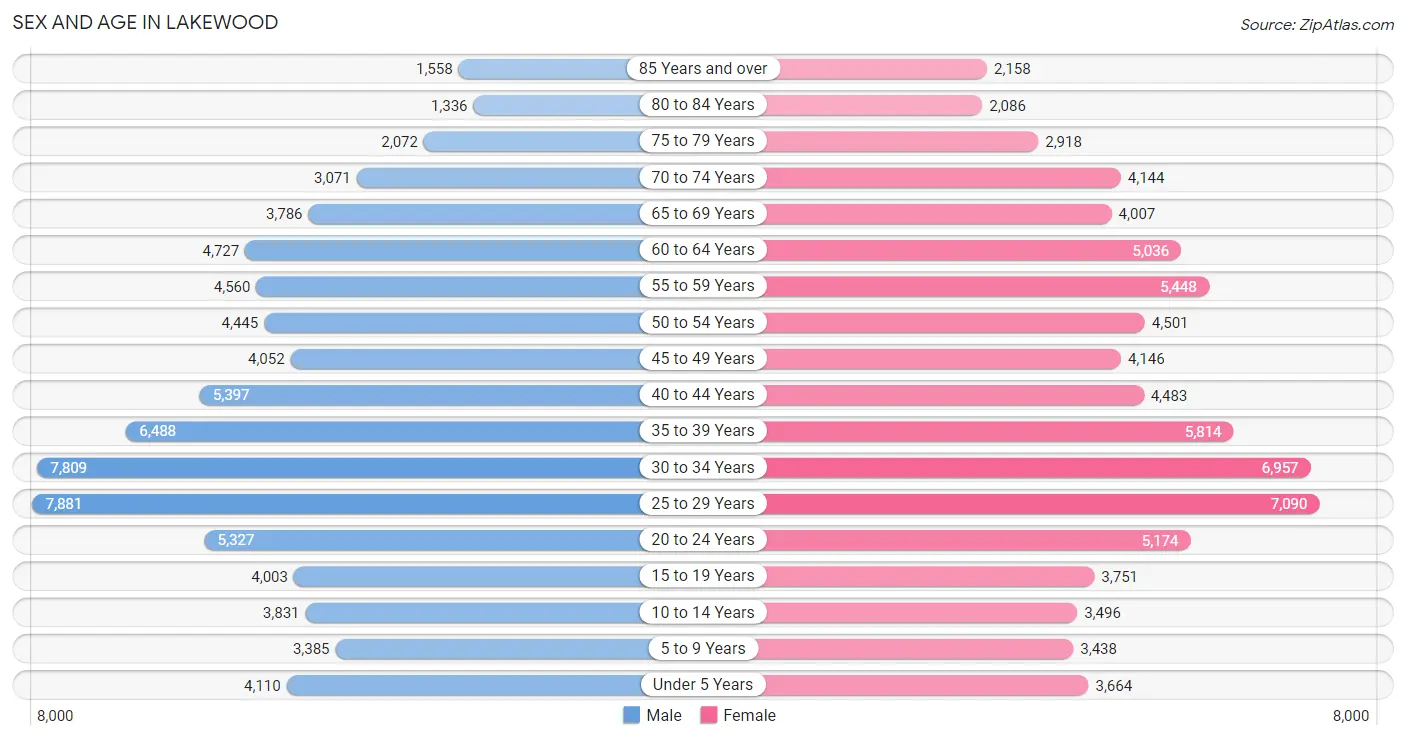
Sex and Age in Lakewood
Sex and Age in Lakewood
The most populous age groups in Lakewood are 25 to 29 Years (7,881 | 10.1%) for men and 25 to 29 Years (7,090 | 9.0%) for women.
| Age Bracket | Male | Female |
| Under 5 Years | 4,110 (5.3%) | 3,664 (4.7%) |
| 5 to 9 Years | 3,385 (4.3%) | 3,438 (4.4%) |
| 10 to 14 Years | 3,831 (4.9%) | 3,496 (4.5%) |
| 15 to 19 Years | 4,003 (5.1%) | 3,751 (4.8%) |
| 20 to 24 Years | 5,327 (6.8%) | 5,174 (6.6%) |
| 25 to 29 Years | 7,881 (10.1%) | 7,090 (9.0%) |
| 30 to 34 Years | 7,809 (10.0%) | 6,957 (8.9%) |
| 35 to 39 Years | 6,488 (8.3%) | 5,814 (7.4%) |
| 40 to 44 Years | 5,397 (6.9%) | 4,483 (5.7%) |
| 45 to 49 Years | 4,052 (5.2%) | 4,146 (5.3%) |
| 50 to 54 Years | 4,445 (5.7%) | 4,501 (5.8%) |
| 55 to 59 Years | 4,560 (5.9%) | 5,448 (7.0%) |
| 60 to 64 Years | 4,727 (6.1%) | 5,036 (6.4%) |
| 65 to 69 Years | 3,786 (4.9%) | 4,007 (5.1%) |
| 70 to 74 Years | 3,071 (4.0%) | 4,144 (5.3%) |
| 75 to 79 Years | 2,072 (2.7%) | 2,918 (3.7%) |
| 80 to 84 Years | 1,336 (1.7%) | 2,086 (2.7%) |
| 85 Years and over | 1,558 (2.0%) | 2,158 (2.8%) |
| Total | 77,838 (100.0%) | 78,311 (100.0%) |
Families and Households in Lakewood
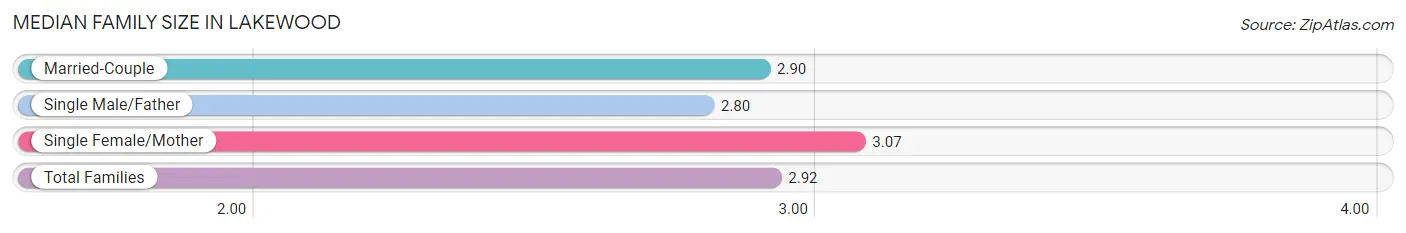
Median Family Size in Lakewood
The median family size in Lakewood is 2.92 persons per family, with single female/mother families (6,544 | 17.3%) accounting for the largest median family size of 3.07 persons per family. On the other hand, single male/father families (3,505 | 9.3%) represent the smallest median family size with 2.80 persons per family.
| Family Type | # Families | Family Size |
| Married-Couple | 27,679 (73.4%) | 2.90 |
| Single Male/Father | 3,505 (9.3%) | 2.80 |
| Single Female/Mother | 6,544 (17.3%) | 3.07 |
| Total Families | 37,728 (100.0%) | 2.92 |
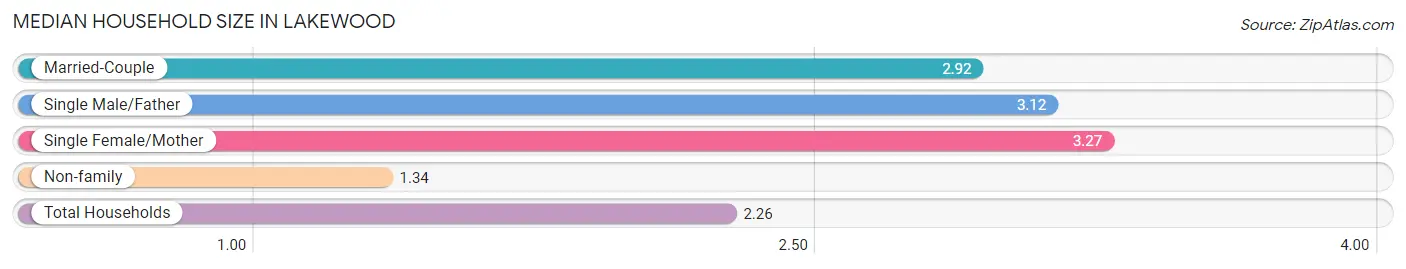
Median Household Size in Lakewood
The median household size in Lakewood is 2.26 persons per household, with single female/mother households (6,544 | 9.6%) accounting for the largest median household size of 3.27 persons per household. non-family households (30,383 | 44.6%) represent the smallest median household size with 1.34 persons per household.
| Household Type | # Households | Household Size |
| Married-Couple | 27,679 (40.6%) | 2.92 |
| Single Male/Father | 3,505 (5.1%) | 3.12 |
| Single Female/Mother | 6,544 (9.6%) | 3.27 |
| Non-family | 30,383 (44.6%) | 1.34 |
| Total Households | 68,111 (100.0%) | 2.26 |
Household Size by Marriage Status in Lakewood
Out of a total of 68,111 households in Lakewood, 37,728 (55.4%) are family households, while 30,383 (44.6%) are nonfamily households. The most numerous type of family households are 2-person households, comprising 18,411, and the most common type of nonfamily households are 1-person households, comprising 22,836.
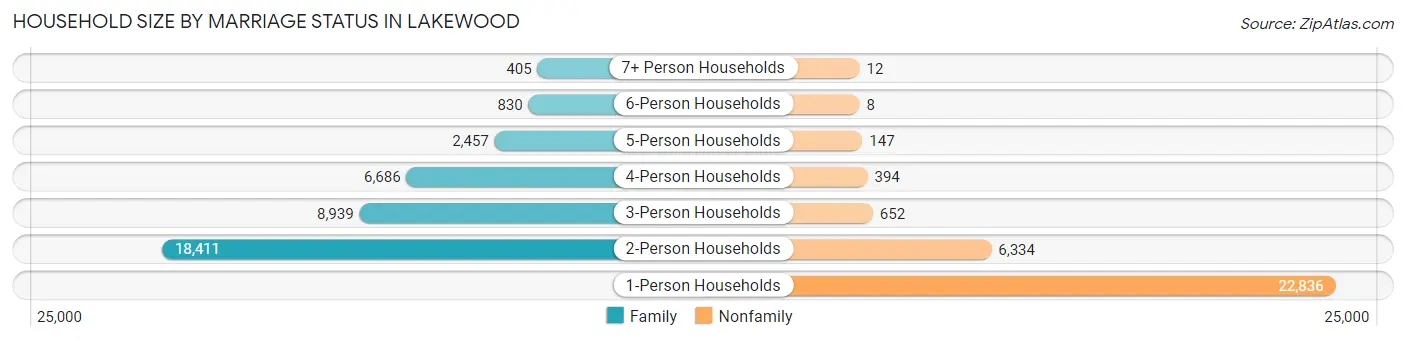
| Household Size | Family Households | Nonfamily Households |
| 1-Person Households | - | 22,836 (33.5%) |
| 2-Person Households | 18,411 (27.0%) | 6,334 (9.3%) |
| 3-Person Households | 8,939 (13.1%) | 652 (1.0%) |
| 4-Person Households | 6,686 (9.8%) | 394 (0.6%) |
| 5-Person Households | 2,457 (3.6%) | 147 (0.2%) |
| 6-Person Households | 830 (1.2%) | 8 (0.0%) |
| 7+ Person Households | 405 (0.6%) | 12 (0.0%) |
| Total | 37,728 (55.4%) | 30,383 (44.6%) |
Female Fertility in Lakewood
Fertility by Age in Lakewood
Average fertility rate in Lakewood is 41.0 births per 1,000 women. Women in the age bracket of 20 to 34 years have the highest fertility rate with 56.0 births per 1,000 women. Women in the age bracket of 20 to 34 years acount for 69.1% of all women with births.
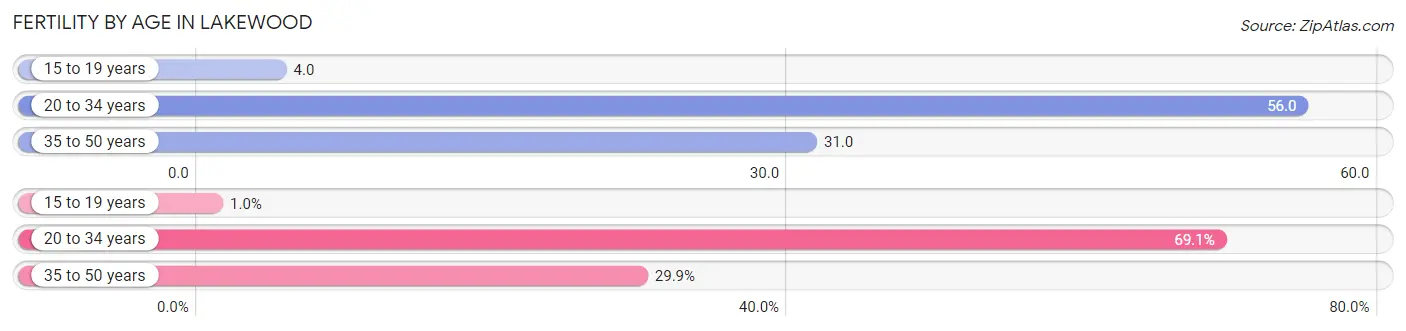
| Age Bracket | Women with Births | Births / 1,000 Women |
| 15 to 19 years | 16 (1.0%) | 4.0 |
| 20 to 34 years | 1,079 (69.1%) | 56.0 |
| 35 to 50 years | 466 (29.8%) | 31.0 |
| Total | 1,561 (100.0%) | 41.0 |
Fertility by Age by Marriage Status in Lakewood
85.9% of women with births (1,561) in Lakewood are married. The highest percentage of unmarried women with births falls into 15 to 19 years age bracket with 100.0% of them unmarried at the time of birth, while the lowest percentage of unmarried women with births belong to 35 to 50 years age bracket with 3.2% of them unmarried.
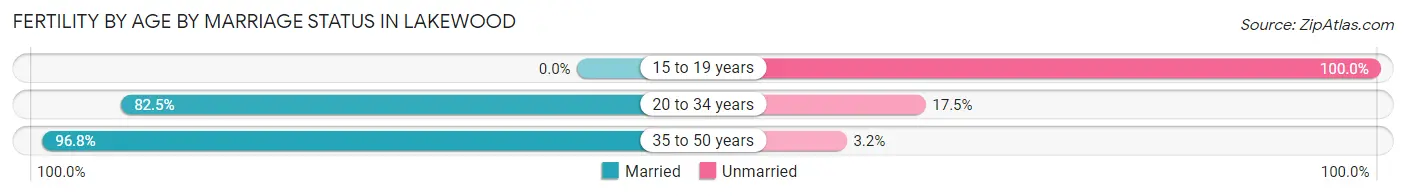
| Age Bracket | Married | Unmarried |
| 15 to 19 years | 0 (0.0%) | 16 (100.0%) |
| 20 to 34 years | 890 (82.5%) | 189 (17.5%) |
| 35 to 50 years | 451 (96.8%) | 15 (3.2%) |
| Total | 1,341 (85.9%) | 220 (14.1%) |
Fertility by Education in Lakewood
Average fertility rate in Lakewood is 41.0 births per 1,000 women. Women with the education attainment of graduate degree have the highest fertility rate of 61.0 births per 1,000 women, while women with the education attainment of less than high school have the lowest fertility at 22.0 births per 1,000 women. Women with the education attainment of bachelor's degree represent 32.5% of all women with births.
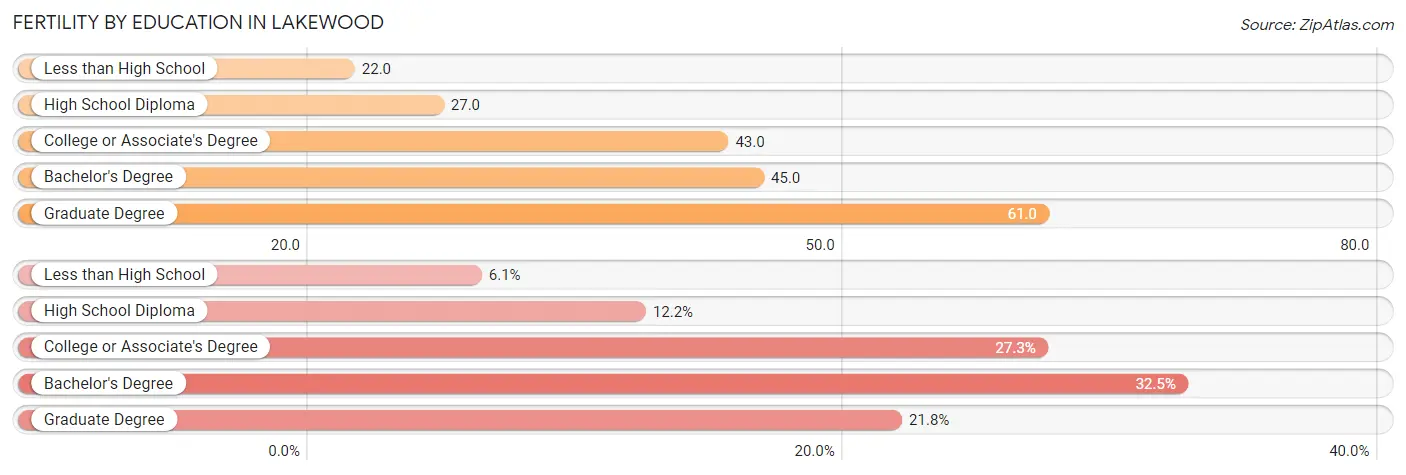
| Educational Attainment | Women with Births | Births / 1,000 Women |
| Less than High School | 95 (6.1%) | 22.0 |
| High School Diploma | 191 (12.2%) | 27.0 |
| College or Associate's Degree | 426 (27.3%) | 43.0 |
| Bachelor's Degree | 508 (32.5%) | 45.0 |
| Graduate Degree | 341 (21.8%) | 61.0 |
| Total | 1,561 (100.0%) | 41.0 |
Fertility by Education by Marriage Status in Lakewood
14.1% of women with births in Lakewood are unmarried. Women with the educational attainment of less than high school are most likely to be married with 100.0% of them married at childbirth, while women with the educational attainment of college or associate's degree are least likely to be married with 32.9% of them unmarried at childbirth.
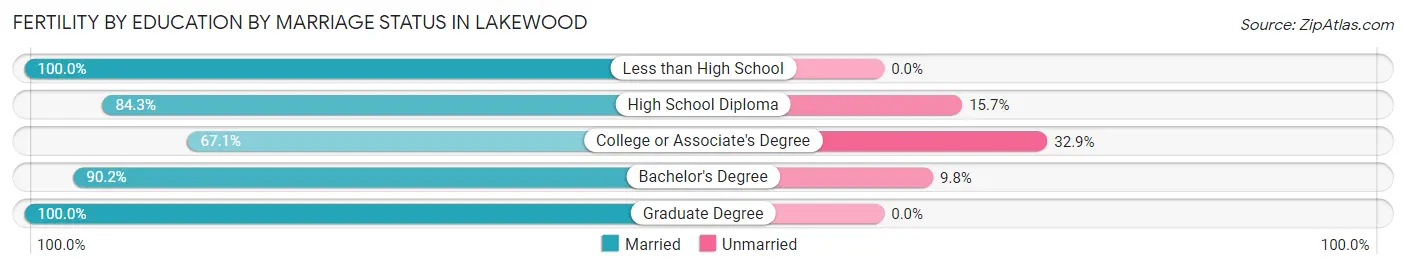
| Educational Attainment | Married | Unmarried |
| Less than High School | 95 (100.0%) | 0 (0.0%) |
| High School Diploma | 161 (84.3%) | 30 (15.7%) |
| College or Associate's Degree | 286 (67.1%) | 140 (32.9%) |
| Bachelor's Degree | 458 (90.2%) | 50 (9.8%) |
| Graduate Degree | 341 (100.0%) | 0 (0.0%) |
| Total | 1,341 (85.9%) | 220 (14.1%) |
Employment Characteristics in Lakewood
Employment by Class of Employer in Lakewood
Among the 85,732 employed individuals in Lakewood, private company employees (60,032 | 70.0%), not-for-profit organizations (5,839 | 6.8%), and local government employees (5,024 | 5.9%) make up the most common classes of employment.
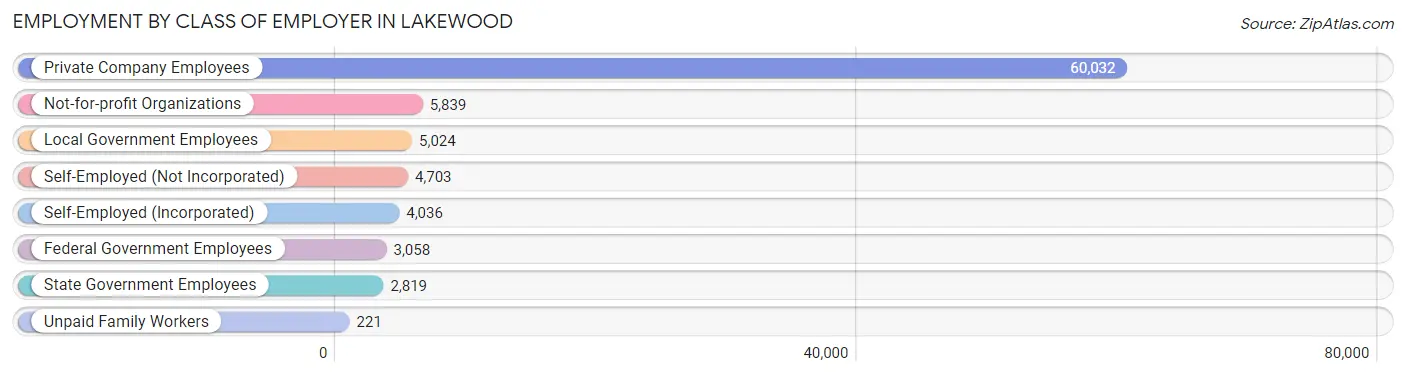
| Employer Class | # Employees | % Employees |
| Private Company Employees | 60,032 | 70.0% |
| Self-Employed (Incorporated) | 4,036 | 4.7% |
| Self-Employed (Not Incorporated) | 4,703 | 5.5% |
| Not-for-profit Organizations | 5,839 | 6.8% |
| Local Government Employees | 5,024 | 5.9% |
| State Government Employees | 2,819 | 3.3% |
| Federal Government Employees | 3,058 | 3.6% |
| Unpaid Family Workers | 221 | 0.3% |
| Total | 85,732 | 100.0% |
Employment Status by Age in Lakewood
According to the labor force statistics for Lakewood, out of the total population over 16 years of age (132,969), 68.5% or 91,084 individuals are in the labor force, with 4.4% or 4,008 of them unemployed. The age group with the highest labor force participation rate is 30 to 34 years, with 90.0% or 13,289 individuals in the labor force. Within the labor force, the 16 to 19 years age range has the highest percentage of unemployed individuals, with 12.4% or 330 of them being unemployed.
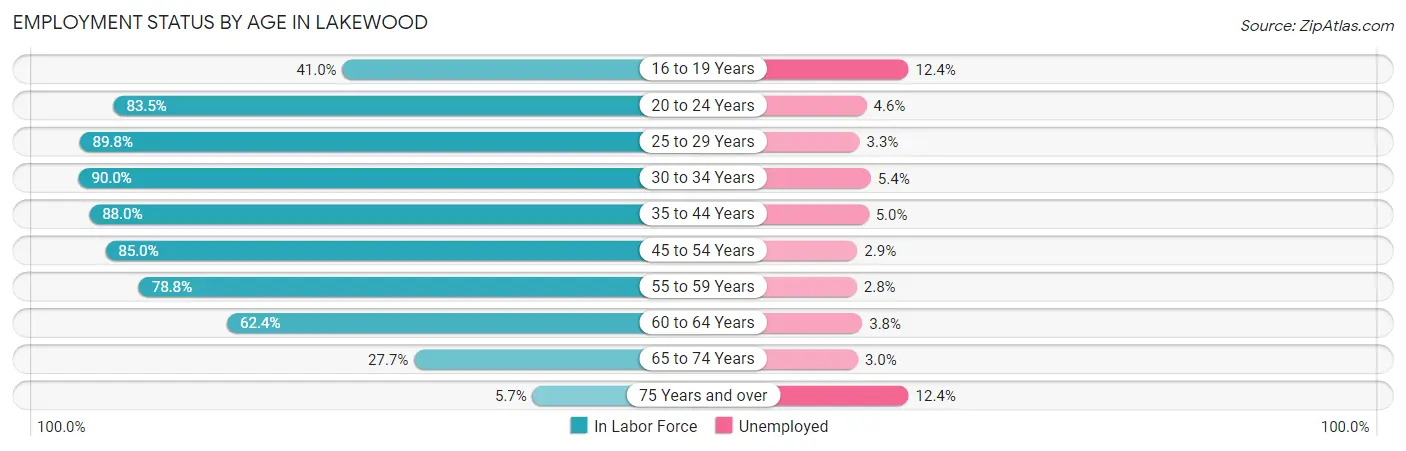
| Age Bracket | In Labor Force | Unemployed |
| 16 to 19 Years | 2,664 (41.0%) | 330 (12.4%) |
| 20 to 24 Years | 8,768 (83.5%) | 403 (4.6%) |
| 25 to 29 Years | 13,444 (89.8%) | 444 (3.3%) |
| 30 to 34 Years | 13,289 (90.0%) | 718 (5.4%) |
| 35 to 44 Years | 19,520 (88.0%) | 976 (5.0%) |
| 45 to 54 Years | 14,572 (85.0%) | 423 (2.9%) |
| 55 to 59 Years | 7,886 (78.8%) | 221 (2.8%) |
| 60 to 64 Years | 6,092 (62.4%) | 231 (3.8%) |
| 65 to 74 Years | 4,157 (27.7%) | 125 (3.0%) |
| 75 Years and over | 691 (5.7%) | 86 (12.4%) |
| Total | 91,084 (68.5%) | 4,008 (4.4%) |
Employment Status by Educational Attainment in Lakewood
According to labor force statistics for Lakewood, 84.2% of individuals (74,798) out of the total population between 25 and 64 years of age (88,834) are in the labor force, with 4.0% or 2,992 of them being unemployed. The group with the highest labor force participation rate are those with the educational attainment of bachelor's degree or higher, with 90.1% or 36,855 individuals in the labor force. Within the labor force, individuals with less than high school education have the highest percentage of unemployment, with 8.6% or 347 of them being unemployed.
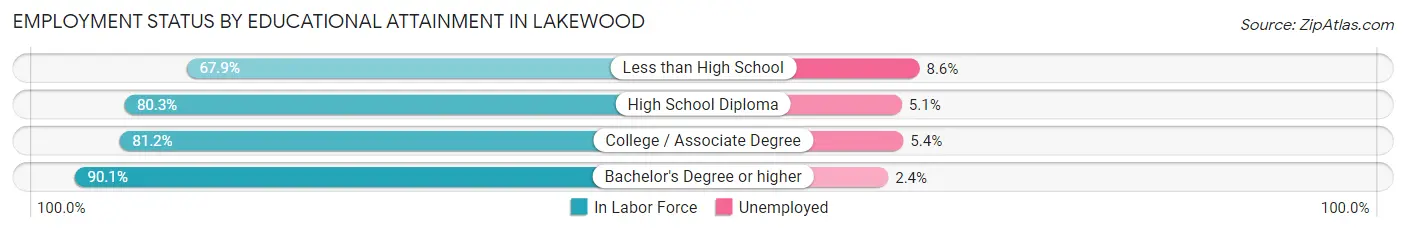
| Educational Attainment | In Labor Force | Unemployed |
| Less than High School | 4,037 (67.9%) | 511 (8.6%) |
| High School Diploma | 14,415 (80.3%) | 916 (5.1%) |
| College / Associate Degree | 19,515 (81.2%) | 1,298 (5.4%) |
| Bachelor's Degree or higher | 36,855 (90.1%) | 982 (2.4%) |
| Total | 74,798 (84.2%) | 3,553 (4.0%) |
Employment Occupations by Sex in Lakewood
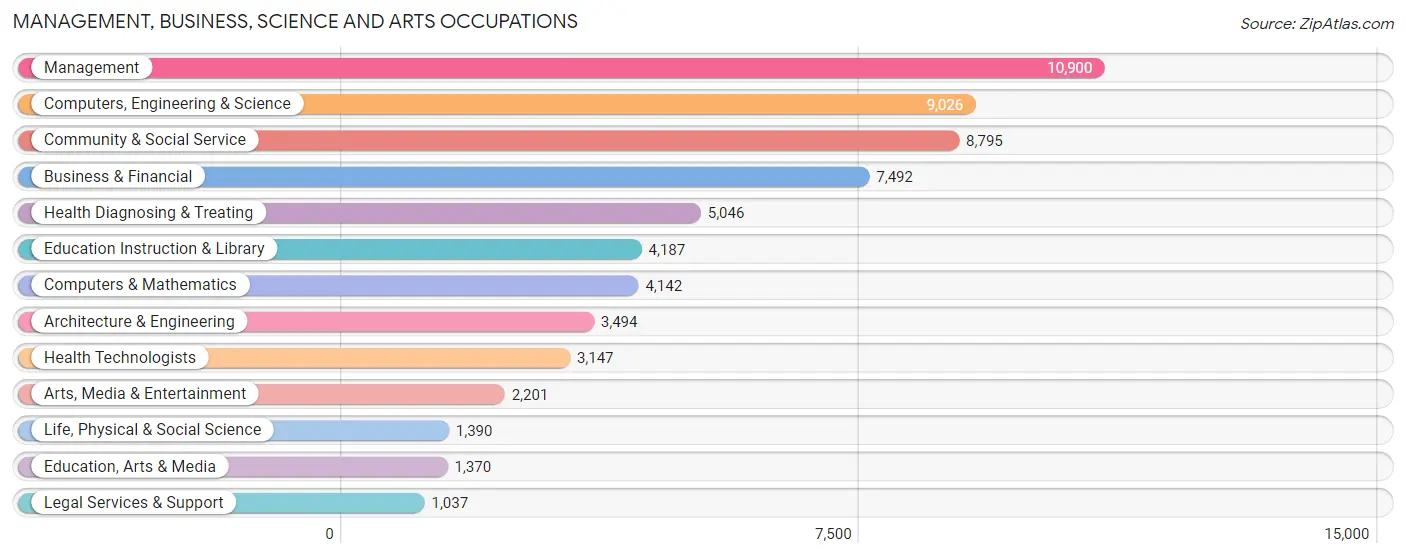
Management, Business, Science and Arts Occupations
The most common Management, Business, Science and Arts occupations in Lakewood are Management (10,900 | 12.5%), Computers, Engineering & Science (9,026 | 10.4%), Community & Social Service (8,795 | 10.1%), Business & Financial (7,492 | 8.6%), and Health Diagnosing & Treating (5,046 | 5.8%).
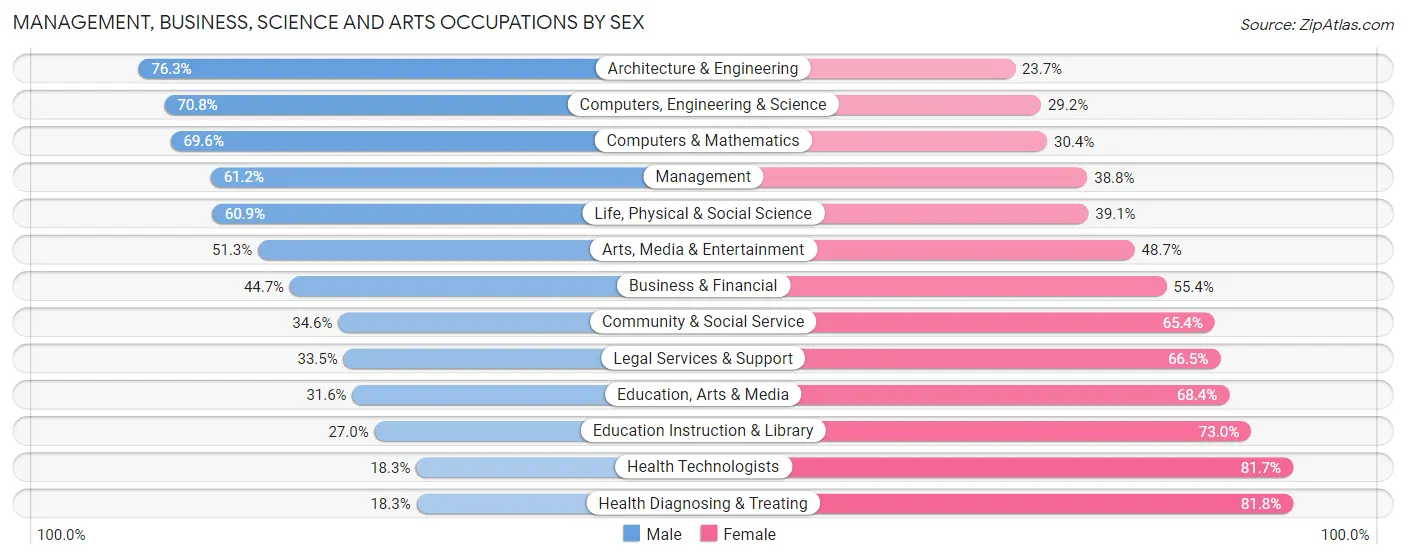
Management, Business, Science and Arts Occupations by Sex
Within the Management, Business, Science and Arts occupations in Lakewood, the most male-oriented occupations are Architecture & Engineering (76.3%), Computers, Engineering & Science (70.8%), and Computers & Mathematics (69.6%), while the most female-oriented occupations are Health Diagnosing & Treating (81.8%), Health Technologists (81.7%), and Education Instruction & Library (73.0%).
| Occupation | Male | Female |
| Management | 6,667 (61.2%) | 4,233 (38.8%) |
| Business & Financial | 3,345 (44.7%) | 4,147 (55.3%) |
| Computers, Engineering & Science | 6,393 (70.8%) | 2,633 (29.2%) |
| Computers & Mathematics | 2,881 (69.6%) | 1,261 (30.4%) |
| Architecture & Engineering | 2,665 (76.3%) | 829 (23.7%) |
| Life, Physical & Social Science | 847 (60.9%) | 543 (39.1%) |
| Community & Social Service | 3,040 (34.6%) | 5,755 (65.4%) |
| Education, Arts & Media | 433 (31.6%) | 937 (68.4%) |
| Legal Services & Support | 347 (33.5%) | 690 (66.5%) |
| Education Instruction & Library | 1,131 (27.0%) | 3,056 (73.0%) |
| Arts, Media & Entertainment | 1,129 (51.3%) | 1,072 (48.7%) |
| Health Diagnosing & Treating | 921 (18.2%) | 4,125 (81.8%) |
| Health Technologists | 576 (18.3%) | 2,571 (81.7%) |
| Total (Category) | 20,366 (49.4%) | 20,893 (50.6%) |
| Total (Overall) | 45,966 (52.8%) | 41,107 (47.2%) |
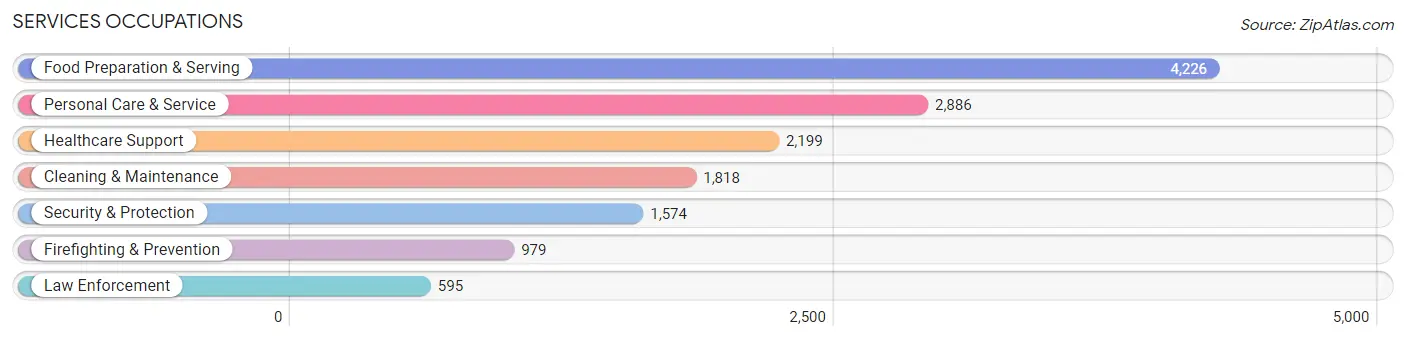
Services Occupations
The most common Services occupations in Lakewood are Food Preparation & Serving (4,226 | 4.9%), Personal Care & Service (2,886 | 3.3%), Healthcare Support (2,199 | 2.5%), Cleaning & Maintenance (1,818 | 2.1%), and Security & Protection (1,574 | 1.8%).
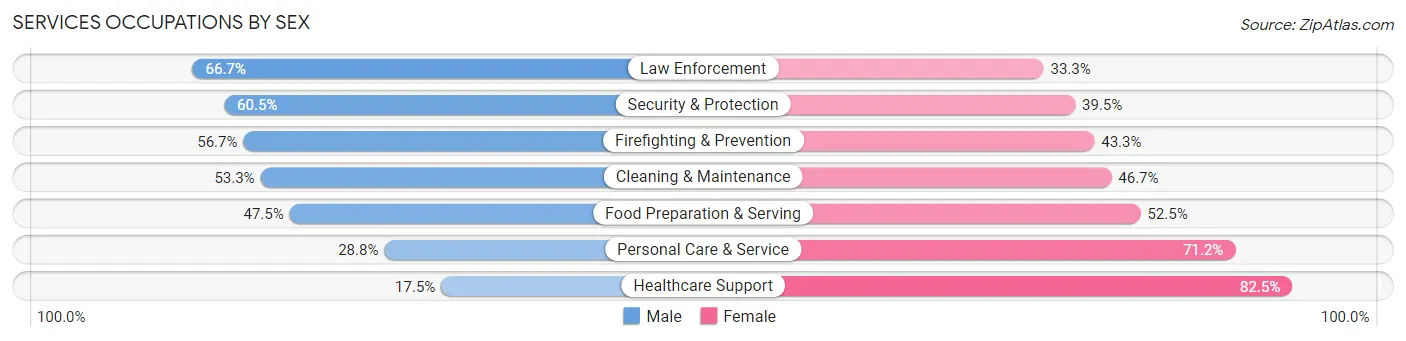
Services Occupations by Sex
Within the Services occupations in Lakewood, the most male-oriented occupations are Law Enforcement (66.7%), Security & Protection (60.5%), and Firefighting & Prevention (56.7%), while the most female-oriented occupations are Healthcare Support (82.5%), Personal Care & Service (71.2%), and Food Preparation & Serving (52.5%).
| Occupation | Male | Female |
| Healthcare Support | 385 (17.5%) | 1,814 (82.5%) |
| Security & Protection | 952 (60.5%) | 622 (39.5%) |
| Firefighting & Prevention | 555 (56.7%) | 424 (43.3%) |
| Law Enforcement | 397 (66.7%) | 198 (33.3%) |
| Food Preparation & Serving | 2,009 (47.5%) | 2,217 (52.5%) |
| Cleaning & Maintenance | 969 (53.3%) | 849 (46.7%) |
| Personal Care & Service | 831 (28.8%) | 2,055 (71.2%) |
| Total (Category) | 5,146 (40.5%) | 7,557 (59.5%) |
| Total (Overall) | 45,966 (52.8%) | 41,107 (47.2%) |
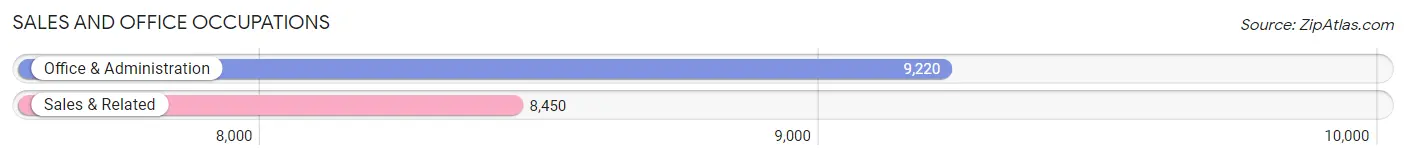
Sales and Office Occupations
The most common Sales and Office occupations in Lakewood are Office & Administration (9,220 | 10.6%), and Sales & Related (8,450 | 9.7%).
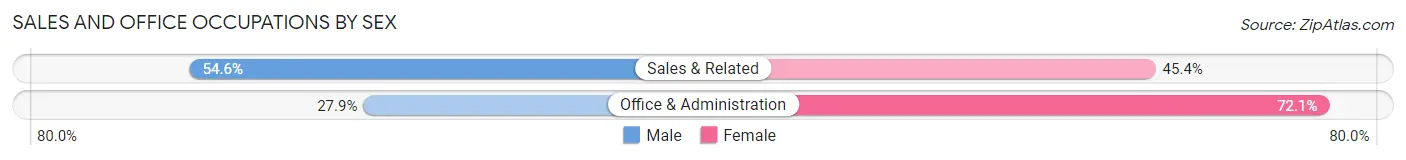
Sales and Office Occupations by Sex
| Occupation | Male | Female |
| Sales & Related | 4,614 (54.6%) | 3,836 (45.4%) |
| Office & Administration | 2,572 (27.9%) | 6,648 (72.1%) |
| Total (Category) | 7,186 (40.7%) | 10,484 (59.3%) |
| Total (Overall) | 45,966 (52.8%) | 41,107 (47.2%) |
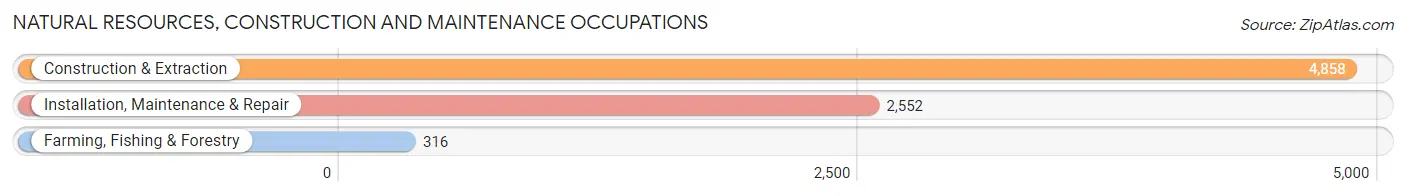
Natural Resources, Construction and Maintenance Occupations
The most common Natural Resources, Construction and Maintenance occupations in Lakewood are Construction & Extraction (4,858 | 5.6%), Installation, Maintenance & Repair (2,552 | 2.9%), and Farming, Fishing & Forestry (316 | 0.4%).
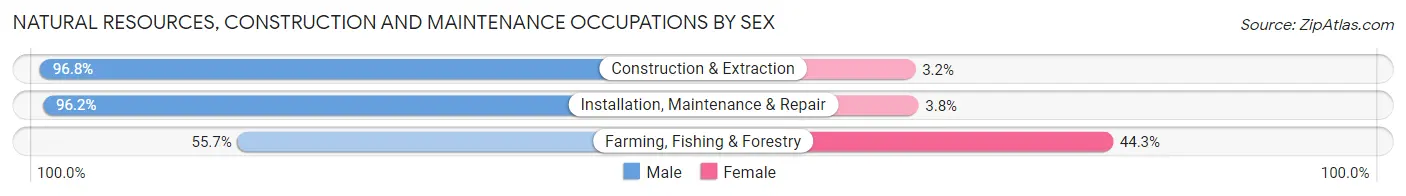
Natural Resources, Construction and Maintenance Occupations by Sex
| Occupation | Male | Female |
| Farming, Fishing & Forestry | 176 (55.7%) | 140 (44.3%) |
| Construction & Extraction | 4,703 (96.8%) | 155 (3.2%) |
| Installation, Maintenance & Repair | 2,454 (96.2%) | 98 (3.8%) |
| Total (Category) | 7,333 (94.9%) | 393 (5.1%) |
| Total (Overall) | 45,966 (52.8%) | 41,107 (47.2%) |
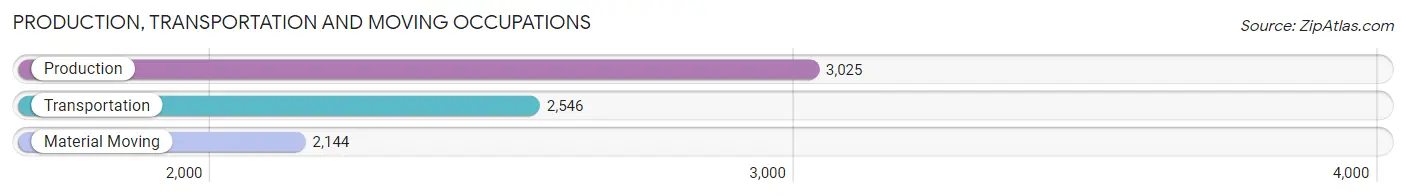
Production, Transportation and Moving Occupations
The most common Production, Transportation and Moving occupations in Lakewood are Production (3,025 | 3.5%), Transportation (2,546 | 2.9%), and Material Moving (2,144 | 2.5%).
Production, Transportation and Moving Occupations by Sex
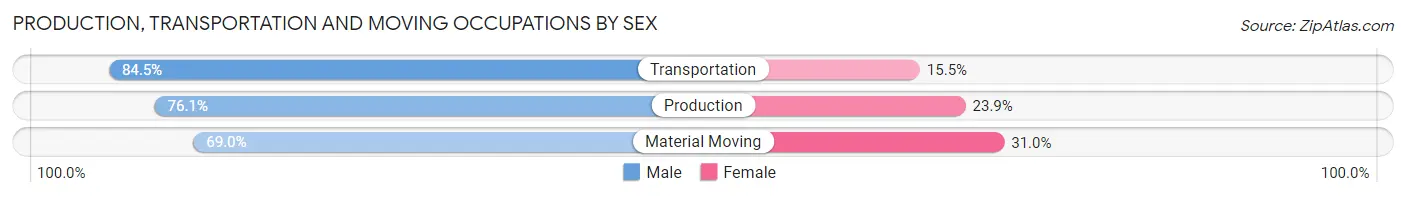
| Occupation | Male | Female |
| Production | 2,303 (76.1%) | 722 (23.9%) |
| Transportation | 2,152 (84.5%) | 394 (15.5%) |
| Material Moving | 1,480 (69.0%) | 664 (31.0%) |
| Total (Category) | 5,935 (76.9%) | 1,780 (23.1%) |
| Total (Overall) | 45,966 (52.8%) | 41,107 (47.2%) |
Employment Industries by Sex in Lakewood
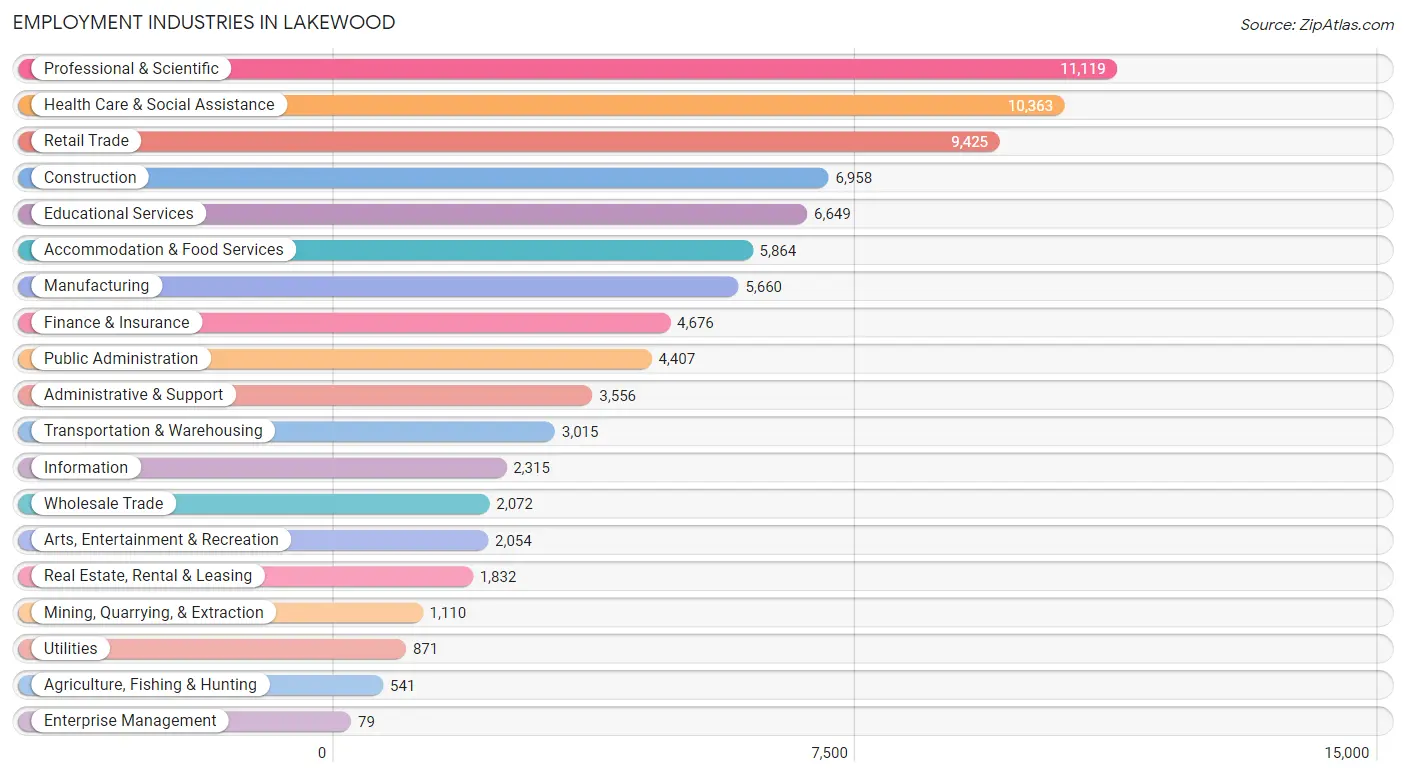
Employment Industries in Lakewood
The major employment industries in Lakewood include Professional & Scientific (11,119 | 12.8%), Health Care & Social Assistance (10,363 | 11.9%), Retail Trade (9,425 | 10.8%), Construction (6,958 | 8.0%), and Educational Services (6,649 | 7.6%).
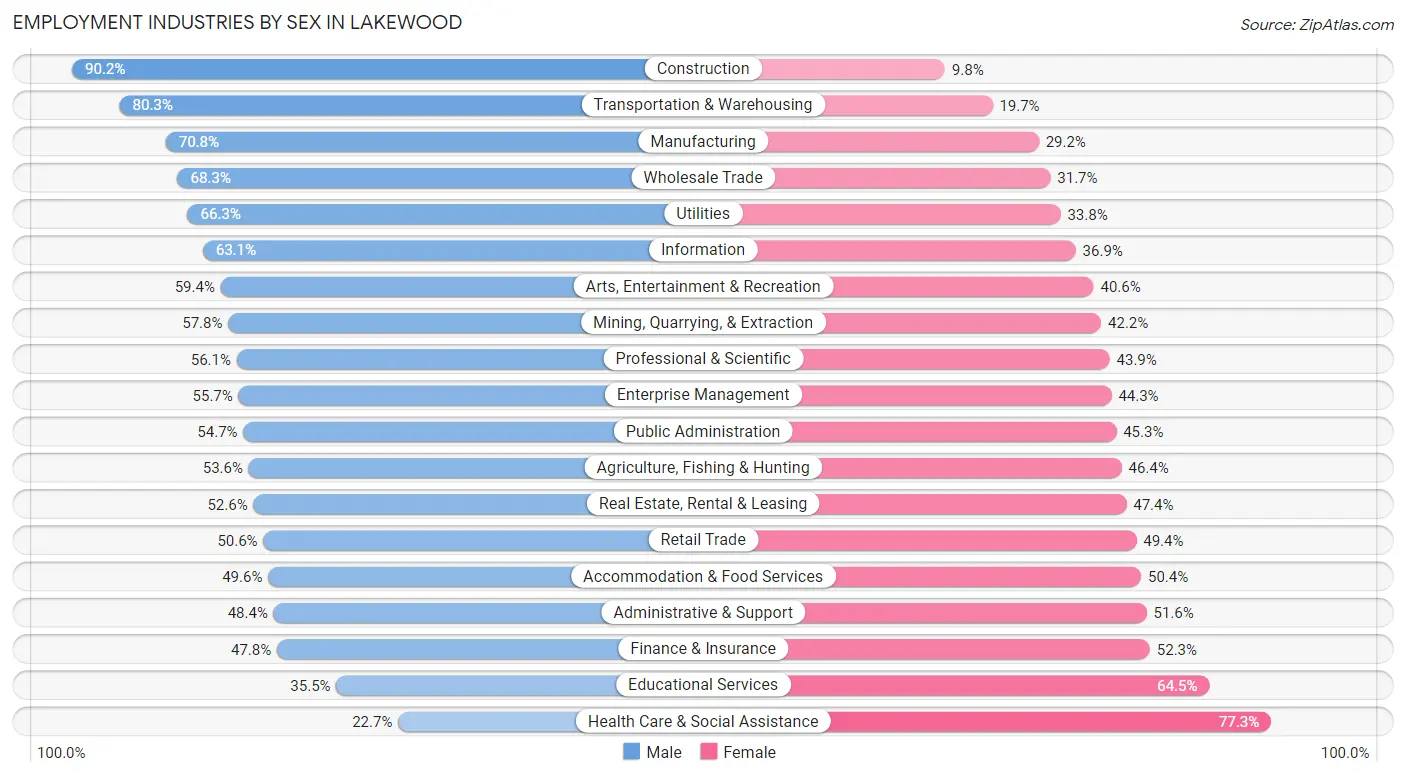
Employment Industries by Sex in Lakewood
The Lakewood industries that see more men than women are Construction (90.2%), Transportation & Warehousing (80.3%), and Manufacturing (70.8%), whereas the industries that tend to have a higher number of women are Health Care & Social Assistance (77.3%), Educational Services (64.5%), and Finance & Insurance (52.2%).
| Industry | Male | Female |
| Agriculture, Fishing & Hunting | 290 (53.6%) | 251 (46.4%) |
| Mining, Quarrying, & Extraction | 642 (57.8%) | 468 (42.2%) |
| Construction | 6,274 (90.2%) | 684 (9.8%) |
| Manufacturing | 4,005 (70.8%) | 1,655 (29.2%) |
| Wholesale Trade | 1,416 (68.3%) | 656 (31.7%) |
| Retail Trade | 4,765 (50.6%) | 4,660 (49.4%) |
| Transportation & Warehousing | 2,422 (80.3%) | 593 (19.7%) |
| Utilities | 577 (66.2%) | 294 (33.8%) |
| Information | 1,461 (63.1%) | 854 (36.9%) |
| Finance & Insurance | 2,233 (47.7%) | 2,443 (52.2%) |
| Real Estate, Rental & Leasing | 964 (52.6%) | 868 (47.4%) |
| Professional & Scientific | 6,235 (56.1%) | 4,884 (43.9%) |
| Enterprise Management | 44 (55.7%) | 35 (44.3%) |
| Administrative & Support | 1,722 (48.4%) | 1,834 (51.6%) |
| Educational Services | 2,358 (35.5%) | 4,291 (64.5%) |
| Health Care & Social Assistance | 2,348 (22.7%) | 8,015 (77.3%) |
| Arts, Entertainment & Recreation | 1,220 (59.4%) | 834 (40.6%) |
| Accommodation & Food Services | 2,907 (49.6%) | 2,957 (50.4%) |
| Public Administration | 2,411 (54.7%) | 1,996 (45.3%) |
| Total | 45,966 (52.8%) | 41,107 (47.2%) |
Education in Lakewood
School Enrollment in Lakewood
The most common levels of schooling among the 30,697 students in Lakewood are college / undergraduate (7,623 | 24.8%), high school (6,038 | 19.7%), and middle school (5,970 | 19.5%).
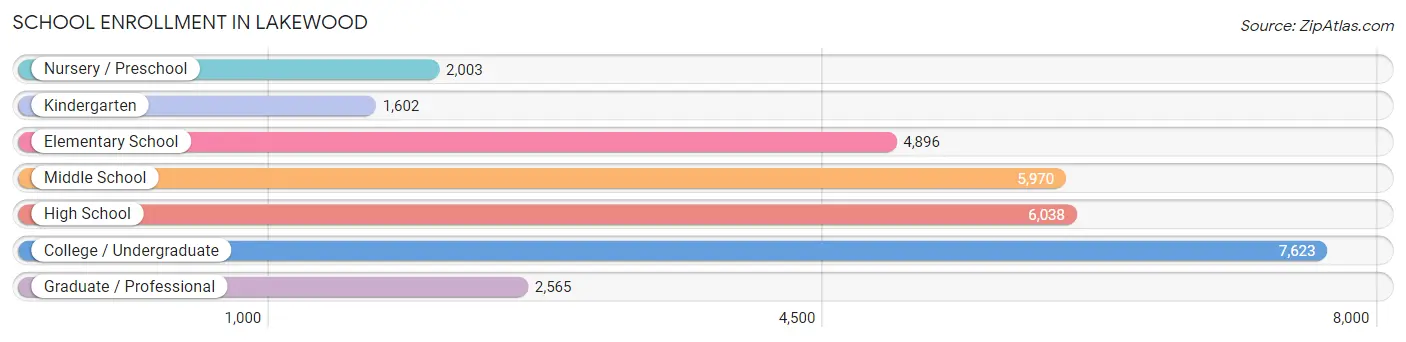
| School Level | # Students | % Students |
| Nursery / Preschool | 2,003 | 6.5% |
| Kindergarten | 1,602 | 5.2% |
| Elementary School | 4,896 | 16.0% |
| Middle School | 5,970 | 19.5% |
| High School | 6,038 | 19.7% |
| College / Undergraduate | 7,623 | 24.8% |
| Graduate / Professional | 2,565 | 8.4% |
| Total | 30,697 | 100.0% |
School Enrollment by Age by Funding Source in Lakewood
Out of a total of 30,697 students who are enrolled in schools in Lakewood, 4,359 (14.2%) attend a private institution, while the remaining 26,338 (85.8%) are enrolled in public schools. The age group of 3 to 4 year olds has the highest likelihood of being enrolled in private schools, with 682 (42.4% in the age bracket) enrolled. Conversely, the age group of 10 to 14 year olds has the lowest likelihood of being enrolled in a private school, with 6,536 (92.1% in the age bracket) attending a public institution.
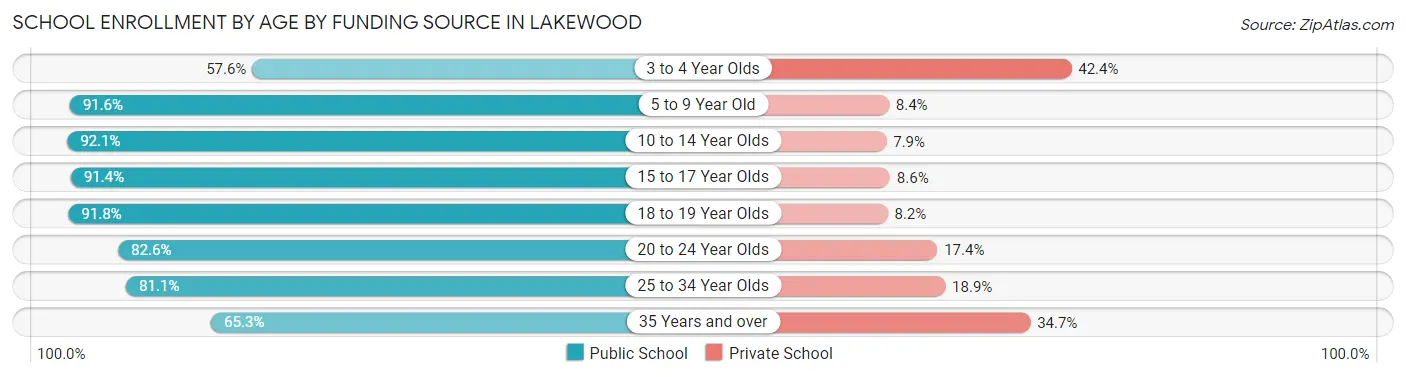
| Age Bracket | Public School | Private School |
| 3 to 4 Year Olds | 927 (57.6%) | 682 (42.4%) |
| 5 to 9 Year Old | 5,999 (91.6%) | 551 (8.4%) |
| 10 to 14 Year Olds | 6,536 (92.1%) | 564 (7.9%) |
| 15 to 17 Year Olds | 3,833 (91.4%) | 361 (8.6%) |
| 18 to 19 Year Olds | 1,809 (91.8%) | 161 (8.2%) |
| 20 to 24 Year Olds | 2,895 (82.6%) | 611 (17.4%) |
| 25 to 34 Year Olds | 2,990 (81.1%) | 697 (18.9%) |
| 35 Years and over | 1,358 (65.3%) | 723 (34.7%) |
| Total | 26,338 (85.8%) | 4,359 (14.2%) |
Educational Attainment by Field of Study in Lakewood
Business (10,944 | 19.3%), engineering (5,821 | 10.3%), education (4,613 | 8.1%), social sciences (4,601 | 8.1%), and science & technology (4,544 | 8.0%) are the most common fields of study among 56,656 individuals in Lakewood who have obtained a bachelor's degree or higher.
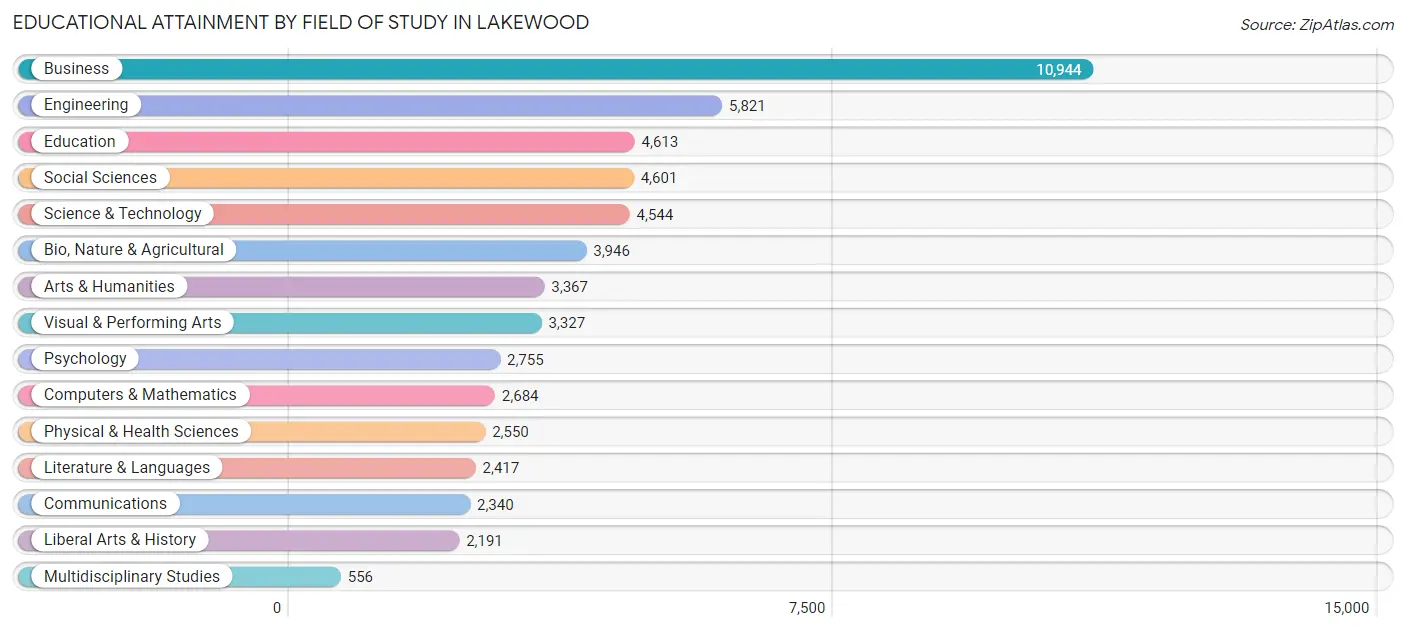
| Field of Study | # Graduates | % Graduates |
| Computers & Mathematics | 2,684 | 4.7% |
| Bio, Nature & Agricultural | 3,946 | 7.0% |
| Physical & Health Sciences | 2,550 | 4.5% |
| Psychology | 2,755 | 4.9% |
| Social Sciences | 4,601 | 8.1% |
| Engineering | 5,821 | 10.3% |
| Multidisciplinary Studies | 556 | 1.0% |
| Science & Technology | 4,544 | 8.0% |
| Business | 10,944 | 19.3% |
| Education | 4,613 | 8.1% |
| Literature & Languages | 2,417 | 4.3% |
| Liberal Arts & History | 2,191 | 3.9% |
| Visual & Performing Arts | 3,327 | 5.9% |
| Communications | 2,340 | 4.1% |
| Arts & Humanities | 3,367 | 5.9% |
| Total | 56,656 | 100.0% |
Transportation & Commute in Lakewood
Vehicle Availability by Sex in Lakewood
The most prevalent vehicle ownership categories in Lakewood are males with 2 vehicles (19,837, accounting for 43.9%) and females with 2 vehicles (17,357, making up 49.3%).
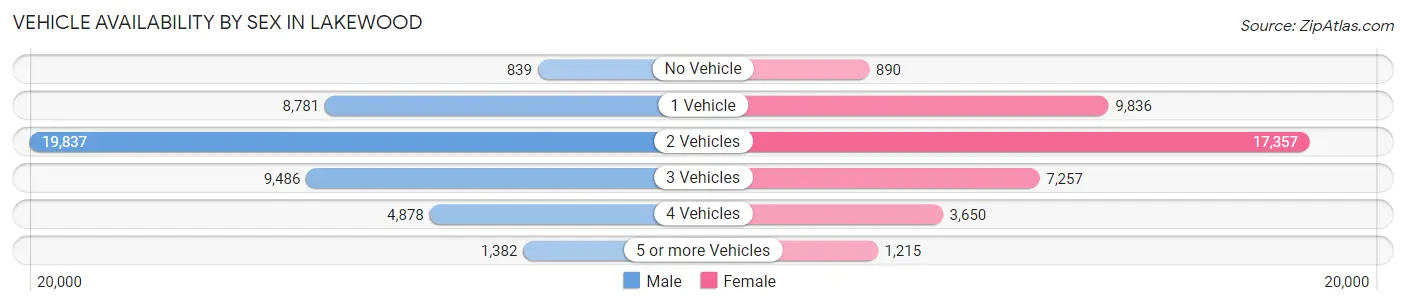
| Vehicles Available | Male | Female |
| No Vehicle | 839 (1.9%) | 890 (2.2%) |
| 1 Vehicle | 8,781 (19.4%) | 9,836 (24.5%) |
| 2 Vehicles | 19,837 (43.9%) | 17,357 (43.2%) |
| 3 Vehicles | 9,486 (21.0%) | 7,257 (18.0%) |
| 4 Vehicles | 4,878 (10.8%) | 3,650 (9.1%) |
| 5 or more Vehicles | 1,382 (3.1%) | 1,215 (3.0%) |
| Total | 45,203 (100.0%) | 40,205 (100.0%) |
Commute Time in Lakewood
The most frequently occuring commute durations in Lakewood are 30 to 34 minutes (13,226 commuters, 18.6%), 15 to 19 minutes (12,031 commuters, 16.9%), and 20 to 24 minutes (11,312 commuters, 15.9%).
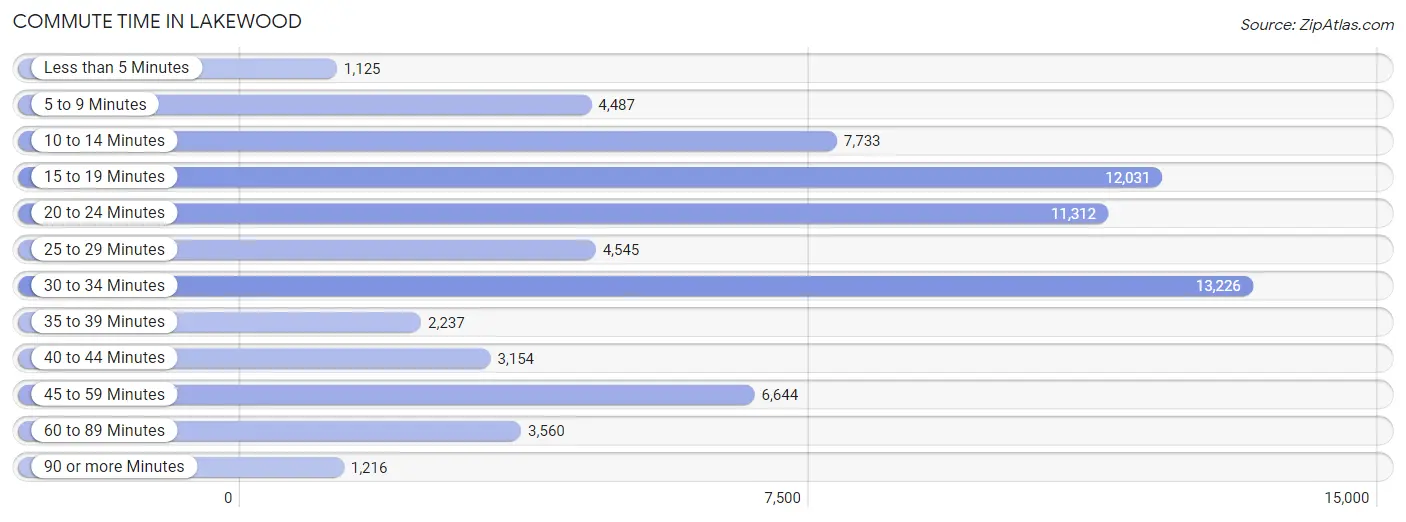
| Commute Time | # Commuters | % Commuters |
| Less than 5 Minutes | 1,125 | 1.6% |
| 5 to 9 Minutes | 4,487 | 6.3% |
| 10 to 14 Minutes | 7,733 | 10.8% |
| 15 to 19 Minutes | 12,031 | 16.9% |
| 20 to 24 Minutes | 11,312 | 15.9% |
| 25 to 29 Minutes | 4,545 | 6.4% |
| 30 to 34 Minutes | 13,226 | 18.6% |
| 35 to 39 Minutes | 2,237 | 3.1% |
| 40 to 44 Minutes | 3,154 | 4.4% |
| 45 to 59 Minutes | 6,644 | 9.3% |
| 60 to 89 Minutes | 3,560 | 5.0% |
| 90 or more Minutes | 1,216 | 1.7% |
Commute Time by Sex in Lakewood
The most common commute times in Lakewood are 30 to 34 minutes (7,310 commuters, 18.9%) for males and 15 to 19 minutes (6,136 commuters, 18.8%) for females.
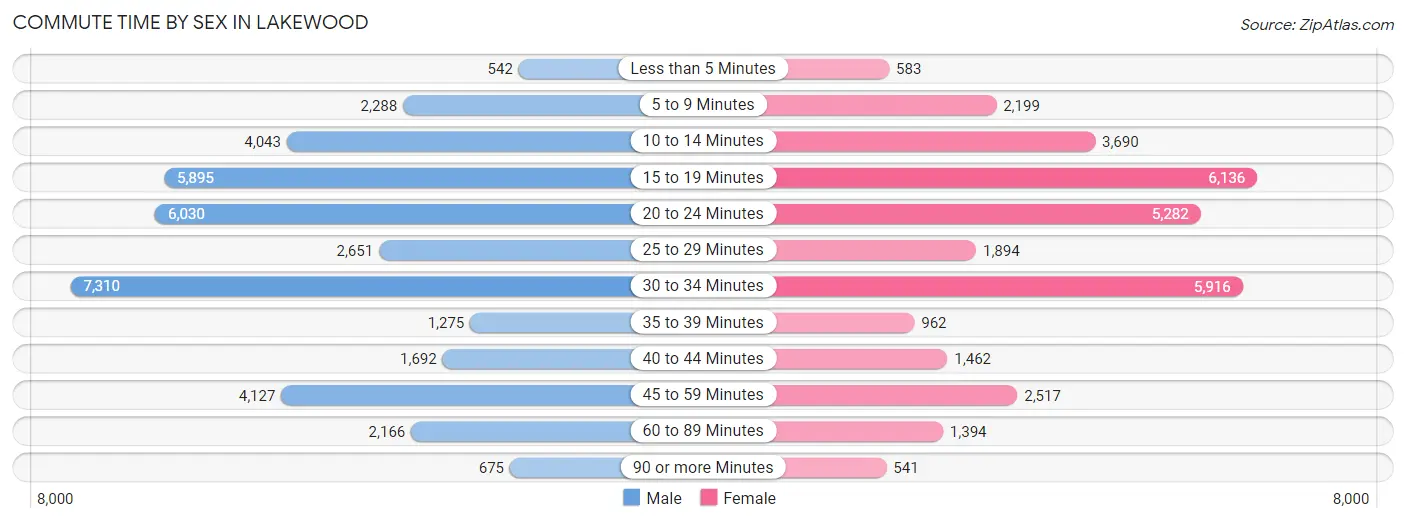
| Commute Time | Male | Female |
| Less than 5 Minutes | 542 (1.4%) | 583 (1.8%) |
| 5 to 9 Minutes | 2,288 (5.9%) | 2,199 (6.8%) |
| 10 to 14 Minutes | 4,043 (10.4%) | 3,690 (11.3%) |
| 15 to 19 Minutes | 5,895 (15.2%) | 6,136 (18.8%) |
| 20 to 24 Minutes | 6,030 (15.6%) | 5,282 (16.2%) |
| 25 to 29 Minutes | 2,651 (6.9%) | 1,894 (5.8%) |
| 30 to 34 Minutes | 7,310 (18.9%) | 5,916 (18.2%) |
| 35 to 39 Minutes | 1,275 (3.3%) | 962 (2.9%) |
| 40 to 44 Minutes | 1,692 (4.4%) | 1,462 (4.5%) |
| 45 to 59 Minutes | 4,127 (10.7%) | 2,517 (7.7%) |
| 60 to 89 Minutes | 2,166 (5.6%) | 1,394 (4.3%) |
| 90 or more Minutes | 675 (1.7%) | 541 (1.7%) |
Time of Departure to Work by Sex in Lakewood
The most frequent times of departure to work in Lakewood are 7:00 AM to 7:29 AM (5,112, 13.2%) for males and 7:00 AM to 7:29 AM (5,708, 17.5%) for females.
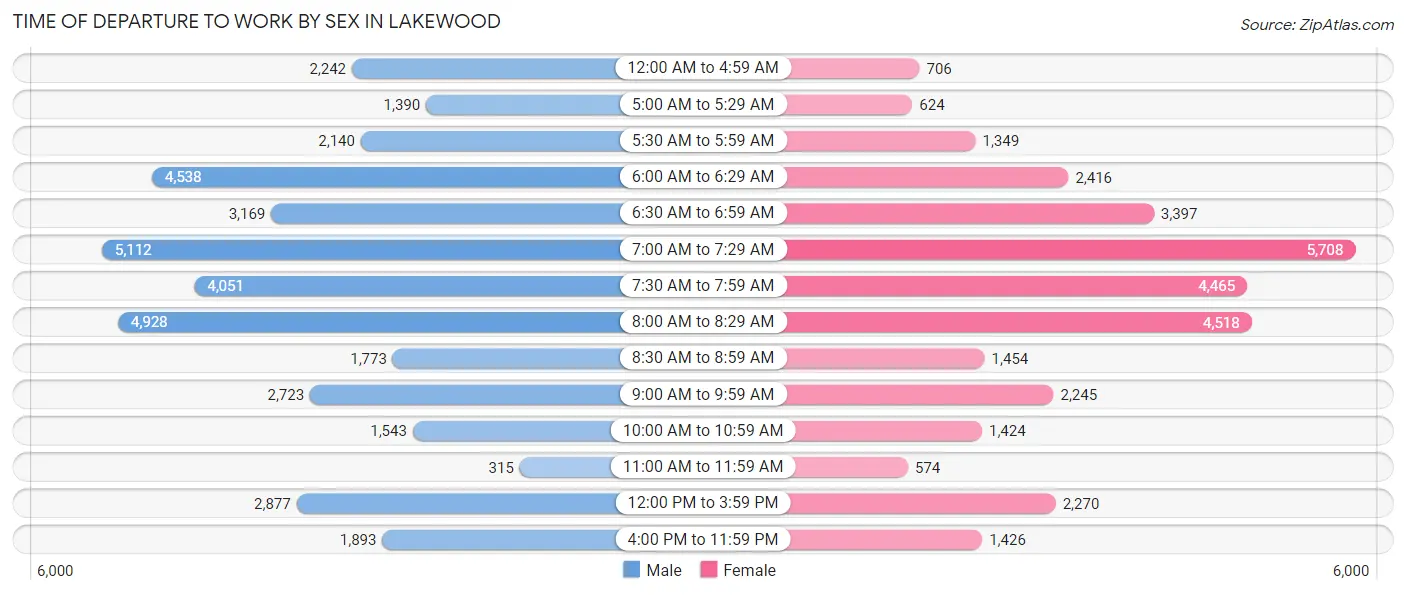
| Time of Departure | Male | Female |
| 12:00 AM to 4:59 AM | 2,242 (5.8%) | 706 (2.2%) |
| 5:00 AM to 5:29 AM | 1,390 (3.6%) | 624 (1.9%) |
| 5:30 AM to 5:59 AM | 2,140 (5.5%) | 1,349 (4.1%) |
| 6:00 AM to 6:29 AM | 4,538 (11.7%) | 2,416 (7.4%) |
| 6:30 AM to 6:59 AM | 3,169 (8.2%) | 3,397 (10.4%) |
| 7:00 AM to 7:29 AM | 5,112 (13.2%) | 5,708 (17.5%) |
| 7:30 AM to 7:59 AM | 4,051 (10.5%) | 4,465 (13.7%) |
| 8:00 AM to 8:29 AM | 4,928 (12.7%) | 4,518 (13.9%) |
| 8:30 AM to 8:59 AM | 1,773 (4.6%) | 1,454 (4.5%) |
| 9:00 AM to 9:59 AM | 2,723 (7.0%) | 2,245 (6.9%) |
| 10:00 AM to 10:59 AM | 1,543 (4.0%) | 1,424 (4.4%) |
| 11:00 AM to 11:59 AM | 315 (0.8%) | 574 (1.8%) |
| 12:00 PM to 3:59 PM | 2,877 (7.4%) | 2,270 (7.0%) |
| 4:00 PM to 11:59 PM | 1,893 (4.9%) | 1,426 (4.4%) |
| Total | 38,694 (100.0%) | 32,576 (100.0%) |
Housing Occupancy in Lakewood
Occupancy by Ownership in Lakewood
Of the total 68,111 dwellings in Lakewood, owner-occupied units account for 39,531 (58.0%), while renter-occupied units make up 28,580 (42.0%).
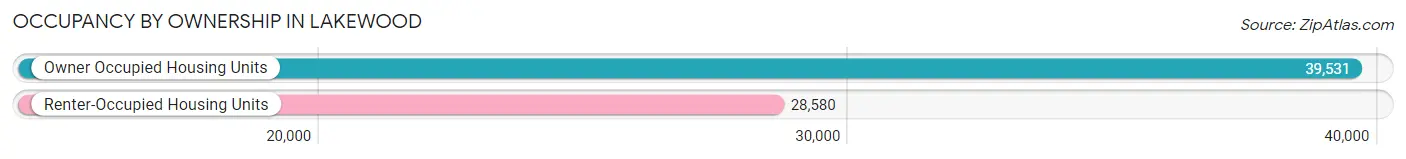
| Occupancy | # Housing Units | % Housing Units |
| Owner Occupied Housing Units | 39,531 | 58.0% |
| Renter-Occupied Housing Units | 28,580 | 42.0% |
| Total Occupied Housing Units | 68,111 | 100.0% |
Occupancy by Household Size in Lakewood
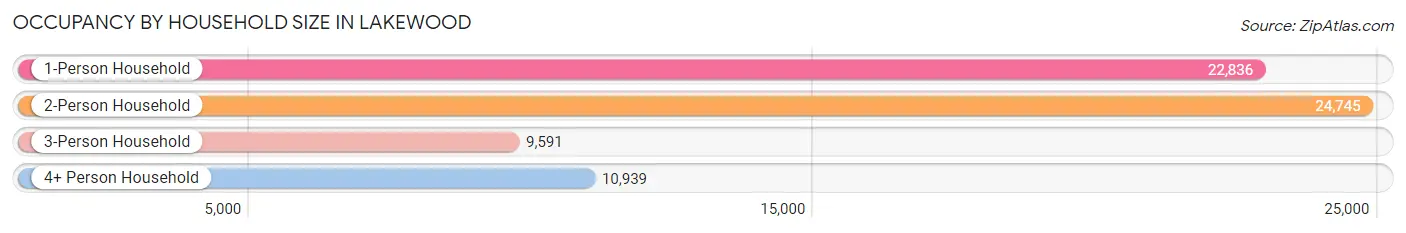
| Household Size | # Housing Units | % Housing Units |
| 1-Person Household | 22,836 | 33.5% |
| 2-Person Household | 24,745 | 36.3% |
| 3-Person Household | 9,591 | 14.1% |
| 4+ Person Household | 10,939 | 16.1% |
| Total Housing Units | 68,111 | 100.0% |
Occupancy by Ownership by Household Size in Lakewood
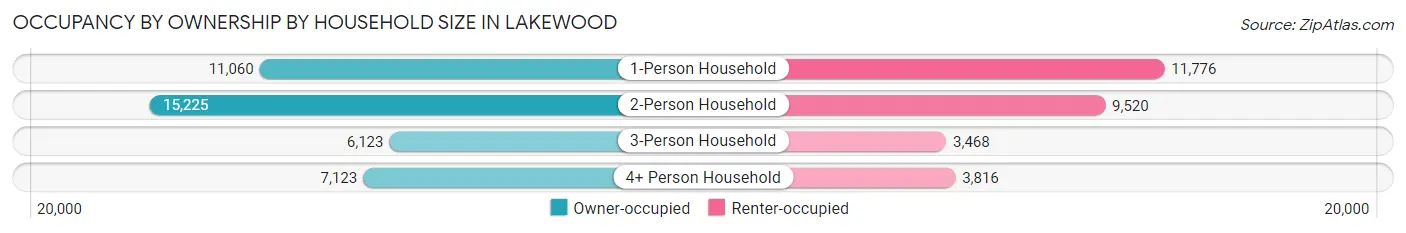
| Household Size | Owner-occupied | Renter-occupied |
| 1-Person Household | 11,060 (48.4%) | 11,776 (51.6%) |
| 2-Person Household | 15,225 (61.5%) | 9,520 (38.5%) |
| 3-Person Household | 6,123 (63.8%) | 3,468 (36.2%) |
| 4+ Person Household | 7,123 (65.1%) | 3,816 (34.9%) |
| Total Housing Units | 39,531 (58.0%) | 28,580 (42.0%) |
Occupancy by Educational Attainment in Lakewood
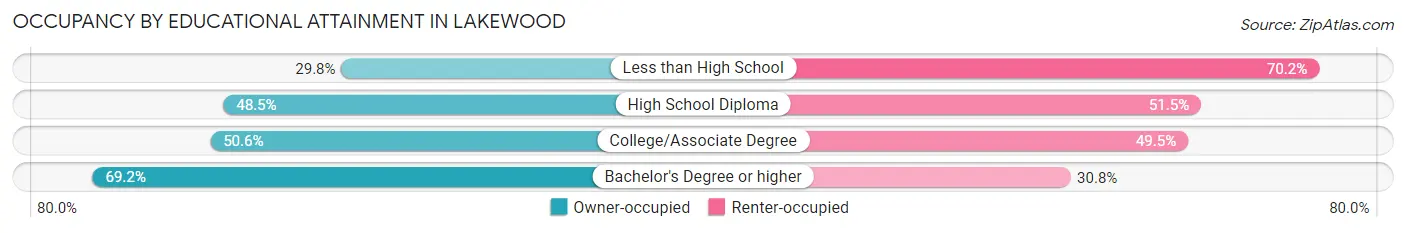
| Household Size | Owner-occupied | Renter-occupied |
| Less than High School | 1,094 (29.8%) | 2,582 (70.2%) |
| High School Diploma | 6,295 (48.5%) | 6,689 (51.5%) |
| College/Associate Degree | 9,410 (50.5%) | 9,204 (49.4%) |
| Bachelor's Degree or higher | 22,732 (69.2%) | 10,105 (30.8%) |
Occupancy by Age of Householder in Lakewood
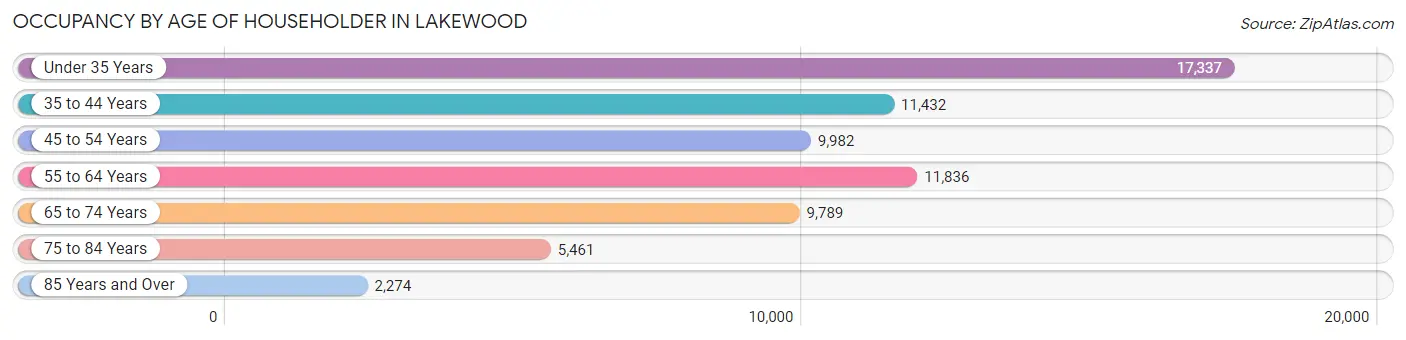
| Age Bracket | # Households | % Households |
| Under 35 Years | 17,337 | 25.5% |
| 35 to 44 Years | 11,432 | 16.8% |
| 45 to 54 Years | 9,982 | 14.7% |
| 55 to 64 Years | 11,836 | 17.4% |
| 65 to 74 Years | 9,789 | 14.4% |
| 75 to 84 Years | 5,461 | 8.0% |
| 85 Years and Over | 2,274 | 3.3% |
| Total | 68,111 | 100.0% |
Housing Finances in Lakewood
Median Income by Occupancy in Lakewood
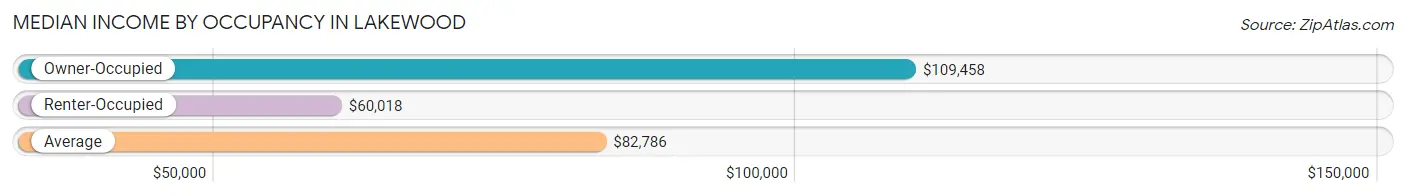
| Occupancy Type | # Households | Median Income |
| Owner-Occupied | 39,531 (58.0%) | $109,458 |
| Renter-Occupied | 28,580 (42.0%) | $60,018 |
| Average | 68,111 (100.0%) | $82,786 |
Occupancy by Householder Income Bracket in Lakewood
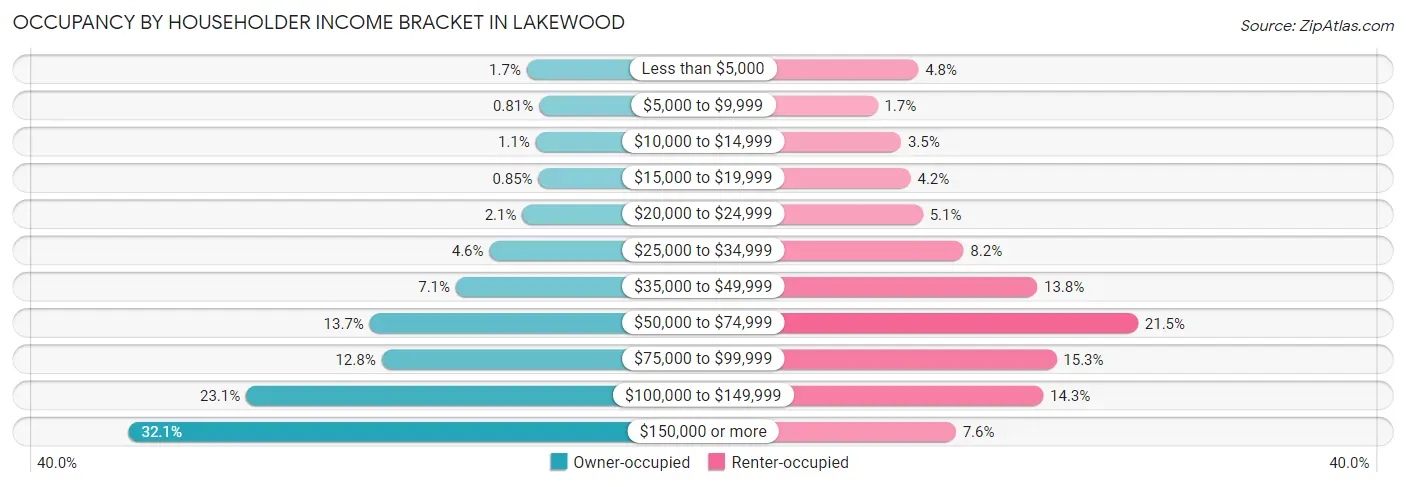
| Income Bracket | Owner-occupied | Renter-occupied |
| Less than $5,000 | 688 (1.7%) | 1,366 (4.8%) |
| $5,000 to $9,999 | 321 (0.8%) | 478 (1.7%) |
| $10,000 to $14,999 | 422 (1.1%) | 990 (3.5%) |
| $15,000 to $19,999 | 336 (0.9%) | 1,197 (4.2%) |
| $20,000 to $24,999 | 822 (2.1%) | 1,463 (5.1%) |
| $25,000 to $34,999 | 1,814 (4.6%) | 2,348 (8.2%) |
| $35,000 to $49,999 | 2,822 (7.1%) | 3,954 (13.8%) |
| $50,000 to $74,999 | 5,419 (13.7%) | 6,147 (21.5%) |
| $75,000 to $99,999 | 5,064 (12.8%) | 4,372 (15.3%) |
| $100,000 to $149,999 | 9,142 (23.1%) | 4,085 (14.3%) |
| $150,000 or more | 12,681 (32.1%) | 2,180 (7.6%) |
| Total | 39,531 (100.0%) | 28,580 (100.0%) |
Monthly Housing Cost Tiers in Lakewood
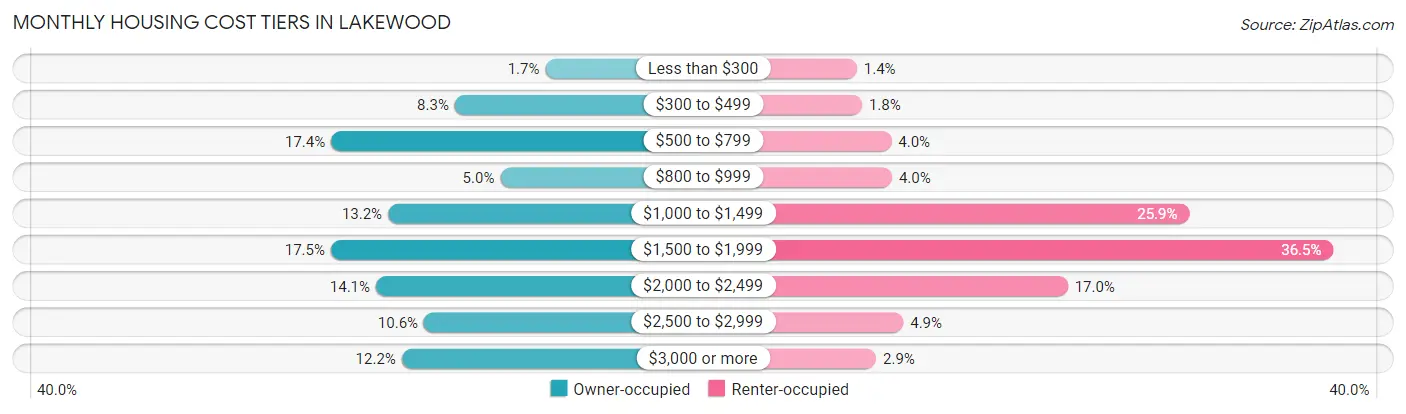
| Monthly Cost | Owner-occupied | Renter-occupied |
| Less than $300 | 651 (1.7%) | 408 (1.4%) |
| $300 to $499 | 3,288 (8.3%) | 516 (1.8%) |
| $500 to $799 | 6,891 (17.4%) | 1,136 (4.0%) |
| $800 to $999 | 1,964 (5.0%) | 1,149 (4.0%) |
| $1,000 to $1,499 | 5,235 (13.2%) | 7,404 (25.9%) |
| $1,500 to $1,999 | 6,897 (17.4%) | 10,437 (36.5%) |
| $2,000 to $2,499 | 5,585 (14.1%) | 4,848 (17.0%) |
| $2,500 to $2,999 | 4,186 (10.6%) | 1,386 (4.9%) |
| $3,000 or more | 4,834 (12.2%) | 814 (2.9%) |
| Total | 39,531 (100.0%) | 28,580 (100.0%) |
Physical Housing Characteristics in Lakewood
Housing Structures in Lakewood
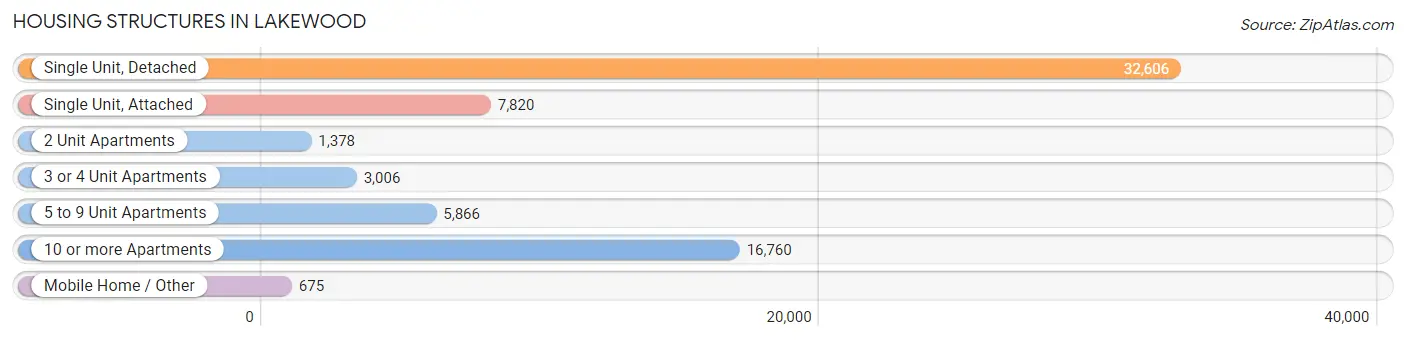
| Structure Type | # Housing Units | % Housing Units |
| Single Unit, Detached | 32,606 | 47.9% |
| Single Unit, Attached | 7,820 | 11.5% |
| 2 Unit Apartments | 1,378 | 2.0% |
| 3 or 4 Unit Apartments | 3,006 | 4.4% |
| 5 to 9 Unit Apartments | 5,866 | 8.6% |
| 10 or more Apartments | 16,760 | 24.6% |
| Mobile Home / Other | 675 | 1.0% |
| Total | 68,111 | 100.0% |
Housing Structures by Occupancy in Lakewood
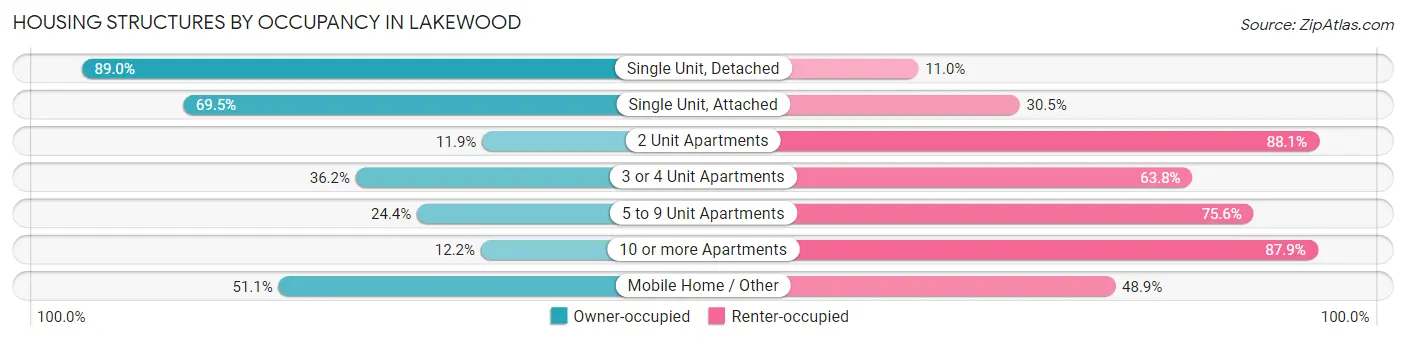
| Structure Type | Owner-occupied | Renter-occupied |
| Single Unit, Detached | 29,027 (89.0%) | 3,579 (11.0%) |
| Single Unit, Attached | 5,436 (69.5%) | 2,384 (30.5%) |
| 2 Unit Apartments | 164 (11.9%) | 1,214 (88.1%) |
| 3 or 4 Unit Apartments | 1,089 (36.2%) | 1,917 (63.8%) |
| 5 to 9 Unit Apartments | 1,433 (24.4%) | 4,433 (75.6%) |
| 10 or more Apartments | 2,037 (12.1%) | 14,723 (87.8%) |
| Mobile Home / Other | 345 (51.1%) | 330 (48.9%) |
| Total | 39,531 (58.0%) | 28,580 (42.0%) |
Housing Structures by Number of Rooms in Lakewood
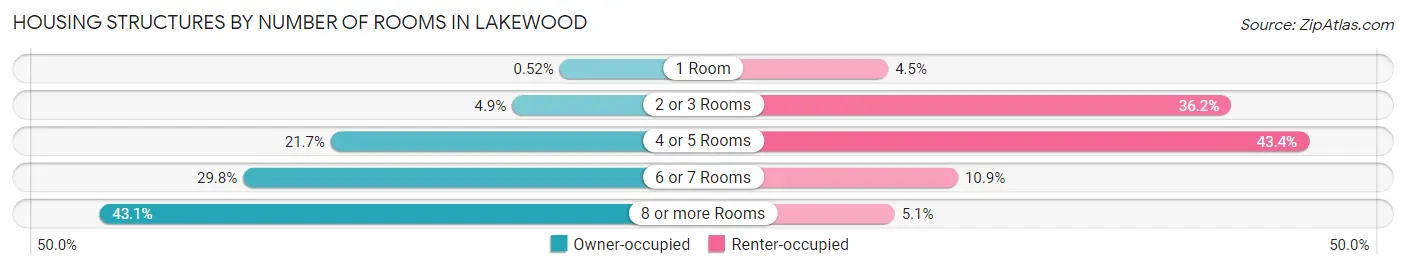
| Number of Rooms | Owner-occupied | Renter-occupied |
| 1 Room | 207 (0.5%) | 1,277 (4.5%) |
| 2 or 3 Rooms | 1,941 (4.9%) | 10,337 (36.2%) |
| 4 or 5 Rooms | 8,569 (21.7%) | 12,395 (43.4%) |
| 6 or 7 Rooms | 11,782 (29.8%) | 3,121 (10.9%) |
| 8 or more Rooms | 17,032 (43.1%) | 1,450 (5.1%) |
| Total | 39,531 (100.0%) | 28,580 (100.0%) |
Housing Structure by Heating Type in Lakewood
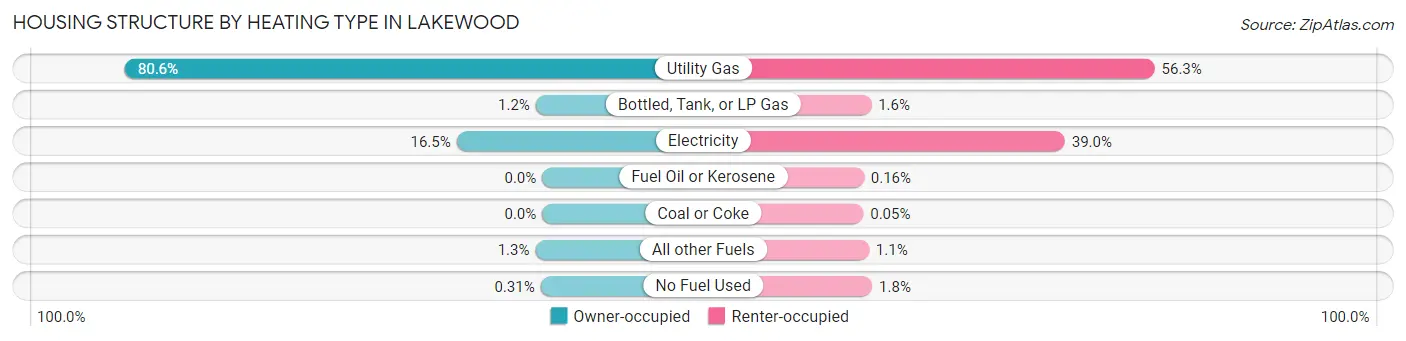
| Heating Type | Owner-occupied | Renter-occupied |
| Utility Gas | 31,869 (80.6%) | 16,102 (56.3%) |
| Bottled, Tank, or LP Gas | 489 (1.2%) | 452 (1.6%) |
| Electricity | 6,534 (16.5%) | 11,141 (39.0%) |
| Fuel Oil or Kerosene | 0 (0.0%) | 45 (0.2%) |
| Coal or Coke | 0 (0.0%) | 15 (0.1%) |
| All other Fuels | 516 (1.3%) | 322 (1.1%) |
| No Fuel Used | 123 (0.3%) | 503 (1.8%) |
| Total | 39,531 (100.0%) | 28,580 (100.0%) |
Household Vehicle Usage in Lakewood
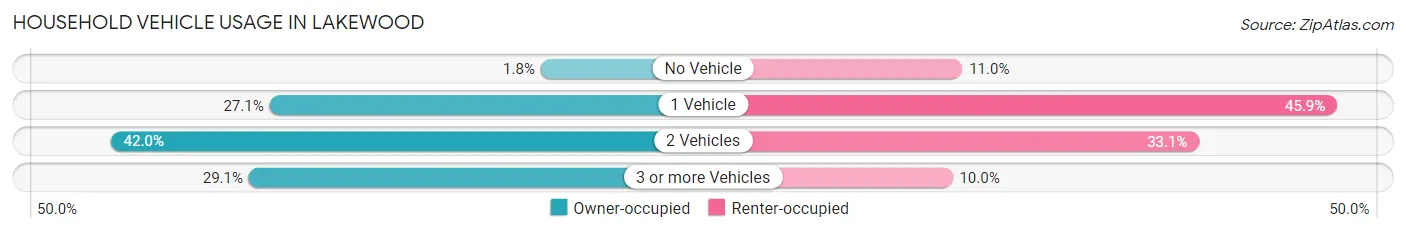
| Vehicles per Household | Owner-occupied | Renter-occupied |
| No Vehicle | 721 (1.8%) | 3,130 (11.0%) |
| 1 Vehicle | 10,728 (27.1%) | 13,131 (45.9%) |
| 2 Vehicles | 16,591 (42.0%) | 9,450 (33.1%) |
| 3 or more Vehicles | 11,491 (29.1%) | 2,869 (10.0%) |
| Total | 39,531 (100.0%) | 28,580 (100.0%) |
Real Estate & Mortgages in Lakewood
Real Estate and Mortgage Overview in Lakewood
| Characteristic | Without Mortgage | With Mortgage |
| Housing Units | 12,180 | 27,351 |
| Median Property Value | $480,700 | $500,900 |
| Median Household Income | $75,885 | $10,175 |
| Monthly Housing Costs | $588 | $4,784 |
| Real Estate Taxes | $2,369 | $468 |
Property Value by Mortgage Status in Lakewood
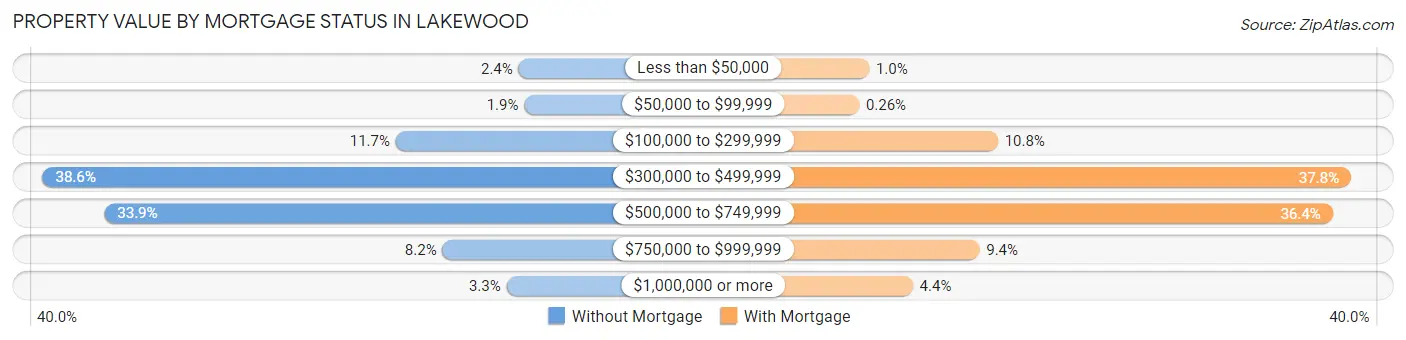
| Property Value | Without Mortgage | With Mortgage |
| Less than $50,000 | 287 (2.4%) | 280 (1.0%) |
| $50,000 to $99,999 | 235 (1.9%) | 71 (0.3%) |
| $100,000 to $299,999 | 1,428 (11.7%) | 2,962 (10.8%) |
| $300,000 to $499,999 | 4,705 (38.6%) | 10,326 (37.8%) |
| $500,000 to $749,999 | 4,132 (33.9%) | 9,943 (36.3%) |
| $750,000 to $999,999 | 994 (8.2%) | 2,578 (9.4%) |
| $1,000,000 or more | 399 (3.3%) | 1,191 (4.3%) |
| Total | 12,180 (100.0%) | 27,351 (100.0%) |
Household Income by Mortgage Status in Lakewood
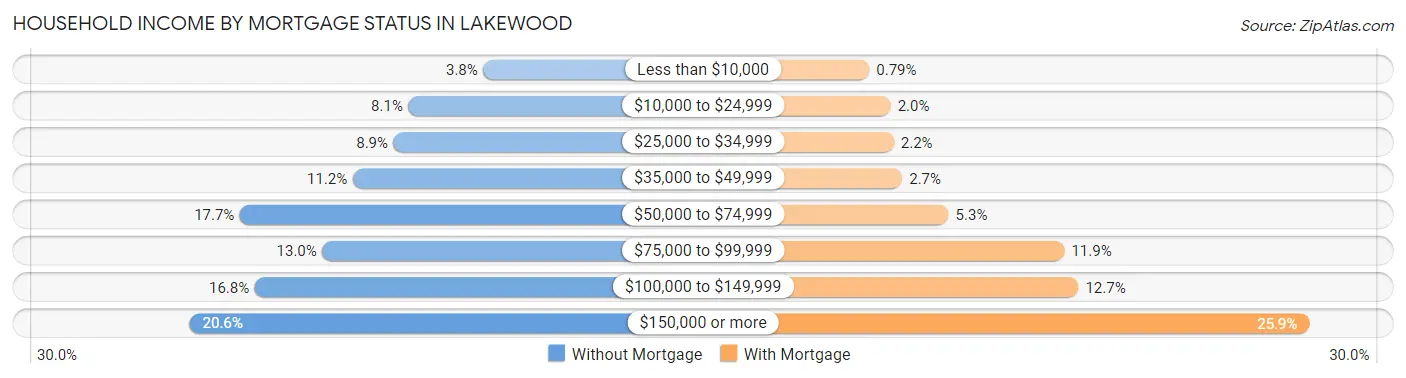
| Household Income | Without Mortgage | With Mortgage |
| Less than $10,000 | 459 (3.8%) | 216 (0.8%) |
| $10,000 to $24,999 | 980 (8.1%) | 550 (2.0%) |
| $25,000 to $34,999 | 1,084 (8.9%) | 600 (2.2%) |
| $35,000 to $49,999 | 1,368 (11.2%) | 730 (2.7%) |
| $50,000 to $74,999 | 2,153 (17.7%) | 1,454 (5.3%) |
| $75,000 to $99,999 | 1,580 (13.0%) | 3,266 (11.9%) |
| $100,000 to $149,999 | 2,050 (16.8%) | 3,484 (12.7%) |
| $150,000 or more | 2,506 (20.6%) | 7,092 (25.9%) |
| Total | 12,180 (100.0%) | 27,351 (100.0%) |
Property Value to Household Income Ratio in Lakewood
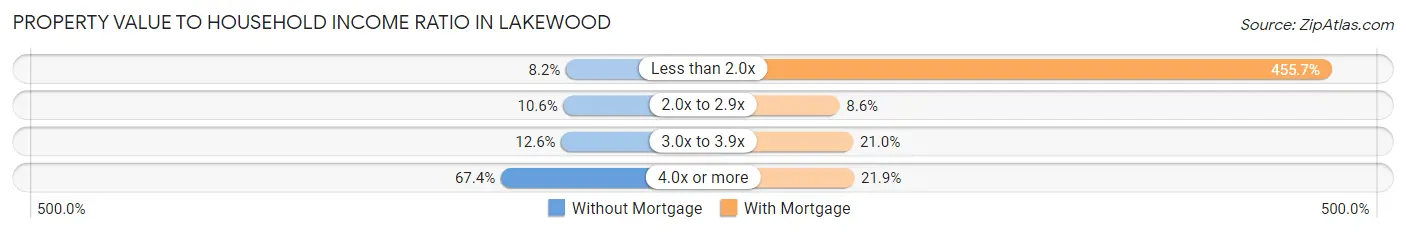
| Value-to-Income Ratio | Without Mortgage | With Mortgage |
| Less than 2.0x | 1,002 (8.2%) | 124,638 (455.7%) |
| 2.0x to 2.9x | 1,292 (10.6%) | 2,343 (8.6%) |
| 3.0x to 3.9x | 1,530 (12.6%) | 5,730 (20.9%) |
| 4.0x or more | 8,213 (67.4%) | 5,989 (21.9%) |
| Total | 12,180 (100.0%) | 27,351 (100.0%) |
Real Estate Taxes by Mortgage Status in Lakewood
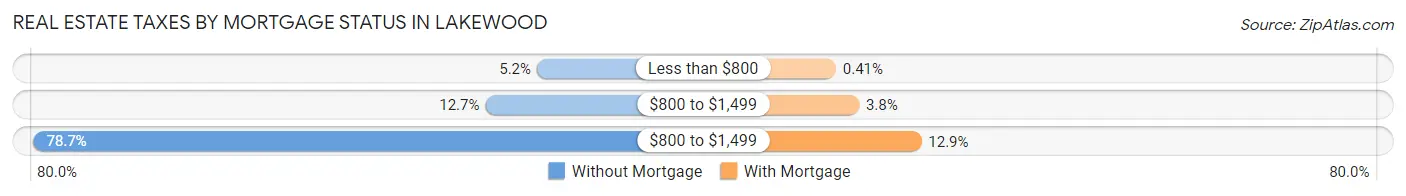
| Property Taxes | Without Mortgage | With Mortgage |
| Less than $800 | 627 (5.1%) | 111 (0.4%) |
| $800 to $1,499 | 1,544 (12.7%) | 1,037 (3.8%) |
| $800 to $1,499 | 9,586 (78.7%) | 3,529 (12.9%) |
| Total | 12,180 (100.0%) | 27,351 (100.0%) |
Health & Disability in Lakewood
Health Insurance Coverage by Age in Lakewood
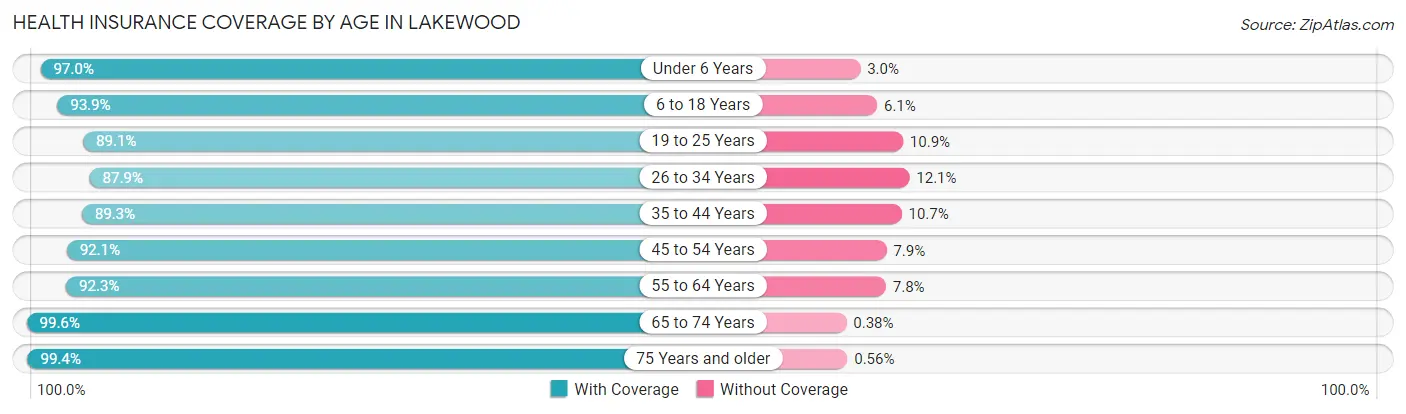
| Age Bracket | With Coverage | Without Coverage |
| Under 6 Years | 8,988 (97.0%) | 275 (3.0%) |
| 6 to 18 Years | 17,165 (93.9%) | 1,117 (6.1%) |
| 19 to 25 Years | 13,354 (89.1%) | 1,638 (10.9%) |
| 26 to 34 Years | 23,932 (87.9%) | 3,304 (12.1%) |
| 35 to 44 Years | 19,723 (89.3%) | 2,356 (10.7%) |
| 45 to 54 Years | 15,687 (92.1%) | 1,339 (7.9%) |
| 55 to 64 Years | 18,022 (92.2%) | 1,514 (7.7%) |
| 65 to 74 Years | 14,614 (99.6%) | 56 (0.4%) |
| 75 Years and older | 11,484 (99.4%) | 65 (0.6%) |
| Total | 142,969 (92.5%) | 11,664 (7.5%) |
Health Insurance Coverage by Citizenship Status in Lakewood
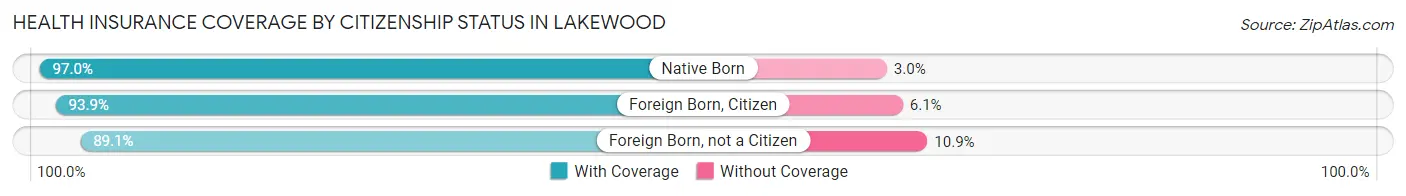
| Citizenship Status | With Coverage | Without Coverage |
| Native Born | 8,988 (97.0%) | 275 (3.0%) |
| Foreign Born, Citizen | 17,165 (93.9%) | 1,117 (6.1%) |
| Foreign Born, not a Citizen | 13,354 (89.1%) | 1,638 (10.9%) |
Health Insurance Coverage by Household Income in Lakewood
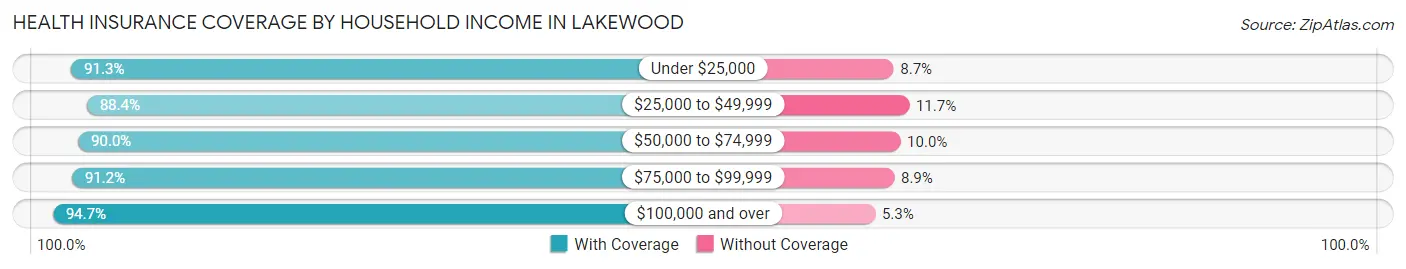
| Household Income | With Coverage | Without Coverage |
| Under $25,000 | 11,530 (91.3%) | 1,102 (8.7%) |
| $25,000 to $49,999 | 16,821 (88.3%) | 2,217 (11.7%) |
| $50,000 to $74,999 | 20,699 (90.0%) | 2,301 (10.0%) |
| $75,000 to $99,999 | 20,221 (91.1%) | 1,963 (8.8%) |
| $100,000 and over | 72,832 (94.7%) | 4,056 (5.3%) |
Public vs Private Health Insurance Coverage by Age in Lakewood
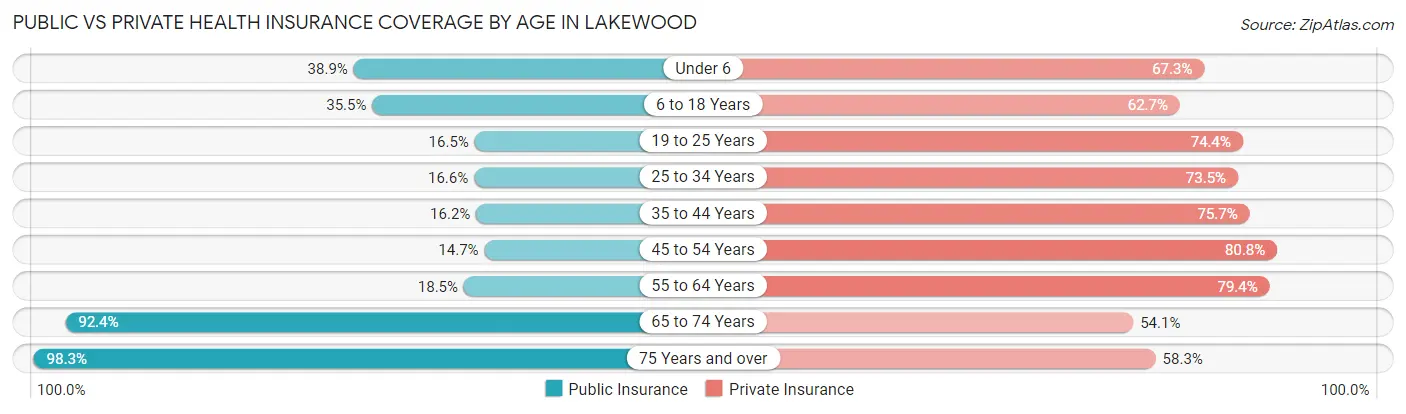
| Age Bracket | Public Insurance | Private Insurance |
| Under 6 | 3,605 (38.9%) | 6,231 (67.3%) |
| 6 to 18 Years | 6,483 (35.5%) | 11,468 (62.7%) |
| 19 to 25 Years | 2,467 (16.5%) | 11,158 (74.4%) |
| 25 to 34 Years | 4,517 (16.6%) | 20,025 (73.5%) |
| 35 to 44 Years | 3,572 (16.2%) | 16,709 (75.7%) |
| 45 to 54 Years | 2,494 (14.6%) | 13,757 (80.8%) |
| 55 to 64 Years | 3,609 (18.5%) | 15,510 (79.4%) |
| 65 to 74 Years | 13,561 (92.4%) | 7,936 (54.1%) |
| 75 Years and over | 11,354 (98.3%) | 6,728 (58.3%) |
| Total | 51,662 (33.4%) | 109,522 (70.8%) |
Disability Status by Sex by Age in Lakewood
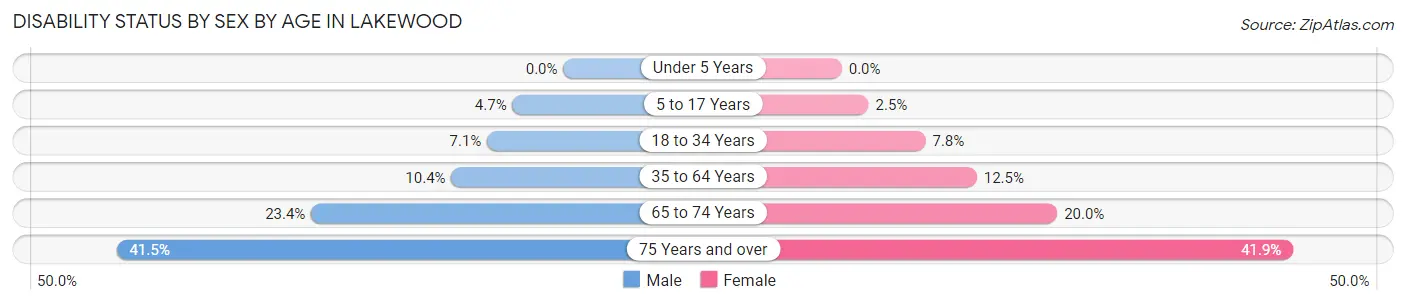
| Age Bracket | Male | Female |
| Under 5 Years | 0 (0.0%) | 0 (0.0%) |
| 5 to 17 Years | 447 (4.7%) | 222 (2.5%) |
| 18 to 34 Years | 1,602 (7.1%) | 1,631 (7.8%) |
| 35 to 64 Years | 3,049 (10.4%) | 3,672 (12.5%) |
| 65 to 74 Years | 1,570 (23.4%) | 1,591 (20.0%) |
| 75 Years and over | 1,984 (41.5%) | 2,834 (41.9%) |
Disability Class by Sex by Age in Lakewood
Disability Class: Hearing Difficulty
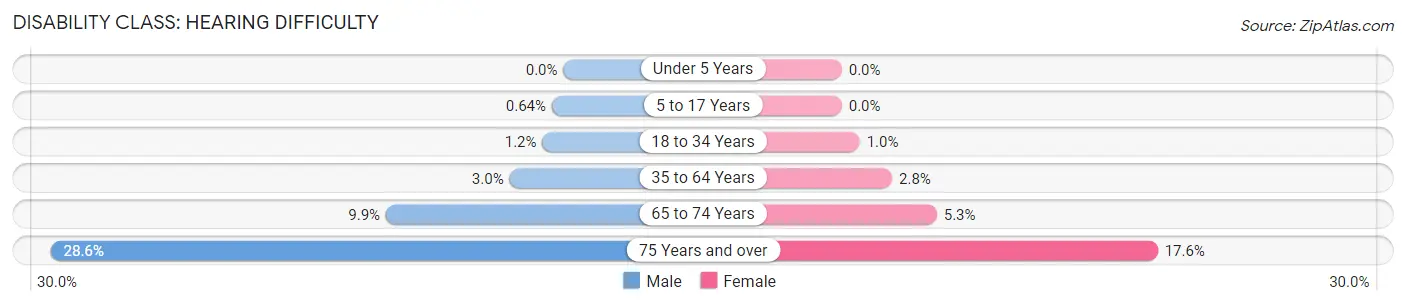
| Age Bracket | Male | Female |
| Under 5 Years | 0 (0.0%) | 0 (0.0%) |
| 5 to 17 Years | 61 (0.6%) | 0 (0.0%) |
| 18 to 34 Years | 266 (1.2%) | 210 (1.0%) |
| 35 to 64 Years | 881 (3.0%) | 819 (2.8%) |
| 65 to 74 Years | 663 (9.9%) | 421 (5.3%) |
| 75 Years and over | 1,366 (28.5%) | 1,190 (17.6%) |
Disability Class: Vision Difficulty
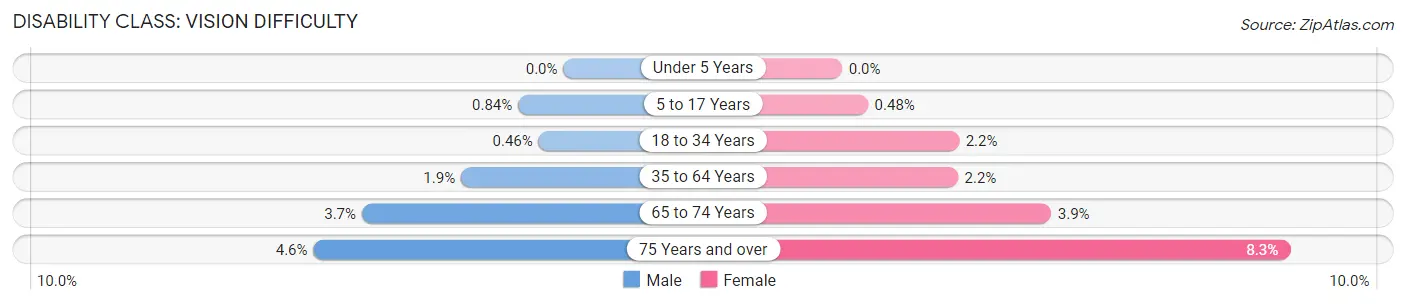
| Age Bracket | Male | Female |
| Under 5 Years | 0 (0.0%) | 0 (0.0%) |
| 5 to 17 Years | 79 (0.8%) | 43 (0.5%) |
| 18 to 34 Years | 105 (0.5%) | 455 (2.2%) |
| 35 to 64 Years | 557 (1.9%) | 631 (2.1%) |
| 65 to 74 Years | 251 (3.7%) | 309 (3.9%) |
| 75 Years and over | 222 (4.6%) | 563 (8.3%) |
Disability Class: Cognitive Difficulty
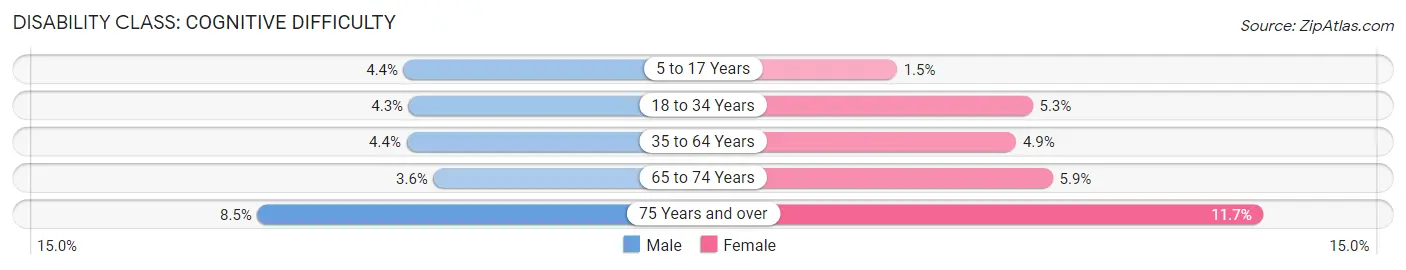
| Age Bracket | Male | Female |
| 5 to 17 Years | 420 (4.4%) | 136 (1.5%) |
| 18 to 34 Years | 975 (4.3%) | 1,114 (5.3%) |
| 35 to 64 Years | 1,279 (4.4%) | 1,420 (4.9%) |
| 65 to 74 Years | 242 (3.6%) | 467 (5.9%) |
| 75 Years and over | 407 (8.5%) | 794 (11.7%) |
Disability Class: Ambulatory Difficulty
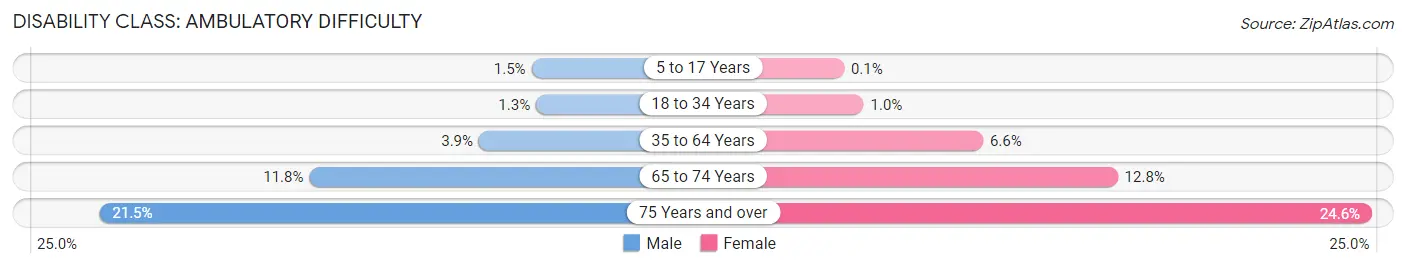
| Age Bracket | Male | Female |
| 5 to 17 Years | 140 (1.5%) | 9 (0.1%) |
| 18 to 34 Years | 287 (1.3%) | 211 (1.0%) |
| 35 to 64 Years | 1,150 (3.9%) | 1,920 (6.6%) |
| 65 to 74 Years | 791 (11.8%) | 1,019 (12.8%) |
| 75 Years and over | 1,030 (21.5%) | 1,664 (24.6%) |
Disability Class: Self-Care Difficulty
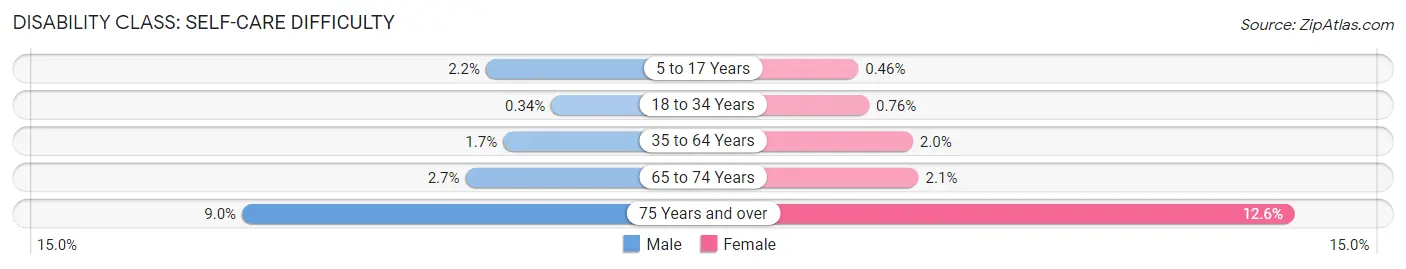
| Age Bracket | Male | Female |
| 5 to 17 Years | 204 (2.2%) | 41 (0.5%) |
| 18 to 34 Years | 77 (0.3%) | 159 (0.8%) |
| 35 to 64 Years | 492 (1.7%) | 579 (2.0%) |
| 65 to 74 Years | 183 (2.7%) | 170 (2.1%) |
| 75 Years and over | 428 (8.9%) | 853 (12.6%) |
Technology Access in Lakewood
Computing Device Access in Lakewood
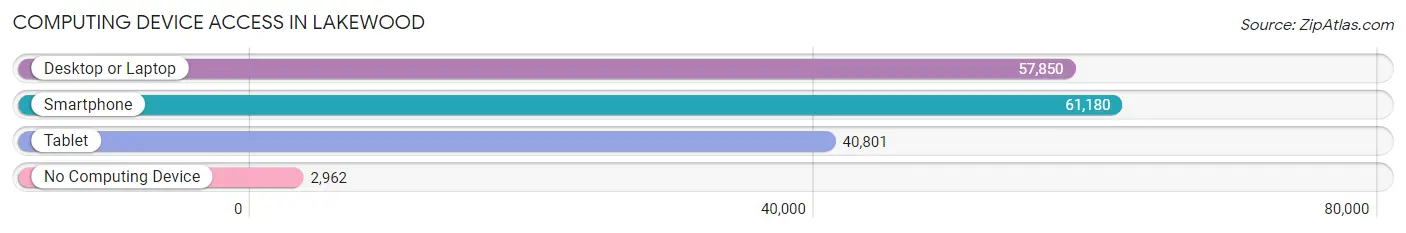
| Device Type | # Households | % Households |
| Desktop or Laptop | 57,850 | 84.9% |
| Smartphone | 61,180 | 89.8% |
| Tablet | 40,801 | 59.9% |
| No Computing Device | 2,962 | 4.3% |
| Total | 68,111 | 100.0% |
Internet Access in Lakewood
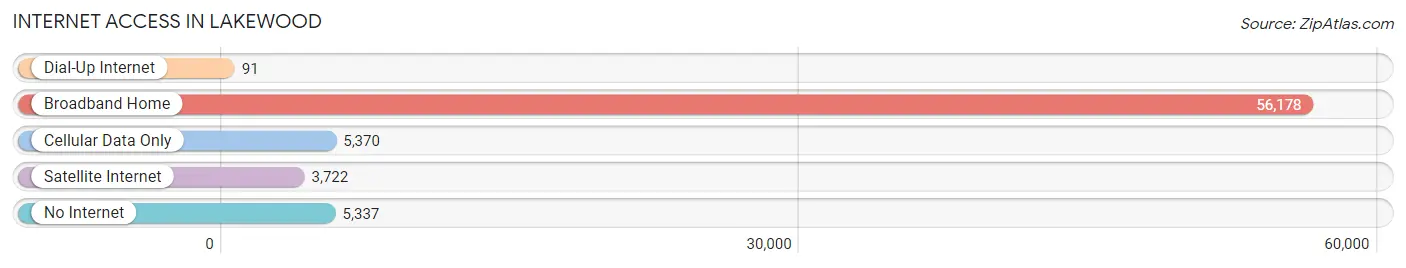
| Internet Type | # Households | % Households |
| Dial-Up Internet | 91 | 0.1% |
| Broadband Home | 56,178 | 82.5% |
| Cellular Data Only | 5,370 | 7.9% |
| Satellite Internet | 3,722 | 5.5% |
| No Internet | 5,337 | 7.8% |
| Total | 68,111 | 100.0% |
Lakewood Summary
Lakewood, Colorado is a city located in Jefferson County, Colorado, United States. It is the fifth most populous city in the state, with a population of approximately 140,000 people. The city is located in the foothills of the Rocky Mountains, just west of Denver.
History
The area that is now Lakewood was first settled in the late 1800s by homesteaders. The area was originally known as Bear Creek, and the first post office was established in 1891. In the early 1900s, the area began to grow as a resort town, with the opening of the Bear Creek Hotel in 1906. The hotel was a popular destination for visitors from Denver and the surrounding area.
In 1911, the area was incorporated as the City of Lakewood. The city was named after the nearby Bear Creek Lake, which was formed by the damming of Bear Creek. The city grew rapidly in the following decades, and by the 1950s, it had become a major suburb of Denver.
Geography
Lakewood is located in the foothills of the Rocky Mountains, just west of Denver. The city covers an area of approximately 40 square miles, and is bordered by the cities of Wheat Ridge, Arvada, and Golden. The city is situated at an elevation of 5,400 feet above sea level.
The city is located in the South Platte River Valley, and is surrounded by several mountain ranges, including the Front Range, the Rocky Mountains, and the Indian Peaks. The city is also home to several lakes, including Bear Creek Lake, which is the largest lake in the city.
Economy
The economy of Lakewood is largely based on the service industry, with many businesses providing services to the local population. The city is home to several large employers, including the St. Anthony Hospital, the Denver Federal Center, and the Colorado Mills Mall.
The city is also home to several major retail stores, including Walmart, Target, and Home Depot. The city is also home to several major corporations, including Lockheed Martin, Ball Aerospace, and the Coors Brewing Company.
Demographics
As of the 2010 census, the population of Lakewood was 140,000. The racial makeup of the city was 79.3% White, 8.2% African American, 0.7% Native American, 4.2% Asian, and 4.3% from other races. Hispanic or Latino of any race were 11.7% of the population.
The median household income in Lakewood was $60,000, and the median family income was $68,000. The per capita income for the city was $27,000. The poverty rate in Lakewood was 8.2%.
Conclusion
Lakewood, Colorado is a city located in Jefferson County, Colorado, United States. It is the fifth most populous city in the state, with a population of approximately 140,000 people. The city is located in the foothills of the Rocky Mountains, just west of Denver. The economy of Lakewood is largely based on the service industry, with many businesses providing services to the local population. The racial makeup of the city was 79.3% White, 8.2% African American, 0.7% Native American, 4.2% Asian, and 4.3% from other races. The median household income in Lakewood was $60,000, and the median family income was $68,000. The per capita income for the city was $27,000. The poverty rate in Lakewood was 8.2%. Lakewood is a vibrant city with a diverse population and a strong economy.
Common Questions
What is Per Capita Income in Lakewood?
Per Capita income in Lakewood is $48,299.
What is the Median Family Income in Lakewood?
Median Family Income in Lakewood is $105,748.
What is the Median Household income in Lakewood?
Median Household Income in Lakewood is $82,786.
What is Income or Wage Gap in Lakewood?
Income or Wage Gap in Lakewood is 24.9%.
Women in Lakewood earn 75.1 cents for every dollar earned by a man.
What is Family Income Deficit in Lakewood?
Family Income Deficit in Lakewood is $10,296.
Families that are below poverty line in Lakewood earn $10,296 less on average than the poverty threshold level.
What is Inequality or Gini Index in Lakewood?
Inequality or Gini Index in Lakewood is 0.44.
What is the Total Population of Lakewood?
Total Population of Lakewood is 156,149.
What is the Total Male Population of Lakewood?
Total Male Population of Lakewood is 77,838.
What is the Total Female Population of Lakewood?
Total Female Population of Lakewood is 78,311.
What is the Ratio of Males per 100 Females in Lakewood?
There are 99.40 Males per 100 Females in Lakewood.
What is the Ratio of Females per 100 Males in Lakewood?
There are 100.61 Females per 100 Males in Lakewood.
What is the Median Population Age in Lakewood?
Median Population Age in Lakewood is 38.1 Years.
What is the Average Family Size in Lakewood
Average Family Size in Lakewood is 2.9 People.
What is the Average Household Size in Lakewood
Average Household Size in Lakewood is 2.3 People.
How Large is the Labor Force in Lakewood?
There are 91,084 People in the Labor Forcein in Lakewood.
What is the Percentage of People in the Labor Force in Lakewood?
68.5% of People are in the Labor Force in Lakewood.
What is the Unemployment Rate in Lakewood?
Unemployment Rate in Lakewood is 4.4%.