Highlands Ranch, CO Map & Demographics
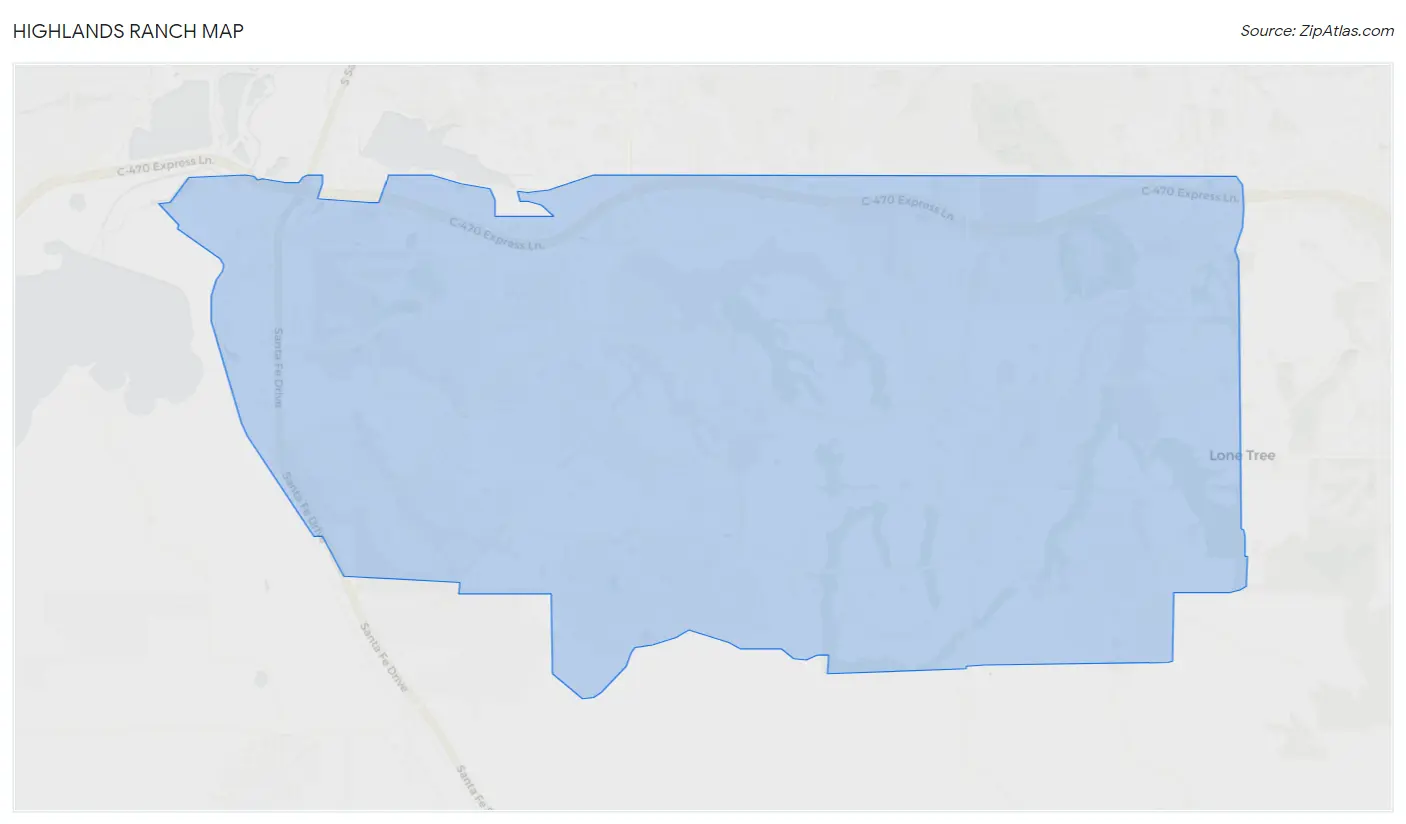
Highlands Ranch Map
Highlands Ranch Overview
$65,584
PER CAPITA INCOME
$163,363
AVG FAMILY INCOME
$148,227
AVG HOUSEHOLD INCOME
44.1%
WAGE / INCOME GAP [ % ]
55.9¢/ $1
WAGE / INCOME GAP [ $ ]
$12,125
FAMILY INCOME DEFICIT
0.37
INEQUALITY / GINI INDEX
101,514
TOTAL POPULATION
50,875
MALE POPULATION
50,639
FEMALE POPULATION
100.47
MALES / 100 FEMALES
99.54
FEMALES / 100 MALES
41.0
MEDIAN AGE
3.1
AVG FAMILY SIZE
2.7
AVG HOUSEHOLD SIZE
57,483
LABOR FORCE [ PEOPLE ]
72.1%
PERCENT IN LABOR FORCE
3.4%
UNEMPLOYMENT RATE
Income in Highlands Ranch
Income Overview in Highlands Ranch
Per Capita Income in Highlands Ranch is $65,584, while median incomes of families and households are $163,363 and $148,227 respectively.
| Characteristic | Number | Measure |
| Per Capita Income | 101,514 | $65,584 |
| Median Family Income | 28,592 | $163,363 |
| Mean Family Income | 28,592 | $192,651 |
| Median Household Income | 37,583 | $148,227 |
| Mean Household Income | 37,583 | $173,033 |
| Income Deficit | 28,592 | $12,125 |
| Wage / Income Gap (%) | 101,514 | 44.08% |
| Wage / Income Gap ($) | 101,514 | 55.92¢ per $1 |
| Gini / Inequality Index | 101,514 | 0.37 |
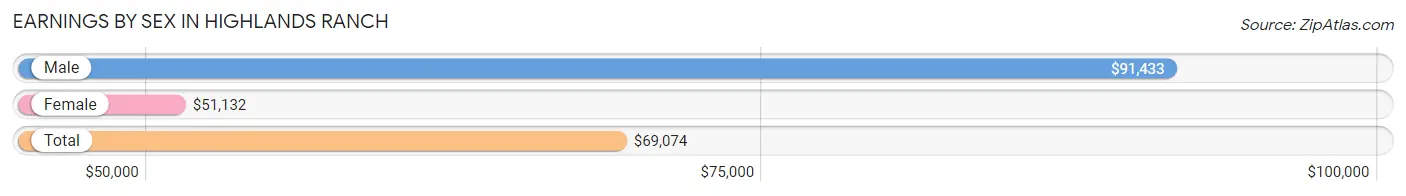
Earnings by Sex in Highlands Ranch
Average Earnings in Highlands Ranch are $69,074, $91,433 for men and $51,132 for women, a difference of 44.1%.
| Sex | Number | Average Earnings |
| Male | 32,723 (54.2%) | $91,433 |
| Female | 27,692 (45.8%) | $51,132 |
| Total | 60,415 (100.0%) | $69,074 |
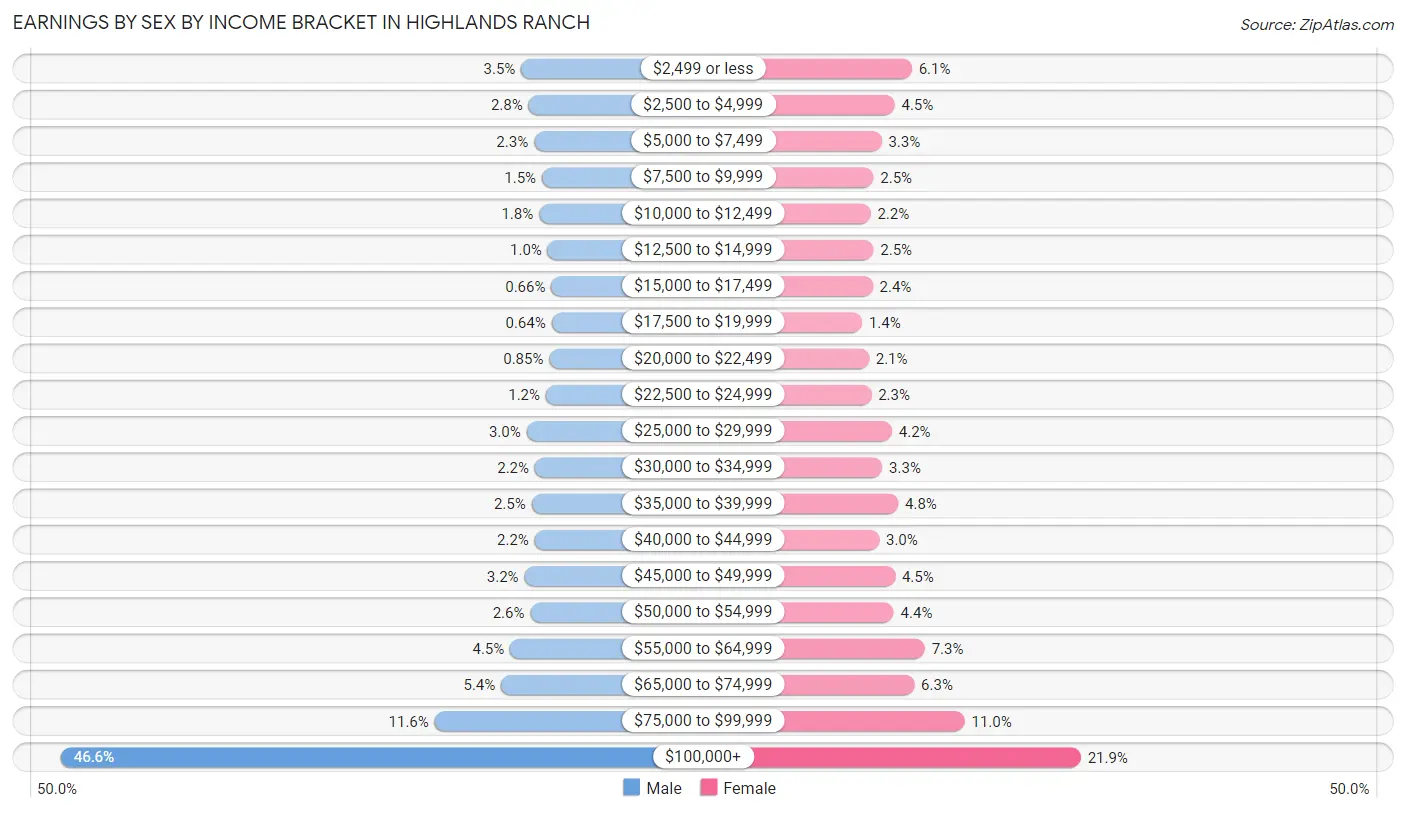
Earnings by Sex by Income Bracket in Highlands Ranch
The most common earnings brackets in Highlands Ranch are $100,000+ for men (15,250 | 46.6%) and $100,000+ for women (6,067 | 21.9%).
| Income | Male | Female |
| $2,499 or less | 1,139 (3.5%) | 1,685 (6.1%) |
| $2,500 to $4,999 | 912 (2.8%) | 1,238 (4.5%) |
| $5,000 to $7,499 | 745 (2.3%) | 901 (3.3%) |
| $7,500 to $9,999 | 503 (1.5%) | 690 (2.5%) |
| $10,000 to $12,499 | 593 (1.8%) | 614 (2.2%) |
| $12,500 to $14,999 | 327 (1.0%) | 690 (2.5%) |
| $15,000 to $17,499 | 217 (0.7%) | 669 (2.4%) |
| $17,500 to $19,999 | 208 (0.6%) | 393 (1.4%) |
| $20,000 to $22,499 | 277 (0.9%) | 570 (2.1%) |
| $22,500 to $24,999 | 383 (1.2%) | 634 (2.3%) |
| $25,000 to $29,999 | 975 (3.0%) | 1,169 (4.2%) |
| $30,000 to $34,999 | 720 (2.2%) | 917 (3.3%) |
| $35,000 to $39,999 | 820 (2.5%) | 1,331 (4.8%) |
| $40,000 to $44,999 | 727 (2.2%) | 836 (3.0%) |
| $45,000 to $49,999 | 1,042 (3.2%) | 1,249 (4.5%) |
| $50,000 to $54,999 | 861 (2.6%) | 1,215 (4.4%) |
| $55,000 to $64,999 | 1,478 (4.5%) | 2,022 (7.3%) |
| $65,000 to $74,999 | 1,754 (5.4%) | 1,748 (6.3%) |
| $75,000 to $99,999 | 3,792 (11.6%) | 3,054 (11.0%) |
| $100,000+ | 15,250 (46.6%) | 6,067 (21.9%) |
| Total | 32,723 (100.0%) | 27,692 (100.0%) |
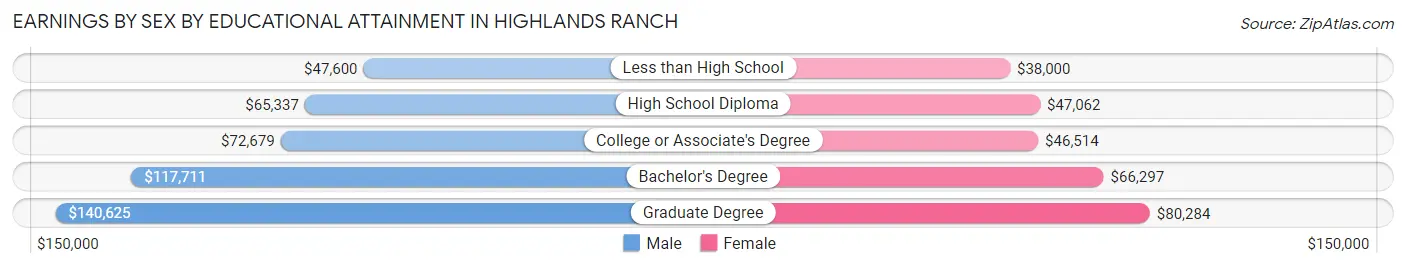
Earnings by Sex by Educational Attainment in Highlands Ranch
Average earnings in Highlands Ranch are $107,029 for men and $59,984 for women, a difference of 44.0%. Men with an educational attainment of graduate degree enjoy the highest average annual earnings of $140,625, while those with less than high school education earn the least with $47,600. Women with an educational attainment of graduate degree earn the most with the average annual earnings of $80,284, while those with less than high school education have the smallest earnings of $38,000.
| Educational Attainment | Male Income | Female Income |
| Less than High School | $47,600 | $38,000 |
| High School Diploma | $65,337 | $47,062 |
| College or Associate's Degree | $72,679 | $46,514 |
| Bachelor's Degree | $117,711 | $66,297 |
| Graduate Degree | $140,625 | $80,284 |
| Total | $107,029 | $59,984 |
Family Income in Highlands Ranch
Family Income Brackets in Highlands Ranch
According to the Highlands Ranch family income data, there are 10,179 families falling into the $200,000+ income range, which is the most common income bracket and makes up 35.6% of all families. Conversely, the $10,000 to $14,999 income bracket is the least frequent group with only 57 families (0.2%) belonging to this category.
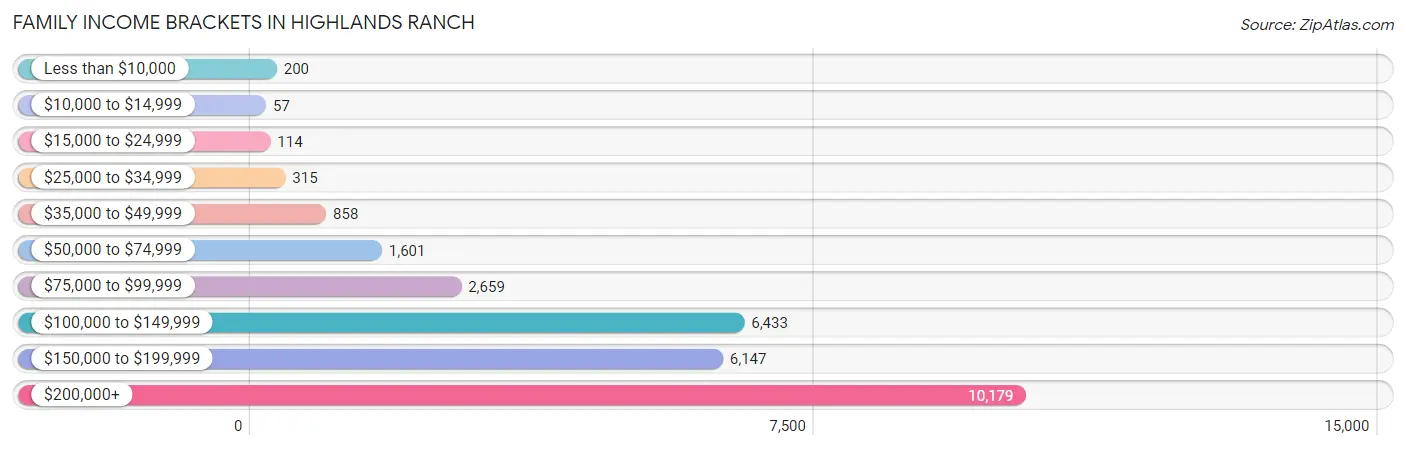
| Income Bracket | # Families | % Families |
| Less than $10,000 | 200 | 0.7% |
| $10,000 to $14,999 | 57 | 0.2% |
| $15,000 to $24,999 | 114 | 0.4% |
| $25,000 to $34,999 | 315 | 1.1% |
| $35,000 to $49,999 | 858 | 3.0% |
| $50,000 to $74,999 | 1,601 | 5.6% |
| $75,000 to $99,999 | 2,659 | 9.3% |
| $100,000 to $149,999 | 6,433 | 22.5% |
| $150,000 to $199,999 | 6,147 | 21.5% |
| $200,000+ | 10,179 | 35.6% |
Family Income by Famaliy Size in Highlands Ranch
7+ person families (280 | 1.0%) account for the highest median family income in Highlands Ranch with $225,781 per family, while 2-person families (12,812 | 44.8%) have the highest median income of $71,097 per family member.
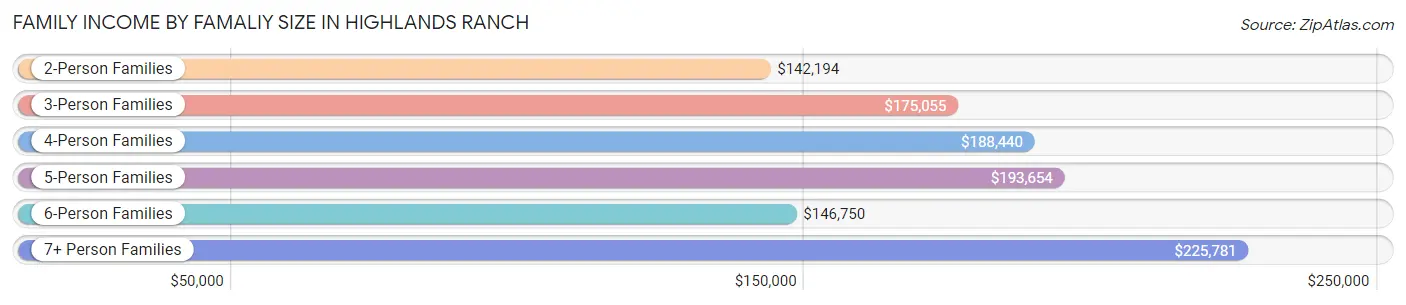
| Income Bracket | # Families | Median Income |
| 2-Person Families | 12,812 (44.8%) | $142,194 |
| 3-Person Families | 6,214 (21.7%) | $175,055 |
| 4-Person Families | 6,115 (21.4%) | $188,440 |
| 5-Person Families | 2,240 (7.8%) | $193,654 |
| 6-Person Families | 931 (3.3%) | $146,750 |
| 7+ Person Families | 280 (1.0%) | $225,781 |
| Total | 28,592 (100.0%) | $163,363 |
Family Income by Number of Earners in Highlands Ranch
The median family income in Highlands Ranch is $163,363, with families comprising 3+ earners (3,804) having the highest median family income of $210,500, while families with no earners (2,557) have the lowest median family income of $103,080, accounting for 13.3% and 8.9% of families, respectively.
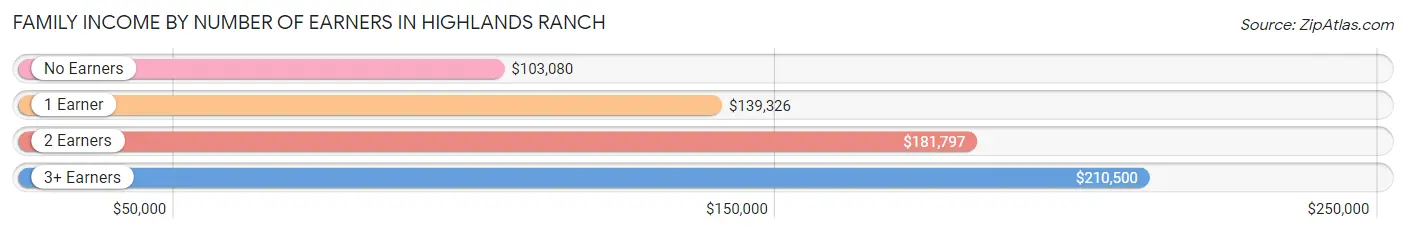
| Number of Earners | # Families | Median Income |
| No Earners | 2,557 (8.9%) | $103,080 |
| 1 Earner | 7,744 (27.1%) | $139,326 |
| 2 Earners | 14,487 (50.7%) | $181,797 |
| 3+ Earners | 3,804 (13.3%) | $210,500 |
| Total | 28,592 (100.0%) | $163,363 |
Household Income in Highlands Ranch
Household Income Brackets in Highlands Ranch
With 11,463 households falling in the category, the $200,000+ income range is the most frequent in Highlands Ranch, accounting for 30.5% of all households. In contrast, only 188 households (0.5%) fall into the $10,000 to $14,999 income bracket, making it the least populous group.
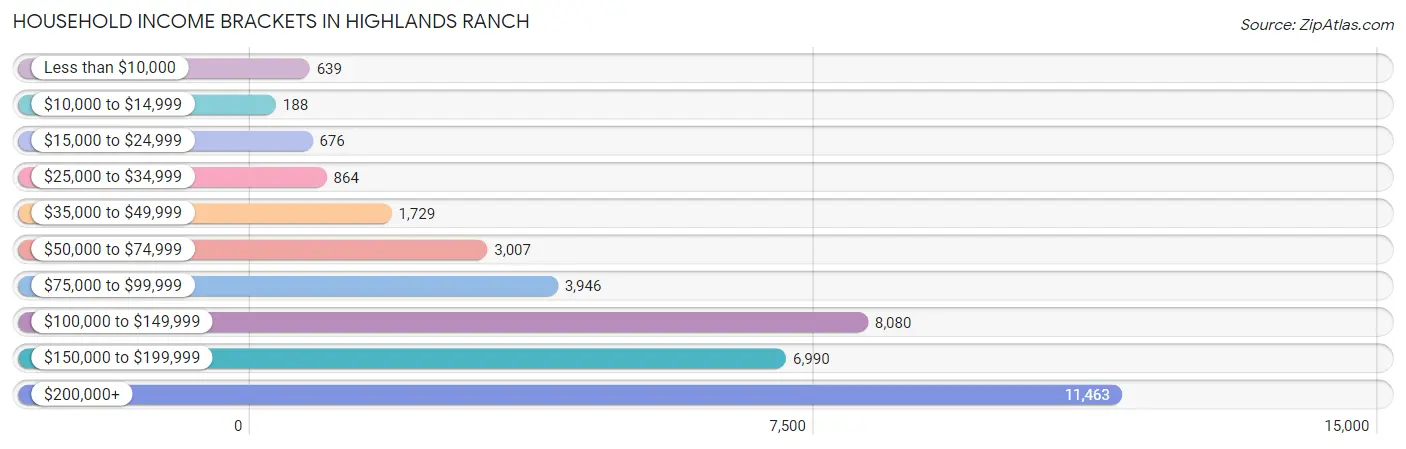
| Income Bracket | # Households | % Households |
| Less than $10,000 | 639 | 1.7% |
| $10,000 to $14,999 | 188 | 0.5% |
| $15,000 to $24,999 | 676 | 1.8% |
| $25,000 to $34,999 | 864 | 2.3% |
| $35,000 to $49,999 | 1,729 | 4.6% |
| $50,000 to $74,999 | 3,007 | 8.0% |
| $75,000 to $99,999 | 3,946 | 10.5% |
| $100,000 to $149,999 | 8,080 | 21.5% |
| $150,000 to $199,999 | 6,990 | 18.6% |
| $200,000+ | 11,463 | 30.5% |
Household Income by Householder Age in Highlands Ranch
The median household income in Highlands Ranch is $148,227, with the highest median household income of $173,273 found in the 45 to 64 years age bracket for the primary householder. A total of 17,028 households (45.3%) fall into this category. Meanwhile, the 15 to 24 years age bracket for the primary householder has the lowest median household income of $65,703, with 550 households (1.5%) in this group.
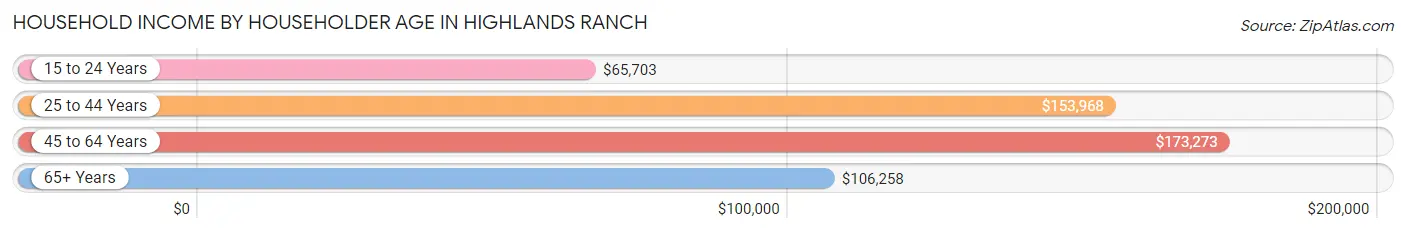
| Income Bracket | # Households | Median Income |
| 15 to 24 Years | 550 (1.5%) | $65,703 |
| 25 to 44 Years | 11,452 (30.5%) | $153,968 |
| 45 to 64 Years | 17,028 (45.3%) | $173,273 |
| 65+ Years | 8,553 (22.8%) | $106,258 |
| Total | 37,583 (100.0%) | $148,227 |
Poverty in Highlands Ranch
Income Below Poverty by Sex and Age in Highlands Ranch
With 1.9% poverty level for males and 1.9% for females among the residents of Highlands Ranch, 25 to 34 year old males and 75 year old and over females are the most vulnerable to poverty, with 158 males (3.4%) and 144 females (4.4%) in their respective age groups living below the poverty level.
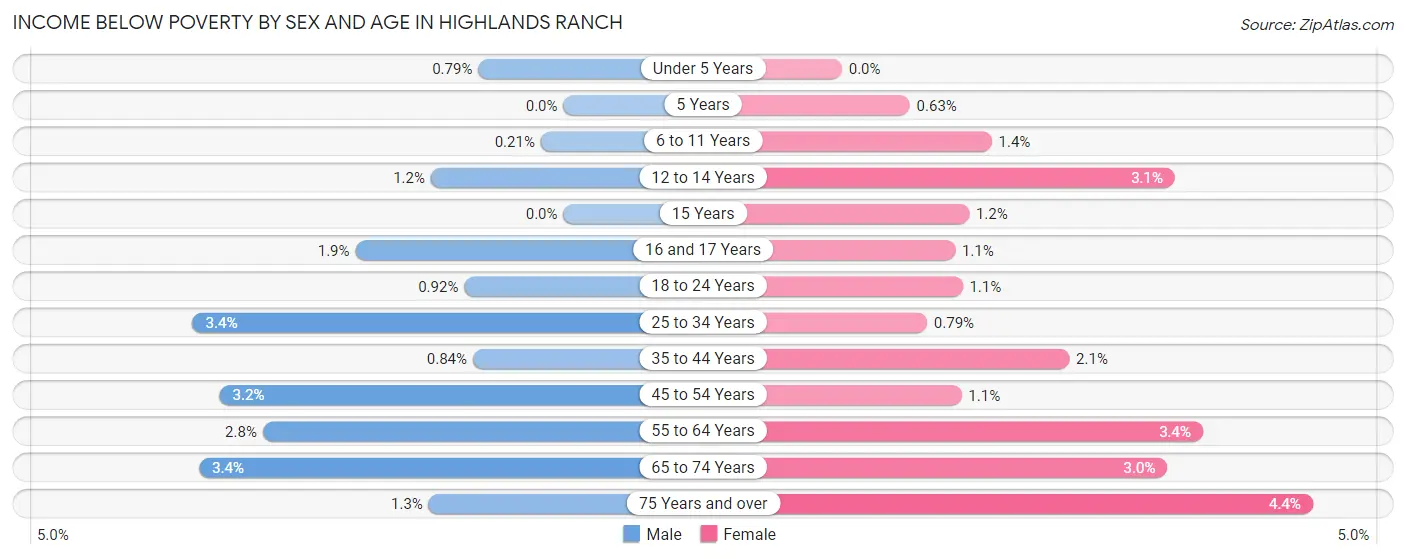
| Age Bracket | Male | Female |
| Under 5 Years | 20 (0.8%) | 0 (0.0%) |
| 5 Years | 0 (0.0%) | 4 (0.6%) |
| 6 to 11 Years | 9 (0.2%) | 58 (1.4%) |
| 12 to 14 Years | 38 (1.2%) | 73 (3.1%) |
| 15 Years | 0 (0.0%) | 11 (1.2%) |
| 16 and 17 Years | 33 (1.9%) | 19 (1.1%) |
| 18 to 24 Years | 37 (0.9%) | 44 (1.1%) |
| 25 to 34 Years | 158 (3.4%) | 39 (0.8%) |
| 35 to 44 Years | 61 (0.8%) | 152 (2.1%) |
| 45 to 54 Years | 288 (3.2%) | 95 (1.1%) |
| 55 to 64 Years | 182 (2.8%) | 219 (3.4%) |
| 65 to 74 Years | 129 (3.4%) | 124 (3.0%) |
| 75 Years and over | 29 (1.3%) | 144 (4.4%) |
| Total | 984 (1.9%) | 982 (1.9%) |
Income Above Poverty by Sex and Age in Highlands Ranch
According to the poverty statistics in Highlands Ranch, males aged 5 years and females aged under 5 years are the age groups that are most secure financially, with 100.0% of males and 100.0% of females in these age groups living above the poverty line.
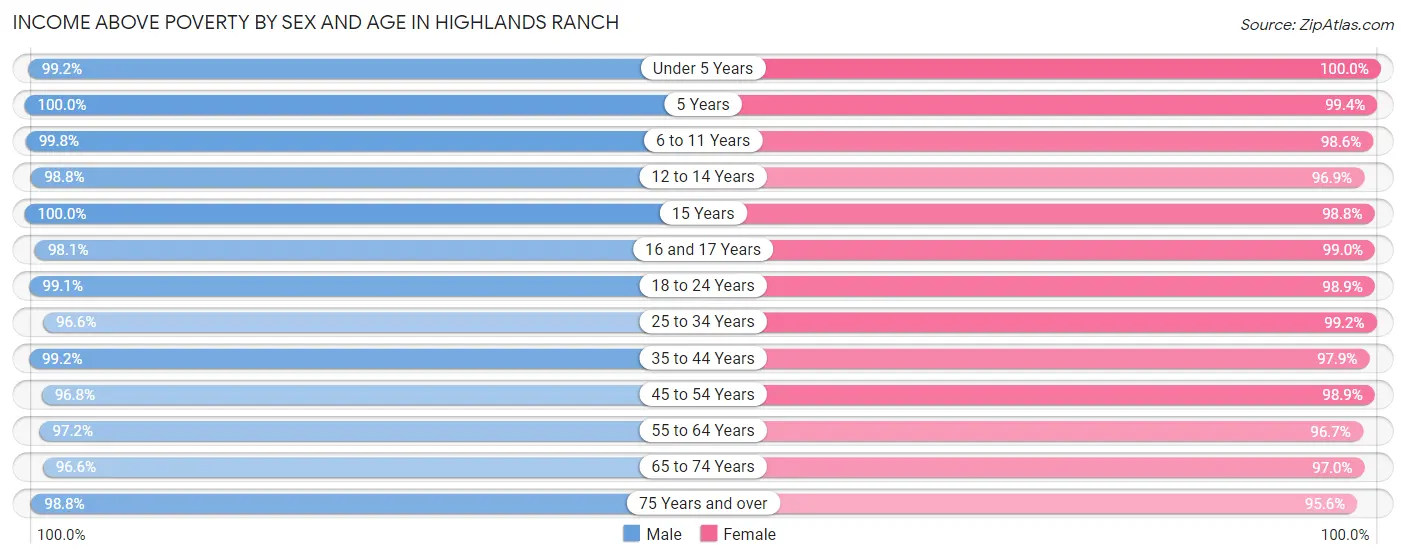
| Age Bracket | Male | Female |
| Under 5 Years | 2,503 (99.2%) | 2,010 (100.0%) |
| 5 Years | 489 (100.0%) | 635 (99.4%) |
| 6 to 11 Years | 4,190 (99.8%) | 4,119 (98.6%) |
| 12 to 14 Years | 3,045 (98.8%) | 2,291 (96.9%) |
| 15 Years | 1,228 (100.0%) | 920 (98.8%) |
| 16 and 17 Years | 1,676 (98.1%) | 1,796 (99.0%) |
| 18 to 24 Years | 3,982 (99.1%) | 3,900 (98.9%) |
| 25 to 34 Years | 4,434 (96.6%) | 4,908 (99.2%) |
| 35 to 44 Years | 7,210 (99.2%) | 7,040 (97.9%) |
| 45 to 54 Years | 8,738 (96.8%) | 8,454 (98.9%) |
| 55 to 64 Years | 6,334 (97.2%) | 6,312 (96.7%) |
| 65 to 74 Years | 3,685 (96.6%) | 3,978 (97.0%) |
| 75 Years and over | 2,286 (98.8%) | 3,149 (95.6%) |
| Total | 49,800 (98.1%) | 49,512 (98.1%) |
Income Below Poverty Among Married-Couple Families in Highlands Ranch
The poverty statistics for married-couple families in Highlands Ranch show that 0.6% or 139 of the total 24,227 families live below the poverty line. Families with no children have the highest poverty rate of 0.9%, comprising of 117 families. On the other hand, families with 5 or more children have the lowest poverty rate of 0.0%, which includes 0 families.
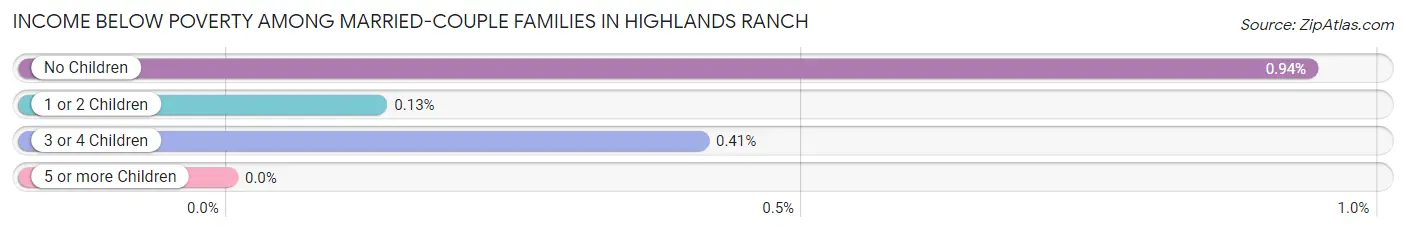
| Children | Above Poverty | Below Poverty |
| No Children | 12,307 (99.1%) | 117 (0.9%) |
| 1 or 2 Children | 9,203 (99.9%) | 12 (0.1%) |
| 3 or 4 Children | 2,444 (99.6%) | 10 (0.4%) |
| 5 or more Children | 134 (100.0%) | 0 (0.0%) |
| Total | 24,088 (99.4%) | 139 (0.6%) |
Income Below Poverty Among Single-Parent Households in Highlands Ranch
According to the poverty data in Highlands Ranch, 3.5% or 58 single-father households and 4.7% or 127 single-mother households are living below the poverty line. Among single-father households, those with 3 or 4 children have the highest poverty rate, with 10 households (20.4%) experiencing poverty. Likewise, among single-mother households, those with 1 or 2 children have the highest poverty rate, with 111 households (6.9%) falling below the poverty line.
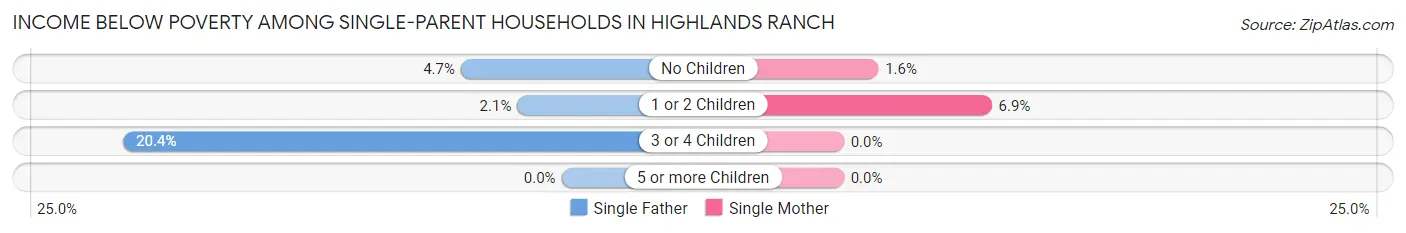
| Children | Single Father | Single Mother |
| No Children | 27 (4.7%) | 16 (1.6%) |
| 1 or 2 Children | 21 (2.1%) | 111 (6.9%) |
| 3 or 4 Children | 10 (20.4%) | 0 (0.0%) |
| 5 or more Children | 0 (0.0%) | 0 (0.0%) |
| Total | 58 (3.5%) | 127 (4.7%) |
Income Below Poverty Among Married-Couple vs Single-Parent Households in Highlands Ranch
The poverty data for Highlands Ranch shows that 139 of the married-couple family households (0.6%) and 185 of the single-parent households (4.2%) are living below the poverty level. Within the married-couple family households, those with no children have the highest poverty rate, with 117 households (0.9%) falling below the poverty line. Among the single-parent households, those with 3 or 4 children have the highest poverty rate, with 10 household (6.1%) living below poverty.
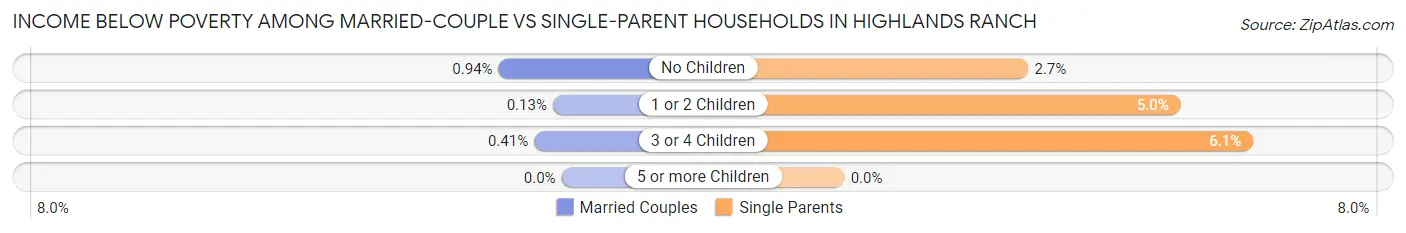
| Children | Married-Couple Families | Single-Parent Households |
| No Children | 117 (0.9%) | 43 (2.7%) |
| 1 or 2 Children | 12 (0.1%) | 132 (5.0%) |
| 3 or 4 Children | 10 (0.4%) | 10 (6.1%) |
| 5 or more Children | 0 (0.0%) | 0 (0.0%) |
| Total | 139 (0.6%) | 185 (4.2%) |
Race in Highlands Ranch
The most populous races in Highlands Ranch are White / Caucasian (86,540 | 85.3%), Hispanic or Latino (9,117 | 9.0%), and Asian (6,242 | 6.1%).
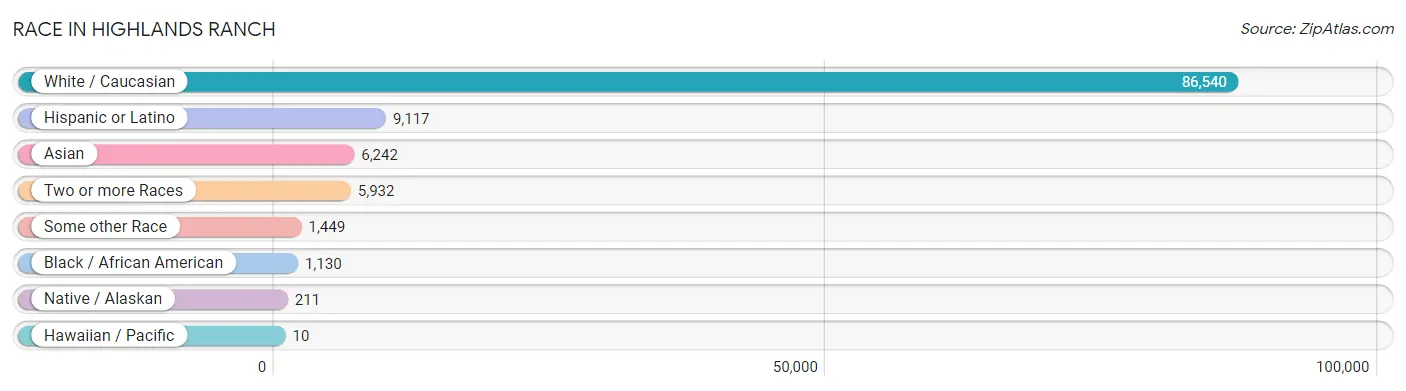
| Race | # Population | % Population |
| Asian | 6,242 | 6.1% |
| Black / African American | 1,130 | 1.1% |
| Hawaiian / Pacific | 10 | 0.0% |
| Hispanic or Latino | 9,117 | 9.0% |
| Native / Alaskan | 211 | 0.2% |
| White / Caucasian | 86,540 | 85.3% |
| Two or more Races | 5,932 | 5.8% |
| Some other Race | 1,449 | 1.4% |
| Total | 101,514 | 100.0% |
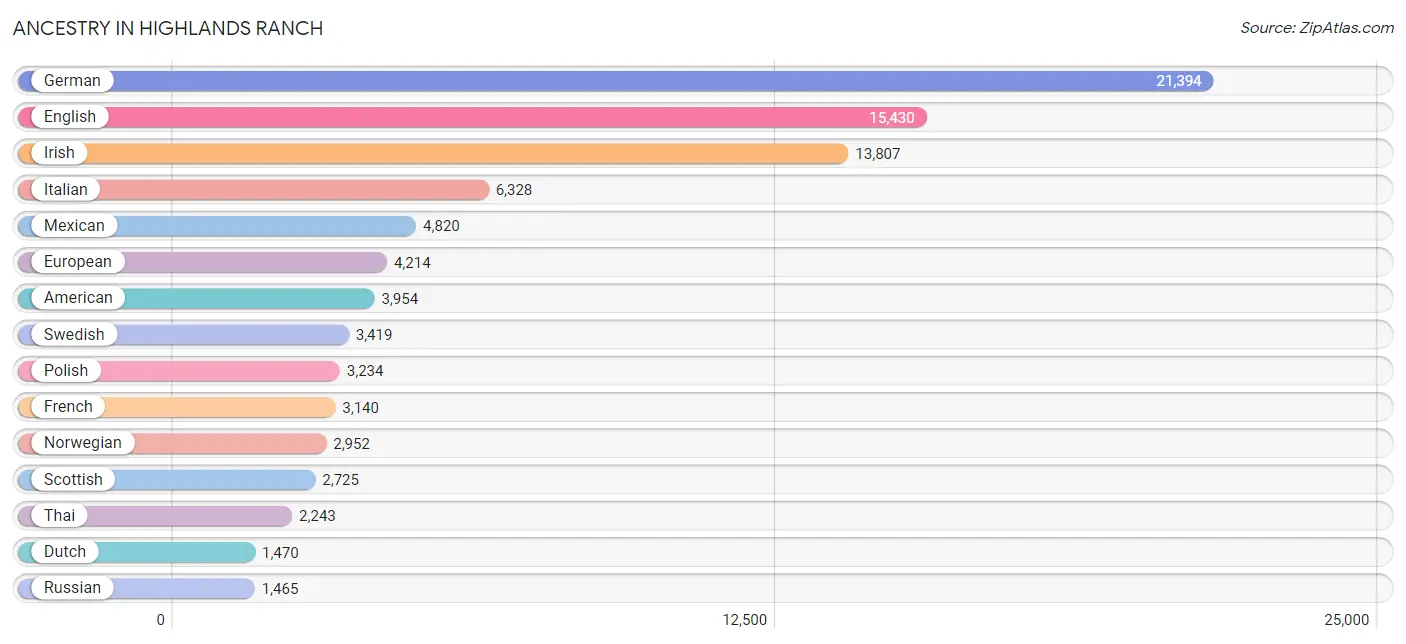
Ancestry in Highlands Ranch
The most populous ancestries reported in Highlands Ranch are German (21,394 | 21.1%), English (15,430 | 15.2%), Irish (13,807 | 13.6%), Italian (6,328 | 6.2%), and Mexican (4,820 | 4.8%), together accounting for 60.9% of all Highlands Ranch residents.
| Ancestry | # Population | % Population |
| African | 47 | 0.1% |
| Aleut | 5 | 0.0% |
| American | 3,954 | 3.9% |
| Apache | 32 | 0.0% |
| Arab | 506 | 0.5% |
| Arapaho | 6 | 0.0% |
| Argentinean | 70 | 0.1% |
| Armenian | 89 | 0.1% |
| Australian | 142 | 0.1% |
| Austrian | 405 | 0.4% |
| Bahamian | 8 | 0.0% |
| Barbadian | 15 | 0.0% |
| Belgian | 350 | 0.3% |
| Bhutanese | 536 | 0.5% |
| Blackfeet | 11 | 0.0% |
| Bolivian | 8 | 0.0% |
| Brazilian | 188 | 0.2% |
| British | 896 | 0.9% |
| Burmese | 1,274 | 1.3% |
| Cajun | 28 | 0.0% |
| Cambodian | 9 | 0.0% |
| Canadian | 322 | 0.3% |
| Carpatho Rusyn | 34 | 0.0% |
| Celtic | 34 | 0.0% |
| Central American | 455 | 0.4% |
| Central American Indian | 107 | 0.1% |
| Cherokee | 206 | 0.2% |
| Cheyenne | 47 | 0.1% |
| Chickasaw | 40 | 0.0% |
| Chilean | 109 | 0.1% |
| Choctaw | 40 | 0.0% |
| Colombian | 150 | 0.2% |
| Costa Rican | 105 | 0.1% |
| Creek | 46 | 0.1% |
| Croatian | 384 | 0.4% |
| Cuban | 222 | 0.2% |
| Czech | 838 | 0.8% |
| Czechoslovakian | 295 | 0.3% |
| Danish | 907 | 0.9% |
| Dominican | 67 | 0.1% |
| Dutch | 1,470 | 1.5% |
| Eastern European | 507 | 0.5% |
| Ecuadorian | 173 | 0.2% |
| Egyptian | 214 | 0.2% |
| English | 15,430 | 15.2% |
| Estonian | 89 | 0.1% |
| Ethiopian | 20 | 0.0% |
| European | 4,214 | 4.2% |
| Filipino | 152 | 0.2% |
| Finnish | 397 | 0.4% |
| French | 3,140 | 3.1% |
| French Canadian | 412 | 0.4% |
| German | 21,394 | 21.1% |
| German Russian | 28 | 0.0% |
| Greek | 751 | 0.7% |
| Guamanian / Chamorro | 129 | 0.1% |
| Guatemalan | 41 | 0.0% |
| Haitian | 14 | 0.0% |
| Honduran | 95 | 0.1% |
| Hungarian | 408 | 0.4% |
| Icelander | 43 | 0.0% |
| Indian (Asian) | 1,269 | 1.3% |
| Iranian | 133 | 0.1% |
| Irish | 13,807 | 13.6% |
| Iroquois | 35 | 0.0% |
| Israeli | 15 | 0.0% |
| Italian | 6,328 | 6.2% |
| Jamaican | 55 | 0.1% |
| Jordanian | 23 | 0.0% |
| Kenyan | 7 | 0.0% |
| Korean | 1,363 | 1.3% |
| Laotian | 147 | 0.1% |
| Latvian | 21 | 0.0% |
| Lebanese | 141 | 0.1% |
| Lithuanian | 478 | 0.5% |
| Malaysian | 16 | 0.0% |
| Mexican | 4,820 | 4.8% |
| Mexican American Indian | 13 | 0.0% |
| Mongolian | 13 | 0.0% |
| Native Hawaiian | 122 | 0.1% |
| Navajo | 137 | 0.1% |
| New Zealander | 4 | 0.0% |
| Nicaraguan | 72 | 0.1% |
| Nigerian | 18 | 0.0% |
| Northern European | 351 | 0.4% |
| Norwegian | 2,952 | 2.9% |
| Pakistani | 199 | 0.2% |
| Panamanian | 20 | 0.0% |
| Paraguayan | 22 | 0.0% |
| Pennsylvania German | 36 | 0.0% |
| Peruvian | 97 | 0.1% |
| Polish | 3,234 | 3.2% |
| Portuguese | 297 | 0.3% |
| Potawatomi | 6 | 0.0% |
| Pueblo | 11 | 0.0% |
| Puerto Rican | 568 | 0.6% |
| Romanian | 151 | 0.2% |
| Russian | 1,465 | 1.4% |
| Salvadoran | 85 | 0.1% |
| Samoan | 29 | 0.0% |
| Scandinavian | 660 | 0.6% |
| Scotch-Irish | 882 | 0.9% |
| Scottish | 2,725 | 2.7% |
| Seminole | 10 | 0.0% |
| Serbian | 36 | 0.0% |
| Sioux | 5 | 0.0% |
| Slavic | 83 | 0.1% |
| Slovak | 136 | 0.1% |
| Slovene | 40 | 0.0% |
| South African | 44 | 0.0% |
| South American | 759 | 0.7% |
| South American Indian | 26 | 0.0% |
| Spaniard | 1,410 | 1.4% |
| Spanish | 566 | 0.6% |
| Spanish American | 19 | 0.0% |
| Sri Lankan | 649 | 0.6% |
| Subsaharan African | 148 | 0.2% |
| Sudanese | 7 | 0.0% |
| Swedish | 3,419 | 3.4% |
| Swiss | 540 | 0.5% |
| Syrian | 82 | 0.1% |
| Thai | 2,243 | 2.2% |
| Tlingit-Haida | 5 | 0.0% |
| Trinidadian and Tobagonian | 7 | 0.0% |
| Turkish | 102 | 0.1% |
| Ugandan | 14 | 0.0% |
| Ukrainian | 418 | 0.4% |
| Venezuelan | 99 | 0.1% |
| Welsh | 1,018 | 1.0% |
| West Indian | 30 | 0.0% |
| Yaqui | 16 | 0.0% |
| Yugoslavian | 42 | 0.0% | View All 132 Rows |
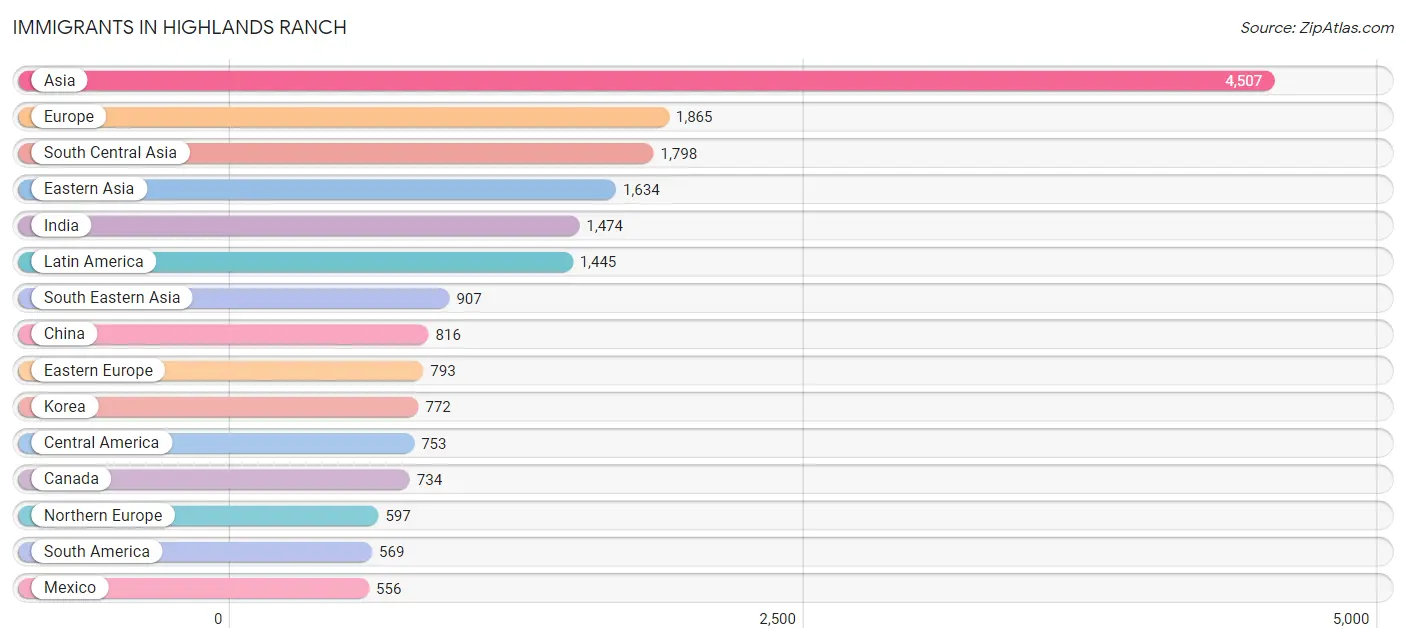
Immigrants in Highlands Ranch
The most numerous immigrant groups reported in Highlands Ranch came from Asia (4,507 | 4.4%), Europe (1,865 | 1.8%), South Central Asia (1,798 | 1.8%), Eastern Asia (1,634 | 1.6%), and India (1,474 | 1.5%), together accounting for 11.1% of all Highlands Ranch residents.
| Immigration Origin | # Population | % Population |
| Africa | 146 | 0.1% |
| Argentina | 50 | 0.1% |
| Asia | 4,507 | 4.4% |
| Australia | 73 | 0.1% |
| Austria | 24 | 0.0% |
| Bahamas | 8 | 0.0% |
| Belarus | 18 | 0.0% |
| Belgium | 50 | 0.1% |
| Brazil | 222 | 0.2% |
| Cambodia | 12 | 0.0% |
| Canada | 734 | 0.7% |
| Caribbean | 123 | 0.1% |
| Central America | 753 | 0.7% |
| Chile | 37 | 0.0% |
| China | 816 | 0.8% |
| Colombia | 35 | 0.0% |
| Costa Rica | 68 | 0.1% |
| Cuba | 71 | 0.1% |
| Czechoslovakia | 26 | 0.0% |
| Denmark | 23 | 0.0% |
| Dominican Republic | 7 | 0.0% |
| Eastern Africa | 33 | 0.0% |
| Eastern Asia | 1,634 | 1.6% |
| Eastern Europe | 793 | 0.8% |
| Ecuador | 74 | 0.1% |
| Egypt | 20 | 0.0% |
| El Salvador | 18 | 0.0% |
| England | 127 | 0.1% |
| Ethiopia | 9 | 0.0% |
| Europe | 1,865 | 1.8% |
| France | 25 | 0.0% |
| Germany | 234 | 0.2% |
| Greece | 8 | 0.0% |
| Guatemala | 30 | 0.0% |
| Haiti | 14 | 0.0% |
| Hong Kong | 34 | 0.0% |
| Hungary | 44 | 0.0% |
| India | 1,474 | 1.5% |
| Indonesia | 91 | 0.1% |
| Iran | 134 | 0.1% |
| Iraq | 29 | 0.0% |
| Ireland | 22 | 0.0% |
| Israel | 40 | 0.0% |
| Italy | 30 | 0.0% |
| Jamaica | 16 | 0.0% |
| Japan | 37 | 0.0% |
| Jordan | 29 | 0.0% |
| Kazakhstan | 107 | 0.1% |
| Korea | 772 | 0.8% |
| Latin America | 1,445 | 1.4% |
| Lebanon | 32 | 0.0% |
| Malaysia | 17 | 0.0% |
| Mexico | 556 | 0.5% |
| Moldova | 10 | 0.0% |
| Nepal | 9 | 0.0% |
| Netherlands | 33 | 0.0% |
| Nicaragua | 81 | 0.1% |
| Nigeria | 2 | 0.0% |
| Northern Africa | 20 | 0.0% |
| Northern Europe | 597 | 0.6% |
| Norway | 21 | 0.0% |
| Oceania | 93 | 0.1% |
| Pakistan | 38 | 0.0% |
| Peru | 76 | 0.1% |
| Philippines | 442 | 0.4% |
| Poland | 329 | 0.3% |
| Portugal | 13 | 0.0% |
| Romania | 105 | 0.1% |
| Russia | 164 | 0.2% |
| Saudi Arabia | 11 | 0.0% |
| South Africa | 80 | 0.1% |
| South America | 569 | 0.6% |
| South Central Asia | 1,798 | 1.8% |
| South Eastern Asia | 907 | 0.9% |
| Southern Europe | 85 | 0.1% |
| Spain | 34 | 0.0% |
| Sri Lanka | 36 | 0.0% |
| Sweden | 6 | 0.0% |
| Switzerland | 11 | 0.0% |
| Taiwan | 89 | 0.1% |
| Thailand | 79 | 0.1% |
| Trinidad and Tobago | 7 | 0.0% |
| Turkey | 16 | 0.0% |
| Uganda | 14 | 0.0% |
| Ukraine | 53 | 0.1% |
| Venezuela | 63 | 0.1% |
| Vietnam | 250 | 0.3% |
| Western Africa | 7 | 0.0% |
| Western Asia | 168 | 0.2% |
| Western Europe | 390 | 0.4% | View All 90 Rows |
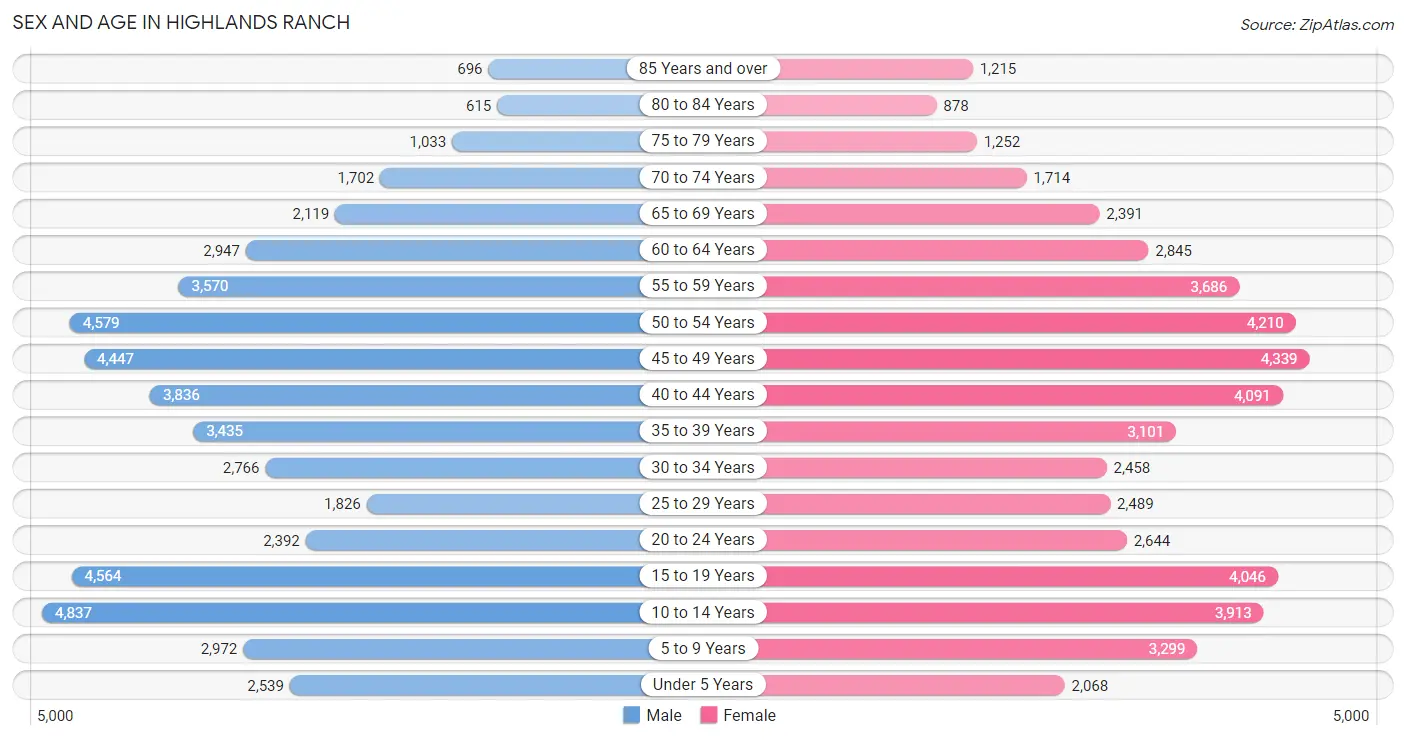
Sex and Age in Highlands Ranch
Sex and Age in Highlands Ranch
The most populous age groups in Highlands Ranch are 10 to 14 Years (4,837 | 9.5%) for men and 45 to 49 Years (4,339 | 8.6%) for women.
| Age Bracket | Male | Female |
| Under 5 Years | 2,539 (5.0%) | 2,068 (4.1%) |
| 5 to 9 Years | 2,972 (5.8%) | 3,299 (6.5%) |
| 10 to 14 Years | 4,837 (9.5%) | 3,913 (7.7%) |
| 15 to 19 Years | 4,564 (9.0%) | 4,046 (8.0%) |
| 20 to 24 Years | 2,392 (4.7%) | 2,644 (5.2%) |
| 25 to 29 Years | 1,826 (3.6%) | 2,489 (4.9%) |
| 30 to 34 Years | 2,766 (5.4%) | 2,458 (4.9%) |
| 35 to 39 Years | 3,435 (6.8%) | 3,101 (6.1%) |
| 40 to 44 Years | 3,836 (7.5%) | 4,091 (8.1%) |
| 45 to 49 Years | 4,447 (8.7%) | 4,339 (8.6%) |
| 50 to 54 Years | 4,579 (9.0%) | 4,210 (8.3%) |
| 55 to 59 Years | 3,570 (7.0%) | 3,686 (7.3%) |
| 60 to 64 Years | 2,947 (5.8%) | 2,845 (5.6%) |
| 65 to 69 Years | 2,119 (4.2%) | 2,391 (4.7%) |
| 70 to 74 Years | 1,702 (3.4%) | 1,714 (3.4%) |
| 75 to 79 Years | 1,033 (2.0%) | 1,252 (2.5%) |
| 80 to 84 Years | 615 (1.2%) | 878 (1.7%) |
| 85 Years and over | 696 (1.4%) | 1,215 (2.4%) |
| Total | 50,875 (100.0%) | 50,639 (100.0%) |
Families and Households in Highlands Ranch
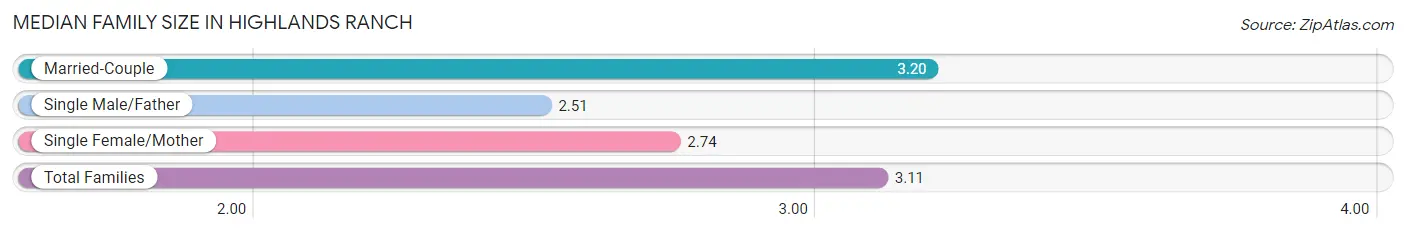
Median Family Size in Highlands Ranch
The median family size in Highlands Ranch is 3.11 persons per family, with married-couple families (24,227 | 84.7%) accounting for the largest median family size of 3.2 persons per family. On the other hand, single male/father families (1,645 | 5.8%) represent the smallest median family size with 2.51 persons per family.
| Family Type | # Families | Family Size |
| Married-Couple | 24,227 (84.7%) | 3.20 |
| Single Male/Father | 1,645 (5.8%) | 2.51 |
| Single Female/Mother | 2,720 (9.5%) | 2.74 |
| Total Families | 28,592 (100.0%) | 3.11 |
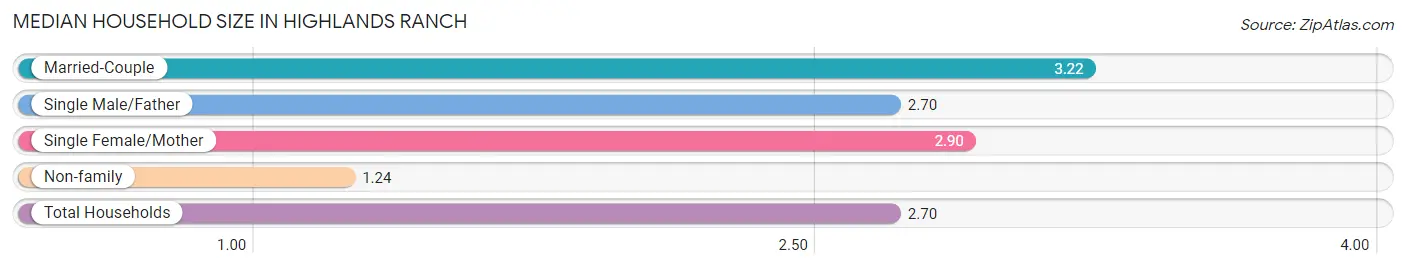
Median Household Size in Highlands Ranch
The median household size in Highlands Ranch is 2.70 persons per household, with married-couple households (24,227 | 64.5%) accounting for the largest median household size of 3.22 persons per household. non-family households (8,991 | 23.9%) represent the smallest median household size with 1.24 persons per household.
| Household Type | # Households | Household Size |
| Married-Couple | 24,227 (64.5%) | 3.22 |
| Single Male/Father | 1,645 (4.4%) | 2.70 |
| Single Female/Mother | 2,720 (7.2%) | 2.90 |
| Non-family | 8,991 (23.9%) | 1.24 |
| Total Households | 37,583 (100.0%) | 2.70 |
Household Size by Marriage Status in Highlands Ranch
Out of a total of 37,583 households in Highlands Ranch, 28,592 (76.1%) are family households, while 8,991 (23.9%) are nonfamily households. The most numerous type of family households are 2-person households, comprising 12,271, and the most common type of nonfamily households are 1-person households, comprising 7,416.
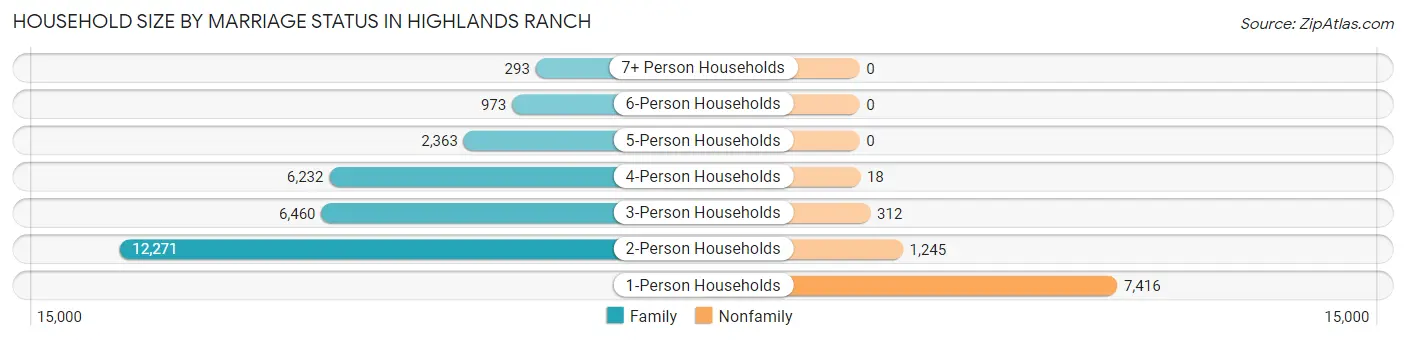
| Household Size | Family Households | Nonfamily Households |
| 1-Person Households | - | 7,416 (19.7%) |
| 2-Person Households | 12,271 (32.7%) | 1,245 (3.3%) |
| 3-Person Households | 6,460 (17.2%) | 312 (0.8%) |
| 4-Person Households | 6,232 (16.6%) | 18 (0.1%) |
| 5-Person Households | 2,363 (6.3%) | 0 (0.0%) |
| 6-Person Households | 973 (2.6%) | 0 (0.0%) |
| 7+ Person Households | 293 (0.8%) | 0 (0.0%) |
| Total | 28,592 (76.1%) | 8,991 (23.9%) |
Female Fertility in Highlands Ranch
Fertility by Age in Highlands Ranch
Average fertility rate in Highlands Ranch is 40.0 births per 1,000 women. Women in the age bracket of 20 to 34 years have the highest fertility rate with 67.0 births per 1,000 women. Women in the age bracket of 20 to 34 years acount for 52.2% of all women with births.
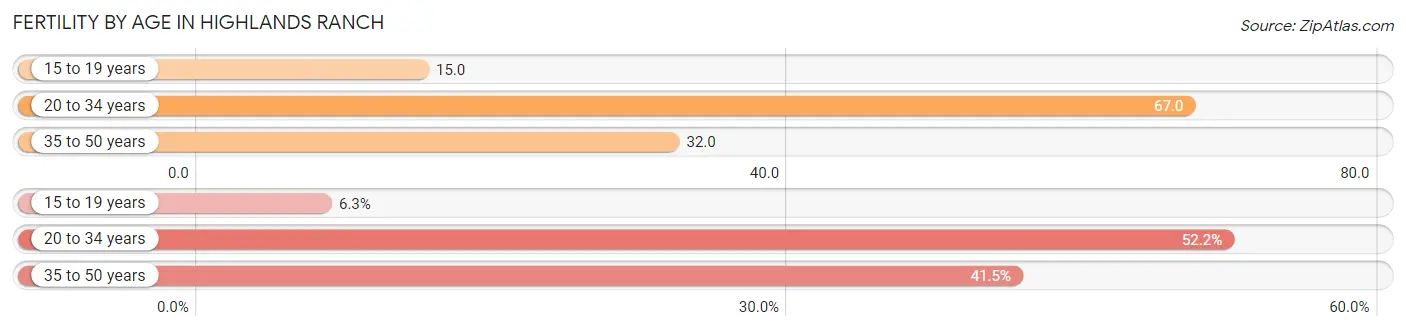
| Age Bracket | Women with Births | Births / 1,000 Women |
| 15 to 19 years | 61 (6.3%) | 15.0 |
| 20 to 34 years | 505 (52.2%) | 67.0 |
| 35 to 50 years | 401 (41.5%) | 32.0 |
| Total | 967 (100.0%) | 40.0 |
Fertility by Age by Marriage Status in Highlands Ranch
91.9% of women with births (967) in Highlands Ranch are married. The highest percentage of unmarried women with births falls into 15 to 19 years age bracket with 100.0% of them unmarried at the time of birth, while the lowest percentage of unmarried women with births belong to 20 to 34 years age bracket with 1.4% of them unmarried.
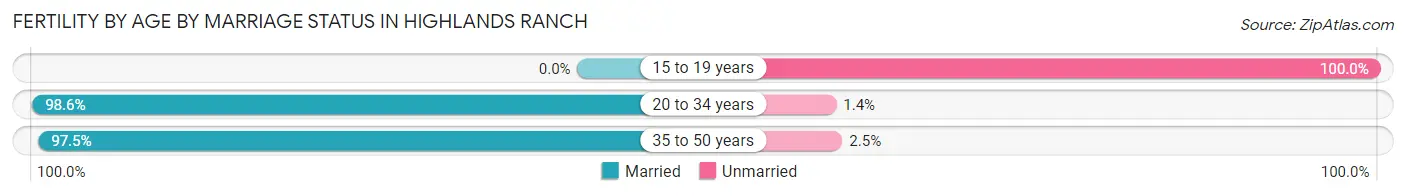
| Age Bracket | Married | Unmarried |
| 15 to 19 years | 0 (0.0%) | 61 (100.0%) |
| 20 to 34 years | 498 (98.6%) | 7 (1.4%) |
| 35 to 50 years | 391 (97.5%) | 10 (2.5%) |
| Total | 889 (91.9%) | 78 (8.1%) |
Fertility by Education in Highlands Ranch
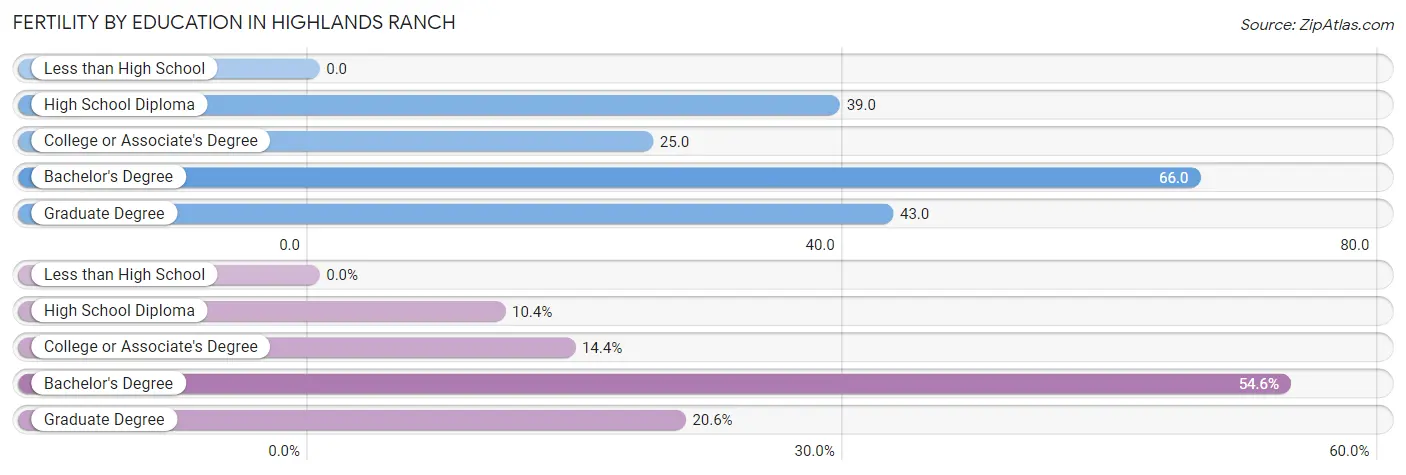
| Educational Attainment | Women with Births | Births / 1,000 Women |
| Less than High School | 0 (0.0%) | 0.0 |
| High School Diploma | 101 (10.4%) | 39.0 |
| College or Associate's Degree | 139 (14.4%) | 25.0 |
| Bachelor's Degree | 528 (54.6%) | 66.0 |
| Graduate Degree | 199 (20.6%) | 43.0 |
| Total | 967 (100.0%) | 40.0 |
Fertility by Education by Marriage Status in Highlands Ranch
8.1% of women with births in Highlands Ranch are unmarried. Women with the educational attainment of bachelor's degree are most likely to be married with 100.0% of them married at childbirth, while women with the educational attainment of high school diploma are least likely to be married with 60.4% of them unmarried at childbirth.
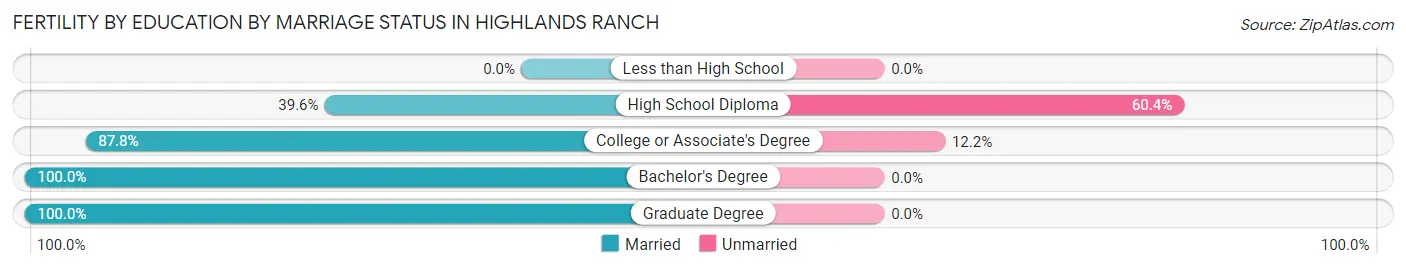
| Educational Attainment | Married | Unmarried |
| Less than High School | 0 (0.0%) | 0 (0.0%) |
| High School Diploma | 40 (39.6%) | 61 (60.4%) |
| College or Associate's Degree | 122 (87.8%) | 17 (12.2%) |
| Bachelor's Degree | 528 (100.0%) | 0 (0.0%) |
| Graduate Degree | 199 (100.0%) | 0 (0.0%) |
| Total | 889 (91.9%) | 78 (8.1%) |
Employment Characteristics in Highlands Ranch
Employment by Class of Employer in Highlands Ranch
Among the 54,831 employed individuals in Highlands Ranch, private company employees (38,187 | 69.6%), not-for-profit organizations (3,751 | 6.8%), and self-employed (incorporated) (3,567 | 6.5%) make up the most common classes of employment.
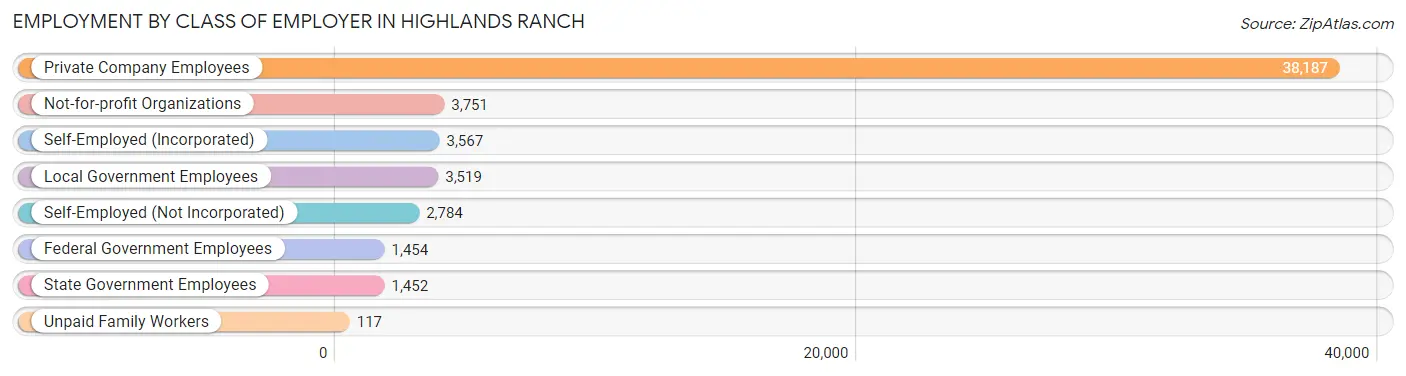
| Employer Class | # Employees | % Employees |
| Private Company Employees | 38,187 | 69.6% |
| Self-Employed (Incorporated) | 3,567 | 6.5% |
| Self-Employed (Not Incorporated) | 2,784 | 5.1% |
| Not-for-profit Organizations | 3,751 | 6.8% |
| Local Government Employees | 3,519 | 6.4% |
| State Government Employees | 1,452 | 2.6% |
| Federal Government Employees | 1,454 | 2.6% |
| Unpaid Family Workers | 117 | 0.2% |
| Total | 54,831 | 100.0% |
Employment Status by Age in Highlands Ranch
According to the labor force statistics for Highlands Ranch, out of the total population over 16 years of age (79,727), 72.1% or 57,483 individuals are in the labor force, with 3.4% or 1,954 of them unemployed. The age group with the highest labor force participation rate is 30 to 34 years, with 92.9% or 4,853 individuals in the labor force. Within the labor force, the 16 to 19 years age range has the highest percentage of unemployed individuals, with 15.6% or 498 of them being unemployed.
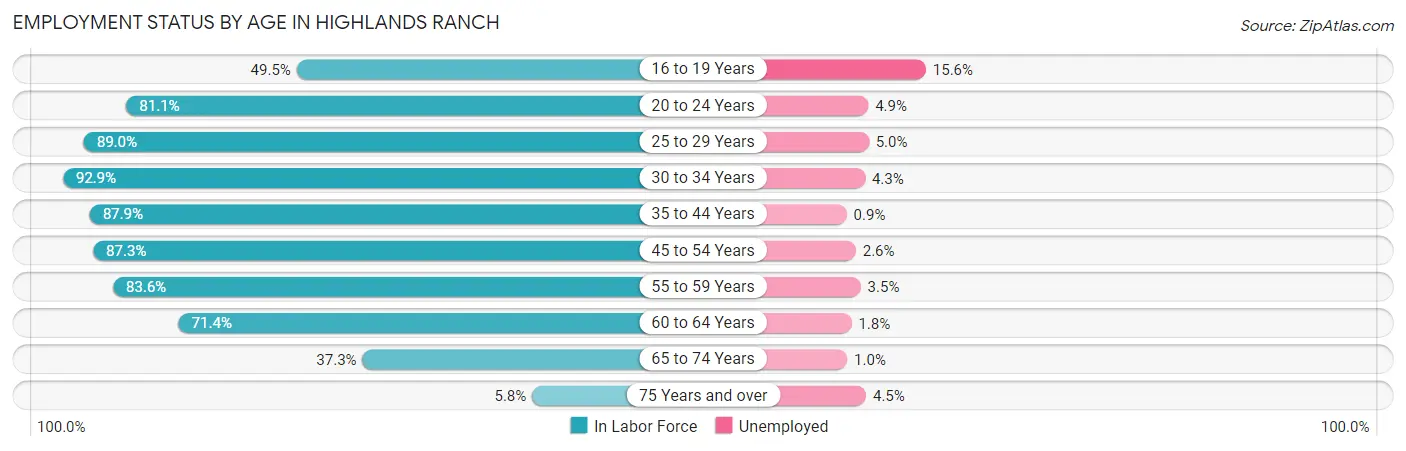
| Age Bracket | In Labor Force | Unemployed |
| 16 to 19 Years | 3,193 (49.5%) | 498 (15.6%) |
| 20 to 24 Years | 4,084 (81.1%) | 200 (4.9%) |
| 25 to 29 Years | 3,840 (89.0%) | 192 (5.0%) |
| 30 to 34 Years | 4,853 (92.9%) | 209 (4.3%) |
| 35 to 44 Years | 12,713 (87.9%) | 114 (0.9%) |
| 45 to 54 Years | 15,343 (87.3%) | 399 (2.6%) |
| 55 to 59 Years | 6,066 (83.6%) | 212 (3.5%) |
| 60 to 64 Years | 4,135 (71.4%) | 74 (1.8%) |
| 65 to 74 Years | 2,956 (37.3%) | 30 (1.0%) |
| 75 Years and over | 330 (5.8%) | 15 (4.5%) |
| Total | 57,483 (72.1%) | 1,954 (3.4%) |
Employment Status by Educational Attainment in Highlands Ranch
According to labor force statistics for Highlands Ranch, 86.0% of individuals (46,978) out of the total population between 25 and 64 years of age (54,625) are in the labor force, with 2.5% or 1,174 of them being unemployed. The group with the highest labor force participation rate are those with the educational attainment of bachelor's degree or higher, with 87.8% or 32,339 individuals in the labor force. Within the labor force, individuals with less than high school education have the highest percentage of unemployment, with 11.3% or 43 of them being unemployed.
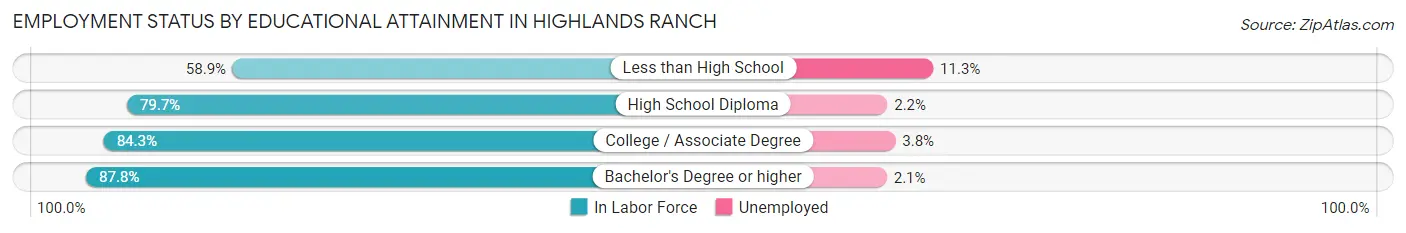
| Educational Attainment | In Labor Force | Unemployed |
| Less than High School | 379 (58.9%) | 73 (11.3%) |
| High School Diploma | 3,813 (79.7%) | 105 (2.2%) |
| College / Associate Degree | 10,424 (84.3%) | 470 (3.8%) |
| Bachelor's Degree or higher | 32,339 (87.8%) | 773 (2.1%) |
| Total | 46,978 (86.0%) | 1,366 (2.5%) |
Employment Occupations by Sex in Highlands Ranch
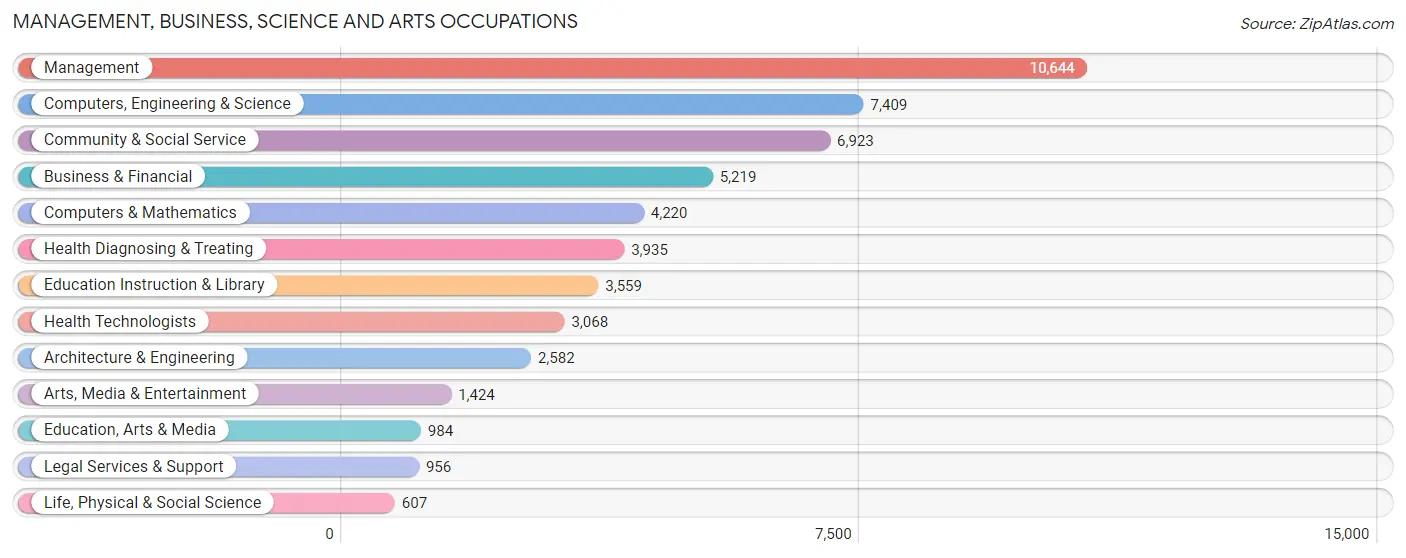
Management, Business, Science and Arts Occupations
The most common Management, Business, Science and Arts occupations in Highlands Ranch are Management (10,644 | 19.3%), Computers, Engineering & Science (7,409 | 13.5%), Community & Social Service (6,923 | 12.6%), Business & Financial (5,219 | 9.5%), and Computers & Mathematics (4,220 | 7.7%).
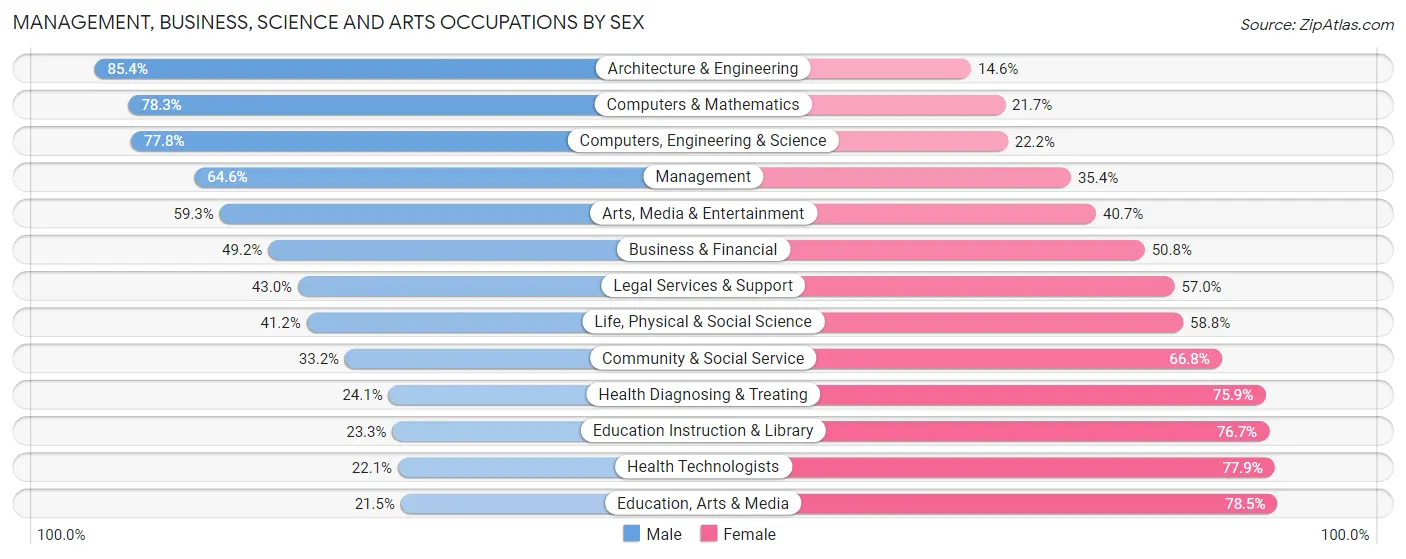
Management, Business, Science and Arts Occupations by Sex
Within the Management, Business, Science and Arts occupations in Highlands Ranch, the most male-oriented occupations are Architecture & Engineering (85.4%), Computers & Mathematics (78.3%), and Computers, Engineering & Science (77.8%), while the most female-oriented occupations are Education, Arts & Media (78.5%), Health Technologists (77.9%), and Education Instruction & Library (76.7%).
| Occupation | Male | Female |
| Management | 6,873 (64.6%) | 3,771 (35.4%) |
| Business & Financial | 2,567 (49.2%) | 2,652 (50.8%) |
| Computers, Engineering & Science | 5,761 (77.8%) | 1,648 (22.2%) |
| Computers & Mathematics | 3,306 (78.3%) | 914 (21.7%) |
| Architecture & Engineering | 2,205 (85.4%) | 377 (14.6%) |
| Life, Physical & Social Science | 250 (41.2%) | 357 (58.8%) |
| Community & Social Service | 2,297 (33.2%) | 4,626 (66.8%) |
| Education, Arts & Media | 212 (21.5%) | 772 (78.5%) |
| Legal Services & Support | 411 (43.0%) | 545 (57.0%) |
| Education Instruction & Library | 829 (23.3%) | 2,730 (76.7%) |
| Arts, Media & Entertainment | 845 (59.3%) | 579 (40.7%) |
| Health Diagnosing & Treating | 948 (24.1%) | 2,987 (75.9%) |
| Health Technologists | 679 (22.1%) | 2,389 (77.9%) |
| Total (Category) | 18,446 (54.0%) | 15,684 (46.0%) |
| Total (Overall) | 29,643 (53.8%) | 25,461 (46.2%) |
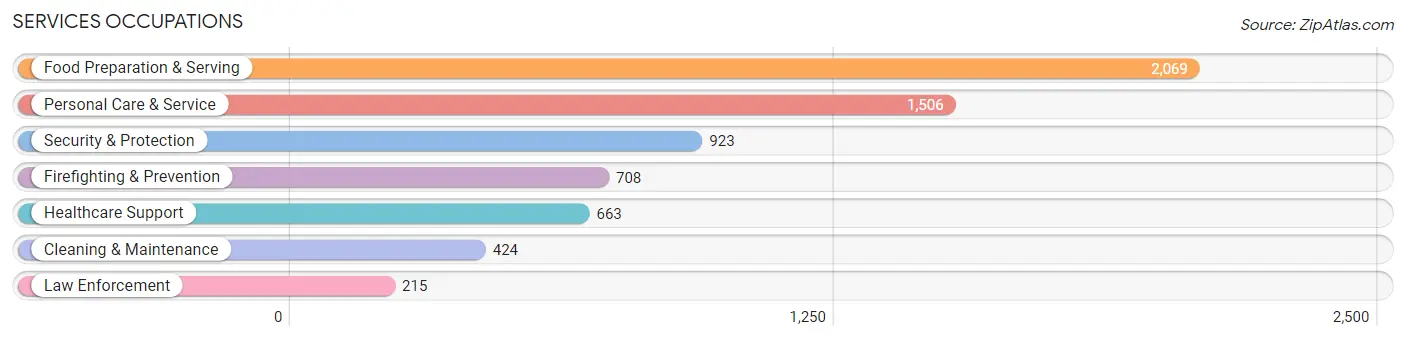
Services Occupations
The most common Services occupations in Highlands Ranch are Food Preparation & Serving (2,069 | 3.7%), Personal Care & Service (1,506 | 2.7%), Security & Protection (923 | 1.7%), Firefighting & Prevention (708 | 1.3%), and Healthcare Support (663 | 1.2%).
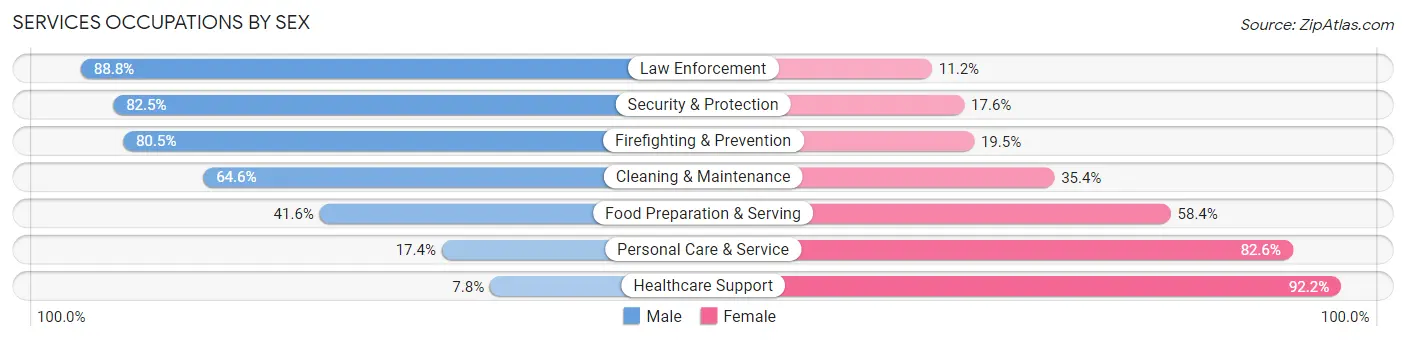
Services Occupations by Sex
Within the Services occupations in Highlands Ranch, the most male-oriented occupations are Law Enforcement (88.8%), Security & Protection (82.5%), and Firefighting & Prevention (80.5%), while the most female-oriented occupations are Healthcare Support (92.2%), Personal Care & Service (82.6%), and Food Preparation & Serving (58.4%).
| Occupation | Male | Female |
| Healthcare Support | 52 (7.8%) | 611 (92.2%) |
| Security & Protection | 761 (82.5%) | 162 (17.5%) |
| Firefighting & Prevention | 570 (80.5%) | 138 (19.5%) |
| Law Enforcement | 191 (88.8%) | 24 (11.2%) |
| Food Preparation & Serving | 860 (41.6%) | 1,209 (58.4%) |
| Cleaning & Maintenance | 274 (64.6%) | 150 (35.4%) |
| Personal Care & Service | 262 (17.4%) | 1,244 (82.6%) |
| Total (Category) | 2,209 (39.6%) | 3,376 (60.5%) |
| Total (Overall) | 29,643 (53.8%) | 25,461 (46.2%) |
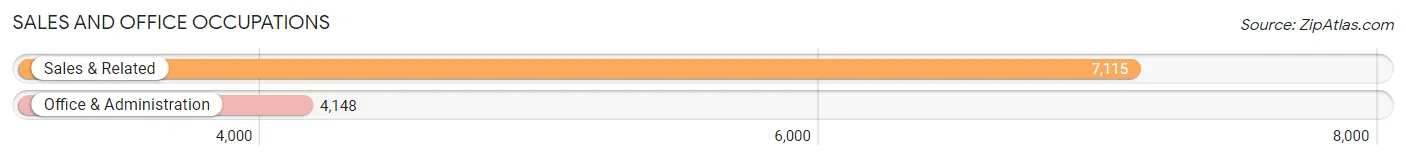
Sales and Office Occupations
The most common Sales and Office occupations in Highlands Ranch are Sales & Related (7,115 | 12.9%), and Office & Administration (4,148 | 7.5%).
Sales and Office Occupations by Sex
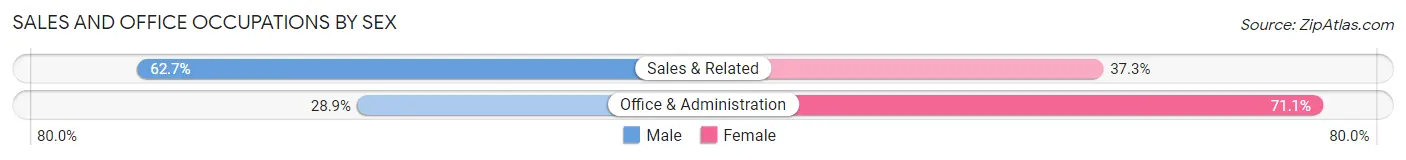
| Occupation | Male | Female |
| Sales & Related | 4,458 (62.7%) | 2,657 (37.3%) |
| Office & Administration | 1,198 (28.9%) | 2,950 (71.1%) |
| Total (Category) | 5,656 (50.2%) | 5,607 (49.8%) |
| Total (Overall) | 29,643 (53.8%) | 25,461 (46.2%) |
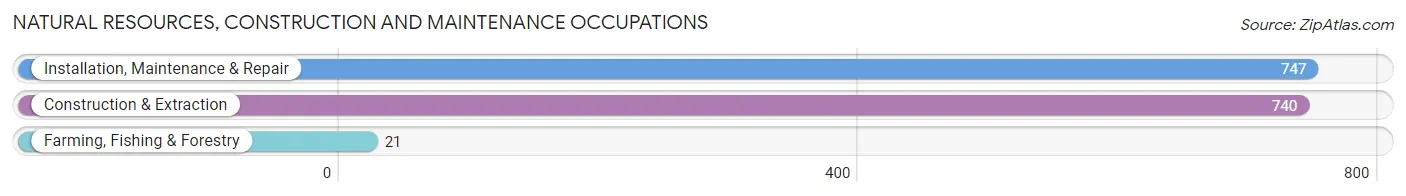
Natural Resources, Construction and Maintenance Occupations
The most common Natural Resources, Construction and Maintenance occupations in Highlands Ranch are Installation, Maintenance & Repair (747 | 1.4%), Construction & Extraction (740 | 1.3%), and Farming, Fishing & Forestry (21 | 0.0%).
Natural Resources, Construction and Maintenance Occupations by Sex
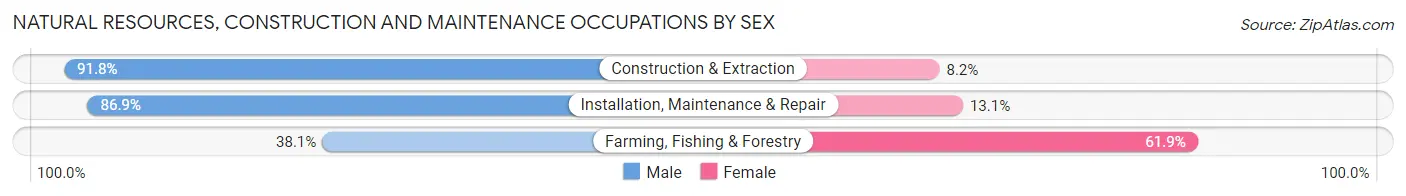
| Occupation | Male | Female |
| Farming, Fishing & Forestry | 8 (38.1%) | 13 (61.9%) |
| Construction & Extraction | 679 (91.8%) | 61 (8.2%) |
| Installation, Maintenance & Repair | 649 (86.9%) | 98 (13.1%) |
| Total (Category) | 1,336 (88.6%) | 172 (11.4%) |
| Total (Overall) | 29,643 (53.8%) | 25,461 (46.2%) |
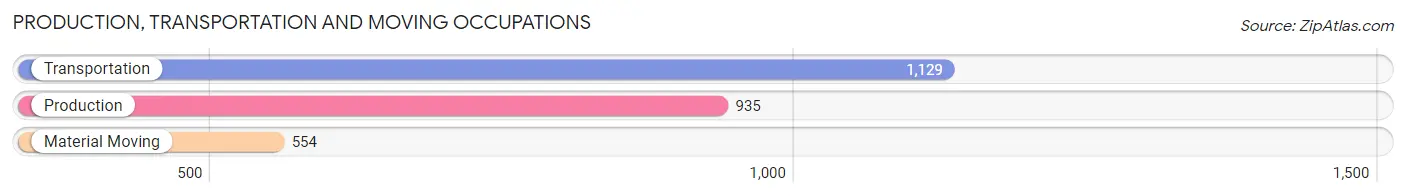
Production, Transportation and Moving Occupations
The most common Production, Transportation and Moving occupations in Highlands Ranch are Transportation (1,129 | 2.1%), Production (935 | 1.7%), and Material Moving (554 | 1.0%).
Production, Transportation and Moving Occupations by Sex
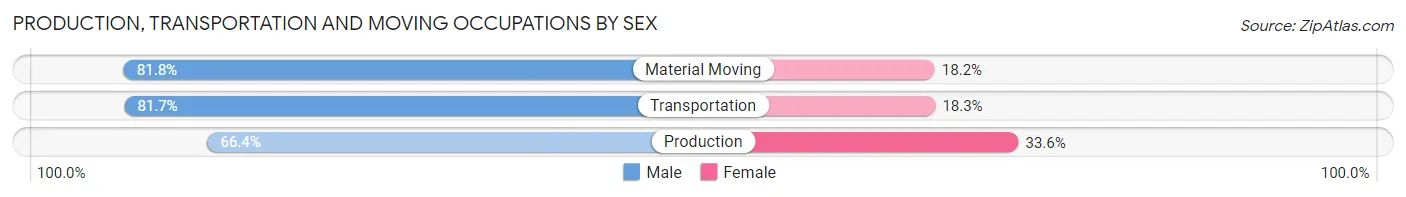
| Occupation | Male | Female |
| Production | 621 (66.4%) | 314 (33.6%) |
| Transportation | 922 (81.7%) | 207 (18.3%) |
| Material Moving | 453 (81.8%) | 101 (18.2%) |
| Total (Category) | 1,996 (76.2%) | 622 (23.8%) |
| Total (Overall) | 29,643 (53.8%) | 25,461 (46.2%) |
Employment Industries by Sex in Highlands Ranch
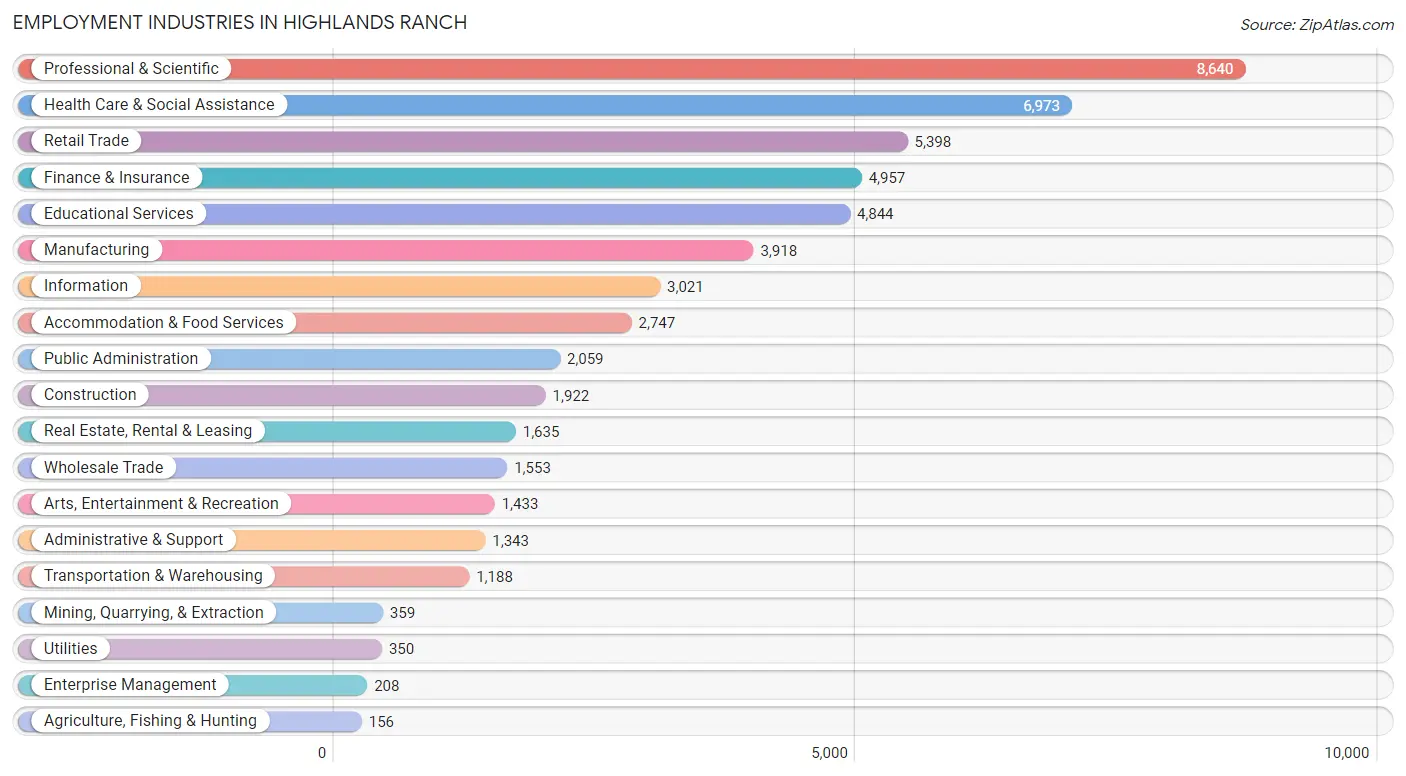
Employment Industries in Highlands Ranch
The major employment industries in Highlands Ranch include Professional & Scientific (8,640 | 15.7%), Health Care & Social Assistance (6,973 | 12.7%), Retail Trade (5,398 | 9.8%), Finance & Insurance (4,957 | 9.0%), and Educational Services (4,844 | 8.8%).
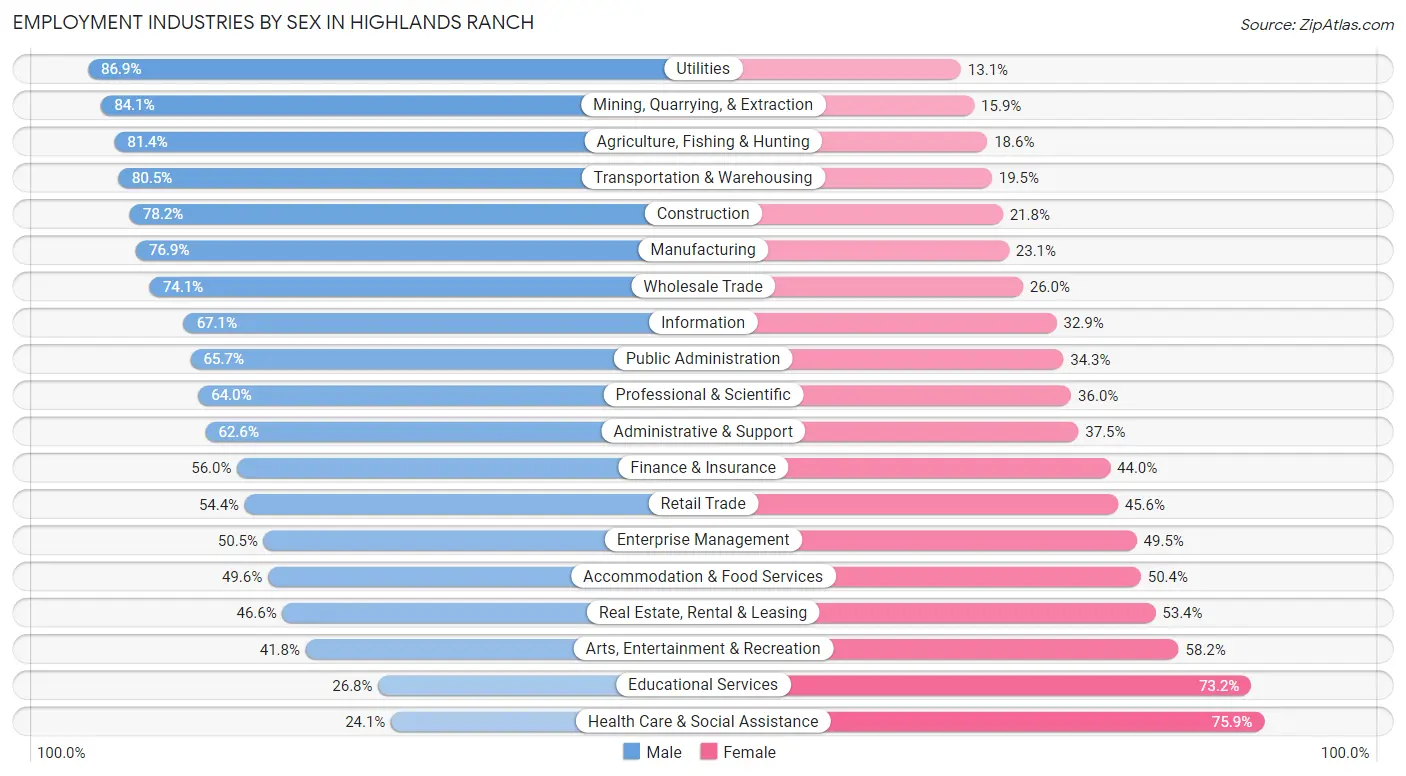
Employment Industries by Sex in Highlands Ranch
The Highlands Ranch industries that see more men than women are Utilities (86.9%), Mining, Quarrying, & Extraction (84.1%), and Agriculture, Fishing & Hunting (81.4%), whereas the industries that tend to have a higher number of women are Health Care & Social Assistance (75.9%), Educational Services (73.2%), and Arts, Entertainment & Recreation (58.2%).
| Industry | Male | Female |
| Agriculture, Fishing & Hunting | 127 (81.4%) | 29 (18.6%) |
| Mining, Quarrying, & Extraction | 302 (84.1%) | 57 (15.9%) |
| Construction | 1,503 (78.2%) | 419 (21.8%) |
| Manufacturing | 3,014 (76.9%) | 904 (23.1%) |
| Wholesale Trade | 1,150 (74.1%) | 403 (26.0%) |
| Retail Trade | 2,936 (54.4%) | 2,462 (45.6%) |
| Transportation & Warehousing | 956 (80.5%) | 232 (19.5%) |
| Utilities | 304 (86.9%) | 46 (13.1%) |
| Information | 2,026 (67.1%) | 995 (32.9%) |
| Finance & Insurance | 2,775 (56.0%) | 2,182 (44.0%) |
| Real Estate, Rental & Leasing | 762 (46.6%) | 873 (53.4%) |
| Professional & Scientific | 5,533 (64.0%) | 3,107 (36.0%) |
| Enterprise Management | 105 (50.5%) | 103 (49.5%) |
| Administrative & Support | 840 (62.5%) | 503 (37.4%) |
| Educational Services | 1,297 (26.8%) | 3,547 (73.2%) |
| Health Care & Social Assistance | 1,682 (24.1%) | 5,291 (75.9%) |
| Arts, Entertainment & Recreation | 599 (41.8%) | 834 (58.2%) |
| Accommodation & Food Services | 1,363 (49.6%) | 1,384 (50.4%) |
| Public Administration | 1,352 (65.7%) | 707 (34.3%) |
| Total | 29,643 (53.8%) | 25,461 (46.2%) |
Education in Highlands Ranch
School Enrollment in Highlands Ranch
The most common levels of schooling among the 27,821 students in Highlands Ranch are high school (7,930 | 28.5%), middle school (7,149 | 25.7%), and elementary school (5,044 | 18.1%).
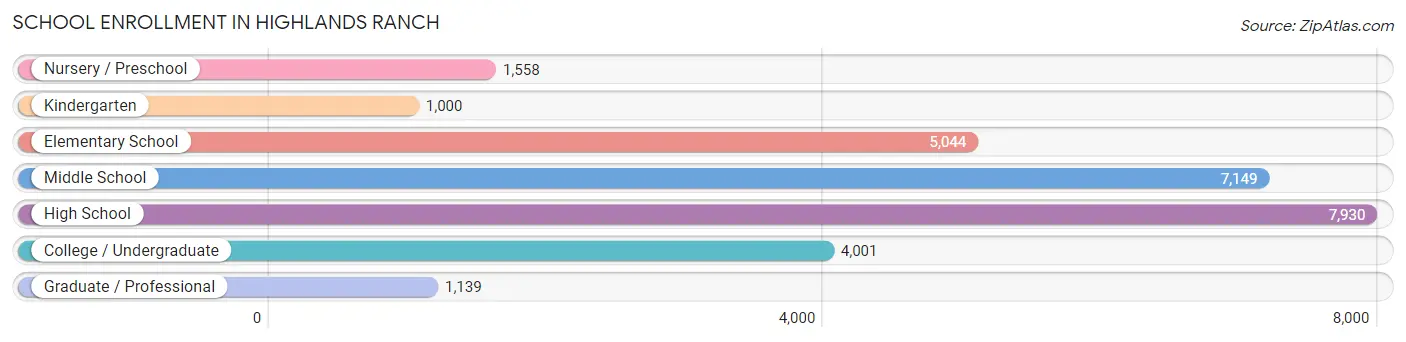
| School Level | # Students | % Students |
| Nursery / Preschool | 1,558 | 5.6% |
| Kindergarten | 1,000 | 3.6% |
| Elementary School | 5,044 | 18.1% |
| Middle School | 7,149 | 25.7% |
| High School | 7,930 | 28.5% |
| College / Undergraduate | 4,001 | 14.4% |
| Graduate / Professional | 1,139 | 4.1% |
| Total | 27,821 | 100.0% |
School Enrollment by Age by Funding Source in Highlands Ranch
Out of a total of 27,821 students who are enrolled in schools in Highlands Ranch, 4,424 (15.9%) attend a private institution, while the remaining 23,397 (84.1%) are enrolled in public schools. The age group of 3 to 4 year olds has the highest likelihood of being enrolled in private schools, with 563 (51.0% in the age bracket) enrolled. Conversely, the age group of 15 to 17 year olds has the lowest likelihood of being enrolled in a private school, with 4,965 (88.8% in the age bracket) attending a public institution.
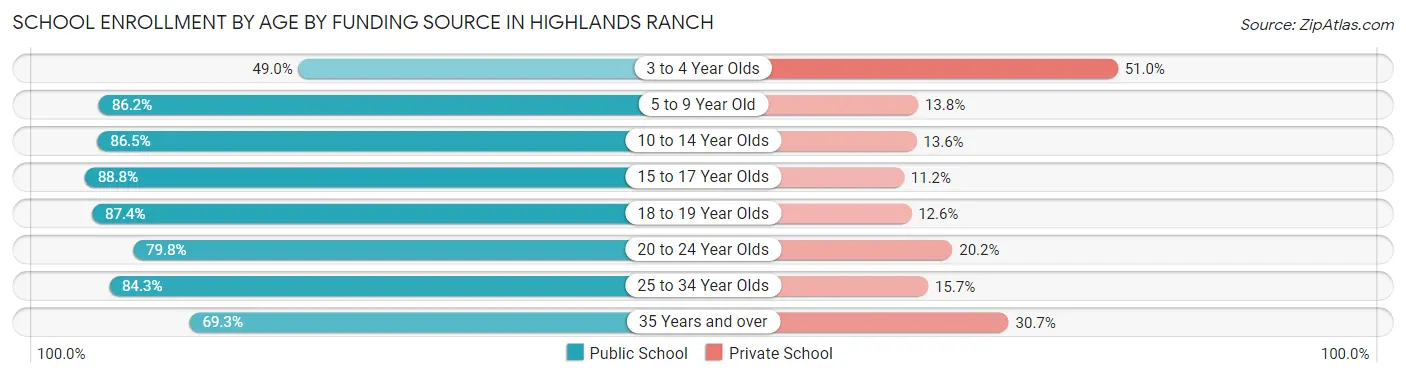
| Age Bracket | Public School | Private School |
| 3 to 4 Year Olds | 540 (49.0%) | 563 (51.0%) |
| 5 to 9 Year Old | 5,043 (86.2%) | 810 (13.8%) |
| 10 to 14 Year Olds | 7,473 (86.5%) | 1,171 (13.6%) |
| 15 to 17 Year Olds | 4,965 (88.8%) | 627 (11.2%) |
| 18 to 19 Year Olds | 2,127 (87.4%) | 306 (12.6%) |
| 20 to 24 Year Olds | 1,629 (79.8%) | 413 (20.2%) |
| 25 to 34 Year Olds | 740 (84.3%) | 138 (15.7%) |
| 35 Years and over | 884 (69.3%) | 392 (30.7%) |
| Total | 23,397 (84.1%) | 4,424 (15.9%) |
Educational Attainment by Field of Study in Highlands Ranch
Business (11,380 | 23.4%), engineering (5,742 | 11.8%), science & technology (4,355 | 9.0%), education (3,718 | 7.6%), and social sciences (3,653 | 7.5%) are the most common fields of study among 48,606 individuals in Highlands Ranch who have obtained a bachelor's degree or higher.
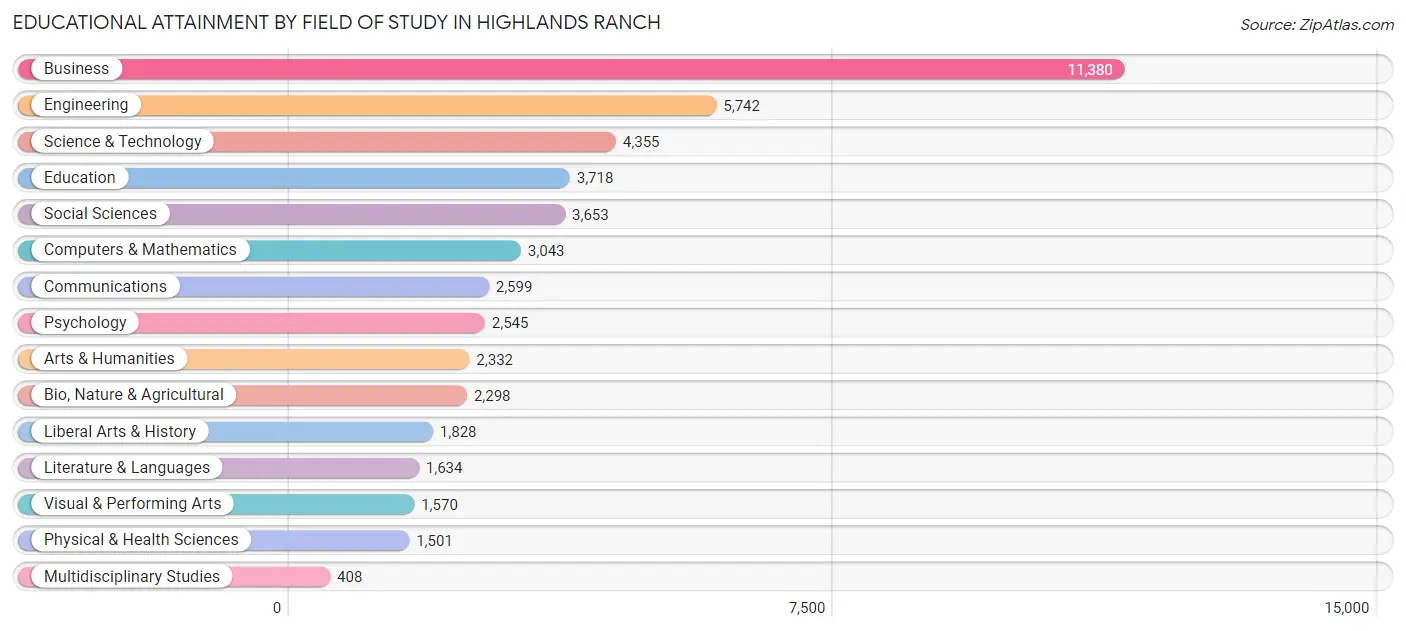
| Field of Study | # Graduates | % Graduates |
| Computers & Mathematics | 3,043 | 6.3% |
| Bio, Nature & Agricultural | 2,298 | 4.7% |
| Physical & Health Sciences | 1,501 | 3.1% |
| Psychology | 2,545 | 5.2% |
| Social Sciences | 3,653 | 7.5% |
| Engineering | 5,742 | 11.8% |
| Multidisciplinary Studies | 408 | 0.8% |
| Science & Technology | 4,355 | 9.0% |
| Business | 11,380 | 23.4% |
| Education | 3,718 | 7.6% |
| Literature & Languages | 1,634 | 3.4% |
| Liberal Arts & History | 1,828 | 3.8% |
| Visual & Performing Arts | 1,570 | 3.2% |
| Communications | 2,599 | 5.3% |
| Arts & Humanities | 2,332 | 4.8% |
| Total | 48,606 | 100.0% |
Transportation & Commute in Highlands Ranch
Vehicle Availability by Sex in Highlands Ranch
The most prevalent vehicle ownership categories in Highlands Ranch are males with 2 vehicles (14,513, accounting for 48.8%) and females with 2 vehicles (11,630, making up 57.8%).
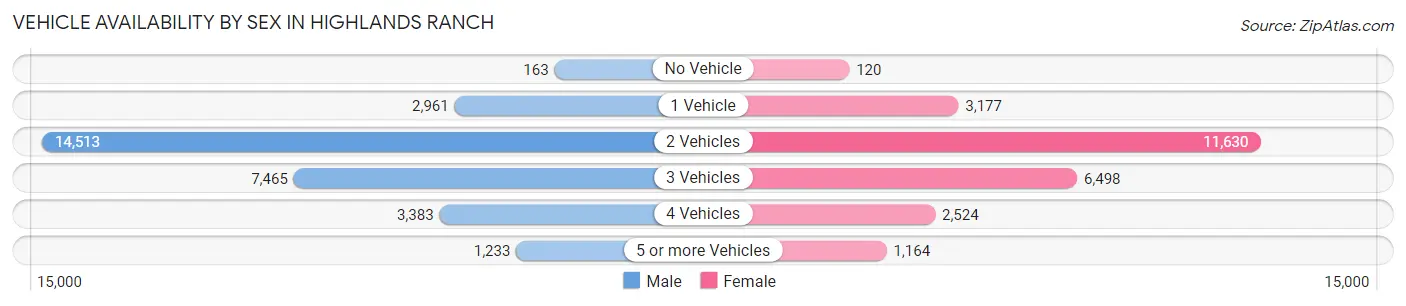
| Vehicles Available | Male | Female |
| No Vehicle | 163 (0.5%) | 120 (0.5%) |
| 1 Vehicle | 2,961 (10.0%) | 3,177 (12.7%) |
| 2 Vehicles | 14,513 (48.8%) | 11,630 (46.3%) |
| 3 Vehicles | 7,465 (25.1%) | 6,498 (25.9%) |
| 4 Vehicles | 3,383 (11.4%) | 2,524 (10.1%) |
| 5 or more Vehicles | 1,233 (4.2%) | 1,164 (4.6%) |
| Total | 29,718 (100.0%) | 25,113 (100.0%) |
Commute Time in Highlands Ranch
The most frequently occuring commute durations in Highlands Ranch are 20 to 24 minutes (7,272 commuters, 18.0%), 15 to 19 minutes (6,602 commuters, 16.3%), and 10 to 14 minutes (5,155 commuters, 12.7%).
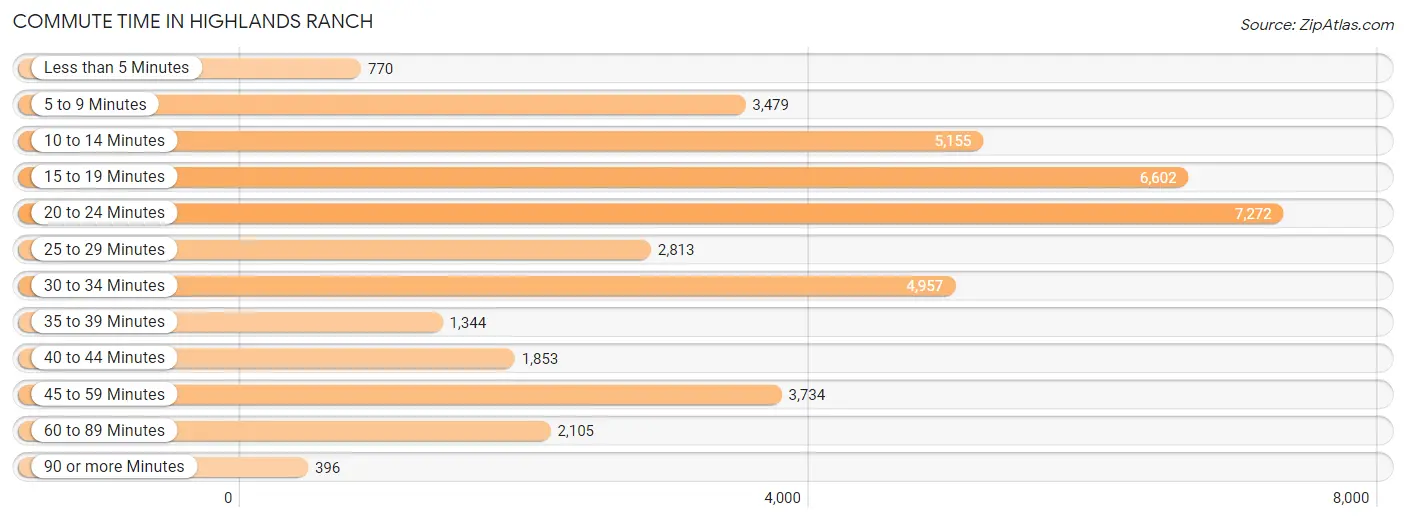
| Commute Time | # Commuters | % Commuters |
| Less than 5 Minutes | 770 | 1.9% |
| 5 to 9 Minutes | 3,479 | 8.6% |
| 10 to 14 Minutes | 5,155 | 12.7% |
| 15 to 19 Minutes | 6,602 | 16.3% |
| 20 to 24 Minutes | 7,272 | 18.0% |
| 25 to 29 Minutes | 2,813 | 7.0% |
| 30 to 34 Minutes | 4,957 | 12.2% |
| 35 to 39 Minutes | 1,344 | 3.3% |
| 40 to 44 Minutes | 1,853 | 4.6% |
| 45 to 59 Minutes | 3,734 | 9.2% |
| 60 to 89 Minutes | 2,105 | 5.2% |
| 90 or more Minutes | 396 | 1.0% |
Commute Time by Sex in Highlands Ranch
The most common commute times in Highlands Ranch are 20 to 24 minutes (4,021 commuters, 18.3%) for males and 15 to 19 minutes (3,253 commuters, 17.5%) for females.
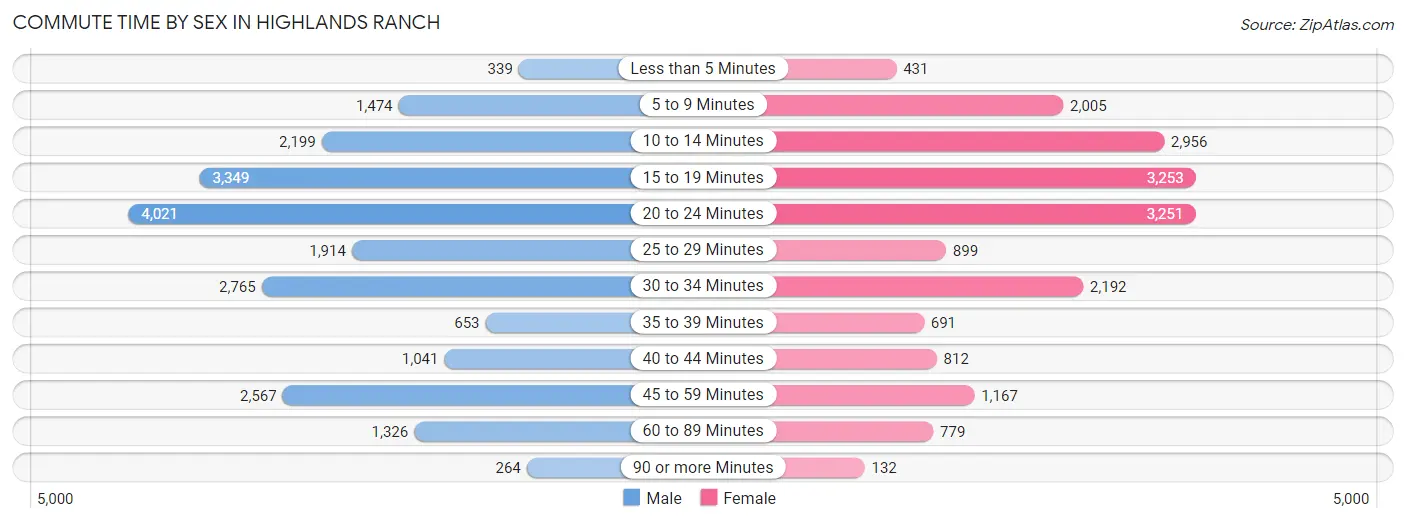
| Commute Time | Male | Female |
| Less than 5 Minutes | 339 (1.5%) | 431 (2.3%) |
| 5 to 9 Minutes | 1,474 (6.7%) | 2,005 (10.8%) |
| 10 to 14 Minutes | 2,199 (10.0%) | 2,956 (15.9%) |
| 15 to 19 Minutes | 3,349 (15.3%) | 3,253 (17.5%) |
| 20 to 24 Minutes | 4,021 (18.3%) | 3,251 (17.5%) |
| 25 to 29 Minutes | 1,914 (8.7%) | 899 (4.8%) |
| 30 to 34 Minutes | 2,765 (12.6%) | 2,192 (11.8%) |
| 35 to 39 Minutes | 653 (3.0%) | 691 (3.7%) |
| 40 to 44 Minutes | 1,041 (4.8%) | 812 (4.4%) |
| 45 to 59 Minutes | 2,567 (11.7%) | 1,167 (6.3%) |
| 60 to 89 Minutes | 1,326 (6.0%) | 779 (4.2%) |
| 90 or more Minutes | 264 (1.2%) | 132 (0.7%) |
Time of Departure to Work by Sex in Highlands Ranch
The most frequent times of departure to work in Highlands Ranch are 7:00 AM to 7:29 AM (3,823, 17.4%) for males and 7:00 AM to 7:29 AM (3,333, 17.9%) for females.
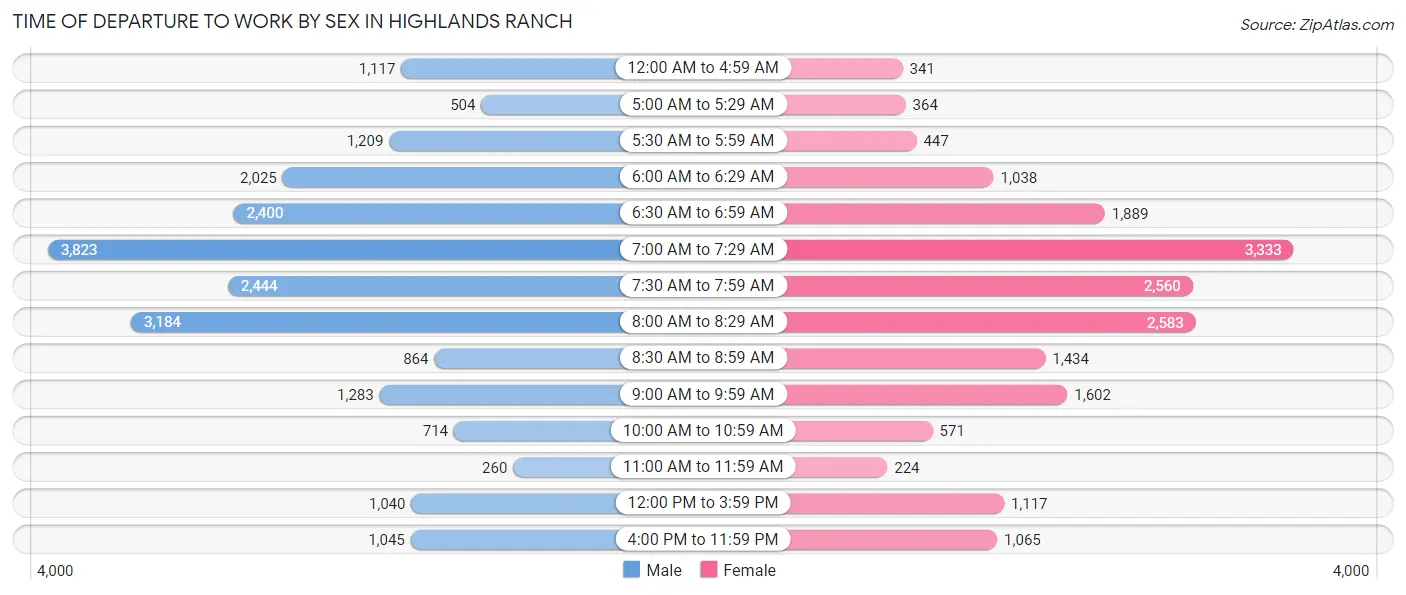
| Time of Departure | Male | Female |
| 12:00 AM to 4:59 AM | 1,117 (5.1%) | 341 (1.8%) |
| 5:00 AM to 5:29 AM | 504 (2.3%) | 364 (2.0%) |
| 5:30 AM to 5:59 AM | 1,209 (5.5%) | 447 (2.4%) |
| 6:00 AM to 6:29 AM | 2,025 (9.2%) | 1,038 (5.6%) |
| 6:30 AM to 6:59 AM | 2,400 (11.0%) | 1,889 (10.2%) |
| 7:00 AM to 7:29 AM | 3,823 (17.4%) | 3,333 (17.9%) |
| 7:30 AM to 7:59 AM | 2,444 (11.2%) | 2,560 (13.8%) |
| 8:00 AM to 8:29 AM | 3,184 (14.5%) | 2,583 (13.9%) |
| 8:30 AM to 8:59 AM | 864 (3.9%) | 1,434 (7.7%) |
| 9:00 AM to 9:59 AM | 1,283 (5.9%) | 1,602 (8.6%) |
| 10:00 AM to 10:59 AM | 714 (3.3%) | 571 (3.1%) |
| 11:00 AM to 11:59 AM | 260 (1.2%) | 224 (1.2%) |
| 12:00 PM to 3:59 PM | 1,040 (4.8%) | 1,117 (6.0%) |
| 4:00 PM to 11:59 PM | 1,045 (4.8%) | 1,065 (5.7%) |
| Total | 21,912 (100.0%) | 18,568 (100.0%) |
Housing Occupancy in Highlands Ranch
Occupancy by Ownership in Highlands Ranch
Of the total 37,583 dwellings in Highlands Ranch, owner-occupied units account for 29,837 (79.4%), while renter-occupied units make up 7,746 (20.6%).
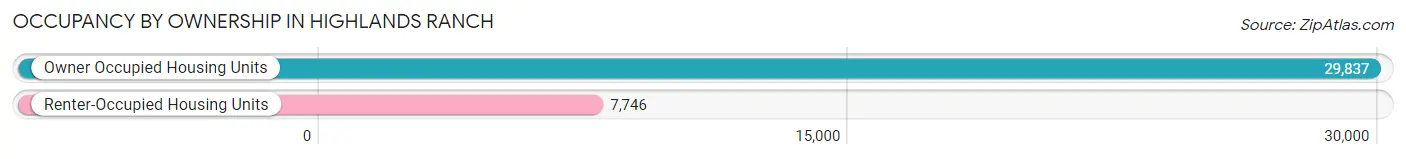
| Occupancy | # Housing Units | % Housing Units |
| Owner Occupied Housing Units | 29,837 | 79.4% |
| Renter-Occupied Housing Units | 7,746 | 20.6% |
| Total Occupied Housing Units | 37,583 | 100.0% |
Occupancy by Household Size in Highlands Ranch
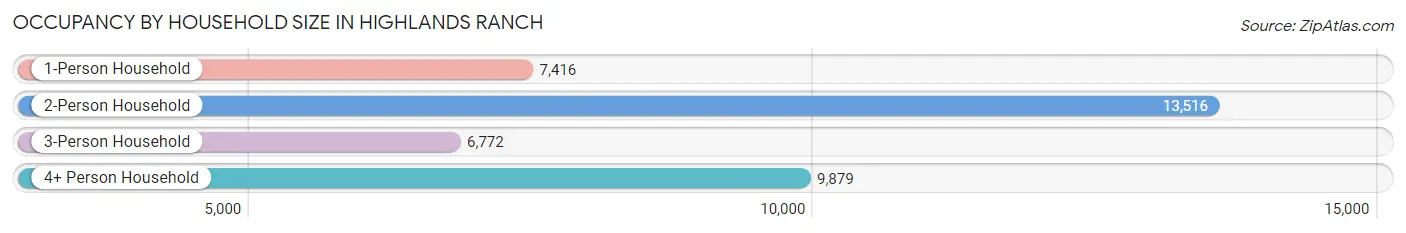
| Household Size | # Housing Units | % Housing Units |
| 1-Person Household | 7,416 | 19.7% |
| 2-Person Household | 13,516 | 36.0% |
| 3-Person Household | 6,772 | 18.0% |
| 4+ Person Household | 9,879 | 26.3% |
| Total Housing Units | 37,583 | 100.0% |
Occupancy by Ownership by Household Size in Highlands Ranch
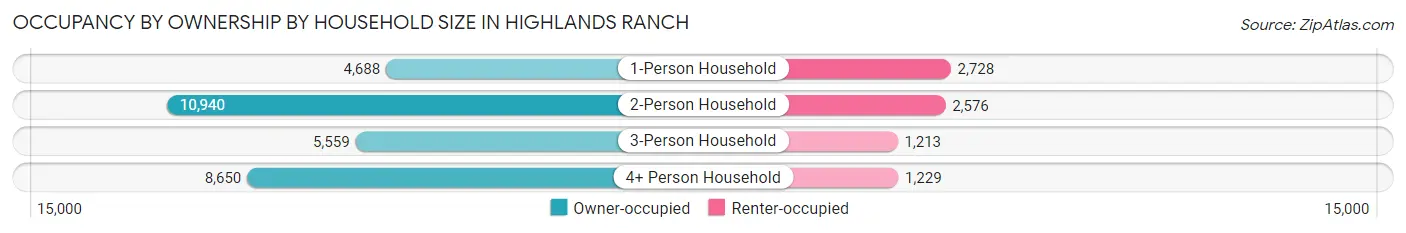
| Household Size | Owner-occupied | Renter-occupied |
| 1-Person Household | 4,688 (63.2%) | 2,728 (36.8%) |
| 2-Person Household | 10,940 (80.9%) | 2,576 (19.1%) |
| 3-Person Household | 5,559 (82.1%) | 1,213 (17.9%) |
| 4+ Person Household | 8,650 (87.6%) | 1,229 (12.4%) |
| Total Housing Units | 29,837 (79.4%) | 7,746 (20.6%) |
Occupancy by Educational Attainment in Highlands Ranch
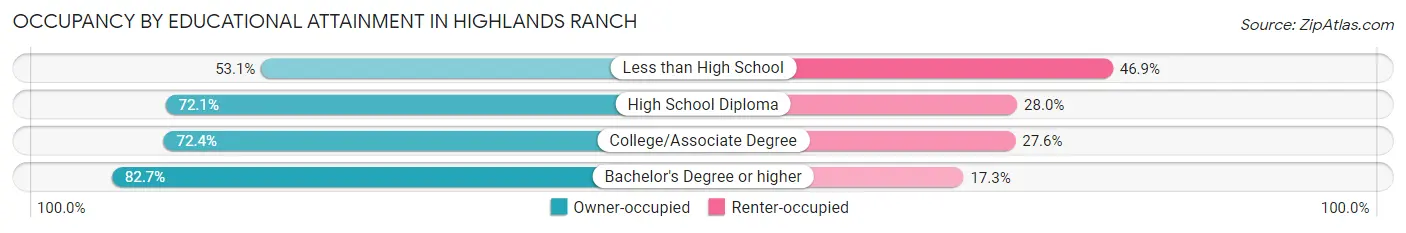
| Household Size | Owner-occupied | Renter-occupied |
| Less than High School | 129 (53.1%) | 114 (46.9%) |
| High School Diploma | 1,629 (72.1%) | 632 (28.0%) |
| College/Associate Degree | 6,545 (72.4%) | 2,492 (27.6%) |
| Bachelor's Degree or higher | 21,534 (82.7%) | 4,508 (17.3%) |
Occupancy by Age of Householder in Highlands Ranch
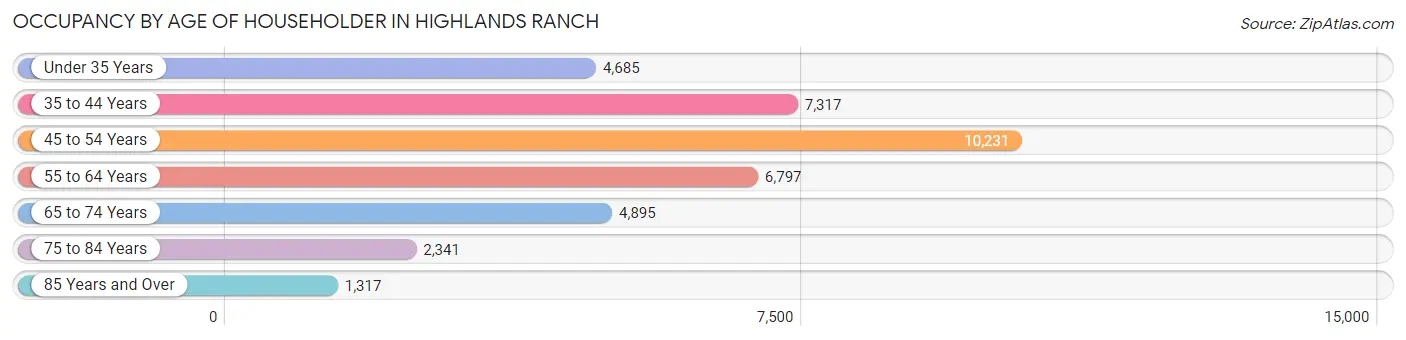
| Age Bracket | # Households | % Households |
| Under 35 Years | 4,685 | 12.5% |
| 35 to 44 Years | 7,317 | 19.5% |
| 45 to 54 Years | 10,231 | 27.2% |
| 55 to 64 Years | 6,797 | 18.1% |
| 65 to 74 Years | 4,895 | 13.0% |
| 75 to 84 Years | 2,341 | 6.2% |
| 85 Years and Over | 1,317 | 3.5% |
| Total | 37,583 | 100.0% |
Housing Finances in Highlands Ranch
Median Income by Occupancy in Highlands Ranch
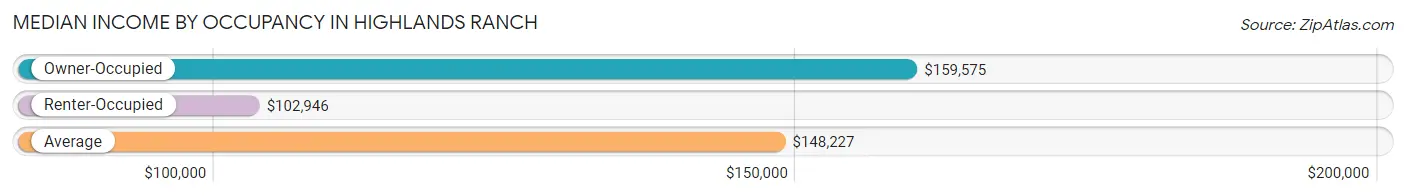
| Occupancy Type | # Households | Median Income |
| Owner-Occupied | 29,837 (79.4%) | $159,575 |
| Renter-Occupied | 7,746 (20.6%) | $102,946 |
| Average | 37,583 (100.0%) | $148,227 |
Occupancy by Householder Income Bracket in Highlands Ranch
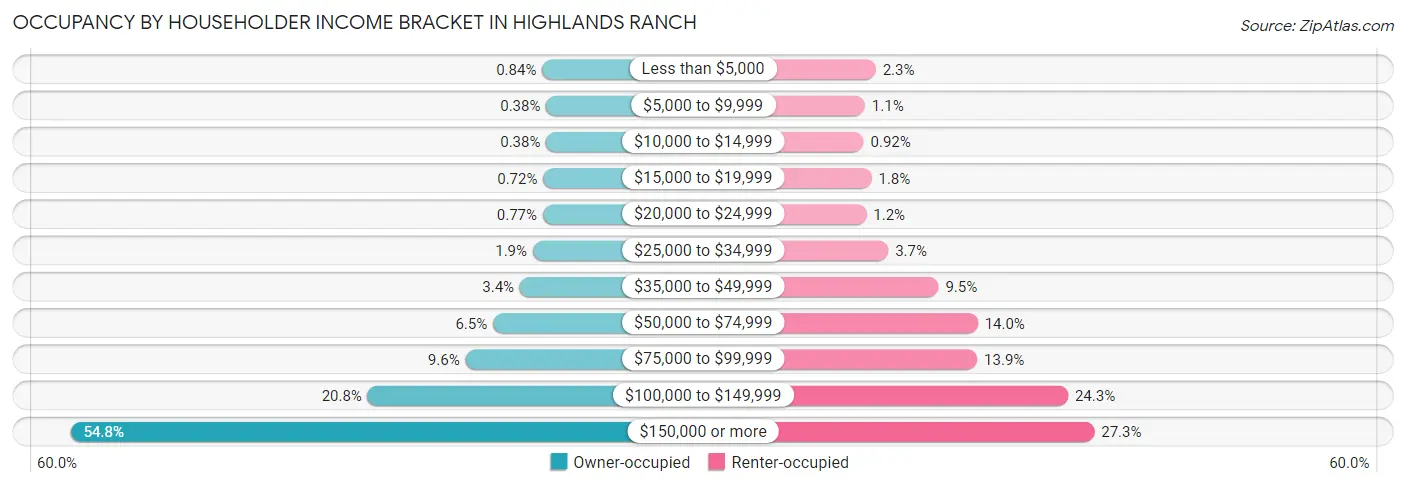
| Income Bracket | Owner-occupied | Renter-occupied |
| Less than $5,000 | 251 (0.8%) | 179 (2.3%) |
| $5,000 to $9,999 | 114 (0.4%) | 83 (1.1%) |
| $10,000 to $14,999 | 113 (0.4%) | 71 (0.9%) |
| $15,000 to $19,999 | 214 (0.7%) | 142 (1.8%) |
| $20,000 to $24,999 | 230 (0.8%) | 95 (1.2%) |
| $25,000 to $34,999 | 571 (1.9%) | 289 (3.7%) |
| $35,000 to $49,999 | 1,010 (3.4%) | 734 (9.5%) |
| $50,000 to $74,999 | 1,926 (6.5%) | 1,081 (14.0%) |
| $75,000 to $99,999 | 2,867 (9.6%) | 1,077 (13.9%) |
| $100,000 to $149,999 | 6,204 (20.8%) | 1,881 (24.3%) |
| $150,000 or more | 16,337 (54.7%) | 2,114 (27.3%) |
| Total | 29,837 (100.0%) | 7,746 (100.0%) |
Monthly Housing Cost Tiers in Highlands Ranch
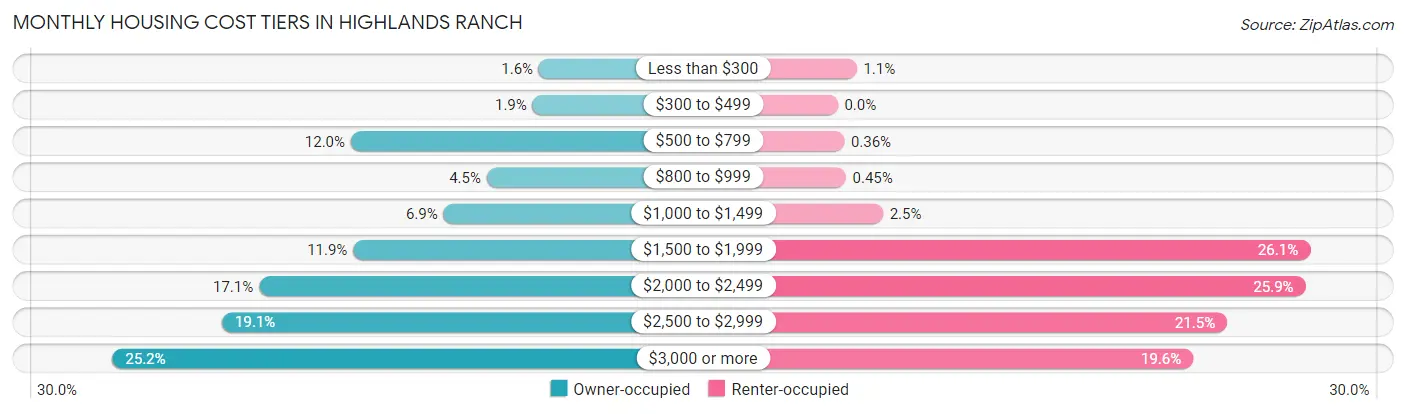
| Monthly Cost | Owner-occupied | Renter-occupied |
| Less than $300 | 473 (1.6%) | 81 (1.1%) |
| $300 to $499 | 579 (1.9%) | 0 (0.0%) |
| $500 to $799 | 3,575 (12.0%) | 28 (0.4%) |
| $800 to $999 | 1,335 (4.5%) | 35 (0.4%) |
| $1,000 to $1,499 | 2,046 (6.9%) | 194 (2.5%) |
| $1,500 to $1,999 | 3,537 (11.8%) | 2,022 (26.1%) |
| $2,000 to $2,499 | 5,088 (17.1%) | 2,002 (25.9%) |
| $2,500 to $2,999 | 5,699 (19.1%) | 1,667 (21.5%) |
| $3,000 or more | 7,505 (25.2%) | 1,521 (19.6%) |
| Total | 29,837 (100.0%) | 7,746 (100.0%) |
Physical Housing Characteristics in Highlands Ranch
Housing Structures in Highlands Ranch
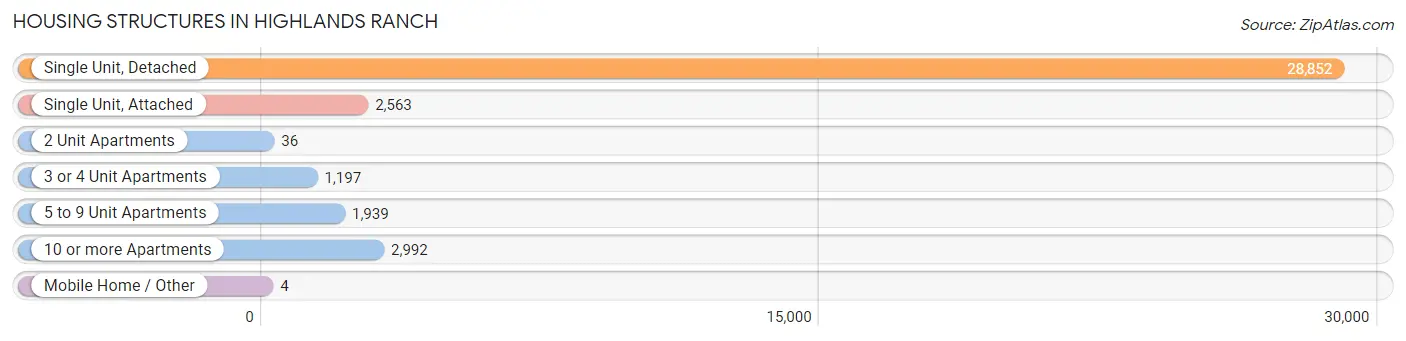
| Structure Type | # Housing Units | % Housing Units |
| Single Unit, Detached | 28,852 | 76.8% |
| Single Unit, Attached | 2,563 | 6.8% |
| 2 Unit Apartments | 36 | 0.1% |
| 3 or 4 Unit Apartments | 1,197 | 3.2% |
| 5 to 9 Unit Apartments | 1,939 | 5.2% |
| 10 or more Apartments | 2,992 | 8.0% |
| Mobile Home / Other | 4 | 0.0% |
| Total | 37,583 | 100.0% |
Housing Structures by Occupancy in Highlands Ranch
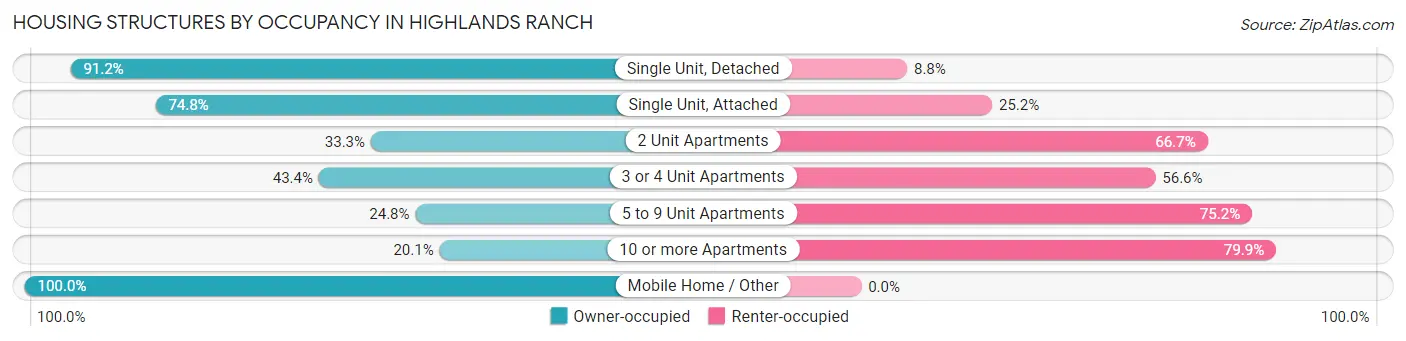
| Structure Type | Owner-occupied | Renter-occupied |
| Single Unit, Detached | 26,303 (91.2%) | 2,549 (8.8%) |
| Single Unit, Attached | 1,917 (74.8%) | 646 (25.2%) |
| 2 Unit Apartments | 12 (33.3%) | 24 (66.7%) |
| 3 or 4 Unit Apartments | 519 (43.4%) | 678 (56.6%) |
| 5 to 9 Unit Apartments | 480 (24.8%) | 1,459 (75.2%) |
| 10 or more Apartments | 602 (20.1%) | 2,390 (79.9%) |
| Mobile Home / Other | 4 (100.0%) | 0 (0.0%) |
| Total | 29,837 (79.4%) | 7,746 (20.6%) |
Housing Structures by Number of Rooms in Highlands Ranch
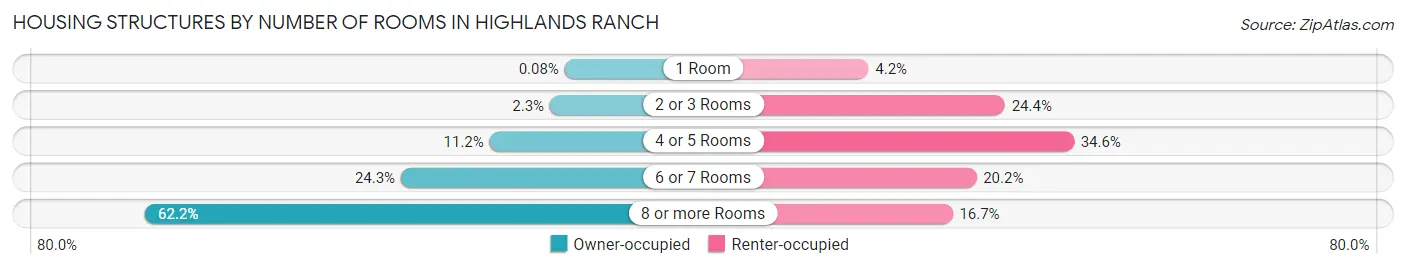
| Number of Rooms | Owner-occupied | Renter-occupied |
| 1 Room | 24 (0.1%) | 326 (4.2%) |
| 2 or 3 Rooms | 674 (2.3%) | 1,889 (24.4%) |
| 4 or 5 Rooms | 3,338 (11.2%) | 2,679 (34.6%) |
| 6 or 7 Rooms | 7,253 (24.3%) | 1,562 (20.2%) |
| 8 or more Rooms | 18,548 (62.2%) | 1,290 (16.7%) |
| Total | 29,837 (100.0%) | 7,746 (100.0%) |
Housing Structure by Heating Type in Highlands Ranch
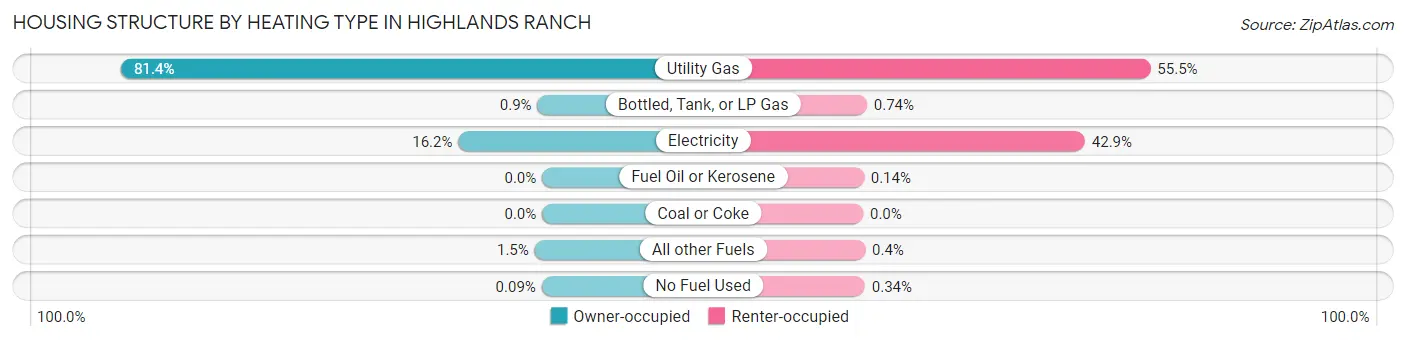
| Heating Type | Owner-occupied | Renter-occupied |
| Utility Gas | 24,277 (81.4%) | 4,301 (55.5%) |
| Bottled, Tank, or LP Gas | 269 (0.9%) | 57 (0.7%) |
| Electricity | 4,831 (16.2%) | 3,320 (42.9%) |
| Fuel Oil or Kerosene | 0 (0.0%) | 11 (0.1%) |
| Coal or Coke | 0 (0.0%) | 0 (0.0%) |
| All other Fuels | 434 (1.5%) | 31 (0.4%) |
| No Fuel Used | 26 (0.1%) | 26 (0.3%) |
| Total | 29,837 (100.0%) | 7,746 (100.0%) |
Household Vehicle Usage in Highlands Ranch
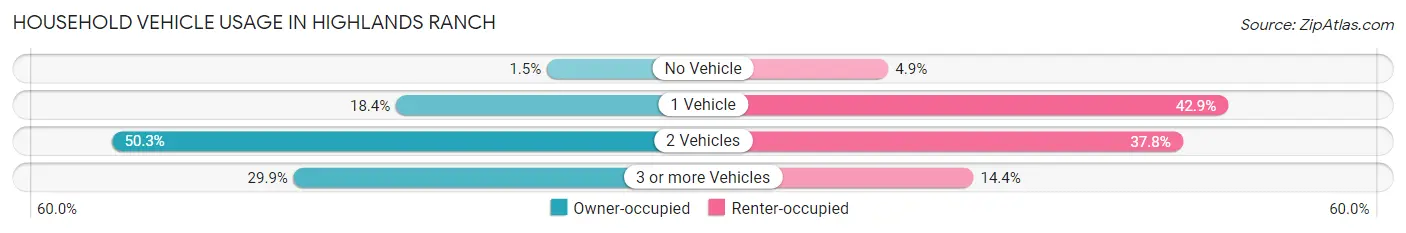
| Vehicles per Household | Owner-occupied | Renter-occupied |
| No Vehicle | 441 (1.5%) | 377 (4.9%) |
| 1 Vehicle | 5,487 (18.4%) | 3,324 (42.9%) |
| 2 Vehicles | 15,000 (50.3%) | 2,929 (37.8%) |
| 3 or more Vehicles | 8,909 (29.9%) | 1,116 (14.4%) |
| Total | 29,837 (100.0%) | 7,746 (100.0%) |
Real Estate & Mortgages in Highlands Ranch
Real Estate and Mortgage Overview in Highlands Ranch
| Characteristic | Without Mortgage | With Mortgage |
| Housing Units | 6,631 | 23,206 |
| Median Property Value | $628,000 | $640,000 |
| Median Household Income | $120,989 | $13,776 |
| Monthly Housing Costs | $704 | $7,493 |
| Real Estate Taxes | $3,340 | $256 |
Property Value by Mortgage Status in Highlands Ranch
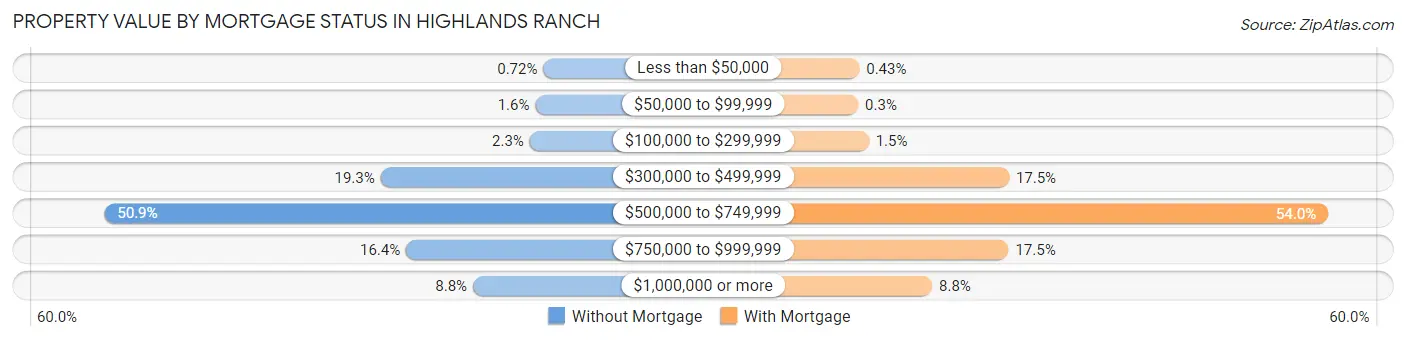
| Property Value | Without Mortgage | With Mortgage |
| Less than $50,000 | 48 (0.7%) | 99 (0.4%) |
| $50,000 to $99,999 | 108 (1.6%) | 70 (0.3%) |
| $100,000 to $299,999 | 151 (2.3%) | 348 (1.5%) |
| $300,000 to $499,999 | 1,281 (19.3%) | 4,068 (17.5%) |
| $500,000 to $749,999 | 3,374 (50.9%) | 12,534 (54.0%) |
| $750,000 to $999,999 | 1,088 (16.4%) | 4,056 (17.5%) |
| $1,000,000 or more | 581 (8.8%) | 2,031 (8.7%) |
| Total | 6,631 (100.0%) | 23,206 (100.0%) |
Household Income by Mortgage Status in Highlands Ranch
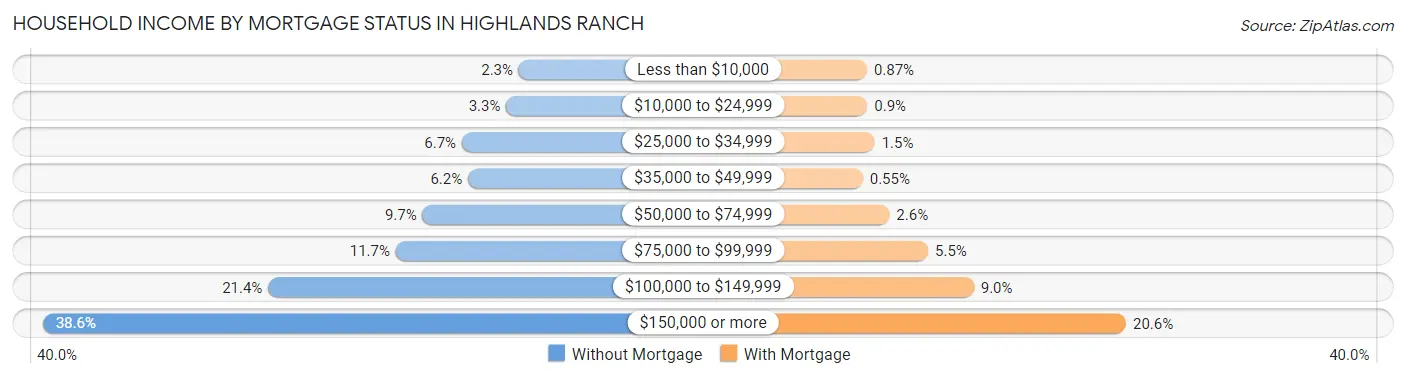
| Household Income | Without Mortgage | With Mortgage |
| Less than $10,000 | 155 (2.3%) | 201 (0.9%) |
| $10,000 to $24,999 | 219 (3.3%) | 210 (0.9%) |
| $25,000 to $34,999 | 443 (6.7%) | 338 (1.5%) |
| $35,000 to $49,999 | 412 (6.2%) | 128 (0.5%) |
| $50,000 to $74,999 | 642 (9.7%) | 598 (2.6%) |
| $75,000 to $99,999 | 777 (11.7%) | 1,284 (5.5%) |
| $100,000 to $149,999 | 1,422 (21.4%) | 2,090 (9.0%) |
| $150,000 or more | 2,561 (38.6%) | 4,782 (20.6%) |
| Total | 6,631 (100.0%) | 23,206 (100.0%) |
Property Value to Household Income Ratio in Highlands Ranch
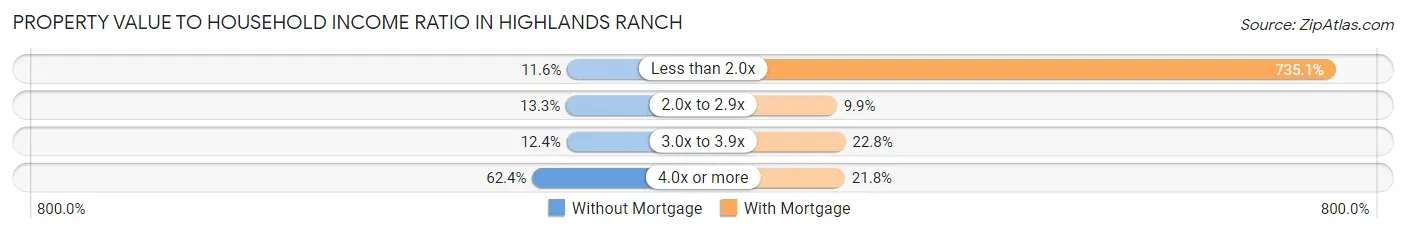
| Value-to-Income Ratio | Without Mortgage | With Mortgage |
| Less than 2.0x | 768 (11.6%) | 170,581 (735.1%) |
| 2.0x to 2.9x | 880 (13.3%) | 2,289 (9.9%) |
| 3.0x to 3.9x | 823 (12.4%) | 5,279 (22.8%) |
| 4.0x or more | 4,139 (62.4%) | 5,052 (21.8%) |
| Total | 6,631 (100.0%) | 23,206 (100.0%) |
Real Estate Taxes by Mortgage Status in Highlands Ranch
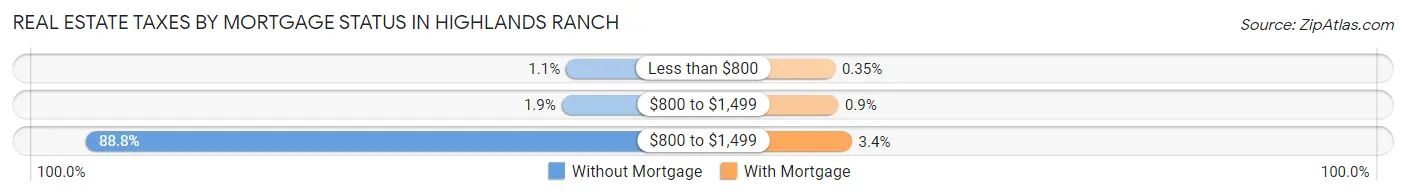
| Property Taxes | Without Mortgage | With Mortgage |
| Less than $800 | 74 (1.1%) | 81 (0.4%) |
| $800 to $1,499 | 127 (1.9%) | 208 (0.9%) |
| $800 to $1,499 | 5,885 (88.7%) | 788 (3.4%) |
| Total | 6,631 (100.0%) | 23,206 (100.0%) |
Health & Disability in Highlands Ranch
Health Insurance Coverage by Age in Highlands Ranch
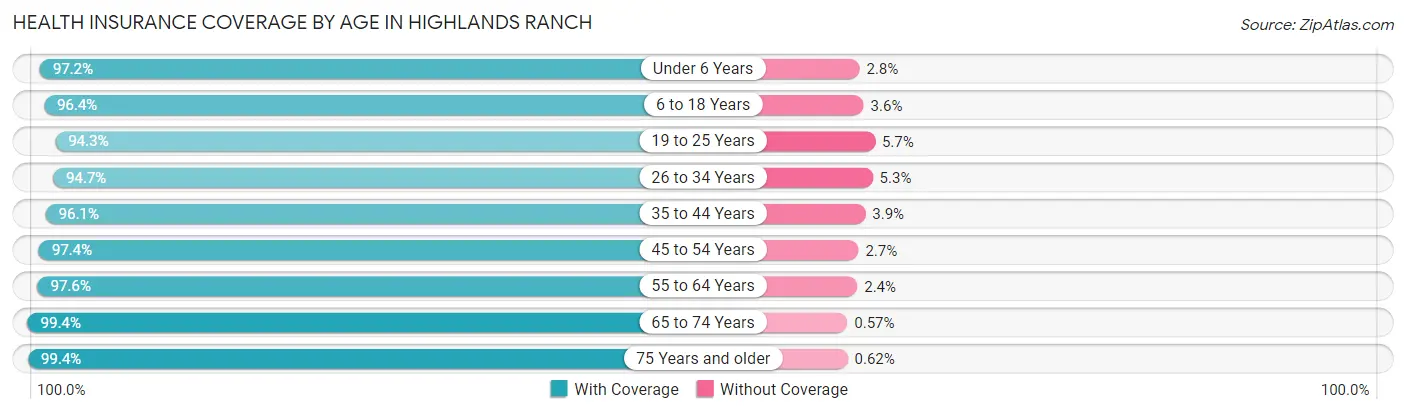
| Age Bracket | With Coverage | Without Coverage |
| Under 6 Years | 5,572 (97.2%) | 163 (2.8%) |
| 6 to 18 Years | 20,650 (96.4%) | 774 (3.6%) |
| 19 to 25 Years | 6,445 (94.3%) | 391 (5.7%) |
| 26 to 34 Years | 8,329 (94.7%) | 465 (5.3%) |
| 35 to 44 Years | 13,547 (96.1%) | 552 (3.9%) |
| 45 to 54 Years | 17,008 (97.4%) | 463 (2.6%) |
| 55 to 64 Years | 12,731 (97.6%) | 316 (2.4%) |
| 65 to 74 Years | 7,871 (99.4%) | 45 (0.6%) |
| 75 Years and older | 5,573 (99.4%) | 35 (0.6%) |
| Total | 97,726 (96.8%) | 3,204 (3.2%) |
Health Insurance Coverage by Citizenship Status in Highlands Ranch
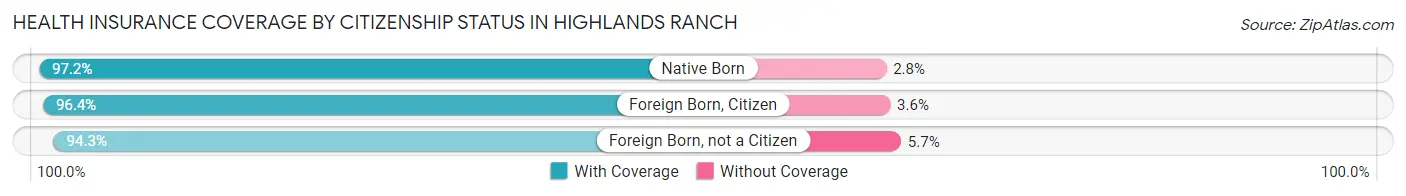
| Citizenship Status | With Coverage | Without Coverage |
| Native Born | 5,572 (97.2%) | 163 (2.8%) |
| Foreign Born, Citizen | 20,650 (96.4%) | 774 (3.6%) |
| Foreign Born, not a Citizen | 6,445 (94.3%) | 391 (5.7%) |
Health Insurance Coverage by Household Income in Highlands Ranch
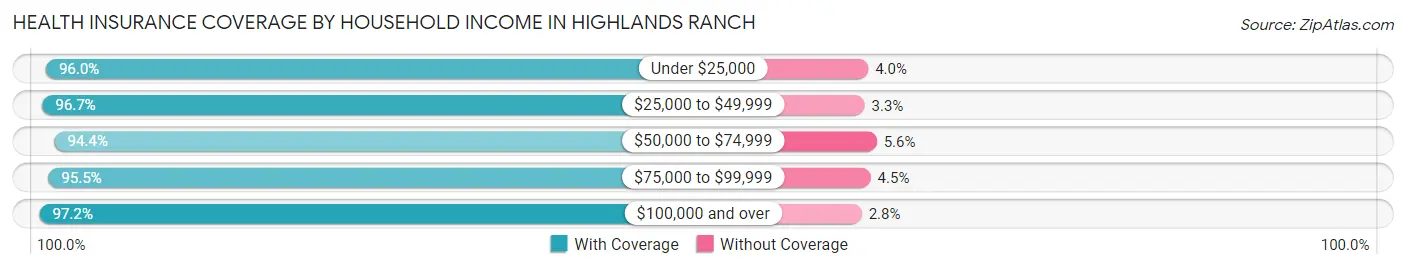
| Household Income | With Coverage | Without Coverage |
| Under $25,000 | 1,941 (96.0%) | 81 (4.0%) |
| $25,000 to $49,999 | 3,844 (96.7%) | 133 (3.3%) |
| $50,000 to $74,999 | 5,793 (94.4%) | 344 (5.6%) |
| $75,000 to $99,999 | 8,994 (95.5%) | 421 (4.5%) |
| $100,000 and over | 77,148 (97.2%) | 2,225 (2.8%) |
Public vs Private Health Insurance Coverage by Age in Highlands Ranch
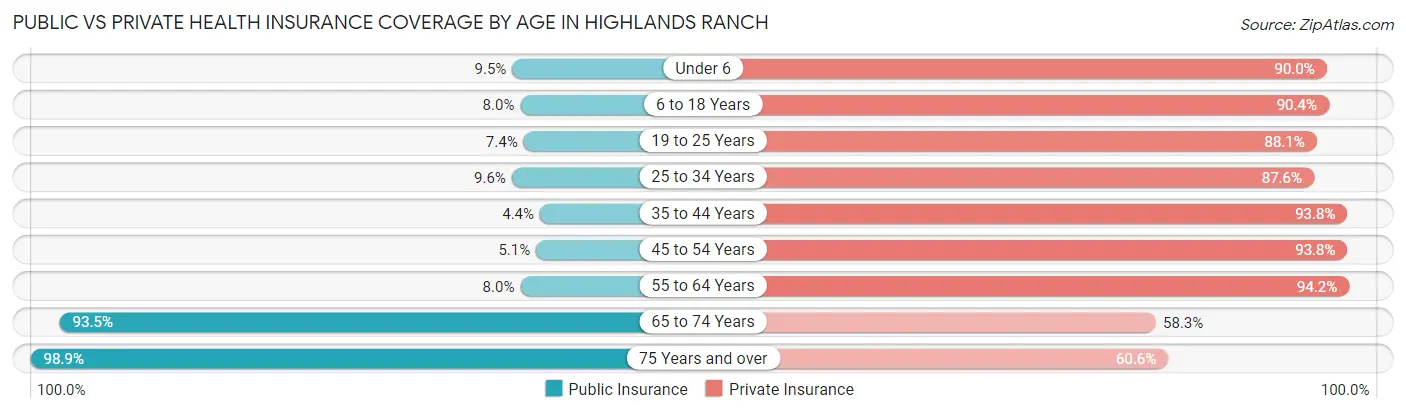
| Age Bracket | Public Insurance | Private Insurance |
| Under 6 | 545 (9.5%) | 5,161 (90.0%) |
| 6 to 18 Years | 1,713 (8.0%) | 19,363 (90.4%) |
| 19 to 25 Years | 506 (7.4%) | 6,024 (88.1%) |
| 25 to 34 Years | 843 (9.6%) | 7,704 (87.6%) |
| 35 to 44 Years | 615 (4.4%) | 13,226 (93.8%) |
| 45 to 54 Years | 885 (5.1%) | 16,392 (93.8%) |
| 55 to 64 Years | 1,044 (8.0%) | 12,284 (94.2%) |
| 65 to 74 Years | 7,401 (93.5%) | 4,618 (58.3%) |
| 75 Years and over | 5,546 (98.9%) | 3,396 (60.6%) |
| Total | 19,098 (18.9%) | 88,168 (87.4%) |
Disability Status by Sex by Age in Highlands Ranch
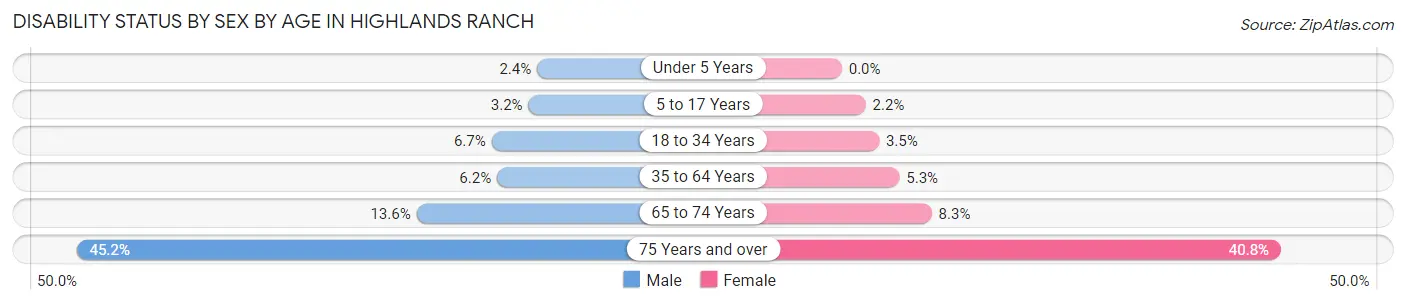
| Age Bracket | Male | Female |
| Under 5 Years | 62 (2.4%) | 0 (0.0%) |
| 5 to 17 Years | 348 (3.2%) | 220 (2.2%) |
| 18 to 34 Years | 572 (6.7%) | 307 (3.5%) |
| 35 to 64 Years | 1,376 (6.2%) | 1,190 (5.3%) |
| 65 to 74 Years | 520 (13.6%) | 342 (8.3%) |
| 75 Years and over | 1,046 (45.2%) | 1,342 (40.7%) |
Disability Class by Sex by Age in Highlands Ranch
Disability Class: Hearing Difficulty
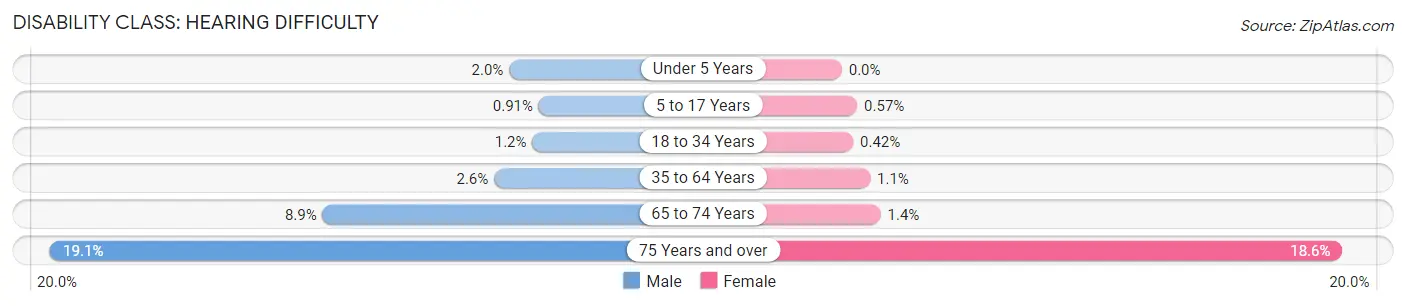
| Age Bracket | Male | Female |
| Under 5 Years | 51 (2.0%) | 0 (0.0%) |
| 5 to 17 Years | 98 (0.9%) | 57 (0.6%) |
| 18 to 34 Years | 99 (1.1%) | 37 (0.4%) |
| 35 to 64 Years | 574 (2.6%) | 233 (1.1%) |
| 65 to 74 Years | 341 (8.9%) | 59 (1.4%) |
| 75 Years and over | 441 (19.1%) | 612 (18.6%) |
Disability Class: Vision Difficulty
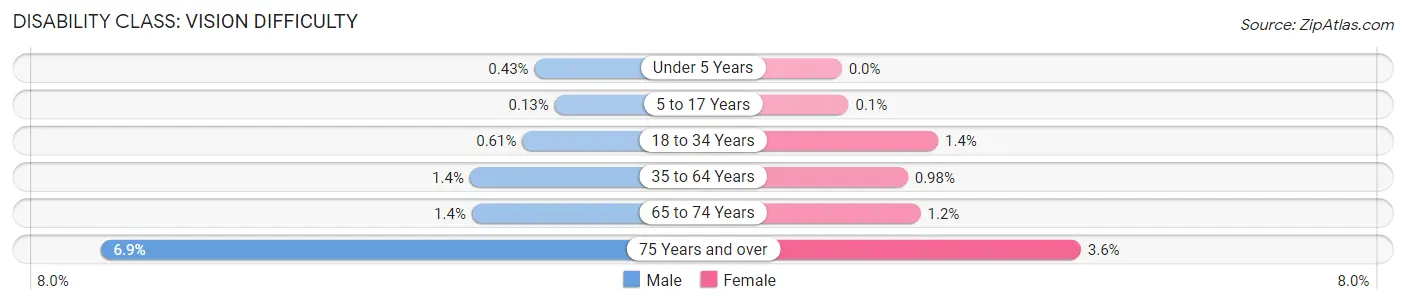
| Age Bracket | Male | Female |
| Under 5 Years | 11 (0.4%) | 0 (0.0%) |
| 5 to 17 Years | 14 (0.1%) | 10 (0.1%) |
| 18 to 34 Years | 52 (0.6%) | 127 (1.4%) |
| 35 to 64 Years | 311 (1.4%) | 218 (1.0%) |
| 65 to 74 Years | 52 (1.4%) | 48 (1.2%) |
| 75 Years and over | 159 (6.9%) | 117 (3.5%) |
Disability Class: Cognitive Difficulty
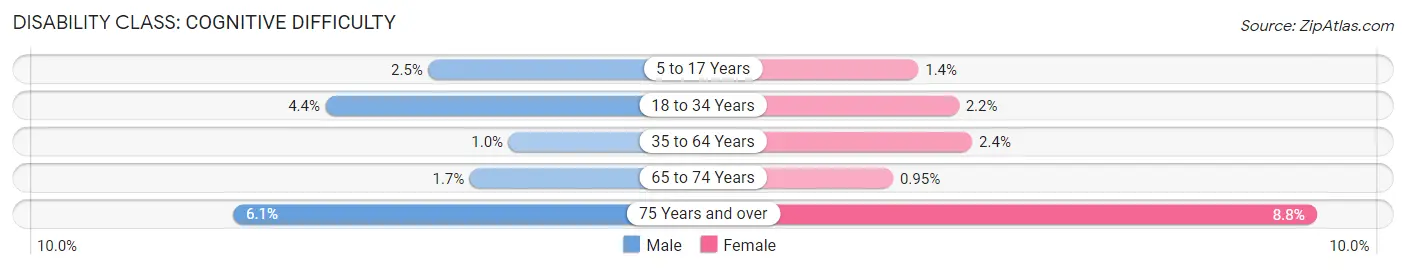
| Age Bracket | Male | Female |
| 5 to 17 Years | 269 (2.5%) | 141 (1.4%) |
| 18 to 34 Years | 379 (4.4%) | 193 (2.2%) |
| 35 to 64 Years | 226 (1.0%) | 538 (2.4%) |
| 65 to 74 Years | 66 (1.7%) | 39 (0.9%) |
| 75 Years and over | 142 (6.1%) | 290 (8.8%) |
Disability Class: Ambulatory Difficulty
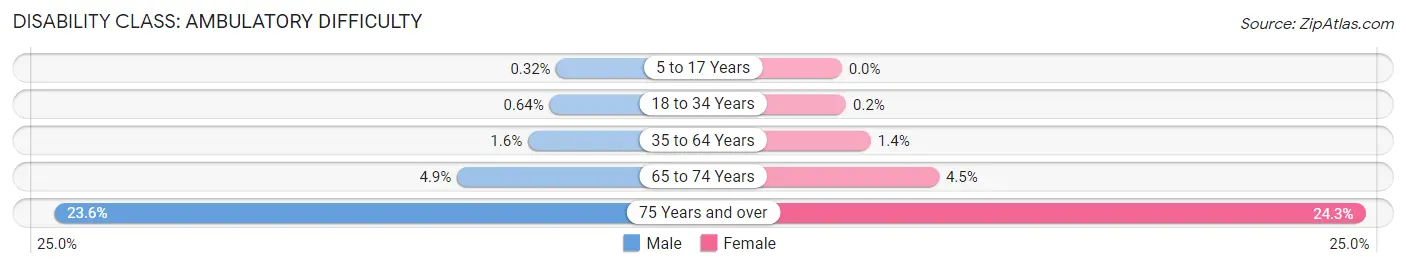
| Age Bracket | Male | Female |
| 5 to 17 Years | 34 (0.3%) | 0 (0.0%) |
| 18 to 34 Years | 55 (0.6%) | 18 (0.2%) |
| 35 to 64 Years | 366 (1.6%) | 300 (1.3%) |
| 65 to 74 Years | 188 (4.9%) | 185 (4.5%) |
| 75 Years and over | 547 (23.6%) | 800 (24.3%) |
Disability Class: Self-Care Difficulty
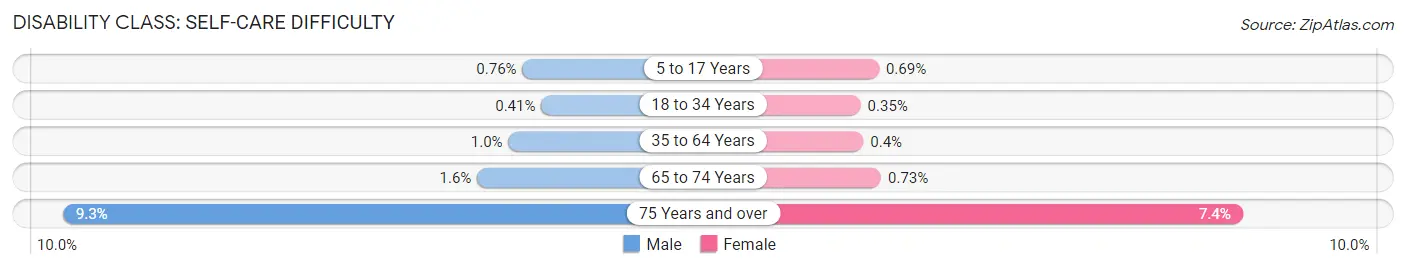
| Age Bracket | Male | Female |
| 5 to 17 Years | 82 (0.8%) | 69 (0.7%) |
| 18 to 34 Years | 35 (0.4%) | 31 (0.4%) |
| 35 to 64 Years | 228 (1.0%) | 90 (0.4%) |
| 65 to 74 Years | 61 (1.6%) | 30 (0.7%) |
| 75 Years and over | 215 (9.3%) | 245 (7.4%) |
Technology Access in Highlands Ranch
Computing Device Access in Highlands Ranch
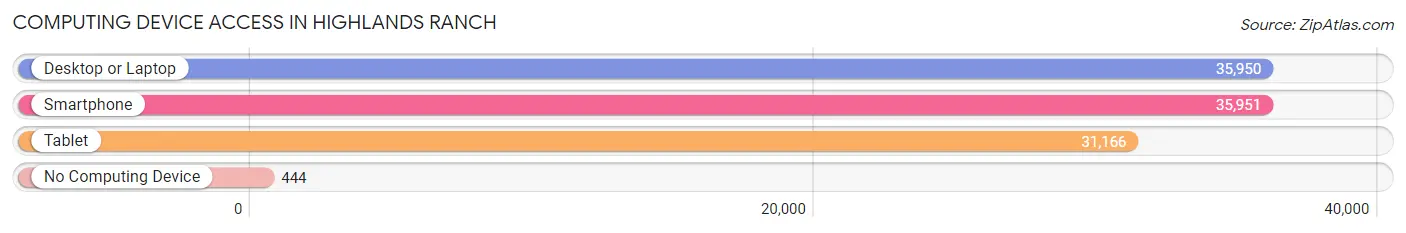
| Device Type | # Households | % Households |
| Desktop or Laptop | 35,950 | 95.7% |
| Smartphone | 35,951 | 95.7% |
| Tablet | 31,166 | 82.9% |
| No Computing Device | 444 | 1.2% |
| Total | 37,583 | 100.0% |
Internet Access in Highlands Ranch
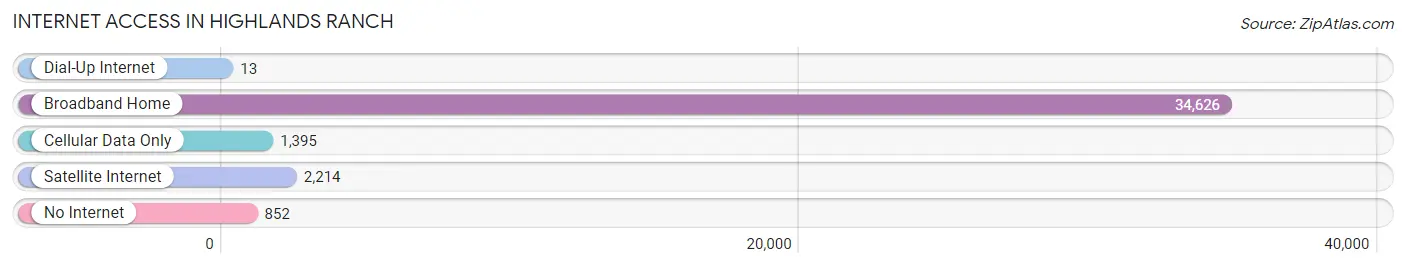
| Internet Type | # Households | % Households |
| Dial-Up Internet | 13 | 0.0% |
| Broadband Home | 34,626 | 92.1% |
| Cellular Data Only | 1,395 | 3.7% |
| Satellite Internet | 2,214 | 5.9% |
| No Internet | 852 | 2.3% |
| Total | 37,583 | 100.0% |
Highlands Ranch Summary
Highlands Ranch is an unincorporated community located in Douglas County, Colorado, United States. It is located approximately 12 miles south of Denver and is part of the Denver-Aurora-Lakewood, CO Metropolitan Statistical Area. The population of Highlands Ranch was estimated to be 96,713 in 2019.
History
Highlands Ranch was founded in 1981 by the Mission Viejo Company, a real estate development firm based in California. The company purchased the land from the Louisa and John Hendricks family, who had owned the land since the late 19th century. The Mission Viejo Company planned to develop the land into a master-planned community, and the first homes were built in 1981.
The community was initially planned to be a retirement community, but the plans changed when the Mission Viejo Company sold the land to the Rouse Company in 1984. The Rouse Company developed the land into a master-planned community with a mix of residential, commercial, and recreational uses.
Geography
Highlands Ranch is located in the foothills of the Rocky Mountains, approximately 12 miles south of Denver. The community is situated on a plateau at an elevation of 5,400 feet above sea level. The area is characterized by rolling hills, open space, and a variety of wildlife.
The community is bordered by the cities of Littleton to the north, Centennial to the east, and Lone Tree to the south. The community is also bordered by the unincorporated communities of Roxborough Park to the west and Chatfield to the southwest.
Economy
Highlands Ranch is home to a variety of businesses, including retail stores, restaurants, and professional services. The community is also home to several corporate headquarters, including the headquarters of the Ball Corporation, the world’s largest manufacturer of metal packaging.
The community is also home to several major employers, including the Lockheed Martin Space Systems Company, the University of Colorado Hospital, and the Denver Broncos Football Club.
Demographics
As of the 2019 census, the population of Highlands Ranch was estimated to be 96,713. The racial makeup of the community was 79.2% White, 8.2% Hispanic or Latino, 6.2% Asian, 4.2% African American, and 2.2% other.
The median household income in Highlands Ranch was estimated to be $107,845 in 2019, and the median home value was estimated to be $521,000. The median age of the population was estimated to be 37.7 years.
Conclusion
Highlands Ranch is an unincorporated community located in Douglas County, Colorado, United States. It is located approximately 12 miles south of Denver and is part of the Denver-Aurora-Lakewood, CO Metropolitan Statistical Area. The population of Highlands Ranch was estimated to be 96,713 in 2019. The community was founded in 1981 by the Mission Viejo Company and was developed into a master-planned community by the Rouse Company in 1984. The community is characterized by rolling hills, open space, and a variety of wildlife. The economy of Highlands Ranch is supported by a variety of businesses, including retail stores, restaurants, and professional services. The median household income in Highlands Ranch was estimated to be $107,845 in 2019, and the median home value was estimated to be $521,000. The racial makeup of the community was 79.2% White, 8.2% Hispanic or Latino, 6.2% Asian, 4.2% African American, and 2.2% other.
Common Questions
What is Per Capita Income in Highlands Ranch?
Per Capita income in Highlands Ranch is $65,584.
What is the Median Family Income in Highlands Ranch?
Median Family Income in Highlands Ranch is $163,363.
What is the Median Household income in Highlands Ranch?
Median Household Income in Highlands Ranch is $148,227.
What is Income or Wage Gap in Highlands Ranch?
Income or Wage Gap in Highlands Ranch is 44.1%.
Women in Highlands Ranch earn 55.9 cents for every dollar earned by a man.
What is Family Income Deficit in Highlands Ranch?
Family Income Deficit in Highlands Ranch is $12,125.
Families that are below poverty line in Highlands Ranch earn $12,125 less on average than the poverty threshold level.
What is Inequality or Gini Index in Highlands Ranch?
Inequality or Gini Index in Highlands Ranch is 0.37.
What is the Total Population of Highlands Ranch?
Total Population of Highlands Ranch is 101,514.
What is the Total Male Population of Highlands Ranch?
Total Male Population of Highlands Ranch is 50,875.
What is the Total Female Population of Highlands Ranch?
Total Female Population of Highlands Ranch is 50,639.
What is the Ratio of Males per 100 Females in Highlands Ranch?
There are 100.47 Males per 100 Females in Highlands Ranch.
What is the Ratio of Females per 100 Males in Highlands Ranch?
There are 99.54 Females per 100 Males in Highlands Ranch.
What is the Median Population Age in Highlands Ranch?
Median Population Age in Highlands Ranch is 41.0 Years.
What is the Average Family Size in Highlands Ranch
Average Family Size in Highlands Ranch is 3.1 People.
What is the Average Household Size in Highlands Ranch
Average Household Size in Highlands Ranch is 2.7 People.
How Large is the Labor Force in Highlands Ranch?
There are 57,483 People in the Labor Forcein in Highlands Ranch.
What is the Percentage of People in the Labor Force in Highlands Ranch?
72.1% of People are in the Labor Force in Highlands Ranch.
What is the Unemployment Rate in Highlands Ranch?
Unemployment Rate in Highlands Ranch is 3.4%.