Richlands, VA Map & Demographics
Richlands Map
Richlands Overview
$27,739
PER CAPITA INCOME
$63,125
AVG FAMILY INCOME
$35,959
AVG HOUSEHOLD INCOME
19.2%
WAGE / INCOME GAP [ % ]
80.8¢/ $1
WAGE / INCOME GAP [ $ ]
0.52
INEQUALITY / GINI INDEX
5,266
TOTAL POPULATION
2,488
MALE POPULATION
2,778
FEMALE POPULATION
89.56
MALES / 100 FEMALES
111.66
FEMALES / 100 MALES
45.2
MEDIAN AGE
2.9
AVG FAMILY SIZE
2.3
AVG HOUSEHOLD SIZE
2,016
LABOR FORCE [ PEOPLE ]
44.9%
PERCENT IN LABOR FORCE
8.6%
UNEMPLOYMENT RATE
Richlands Zip Codes
Richlands Area Codes
Income in Richlands
Income Overview in Richlands
Per Capita Income in Richlands is $27,739, while median incomes of families and households are $63,125 and $35,959 respectively.
| Characteristic | Number | Measure |
| Per Capita Income | 5,266 | $27,739 |
| Median Family Income | 1,346 | $63,125 |
| Mean Family Income | 1,346 | $81,800 |
| Median Household Income | 2,273 | $35,959 |
| Mean Household Income | 2,273 | $59,107 |
| Income Deficit | 1,346 | $0 |
| Wage / Income Gap (%) | 5,266 | 19.23% |
| Wage / Income Gap ($) | 5,266 | 80.77¢ per $1 |
| Gini / Inequality Index | 5,266 | 0.52 |
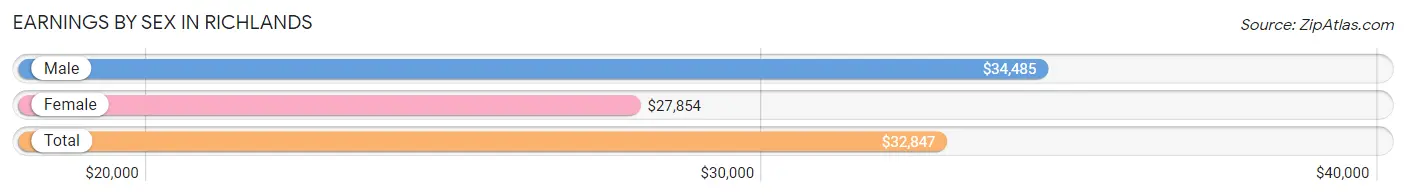
Earnings by Sex in Richlands
Average Earnings in Richlands are $32,847, $34,485 for men and $27,854 for women, a difference of 19.2%.
| Sex | Number | Average Earnings |
| Male | 1,154 (57.0%) | $34,485 |
| Female | 869 (43.0%) | $27,854 |
| Total | 2,023 (100.0%) | $32,847 |
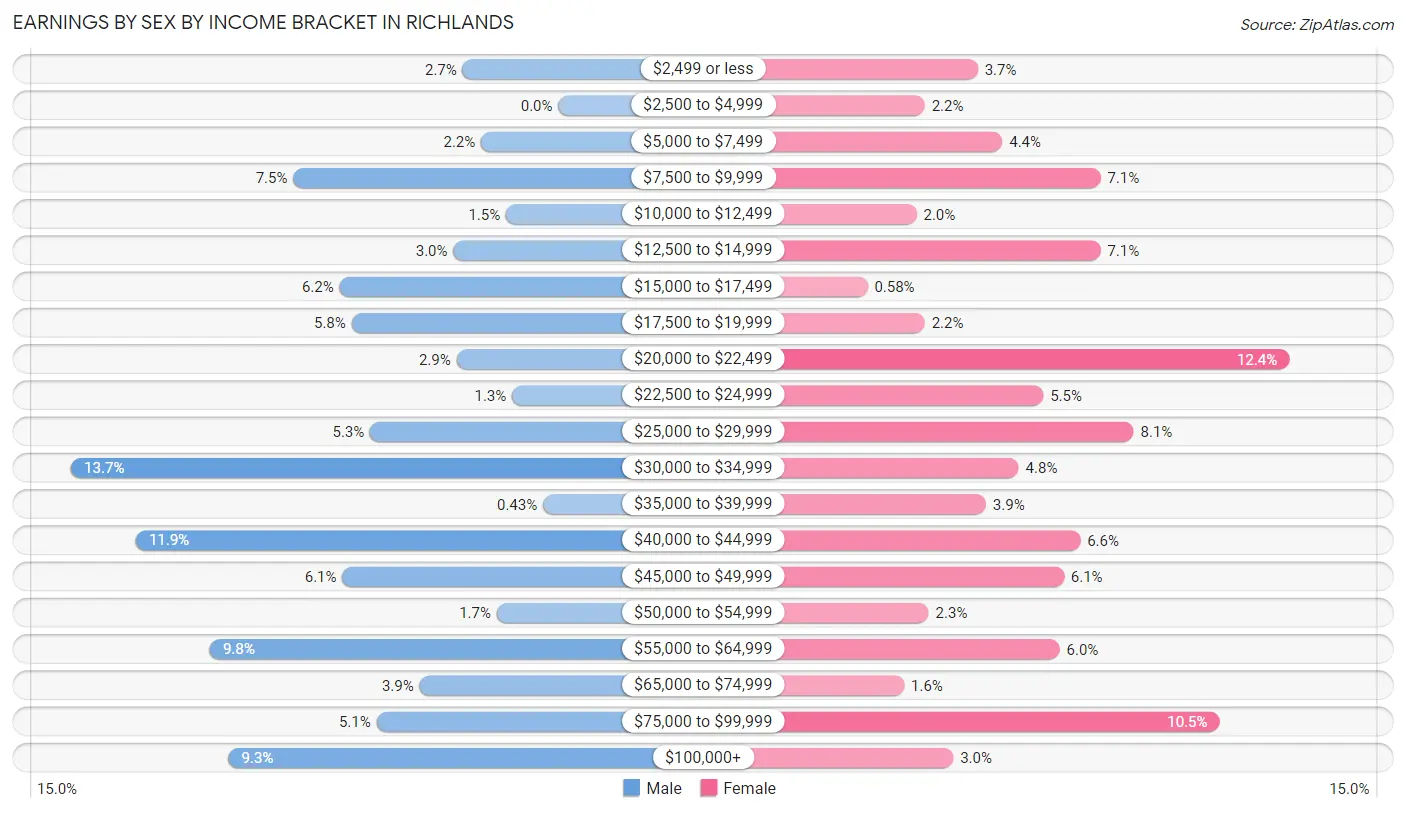
Earnings by Sex by Income Bracket in Richlands
The most common earnings brackets in Richlands are $30,000 to $34,999 for men (158 | 13.7%) and $20,000 to $22,499 for women (108 | 12.4%).
| Income | Male | Female |
| $2,499 or less | 31 (2.7%) | 32 (3.7%) |
| $2,500 to $4,999 | 0 (0.0%) | 19 (2.2%) |
| $5,000 to $7,499 | 25 (2.2%) | 38 (4.4%) |
| $7,500 to $9,999 | 86 (7.4%) | 62 (7.1%) |
| $10,000 to $12,499 | 17 (1.5%) | 17 (2.0%) |
| $12,500 to $14,999 | 34 (2.9%) | 62 (7.1%) |
| $15,000 to $17,499 | 71 (6.1%) | 5 (0.6%) |
| $17,500 to $19,999 | 67 (5.8%) | 19 (2.2%) |
| $20,000 to $22,499 | 33 (2.9%) | 108 (12.4%) |
| $22,500 to $24,999 | 15 (1.3%) | 48 (5.5%) |
| $25,000 to $29,999 | 61 (5.3%) | 70 (8.1%) |
| $30,000 to $34,999 | 158 (13.7%) | 42 (4.8%) |
| $35,000 to $39,999 | 5 (0.4%) | 34 (3.9%) |
| $40,000 to $44,999 | 137 (11.9%) | 57 (6.6%) |
| $45,000 to $49,999 | 70 (6.1%) | 53 (6.1%) |
| $50,000 to $54,999 | 20 (1.7%) | 20 (2.3%) |
| $55,000 to $64,999 | 113 (9.8%) | 52 (6.0%) |
| $65,000 to $74,999 | 45 (3.9%) | 14 (1.6%) |
| $75,000 to $99,999 | 59 (5.1%) | 91 (10.5%) |
| $100,000+ | 107 (9.3%) | 26 (3.0%) |
| Total | 1,154 (100.0%) | 869 (100.0%) |
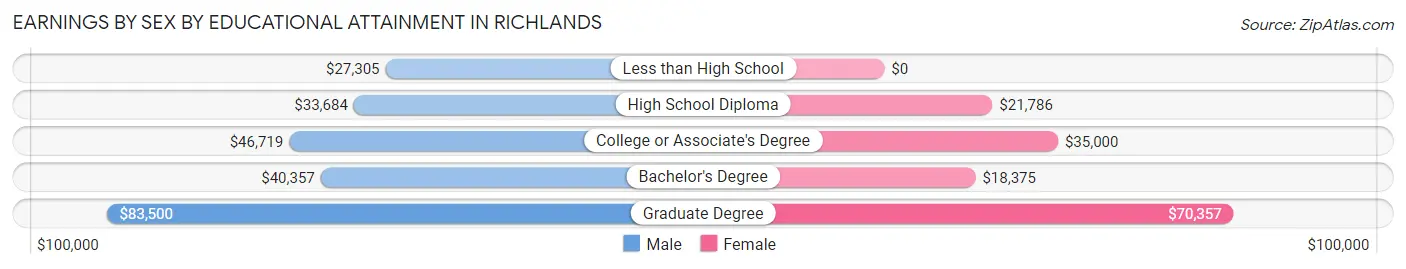
Earnings by Sex by Educational Attainment in Richlands
Average earnings in Richlands are $42,560 for men and $29,125 for women, a difference of 31.6%. Men with an educational attainment of graduate degree enjoy the highest average annual earnings of $83,500, while those with less than high school education earn the least with $27,305. Women with an educational attainment of graduate degree earn the most with the average annual earnings of $70,357, while those with bachelor's degree education have the smallest earnings of $18,375.
| Educational Attainment | Male Income | Female Income |
| Less than High School | $27,305 | $0 |
| High School Diploma | $33,684 | $21,786 |
| College or Associate's Degree | $46,719 | $35,000 |
| Bachelor's Degree | $40,357 | $18,375 |
| Graduate Degree | $83,500 | $70,357 |
| Total | $42,560 | $29,125 |
Family Income in Richlands
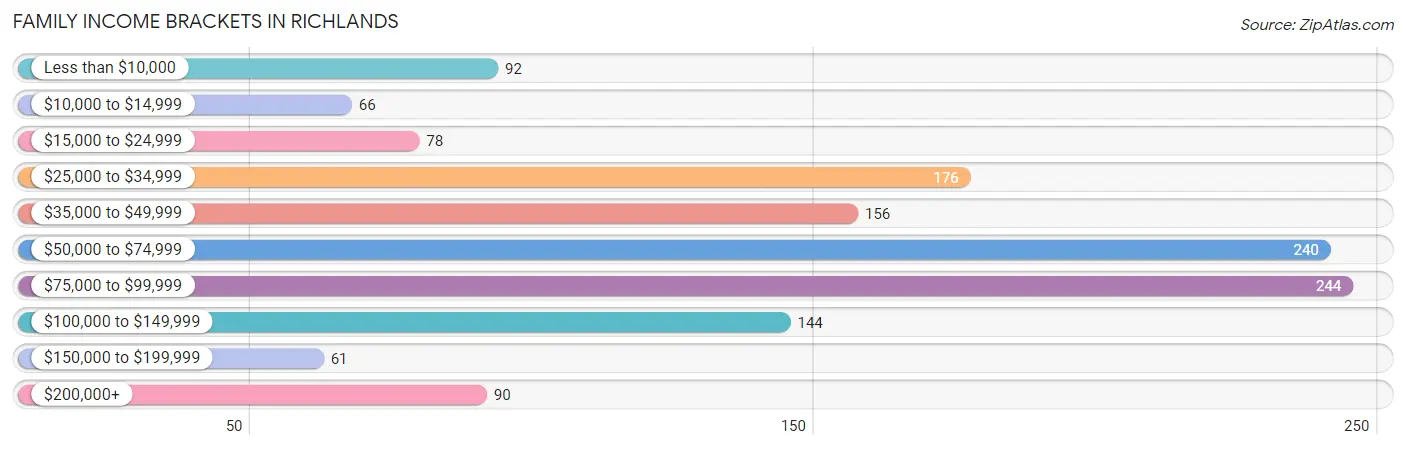
Family Income Brackets in Richlands
According to the Richlands family income data, there are 244 families falling into the $75,000 to $99,999 income range, which is the most common income bracket and makes up 18.1% of all families. Conversely, the $150,000 to $199,999 income bracket is the least frequent group with only 61 families (4.5%) belonging to this category.
| Income Bracket | # Families | % Families |
| Less than $10,000 | 92 | 6.8% |
| $10,000 to $14,999 | 66 | 4.9% |
| $15,000 to $24,999 | 78 | 5.8% |
| $25,000 to $34,999 | 176 | 13.1% |
| $35,000 to $49,999 | 156 | 11.6% |
| $50,000 to $74,999 | 240 | 17.8% |
| $75,000 to $99,999 | 244 | 18.1% |
| $100,000 to $149,999 | 144 | 10.7% |
| $150,000 to $199,999 | 61 | 4.5% |
| $200,000+ | 90 | 6.7% |
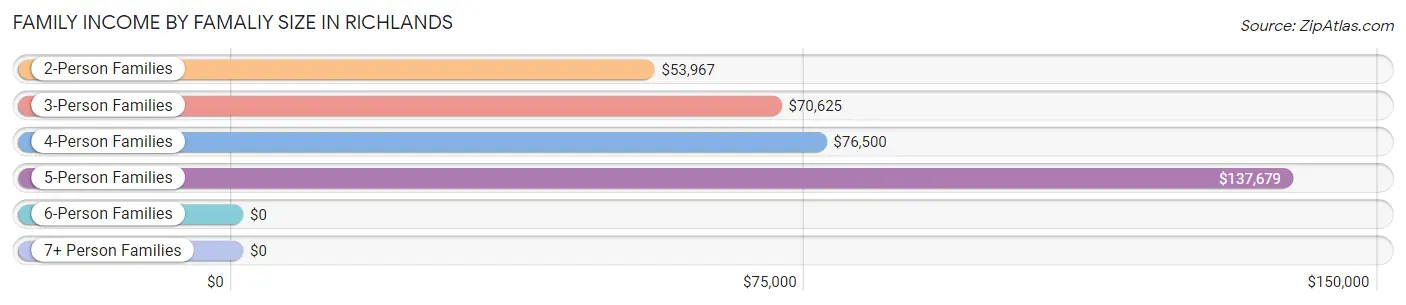
Family Income by Famaliy Size in Richlands
5-person families (40 | 3.0%) account for the highest median family income in Richlands with $137,679 per family, while 5-person families (40 | 3.0%) have the highest median income of $27,536 per family member.
| Income Bracket | # Families | Median Income |
| 2-Person Families | 761 (56.5%) | $53,967 |
| 3-Person Families | 335 (24.9%) | $70,625 |
| 4-Person Families | 180 (13.4%) | $76,500 |
| 5-Person Families | 40 (3.0%) | $137,679 |
| 6-Person Families | 30 (2.2%) | $0 |
| 7+ Person Families | 0 (0.0%) | $0 |
| Total | 1,346 (100.0%) | $63,125 |
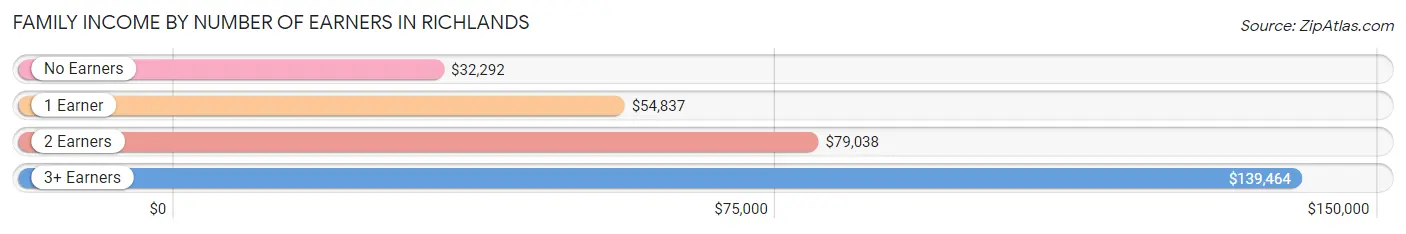
Family Income by Number of Earners in Richlands
The median family income in Richlands is $63,125, with families comprising 3+ earners (62) having the highest median family income of $139,464, while families with no earners (445) have the lowest median family income of $32,292, accounting for 4.6% and 33.1% of families, respectively.
| Number of Earners | # Families | Median Income |
| No Earners | 445 (33.1%) | $32,292 |
| 1 Earner | 535 (39.8%) | $54,837 |
| 2 Earners | 304 (22.6%) | $79,038 |
| 3+ Earners | 62 (4.6%) | $139,464 |
| Total | 1,346 (100.0%) | $63,125 |
Household Income in Richlands
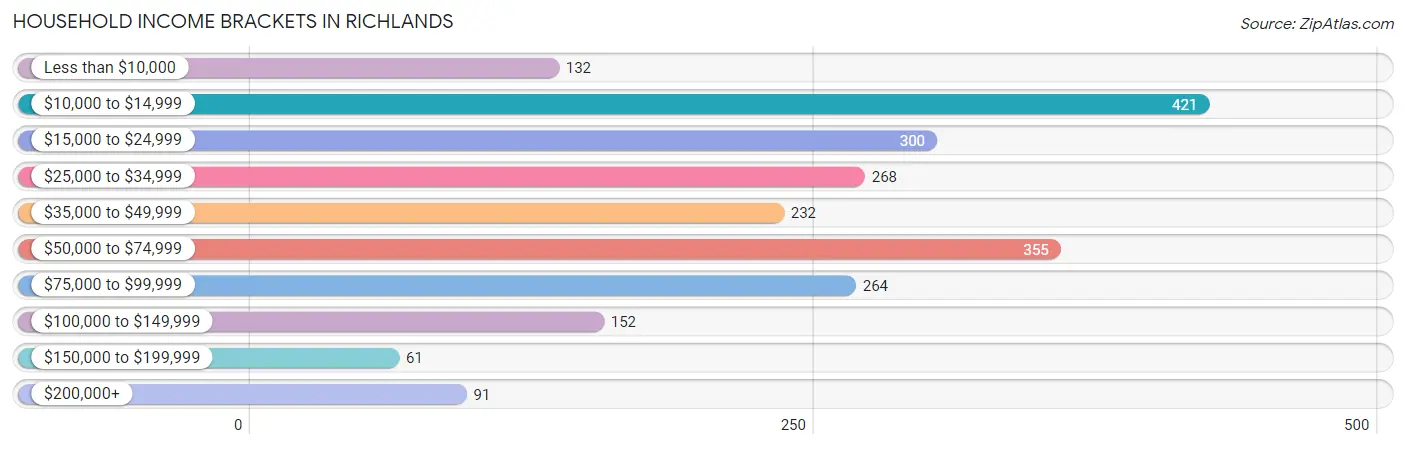
Household Income Brackets in Richlands
With 421 households falling in the category, the $10,000 to $14,999 income range is the most frequent in Richlands, accounting for 18.5% of all households. In contrast, only 61 households (2.7%) fall into the $150,000 to $199,999 income bracket, making it the least populous group.
| Income Bracket | # Households | % Households |
| Less than $10,000 | 132 | 5.8% |
| $10,000 to $14,999 | 421 | 18.5% |
| $15,000 to $24,999 | 300 | 13.2% |
| $25,000 to $34,999 | 268 | 11.8% |
| $35,000 to $49,999 | 232 | 10.2% |
| $50,000 to $74,999 | 355 | 15.6% |
| $75,000 to $99,999 | 264 | 11.6% |
| $100,000 to $149,999 | 152 | 6.7% |
| $150,000 to $199,999 | 61 | 2.7% |
| $200,000+ | 91 | 4.0% |
Household Income by Householder Age in Richlands
The median household income in Richlands is $35,959, with the highest median household income of $53,063 found in the 45 to 64 years age bracket for the primary householder. A total of 747 households (32.9%) fall into this category. Meanwhile, the 15 to 24 years age bracket for the primary householder has the lowest median household income of $0, with 188 households (8.3%) in this group.
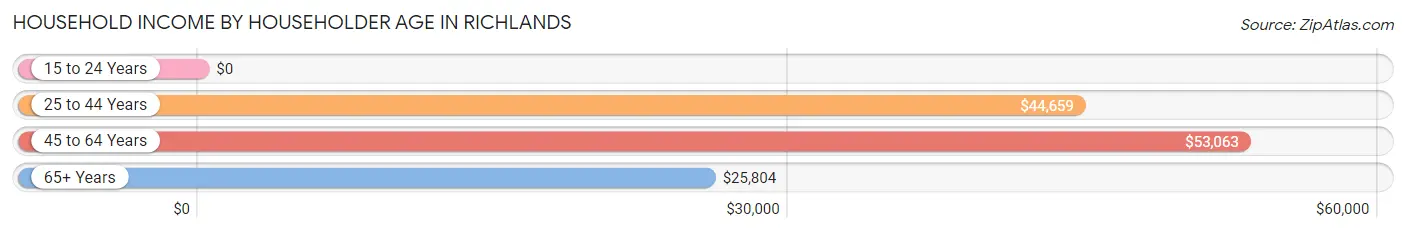
| Income Bracket | # Households | Median Income |
| 15 to 24 Years | 188 (8.3%) | $0 |
| 25 to 44 Years | 535 (23.5%) | $44,659 |
| 45 to 64 Years | 747 (32.9%) | $53,063 |
| 65+ Years | 803 (35.3%) | $25,804 |
| Total | 2,273 (100.0%) | $35,959 |
Poverty in Richlands
Income Below Poverty by Sex and Age in Richlands
With 23.3% poverty level for males and 26.5% for females among the residents of Richlands, 6 to 11 year old males and 15 year old females are the most vulnerable to poverty, with 96 males (57.8%) and 60 females (92.3%) in their respective age groups living below the poverty level.
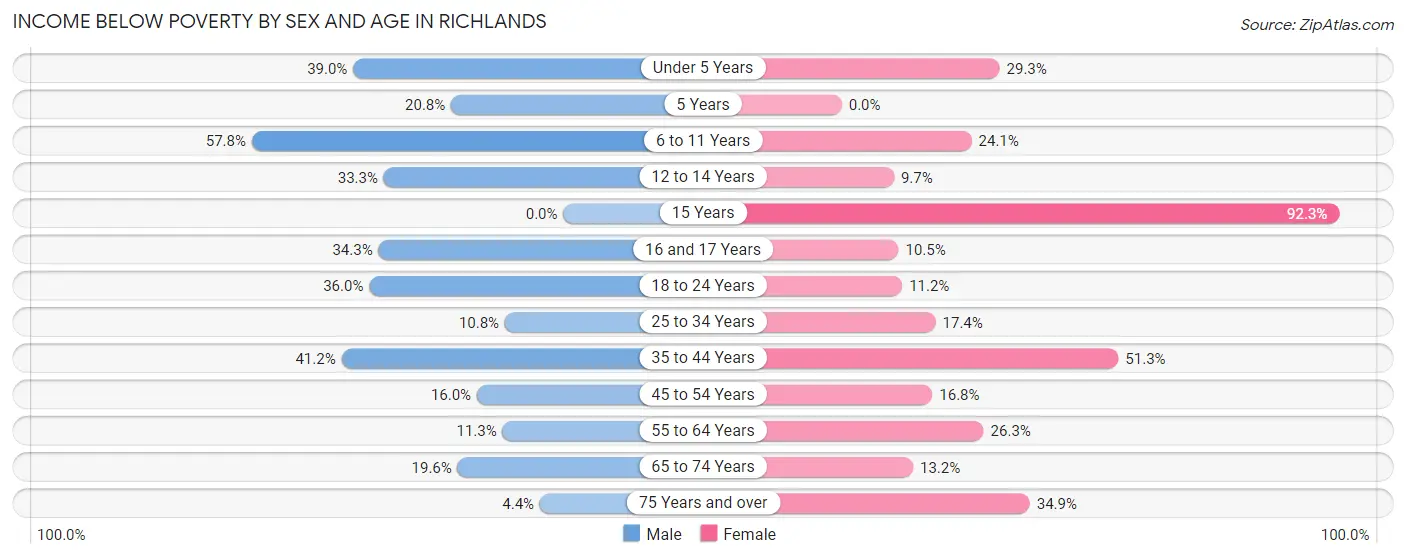
| Age Bracket | Male | Female |
| Under 5 Years | 55 (39.0%) | 41 (29.3%) |
| 5 Years | 5 (20.8%) | 0 (0.0%) |
| 6 to 11 Years | 96 (57.8%) | 20 (24.1%) |
| 12 to 14 Years | 5 (33.3%) | 6 (9.7%) |
| 15 Years | 0 (0.0%) | 60 (92.3%) |
| 16 and 17 Years | 35 (34.3%) | 4 (10.5%) |
| 18 to 24 Years | 89 (36.0%) | 24 (11.2%) |
| 25 to 34 Years | 44 (10.8%) | 55 (17.4%) |
| 35 to 44 Years | 91 (41.2%) | 153 (51.3%) |
| 45 to 54 Years | 68 (16.0%) | 58 (16.8%) |
| 55 to 64 Years | 30 (11.3%) | 84 (26.3%) |
| 65 to 74 Years | 53 (19.6%) | 46 (13.2%) |
| 75 Years and over | 6 (4.3%) | 179 (34.9%) |
| Total | 577 (23.3%) | 730 (26.5%) |
Income Above Poverty by Sex and Age in Richlands
According to the poverty statistics in Richlands, males aged 15 years and females aged 5 years are the age groups that are most secure financially, with 100.0% of males and 100.0% of females in these age groups living above the poverty line.
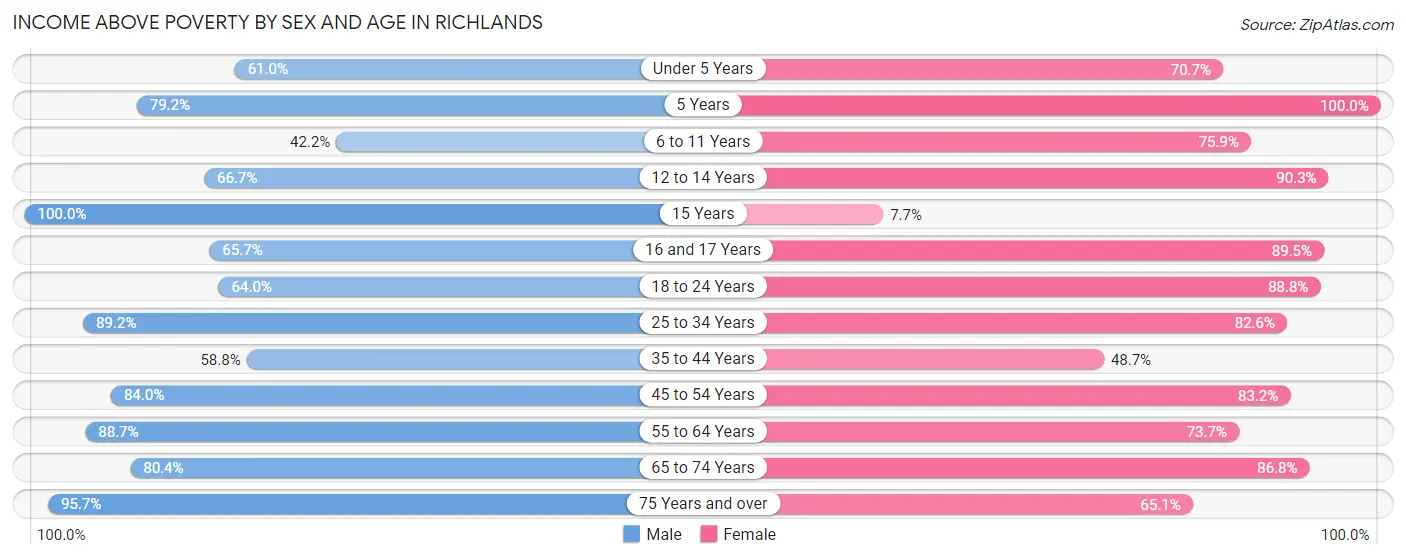
| Age Bracket | Male | Female |
| Under 5 Years | 86 (61.0%) | 99 (70.7%) |
| 5 Years | 19 (79.2%) | 15 (100.0%) |
| 6 to 11 Years | 70 (42.2%) | 63 (75.9%) |
| 12 to 14 Years | 10 (66.7%) | 56 (90.3%) |
| 15 Years | 57 (100.0%) | 5 (7.7%) |
| 16 and 17 Years | 67 (65.7%) | 34 (89.5%) |
| 18 to 24 Years | 158 (64.0%) | 190 (88.8%) |
| 25 to 34 Years | 362 (89.2%) | 261 (82.6%) |
| 35 to 44 Years | 130 (58.8%) | 145 (48.7%) |
| 45 to 54 Years | 356 (84.0%) | 287 (83.2%) |
| 55 to 64 Years | 236 (88.7%) | 235 (73.7%) |
| 65 to 74 Years | 217 (80.4%) | 302 (86.8%) |
| 75 Years and over | 132 (95.7%) | 334 (65.1%) |
| Total | 1,900 (76.7%) | 2,026 (73.5%) |
Income Below Poverty Among Married-Couple Families in Richlands
The poverty statistics for married-couple families in Richlands show that 6.0% or 59 of the total 986 families live below the poverty line. Families with 3 or 4 children have the highest poverty rate of 30.0%, comprising of 12 families. On the other hand, families with no children have the lowest poverty rate of 2.7%, which includes 17 families.
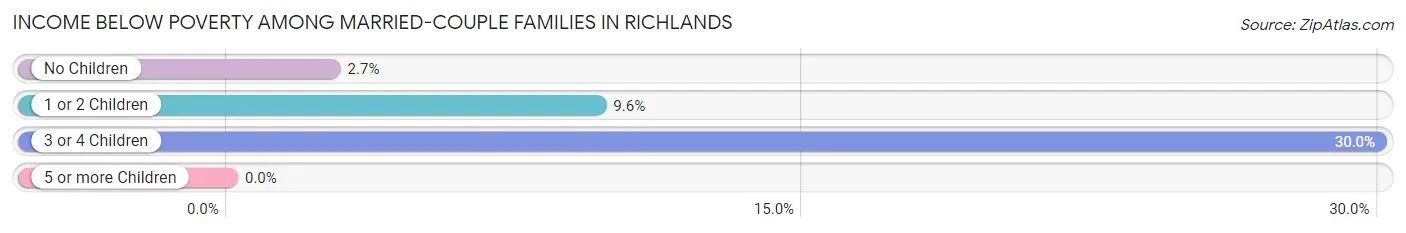
| Children | Above Poverty | Below Poverty |
| No Children | 617 (97.3%) | 17 (2.7%) |
| 1 or 2 Children | 282 (90.4%) | 30 (9.6%) |
| 3 or 4 Children | 28 (70.0%) | 12 (30.0%) |
| 5 or more Children | 0 (0.0%) | 0 (0.0%) |
| Total | 927 (94.0%) | 59 (6.0%) |
Income Below Poverty Among Single-Parent Households in Richlands
According to the poverty data in Richlands, 40.4% or 38 single-father households and 43.2% or 115 single-mother households are living below the poverty line. Among single-father households, those with 1 or 2 children have the highest poverty rate, with 38 households (100.0%) experiencing poverty. Likewise, among single-mother households, those with 1 or 2 children have the highest poverty rate, with 99 households (83.9%) falling below the poverty line.
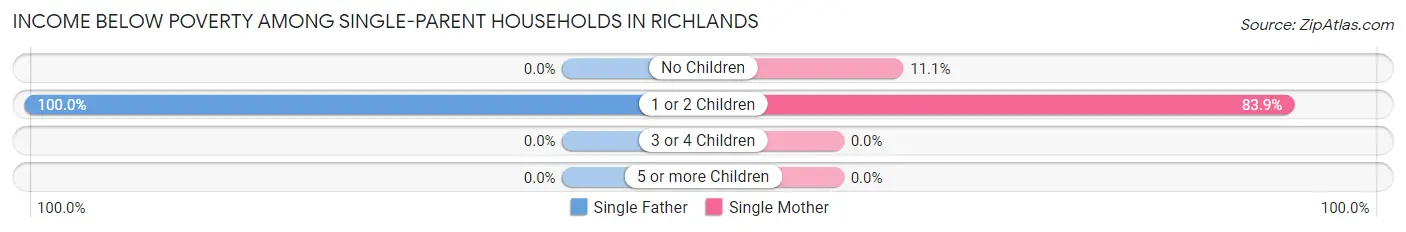
| Children | Single Father | Single Mother |
| No Children | 0 (0.0%) | 16 (11.1%) |
| 1 or 2 Children | 38 (100.0%) | 99 (83.9%) |
| 3 or 4 Children | 0 (0.0%) | 0 (0.0%) |
| 5 or more Children | 0 (0.0%) | 0 (0.0%) |
| Total | 38 (40.4%) | 115 (43.2%) |
Income Below Poverty Among Married-Couple vs Single-Parent Households in Richlands
The poverty data for Richlands shows that 59 of the married-couple family households (6.0%) and 153 of the single-parent households (42.5%) are living below the poverty level. Within the married-couple family households, those with 3 or 4 children have the highest poverty rate, with 12 households (30.0%) falling below the poverty line. Among the single-parent households, those with 1 or 2 children have the highest poverty rate, with 137 household (87.8%) living below poverty.
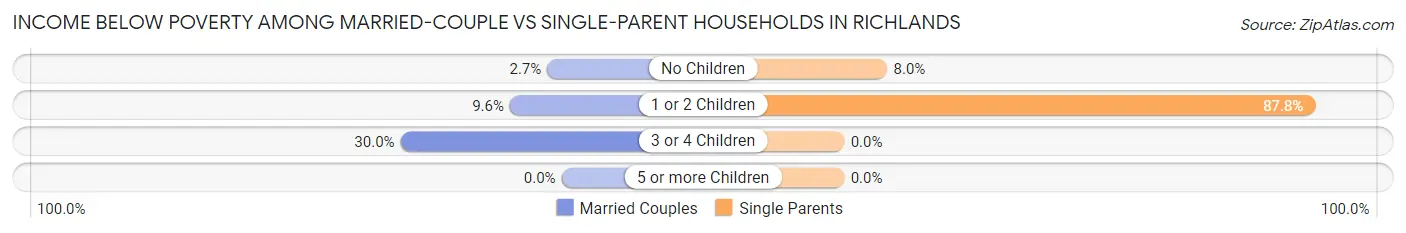
| Children | Married-Couple Families | Single-Parent Households |
| No Children | 17 (2.7%) | 16 (8.0%) |
| 1 or 2 Children | 30 (9.6%) | 137 (87.8%) |
| 3 or 4 Children | 12 (30.0%) | 0 (0.0%) |
| 5 or more Children | 0 (0.0%) | 0 (0.0%) |
| Total | 59 (6.0%) | 153 (42.5%) |
Race in Richlands
The most populous races in Richlands are White / Caucasian (5,141 | 97.6%), Asian (56 | 1.1%), and Two or more Races (38 | 0.7%).
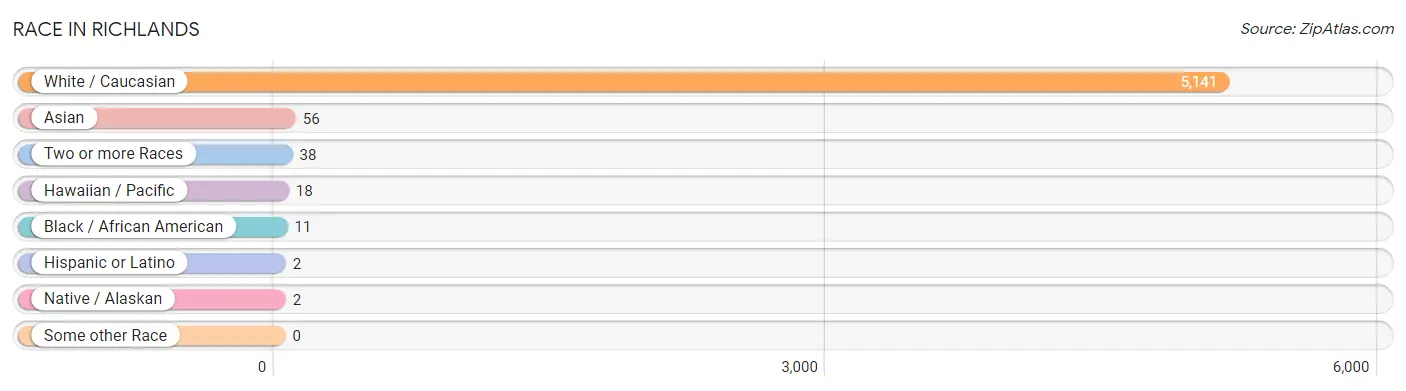
| Race | # Population | % Population |
| Asian | 56 | 1.1% |
| Black / African American | 11 | 0.2% |
| Hawaiian / Pacific | 18 | 0.3% |
| Hispanic or Latino | 2 | 0.0% |
| Native / Alaskan | 2 | 0.0% |
| White / Caucasian | 5,141 | 97.6% |
| Two or more Races | 38 | 0.7% |
| Some other Race | 0 | 0.0% |
| Total | 5,266 | 100.0% |
Ancestry in Richlands
The most populous ancestries reported in Richlands are American (1,216 | 23.1%), Irish (696 | 13.2%), English (529 | 10.1%), German (311 | 5.9%), and Scotch-Irish (127 | 2.4%), together accounting for 54.7% of all Richlands residents.
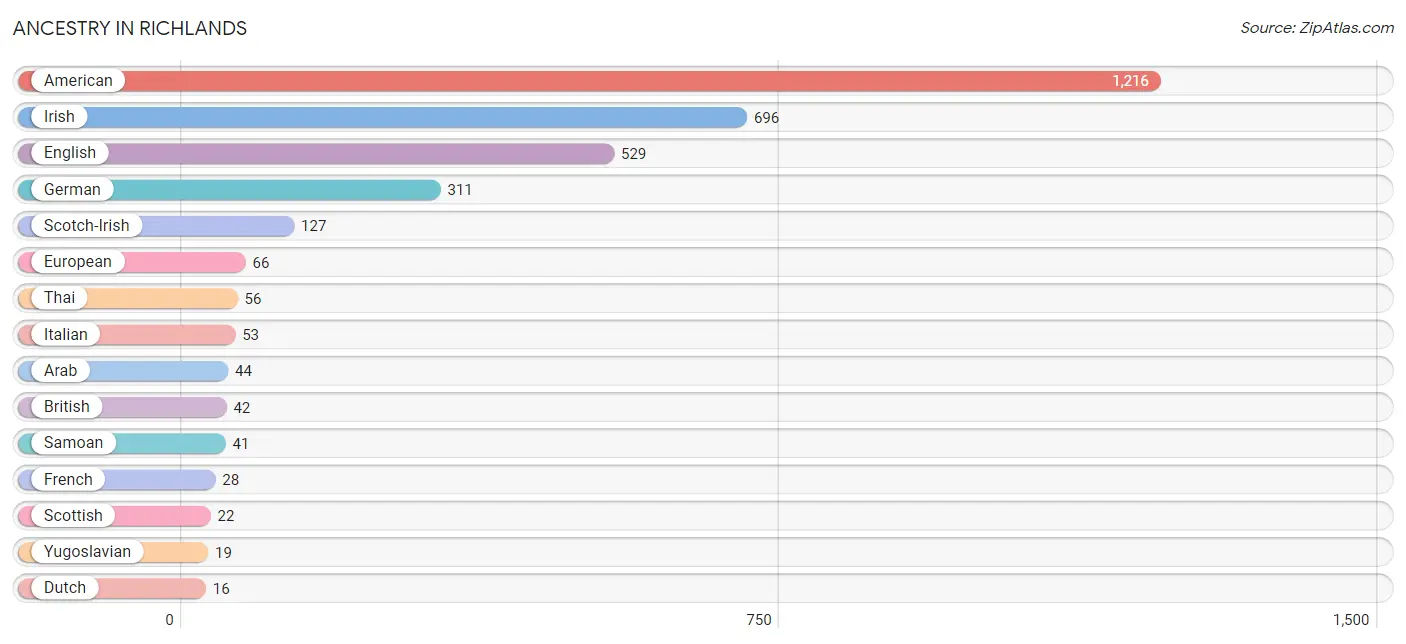
| Ancestry | # Population | % Population |
| American | 1,216 | 23.1% |
| Arab | 44 | 0.8% |
| British | 42 | 0.8% |
| Cherokee | 13 | 0.3% |
| Dutch | 16 | 0.3% |
| Eastern European | 11 | 0.2% |
| English | 529 | 10.1% |
| European | 66 | 1.3% |
| French | 28 | 0.5% |
| French American Indian | 1 | 0.0% |
| German | 311 | 5.9% |
| Irish | 696 | 13.2% |
| Italian | 53 | 1.0% |
| Norwegian | 13 | 0.3% |
| Polish | 7 | 0.1% |
| Samoan | 41 | 0.8% |
| Scotch-Irish | 127 | 2.4% |
| Scottish | 22 | 0.4% |
| Slavic | 5 | 0.1% |
| Swedish | 8 | 0.2% |
| Thai | 56 | 1.1% |
| Ukrainian | 5 | 0.1% |
| Yugoslavian | 19 | 0.4% | View All 23 Rows |
Immigrants in Richlands
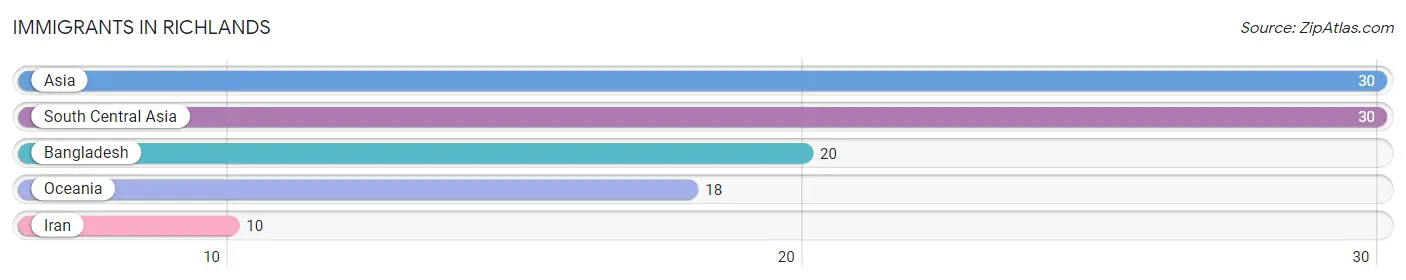
The most numerous immigrant groups reported in Richlands came from Asia (30 | 0.6%), South Central Asia (30 | 0.6%), Bangladesh (20 | 0.4%), Oceania (18 | 0.3%), and Iran (10 | 0.2%), together accounting for 2.0% of all Richlands residents.
| Immigration Origin | # Population | % Population |
| Asia | 30 | 0.6% |
| Bangladesh | 20 | 0.4% |
| Iran | 10 | 0.2% |
| Oceania | 18 | 0.3% |
| South Central Asia | 30 | 0.6% | View All 5 Rows |
Sex and Age in Richlands
Sex and Age in Richlands
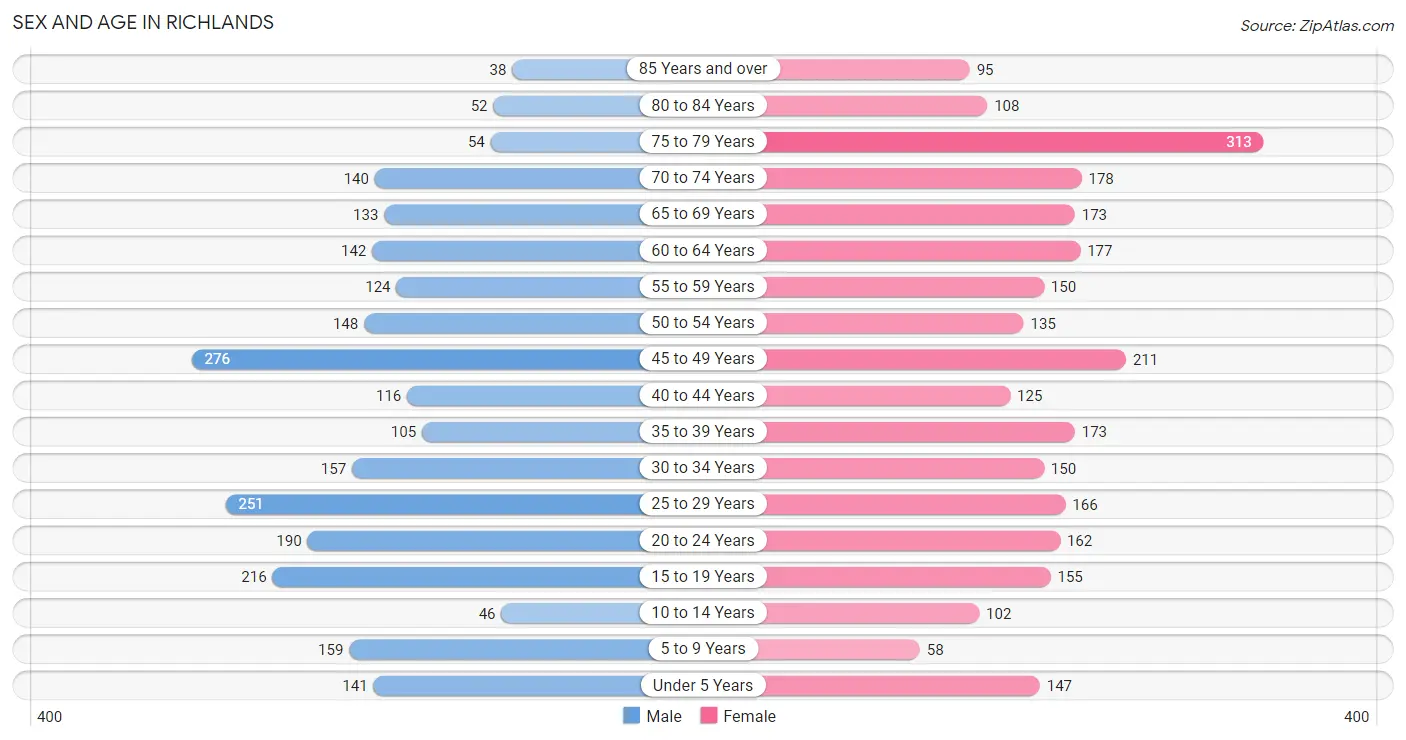
The most populous age groups in Richlands are 45 to 49 Years (276 | 11.1%) for men and 75 to 79 Years (313 | 11.3%) for women.
| Age Bracket | Male | Female |
| Under 5 Years | 141 (5.7%) | 147 (5.3%) |
| 5 to 9 Years | 159 (6.4%) | 58 (2.1%) |
| 10 to 14 Years | 46 (1.8%) | 102 (3.7%) |
| 15 to 19 Years | 216 (8.7%) | 155 (5.6%) |
| 20 to 24 Years | 190 (7.6%) | 162 (5.8%) |
| 25 to 29 Years | 251 (10.1%) | 166 (6.0%) |
| 30 to 34 Years | 157 (6.3%) | 150 (5.4%) |
| 35 to 39 Years | 105 (4.2%) | 173 (6.2%) |
| 40 to 44 Years | 116 (4.7%) | 125 (4.5%) |
| 45 to 49 Years | 276 (11.1%) | 211 (7.6%) |
| 50 to 54 Years | 148 (5.9%) | 135 (4.9%) |
| 55 to 59 Years | 124 (5.0%) | 150 (5.4%) |
| 60 to 64 Years | 142 (5.7%) | 177 (6.4%) |
| 65 to 69 Years | 133 (5.3%) | 173 (6.2%) |
| 70 to 74 Years | 140 (5.6%) | 178 (6.4%) |
| 75 to 79 Years | 54 (2.2%) | 313 (11.3%) |
| 80 to 84 Years | 52 (2.1%) | 108 (3.9%) |
| 85 Years and over | 38 (1.5%) | 95 (3.4%) |
| Total | 2,488 (100.0%) | 2,778 (100.0%) |
Families and Households in Richlands
Median Family Size in Richlands
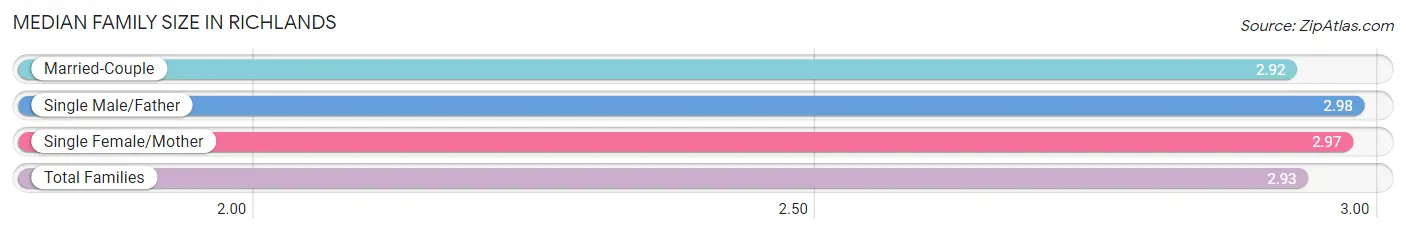
The median family size in Richlands is 2.93 persons per family, with single male/father families (94 | 7.0%) accounting for the largest median family size of 2.98 persons per family. On the other hand, married-couple families (986 | 73.3%) represent the smallest median family size with 2.92 persons per family.
| Family Type | # Families | Family Size |
| Married-Couple | 986 (73.3%) | 2.92 |
| Single Male/Father | 94 (7.0%) | 2.98 |
| Single Female/Mother | 266 (19.8%) | 2.97 |
| Total Families | 1,346 (100.0%) | 2.93 |
Median Household Size in Richlands
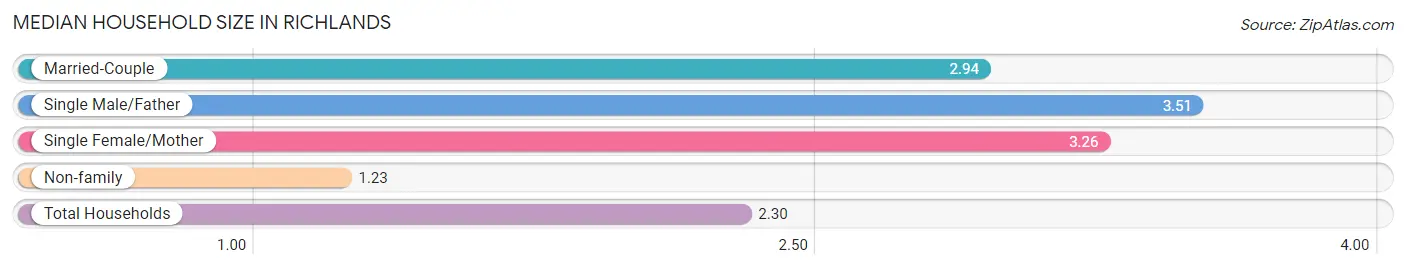
The median household size in Richlands is 2.30 persons per household, with single male/father households (94 | 4.1%) accounting for the largest median household size of 3.51 persons per household. non-family households (927 | 40.8%) represent the smallest median household size with 1.23 persons per household.
| Household Type | # Households | Household Size |
| Married-Couple | 986 (43.4%) | 2.94 |
| Single Male/Father | 94 (4.1%) | 3.51 |
| Single Female/Mother | 266 (11.7%) | 3.26 |
| Non-family | 927 (40.8%) | 1.23 |
| Total Households | 2,273 (100.0%) | 2.30 |
Household Size by Marriage Status in Richlands
Out of a total of 2,273 households in Richlands, 1,346 (59.2%) are family households, while 927 (40.8%) are nonfamily households. The most numerous type of family households are 2-person households, comprising 657, and the most common type of nonfamily households are 1-person households, comprising 815.
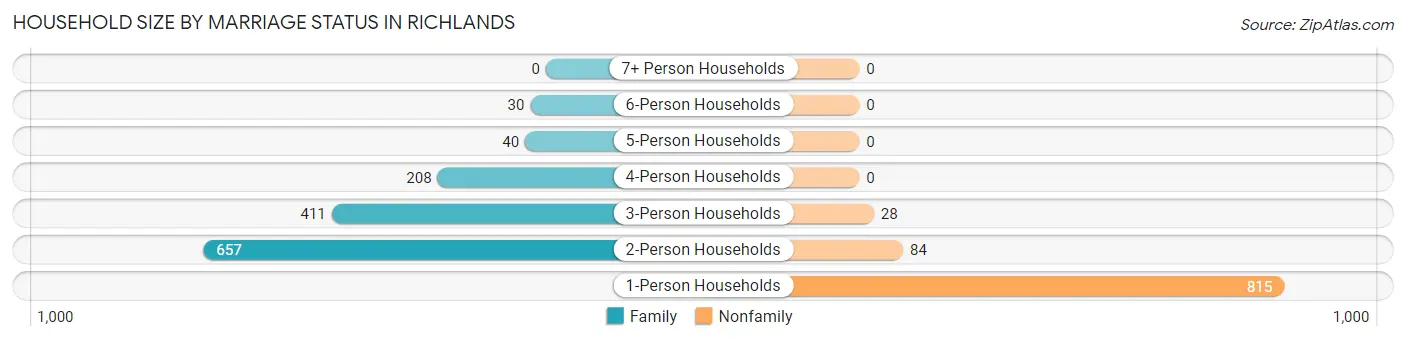
| Household Size | Family Households | Nonfamily Households |
| 1-Person Households | - | 815 (35.9%) |
| 2-Person Households | 657 (28.9%) | 84 (3.7%) |
| 3-Person Households | 411 (18.1%) | 28 (1.2%) |
| 4-Person Households | 208 (9.1%) | 0 (0.0%) |
| 5-Person Households | 40 (1.8%) | 0 (0.0%) |
| 6-Person Households | 30 (1.3%) | 0 (0.0%) |
| 7+ Person Households | 0 (0.0%) | 0 (0.0%) |
| Total | 1,346 (59.2%) | 927 (40.8%) |
Female Fertility in Richlands
Fertility by Age in Richlands
Average fertility rate in Richlands is 54.0 births per 1,000 women. Women in the age bracket of 20 to 34 years have the highest fertility rate with 71.0 births per 1,000 women. Women in the age bracket of 20 to 34 years acount for 54.0% of all women with births.
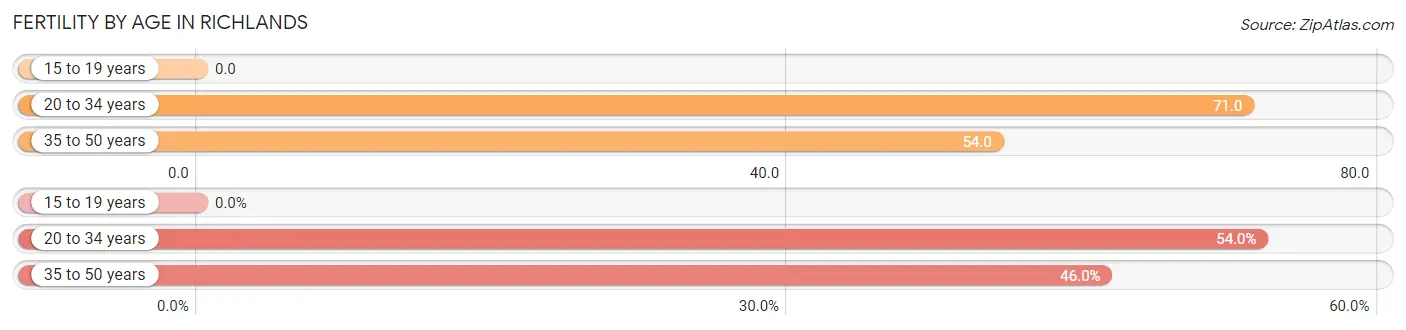
| Age Bracket | Women with Births | Births / 1,000 Women |
| 15 to 19 years | 0 (0.0%) | 0.0 |
| 20 to 34 years | 34 (54.0%) | 71.0 |
| 35 to 50 years | 29 (46.0%) | 54.0 |
| Total | 63 (100.0%) | 54.0 |
Fertility by Age by Marriage Status in Richlands
98.4% of women with births (63) in Richlands are married. The highest percentage of unmarried women with births falls into 35 to 50 years age bracket with 3.5% of them unmarried at the time of birth, while the lowest percentage of unmarried women with births belong to 20 to 34 years age bracket with 0.0% of them unmarried.
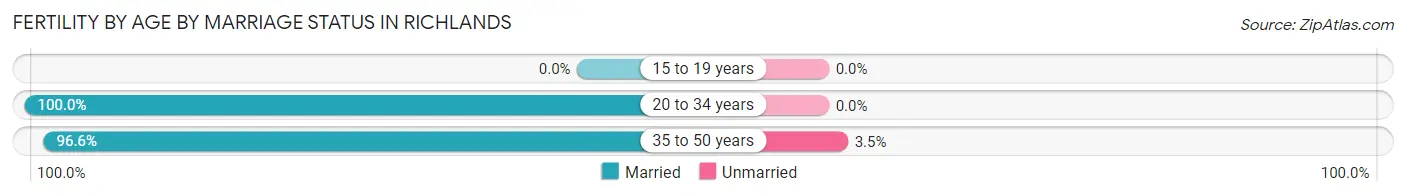
| Age Bracket | Married | Unmarried |
| 15 to 19 years | 0 (0.0%) | 0 (0.0%) |
| 20 to 34 years | 34 (100.0%) | 0 (0.0%) |
| 35 to 50 years | 28 (96.6%) | 1 (3.5%) |
| Total | 62 (98.4%) | 1 (1.6%) |
Fertility by Education in Richlands
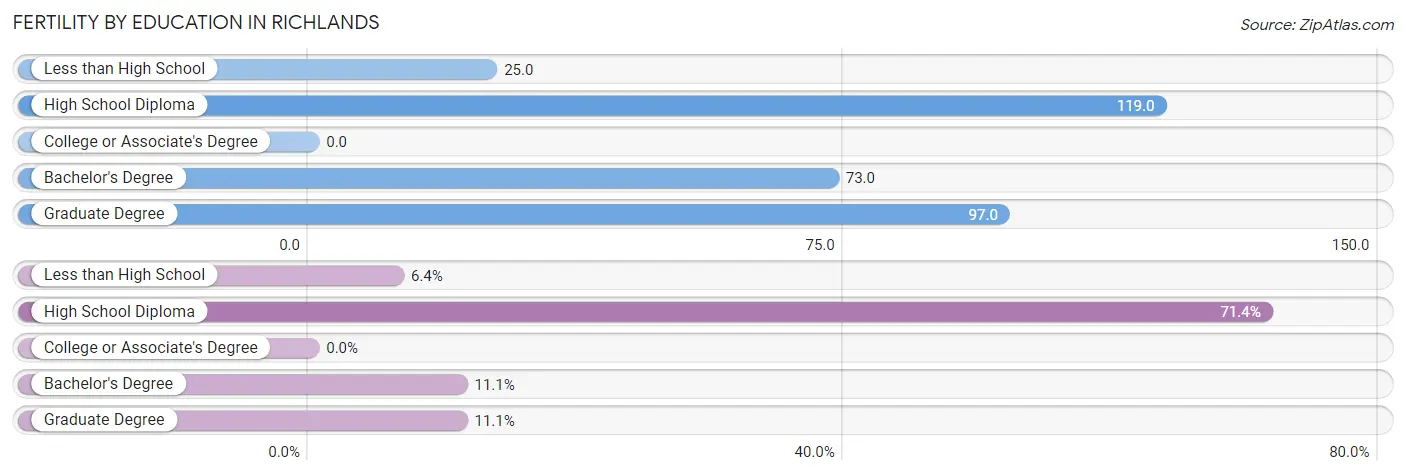
| Educational Attainment | Women with Births | Births / 1,000 Women |
| Less than High School | 4 (6.4%) | 25.0 |
| High School Diploma | 45 (71.4%) | 119.0 |
| College or Associate's Degree | 0 (0.0%) | 0.0 |
| Bachelor's Degree | 7 (11.1%) | 73.0 |
| Graduate Degree | 7 (11.1%) | 97.0 |
| Total | 63 (100.0%) | 54.0 |
Fertility by Education by Marriage Status in Richlands
1.6% of women with births in Richlands are unmarried. Women with the educational attainment of less than high school are most likely to be married with 100.0% of them married at childbirth, while women with the educational attainment of high school diploma are least likely to be married with 2.2% of them unmarried at childbirth.
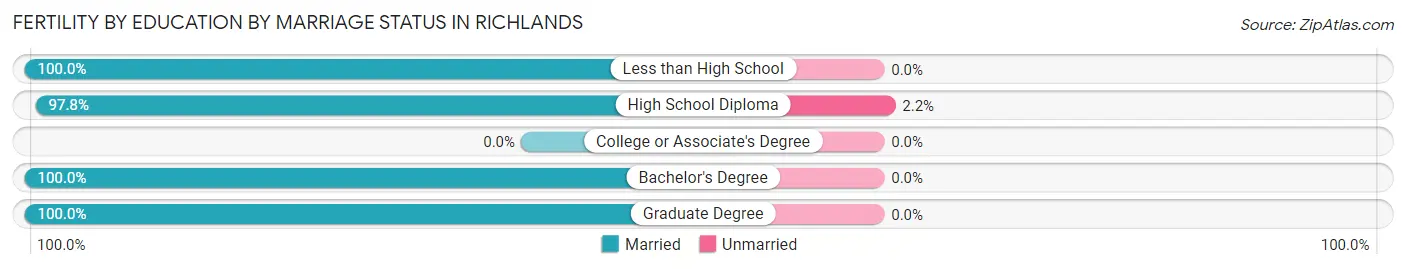
| Educational Attainment | Married | Unmarried |
| Less than High School | 4 (100.0%) | 0 (0.0%) |
| High School Diploma | 44 (97.8%) | 1 (2.2%) |
| College or Associate's Degree | 0 (0.0%) | 0 (0.0%) |
| Bachelor's Degree | 7 (100.0%) | 0 (0.0%) |
| Graduate Degree | 7 (100.0%) | 0 (0.0%) |
| Total | 62 (98.4%) | 1 (1.6%) |
Employment Characteristics in Richlands
Employment by Class of Employer in Richlands
Among the 1,828 employed individuals in Richlands, private company employees (1,345 | 73.6%), state government employees (156 | 8.5%), and local government employees (83 | 4.5%) make up the most common classes of employment.
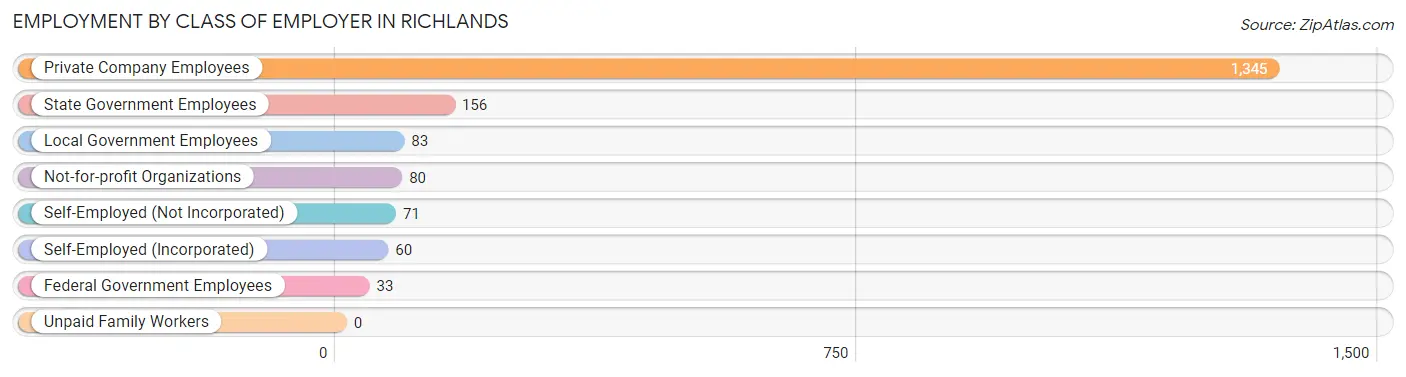
| Employer Class | # Employees | % Employees |
| Private Company Employees | 1,345 | 73.6% |
| Self-Employed (Incorporated) | 60 | 3.3% |
| Self-Employed (Not Incorporated) | 71 | 3.9% |
| Not-for-profit Organizations | 80 | 4.4% |
| Local Government Employees | 83 | 4.5% |
| State Government Employees | 156 | 8.5% |
| Federal Government Employees | 33 | 1.8% |
| Unpaid Family Workers | 0 | 0.0% |
| Total | 1,828 | 100.0% |
Employment Status by Age in Richlands
According to the labor force statistics for Richlands, out of the total population over 16 years of age (4,491), 44.9% or 2,016 individuals are in the labor force, with 8.6% or 173 of them unemployed. The age group with the highest labor force participation rate is 30 to 34 years, with 88.3% or 271 individuals in the labor force. Within the labor force, the 25 to 29 years age range has the highest percentage of unemployed individuals, with 25.4% or 92 of them being unemployed.
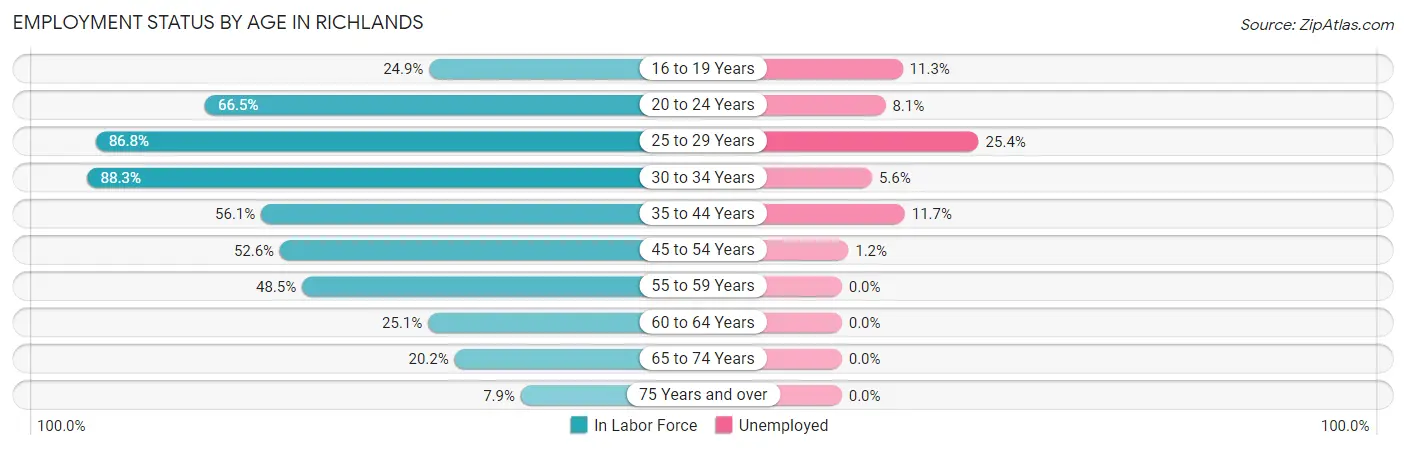
| Age Bracket | In Labor Force | Unemployed |
| 16 to 19 Years | 62 (24.9%) | 7 (11.3%) |
| 20 to 24 Years | 234 (66.5%) | 19 (8.1%) |
| 25 to 29 Years | 362 (86.8%) | 92 (25.4%) |
| 30 to 34 Years | 271 (88.3%) | 15 (5.6%) |
| 35 to 44 Years | 291 (56.1%) | 34 (11.7%) |
| 45 to 54 Years | 405 (52.6%) | 5 (1.2%) |
| 55 to 59 Years | 133 (48.5%) | 0 (0.0%) |
| 60 to 64 Years | 80 (25.1%) | 0 (0.0%) |
| 65 to 74 Years | 126 (20.2%) | 0 (0.0%) |
| 75 Years and over | 52 (7.9%) | 0 (0.0%) |
| Total | 2,016 (44.9%) | 173 (8.6%) |
Employment Status by Educational Attainment in Richlands
According to labor force statistics for Richlands, 59.2% of individuals (1,543) out of the total population between 25 and 64 years of age (2,606) are in the labor force, with 9.5% or 147 of them being unemployed. The group with the highest labor force participation rate are those with the educational attainment of college / associate degree, with 69.5% or 531 individuals in the labor force. Within the labor force, individuals with less than high school education have the highest percentage of unemployment, with 44.1% or 26 of them being unemployed.
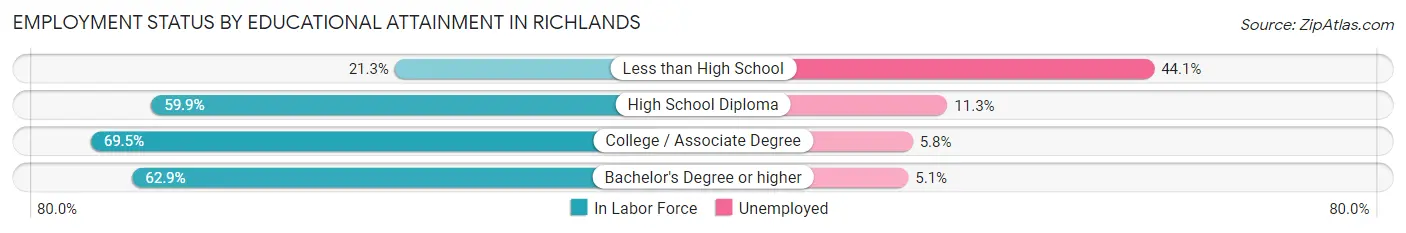
| Educational Attainment | In Labor Force | Unemployed |
| Less than High School | 59 (21.3%) | 122 (44.1%) |
| High School Diploma | 654 (59.9%) | 123 (11.3%) |
| College / Associate Degree | 531 (69.5%) | 44 (5.8%) |
| Bachelor's Degree or higher | 298 (62.9%) | 24 (5.1%) |
| Total | 1,543 (59.2%) | 248 (9.5%) |
Employment Occupations by Sex in Richlands
Management, Business, Science and Arts Occupations
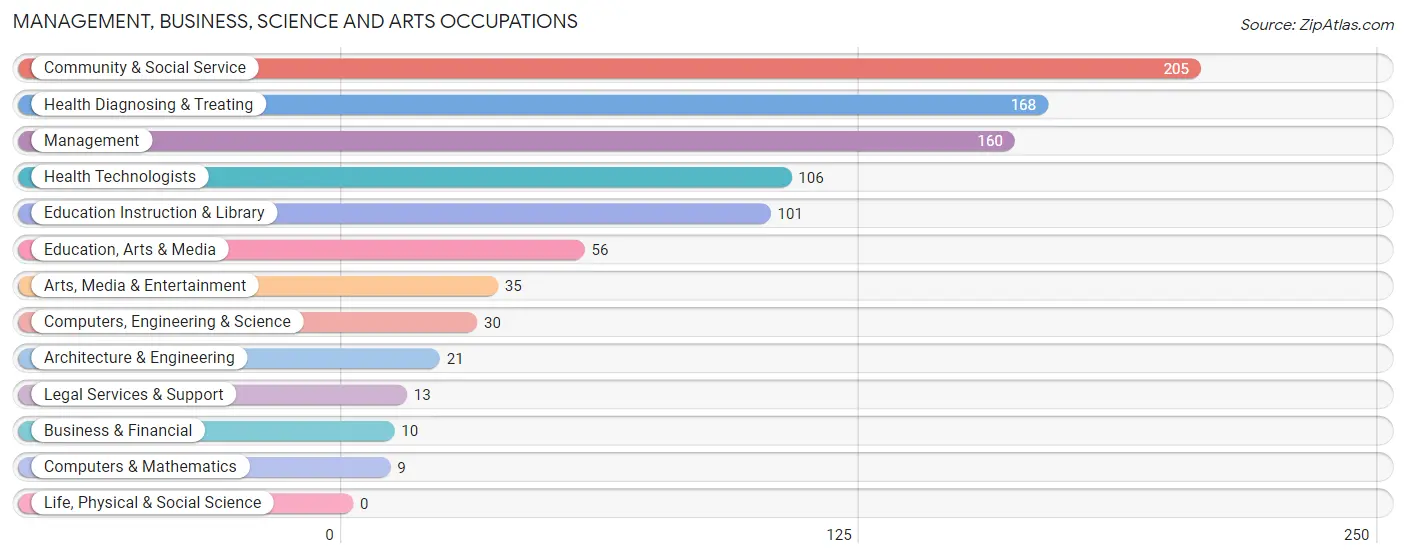
The most common Management, Business, Science and Arts occupations in Richlands are Community & Social Service (205 | 11.2%), Health Diagnosing & Treating (168 | 9.1%), Management (160 | 8.7%), Health Technologists (106 | 5.8%), and Education Instruction & Library (101 | 5.5%).
Management, Business, Science and Arts Occupations by Sex
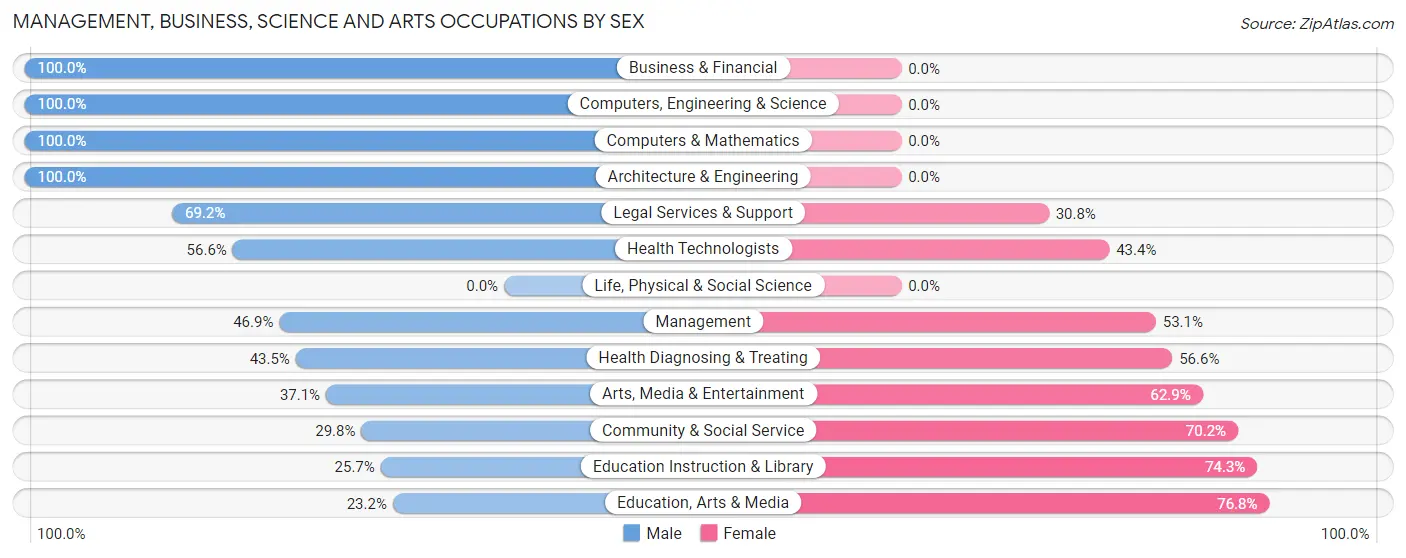
Within the Management, Business, Science and Arts occupations in Richlands, the most male-oriented occupations are Business & Financial (100.0%), Computers, Engineering & Science (100.0%), and Computers & Mathematics (100.0%), while the most female-oriented occupations are Education, Arts & Media (76.8%), Education Instruction & Library (74.3%), and Community & Social Service (70.2%).
| Occupation | Male | Female |
| Management | 75 (46.9%) | 85 (53.1%) |
| Business & Financial | 10 (100.0%) | 0 (0.0%) |
| Computers, Engineering & Science | 30 (100.0%) | 0 (0.0%) |
| Computers & Mathematics | 9 (100.0%) | 0 (0.0%) |
| Architecture & Engineering | 21 (100.0%) | 0 (0.0%) |
| Life, Physical & Social Science | 0 (0.0%) | 0 (0.0%) |
| Community & Social Service | 61 (29.8%) | 144 (70.2%) |
| Education, Arts & Media | 13 (23.2%) | 43 (76.8%) |
| Legal Services & Support | 9 (69.2%) | 4 (30.8%) |
| Education Instruction & Library | 26 (25.7%) | 75 (74.3%) |
| Arts, Media & Entertainment | 13 (37.1%) | 22 (62.9%) |
| Health Diagnosing & Treating | 73 (43.4%) | 95 (56.6%) |
| Health Technologists | 60 (56.6%) | 46 (43.4%) |
| Total (Category) | 249 (43.5%) | 324 (56.5%) |
| Total (Overall) | 1,038 (56.4%) | 801 (43.6%) |
Services Occupations
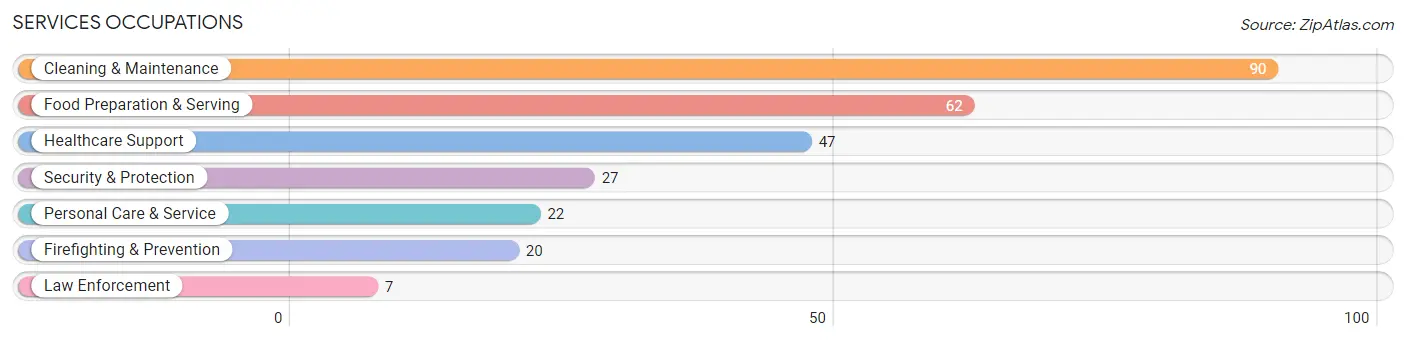
The most common Services occupations in Richlands are Cleaning & Maintenance (90 | 4.9%), Food Preparation & Serving (62 | 3.4%), Healthcare Support (47 | 2.6%), Security & Protection (27 | 1.5%), and Personal Care & Service (22 | 1.2%).
Services Occupations by Sex
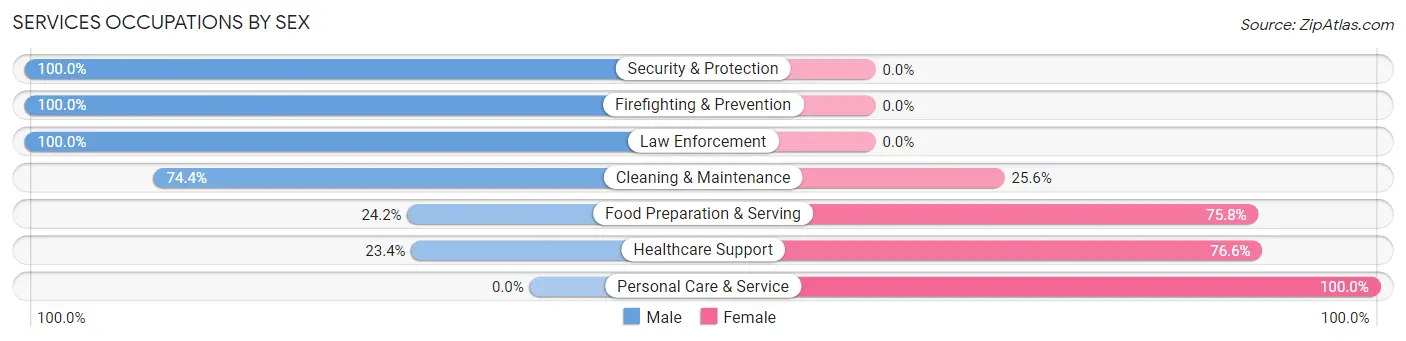
Within the Services occupations in Richlands, the most male-oriented occupations are Security & Protection (100.0%), Firefighting & Prevention (100.0%), and Law Enforcement (100.0%), while the most female-oriented occupations are Personal Care & Service (100.0%), Healthcare Support (76.6%), and Food Preparation & Serving (75.8%).
| Occupation | Male | Female |
| Healthcare Support | 11 (23.4%) | 36 (76.6%) |
| Security & Protection | 27 (100.0%) | 0 (0.0%) |
| Firefighting & Prevention | 20 (100.0%) | 0 (0.0%) |
| Law Enforcement | 7 (100.0%) | 0 (0.0%) |
| Food Preparation & Serving | 15 (24.2%) | 47 (75.8%) |
| Cleaning & Maintenance | 67 (74.4%) | 23 (25.6%) |
| Personal Care & Service | 0 (0.0%) | 22 (100.0%) |
| Total (Category) | 120 (48.4%) | 128 (51.6%) |
| Total (Overall) | 1,038 (56.4%) | 801 (43.6%) |
Sales and Office Occupations
The most common Sales and Office occupations in Richlands are Sales & Related (440 | 23.9%), and Office & Administration (164 | 8.9%).
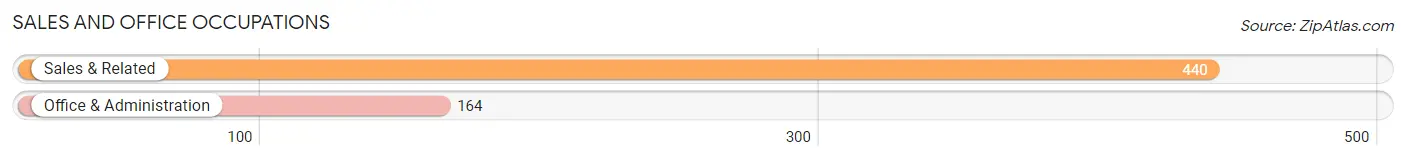
Sales and Office Occupations by Sex
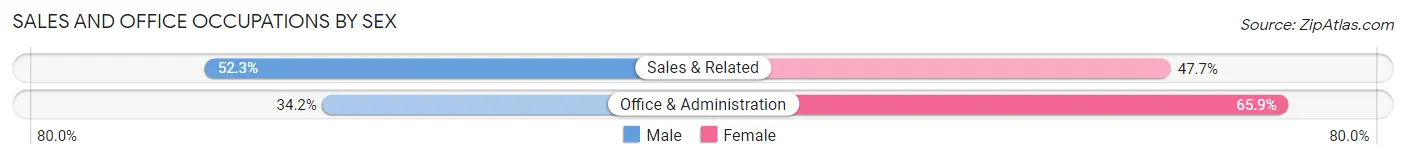
| Occupation | Male | Female |
| Sales & Related | 230 (52.3%) | 210 (47.7%) |
| Office & Administration | 56 (34.2%) | 108 (65.8%) |
| Total (Category) | 286 (47.3%) | 318 (52.6%) |
| Total (Overall) | 1,038 (56.4%) | 801 (43.6%) |
Natural Resources, Construction and Maintenance Occupations
The most common Natural Resources, Construction and Maintenance occupations in Richlands are Installation, Maintenance & Repair (107 | 5.8%), and Construction & Extraction (73 | 4.0%).
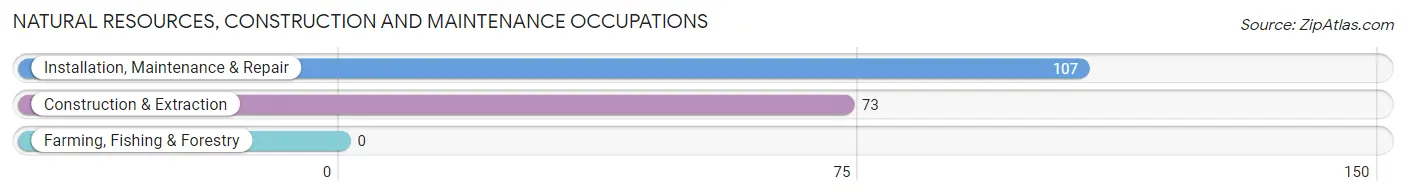
Natural Resources, Construction and Maintenance Occupations by Sex
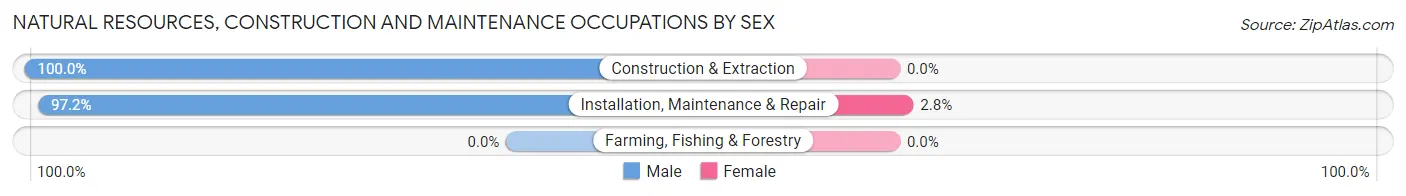
| Occupation | Male | Female |
| Farming, Fishing & Forestry | 0 (0.0%) | 0 (0.0%) |
| Construction & Extraction | 73 (100.0%) | 0 (0.0%) |
| Installation, Maintenance & Repair | 104 (97.2%) | 3 (2.8%) |
| Total (Category) | 177 (98.3%) | 3 (1.7%) |
| Total (Overall) | 1,038 (56.4%) | 801 (43.6%) |
Production, Transportation and Moving Occupations
The most common Production, Transportation and Moving occupations in Richlands are Transportation (104 | 5.7%), Production (91 | 5.0%), and Material Moving (39 | 2.1%).

Production, Transportation and Moving Occupations by Sex
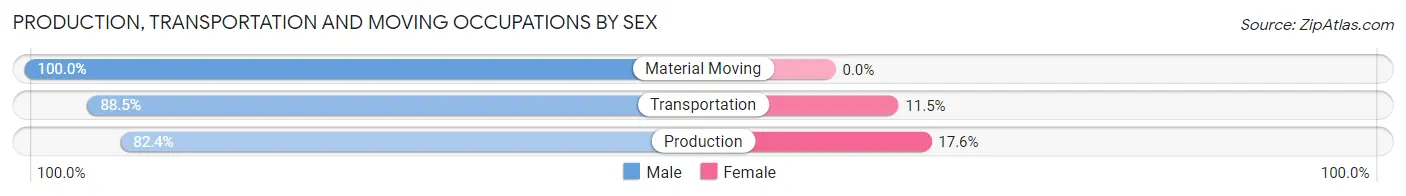
| Occupation | Male | Female |
| Production | 75 (82.4%) | 16 (17.6%) |
| Transportation | 92 (88.5%) | 12 (11.5%) |
| Material Moving | 39 (100.0%) | 0 (0.0%) |
| Total (Category) | 206 (88.0%) | 28 (12.0%) |
| Total (Overall) | 1,038 (56.4%) | 801 (43.6%) |
Employment Industries by Sex in Richlands
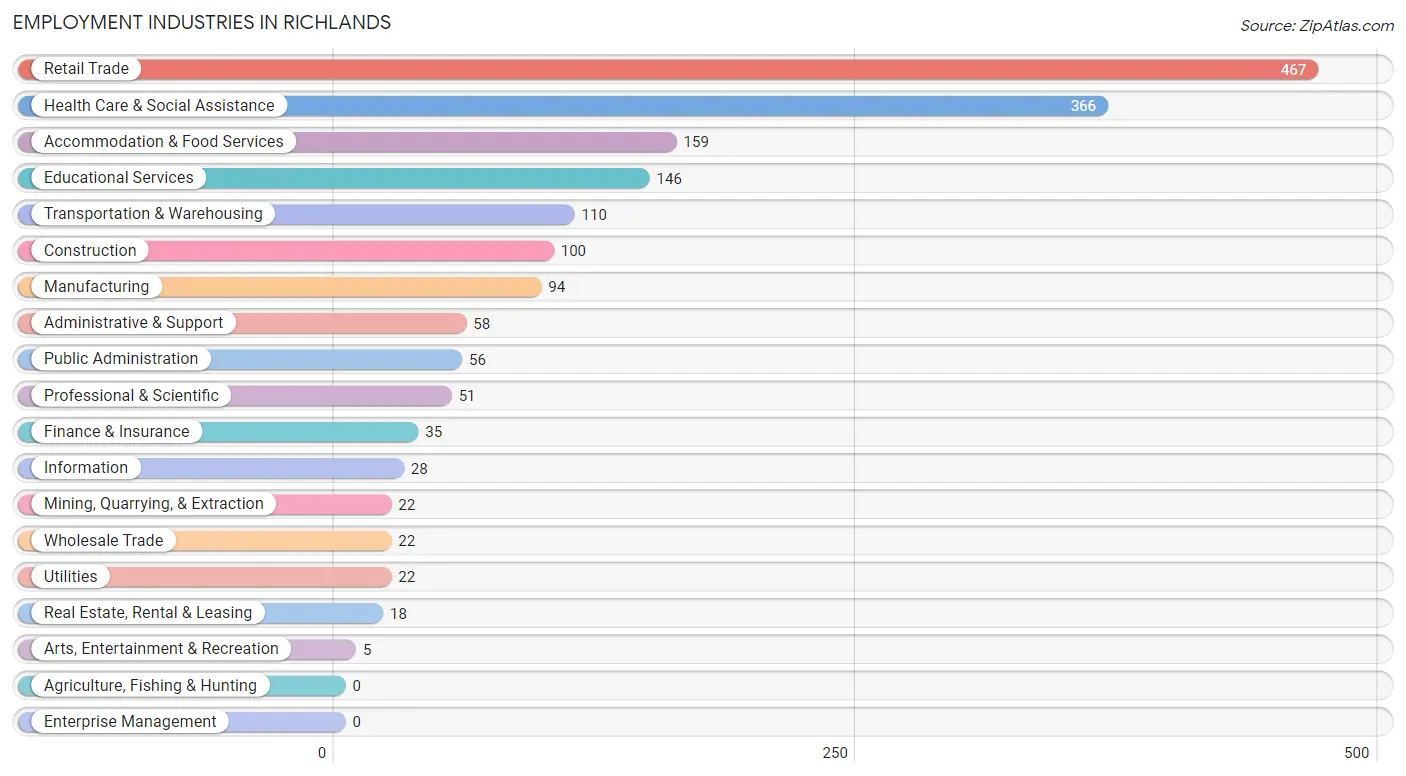
Employment Industries in Richlands
The major employment industries in Richlands include Retail Trade (467 | 25.4%), Health Care & Social Assistance (366 | 19.9%), Accommodation & Food Services (159 | 8.6%), Educational Services (146 | 7.9%), and Transportation & Warehousing (110 | 6.0%).
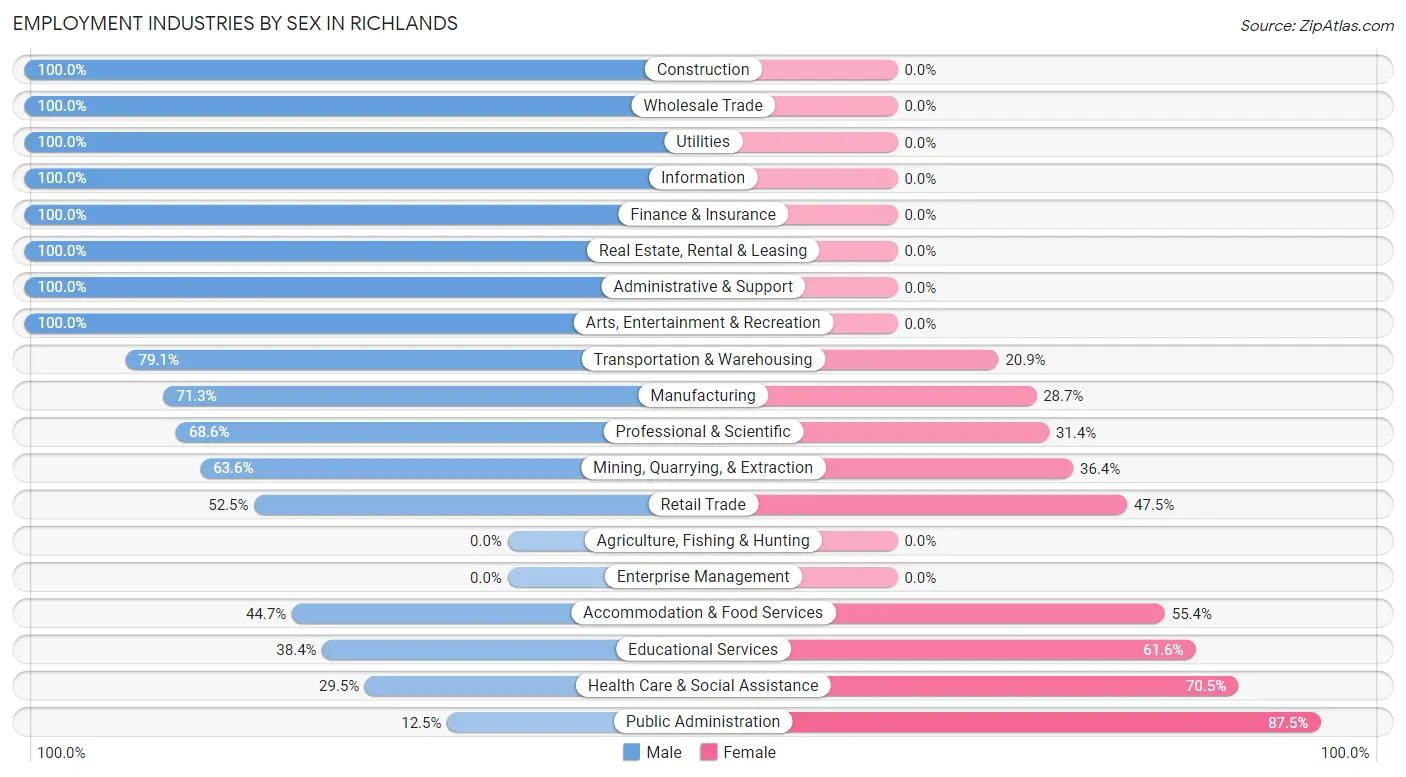
Employment Industries by Sex in Richlands
The Richlands industries that see more men than women are Construction (100.0%), Wholesale Trade (100.0%), and Utilities (100.0%), whereas the industries that tend to have a higher number of women are Public Administration (87.5%), Health Care & Social Assistance (70.5%), and Educational Services (61.6%).
| Industry | Male | Female |
| Agriculture, Fishing & Hunting | 0 (0.0%) | 0 (0.0%) |
| Mining, Quarrying, & Extraction | 14 (63.6%) | 8 (36.4%) |
| Construction | 100 (100.0%) | 0 (0.0%) |
| Manufacturing | 67 (71.3%) | 27 (28.7%) |
| Wholesale Trade | 22 (100.0%) | 0 (0.0%) |
| Retail Trade | 245 (52.5%) | 222 (47.5%) |
| Transportation & Warehousing | 87 (79.1%) | 23 (20.9%) |
| Utilities | 22 (100.0%) | 0 (0.0%) |
| Information | 28 (100.0%) | 0 (0.0%) |
| Finance & Insurance | 35 (100.0%) | 0 (0.0%) |
| Real Estate, Rental & Leasing | 18 (100.0%) | 0 (0.0%) |
| Professional & Scientific | 35 (68.6%) | 16 (31.4%) |
| Enterprise Management | 0 (0.0%) | 0 (0.0%) |
| Administrative & Support | 58 (100.0%) | 0 (0.0%) |
| Educational Services | 56 (38.4%) | 90 (61.6%) |
| Health Care & Social Assistance | 108 (29.5%) | 258 (70.5%) |
| Arts, Entertainment & Recreation | 5 (100.0%) | 0 (0.0%) |
| Accommodation & Food Services | 71 (44.7%) | 88 (55.3%) |
| Public Administration | 7 (12.5%) | 49 (87.5%) |
| Total | 1,038 (56.4%) | 801 (43.6%) |
Education in Richlands
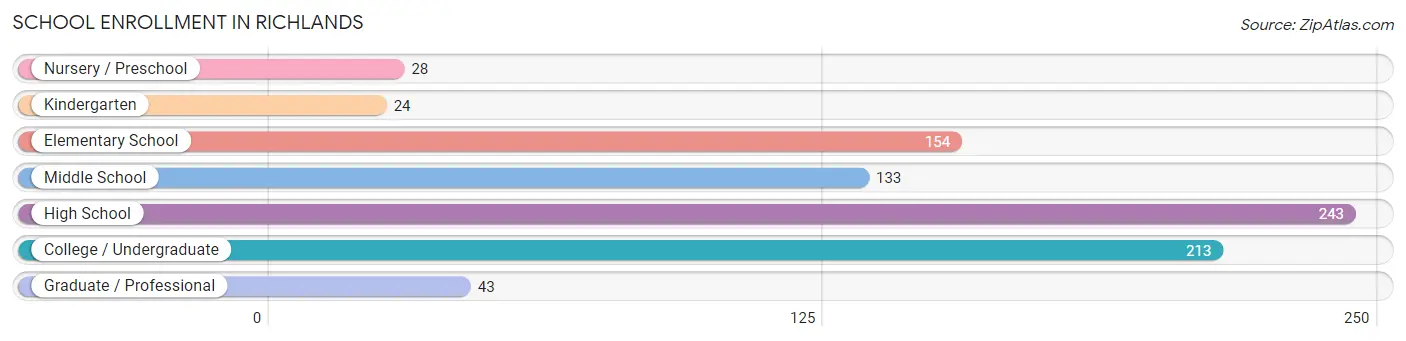
School Enrollment in Richlands
The most common levels of schooling among the 838 students in Richlands are high school (243 | 29.0%), college / undergraduate (213 | 25.4%), and elementary school (154 | 18.4%).
| School Level | # Students | % Students |
| Nursery / Preschool | 28 | 3.3% |
| Kindergarten | 24 | 2.9% |
| Elementary School | 154 | 18.4% |
| Middle School | 133 | 15.9% |
| High School | 243 | 29.0% |
| College / Undergraduate | 213 | 25.4% |
| Graduate / Professional | 43 | 5.1% |
| Total | 838 | 100.0% |
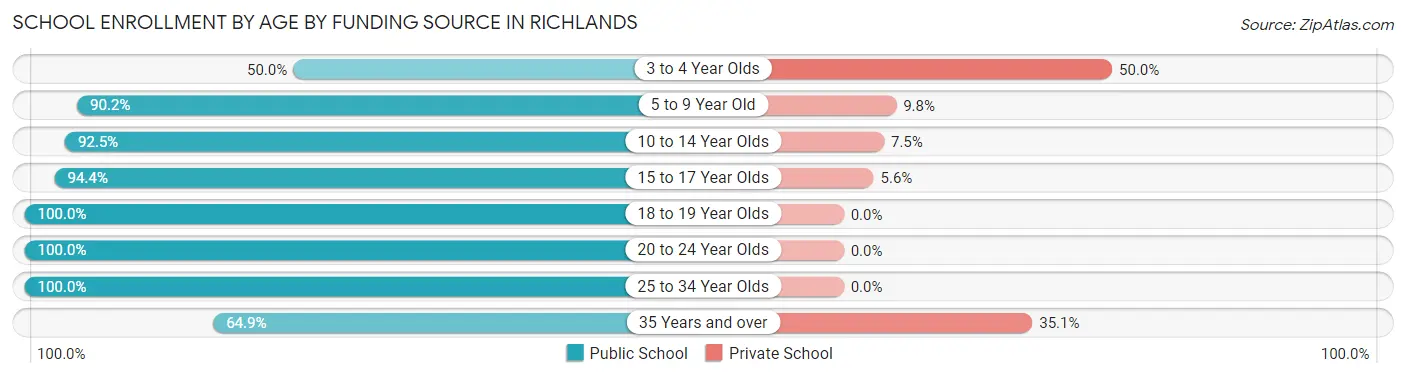
School Enrollment by Age by Funding Source in Richlands
Out of a total of 838 students who are enrolled in schools in Richlands, 61 (7.3%) attend a private institution, while the remaining 777 (92.7%) are enrolled in public schools. The age group of 3 to 4 year olds has the highest likelihood of being enrolled in private schools, with 6 (50.0% in the age bracket) enrolled. Conversely, the age group of 18 to 19 year olds has the lowest likelihood of being enrolled in a private school, with 74 (100.0% in the age bracket) attending a public institution.
| Age Bracket | Public School | Private School |
| 3 to 4 Year Olds | 6 (50.0%) | 6 (50.0%) |
| 5 to 9 Year Old | 175 (90.2%) | 19 (9.8%) |
| 10 to 14 Year Olds | 123 (92.5%) | 10 (7.5%) |
| 15 to 17 Year Olds | 220 (94.4%) | 13 (5.6%) |
| 18 to 19 Year Olds | 74 (100.0%) | 0 (0.0%) |
| 20 to 24 Year Olds | 120 (100.0%) | 0 (0.0%) |
| 25 to 34 Year Olds | 35 (100.0%) | 0 (0.0%) |
| 35 Years and over | 24 (64.9%) | 13 (35.1%) |
| Total | 777 (92.7%) | 61 (7.3%) |
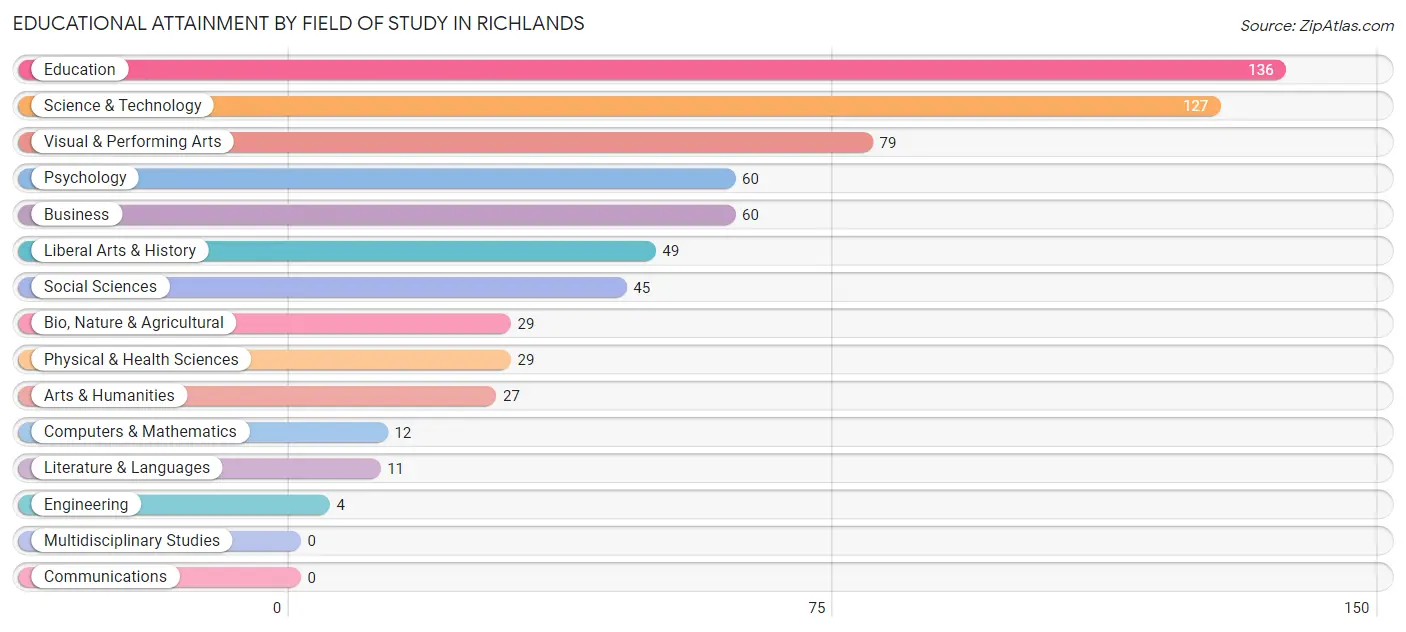
Educational Attainment by Field of Study in Richlands
Education (136 | 20.4%), science & technology (127 | 19.0%), visual & performing arts (79 | 11.8%), psychology (60 | 9.0%), and business (60 | 9.0%) are the most common fields of study among 668 individuals in Richlands who have obtained a bachelor's degree or higher.
| Field of Study | # Graduates | % Graduates |
| Computers & Mathematics | 12 | 1.8% |
| Bio, Nature & Agricultural | 29 | 4.3% |
| Physical & Health Sciences | 29 | 4.3% |
| Psychology | 60 | 9.0% |
| Social Sciences | 45 | 6.7% |
| Engineering | 4 | 0.6% |
| Multidisciplinary Studies | 0 | 0.0% |
| Science & Technology | 127 | 19.0% |
| Business | 60 | 9.0% |
| Education | 136 | 20.4% |
| Literature & Languages | 11 | 1.7% |
| Liberal Arts & History | 49 | 7.3% |
| Visual & Performing Arts | 79 | 11.8% |
| Communications | 0 | 0.0% |
| Arts & Humanities | 27 | 4.0% |
| Total | 668 | 100.0% |
Transportation & Commute in Richlands
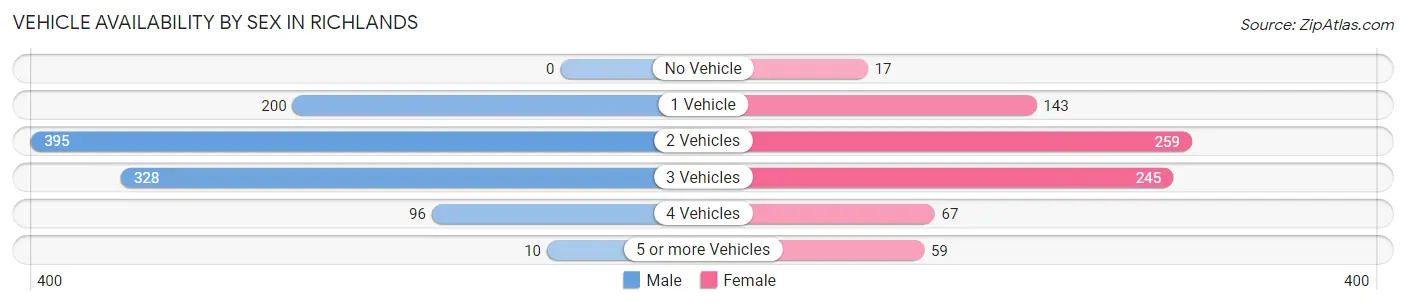
Vehicle Availability by Sex in Richlands
The most prevalent vehicle ownership categories in Richlands are males with 2 vehicles (395, accounting for 38.4%) and females with 2 vehicles (259, making up 50.0%).
| Vehicles Available | Male | Female |
| No Vehicle | 0 (0.0%) | 17 (2.1%) |
| 1 Vehicle | 200 (19.4%) | 143 (18.1%) |
| 2 Vehicles | 395 (38.4%) | 259 (32.8%) |
| 3 Vehicles | 328 (31.9%) | 245 (31.0%) |
| 4 Vehicles | 96 (9.3%) | 67 (8.5%) |
| 5 or more Vehicles | 10 (1.0%) | 59 (7.5%) |
| Total | 1,029 (100.0%) | 790 (100.0%) |
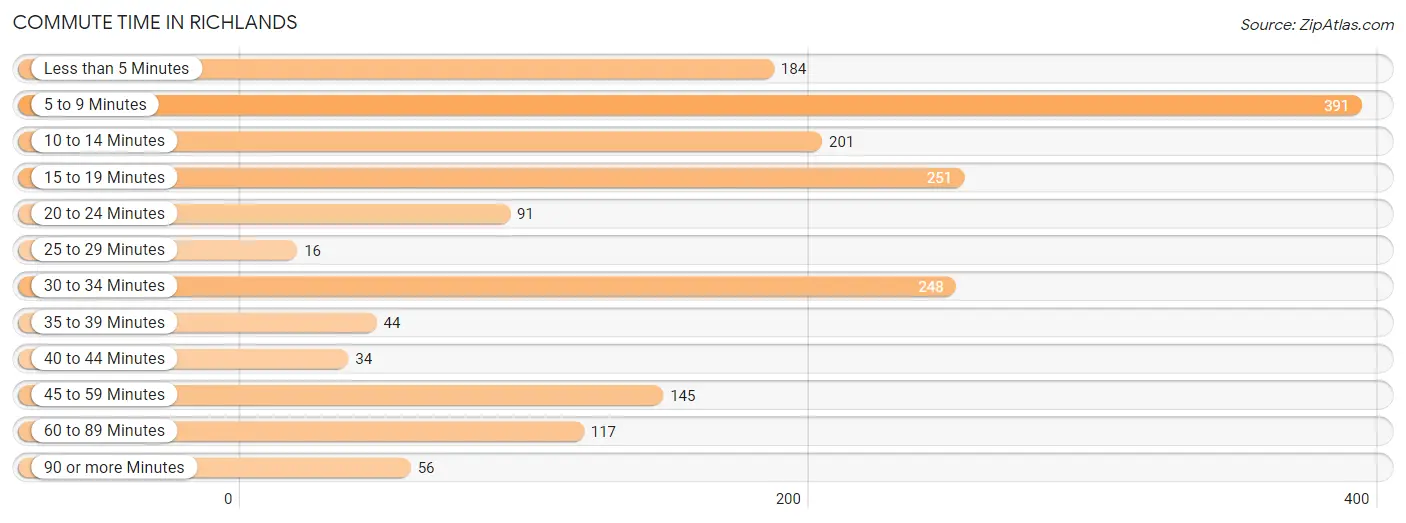
Commute Time in Richlands
The most frequently occuring commute durations in Richlands are 5 to 9 minutes (391 commuters, 22.0%), 15 to 19 minutes (251 commuters, 14.1%), and 30 to 34 minutes (248 commuters, 14.0%).
| Commute Time | # Commuters | % Commuters |
| Less than 5 Minutes | 184 | 10.3% |
| 5 to 9 Minutes | 391 | 22.0% |
| 10 to 14 Minutes | 201 | 11.3% |
| 15 to 19 Minutes | 251 | 14.1% |
| 20 to 24 Minutes | 91 | 5.1% |
| 25 to 29 Minutes | 16 | 0.9% |
| 30 to 34 Minutes | 248 | 14.0% |
| 35 to 39 Minutes | 44 | 2.5% |
| 40 to 44 Minutes | 34 | 1.9% |
| 45 to 59 Minutes | 145 | 8.2% |
| 60 to 89 Minutes | 117 | 6.6% |
| 90 or more Minutes | 56 | 3.2% |
Commute Time by Sex in Richlands
The most common commute times in Richlands are 5 to 9 minutes (207 commuters, 20.5%) for males and 5 to 9 minutes (184 commuters, 23.9%) for females.
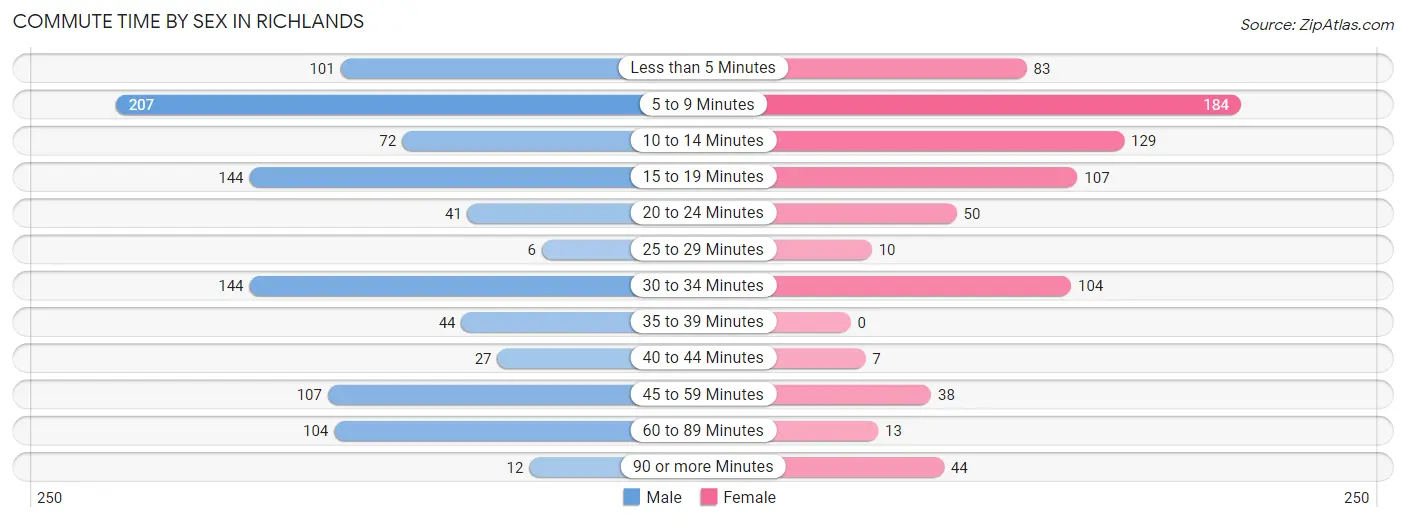
| Commute Time | Male | Female |
| Less than 5 Minutes | 101 (10.0%) | 83 (10.8%) |
| 5 to 9 Minutes | 207 (20.5%) | 184 (23.9%) |
| 10 to 14 Minutes | 72 (7.1%) | 129 (16.8%) |
| 15 to 19 Minutes | 144 (14.3%) | 107 (13.9%) |
| 20 to 24 Minutes | 41 (4.1%) | 50 (6.5%) |
| 25 to 29 Minutes | 6 (0.6%) | 10 (1.3%) |
| 30 to 34 Minutes | 144 (14.3%) | 104 (13.5%) |
| 35 to 39 Minutes | 44 (4.4%) | 0 (0.0%) |
| 40 to 44 Minutes | 27 (2.7%) | 7 (0.9%) |
| 45 to 59 Minutes | 107 (10.6%) | 38 (4.9%) |
| 60 to 89 Minutes | 104 (10.3%) | 13 (1.7%) |
| 90 or more Minutes | 12 (1.2%) | 44 (5.7%) |
Time of Departure to Work by Sex in Richlands
The most frequent times of departure to work in Richlands are 7:00 AM to 7:29 AM (197, 19.5%) for males and 8:00 AM to 8:29 AM (141, 18.3%) for females.
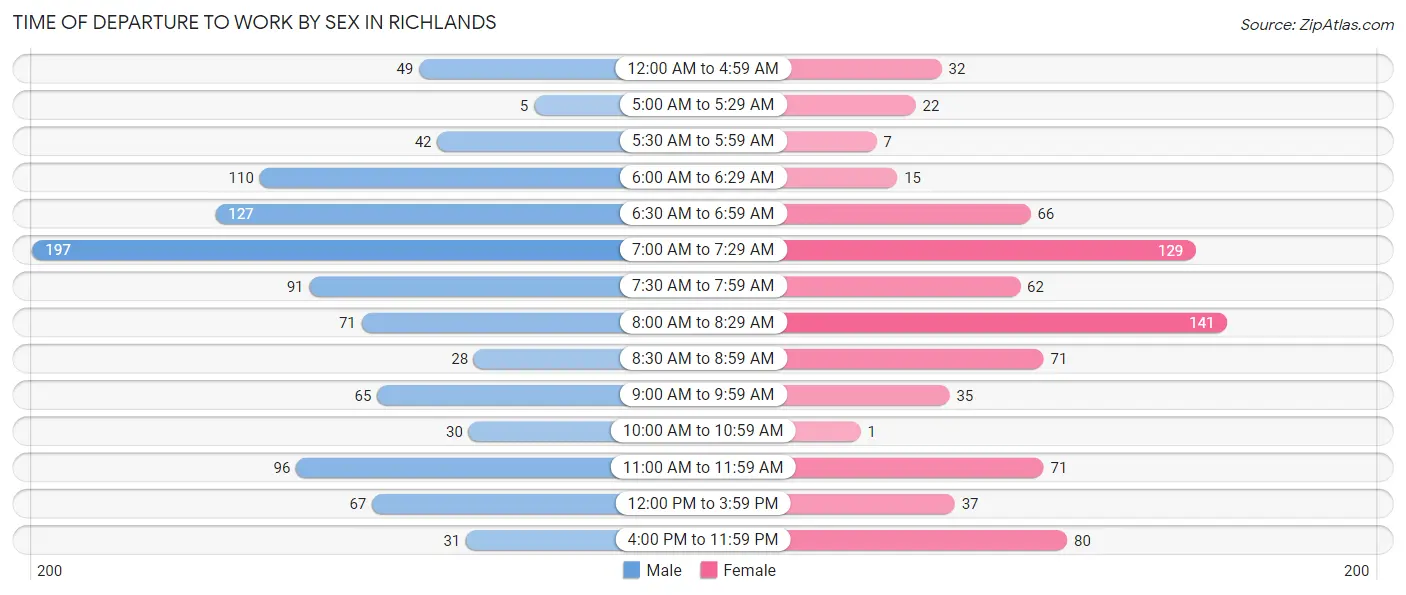
| Time of Departure | Male | Female |
| 12:00 AM to 4:59 AM | 49 (4.9%) | 32 (4.2%) |
| 5:00 AM to 5:29 AM | 5 (0.5%) | 22 (2.9%) |
| 5:30 AM to 5:59 AM | 42 (4.2%) | 7 (0.9%) |
| 6:00 AM to 6:29 AM | 110 (10.9%) | 15 (1.9%) |
| 6:30 AM to 6:59 AM | 127 (12.6%) | 66 (8.6%) |
| 7:00 AM to 7:29 AM | 197 (19.5%) | 129 (16.8%) |
| 7:30 AM to 7:59 AM | 91 (9.0%) | 62 (8.1%) |
| 8:00 AM to 8:29 AM | 71 (7.0%) | 141 (18.3%) |
| 8:30 AM to 8:59 AM | 28 (2.8%) | 71 (9.2%) |
| 9:00 AM to 9:59 AM | 65 (6.4%) | 35 (4.5%) |
| 10:00 AM to 10:59 AM | 30 (3.0%) | 1 (0.1%) |
| 11:00 AM to 11:59 AM | 96 (9.5%) | 71 (9.2%) |
| 12:00 PM to 3:59 PM | 67 (6.6%) | 37 (4.8%) |
| 4:00 PM to 11:59 PM | 31 (3.1%) | 80 (10.4%) |
| Total | 1,009 (100.0%) | 769 (100.0%) |
Housing Occupancy in Richlands
Occupancy by Ownership in Richlands
Of the total 2,273 dwellings in Richlands, owner-occupied units account for 1,482 (65.2%), while renter-occupied units make up 791 (34.8%).
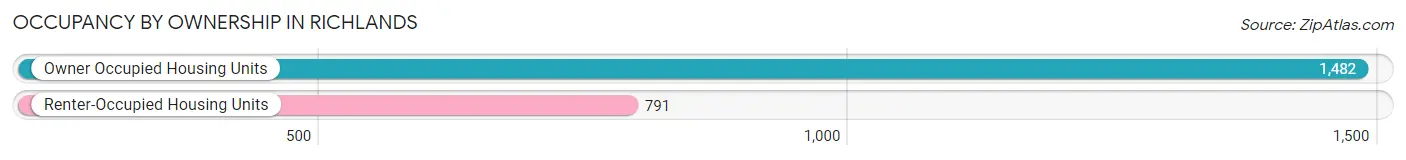
| Occupancy | # Housing Units | % Housing Units |
| Owner Occupied Housing Units | 1,482 | 65.2% |
| Renter-Occupied Housing Units | 791 | 34.8% |
| Total Occupied Housing Units | 2,273 | 100.0% |
Occupancy by Household Size in Richlands
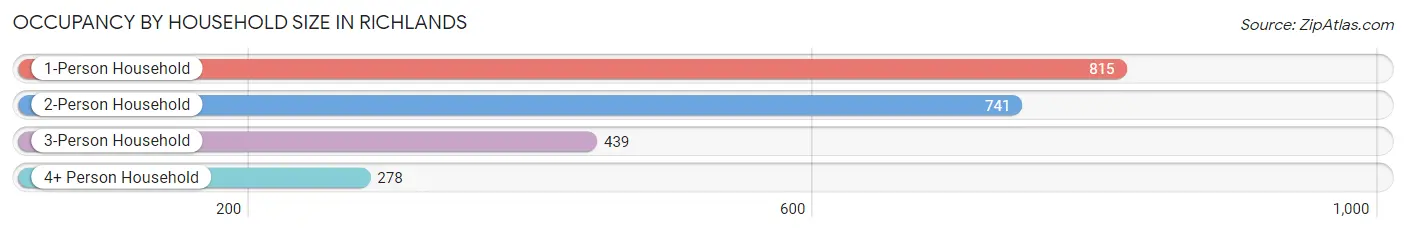
| Household Size | # Housing Units | % Housing Units |
| 1-Person Household | 815 | 35.9% |
| 2-Person Household | 741 | 32.6% |
| 3-Person Household | 439 | 19.3% |
| 4+ Person Household | 278 | 12.2% |
| Total Housing Units | 2,273 | 100.0% |
Occupancy by Ownership by Household Size in Richlands
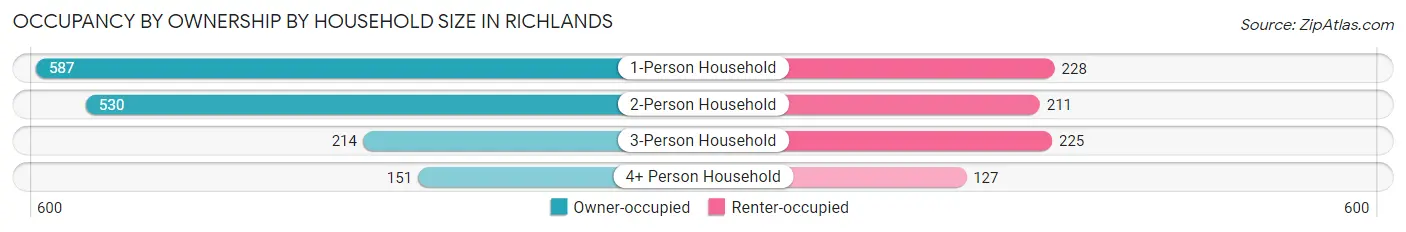
| Household Size | Owner-occupied | Renter-occupied |
| 1-Person Household | 587 (72.0%) | 228 (28.0%) |
| 2-Person Household | 530 (71.5%) | 211 (28.5%) |
| 3-Person Household | 214 (48.7%) | 225 (51.2%) |
| 4+ Person Household | 151 (54.3%) | 127 (45.7%) |
| Total Housing Units | 1,482 (65.2%) | 791 (34.8%) |
Occupancy by Educational Attainment in Richlands
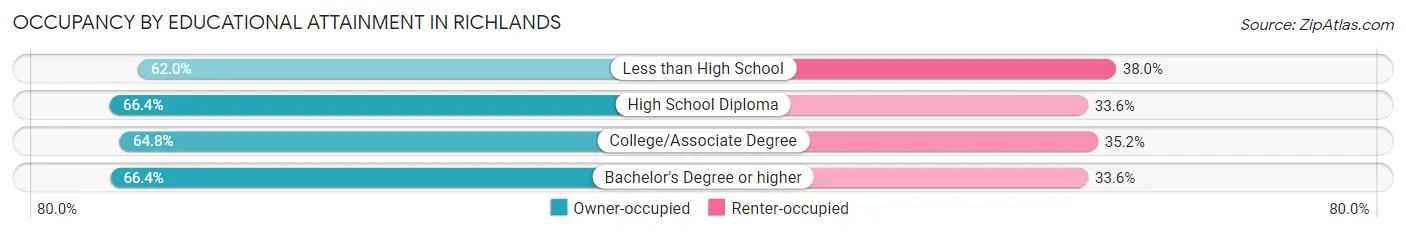
| Household Size | Owner-occupied | Renter-occupied |
| Less than High School | 199 (62.0%) | 122 (38.0%) |
| High School Diploma | 495 (66.4%) | 250 (33.6%) |
| College/Associate Degree | 557 (64.8%) | 302 (35.2%) |
| Bachelor's Degree or higher | 231 (66.4%) | 117 (33.6%) |
Occupancy by Age of Householder in Richlands
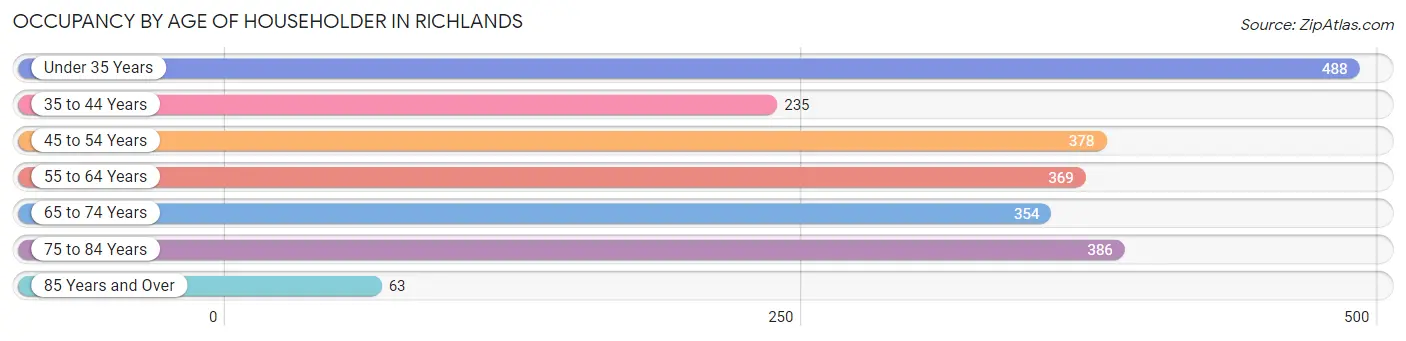
| Age Bracket | # Households | % Households |
| Under 35 Years | 488 | 21.5% |
| 35 to 44 Years | 235 | 10.3% |
| 45 to 54 Years | 378 | 16.6% |
| 55 to 64 Years | 369 | 16.2% |
| 65 to 74 Years | 354 | 15.6% |
| 75 to 84 Years | 386 | 17.0% |
| 85 Years and Over | 63 | 2.8% |
| Total | 2,273 | 100.0% |
Housing Finances in Richlands
Median Income by Occupancy in Richlands
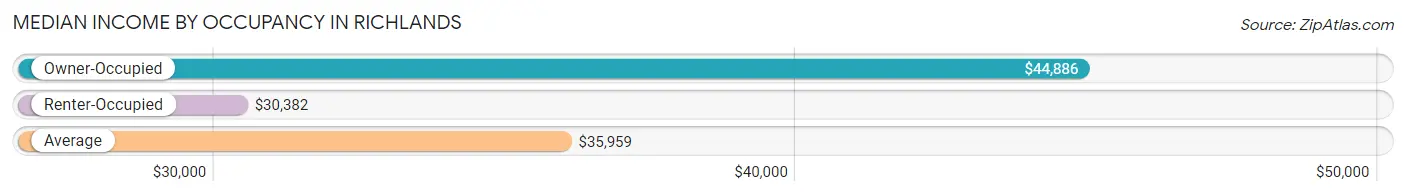
| Occupancy Type | # Households | Median Income |
| Owner-Occupied | 1,482 (65.2%) | $44,886 |
| Renter-Occupied | 791 (34.8%) | $30,382 |
| Average | 2,273 (100.0%) | $35,959 |
Occupancy by Householder Income Bracket in Richlands
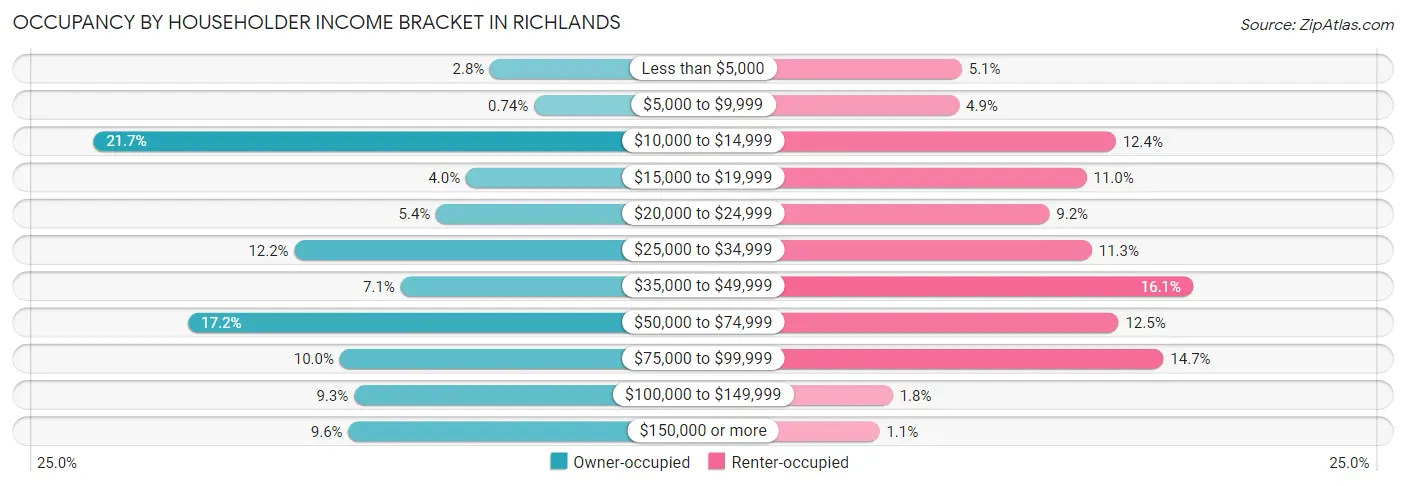
| Income Bracket | Owner-occupied | Renter-occupied |
| Less than $5,000 | 42 (2.8%) | 40 (5.1%) |
| $5,000 to $9,999 | 11 (0.7%) | 39 (4.9%) |
| $10,000 to $14,999 | 322 (21.7%) | 98 (12.4%) |
| $15,000 to $19,999 | 59 (4.0%) | 87 (11.0%) |
| $20,000 to $24,999 | 80 (5.4%) | 73 (9.2%) |
| $25,000 to $34,999 | 180 (12.1%) | 89 (11.3%) |
| $35,000 to $49,999 | 105 (7.1%) | 127 (16.1%) |
| $50,000 to $74,999 | 255 (17.2%) | 99 (12.5%) |
| $75,000 to $99,999 | 148 (10.0%) | 116 (14.7%) |
| $100,000 to $149,999 | 138 (9.3%) | 14 (1.8%) |
| $150,000 or more | 142 (9.6%) | 9 (1.1%) |
| Total | 1,482 (100.0%) | 791 (100.0%) |
Monthly Housing Cost Tiers in Richlands
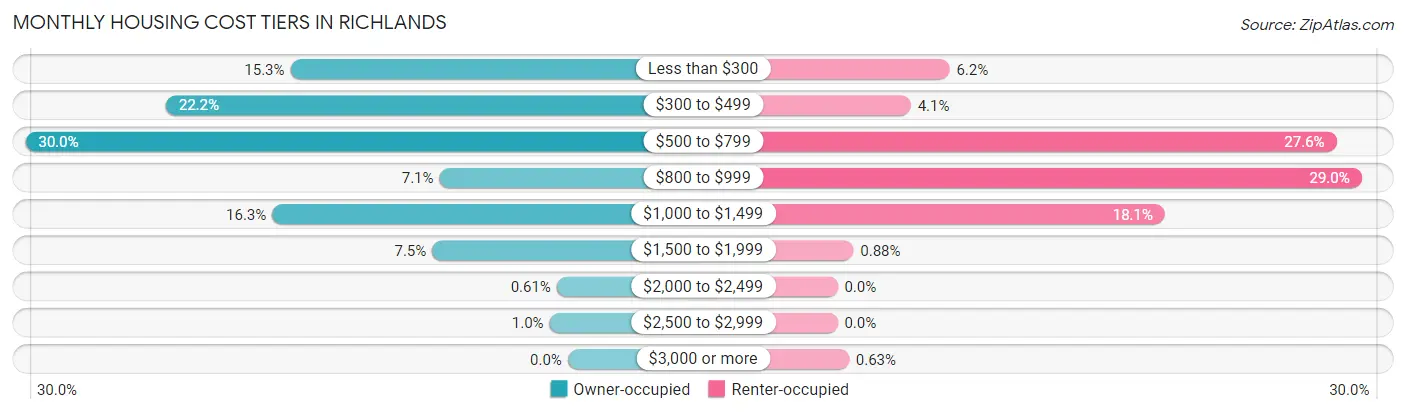
| Monthly Cost | Owner-occupied | Renter-occupied |
| Less than $300 | 227 (15.3%) | 49 (6.2%) |
| $300 to $499 | 329 (22.2%) | 32 (4.1%) |
| $500 to $799 | 444 (30.0%) | 218 (27.6%) |
| $800 to $999 | 105 (7.1%) | 229 (28.9%) |
| $1,000 to $1,499 | 242 (16.3%) | 143 (18.1%) |
| $1,500 to $1,999 | 111 (7.5%) | 7 (0.9%) |
| $2,000 to $2,499 | 9 (0.6%) | 0 (0.0%) |
| $2,500 to $2,999 | 15 (1.0%) | 0 (0.0%) |
| $3,000 or more | 0 (0.0%) | 5 (0.6%) |
| Total | 1,482 (100.0%) | 791 (100.0%) |
Physical Housing Characteristics in Richlands
Housing Structures in Richlands
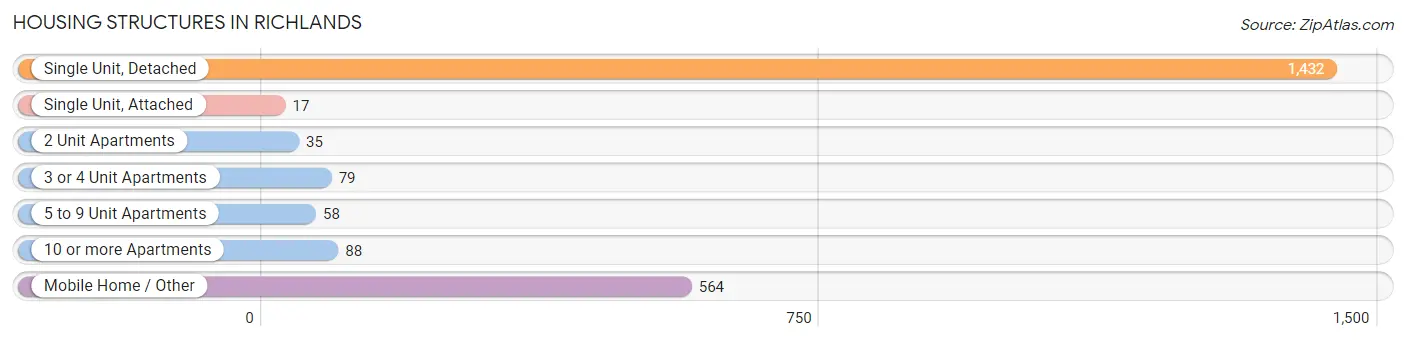
| Structure Type | # Housing Units | % Housing Units |
| Single Unit, Detached | 1,432 | 63.0% |
| Single Unit, Attached | 17 | 0.7% |
| 2 Unit Apartments | 35 | 1.5% |
| 3 or 4 Unit Apartments | 79 | 3.5% |
| 5 to 9 Unit Apartments | 58 | 2.5% |
| 10 or more Apartments | 88 | 3.9% |
| Mobile Home / Other | 564 | 24.8% |
| Total | 2,273 | 100.0% |
Housing Structures by Occupancy in Richlands
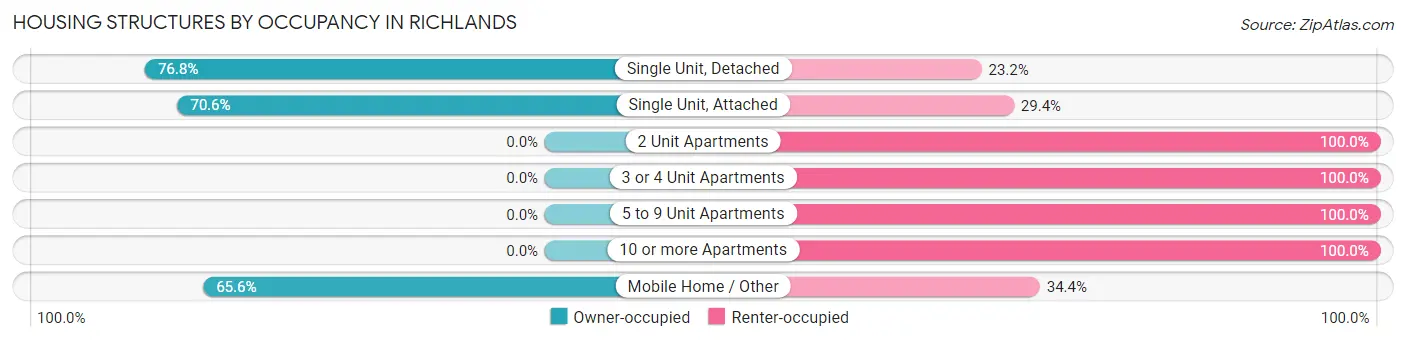
| Structure Type | Owner-occupied | Renter-occupied |
| Single Unit, Detached | 1,100 (76.8%) | 332 (23.2%) |
| Single Unit, Attached | 12 (70.6%) | 5 (29.4%) |
| 2 Unit Apartments | 0 (0.0%) | 35 (100.0%) |
| 3 or 4 Unit Apartments | 0 (0.0%) | 79 (100.0%) |
| 5 to 9 Unit Apartments | 0 (0.0%) | 58 (100.0%) |
| 10 or more Apartments | 0 (0.0%) | 88 (100.0%) |
| Mobile Home / Other | 370 (65.6%) | 194 (34.4%) |
| Total | 1,482 (65.2%) | 791 (34.8%) |
Housing Structures by Number of Rooms in Richlands
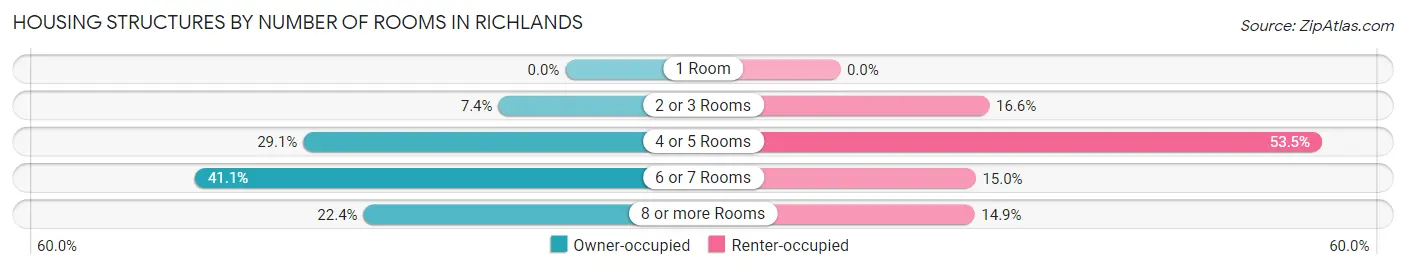
| Number of Rooms | Owner-occupied | Renter-occupied |
| 1 Room | 0 (0.0%) | 0 (0.0%) |
| 2 or 3 Rooms | 110 (7.4%) | 131 (16.6%) |
| 4 or 5 Rooms | 431 (29.1%) | 423 (53.5%) |
| 6 or 7 Rooms | 609 (41.1%) | 119 (15.0%) |
| 8 or more Rooms | 332 (22.4%) | 118 (14.9%) |
| Total | 1,482 (100.0%) | 791 (100.0%) |
Housing Structure by Heating Type in Richlands
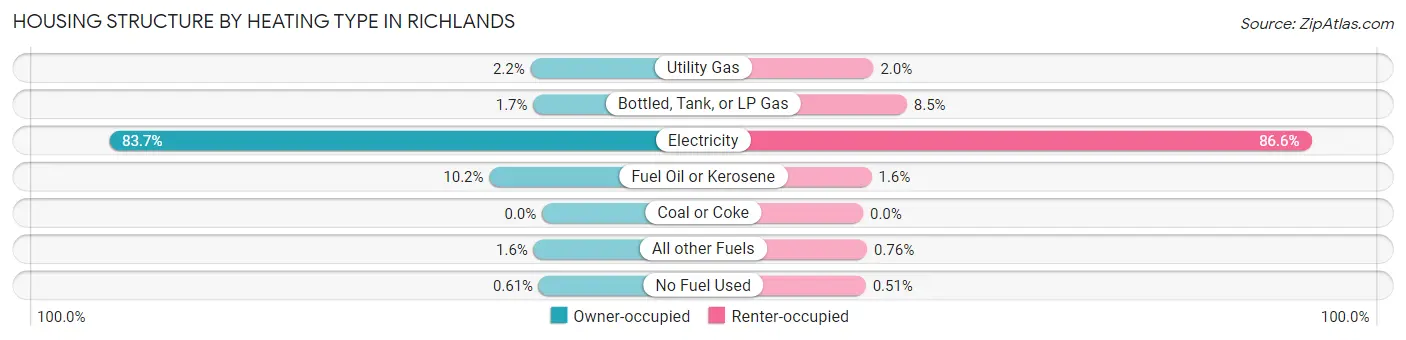
| Heating Type | Owner-occupied | Renter-occupied |
| Utility Gas | 33 (2.2%) | 16 (2.0%) |
| Bottled, Tank, or LP Gas | 25 (1.7%) | 67 (8.5%) |
| Electricity | 1,240 (83.7%) | 685 (86.6%) |
| Fuel Oil or Kerosene | 151 (10.2%) | 13 (1.6%) |
| Coal or Coke | 0 (0.0%) | 0 (0.0%) |
| All other Fuels | 24 (1.6%) | 6 (0.8%) |
| No Fuel Used | 9 (0.6%) | 4 (0.5%) |
| Total | 1,482 (100.0%) | 791 (100.0%) |
Household Vehicle Usage in Richlands
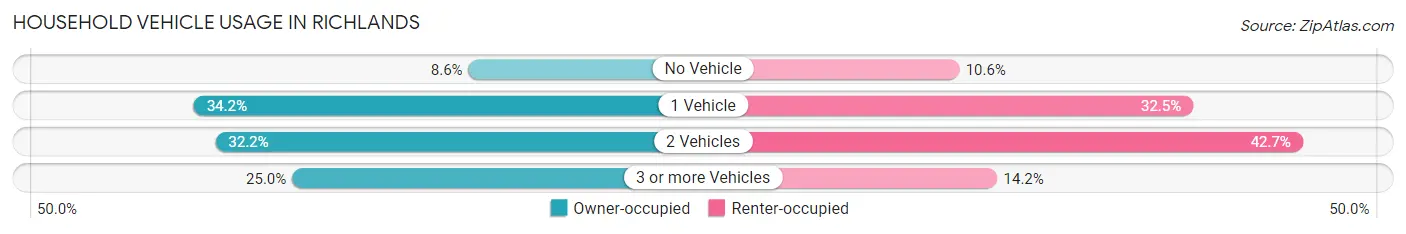
| Vehicles per Household | Owner-occupied | Renter-occupied |
| No Vehicle | 127 (8.6%) | 84 (10.6%) |
| 1 Vehicle | 507 (34.2%) | 257 (32.5%) |
| 2 Vehicles | 477 (32.2%) | 338 (42.7%) |
| 3 or more Vehicles | 371 (25.0%) | 112 (14.2%) |
| Total | 1,482 (100.0%) | 791 (100.0%) |
Real Estate & Mortgages in Richlands
Real Estate and Mortgage Overview in Richlands
| Characteristic | Without Mortgage | With Mortgage |
| Housing Units | 884 | 598 |
| Median Property Value | $95,500 | $138,500 |
| Median Household Income | $31,250 | $119 |
| Monthly Housing Costs | $446 | $0 |
| Real Estate Taxes | $721 | $26 |
Property Value by Mortgage Status in Richlands
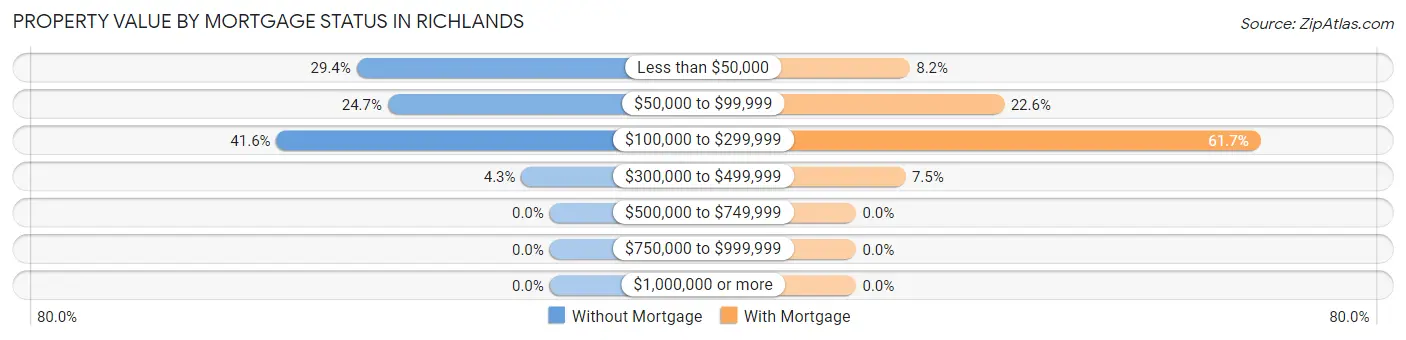
| Property Value | Without Mortgage | With Mortgage |
| Less than $50,000 | 260 (29.4%) | 49 (8.2%) |
| $50,000 to $99,999 | 218 (24.7%) | 135 (22.6%) |
| $100,000 to $299,999 | 368 (41.6%) | 369 (61.7%) |
| $300,000 to $499,999 | 38 (4.3%) | 45 (7.5%) |
| $500,000 to $749,999 | 0 (0.0%) | 0 (0.0%) |
| $750,000 to $999,999 | 0 (0.0%) | 0 (0.0%) |
| $1,000,000 or more | 0 (0.0%) | 0 (0.0%) |
| Total | 884 (100.0%) | 598 (100.0%) |
Household Income by Mortgage Status in Richlands
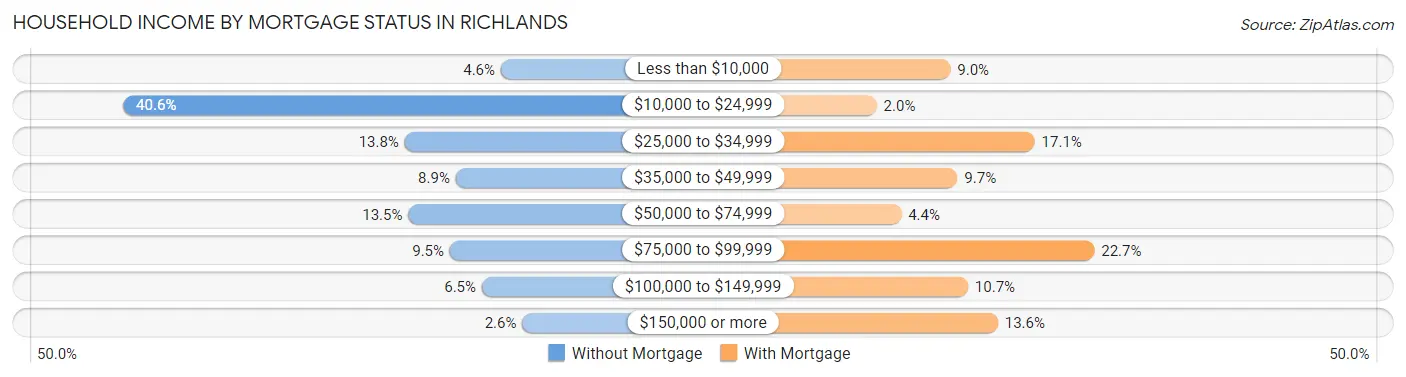
| Household Income | Without Mortgage | With Mortgage |
| Less than $10,000 | 41 (4.6%) | 54 (9.0%) |
| $10,000 to $24,999 | 359 (40.6%) | 12 (2.0%) |
| $25,000 to $34,999 | 122 (13.8%) | 102 (17.1%) |
| $35,000 to $49,999 | 79 (8.9%) | 58 (9.7%) |
| $50,000 to $74,999 | 119 (13.5%) | 26 (4.3%) |
| $75,000 to $99,999 | 84 (9.5%) | 136 (22.7%) |
| $100,000 to $149,999 | 57 (6.5%) | 64 (10.7%) |
| $150,000 or more | 23 (2.6%) | 81 (13.6%) |
| Total | 884 (100.0%) | 598 (100.0%) |
Property Value to Household Income Ratio in Richlands
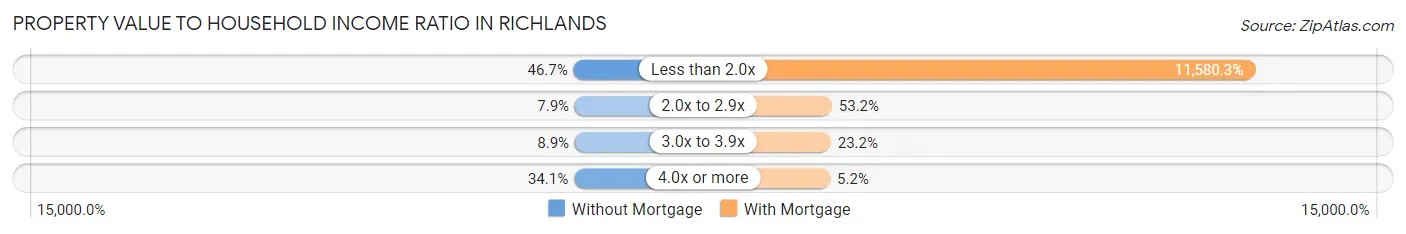
| Value-to-Income Ratio | Without Mortgage | With Mortgage |
| Less than 2.0x | 413 (46.7%) | 69,250 (11,580.3%) |
| 2.0x to 2.9x | 70 (7.9%) | 318 (53.2%) |
| 3.0x to 3.9x | 79 (8.9%) | 139 (23.2%) |
| 4.0x or more | 301 (34.1%) | 31 (5.2%) |
| Total | 884 (100.0%) | 598 (100.0%) |
Real Estate Taxes by Mortgage Status in Richlands
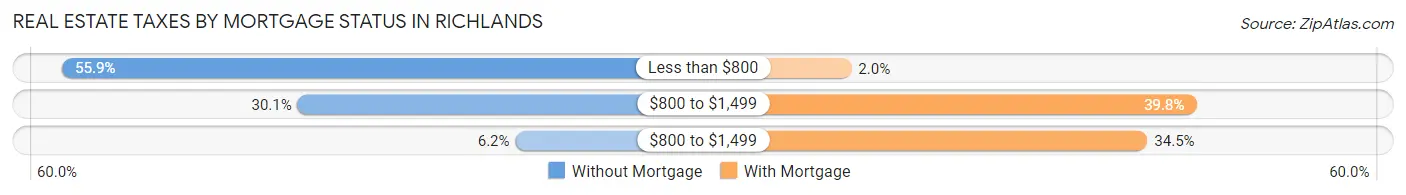
| Property Taxes | Without Mortgage | With Mortgage |
| Less than $800 | 494 (55.9%) | 12 (2.0%) |
| $800 to $1,499 | 266 (30.1%) | 238 (39.8%) |
| $800 to $1,499 | 55 (6.2%) | 206 (34.4%) |
| Total | 884 (100.0%) | 598 (100.0%) |
Health & Disability in Richlands
Health Insurance Coverage by Age in Richlands
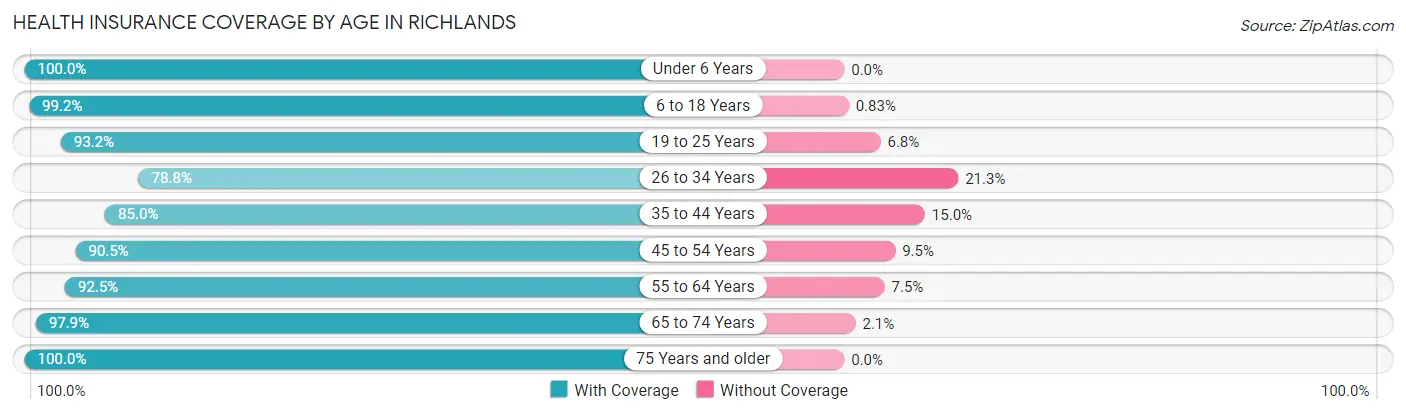
| Age Bracket | With Coverage | Without Coverage |
| Under 6 Years | 327 (100.0%) | 0 (0.0%) |
| 6 to 18 Years | 600 (99.2%) | 5 (0.8%) |
| 19 to 25 Years | 455 (93.2%) | 33 (6.8%) |
| 26 to 34 Years | 530 (78.7%) | 143 (21.2%) |
| 35 to 44 Years | 441 (85.0%) | 78 (15.0%) |
| 45 to 54 Years | 696 (90.5%) | 73 (9.5%) |
| 55 to 64 Years | 541 (92.5%) | 44 (7.5%) |
| 65 to 74 Years | 605 (97.9%) | 13 (2.1%) |
| 75 Years and older | 651 (100.0%) | 0 (0.0%) |
| Total | 4,846 (92.6%) | 389 (7.4%) |
Health Insurance Coverage by Citizenship Status in Richlands
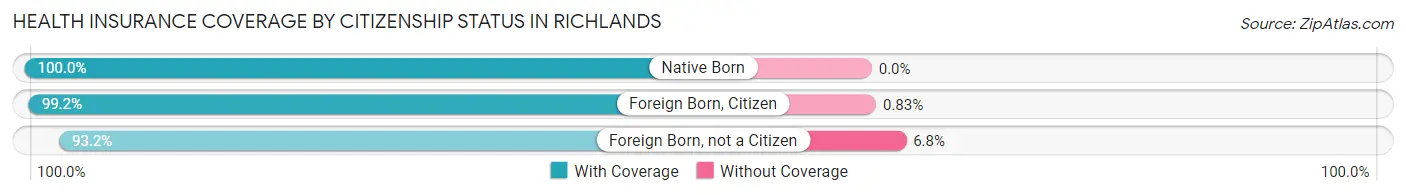
| Citizenship Status | With Coverage | Without Coverage |
| Native Born | 327 (100.0%) | 0 (0.0%) |
| Foreign Born, Citizen | 600 (99.2%) | 5 (0.8%) |
| Foreign Born, not a Citizen | 455 (93.2%) | 33 (6.8%) |
Health Insurance Coverage by Household Income in Richlands
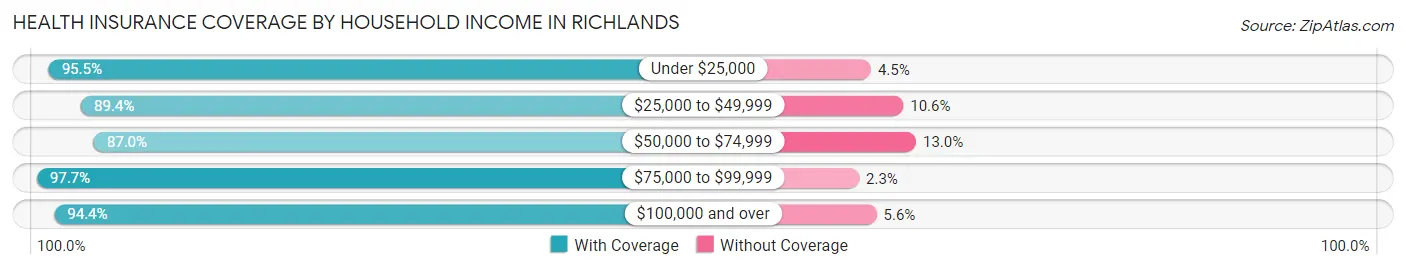
| Household Income | With Coverage | Without Coverage |
| Under $25,000 | 1,243 (95.5%) | 59 (4.5%) |
| $25,000 to $49,999 | 1,106 (89.4%) | 131 (10.6%) |
| $50,000 to $74,999 | 791 (87.0%) | 118 (13.0%) |
| $75,000 to $99,999 | 722 (97.7%) | 17 (2.3%) |
| $100,000 and over | 981 (94.4%) | 58 (5.6%) |
Public vs Private Health Insurance Coverage by Age in Richlands
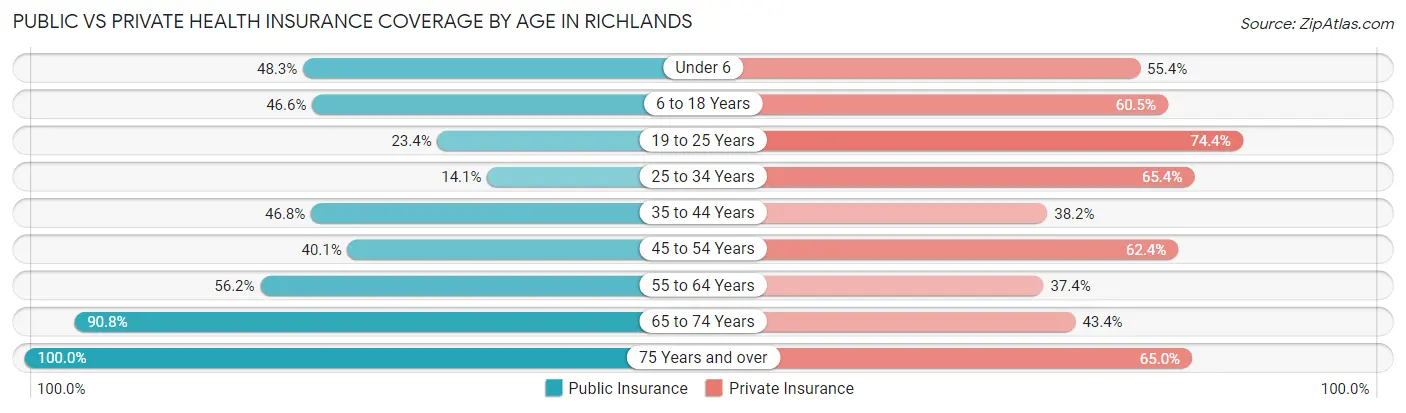
| Age Bracket | Public Insurance | Private Insurance |
| Under 6 | 158 (48.3%) | 181 (55.3%) |
| 6 to 18 Years | 282 (46.6%) | 366 (60.5%) |
| 19 to 25 Years | 114 (23.4%) | 363 (74.4%) |
| 25 to 34 Years | 95 (14.1%) | 440 (65.4%) |
| 35 to 44 Years | 243 (46.8%) | 198 (38.2%) |
| 45 to 54 Years | 308 (40.1%) | 480 (62.4%) |
| 55 to 64 Years | 329 (56.2%) | 219 (37.4%) |
| 65 to 74 Years | 561 (90.8%) | 268 (43.4%) |
| 75 Years and over | 651 (100.0%) | 423 (65.0%) |
| Total | 2,741 (52.4%) | 2,938 (56.1%) |
Disability Status by Sex by Age in Richlands
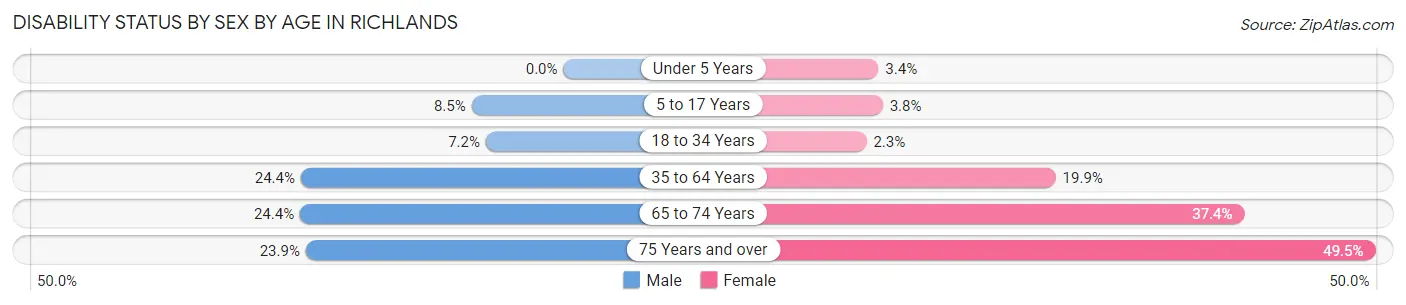
| Age Bracket | Male | Female |
| Under 5 Years | 0 (0.0%) | 5 (3.4%) |
| 5 to 17 Years | 31 (8.5%) | 10 (3.8%) |
| 18 to 34 Years | 47 (7.2%) | 12 (2.3%) |
| 35 to 64 Years | 222 (24.4%) | 191 (19.9%) |
| 65 to 74 Years | 66 (24.4%) | 130 (37.4%) |
| 75 Years and over | 33 (23.9%) | 254 (49.5%) |
Disability Class by Sex by Age in Richlands
Disability Class: Hearing Difficulty
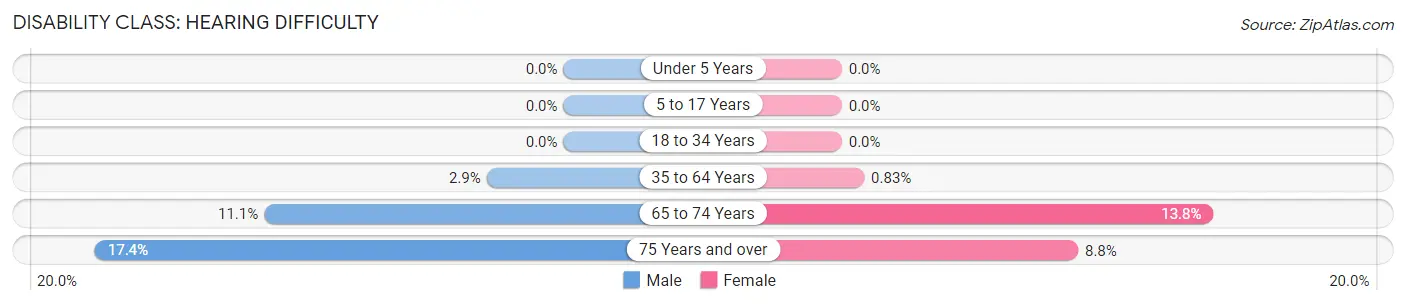
| Age Bracket | Male | Female |
| Under 5 Years | 0 (0.0%) | 0 (0.0%) |
| 5 to 17 Years | 0 (0.0%) | 0 (0.0%) |
| 18 to 34 Years | 0 (0.0%) | 0 (0.0%) |
| 35 to 64 Years | 26 (2.9%) | 8 (0.8%) |
| 65 to 74 Years | 30 (11.1%) | 48 (13.8%) |
| 75 Years and over | 24 (17.4%) | 45 (8.8%) |
Disability Class: Vision Difficulty
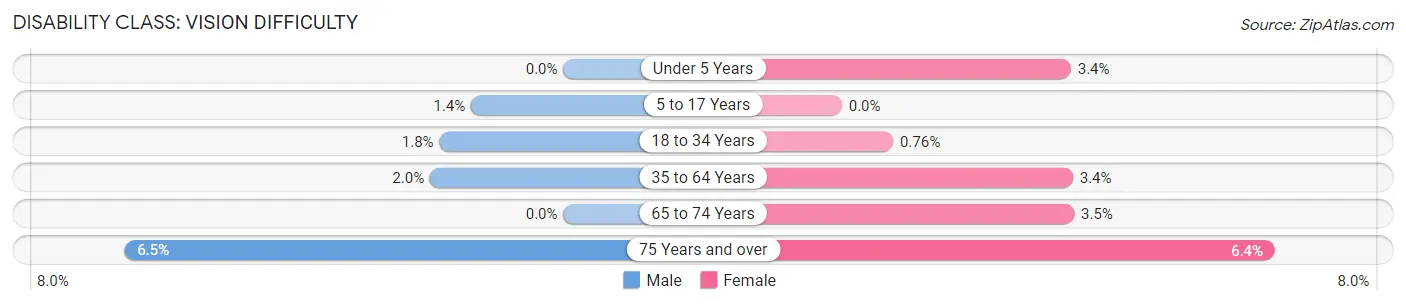
| Age Bracket | Male | Female |
| Under 5 Years | 0 (0.0%) | 5 (3.4%) |
| 5 to 17 Years | 5 (1.4%) | 0 (0.0%) |
| 18 to 34 Years | 12 (1.8%) | 4 (0.8%) |
| 35 to 64 Years | 18 (2.0%) | 33 (3.4%) |
| 65 to 74 Years | 0 (0.0%) | 12 (3.5%) |
| 75 Years and over | 9 (6.5%) | 33 (6.4%) |
Disability Class: Cognitive Difficulty
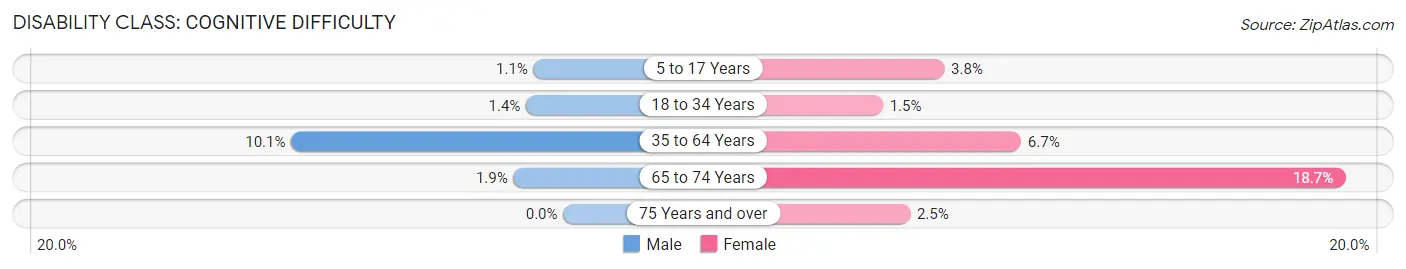
| Age Bracket | Male | Female |
| 5 to 17 Years | 4 (1.1%) | 10 (3.8%) |
| 18 to 34 Years | 9 (1.4%) | 8 (1.5%) |
| 35 to 64 Years | 92 (10.1%) | 64 (6.7%) |
| 65 to 74 Years | 5 (1.8%) | 65 (18.7%) |
| 75 Years and over | 0 (0.0%) | 13 (2.5%) |
Disability Class: Ambulatory Difficulty
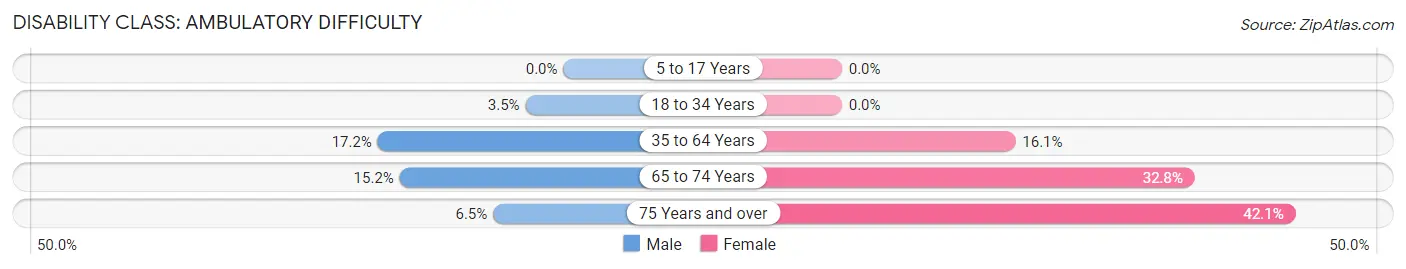
| Age Bracket | Male | Female |
| 5 to 17 Years | 0 (0.0%) | 0 (0.0%) |
| 18 to 34 Years | 23 (3.5%) | 0 (0.0%) |
| 35 to 64 Years | 157 (17.2%) | 155 (16.1%) |
| 65 to 74 Years | 41 (15.2%) | 114 (32.8%) |
| 75 Years and over | 9 (6.5%) | 216 (42.1%) |
Disability Class: Self-Care Difficulty
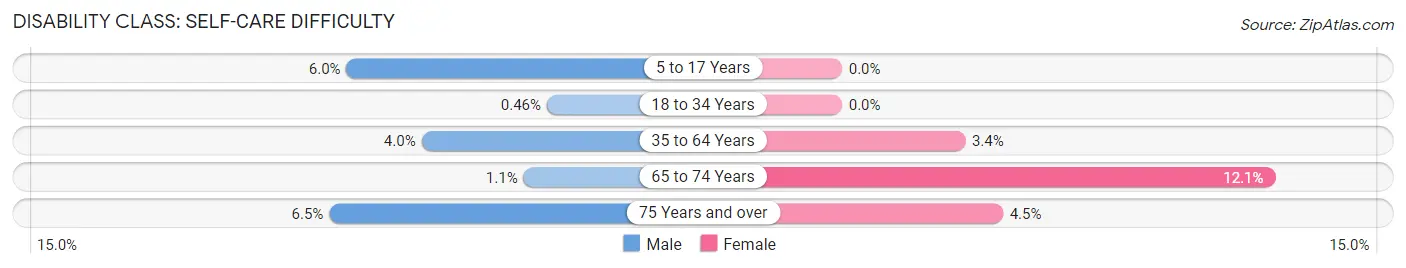
| Age Bracket | Male | Female |
| 5 to 17 Years | 22 (6.0%) | 0 (0.0%) |
| 18 to 34 Years | 3 (0.5%) | 0 (0.0%) |
| 35 to 64 Years | 36 (4.0%) | 33 (3.4%) |
| 65 to 74 Years | 3 (1.1%) | 42 (12.1%) |
| 75 Years and over | 9 (6.5%) | 23 (4.5%) |
Technology Access in Richlands
Computing Device Access in Richlands
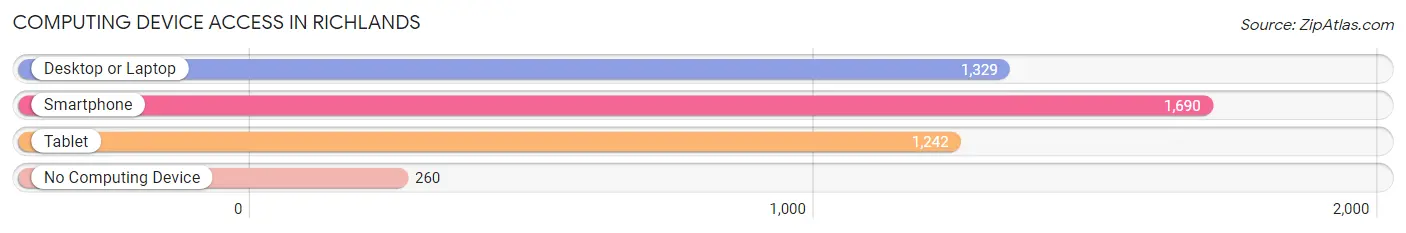
| Device Type | # Households | % Households |
| Desktop or Laptop | 1,329 | 58.5% |
| Smartphone | 1,690 | 74.4% |
| Tablet | 1,242 | 54.6% |
| No Computing Device | 260 | 11.4% |
| Total | 2,273 | 100.0% |
Internet Access in Richlands
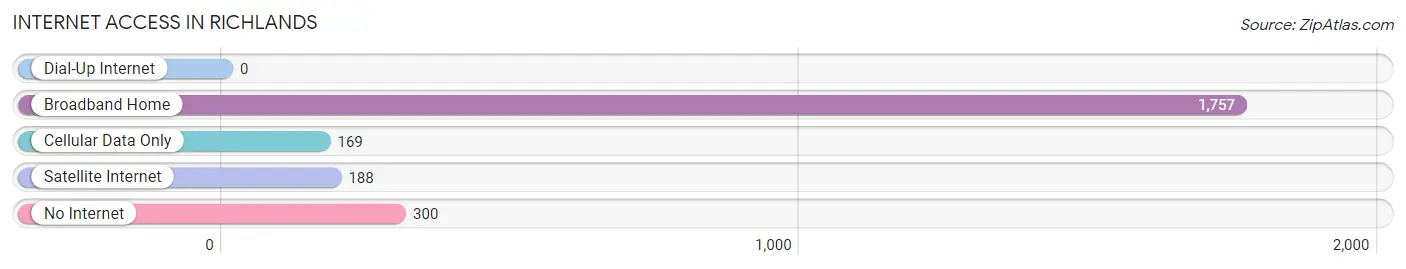
| Internet Type | # Households | % Households |
| Dial-Up Internet | 0 | 0.0% |
| Broadband Home | 1,757 | 77.3% |
| Cellular Data Only | 169 | 7.4% |
| Satellite Internet | 188 | 8.3% |
| No Internet | 300 | 13.2% |
| Total | 2,273 | 100.0% |
Richlands Summary
Richlands, Virginia is a small town located in Tazewell County, Virginia. It is situated in the Appalachian Mountains and is part of the Appalachian Plateau. The town has a population of approximately 2,000 people and is located near the border of West Virginia. Richlands is known for its rich history, beautiful scenery, and friendly people.
History
Richlands was first settled in the late 1700s by a group of settlers from North Carolina. The town was originally known as “Richland” and was named after the rich soil in the area. The town was officially incorporated in 1872 and was named Richlands. The town was a major coal mining center in the late 1800s and early 1900s. The coal industry was the main source of income for the town and many of the residents worked in the mines. The town also had a thriving lumber industry and was home to several sawmills.
Geography
Richlands is located in the Appalachian Mountains and is part of the Appalachian Plateau. The town is situated in a valley surrounded by mountains and hills. The town is located near the border of West Virginia and is approximately 30 miles from the city of Bluefield, West Virginia. The town is also located near the Tug Fork River, which is a tributary of the Big Sandy River. The town is located at an elevation of 1,890 feet above sea level.
Economy
The economy of Richlands is largely based on agriculture and tourism. The town is home to several farms and orchards that produce a variety of fruits and vegetables. The town is also home to several small businesses, including restaurants, shops, and other services. Tourism is also an important part of the economy, as the town is home to several attractions, including the Richlands Museum and the Richlands Historic District.
Demographics
As of the 2010 census, the population of Richlands was 2,000 people. The racial makeup of the town was 97.2% White, 0.7% African American, 0.3% Native American, 0.2% Asian, 0.1% Pacific Islander, and 1.5% from other races. The median household income in Richlands was $30,000 and the median family income was $35,000. The town has a poverty rate of 17.3%.
Richlands is a small town with a rich history and a friendly atmosphere. The town is home to several farms and orchards, as well as several small businesses. The town is also home to several attractions, including the Richlands Museum and the Richlands Historic District. The town has a population of approximately 2,000 people and is located near the border of West Virginia. Richlands is a great place to live and visit and is a great example of the beauty and culture of the Appalachian Mountains.
Common Questions
What is Per Capita Income in Richlands?
Per Capita income in Richlands is $27,739.
What is the Median Family Income in Richlands?
Median Family Income in Richlands is $63,125.
What is the Median Household income in Richlands?
Median Household Income in Richlands is $35,959.
What is Income or Wage Gap in Richlands?
Income or Wage Gap in Richlands is 19.2%.
Women in Richlands earn 80.8 cents for every dollar earned by a man.
What is Inequality or Gini Index in Richlands?
Inequality or Gini Index in Richlands is 0.52.
What is the Total Population of Richlands?
Total Population of Richlands is 5,266.
What is the Total Male Population of Richlands?
Total Male Population of Richlands is 2,488.
What is the Total Female Population of Richlands?
Total Female Population of Richlands is 2,778.
What is the Ratio of Males per 100 Females in Richlands?
There are 89.56 Males per 100 Females in Richlands.
What is the Ratio of Females per 100 Males in Richlands?
There are 111.66 Females per 100 Males in Richlands.
What is the Median Population Age in Richlands?
Median Population Age in Richlands is 45.2 Years.
What is the Average Family Size in Richlands
Average Family Size in Richlands is 2.9 People.
What is the Average Household Size in Richlands
Average Household Size in Richlands is 2.3 People.
How Large is the Labor Force in Richlands?
There are 2,016 People in the Labor Forcein in Richlands.
What is the Percentage of People in the Labor Force in Richlands?
44.9% of People are in the Labor Force in Richlands.
What is the Unemployment Rate in Richlands?
Unemployment Rate in Richlands is 8.6%.