Mount Pleasant, SC Map & Demographics
Mount Pleasant Map
Mount Pleasant Overview
$65,559
PER CAPITA INCOME
$145,770
AVG FAMILY INCOME
$115,167
AVG HOUSEHOLD INCOME
34.2%
WAGE / INCOME GAP [ % ]
65.8¢/ $1
WAGE / INCOME GAP [ $ ]
$13,461
FAMILY INCOME DEFICIT
0.47
INEQUALITY / GINI INDEX
90,945
TOTAL POPULATION
44,812
MALE POPULATION
46,133
FEMALE POPULATION
97.14
MALES / 100 FEMALES
102.95
FEMALES / 100 MALES
42.4
MEDIAN AGE
3.0
AVG FAMILY SIZE
2.4
AVG HOUSEHOLD SIZE
49,153
LABOR FORCE [ PEOPLE ]
67.2%
PERCENT IN LABOR FORCE
3.2%
UNEMPLOYMENT RATE
Mount Pleasant Area Codes
Income in Mount Pleasant
Income Overview in Mount Pleasant
Per Capita Income in Mount Pleasant is $65,559, while median incomes of families and households are $145,770 and $115,167 respectively.
| Characteristic | Number | Measure |
| Per Capita Income | 90,945 | $65,559 |
| Median Family Income | 24,495 | $145,770 |
| Mean Family Income | 24,495 | $190,954 |
| Median Household Income | 38,149 | $115,167 |
| Mean Household Income | 38,149 | $155,726 |
| Income Deficit | 24,495 | $13,461 |
| Wage / Income Gap (%) | 90,945 | 34.21% |
| Wage / Income Gap ($) | 90,945 | 65.79¢ per $1 |
| Gini / Inequality Index | 90,945 | 0.47 |
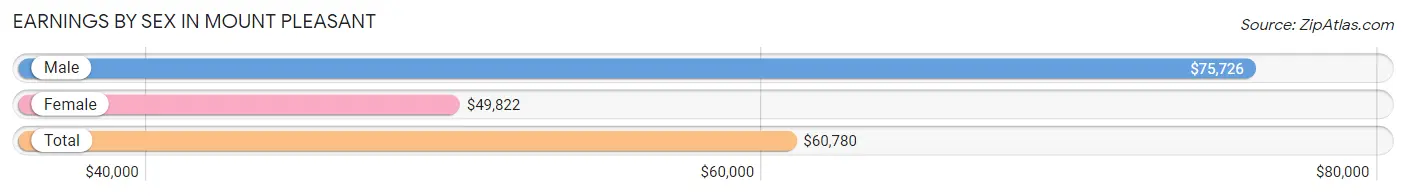
Earnings by Sex in Mount Pleasant
Average Earnings in Mount Pleasant are $60,780, $75,726 for men and $49,822 for women, a difference of 34.2%.
| Sex | Number | Average Earnings |
| Male | 27,207 (53.9%) | $75,726 |
| Female | 23,273 (46.1%) | $49,822 |
| Total | 50,480 (100.0%) | $60,780 |
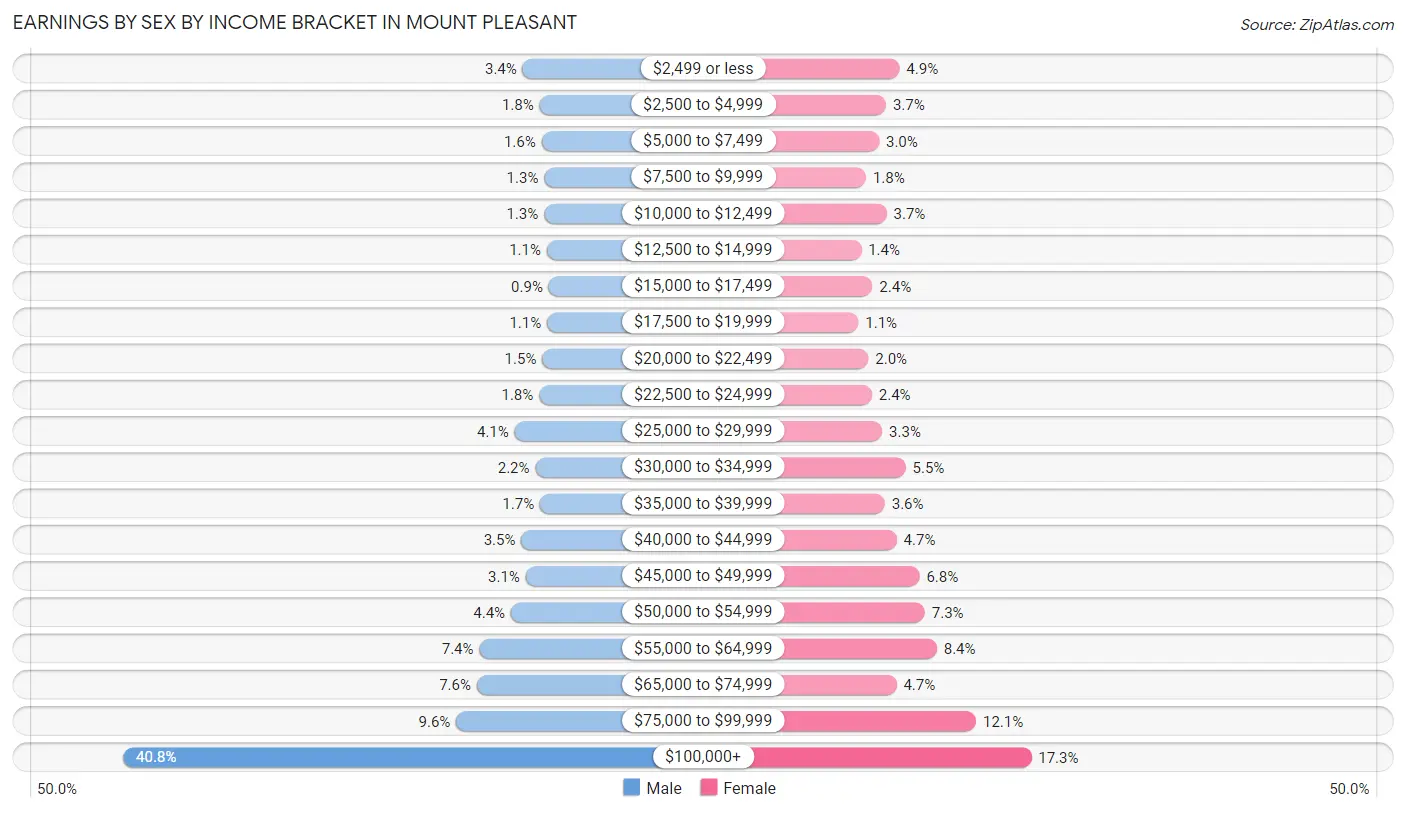
Earnings by Sex by Income Bracket in Mount Pleasant
The most common earnings brackets in Mount Pleasant are $100,000+ for men (11,091 | 40.8%) and $100,000+ for women (4,021 | 17.3%).
| Income | Male | Female |
| $2,499 or less | 912 (3.4%) | 1,148 (4.9%) |
| $2,500 to $4,999 | 478 (1.8%) | 855 (3.7%) |
| $5,000 to $7,499 | 426 (1.6%) | 702 (3.0%) |
| $7,500 to $9,999 | 358 (1.3%) | 420 (1.8%) |
| $10,000 to $12,499 | 364 (1.3%) | 869 (3.7%) |
| $12,500 to $14,999 | 294 (1.1%) | 315 (1.3%) |
| $15,000 to $17,499 | 245 (0.9%) | 559 (2.4%) |
| $17,500 to $19,999 | 289 (1.1%) | 251 (1.1%) |
| $20,000 to $22,499 | 412 (1.5%) | 469 (2.0%) |
| $22,500 to $24,999 | 489 (1.8%) | 546 (2.4%) |
| $25,000 to $29,999 | 1,116 (4.1%) | 770 (3.3%) |
| $30,000 to $34,999 | 584 (2.1%) | 1,282 (5.5%) |
| $35,000 to $39,999 | 468 (1.7%) | 829 (3.6%) |
| $40,000 to $44,999 | 943 (3.5%) | 1,087 (4.7%) |
| $45,000 to $49,999 | 833 (3.1%) | 1,585 (6.8%) |
| $50,000 to $54,999 | 1,209 (4.4%) | 1,701 (7.3%) |
| $55,000 to $64,999 | 2,014 (7.4%) | 1,963 (8.4%) |
| $65,000 to $74,999 | 2,078 (7.6%) | 1,083 (4.6%) |
| $75,000 to $99,999 | 2,604 (9.6%) | 2,818 (12.1%) |
| $100,000+ | 11,091 (40.8%) | 4,021 (17.3%) |
| Total | 27,207 (100.0%) | 23,273 (100.0%) |
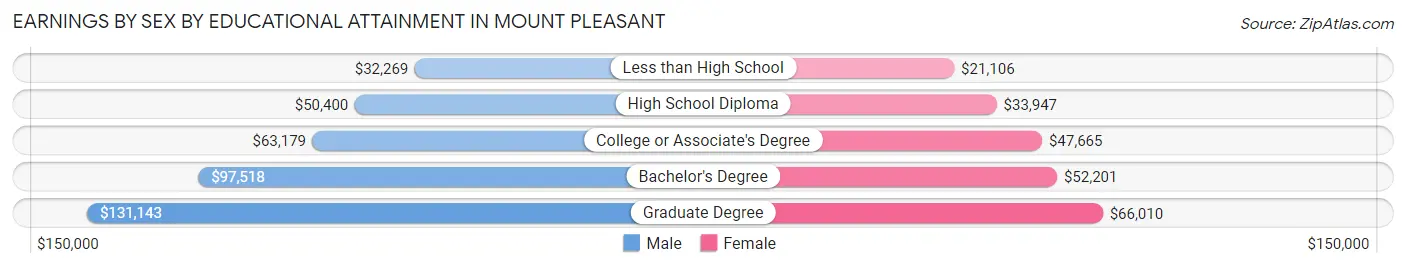
Earnings by Sex by Educational Attainment in Mount Pleasant
Average earnings in Mount Pleasant are $84,286 for men and $52,066 for women, a difference of 38.2%. Men with an educational attainment of graduate degree enjoy the highest average annual earnings of $131,143, while those with less than high school education earn the least with $32,269. Women with an educational attainment of graduate degree earn the most with the average annual earnings of $66,010, while those with less than high school education have the smallest earnings of $21,106.
| Educational Attainment | Male Income | Female Income |
| Less than High School | $32,269 | $21,106 |
| High School Diploma | $50,400 | $33,947 |
| College or Associate's Degree | $63,179 | $47,665 |
| Bachelor's Degree | $97,518 | $52,201 |
| Graduate Degree | $131,143 | $66,010 |
| Total | $84,286 | $52,066 |
Family Income in Mount Pleasant
Family Income Brackets in Mount Pleasant
According to the Mount Pleasant family income data, there are 8,083 families falling into the $200,000+ income range, which is the most common income bracket and makes up 33.0% of all families. Conversely, the $10,000 to $14,999 income bracket is the least frequent group with only 24 families (0.1%) belonging to this category.
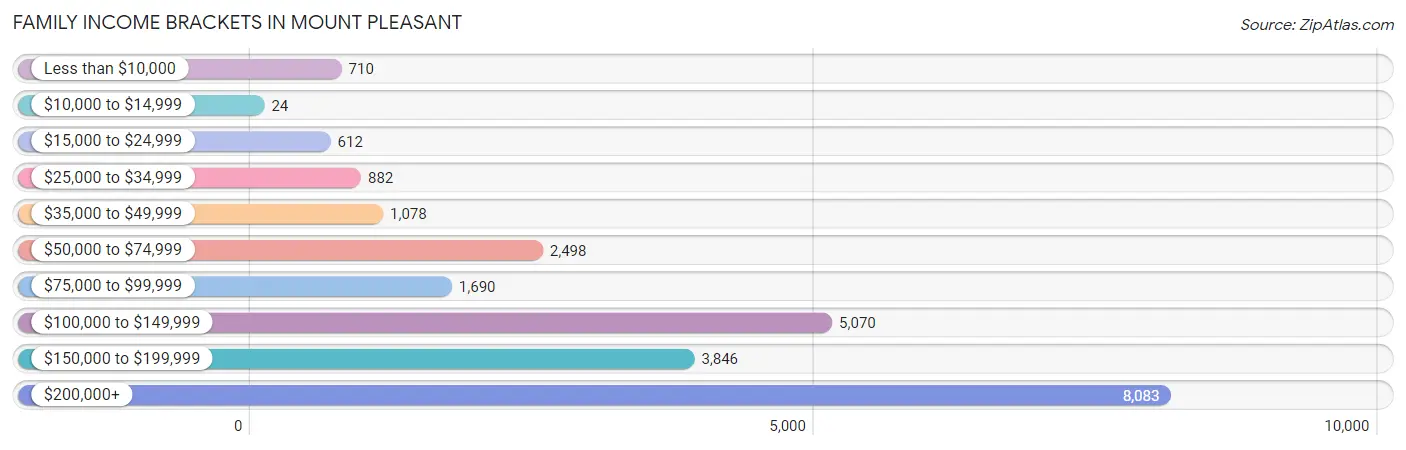
| Income Bracket | # Families | % Families |
| Less than $10,000 | 710 | 2.9% |
| $10,000 to $14,999 | 24 | 0.1% |
| $15,000 to $24,999 | 612 | 2.5% |
| $25,000 to $34,999 | 882 | 3.6% |
| $35,000 to $49,999 | 1,078 | 4.4% |
| $50,000 to $74,999 | 2,498 | 10.2% |
| $75,000 to $99,999 | 1,690 | 6.9% |
| $100,000 to $149,999 | 5,070 | 20.7% |
| $150,000 to $199,999 | 3,846 | 15.7% |
| $200,000+ | 8,083 | 33.0% |
Family Income by Famaliy Size in Mount Pleasant
7+ person families (39 | 0.2%) account for the highest median family income in Mount Pleasant with $211,927 per family, while 2-person families (11,316 | 46.2%) have the highest median income of $60,401 per family member.
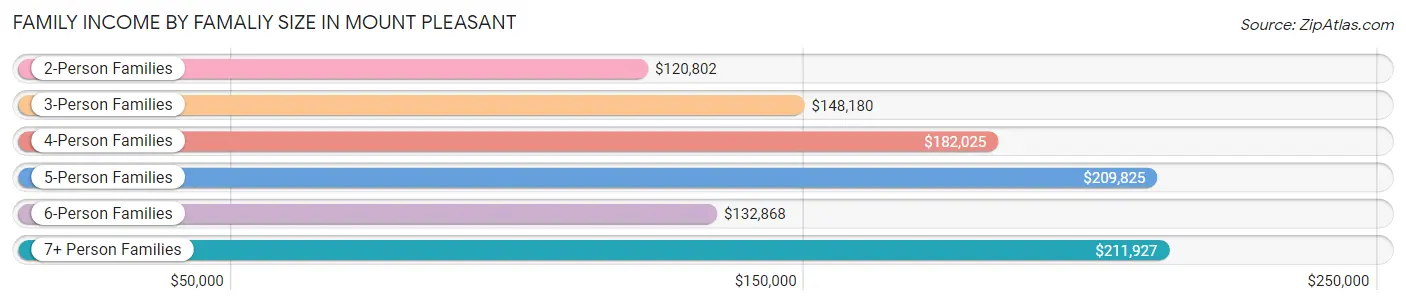
| Income Bracket | # Families | Median Income |
| 2-Person Families | 11,316 (46.2%) | $120,802 |
| 3-Person Families | 5,805 (23.7%) | $148,180 |
| 4-Person Families | 5,061 (20.7%) | $182,025 |
| 5-Person Families | 1,803 (7.4%) | $209,825 |
| 6-Person Families | 471 (1.9%) | $132,868 |
| 7+ Person Families | 39 (0.2%) | $211,927 |
| Total | 24,495 (100.0%) | $145,770 |
Family Income by Number of Earners in Mount Pleasant
The median family income in Mount Pleasant is $145,770, with families comprising 3+ earners (2,522) having the highest median family income of $225,510, while families with no earners (4,184) have the lowest median family income of $67,697, accounting for 10.3% and 17.1% of families, respectively.
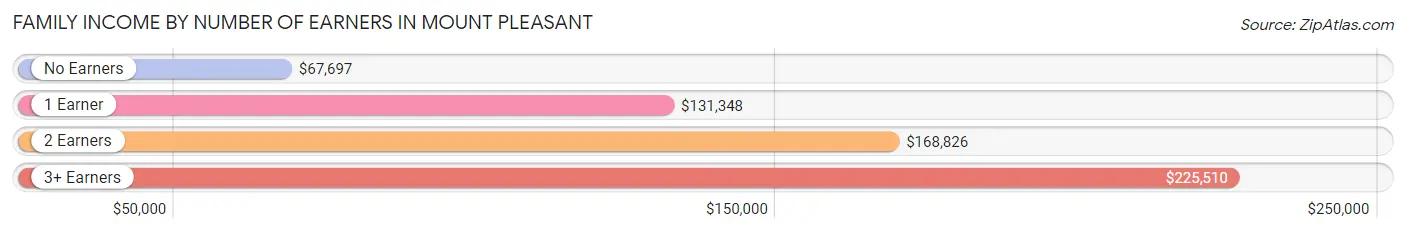
| Number of Earners | # Families | Median Income |
| No Earners | 4,184 (17.1%) | $67,697 |
| 1 Earner | 6,790 (27.7%) | $131,348 |
| 2 Earners | 10,999 (44.9%) | $168,826 |
| 3+ Earners | 2,522 (10.3%) | $225,510 |
| Total | 24,495 (100.0%) | $145,770 |
Household Income in Mount Pleasant
Household Income Brackets in Mount Pleasant
With 9,308 households falling in the category, the $200,000+ income range is the most frequent in Mount Pleasant, accounting for 24.4% of all households. In contrast, only 381 households (1.0%) fall into the $10,000 to $14,999 income bracket, making it the least populous group.
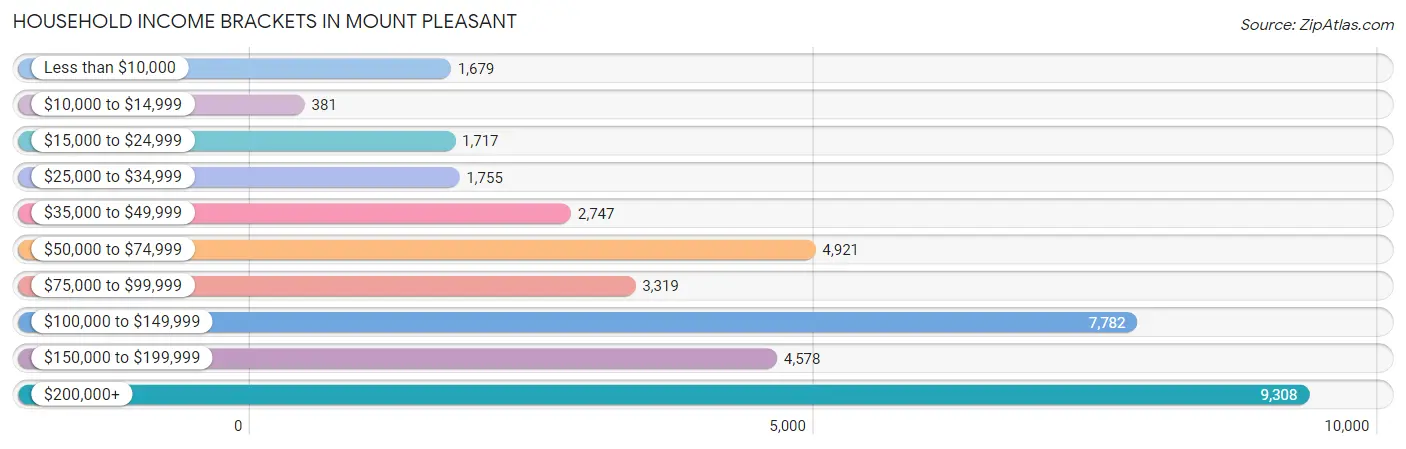
| Income Bracket | # Households | % Households |
| Less than $10,000 | 1,679 | 4.4% |
| $10,000 to $14,999 | 381 | 1.0% |
| $15,000 to $24,999 | 1,717 | 4.5% |
| $25,000 to $34,999 | 1,755 | 4.6% |
| $35,000 to $49,999 | 2,747 | 7.2% |
| $50,000 to $74,999 | 4,921 | 12.9% |
| $75,000 to $99,999 | 3,319 | 8.7% |
| $100,000 to $149,999 | 7,782 | 20.4% |
| $150,000 to $199,999 | 4,578 | 12.0% |
| $200,000+ | 9,308 | 24.4% |
Household Income by Householder Age in Mount Pleasant
The median household income in Mount Pleasant is $115,167, with the highest median household income of $136,138 found in the 45 to 64 years age bracket for the primary householder. A total of 14,483 households (38.0%) fall into this category. Meanwhile, the 15 to 24 years age bracket for the primary householder has the lowest median household income of $36,490, with 575 households (1.5%) in this group.
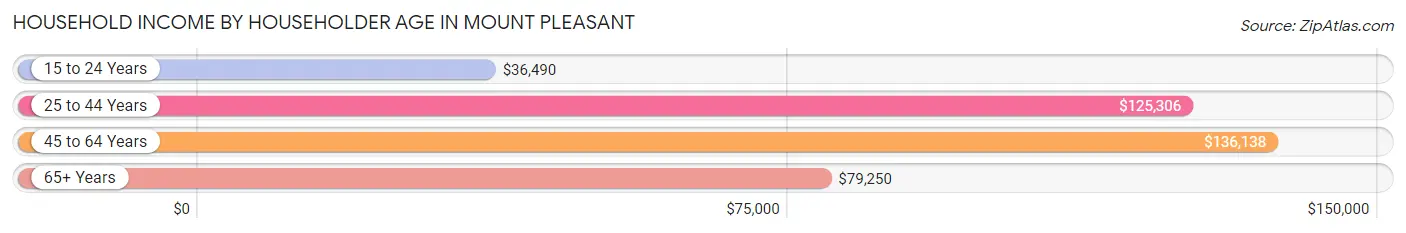
| Income Bracket | # Households | Median Income |
| 15 to 24 Years | 575 (1.5%) | $36,490 |
| 25 to 44 Years | 13,365 (35.0%) | $125,306 |
| 45 to 64 Years | 14,483 (38.0%) | $136,138 |
| 65+ Years | 9,726 (25.5%) | $79,250 |
| Total | 38,149 (100.0%) | $115,167 |
Poverty in Mount Pleasant
Income Below Poverty by Sex and Age in Mount Pleasant
With 5.0% poverty level for males and 6.6% for females among the residents of Mount Pleasant, 18 to 24 year old males and 15 year old females are the most vulnerable to poverty, with 320 males (18.1%) and 77 females (14.3%) in their respective age groups living below the poverty level.
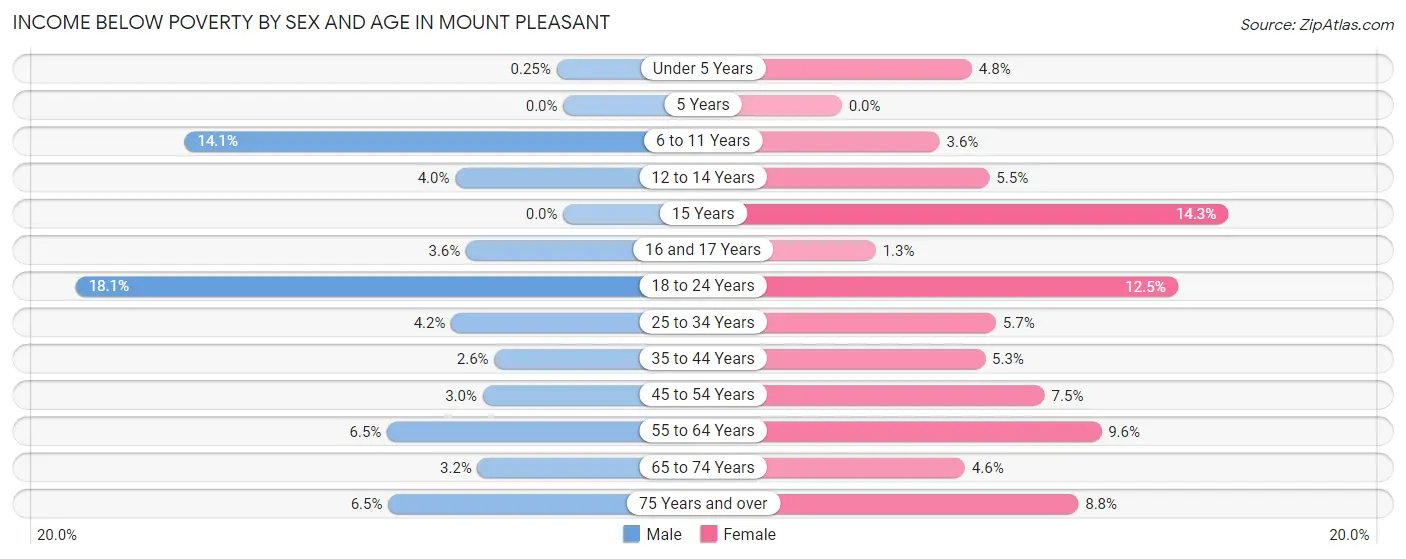
| Age Bracket | Male | Female |
| Under 5 Years | 7 (0.3%) | 111 (4.8%) |
| 5 Years | 0 (0.0%) | 0 (0.0%) |
| 6 to 11 Years | 485 (14.1%) | 109 (3.6%) |
| 12 to 14 Years | 66 (4.0%) | 128 (5.5%) |
| 15 Years | 0 (0.0%) | 77 (14.3%) |
| 16 and 17 Years | 52 (3.6%) | 16 (1.3%) |
| 18 to 24 Years | 320 (18.1%) | 236 (12.5%) |
| 25 to 34 Years | 246 (4.2%) | 327 (5.7%) |
| 35 to 44 Years | 168 (2.6%) | 390 (5.3%) |
| 45 to 54 Years | 203 (3.0%) | 488 (7.5%) |
| 55 to 64 Years | 384 (6.5%) | 596 (9.6%) |
| 65 to 74 Years | 144 (3.2%) | 229 (4.6%) |
| 75 Years and over | 173 (6.5%) | 294 (8.8%) |
| Total | 2,248 (5.0%) | 3,001 (6.6%) |
Income Above Poverty by Sex and Age in Mount Pleasant
According to the poverty statistics in Mount Pleasant, males aged 5 years and females aged 5 years are the age groups that are most secure financially, with 100.0% of males and 100.0% of females in these age groups living above the poverty line.
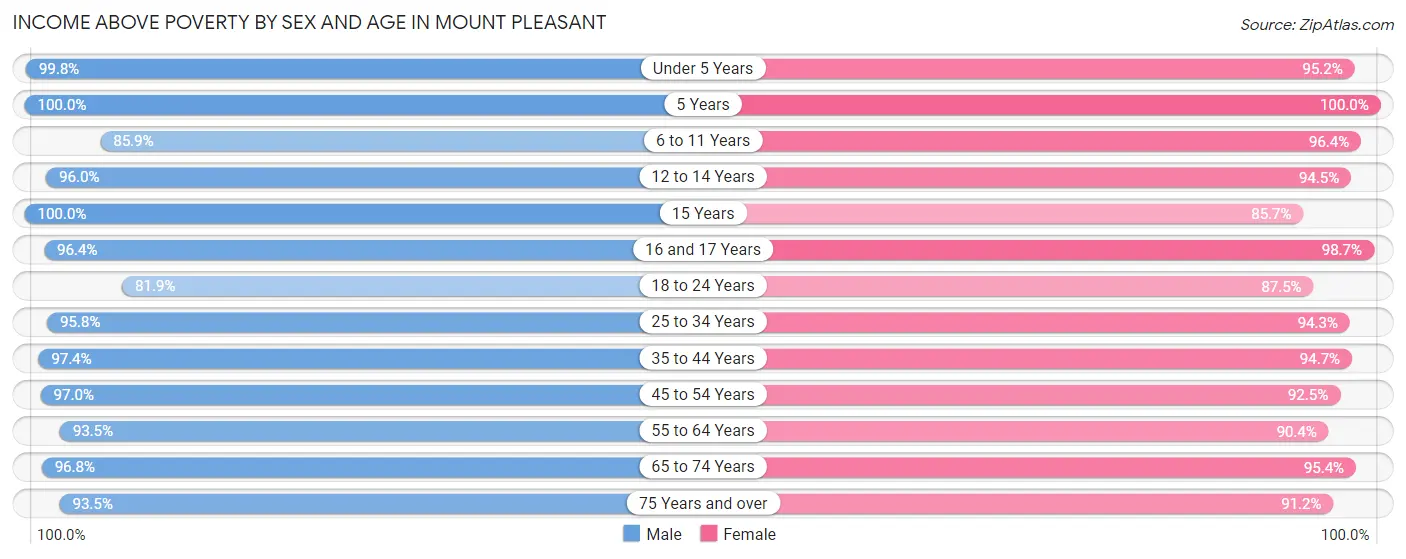
| Age Bracket | Male | Female |
| Under 5 Years | 2,767 (99.8%) | 2,185 (95.2%) |
| 5 Years | 603 (100.0%) | 343 (100.0%) |
| 6 to 11 Years | 2,965 (85.9%) | 2,897 (96.4%) |
| 12 to 14 Years | 1,581 (96.0%) | 2,208 (94.5%) |
| 15 Years | 631 (100.0%) | 460 (85.7%) |
| 16 and 17 Years | 1,387 (96.4%) | 1,252 (98.7%) |
| 18 to 24 Years | 1,448 (81.9%) | 1,658 (87.5%) |
| 25 to 34 Years | 5,670 (95.8%) | 5,388 (94.3%) |
| 35 to 44 Years | 6,383 (97.4%) | 6,943 (94.7%) |
| 45 to 54 Years | 6,593 (97.0%) | 5,993 (92.5%) |
| 55 to 64 Years | 5,484 (93.5%) | 5,595 (90.4%) |
| 65 to 74 Years | 4,391 (96.8%) | 4,778 (95.4%) |
| 75 Years and over | 2,490 (93.5%) | 3,055 (91.2%) |
| Total | 42,393 (95.0%) | 42,755 (93.4%) |
Income Below Poverty Among Married-Couple Families in Mount Pleasant
The poverty statistics for married-couple families in Mount Pleasant show that 3.3% or 710 of the total 21,471 families live below the poverty line. Families with 1 or 2 children have the highest poverty rate of 4.0%, comprising of 304 families. On the other hand, families with 3 or 4 children have the lowest poverty rate of 0.0%, which includes 0 families.
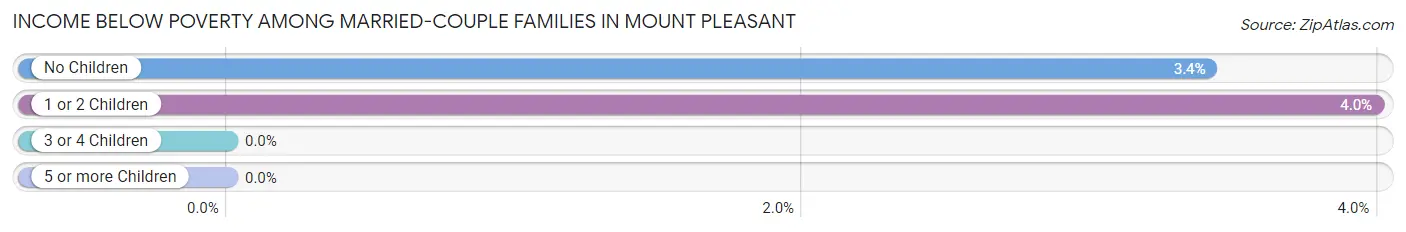
| Children | Above Poverty | Below Poverty |
| No Children | 11,484 (96.6%) | 406 (3.4%) |
| 1 or 2 Children | 7,323 (96.0%) | 304 (4.0%) |
| 3 or 4 Children | 1,930 (100.0%) | 0 (0.0%) |
| 5 or more Children | 24 (100.0%) | 0 (0.0%) |
| Total | 20,761 (96.7%) | 710 (3.3%) |
Income Below Poverty Among Single-Parent Households in Mount Pleasant
According to the poverty data in Mount Pleasant, 7.2% or 78 single-father households and 15.6% or 303 single-mother households are living below the poverty line. Among single-father households, those with 1 or 2 children have the highest poverty rate, with 78 households (13.5%) experiencing poverty. Likewise, among single-mother households, those with 1 or 2 children have the highest poverty rate, with 251 households (20.3%) falling below the poverty line.
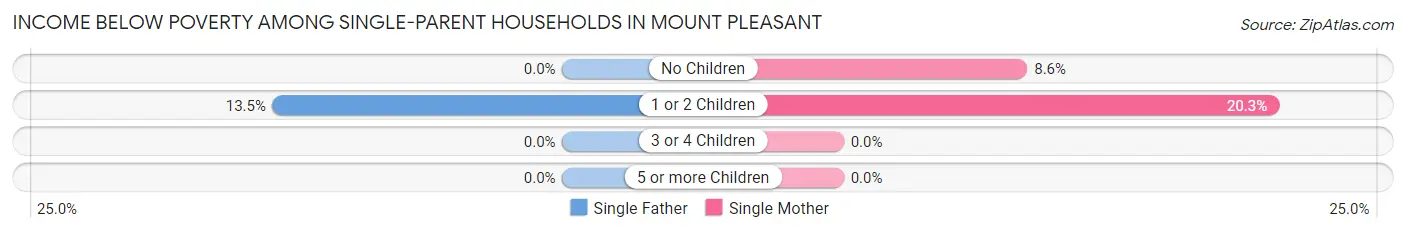
| Children | Single Father | Single Mother |
| No Children | 0 (0.0%) | 52 (8.6%) |
| 1 or 2 Children | 78 (13.5%) | 251 (20.3%) |
| 3 or 4 Children | 0 (0.0%) | 0 (0.0%) |
| 5 or more Children | 0 (0.0%) | 0 (0.0%) |
| Total | 78 (7.2%) | 303 (15.6%) |
Income Below Poverty Among Married-Couple vs Single-Parent Households in Mount Pleasant
The poverty data for Mount Pleasant shows that 710 of the married-couple family households (3.3%) and 381 of the single-parent households (12.6%) are living below the poverty level. Within the married-couple family households, those with 1 or 2 children have the highest poverty rate, with 304 households (4.0%) falling below the poverty line. Among the single-parent households, those with 1 or 2 children have the highest poverty rate, with 329 household (18.1%) living below poverty.
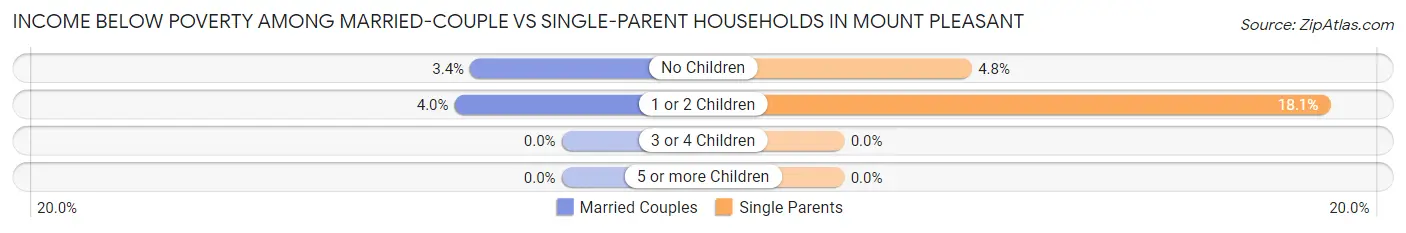
| Children | Married-Couple Families | Single-Parent Households |
| No Children | 406 (3.4%) | 52 (4.8%) |
| 1 or 2 Children | 304 (4.0%) | 329 (18.1%) |
| 3 or 4 Children | 0 (0.0%) | 0 (0.0%) |
| 5 or more Children | 0 (0.0%) | 0 (0.0%) |
| Total | 710 (3.3%) | 381 (12.6%) |
Race in Mount Pleasant
The most populous races in Mount Pleasant are White / Caucasian (83,069 | 91.3%), Black / African American (3,333 | 3.7%), and Two or more Races (2,337 | 2.6%).
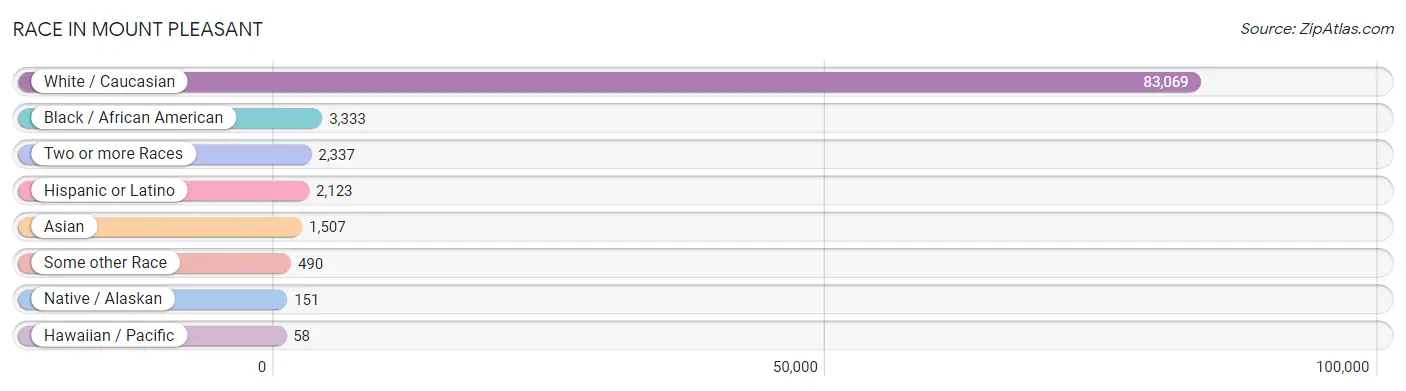
| Race | # Population | % Population |
| Asian | 1,507 | 1.7% |
| Black / African American | 3,333 | 3.7% |
| Hawaiian / Pacific | 58 | 0.1% |
| Hispanic or Latino | 2,123 | 2.3% |
| Native / Alaskan | 151 | 0.2% |
| White / Caucasian | 83,069 | 91.3% |
| Two or more Races | 2,337 | 2.6% |
| Some other Race | 490 | 0.5% |
| Total | 90,945 | 100.0% |
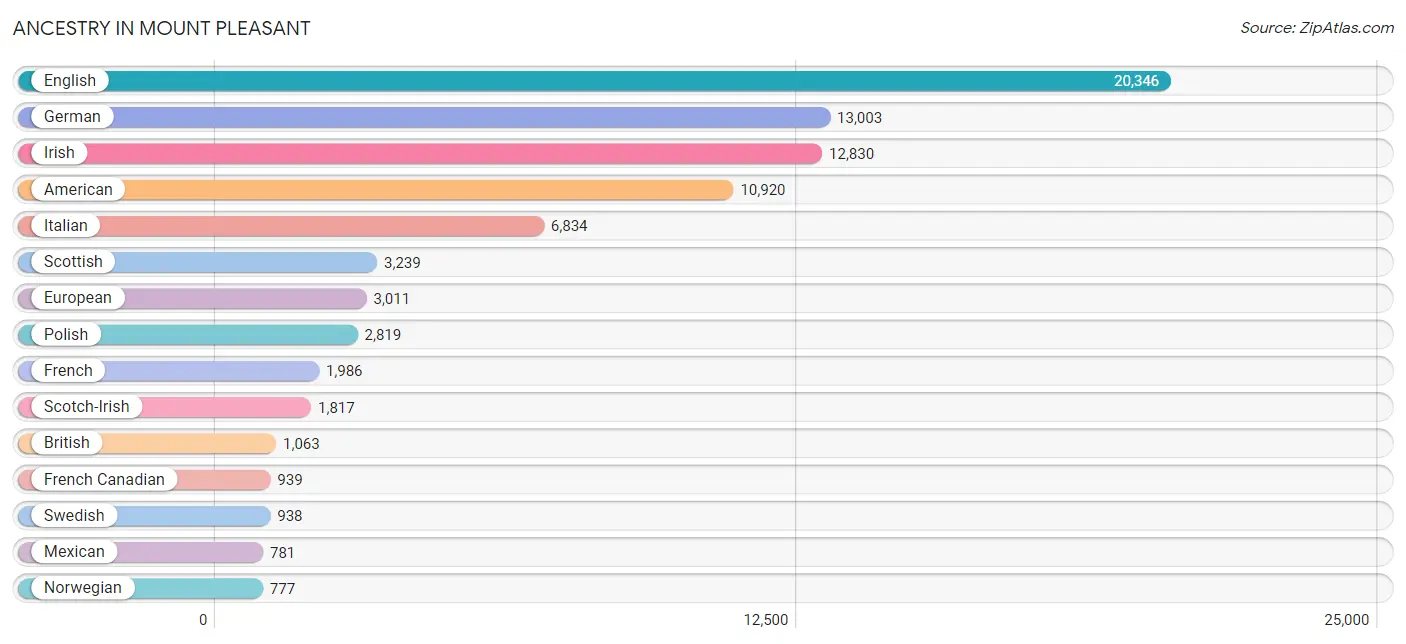
Ancestry in Mount Pleasant
The most populous ancestries reported in Mount Pleasant are English (20,346 | 22.4%), German (13,003 | 14.3%), Irish (12,830 | 14.1%), American (10,920 | 12.0%), and Italian (6,834 | 7.5%), together accounting for 70.3% of all Mount Pleasant residents.
| Ancestry | # Population | % Population |
| Afghan | 48 | 0.1% |
| African | 73 | 0.1% |
| American | 10,920 | 12.0% |
| Arab | 245 | 0.3% |
| Argentinean | 41 | 0.1% |
| Armenian | 200 | 0.2% |
| Australian | 17 | 0.0% |
| Austrian | 237 | 0.3% |
| Belgian | 196 | 0.2% |
| Bhutanese | 286 | 0.3% |
| Bolivian | 16 | 0.0% |
| Brazilian | 231 | 0.3% |
| British | 1,063 | 1.2% |
| Burmese | 29 | 0.0% |
| Canadian | 66 | 0.1% |
| Central American | 137 | 0.2% |
| Central American Indian | 67 | 0.1% |
| Cherokee | 476 | 0.5% |
| Chippewa | 6 | 0.0% |
| Choctaw | 18 | 0.0% |
| Colombian | 33 | 0.0% |
| Comanche | 19 | 0.0% |
| Croatian | 255 | 0.3% |
| Cuban | 119 | 0.1% |
| Czech | 328 | 0.4% |
| Czechoslovakian | 24 | 0.0% |
| Danish | 158 | 0.2% |
| Dominican | 27 | 0.0% |
| Dutch | 714 | 0.8% |
| Eastern European | 316 | 0.4% |
| Ecuadorian | 15 | 0.0% |
| English | 20,346 | 22.4% |
| European | 3,011 | 3.3% |
| Filipino | 50 | 0.1% |
| Finnish | 130 | 0.1% |
| French | 1,986 | 2.2% |
| French Canadian | 939 | 1.0% |
| German | 13,003 | 14.3% |
| Greek | 415 | 0.5% |
| Hungarian | 262 | 0.3% |
| Indian (Asian) | 512 | 0.6% |
| Iranian | 14 | 0.0% |
| Iraqi | 12 | 0.0% |
| Irish | 12,830 | 14.1% |
| Italian | 6,834 | 7.5% |
| Kenyan | 1 | 0.0% |
| Korean | 272 | 0.3% |
| Laotian | 21 | 0.0% |
| Latvian | 39 | 0.0% |
| Lebanese | 149 | 0.2% |
| Lithuanian | 110 | 0.1% |
| Malaysian | 40 | 0.0% |
| Maltese | 12 | 0.0% |
| Mexican | 781 | 0.9% |
| Native Hawaiian | 9 | 0.0% |
| Northern European | 52 | 0.1% |
| Norwegian | 777 | 0.9% |
| Pakistani | 29 | 0.0% |
| Panamanian | 77 | 0.1% |
| Peruvian | 94 | 0.1% |
| Polish | 2,819 | 3.1% |
| Portuguese | 298 | 0.3% |
| Puerto Rican | 360 | 0.4% |
| Russian | 657 | 0.7% |
| Salvadoran | 60 | 0.1% |
| Samoan | 49 | 0.1% |
| Scandinavian | 353 | 0.4% |
| Scotch-Irish | 1,817 | 2.0% |
| Scottish | 3,239 | 3.6% |
| Serbian | 61 | 0.1% |
| Sioux | 20 | 0.0% |
| Slavic | 84 | 0.1% |
| Slovak | 192 | 0.2% |
| Slovene | 38 | 0.0% |
| South African | 65 | 0.1% |
| South American | 233 | 0.3% |
| Spaniard | 249 | 0.3% |
| Spanish | 149 | 0.2% |
| Sri Lankan | 158 | 0.2% |
| Subsaharan African | 140 | 0.2% |
| Swedish | 938 | 1.0% |
| Swiss | 203 | 0.2% |
| Syrian | 50 | 0.1% |
| Thai | 502 | 0.5% |
| Turkish | 171 | 0.2% |
| Ukrainian | 359 | 0.4% |
| Venezuelan | 10 | 0.0% |
| Welsh | 683 | 0.7% |
| Yugoslavian | 16 | 0.0% | View All 89 Rows |
Immigrants in Mount Pleasant
The most numerous immigrant groups reported in Mount Pleasant came from Europe (1,602 | 1.8%), Asia (1,242 | 1.4%), Latin America (975 | 1.1%), Western Europe (678 | 0.7%), and South America (575 | 0.6%), together accounting for 5.6% of all Mount Pleasant residents.
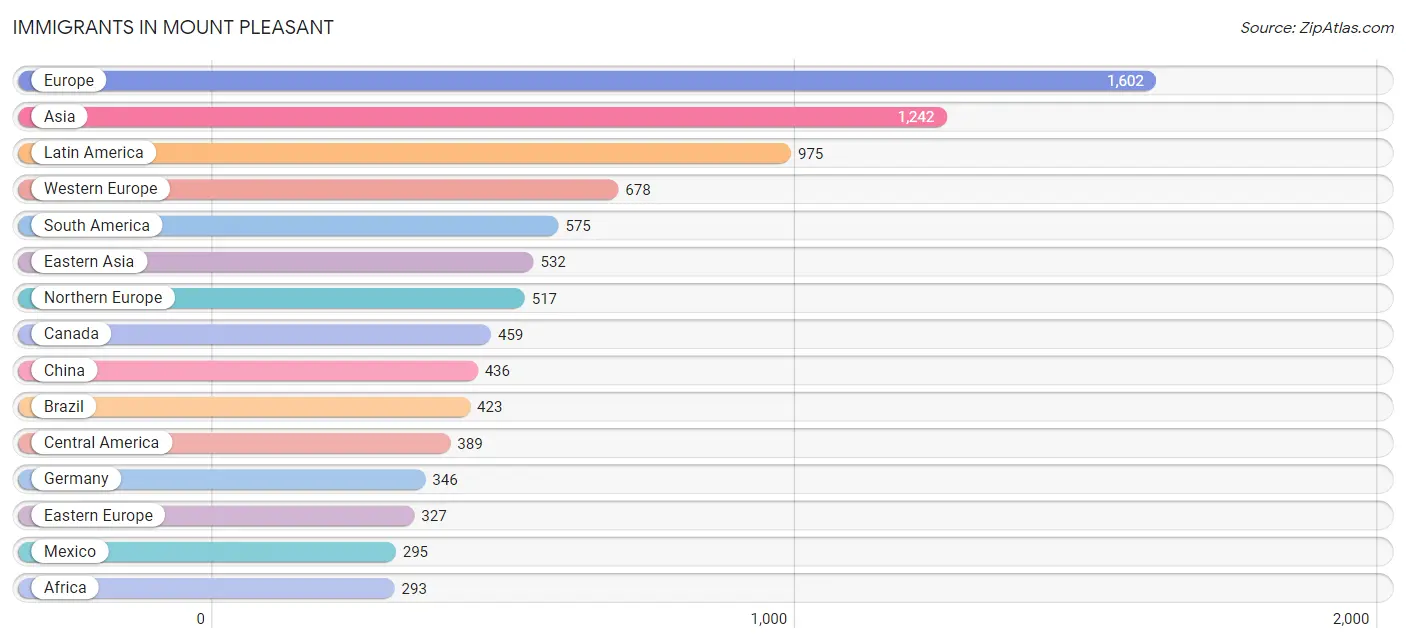
| Immigration Origin | # Population | % Population |
| Africa | 293 | 0.3% |
| Argentina | 12 | 0.0% |
| Asia | 1,242 | 1.4% |
| Australia | 64 | 0.1% |
| Austria | 7 | 0.0% |
| Belgium | 21 | 0.0% |
| Bolivia | 16 | 0.0% |
| Bosnia and Herzegovina | 16 | 0.0% |
| Brazil | 423 | 0.5% |
| Canada | 459 | 0.5% |
| Caribbean | 11 | 0.0% |
| Central America | 389 | 0.4% |
| China | 436 | 0.5% |
| Cuba | 11 | 0.0% |
| Czechoslovakia | 97 | 0.1% |
| Denmark | 12 | 0.0% |
| Eastern Africa | 38 | 0.0% |
| Eastern Asia | 532 | 0.6% |
| Eastern Europe | 327 | 0.4% |
| Ecuador | 34 | 0.0% |
| Egypt | 12 | 0.0% |
| England | 180 | 0.2% |
| Ethiopia | 36 | 0.0% |
| Europe | 1,602 | 1.8% |
| France | 274 | 0.3% |
| Germany | 346 | 0.4% |
| India | 292 | 0.3% |
| Indonesia | 21 | 0.0% |
| Ireland | 7 | 0.0% |
| Italy | 66 | 0.1% |
| Japan | 96 | 0.1% |
| Kenya | 1 | 0.0% |
| Laos | 40 | 0.0% |
| Latin America | 975 | 1.1% |
| Latvia | 51 | 0.1% |
| Lebanon | 35 | 0.0% |
| Mexico | 295 | 0.3% |
| Netherlands | 20 | 0.0% |
| Northern Africa | 118 | 0.1% |
| Northern Europe | 517 | 0.6% |
| Oceania | 64 | 0.1% |
| Pakistan | 1 | 0.0% |
| Panama | 94 | 0.1% |
| Peru | 50 | 0.1% |
| Philippines | 104 | 0.1% |
| Poland | 35 | 0.0% |
| Russia | 91 | 0.1% |
| South Africa | 108 | 0.1% |
| South America | 575 | 0.6% |
| South Central Asia | 293 | 0.3% |
| South Eastern Asia | 241 | 0.3% |
| Southern Europe | 66 | 0.1% |
| Sweden | 231 | 0.3% |
| Switzerland | 10 | 0.0% |
| Taiwan | 58 | 0.1% |
| Thailand | 29 | 0.0% |
| Turkey | 119 | 0.1% |
| Ukraine | 37 | 0.0% |
| Venezuela | 40 | 0.0% |
| Vietnam | 47 | 0.1% |
| Western Asia | 154 | 0.2% |
| Western Europe | 678 | 0.7% | View All 62 Rows |
Sex and Age in Mount Pleasant
Sex and Age in Mount Pleasant
The most populous age groups in Mount Pleasant are 45 to 49 Years (3,706 | 8.3%) for men and 40 to 44 Years (4,418 | 9.6%) for women.
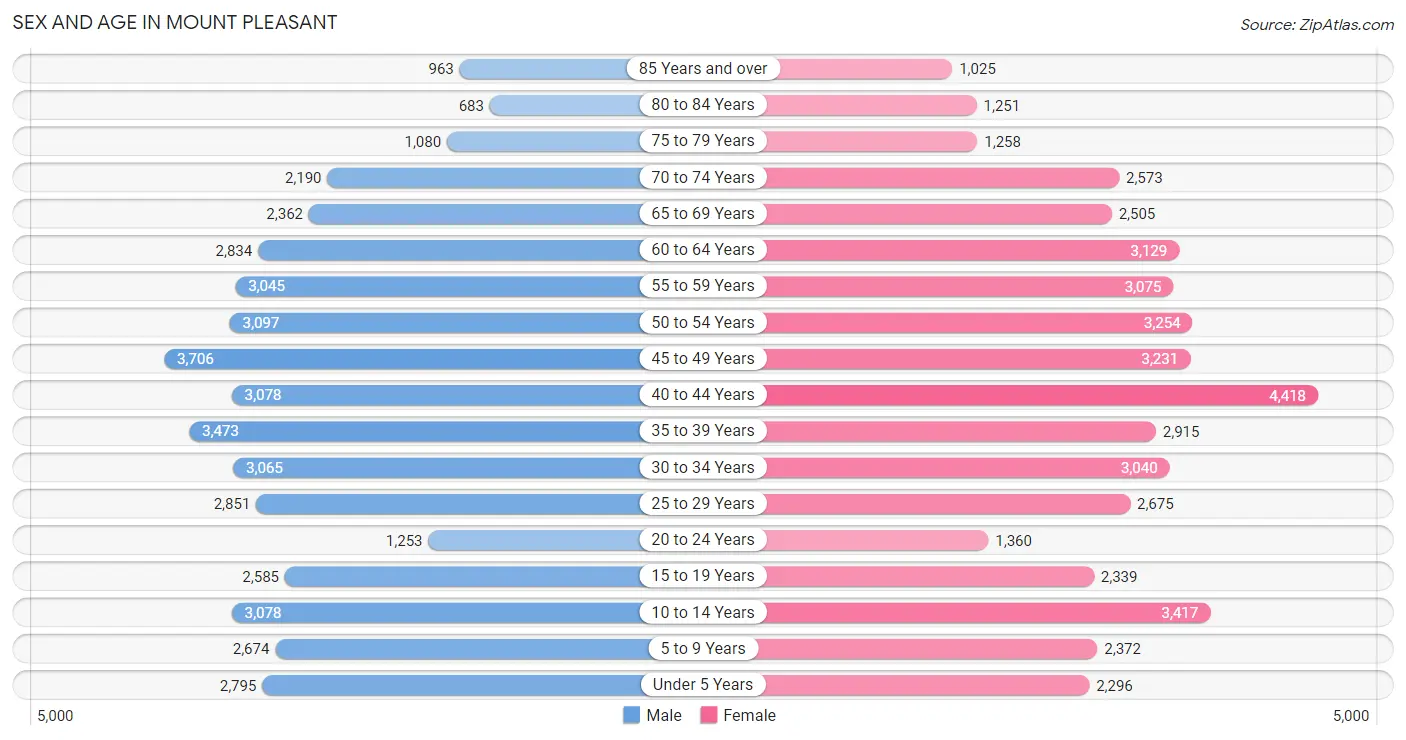
| Age Bracket | Male | Female |
| Under 5 Years | 2,795 (6.2%) | 2,296 (5.0%) |
| 5 to 9 Years | 2,674 (6.0%) | 2,372 (5.1%) |
| 10 to 14 Years | 3,078 (6.9%) | 3,417 (7.4%) |
| 15 to 19 Years | 2,585 (5.8%) | 2,339 (5.1%) |
| 20 to 24 Years | 1,253 (2.8%) | 1,360 (2.9%) |
| 25 to 29 Years | 2,851 (6.4%) | 2,675 (5.8%) |
| 30 to 34 Years | 3,065 (6.8%) | 3,040 (6.6%) |
| 35 to 39 Years | 3,473 (7.7%) | 2,915 (6.3%) |
| 40 to 44 Years | 3,078 (6.9%) | 4,418 (9.6%) |
| 45 to 49 Years | 3,706 (8.3%) | 3,231 (7.0%) |
| 50 to 54 Years | 3,097 (6.9%) | 3,254 (7.0%) |
| 55 to 59 Years | 3,045 (6.8%) | 3,075 (6.7%) |
| 60 to 64 Years | 2,834 (6.3%) | 3,129 (6.8%) |
| 65 to 69 Years | 2,362 (5.3%) | 2,505 (5.4%) |
| 70 to 74 Years | 2,190 (4.9%) | 2,573 (5.6%) |
| 75 to 79 Years | 1,080 (2.4%) | 1,258 (2.7%) |
| 80 to 84 Years | 683 (1.5%) | 1,251 (2.7%) |
| 85 Years and over | 963 (2.1%) | 1,025 (2.2%) |
| Total | 44,812 (100.0%) | 46,133 (100.0%) |
Families and Households in Mount Pleasant
Median Family Size in Mount Pleasant
The median family size in Mount Pleasant is 2.96 persons per family, with married-couple families (21,471 | 87.6%) accounting for the largest median family size of 2.99 persons per family. On the other hand, single male/father families (1,077 | 4.4%) represent the smallest median family size with 2.74 persons per family.
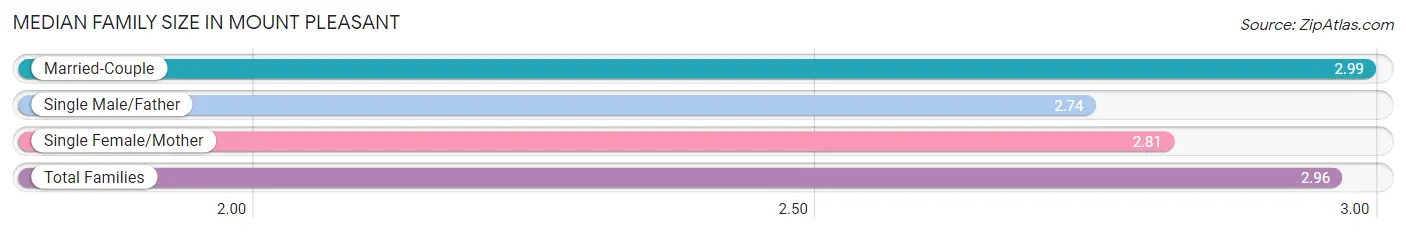
| Family Type | # Families | Family Size |
| Married-Couple | 21,471 (87.6%) | 2.99 |
| Single Male/Father | 1,077 (4.4%) | 2.74 |
| Single Female/Mother | 1,947 (8.0%) | 2.81 |
| Total Families | 24,495 (100.0%) | 2.96 |
Median Household Size in Mount Pleasant
The median household size in Mount Pleasant is 2.37 persons per household, with married-couple households (21,471 | 56.3%) accounting for the largest median household size of 3 persons per household. non-family households (13,654 | 35.8%) represent the smallest median household size with 1.24 persons per household.
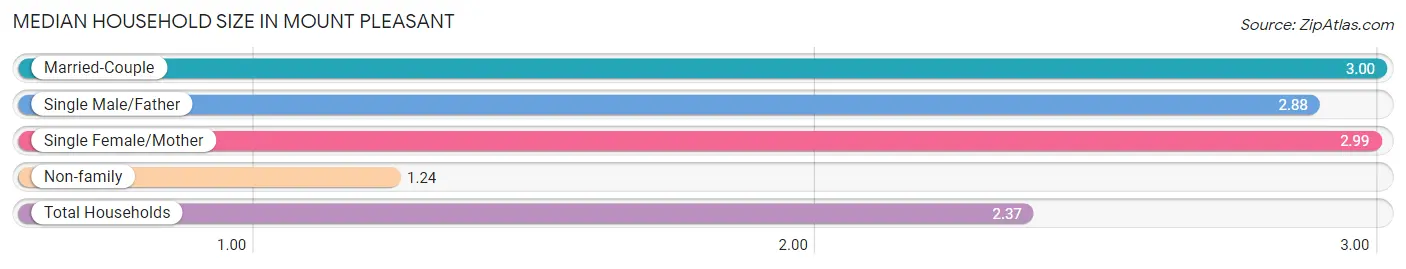
| Household Type | # Households | Household Size |
| Married-Couple | 21,471 (56.3%) | 3.00 |
| Single Male/Father | 1,077 (2.8%) | 2.88 |
| Single Female/Mother | 1,947 (5.1%) | 2.99 |
| Non-family | 13,654 (35.8%) | 1.24 |
| Total Households | 38,149 (100.0%) | 2.37 |
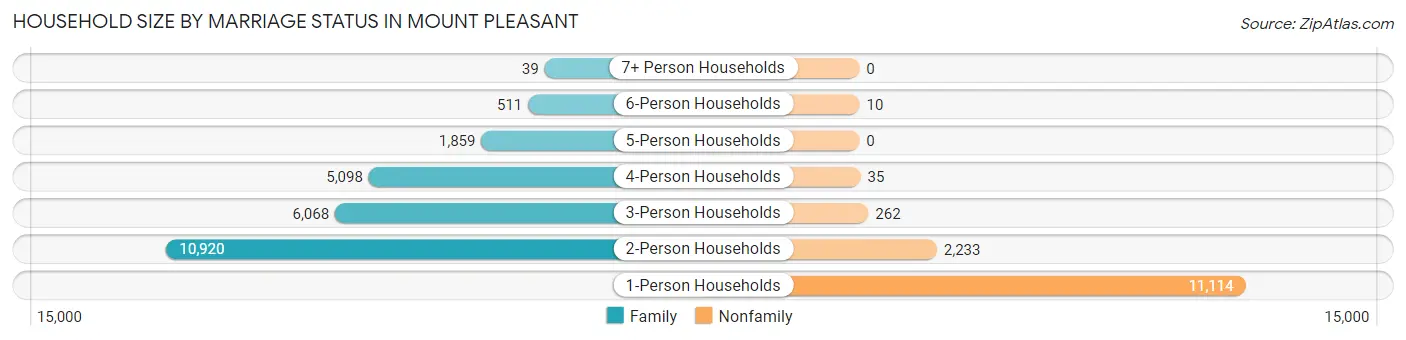
Household Size by Marriage Status in Mount Pleasant
Out of a total of 38,149 households in Mount Pleasant, 24,495 (64.2%) are family households, while 13,654 (35.8%) are nonfamily households. The most numerous type of family households are 2-person households, comprising 10,920, and the most common type of nonfamily households are 1-person households, comprising 11,114.
| Household Size | Family Households | Nonfamily Households |
| 1-Person Households | - | 11,114 (29.1%) |
| 2-Person Households | 10,920 (28.6%) | 2,233 (5.9%) |
| 3-Person Households | 6,068 (15.9%) | 262 (0.7%) |
| 4-Person Households | 5,098 (13.4%) | 35 (0.1%) |
| 5-Person Households | 1,859 (4.9%) | 0 (0.0%) |
| 6-Person Households | 511 (1.3%) | 10 (0.0%) |
| 7+ Person Households | 39 (0.1%) | 0 (0.0%) |
| Total | 24,495 (64.2%) | 13,654 (35.8%) |
Female Fertility in Mount Pleasant
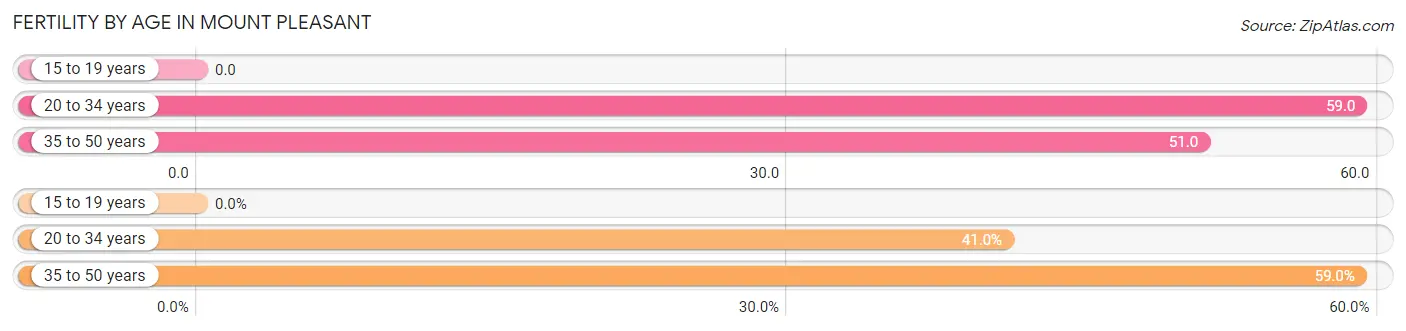
Fertility by Age in Mount Pleasant
Average fertility rate in Mount Pleasant is 48.0 births per 1,000 women. Women in the age bracket of 20 to 34 years have the highest fertility rate with 59.0 births per 1,000 women. Women in the age bracket of 35 to 50 years acount for 59.0% of all women with births.
| Age Bracket | Women with Births | Births / 1,000 Women |
| 15 to 19 years | 0 (0.0%) | 0.0 |
| 20 to 34 years | 420 (41.0%) | 59.0 |
| 35 to 50 years | 604 (59.0%) | 51.0 |
| Total | 1,024 (100.0%) | 48.0 |
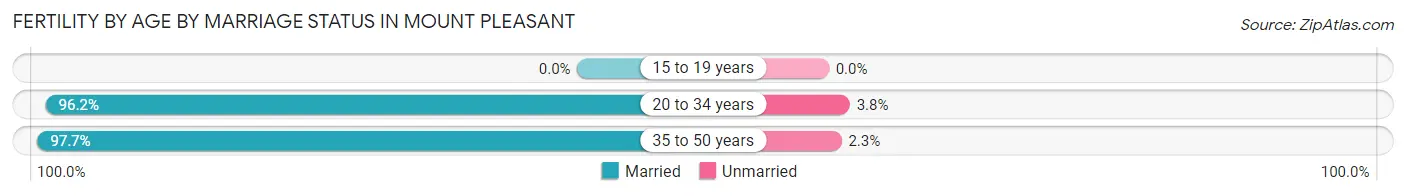
Fertility by Age by Marriage Status in Mount Pleasant
97.1% of women with births (1,024) in Mount Pleasant are married. The highest percentage of unmarried women with births falls into 20 to 34 years age bracket with 3.8% of them unmarried at the time of birth, while the lowest percentage of unmarried women with births belong to 35 to 50 years age bracket with 2.3% of them unmarried.
| Age Bracket | Married | Unmarried |
| 15 to 19 years | 0 (0.0%) | 0 (0.0%) |
| 20 to 34 years | 404 (96.2%) | 16 (3.8%) |
| 35 to 50 years | 590 (97.7%) | 14 (2.3%) |
| Total | 994 (97.1%) | 30 (2.9%) |
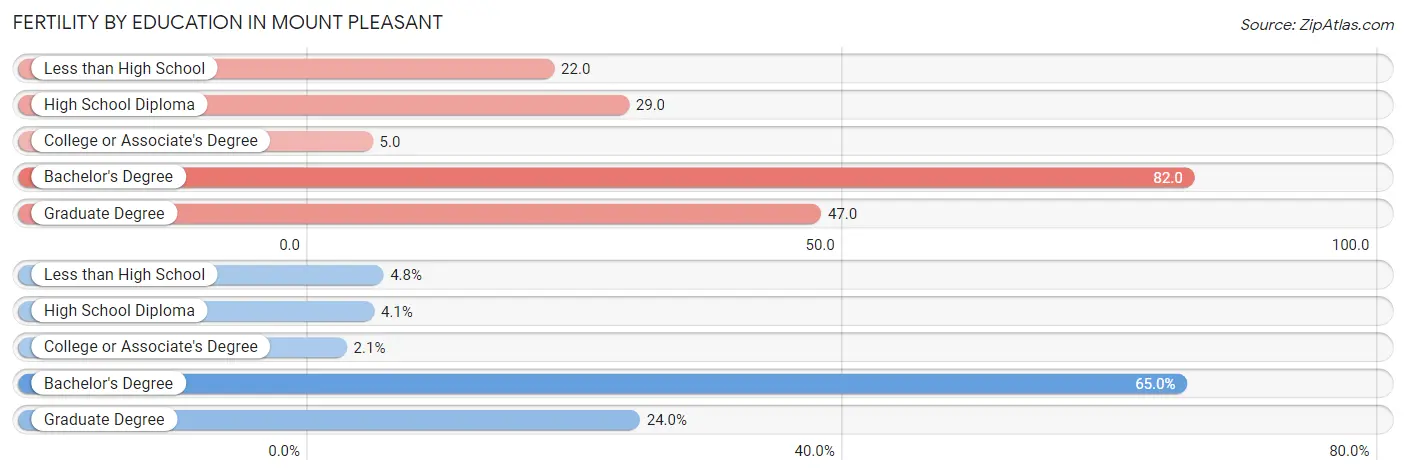
Fertility by Education in Mount Pleasant
Average fertility rate in Mount Pleasant is 48.0 births per 1,000 women. Women with the education attainment of bachelor's degree have the highest fertility rate of 82.0 births per 1,000 women, while women with the education attainment of college or associate's degree have the lowest fertility at 5.0 births per 1,000 women. Women with the education attainment of bachelor's degree represent 65.0% of all women with births.
| Educational Attainment | Women with Births | Births / 1,000 Women |
| Less than High School | 49 (4.8%) | 22.0 |
| High School Diploma | 42 (4.1%) | 29.0 |
| College or Associate's Degree | 21 (2.1%) | 5.0 |
| Bachelor's Degree | 666 (65.0%) | 82.0 |
| Graduate Degree | 246 (24.0%) | 47.0 |
| Total | 1,024 (100.0%) | 48.0 |
Fertility by Education by Marriage Status in Mount Pleasant
2.9% of women with births in Mount Pleasant are unmarried. Women with the educational attainment of less than high school are most likely to be married with 100.0% of them married at childbirth, while women with the educational attainment of high school diploma are least likely to be married with 38.1% of them unmarried at childbirth.
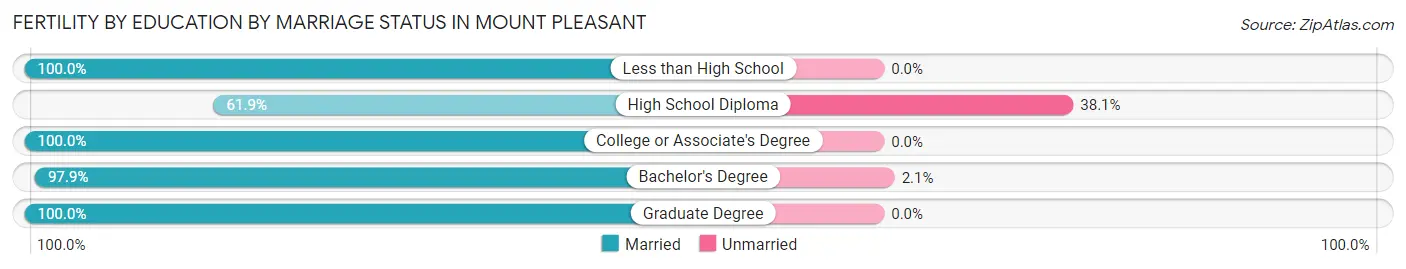
| Educational Attainment | Married | Unmarried |
| Less than High School | 49 (100.0%) | 0 (0.0%) |
| High School Diploma | 26 (61.9%) | 16 (38.1%) |
| College or Associate's Degree | 21 (100.0%) | 0 (0.0%) |
| Bachelor's Degree | 652 (97.9%) | 14 (2.1%) |
| Graduate Degree | 246 (100.0%) | 0 (0.0%) |
| Total | 994 (97.1%) | 30 (2.9%) |
Employment Characteristics in Mount Pleasant
Employment by Class of Employer in Mount Pleasant
Among the 46,848 employed individuals in Mount Pleasant, private company employees (29,430 | 62.8%), self-employed (not incorporated) (3,819 | 8.2%), and self-employed (incorporated) (3,152 | 6.7%) make up the most common classes of employment.
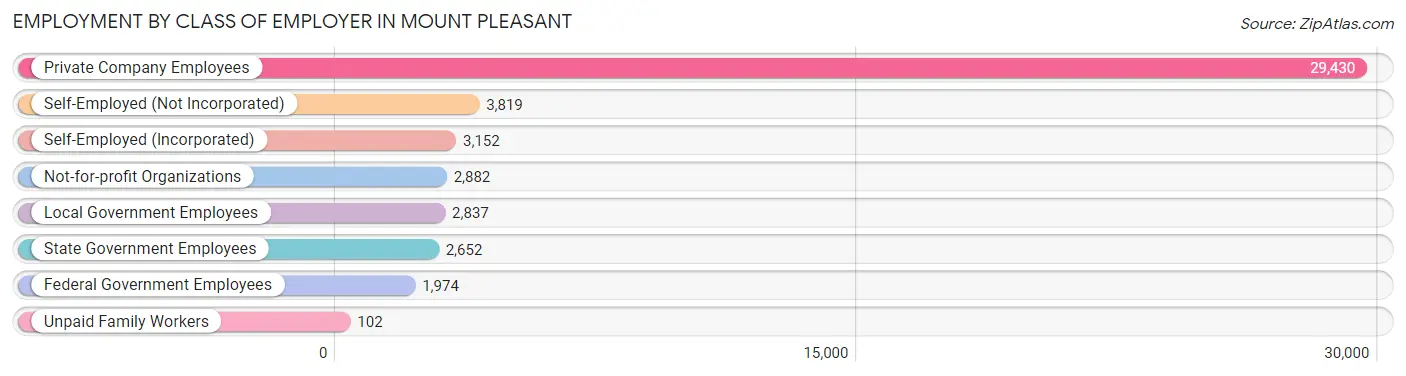
| Employer Class | # Employees | % Employees |
| Private Company Employees | 29,430 | 62.8% |
| Self-Employed (Incorporated) | 3,152 | 6.7% |
| Self-Employed (Not Incorporated) | 3,819 | 8.2% |
| Not-for-profit Organizations | 2,882 | 6.1% |
| Local Government Employees | 2,837 | 6.1% |
| State Government Employees | 2,652 | 5.7% |
| Federal Government Employees | 1,974 | 4.2% |
| Unpaid Family Workers | 102 | 0.2% |
| Total | 46,848 | 100.0% |
Employment Status by Age in Mount Pleasant
According to the labor force statistics for Mount Pleasant, out of the total population over 16 years of age (73,145), 67.2% or 49,153 individuals are in the labor force, with 3.2% or 1,573 of them unemployed. The age group with the highest labor force participation rate is 30 to 34 years, with 90.2% or 5,507 individuals in the labor force. Within the labor force, the 55 to 59 years age range has the highest percentage of unemployed individuals, with 6.7% or 318 of them being unemployed.
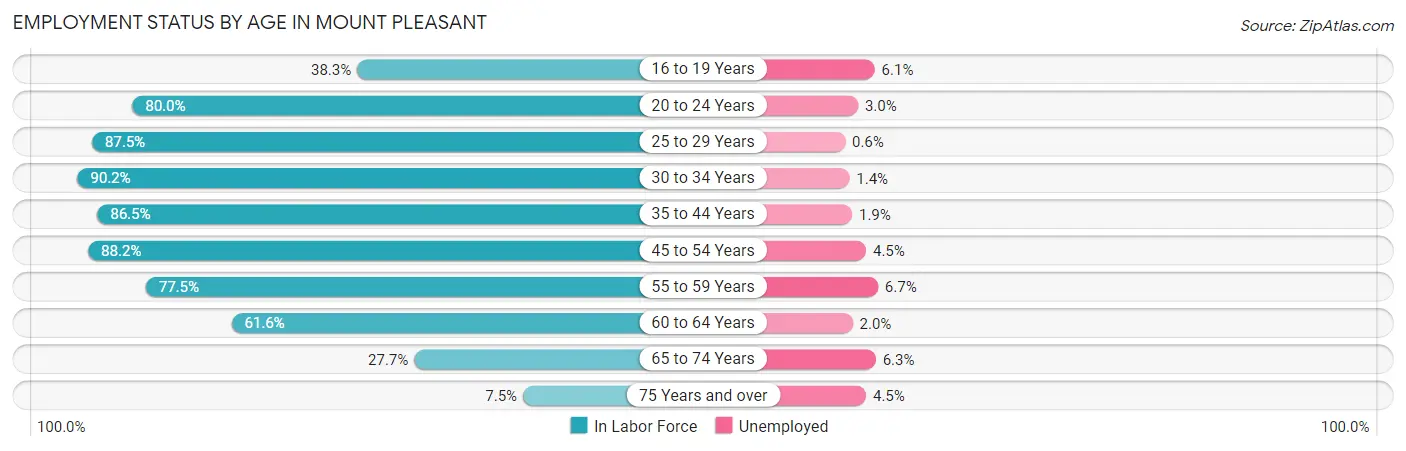
| Age Bracket | In Labor Force | Unemployed |
| 16 to 19 Years | 1,439 (38.3%) | 88 (6.1%) |
| 20 to 24 Years | 2,090 (80.0%) | 63 (3.0%) |
| 25 to 29 Years | 4,835 (87.5%) | 29 (0.6%) |
| 30 to 34 Years | 5,507 (90.2%) | 77 (1.4%) |
| 35 to 44 Years | 12,010 (86.5%) | 228 (1.9%) |
| 45 to 54 Years | 11,720 (88.2%) | 527 (4.5%) |
| 55 to 59 Years | 4,743 (77.5%) | 318 (6.7%) |
| 60 to 64 Years | 3,673 (61.6%) | 73 (2.0%) |
| 65 to 74 Years | 2,668 (27.7%) | 168 (6.3%) |
| 75 Years and over | 470 (7.5%) | 21 (4.5%) |
| Total | 49,153 (67.2%) | 1,573 (3.2%) |
Employment Status by Educational Attainment in Mount Pleasant
According to labor force statistics for Mount Pleasant, 83.5% of individuals (42,490) out of the total population between 25 and 64 years of age (50,886) are in the labor force, with 2.9% or 1,232 of them being unemployed. The group with the highest labor force participation rate are those with the educational attainment of college / associate degree, with 85.0% or 9,502 individuals in the labor force. Within the labor force, individuals with less than high school education have the highest percentage of unemployment, with 12.3% or 70 of them being unemployed.
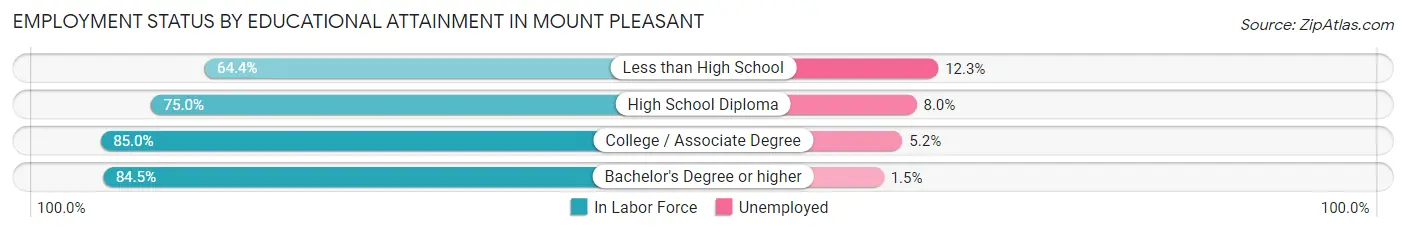
| Educational Attainment | In Labor Force | Unemployed |
| Less than High School | 569 (64.4%) | 109 (12.3%) |
| High School Diploma | 3,222 (75.0%) | 344 (8.0%) |
| College / Associate Degree | 9,502 (85.0%) | 581 (5.2%) |
| Bachelor's Degree or higher | 29,176 (84.5%) | 518 (1.5%) |
| Total | 42,490 (83.5%) | 1,476 (2.9%) |
Employment Occupations by Sex in Mount Pleasant
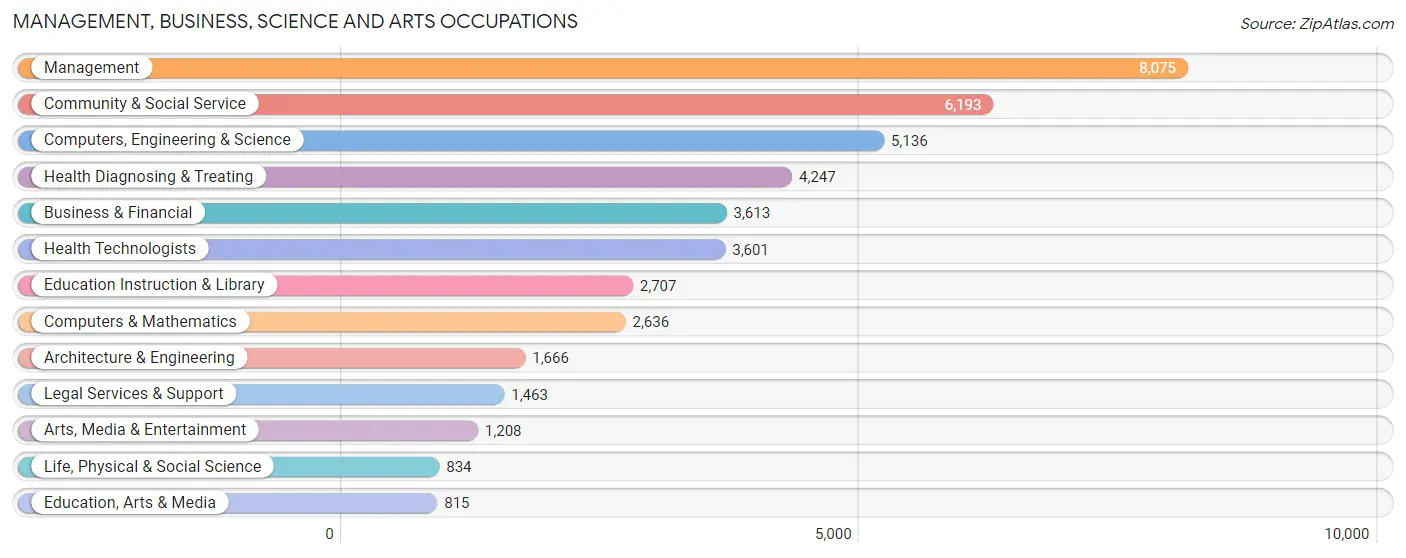
Management, Business, Science and Arts Occupations
The most common Management, Business, Science and Arts occupations in Mount Pleasant are Management (8,075 | 17.1%), Community & Social Service (6,193 | 13.1%), Computers, Engineering & Science (5,136 | 10.9%), Health Diagnosing & Treating (4,247 | 9.0%), and Business & Financial (3,613 | 7.6%).
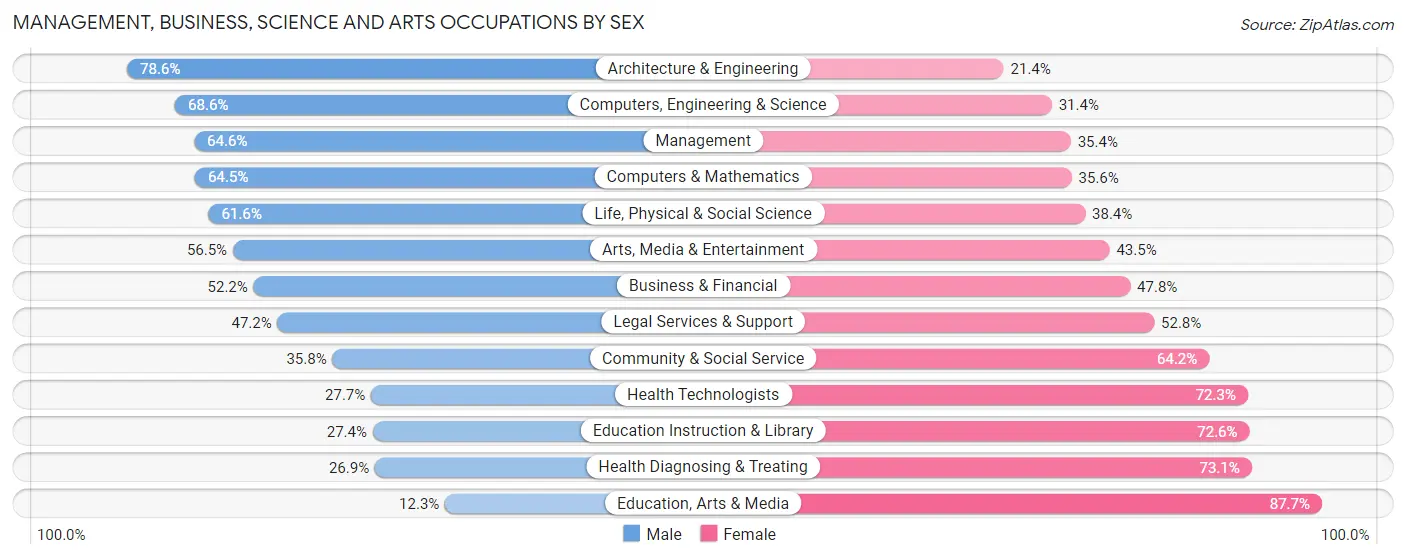
Management, Business, Science and Arts Occupations by Sex
Within the Management, Business, Science and Arts occupations in Mount Pleasant, the most male-oriented occupations are Architecture & Engineering (78.6%), Computers, Engineering & Science (68.6%), and Management (64.6%), while the most female-oriented occupations are Education, Arts & Media (87.7%), Health Diagnosing & Treating (73.1%), and Education Instruction & Library (72.6%).
| Occupation | Male | Female |
| Management | 5,219 (64.6%) | 2,856 (35.4%) |
| Business & Financial | 1,887 (52.2%) | 1,726 (47.8%) |
| Computers, Engineering & Science | 3,523 (68.6%) | 1,613 (31.4%) |
| Computers & Mathematics | 1,699 (64.4%) | 937 (35.5%) |
| Architecture & Engineering | 1,310 (78.6%) | 356 (21.4%) |
| Life, Physical & Social Science | 514 (61.6%) | 320 (38.4%) |
| Community & Social Service | 2,215 (35.8%) | 3,978 (64.2%) |
| Education, Arts & Media | 100 (12.3%) | 715 (87.7%) |
| Legal Services & Support | 691 (47.2%) | 772 (52.8%) |
| Education Instruction & Library | 741 (27.4%) | 1,966 (72.6%) |
| Arts, Media & Entertainment | 683 (56.5%) | 525 (43.5%) |
| Health Diagnosing & Treating | 1,143 (26.9%) | 3,104 (73.1%) |
| Health Technologists | 998 (27.7%) | 2,603 (72.3%) |
| Total (Category) | 13,987 (51.3%) | 13,277 (48.7%) |
| Total (Overall) | 25,751 (54.5%) | 21,514 (45.5%) |
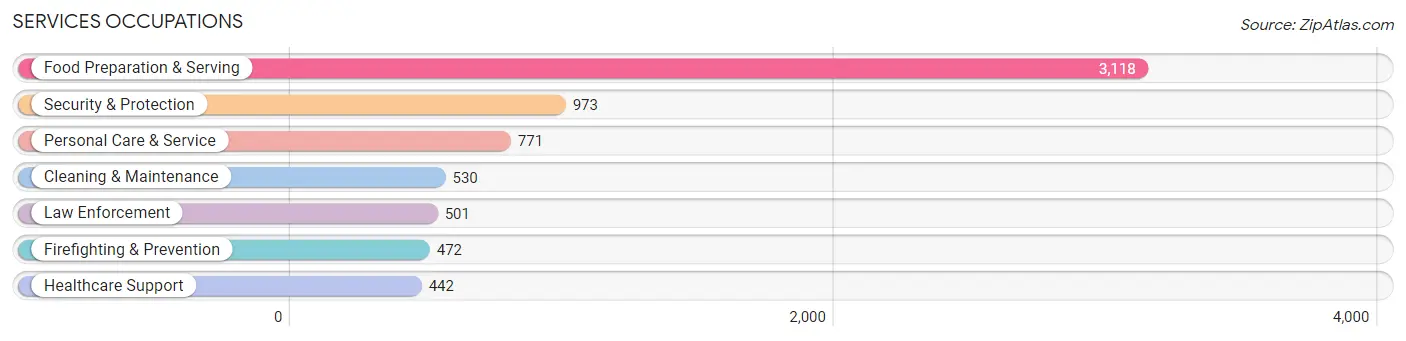
Services Occupations
The most common Services occupations in Mount Pleasant are Food Preparation & Serving (3,118 | 6.6%), Security & Protection (973 | 2.1%), Personal Care & Service (771 | 1.6%), Cleaning & Maintenance (530 | 1.1%), and Law Enforcement (501 | 1.1%).
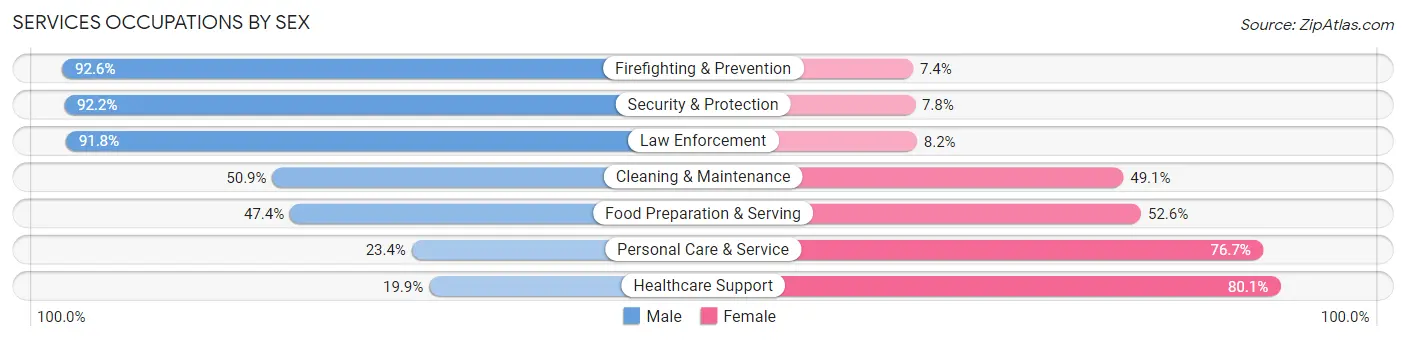
Services Occupations by Sex
Within the Services occupations in Mount Pleasant, the most male-oriented occupations are Firefighting & Prevention (92.6%), Security & Protection (92.2%), and Law Enforcement (91.8%), while the most female-oriented occupations are Healthcare Support (80.1%), Personal Care & Service (76.6%), and Food Preparation & Serving (52.6%).
| Occupation | Male | Female |
| Healthcare Support | 88 (19.9%) | 354 (80.1%) |
| Security & Protection | 897 (92.2%) | 76 (7.8%) |
| Firefighting & Prevention | 437 (92.6%) | 35 (7.4%) |
| Law Enforcement | 460 (91.8%) | 41 (8.2%) |
| Food Preparation & Serving | 1,479 (47.4%) | 1,639 (52.6%) |
| Cleaning & Maintenance | 270 (50.9%) | 260 (49.1%) |
| Personal Care & Service | 180 (23.4%) | 591 (76.6%) |
| Total (Category) | 2,914 (49.9%) | 2,920 (50.0%) |
| Total (Overall) | 25,751 (54.5%) | 21,514 (45.5%) |
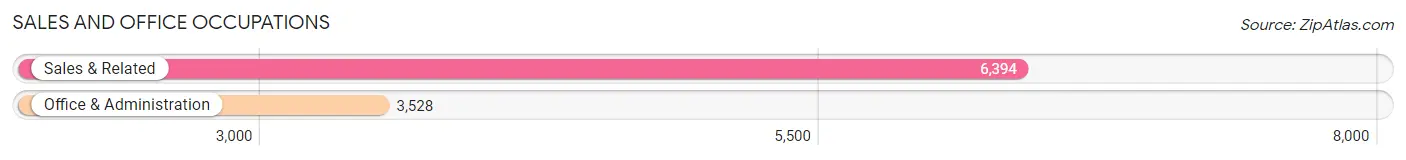
Sales and Office Occupations
The most common Sales and Office occupations in Mount Pleasant are Sales & Related (6,394 | 13.5%), and Office & Administration (3,528 | 7.5%).
Sales and Office Occupations by Sex
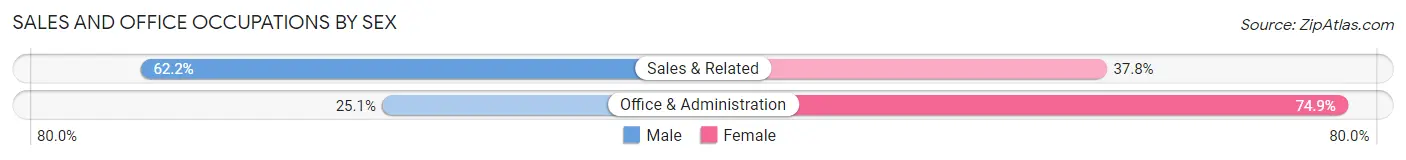
| Occupation | Male | Female |
| Sales & Related | 3,975 (62.2%) | 2,419 (37.8%) |
| Office & Administration | 884 (25.1%) | 2,644 (74.9%) |
| Total (Category) | 4,859 (49.0%) | 5,063 (51.0%) |
| Total (Overall) | 25,751 (54.5%) | 21,514 (45.5%) |
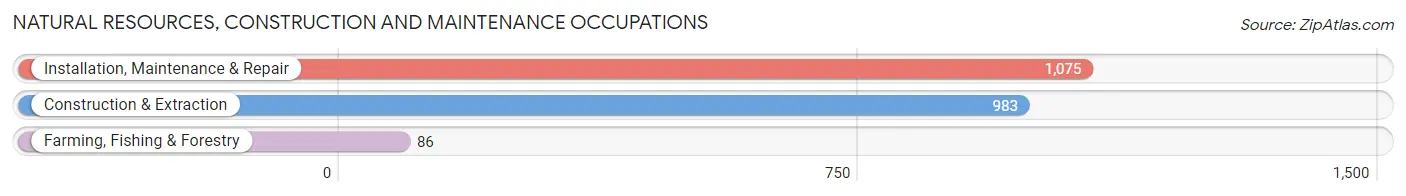
Natural Resources, Construction and Maintenance Occupations
The most common Natural Resources, Construction and Maintenance occupations in Mount Pleasant are Installation, Maintenance & Repair (1,075 | 2.3%), Construction & Extraction (983 | 2.1%), and Farming, Fishing & Forestry (86 | 0.2%).
Natural Resources, Construction and Maintenance Occupations by Sex
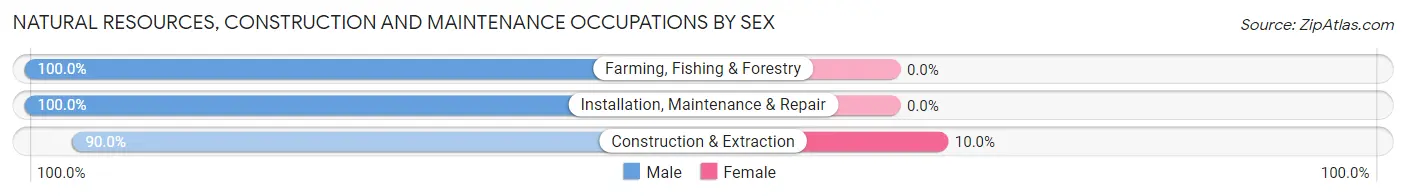
| Occupation | Male | Female |
| Farming, Fishing & Forestry | 86 (100.0%) | 0 (0.0%) |
| Construction & Extraction | 885 (90.0%) | 98 (10.0%) |
| Installation, Maintenance & Repair | 1,075 (100.0%) | 0 (0.0%) |
| Total (Category) | 2,046 (95.4%) | 98 (4.6%) |
| Total (Overall) | 25,751 (54.5%) | 21,514 (45.5%) |
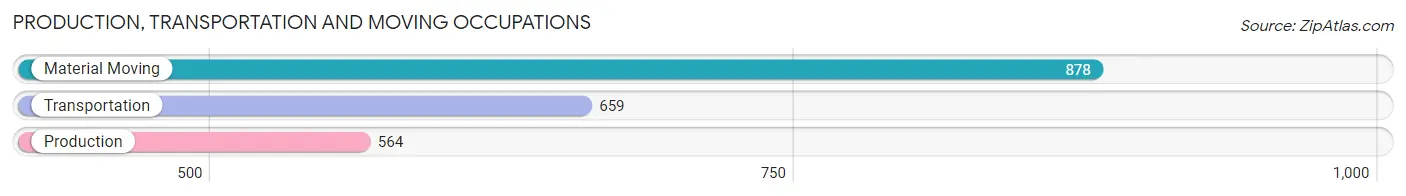
Production, Transportation and Moving Occupations
The most common Production, Transportation and Moving occupations in Mount Pleasant are Material Moving (878 | 1.9%), Transportation (659 | 1.4%), and Production (564 | 1.2%).
Production, Transportation and Moving Occupations by Sex
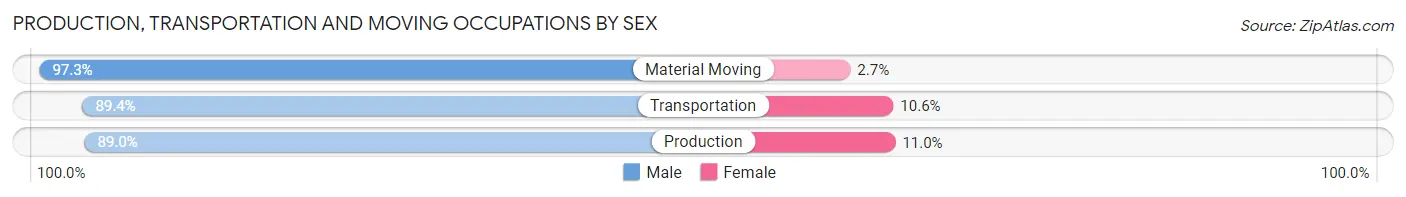
| Occupation | Male | Female |
| Production | 502 (89.0%) | 62 (11.0%) |
| Transportation | 589 (89.4%) | 70 (10.6%) |
| Material Moving | 854 (97.3%) | 24 (2.7%) |
| Total (Category) | 1,945 (92.6%) | 156 (7.4%) |
| Total (Overall) | 25,751 (54.5%) | 21,514 (45.5%) |
Employment Industries by Sex in Mount Pleasant
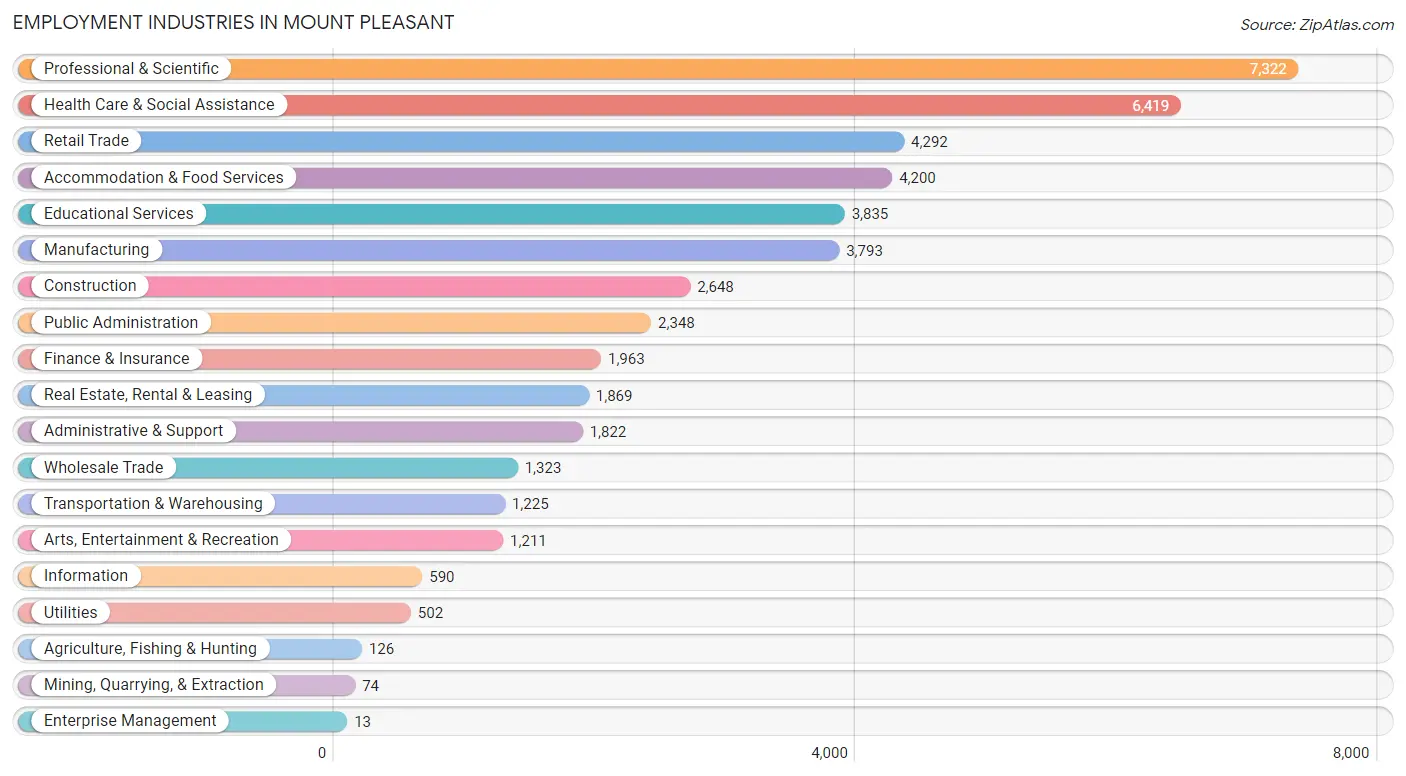
Employment Industries in Mount Pleasant
The major employment industries in Mount Pleasant include Professional & Scientific (7,322 | 15.5%), Health Care & Social Assistance (6,419 | 13.6%), Retail Trade (4,292 | 9.1%), Accommodation & Food Services (4,200 | 8.9%), and Educational Services (3,835 | 8.1%).
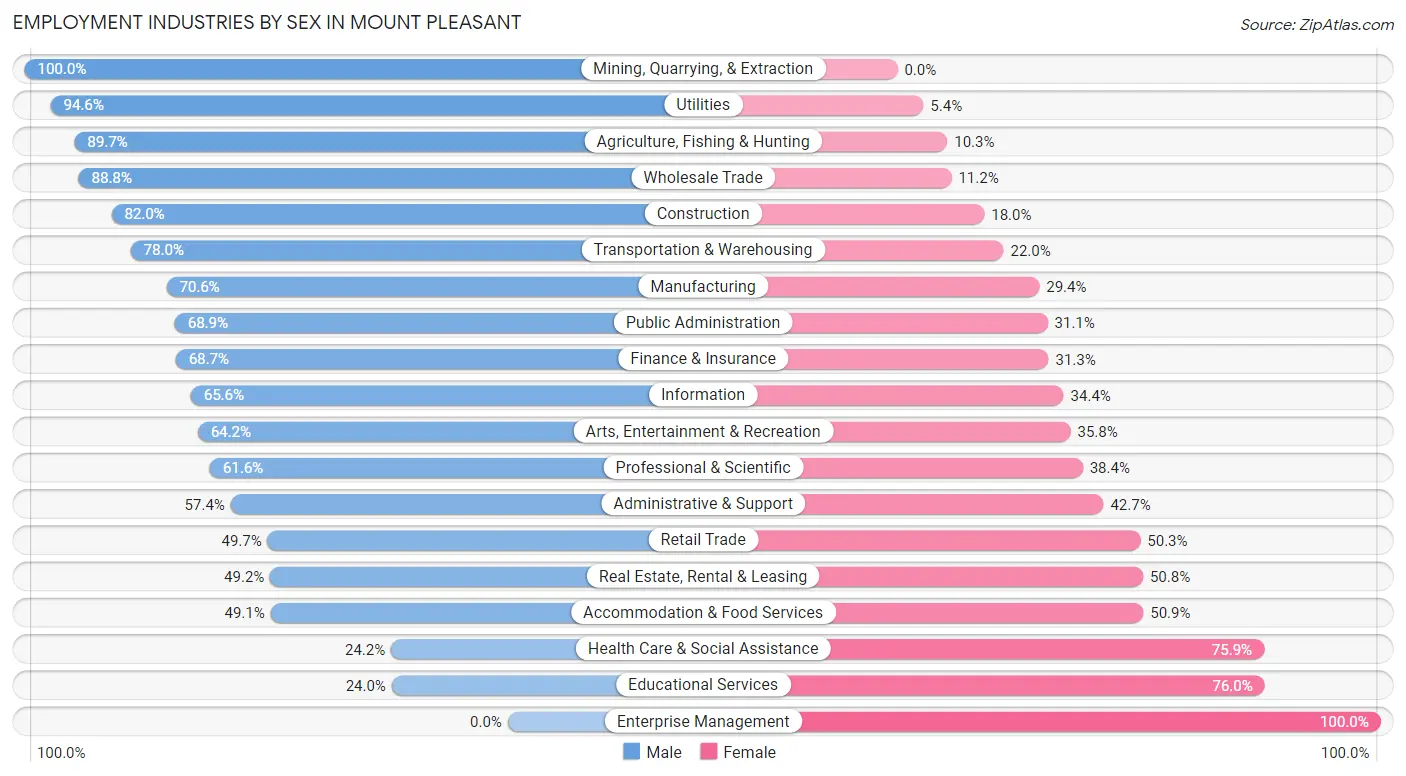
Employment Industries by Sex in Mount Pleasant
The Mount Pleasant industries that see more men than women are Mining, Quarrying, & Extraction (100.0%), Utilities (94.6%), and Agriculture, Fishing & Hunting (89.7%), whereas the industries that tend to have a higher number of women are Enterprise Management (100.0%), Educational Services (76.0%), and Health Care & Social Assistance (75.8%).
| Industry | Male | Female |
| Agriculture, Fishing & Hunting | 113 (89.7%) | 13 (10.3%) |
| Mining, Quarrying, & Extraction | 74 (100.0%) | 0 (0.0%) |
| Construction | 2,172 (82.0%) | 476 (18.0%) |
| Manufacturing | 2,679 (70.6%) | 1,114 (29.4%) |
| Wholesale Trade | 1,175 (88.8%) | 148 (11.2%) |
| Retail Trade | 2,134 (49.7%) | 2,158 (50.3%) |
| Transportation & Warehousing | 956 (78.0%) | 269 (22.0%) |
| Utilities | 475 (94.6%) | 27 (5.4%) |
| Information | 387 (65.6%) | 203 (34.4%) |
| Finance & Insurance | 1,349 (68.7%) | 614 (31.3%) |
| Real Estate, Rental & Leasing | 919 (49.2%) | 950 (50.8%) |
| Professional & Scientific | 4,513 (61.6%) | 2,809 (38.4%) |
| Enterprise Management | 0 (0.0%) | 13 (100.0%) |
| Administrative & Support | 1,045 (57.4%) | 777 (42.6%) |
| Educational Services | 921 (24.0%) | 2,914 (76.0%) |
| Health Care & Social Assistance | 1,550 (24.1%) | 4,869 (75.8%) |
| Arts, Entertainment & Recreation | 777 (64.2%) | 434 (35.8%) |
| Accommodation & Food Services | 2,062 (49.1%) | 2,138 (50.9%) |
| Public Administration | 1,618 (68.9%) | 730 (31.1%) |
| Total | 25,751 (54.5%) | 21,514 (45.5%) |
Education in Mount Pleasant
School Enrollment in Mount Pleasant
The most common levels of schooling among the 20,098 students in Mount Pleasant are high school (4,853 | 24.1%), middle school (4,728 | 23.5%), and elementary school (4,201 | 20.9%).
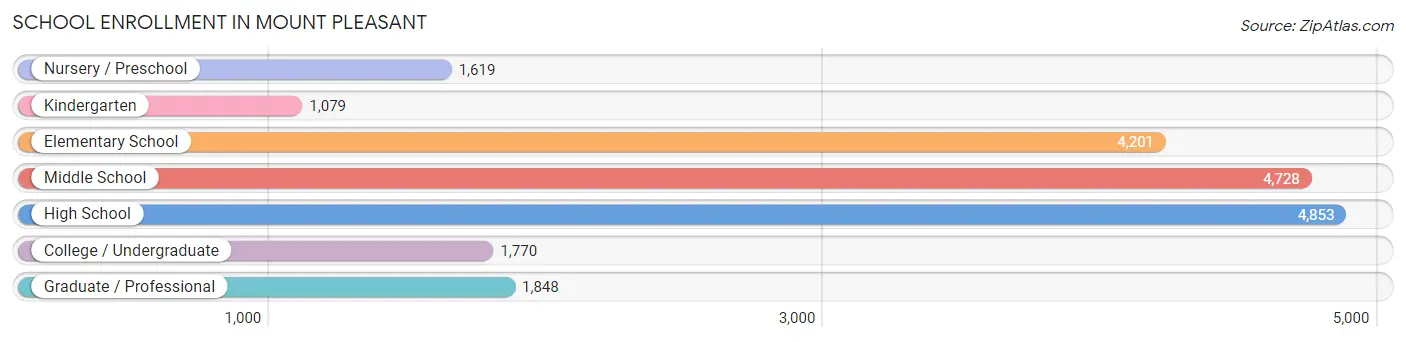
| School Level | # Students | % Students |
| Nursery / Preschool | 1,619 | 8.1% |
| Kindergarten | 1,079 | 5.4% |
| Elementary School | 4,201 | 20.9% |
| Middle School | 4,728 | 23.5% |
| High School | 4,853 | 24.1% |
| College / Undergraduate | 1,770 | 8.8% |
| Graduate / Professional | 1,848 | 9.2% |
| Total | 20,098 | 100.0% |
School Enrollment by Age by Funding Source in Mount Pleasant
Out of a total of 20,098 students who are enrolled in schools in Mount Pleasant, 4,482 (22.3%) attend a private institution, while the remaining 15,616 (77.7%) are enrolled in public schools. The age group of 3 to 4 year olds has the highest likelihood of being enrolled in private schools, with 838 (70.8% in the age bracket) enrolled. Conversely, the age group of 15 to 17 year olds has the lowest likelihood of being enrolled in a private school, with 3,439 (90.5% in the age bracket) attending a public institution.
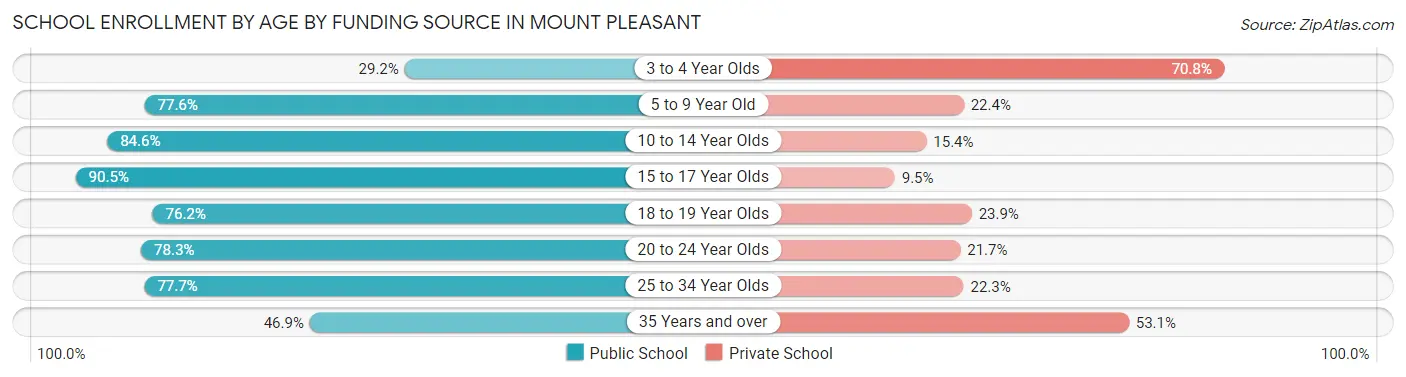
| Age Bracket | Public School | Private School |
| 3 to 4 Year Olds | 346 (29.2%) | 838 (70.8%) |
| 5 to 9 Year Old | 3,660 (77.6%) | 1,054 (22.4%) |
| 10 to 14 Year Olds | 5,341 (84.6%) | 972 (15.4%) |
| 15 to 17 Year Olds | 3,439 (90.5%) | 362 (9.5%) |
| 18 to 19 Year Olds | 565 (76.1%) | 177 (23.8%) |
| 20 to 24 Year Olds | 829 (78.3%) | 230 (21.7%) |
| 25 to 34 Year Olds | 925 (77.7%) | 266 (22.3%) |
| 35 Years and over | 513 (46.9%) | 581 (53.1%) |
| Total | 15,616 (77.7%) | 4,482 (22.3%) |
Educational Attainment by Field of Study in Mount Pleasant
Business (10,615 | 22.9%), science & technology (4,812 | 10.4%), education (4,687 | 10.1%), social sciences (4,016 | 8.7%), and engineering (3,544 | 7.6%) are the most common fields of study among 46,330 individuals in Mount Pleasant who have obtained a bachelor's degree or higher.
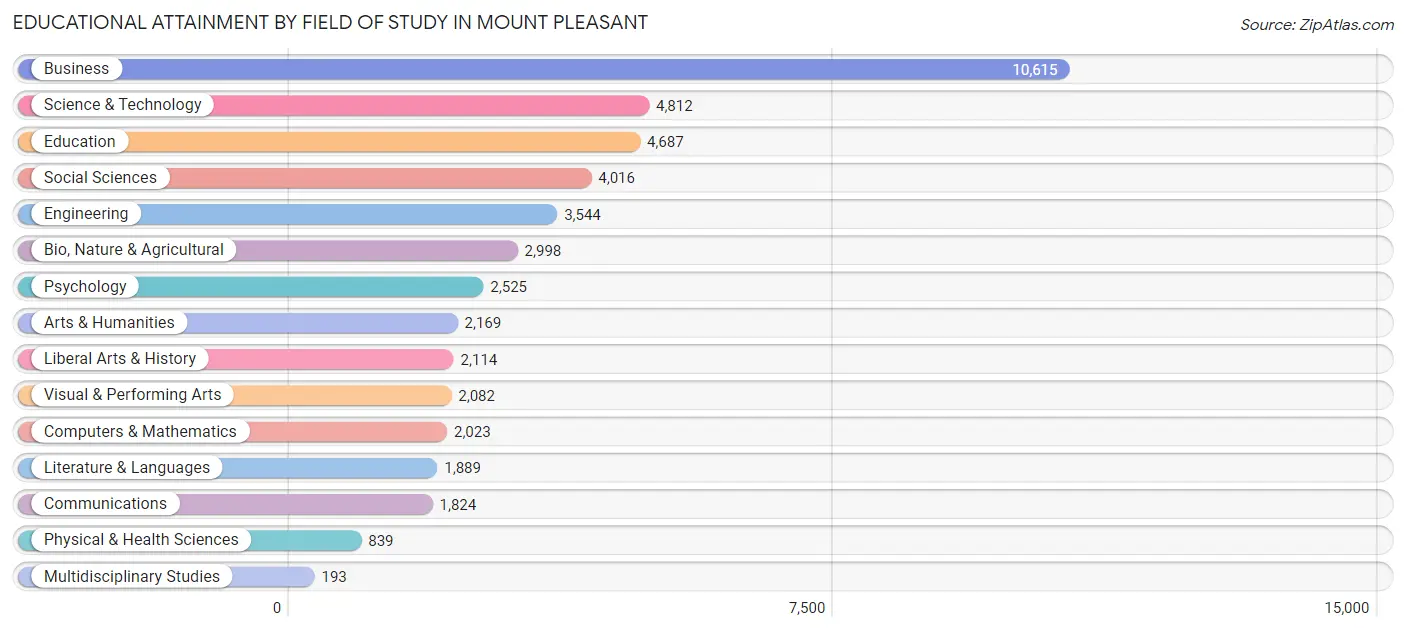
| Field of Study | # Graduates | % Graduates |
| Computers & Mathematics | 2,023 | 4.4% |
| Bio, Nature & Agricultural | 2,998 | 6.5% |
| Physical & Health Sciences | 839 | 1.8% |
| Psychology | 2,525 | 5.4% |
| Social Sciences | 4,016 | 8.7% |
| Engineering | 3,544 | 7.6% |
| Multidisciplinary Studies | 193 | 0.4% |
| Science & Technology | 4,812 | 10.4% |
| Business | 10,615 | 22.9% |
| Education | 4,687 | 10.1% |
| Literature & Languages | 1,889 | 4.1% |
| Liberal Arts & History | 2,114 | 4.6% |
| Visual & Performing Arts | 2,082 | 4.5% |
| Communications | 1,824 | 3.9% |
| Arts & Humanities | 2,169 | 4.7% |
| Total | 46,330 | 100.0% |
Transportation & Commute in Mount Pleasant
Vehicle Availability by Sex in Mount Pleasant
The most prevalent vehicle ownership categories in Mount Pleasant are males with 2 vehicles (13,736, accounting for 53.5%) and females with 2 vehicles (10,142, making up 65.0%).
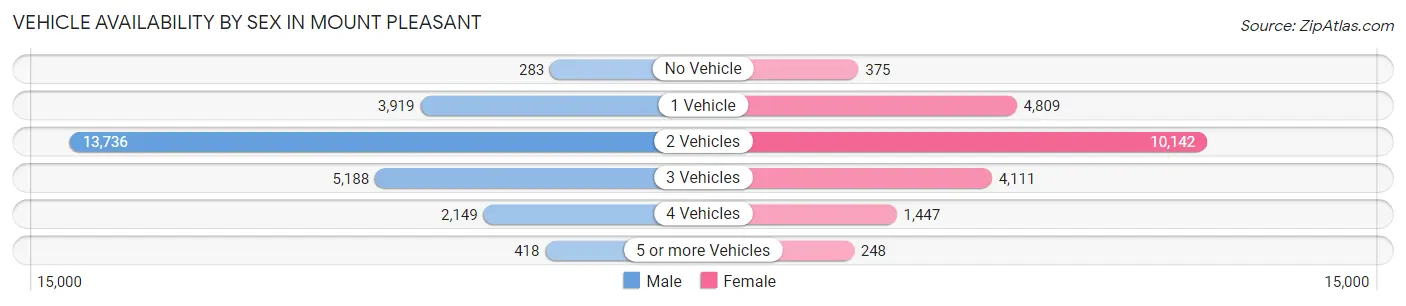
| Vehicles Available | Male | Female |
| No Vehicle | 283 (1.1%) | 375 (1.8%) |
| 1 Vehicle | 3,919 (15.2%) | 4,809 (22.8%) |
| 2 Vehicles | 13,736 (53.5%) | 10,142 (48.0%) |
| 3 Vehicles | 5,188 (20.2%) | 4,111 (19.5%) |
| 4 Vehicles | 2,149 (8.4%) | 1,447 (6.9%) |
| 5 or more Vehicles | 418 (1.6%) | 248 (1.2%) |
| Total | 25,693 (100.0%) | 21,132 (100.0%) |
Commute Time in Mount Pleasant
The most frequently occuring commute durations in Mount Pleasant are 20 to 24 minutes (6,820 commuters, 18.1%), 30 to 34 minutes (6,166 commuters, 16.4%), and 15 to 19 minutes (5,959 commuters, 15.9%).
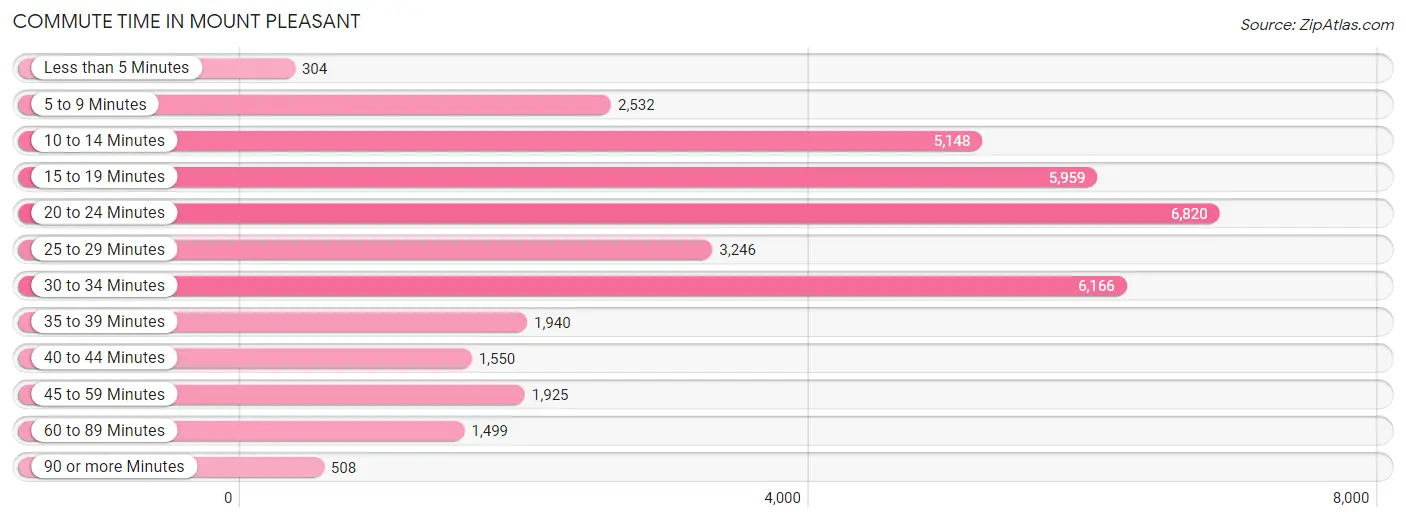
| Commute Time | # Commuters | % Commuters |
| Less than 5 Minutes | 304 | 0.8% |
| 5 to 9 Minutes | 2,532 | 6.7% |
| 10 to 14 Minutes | 5,148 | 13.7% |
| 15 to 19 Minutes | 5,959 | 15.9% |
| 20 to 24 Minutes | 6,820 | 18.1% |
| 25 to 29 Minutes | 3,246 | 8.6% |
| 30 to 34 Minutes | 6,166 | 16.4% |
| 35 to 39 Minutes | 1,940 | 5.2% |
| 40 to 44 Minutes | 1,550 | 4.1% |
| 45 to 59 Minutes | 1,925 | 5.1% |
| 60 to 89 Minutes | 1,499 | 4.0% |
| 90 or more Minutes | 508 | 1.3% |
Commute Time by Sex in Mount Pleasant
The most common commute times in Mount Pleasant are 20 to 24 minutes (4,121 commuters, 19.7%) for males and 15 to 19 minutes (3,120 commuters, 18.7%) for females.
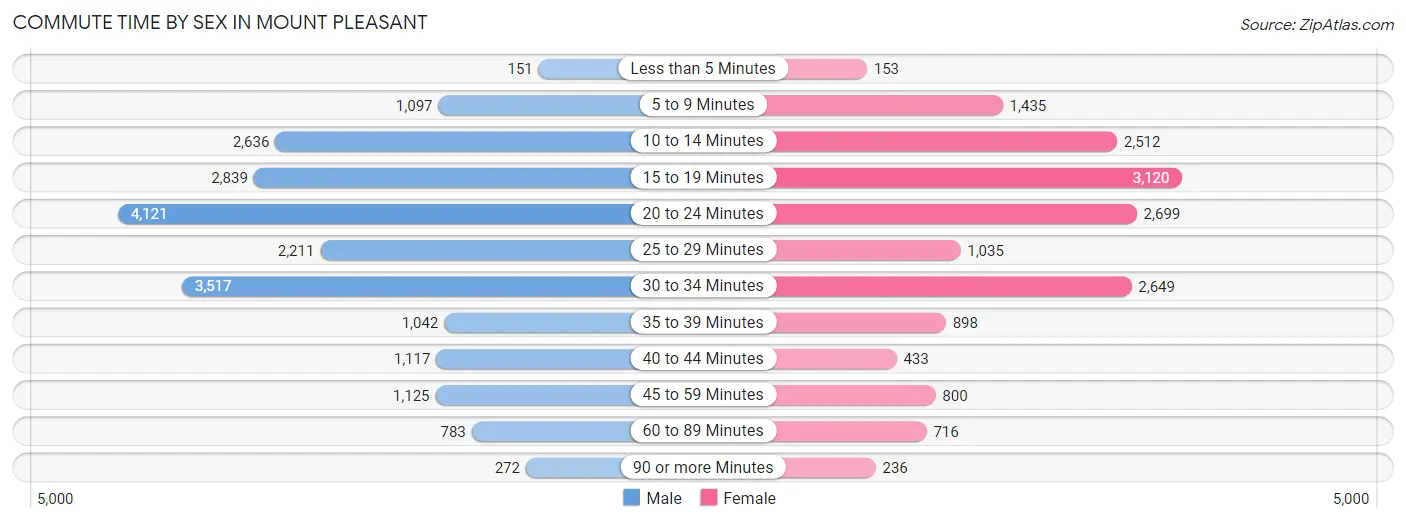
| Commute Time | Male | Female |
| Less than 5 Minutes | 151 (0.7%) | 153 (0.9%) |
| 5 to 9 Minutes | 1,097 (5.2%) | 1,435 (8.6%) |
| 10 to 14 Minutes | 2,636 (12.6%) | 2,512 (15.0%) |
| 15 to 19 Minutes | 2,839 (13.6%) | 3,120 (18.7%) |
| 20 to 24 Minutes | 4,121 (19.7%) | 2,699 (16.2%) |
| 25 to 29 Minutes | 2,211 (10.6%) | 1,035 (6.2%) |
| 30 to 34 Minutes | 3,517 (16.8%) | 2,649 (15.9%) |
| 35 to 39 Minutes | 1,042 (5.0%) | 898 (5.4%) |
| 40 to 44 Minutes | 1,117 (5.3%) | 433 (2.6%) |
| 45 to 59 Minutes | 1,125 (5.4%) | 800 (4.8%) |
| 60 to 89 Minutes | 783 (3.7%) | 716 (4.3%) |
| 90 or more Minutes | 272 (1.3%) | 236 (1.4%) |
Time of Departure to Work by Sex in Mount Pleasant
The most frequent times of departure to work in Mount Pleasant are 8:00 AM to 8:29 AM (3,761, 18.0%) for males and 7:30 AM to 7:59 AM (2,538, 15.2%) for females.
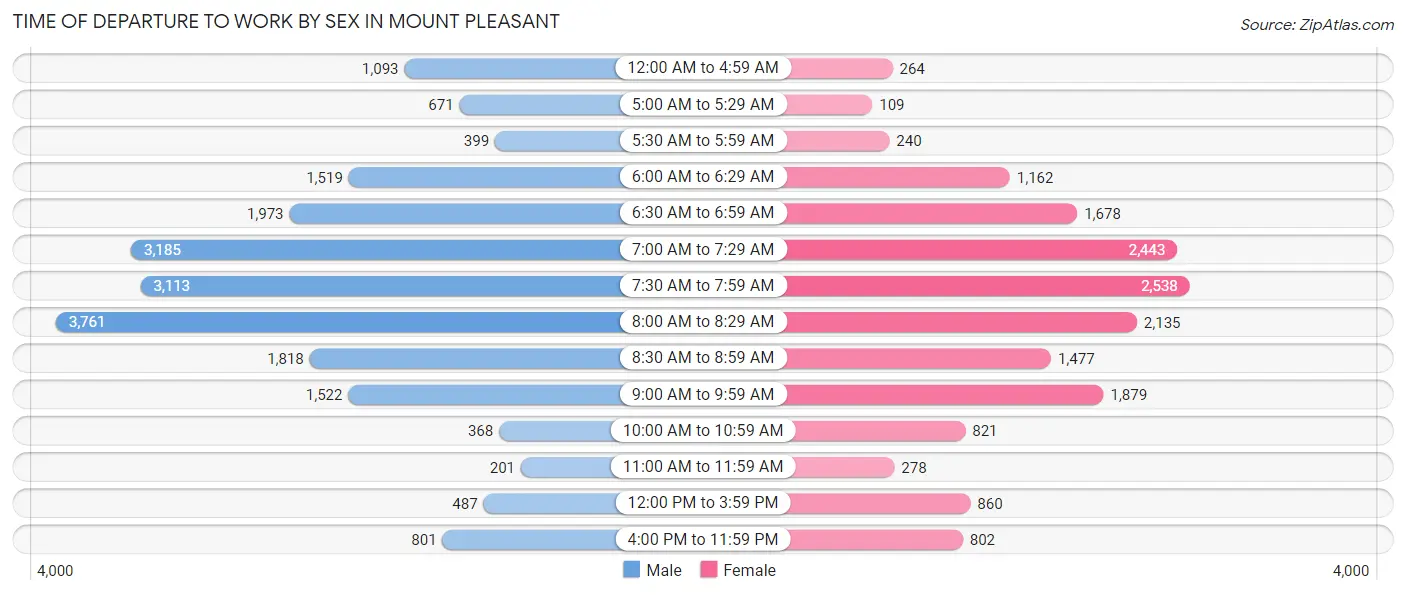
| Time of Departure | Male | Female |
| 12:00 AM to 4:59 AM | 1,093 (5.2%) | 264 (1.6%) |
| 5:00 AM to 5:29 AM | 671 (3.2%) | 109 (0.6%) |
| 5:30 AM to 5:59 AM | 399 (1.9%) | 240 (1.4%) |
| 6:00 AM to 6:29 AM | 1,519 (7.3%) | 1,162 (7.0%) |
| 6:30 AM to 6:59 AM | 1,973 (9.4%) | 1,678 (10.1%) |
| 7:00 AM to 7:29 AM | 3,185 (15.2%) | 2,443 (14.6%) |
| 7:30 AM to 7:59 AM | 3,113 (14.9%) | 2,538 (15.2%) |
| 8:00 AM to 8:29 AM | 3,761 (18.0%) | 2,135 (12.8%) |
| 8:30 AM to 8:59 AM | 1,818 (8.7%) | 1,477 (8.8%) |
| 9:00 AM to 9:59 AM | 1,522 (7.3%) | 1,879 (11.3%) |
| 10:00 AM to 10:59 AM | 368 (1.8%) | 821 (4.9%) |
| 11:00 AM to 11:59 AM | 201 (1.0%) | 278 (1.7%) |
| 12:00 PM to 3:59 PM | 487 (2.3%) | 860 (5.1%) |
| 4:00 PM to 11:59 PM | 801 (3.8%) | 802 (4.8%) |
| Total | 20,911 (100.0%) | 16,686 (100.0%) |
Housing Occupancy in Mount Pleasant
Occupancy by Ownership in Mount Pleasant
Of the total 38,149 dwellings in Mount Pleasant, owner-occupied units account for 27,652 (72.5%), while renter-occupied units make up 10,497 (27.5%).
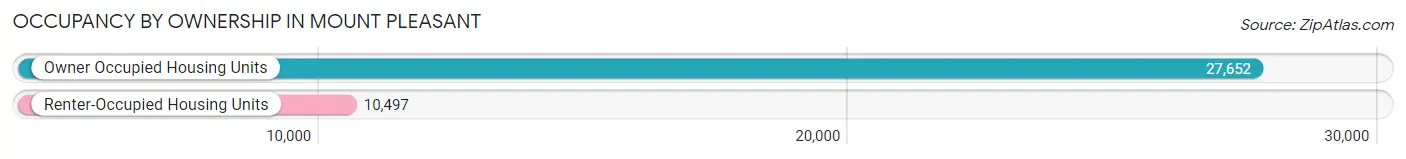
| Occupancy | # Housing Units | % Housing Units |
| Owner Occupied Housing Units | 27,652 | 72.5% |
| Renter-Occupied Housing Units | 10,497 | 27.5% |
| Total Occupied Housing Units | 38,149 | 100.0% |
Occupancy by Household Size in Mount Pleasant
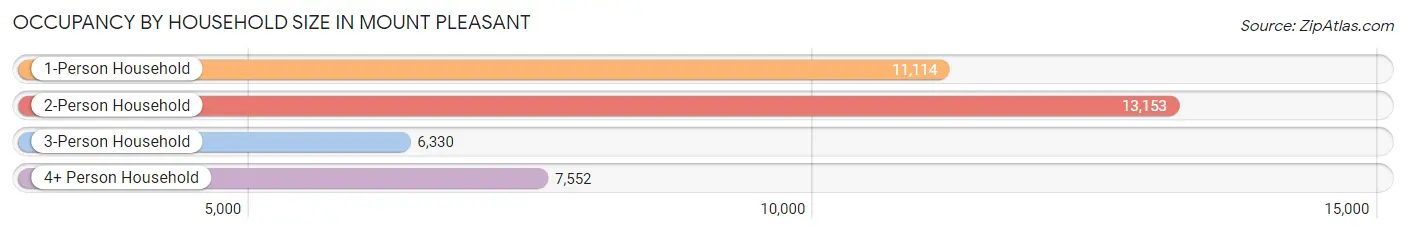
| Household Size | # Housing Units | % Housing Units |
| 1-Person Household | 11,114 | 29.1% |
| 2-Person Household | 13,153 | 34.5% |
| 3-Person Household | 6,330 | 16.6% |
| 4+ Person Household | 7,552 | 19.8% |
| Total Housing Units | 38,149 | 100.0% |
Occupancy by Ownership by Household Size in Mount Pleasant
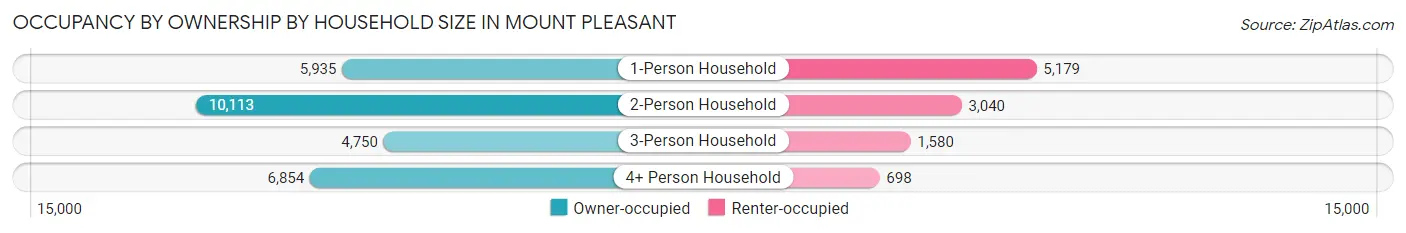
| Household Size | Owner-occupied | Renter-occupied |
| 1-Person Household | 5,935 (53.4%) | 5,179 (46.6%) |
| 2-Person Household | 10,113 (76.9%) | 3,040 (23.1%) |
| 3-Person Household | 4,750 (75.0%) | 1,580 (25.0%) |
| 4+ Person Household | 6,854 (90.8%) | 698 (9.2%) |
| Total Housing Units | 27,652 (72.5%) | 10,497 (27.5%) |
Occupancy by Educational Attainment in Mount Pleasant
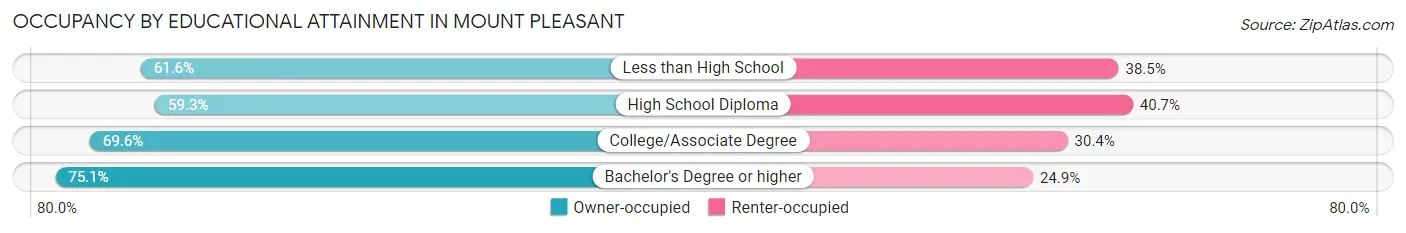
| Household Size | Owner-occupied | Renter-occupied |
| Less than High School | 517 (61.6%) | 323 (38.5%) |
| High School Diploma | 1,752 (59.3%) | 1,203 (40.7%) |
| College/Associate Degree | 5,417 (69.6%) | 2,362 (30.4%) |
| Bachelor's Degree or higher | 19,966 (75.1%) | 6,609 (24.9%) |
Occupancy by Age of Householder in Mount Pleasant
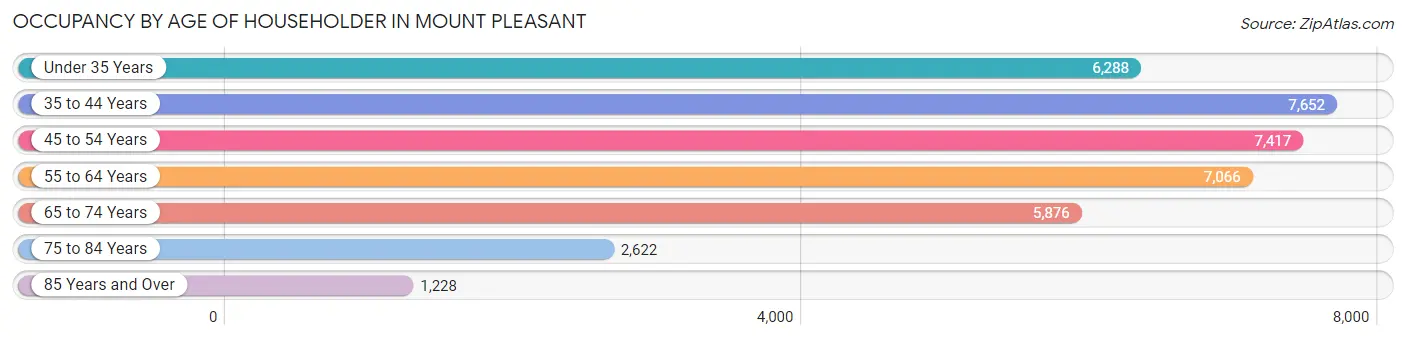
| Age Bracket | # Households | % Households |
| Under 35 Years | 6,288 | 16.5% |
| 35 to 44 Years | 7,652 | 20.1% |
| 45 to 54 Years | 7,417 | 19.4% |
| 55 to 64 Years | 7,066 | 18.5% |
| 65 to 74 Years | 5,876 | 15.4% |
| 75 to 84 Years | 2,622 | 6.9% |
| 85 Years and Over | 1,228 | 3.2% |
| Total | 38,149 | 100.0% |
Housing Finances in Mount Pleasant
Median Income by Occupancy in Mount Pleasant
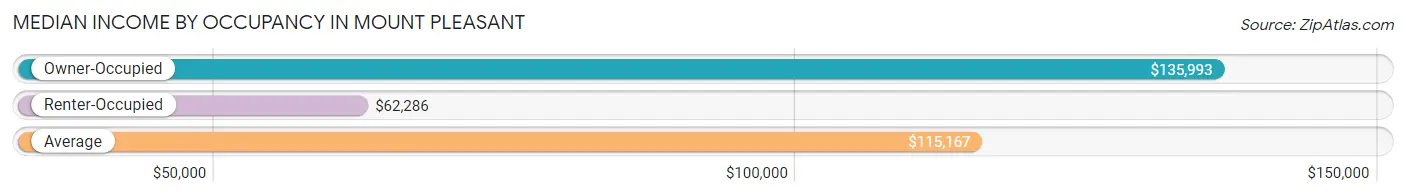
| Occupancy Type | # Households | Median Income |
| Owner-Occupied | 27,652 (72.5%) | $135,993 |
| Renter-Occupied | 10,497 (27.5%) | $62,286 |
| Average | 38,149 (100.0%) | $115,167 |
Occupancy by Householder Income Bracket in Mount Pleasant
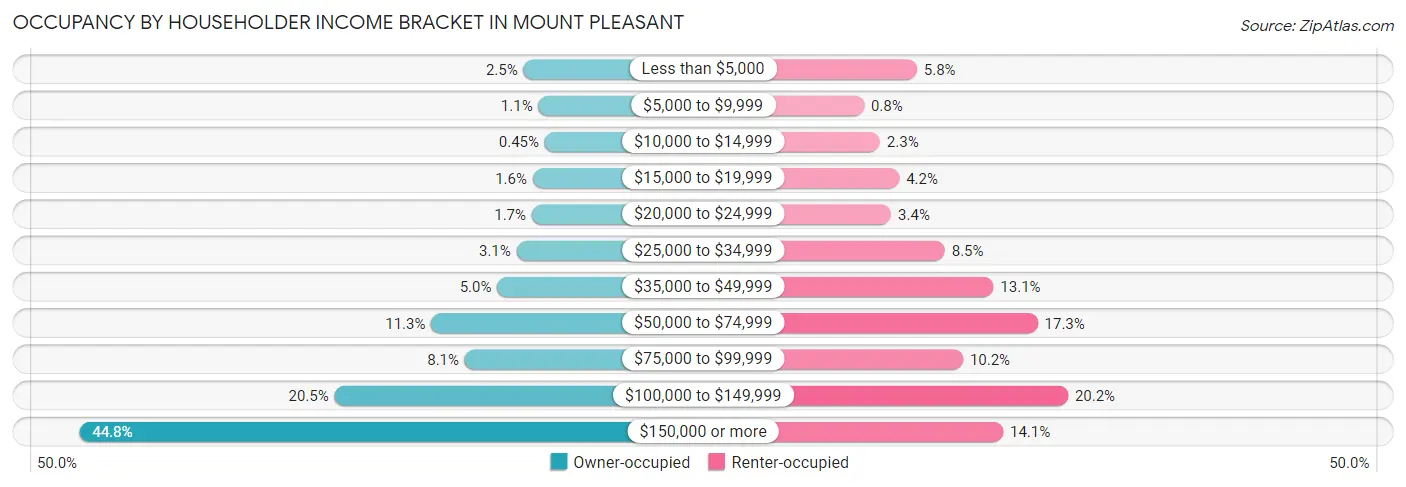
| Income Bracket | Owner-occupied | Renter-occupied |
| Less than $5,000 | 687 (2.5%) | 613 (5.8%) |
| $5,000 to $9,999 | 293 (1.1%) | 84 (0.8%) |
| $10,000 to $14,999 | 125 (0.4%) | 244 (2.3%) |
| $15,000 to $19,999 | 442 (1.6%) | 437 (4.2%) |
| $20,000 to $24,999 | 467 (1.7%) | 356 (3.4%) |
| $25,000 to $34,999 | 868 (3.1%) | 892 (8.5%) |
| $35,000 to $49,999 | 1,376 (5.0%) | 1,378 (13.1%) |
| $50,000 to $74,999 | 3,117 (11.3%) | 1,820 (17.3%) |
| $75,000 to $99,999 | 2,231 (8.1%) | 1,074 (10.2%) |
| $100,000 to $149,999 | 5,662 (20.5%) | 2,124 (20.2%) |
| $150,000 or more | 12,384 (44.8%) | 1,475 (14.1%) |
| Total | 27,652 (100.0%) | 10,497 (100.0%) |
Monthly Housing Cost Tiers in Mount Pleasant
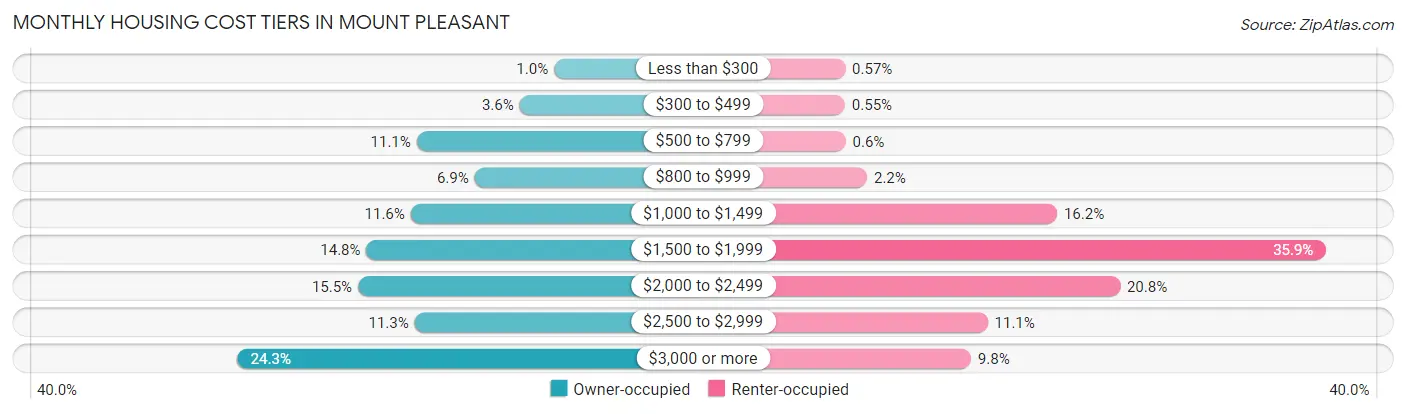
| Monthly Cost | Owner-occupied | Renter-occupied |
| Less than $300 | 279 (1.0%) | 60 (0.6%) |
| $300 to $499 | 983 (3.5%) | 58 (0.5%) |
| $500 to $799 | 3,079 (11.1%) | 63 (0.6%) |
| $800 to $999 | 1,898 (6.9%) | 229 (2.2%) |
| $1,000 to $1,499 | 3,199 (11.6%) | 1,697 (16.2%) |
| $1,500 to $1,999 | 4,102 (14.8%) | 3,770 (35.9%) |
| $2,000 to $2,499 | 4,273 (15.4%) | 2,184 (20.8%) |
| $2,500 to $2,999 | 3,118 (11.3%) | 1,161 (11.1%) |
| $3,000 or more | 6,721 (24.3%) | 1,032 (9.8%) |
| Total | 27,652 (100.0%) | 10,497 (100.0%) |
Physical Housing Characteristics in Mount Pleasant
Housing Structures in Mount Pleasant
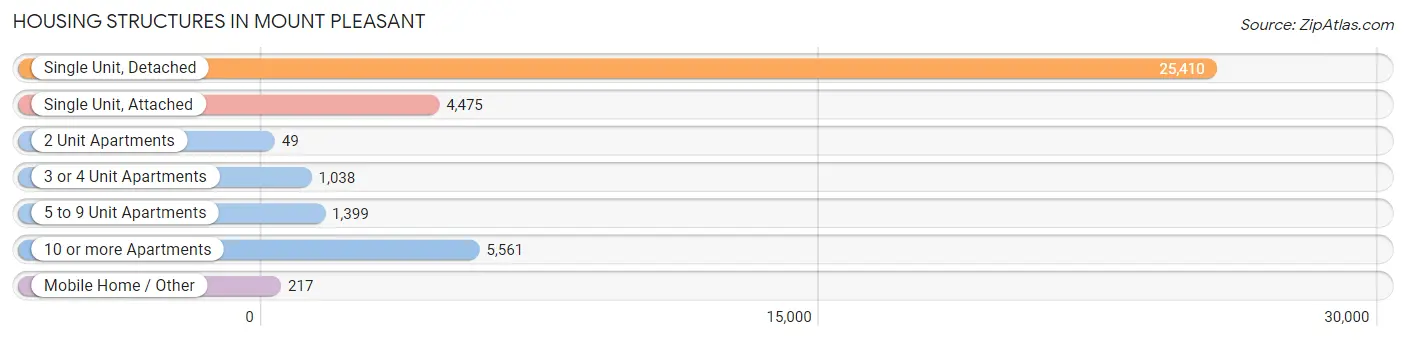
| Structure Type | # Housing Units | % Housing Units |
| Single Unit, Detached | 25,410 | 66.6% |
| Single Unit, Attached | 4,475 | 11.7% |
| 2 Unit Apartments | 49 | 0.1% |
| 3 or 4 Unit Apartments | 1,038 | 2.7% |
| 5 to 9 Unit Apartments | 1,399 | 3.7% |
| 10 or more Apartments | 5,561 | 14.6% |
| Mobile Home / Other | 217 | 0.6% |
| Total | 38,149 | 100.0% |
Housing Structures by Occupancy in Mount Pleasant
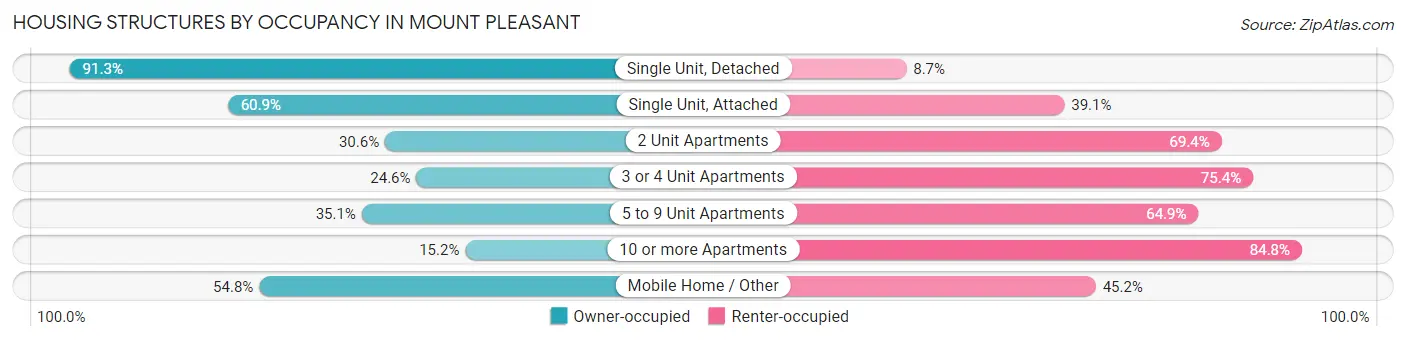
| Structure Type | Owner-occupied | Renter-occupied |
| Single Unit, Detached | 23,204 (91.3%) | 2,206 (8.7%) |
| Single Unit, Attached | 2,725 (60.9%) | 1,750 (39.1%) |
| 2 Unit Apartments | 15 (30.6%) | 34 (69.4%) |
| 3 or 4 Unit Apartments | 255 (24.6%) | 783 (75.4%) |
| 5 to 9 Unit Apartments | 491 (35.1%) | 908 (64.9%) |
| 10 or more Apartments | 843 (15.2%) | 4,718 (84.8%) |
| Mobile Home / Other | 119 (54.8%) | 98 (45.2%) |
| Total | 27,652 (72.5%) | 10,497 (27.5%) |
Housing Structures by Number of Rooms in Mount Pleasant
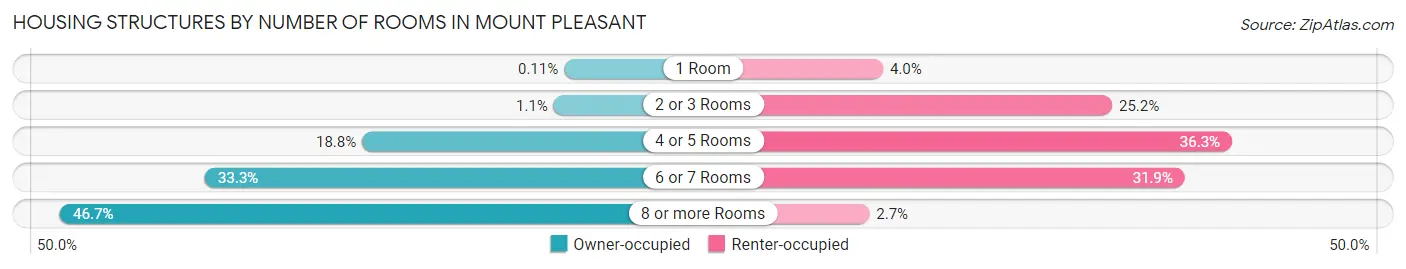
| Number of Rooms | Owner-occupied | Renter-occupied |
| 1 Room | 31 (0.1%) | 418 (4.0%) |
| 2 or 3 Rooms | 297 (1.1%) | 2,642 (25.2%) |
| 4 or 5 Rooms | 5,195 (18.8%) | 3,805 (36.2%) |
| 6 or 7 Rooms | 9,213 (33.3%) | 3,347 (31.9%) |
| 8 or more Rooms | 12,916 (46.7%) | 285 (2.7%) |
| Total | 27,652 (100.0%) | 10,497 (100.0%) |
Housing Structure by Heating Type in Mount Pleasant
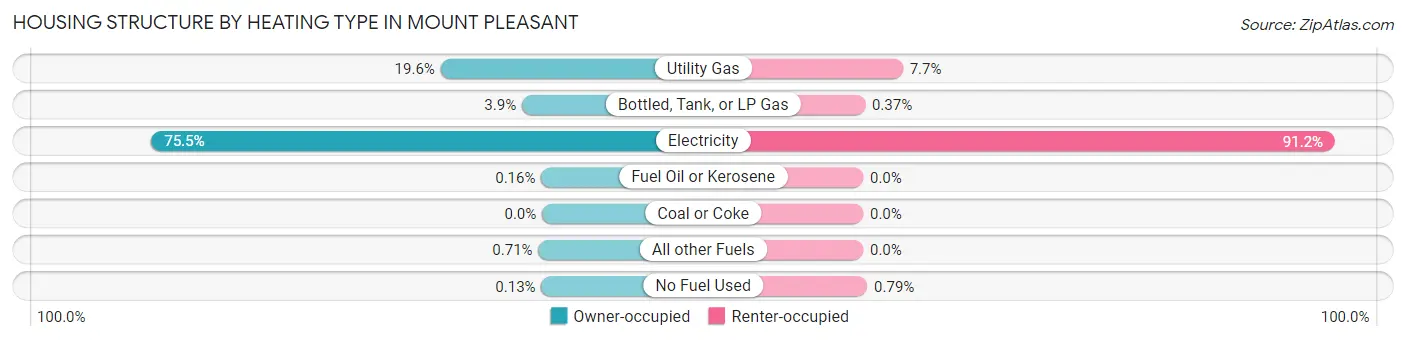
| Heating Type | Owner-occupied | Renter-occupied |
| Utility Gas | 5,419 (19.6%) | 805 (7.7%) |
| Bottled, Tank, or LP Gas | 1,077 (3.9%) | 39 (0.4%) |
| Electricity | 20,881 (75.5%) | 9,570 (91.2%) |
| Fuel Oil or Kerosene | 45 (0.2%) | 0 (0.0%) |
| Coal or Coke | 0 (0.0%) | 0 (0.0%) |
| All other Fuels | 195 (0.7%) | 0 (0.0%) |
| No Fuel Used | 35 (0.1%) | 83 (0.8%) |
| Total | 27,652 (100.0%) | 10,497 (100.0%) |
Household Vehicle Usage in Mount Pleasant
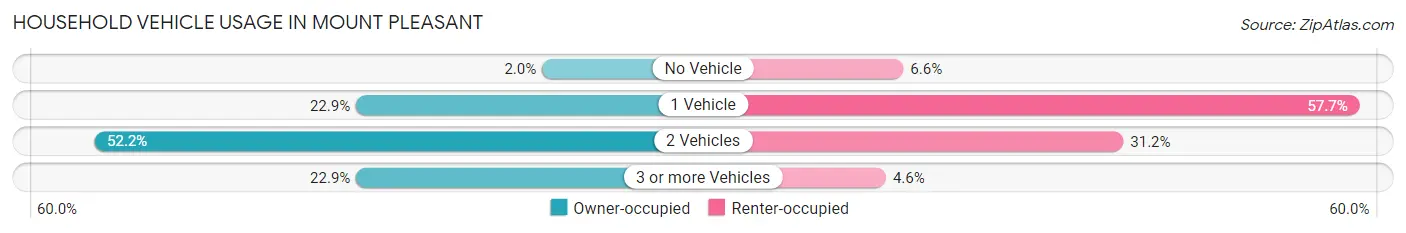
| Vehicles per Household | Owner-occupied | Renter-occupied |
| No Vehicle | 563 (2.0%) | 688 (6.6%) |
| 1 Vehicle | 6,326 (22.9%) | 6,052 (57.7%) |
| 2 Vehicles | 14,442 (52.2%) | 3,274 (31.2%) |
| 3 or more Vehicles | 6,321 (22.9%) | 483 (4.6%) |
| Total | 27,652 (100.0%) | 10,497 (100.0%) |
Real Estate & Mortgages in Mount Pleasant
Real Estate and Mortgage Overview in Mount Pleasant
| Characteristic | Without Mortgage | With Mortgage |
| Housing Units | 7,187 | 20,465 |
| Median Property Value | $601,100 | $610,500 |
| Median Household Income | $92,835 | $10,282 |
| Monthly Housing Costs | $709 | $6,721 |
| Real Estate Taxes | $1,986 | $135 |
Property Value by Mortgage Status in Mount Pleasant
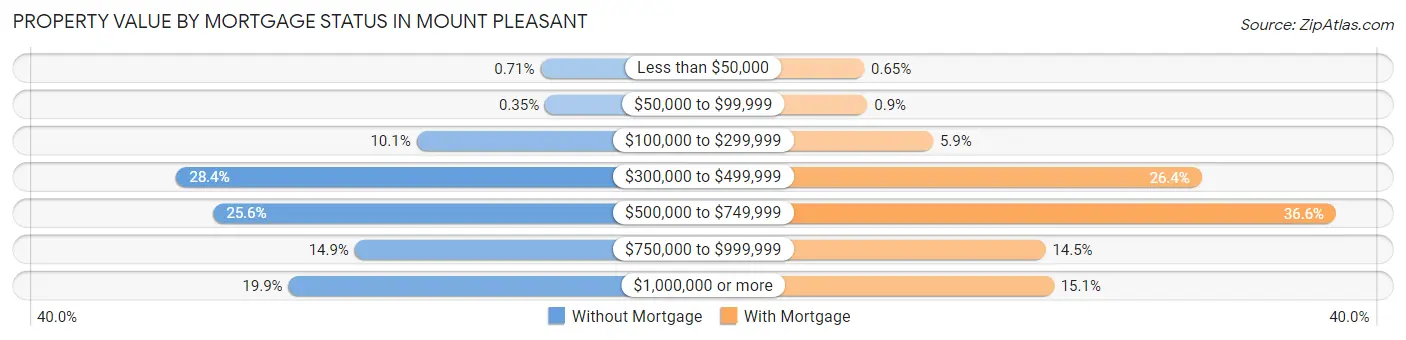
| Property Value | Without Mortgage | With Mortgage |
| Less than $50,000 | 51 (0.7%) | 132 (0.6%) |
| $50,000 to $99,999 | 25 (0.4%) | 185 (0.9%) |
| $100,000 to $299,999 | 729 (10.1%) | 1,208 (5.9%) |
| $300,000 to $499,999 | 2,044 (28.4%) | 5,397 (26.4%) |
| $500,000 to $749,999 | 1,841 (25.6%) | 7,491 (36.6%) |
| $750,000 to $999,999 | 1,067 (14.8%) | 2,961 (14.5%) |
| $1,000,000 or more | 1,430 (19.9%) | 3,091 (15.1%) |
| Total | 7,187 (100.0%) | 20,465 (100.0%) |
Household Income by Mortgage Status in Mount Pleasant
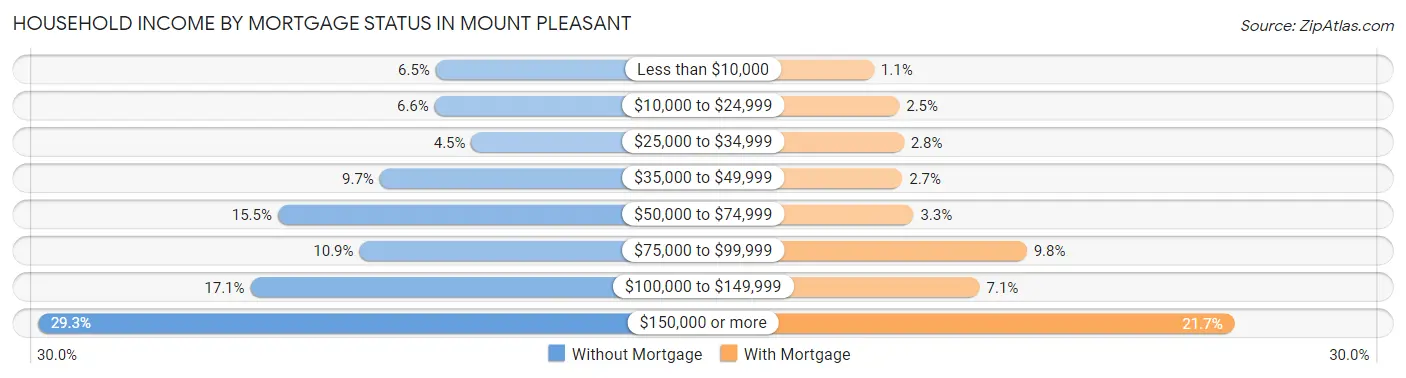
| Household Income | Without Mortgage | With Mortgage |
| Less than $10,000 | 468 (6.5%) | 215 (1.1%) |
| $10,000 to $24,999 | 472 (6.6%) | 512 (2.5%) |
| $25,000 to $34,999 | 321 (4.5%) | 562 (2.8%) |
| $35,000 to $49,999 | 698 (9.7%) | 547 (2.7%) |
| $50,000 to $74,999 | 1,116 (15.5%) | 678 (3.3%) |
| $75,000 to $99,999 | 781 (10.9%) | 2,001 (9.8%) |
| $100,000 to $149,999 | 1,229 (17.1%) | 1,450 (7.1%) |
| $150,000 or more | 2,102 (29.2%) | 4,433 (21.7%) |
| Total | 7,187 (100.0%) | 20,465 (100.0%) |
Property Value to Household Income Ratio in Mount Pleasant
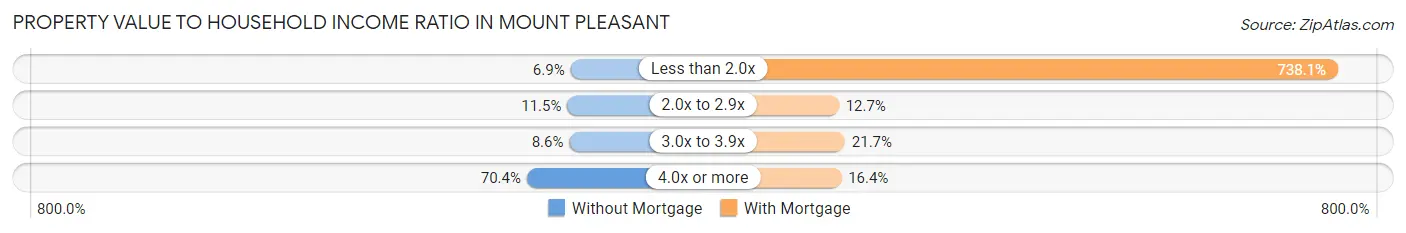
| Value-to-Income Ratio | Without Mortgage | With Mortgage |
| Less than 2.0x | 494 (6.9%) | 151,049 (738.1%) |
| 2.0x to 2.9x | 826 (11.5%) | 2,606 (12.7%) |
| 3.0x to 3.9x | 621 (8.6%) | 4,441 (21.7%) |
| 4.0x or more | 5,058 (70.4%) | 3,350 (16.4%) |
| Total | 7,187 (100.0%) | 20,465 (100.0%) |
Real Estate Taxes by Mortgage Status in Mount Pleasant
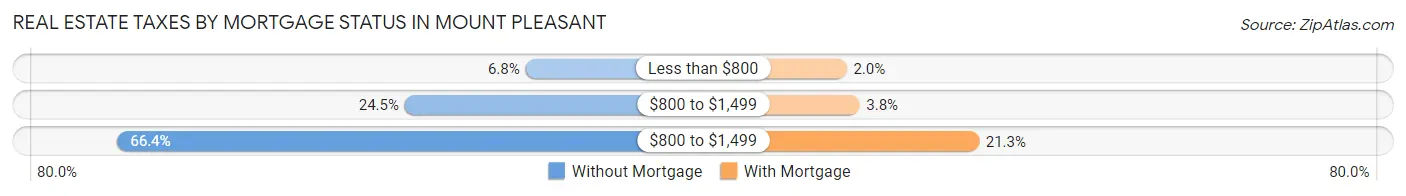
| Property Taxes | Without Mortgage | With Mortgage |
| Less than $800 | 489 (6.8%) | 402 (2.0%) |
| $800 to $1,499 | 1,757 (24.4%) | 785 (3.8%) |
| $800 to $1,499 | 4,775 (66.4%) | 4,359 (21.3%) |
| Total | 7,187 (100.0%) | 20,465 (100.0%) |
Health & Disability in Mount Pleasant
Health Insurance Coverage by Age in Mount Pleasant
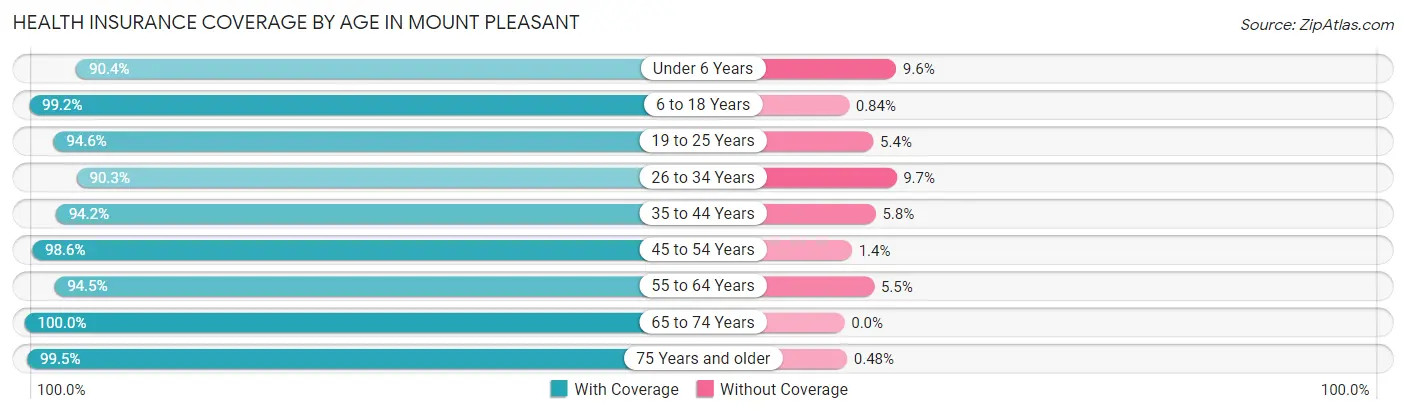
| Age Bracket | With Coverage | Without Coverage |
| Under 6 Years | 5,456 (90.4%) | 581 (9.6%) |
| 6 to 18 Years | 14,942 (99.2%) | 126 (0.8%) |
| 19 to 25 Years | 3,885 (94.6%) | 221 (5.4%) |
| 26 to 34 Years | 9,367 (90.3%) | 1,004 (9.7%) |
| 35 to 44 Years | 13,009 (94.2%) | 802 (5.8%) |
| 45 to 54 Years | 13,092 (98.6%) | 185 (1.4%) |
| 55 to 64 Years | 11,392 (94.5%) | 667 (5.5%) |
| 65 to 74 Years | 9,542 (100.0%) | 0 (0.0%) |
| 75 Years and older | 5,983 (99.5%) | 29 (0.5%) |
| Total | 86,668 (96.0%) | 3,615 (4.0%) |
Health Insurance Coverage by Citizenship Status in Mount Pleasant
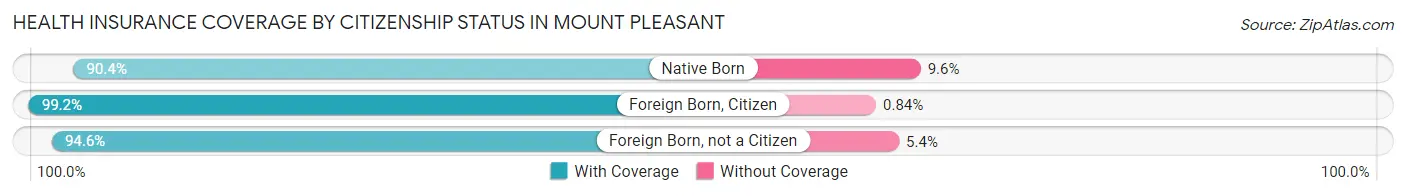
| Citizenship Status | With Coverage | Without Coverage |
| Native Born | 5,456 (90.4%) | 581 (9.6%) |
| Foreign Born, Citizen | 14,942 (99.2%) | 126 (0.8%) |
| Foreign Born, not a Citizen | 3,885 (94.6%) | 221 (5.4%) |
Health Insurance Coverage by Household Income in Mount Pleasant
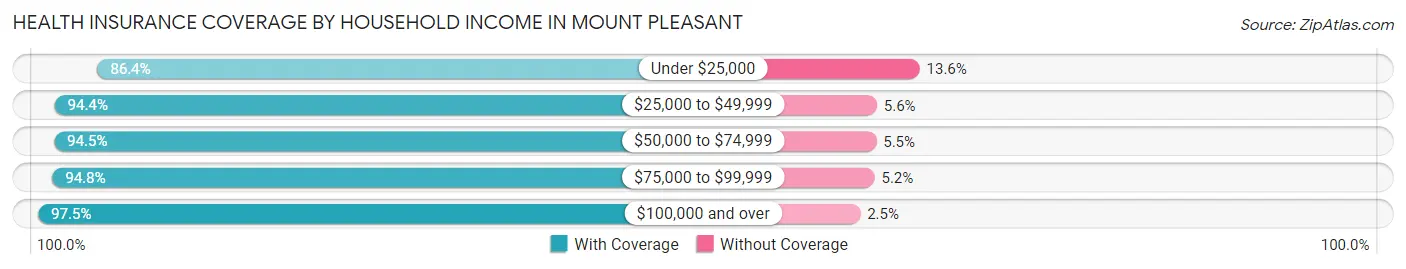
| Household Income | With Coverage | Without Coverage |
| Under $25,000 | 5,066 (86.4%) | 800 (13.6%) |
| $25,000 to $49,999 | 6,778 (94.4%) | 404 (5.6%) |
| $50,000 to $74,999 | 8,817 (94.5%) | 515 (5.5%) |
| $75,000 to $99,999 | 6,124 (94.8%) | 336 (5.2%) |
| $100,000 and over | 59,679 (97.5%) | 1,545 (2.5%) |
Public vs Private Health Insurance Coverage by Age in Mount Pleasant
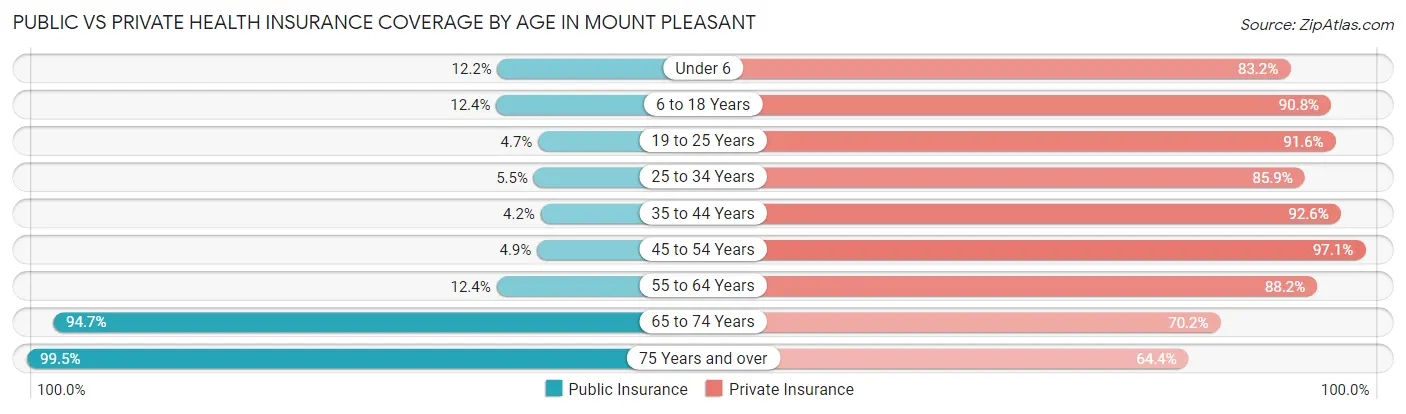
| Age Bracket | Public Insurance | Private Insurance |
| Under 6 | 736 (12.2%) | 5,022 (83.2%) |
| 6 to 18 Years | 1,875 (12.4%) | 13,678 (90.8%) |
| 19 to 25 Years | 192 (4.7%) | 3,762 (91.6%) |
| 25 to 34 Years | 569 (5.5%) | 8,909 (85.9%) |
| 35 to 44 Years | 581 (4.2%) | 12,786 (92.6%) |
| 45 to 54 Years | 646 (4.9%) | 12,893 (97.1%) |
| 55 to 64 Years | 1,495 (12.4%) | 10,638 (88.2%) |
| 65 to 74 Years | 9,036 (94.7%) | 6,702 (70.2%) |
| 75 Years and over | 5,983 (99.5%) | 3,870 (64.4%) |
| Total | 21,113 (23.4%) | 78,260 (86.7%) |
Disability Status by Sex by Age in Mount Pleasant
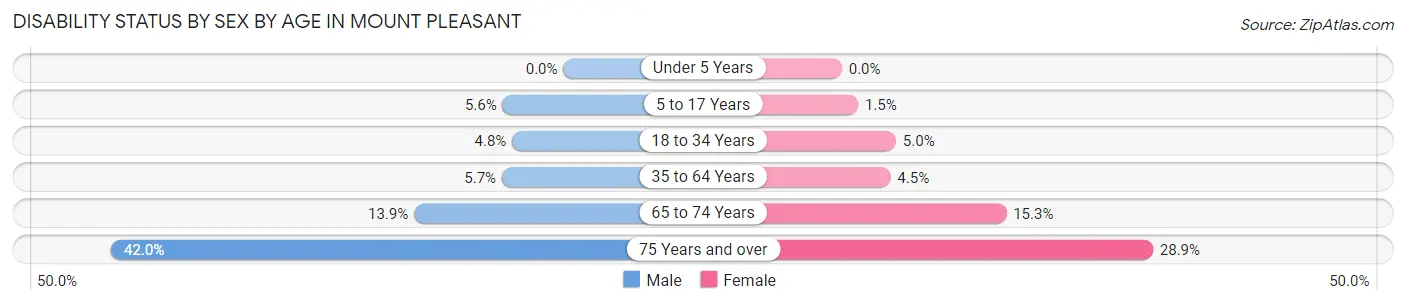
| Age Bracket | Male | Female |
| Under 5 Years | 0 (0.0%) | 0 (0.0%) |
| 5 to 17 Years | 441 (5.6%) | 114 (1.5%) |
| 18 to 34 Years | 355 (4.8%) | 382 (5.0%) |
| 35 to 64 Years | 1,092 (5.7%) | 901 (4.5%) |
| 65 to 74 Years | 628 (13.9%) | 764 (15.3%) |
| 75 Years and over | 1,118 (42.0%) | 967 (28.9%) |
Disability Class by Sex by Age in Mount Pleasant
Disability Class: Hearing Difficulty
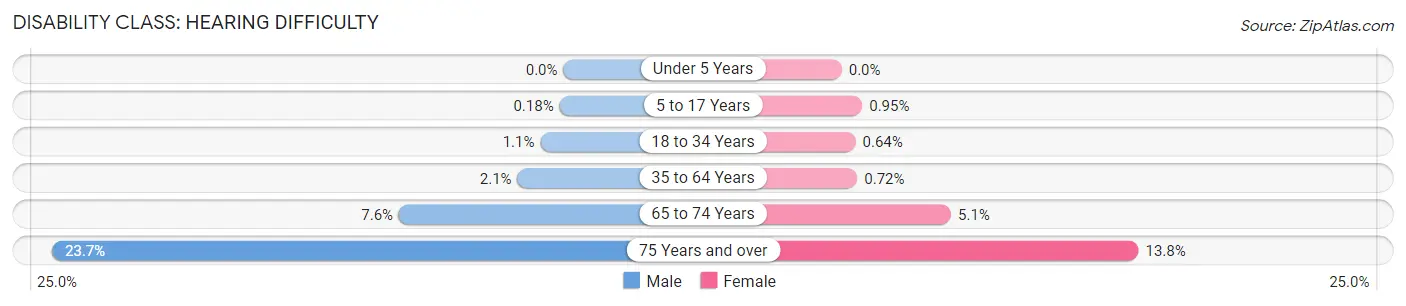
| Age Bracket | Male | Female |
| Under 5 Years | 0 (0.0%) | 0 (0.0%) |
| 5 to 17 Years | 14 (0.2%) | 72 (0.9%) |
| 18 to 34 Years | 80 (1.1%) | 49 (0.6%) |
| 35 to 64 Years | 409 (2.1%) | 144 (0.7%) |
| 65 to 74 Years | 346 (7.6%) | 254 (5.1%) |
| 75 Years and over | 632 (23.7%) | 461 (13.8%) |
Disability Class: Vision Difficulty
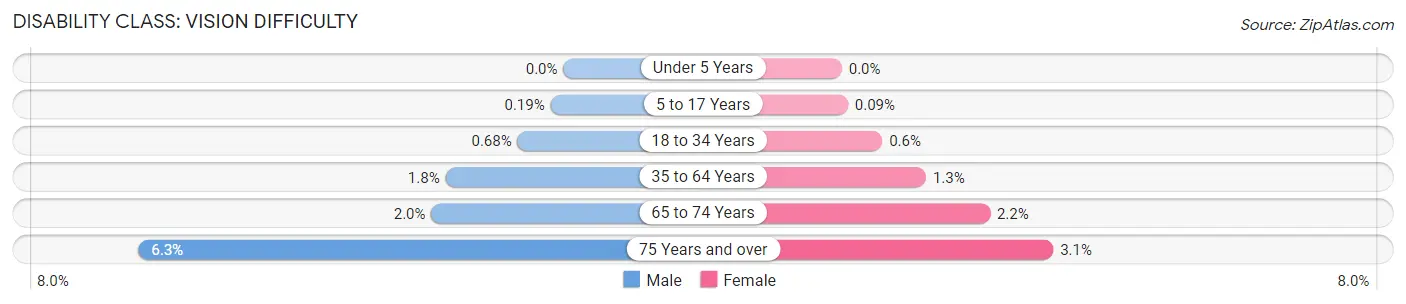
| Age Bracket | Male | Female |
| Under 5 Years | 0 (0.0%) | 0 (0.0%) |
| 5 to 17 Years | 15 (0.2%) | 7 (0.1%) |
| 18 to 34 Years | 51 (0.7%) | 46 (0.6%) |
| 35 to 64 Years | 336 (1.8%) | 249 (1.3%) |
| 65 to 74 Years | 89 (2.0%) | 110 (2.2%) |
| 75 Years and over | 168 (6.3%) | 105 (3.1%) |
Disability Class: Cognitive Difficulty
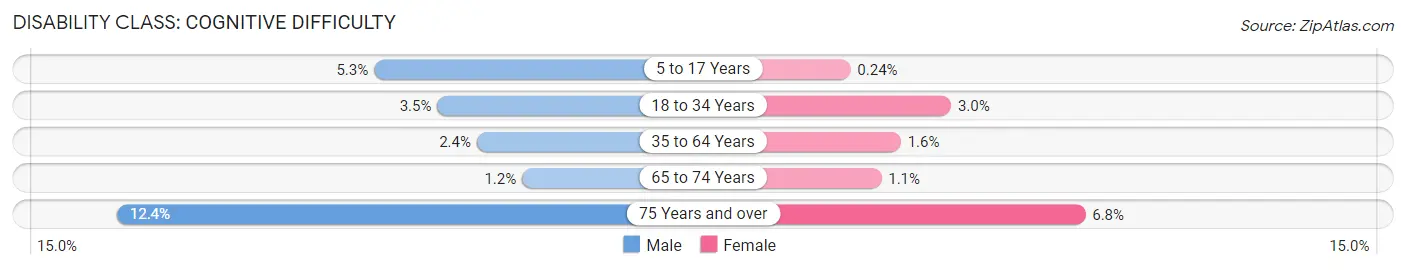
| Age Bracket | Male | Female |
| 5 to 17 Years | 412 (5.3%) | 18 (0.2%) |
| 18 to 34 Years | 262 (3.5%) | 231 (3.0%) |
| 35 to 64 Years | 462 (2.4%) | 328 (1.6%) |
| 65 to 74 Years | 52 (1.1%) | 55 (1.1%) |
| 75 Years and over | 331 (12.4%) | 227 (6.8%) |
Disability Class: Ambulatory Difficulty
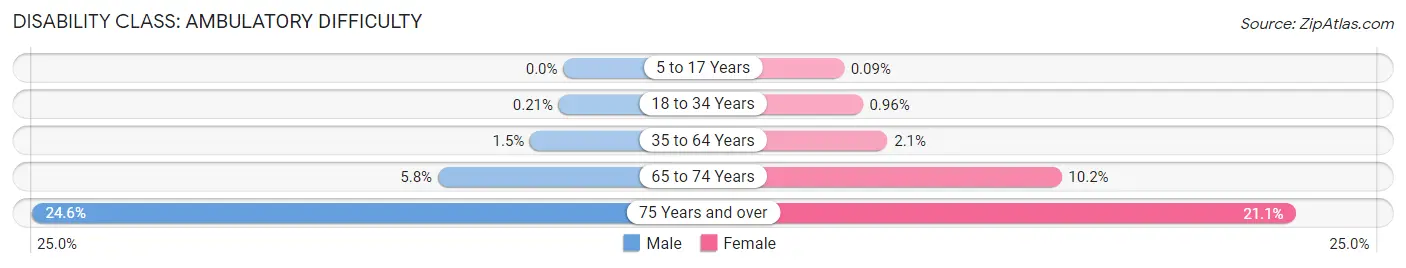
| Age Bracket | Male | Female |
| 5 to 17 Years | 0 (0.0%) | 7 (0.1%) |
| 18 to 34 Years | 16 (0.2%) | 73 (1.0%) |
| 35 to 64 Years | 295 (1.5%) | 422 (2.1%) |
| 65 to 74 Years | 264 (5.8%) | 510 (10.2%) |
| 75 Years and over | 656 (24.6%) | 705 (21.0%) |
Disability Class: Self-Care Difficulty
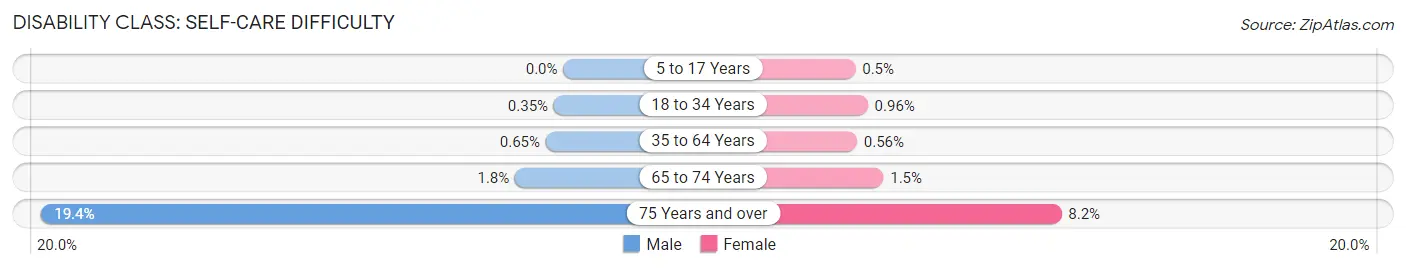
| Age Bracket | Male | Female |
| 5 to 17 Years | 0 (0.0%) | 38 (0.5%) |
| 18 to 34 Years | 26 (0.4%) | 73 (1.0%) |
| 35 to 64 Years | 124 (0.6%) | 111 (0.6%) |
| 65 to 74 Years | 81 (1.8%) | 77 (1.5%) |
| 75 Years and over | 516 (19.4%) | 273 (8.2%) |
Technology Access in Mount Pleasant
Computing Device Access in Mount Pleasant
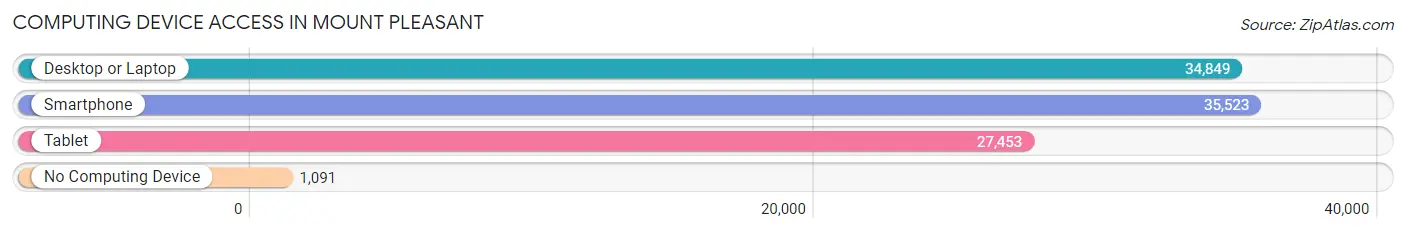
| Device Type | # Households | % Households |
| Desktop or Laptop | 34,849 | 91.3% |
| Smartphone | 35,523 | 93.1% |
| Tablet | 27,453 | 72.0% |
| No Computing Device | 1,091 | 2.9% |
| Total | 38,149 | 100.0% |
Internet Access in Mount Pleasant
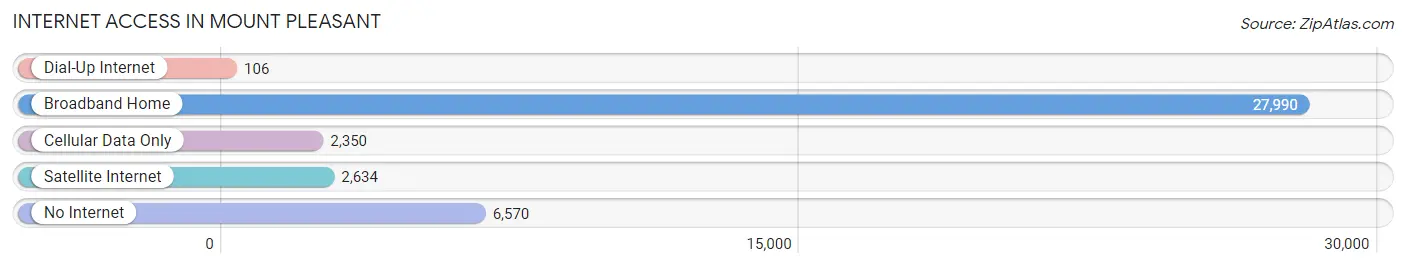
| Internet Type | # Households | % Households |
| Dial-Up Internet | 106 | 0.3% |
| Broadband Home | 27,990 | 73.4% |
| Cellular Data Only | 2,350 | 6.2% |
| Satellite Internet | 2,634 | 6.9% |
| No Internet | 6,570 | 17.2% |
| Total | 38,149 | 100.0% |
Mount Pleasant Summary
Introduction
Mount Pleasant is a town located in Charleston County, South Carolina. It is situated on the Cooper River, just across from Charleston. The town is known for its historic sites, beautiful beaches, and vibrant culture. It is a popular tourist destination and has been named one of the best places to live in the United States.
History
Mount Pleasant was first settled in 1680 by English settlers. The town was originally known as Christ Church Parish, and was part of the Province of Carolina. The town was incorporated in 1837 and was named after the nearby Mount Pleasant Plantation. The plantation was owned by the Drayton family, who were prominent in the area.
The town grew rapidly in the 19th century, and by the early 20th century, it had become a popular tourist destination. The town was also home to several military bases during World War II. After the war, the town continued to grow and develop, and by the late 20th century, it had become a popular suburb of Charleston.
Geography
Mount Pleasant is located in Charleston County, South Carolina. It is situated on the Cooper River, just across from Charleston. The town is bordered by the Wando River to the north, Sullivan’s Island to the east, and the Atlantic Ocean to the south. The town covers an area of approximately 24 square miles, and has a population of over 80,000 people.
The town is located in a humid subtropical climate zone, and experiences hot, humid summers and mild winters. The average annual temperature is around 70 degrees Fahrenheit, and the average annual precipitation is around 50 inches.
Economy
Mount Pleasant’s economy is largely based on tourism, retail, and services. The town is home to several large employers, including Boeing, Blackbaud, and Benefitfocus. The town is also home to several large shopping centers, including the Mount Pleasant Towne Centre and the Belle Hall Shopping Center.
The town is also home to several large medical facilities, including the Medical University of South Carolina and the Roper St. Francis Healthcare System. The town is also home to several large educational institutions, including the College of Charleston and the Charleston School of Law.
Demographics
As of the 2010 census, the population of Mount Pleasant was 67,843. The racial makeup of the town was 79.3% White, 14.2% African American, 0.3% Native American, 2.2% Asian, 0.1% Pacific Islander, 1.7% from other races, and 2.4% from two or more races. The median household income was $68,945, and the median family income was $77,845.
Conclusion
Mount Pleasant is a town located in Charleston County, South Carolina. It is situated on the Cooper River, just across from Charleston. The town is known for its historic sites, beautiful beaches, and vibrant culture. It is a popular tourist destination and has been named one of the best places to live in the United States. The town’s economy is largely based on tourism, retail, and services, and it is home to several large employers, shopping centers, medical facilities, and educational institutions. As of the 2010 census, the population of Mount Pleasant was 67,843, and the median household income was $68,945.
Common Questions
What is Per Capita Income in Mount Pleasant?
Per Capita income in Mount Pleasant is $65,559.
What is the Median Family Income in Mount Pleasant?
Median Family Income in Mount Pleasant is $145,770.
What is the Median Household income in Mount Pleasant?
Median Household Income in Mount Pleasant is $115,167.
What is Income or Wage Gap in Mount Pleasant?
Income or Wage Gap in Mount Pleasant is 34.2%.
Women in Mount Pleasant earn 65.8 cents for every dollar earned by a man.
What is Family Income Deficit in Mount Pleasant?
Family Income Deficit in Mount Pleasant is $13,461.
Families that are below poverty line in Mount Pleasant earn $13,461 less on average than the poverty threshold level.
What is Inequality or Gini Index in Mount Pleasant?
Inequality or Gini Index in Mount Pleasant is 0.47.
What is the Total Population of Mount Pleasant?
Total Population of Mount Pleasant is 90,945.
What is the Total Male Population of Mount Pleasant?
Total Male Population of Mount Pleasant is 44,812.
What is the Total Female Population of Mount Pleasant?
Total Female Population of Mount Pleasant is 46,133.
What is the Ratio of Males per 100 Females in Mount Pleasant?
There are 97.14 Males per 100 Females in Mount Pleasant.
What is the Ratio of Females per 100 Males in Mount Pleasant?
There are 102.95 Females per 100 Males in Mount Pleasant.
What is the Median Population Age in Mount Pleasant?
Median Population Age in Mount Pleasant is 42.4 Years.
What is the Average Family Size in Mount Pleasant
Average Family Size in Mount Pleasant is 3.0 People.
What is the Average Household Size in Mount Pleasant
Average Household Size in Mount Pleasant is 2.4 People.
How Large is the Labor Force in Mount Pleasant?
There are 49,153 People in the Labor Forcein in Mount Pleasant.
What is the Percentage of People in the Labor Force in Mount Pleasant?
67.2% of People are in the Labor Force in Mount Pleasant.
What is the Unemployment Rate in Mount Pleasant?
Unemployment Rate in Mount Pleasant is 3.2%.