Missouri City, TX Map & Demographics
Missouri City Map
Missouri City Overview
$41,033
PER CAPITA INCOME
$106,195
AVG FAMILY INCOME
$97,211
AVG HOUSEHOLD INCOME
27.6%
WAGE / INCOME GAP [ % ]
72.4¢/ $1
WAGE / INCOME GAP [ $ ]
$11,962
FAMILY INCOME DEFICIT
0.38
INEQUALITY / GINI INDEX
74,517
TOTAL POPULATION
35,708
MALE POPULATION
38,809
FEMALE POPULATION
92.01
MALES / 100 FEMALES
108.68
FEMALES / 100 MALES
40.2
MEDIAN AGE
3.2
AVG FAMILY SIZE
2.8
AVG HOUSEHOLD SIZE
39,912
LABOR FORCE [ PEOPLE ]
65.8%
PERCENT IN LABOR FORCE
5.7%
UNEMPLOYMENT RATE
Income in Missouri City
Income Overview in Missouri City
Per Capita Income in Missouri City is $41,033, while median incomes of families and households are $106,195 and $97,211 respectively.
| Characteristic | Number | Measure |
| Per Capita Income | 74,517 | $41,033 |
| Median Family Income | 20,390 | $106,195 |
| Mean Family Income | 20,390 | $122,838 |
| Median Household Income | 26,072 | $97,211 |
| Mean Household Income | 26,072 | $115,639 |
| Income Deficit | 20,390 | $11,962 |
| Wage / Income Gap (%) | 74,517 | 27.61% |
| Wage / Income Gap ($) | 74,517 | 72.39¢ per $1 |
| Gini / Inequality Index | 74,517 | 0.38 |
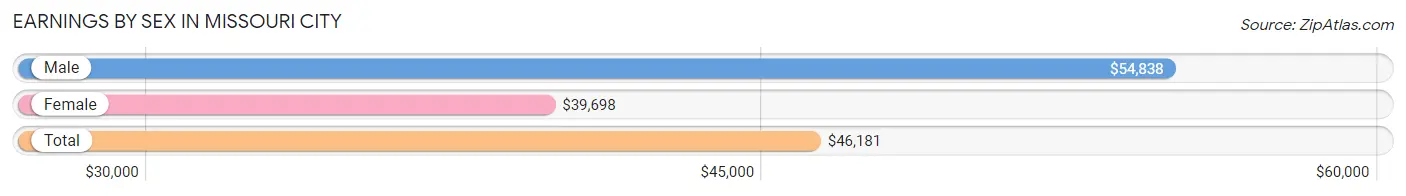
Earnings by Sex in Missouri City
Average Earnings in Missouri City are $46,181, $54,838 for men and $39,698 for women, a difference of 27.6%.
| Sex | Number | Average Earnings |
| Male | 20,932 (50.3%) | $54,838 |
| Female | 20,670 (49.7%) | $39,698 |
| Total | 41,602 (100.0%) | $46,181 |
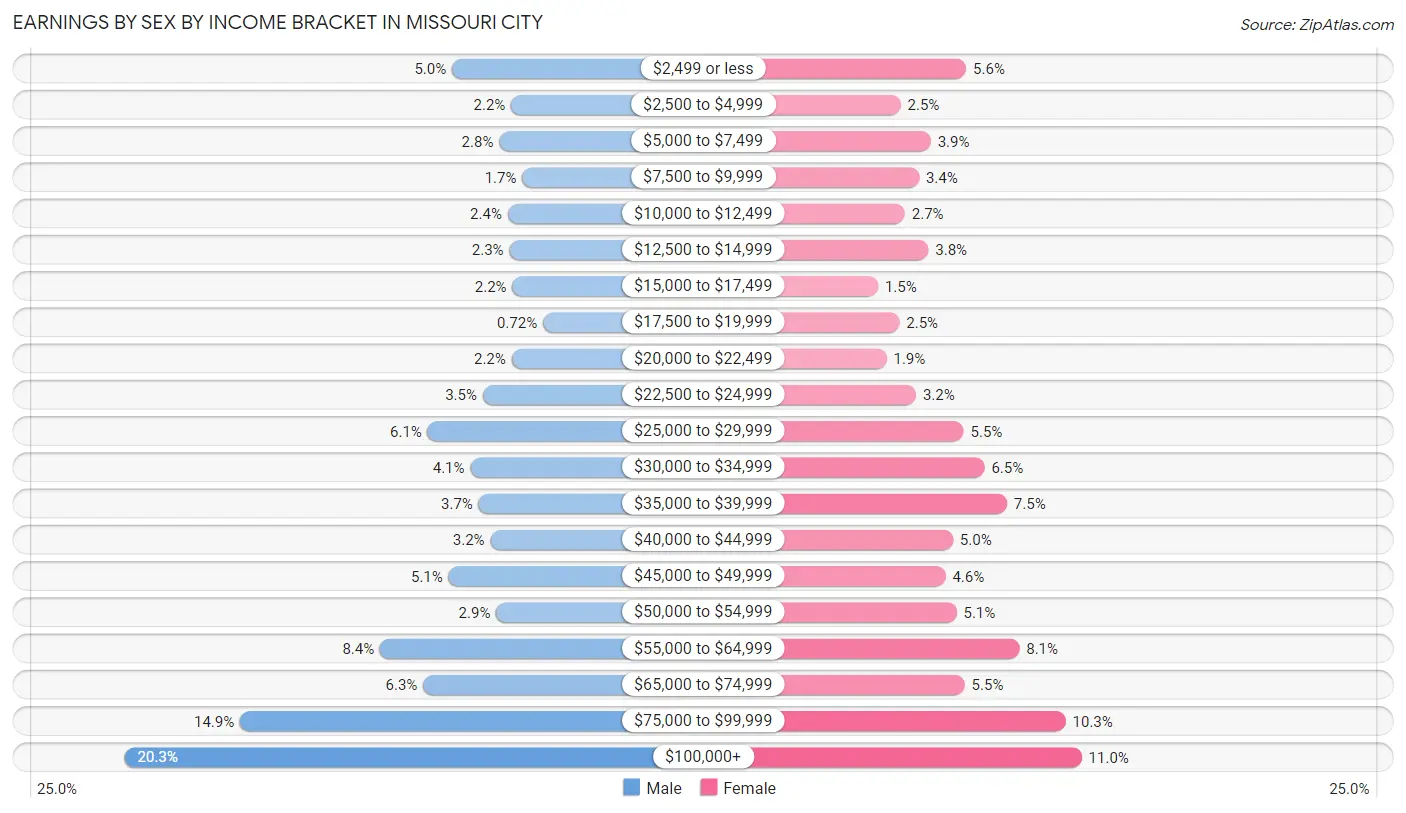
Earnings by Sex by Income Bracket in Missouri City
The most common earnings brackets in Missouri City are $100,000+ for men (4,253 | 20.3%) and $100,000+ for women (2,274 | 11.0%).
| Income | Male | Female |
| $2,499 or less | 1,042 (5.0%) | 1,156 (5.6%) |
| $2,500 to $4,999 | 463 (2.2%) | 520 (2.5%) |
| $5,000 to $7,499 | 579 (2.8%) | 813 (3.9%) |
| $7,500 to $9,999 | 354 (1.7%) | 699 (3.4%) |
| $10,000 to $12,499 | 496 (2.4%) | 563 (2.7%) |
| $12,500 to $14,999 | 479 (2.3%) | 790 (3.8%) |
| $15,000 to $17,499 | 449 (2.1%) | 301 (1.5%) |
| $17,500 to $19,999 | 151 (0.7%) | 508 (2.5%) |
| $20,000 to $22,499 | 459 (2.2%) | 384 (1.9%) |
| $22,500 to $24,999 | 740 (3.5%) | 670 (3.2%) |
| $25,000 to $29,999 | 1,282 (6.1%) | 1,130 (5.5%) |
| $30,000 to $34,999 | 863 (4.1%) | 1,334 (6.5%) |
| $35,000 to $39,999 | 780 (3.7%) | 1,551 (7.5%) |
| $40,000 to $44,999 | 666 (3.2%) | 1,028 (5.0%) |
| $45,000 to $49,999 | 1,075 (5.1%) | 955 (4.6%) |
| $50,000 to $54,999 | 609 (2.9%) | 1,063 (5.1%) |
| $55,000 to $64,999 | 1,747 (8.4%) | 1,671 (8.1%) |
| $65,000 to $74,999 | 1,324 (6.3%) | 1,142 (5.5%) |
| $75,000 to $99,999 | 3,121 (14.9%) | 2,118 (10.2%) |
| $100,000+ | 4,253 (20.3%) | 2,274 (11.0%) |
| Total | 20,932 (100.0%) | 20,670 (100.0%) |
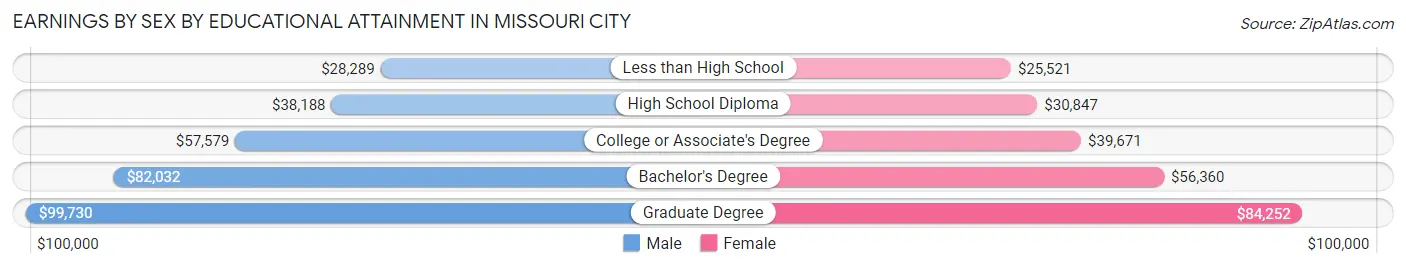
Earnings by Sex by Educational Attainment in Missouri City
Average earnings in Missouri City are $60,106 for men and $45,501 for women, a difference of 24.3%. Men with an educational attainment of graduate degree enjoy the highest average annual earnings of $99,730, while those with less than high school education earn the least with $28,289. Women with an educational attainment of graduate degree earn the most with the average annual earnings of $84,252, while those with less than high school education have the smallest earnings of $25,521.
| Educational Attainment | Male Income | Female Income |
| Less than High School | $28,289 | $25,521 |
| High School Diploma | $38,188 | $30,847 |
| College or Associate's Degree | $57,579 | $39,671 |
| Bachelor's Degree | $82,032 | $56,360 |
| Graduate Degree | $99,730 | $84,252 |
| Total | $60,106 | $45,501 |
Family Income in Missouri City
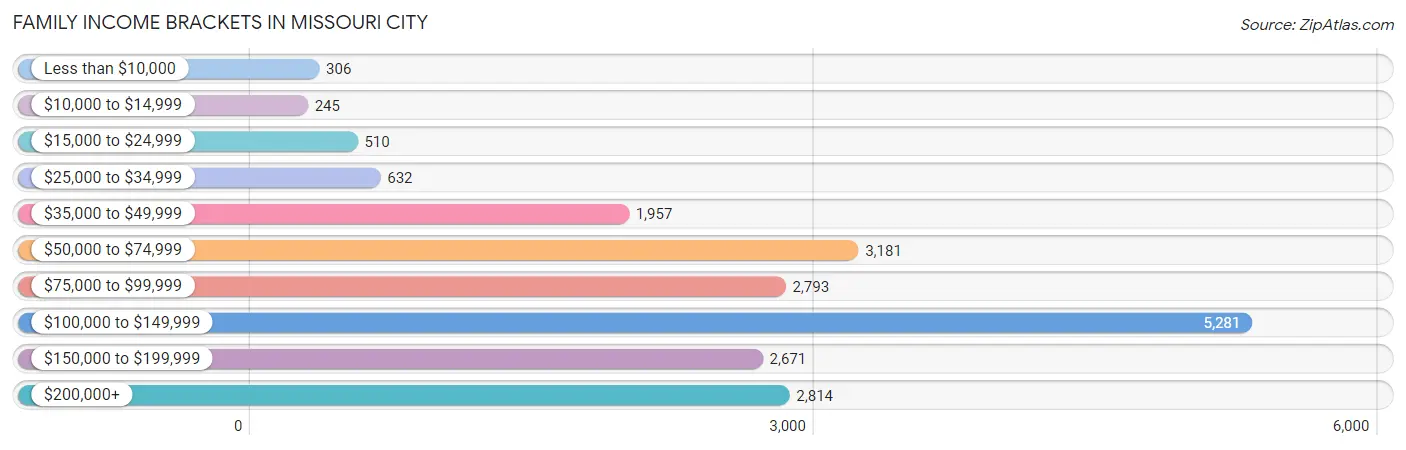
Family Income Brackets in Missouri City
According to the Missouri City family income data, there are 5,281 families falling into the $100,000 to $149,999 income range, which is the most common income bracket and makes up 25.9% of all families. Conversely, the $10,000 to $14,999 income bracket is the least frequent group with only 245 families (1.2%) belonging to this category.
| Income Bracket | # Families | % Families |
| Less than $10,000 | 306 | 1.5% |
| $10,000 to $14,999 | 245 | 1.2% |
| $15,000 to $24,999 | 510 | 2.5% |
| $25,000 to $34,999 | 632 | 3.1% |
| $35,000 to $49,999 | 1,957 | 9.6% |
| $50,000 to $74,999 | 3,181 | 15.6% |
| $75,000 to $99,999 | 2,793 | 13.7% |
| $100,000 to $149,999 | 5,281 | 25.9% |
| $150,000 to $199,999 | 2,671 | 13.1% |
| $200,000+ | 2,814 | 13.8% |
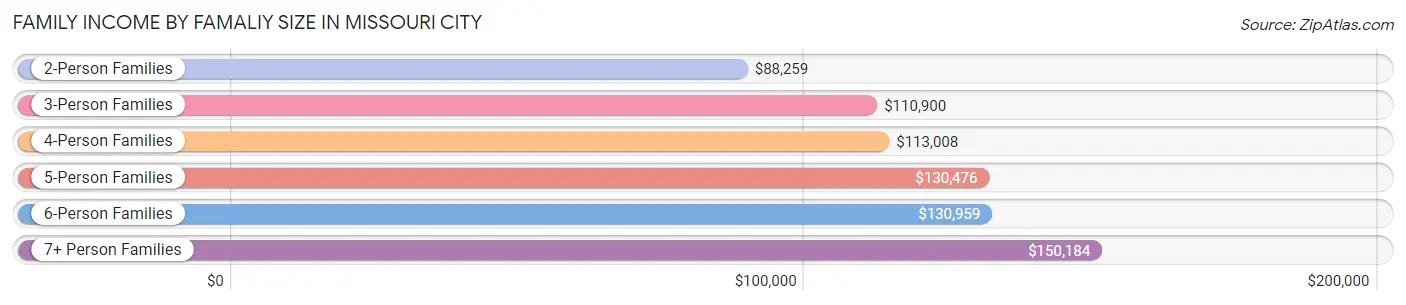
Family Income by Famaliy Size in Missouri City
7+ person families (277 | 1.4%) account for the highest median family income in Missouri City with $150,184 per family, while 2-person families (8,420 | 41.3%) have the highest median income of $44,130 per family member.
| Income Bracket | # Families | Median Income |
| 2-Person Families | 8,420 (41.3%) | $88,259 |
| 3-Person Families | 4,987 (24.5%) | $110,900 |
| 4-Person Families | 4,364 (21.4%) | $113,008 |
| 5-Person Families | 1,778 (8.7%) | $130,476 |
| 6-Person Families | 564 (2.8%) | $130,959 |
| 7+ Person Families | 277 (1.4%) | $150,184 |
| Total | 20,390 (100.0%) | $106,195 |
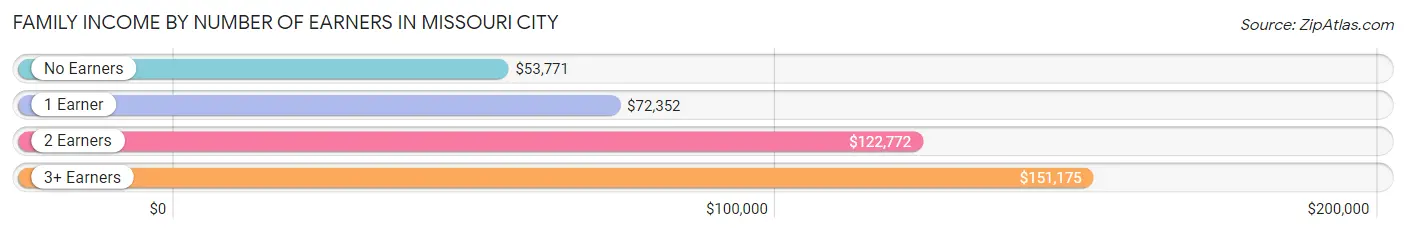
Family Income by Number of Earners in Missouri City
The median family income in Missouri City is $106,195, with families comprising 3+ earners (3,034) having the highest median family income of $151,175, while families with no earners (2,035) have the lowest median family income of $53,771, accounting for 14.9% and 10.0% of families, respectively.
| Number of Earners | # Families | Median Income |
| No Earners | 2,035 (10.0%) | $53,771 |
| 1 Earner | 6,593 (32.3%) | $72,352 |
| 2 Earners | 8,728 (42.8%) | $122,772 |
| 3+ Earners | 3,034 (14.9%) | $151,175 |
| Total | 20,390 (100.0%) | $106,195 |
Household Income in Missouri City
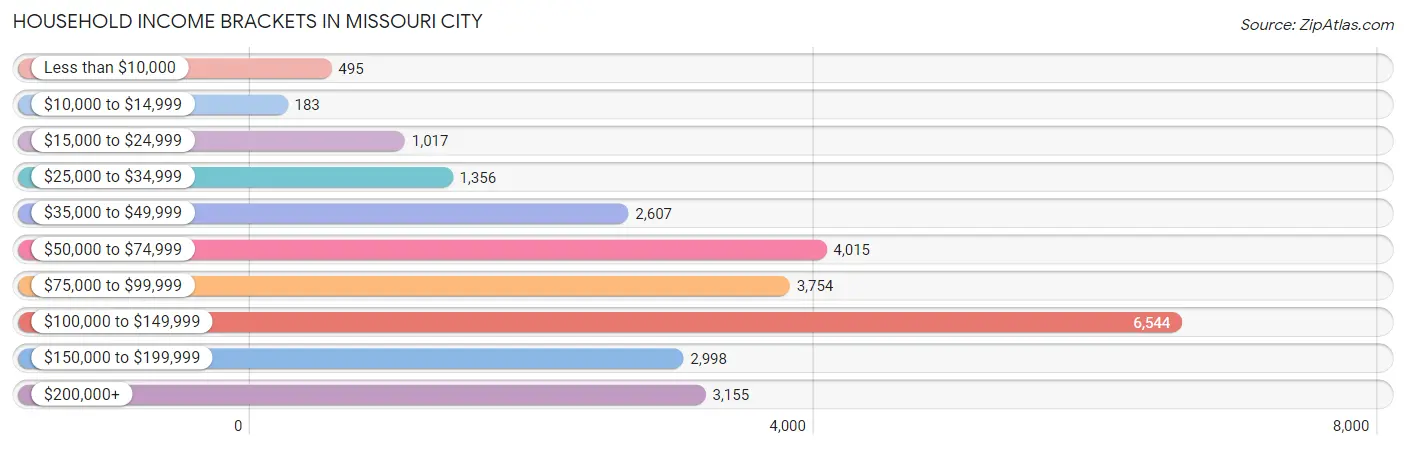
Household Income Brackets in Missouri City
With 6,544 households falling in the category, the $100,000 to $149,999 income range is the most frequent in Missouri City, accounting for 25.1% of all households. In contrast, only 183 households (0.7%) fall into the $10,000 to $14,999 income bracket, making it the least populous group.
| Income Bracket | # Households | % Households |
| Less than $10,000 | 495 | 1.9% |
| $10,000 to $14,999 | 183 | 0.7% |
| $15,000 to $24,999 | 1,017 | 3.9% |
| $25,000 to $34,999 | 1,356 | 5.2% |
| $35,000 to $49,999 | 2,607 | 10.0% |
| $50,000 to $74,999 | 4,015 | 15.4% |
| $75,000 to $99,999 | 3,754 | 14.4% |
| $100,000 to $149,999 | 6,544 | 25.1% |
| $150,000 to $199,999 | 2,998 | 11.5% |
| $200,000+ | 3,155 | 12.1% |
Household Income by Householder Age in Missouri City
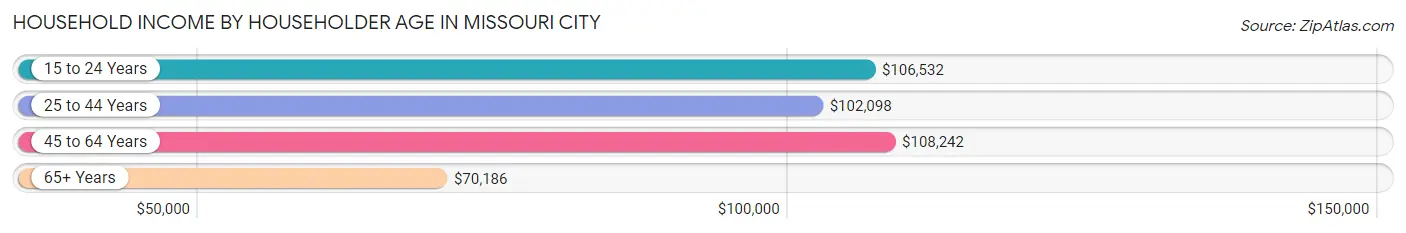
The median household income in Missouri City is $97,211, with the highest median household income of $108,242 found in the 45 to 64 years age bracket for the primary householder. A total of 11,135 households (42.7%) fall into this category. Meanwhile, the 65+ years age bracket for the primary householder has the lowest median household income of $70,186, with 6,273 households (24.1%) in this group.
| Income Bracket | # Households | Median Income |
| 15 to 24 Years | 444 (1.7%) | $106,532 |
| 25 to 44 Years | 8,220 (31.5%) | $102,098 |
| 45 to 64 Years | 11,135 (42.7%) | $108,242 |
| 65+ Years | 6,273 (24.1%) | $70,186 |
| Total | 26,072 (100.0%) | $97,211 |
Poverty in Missouri City
Income Below Poverty by Sex and Age in Missouri City
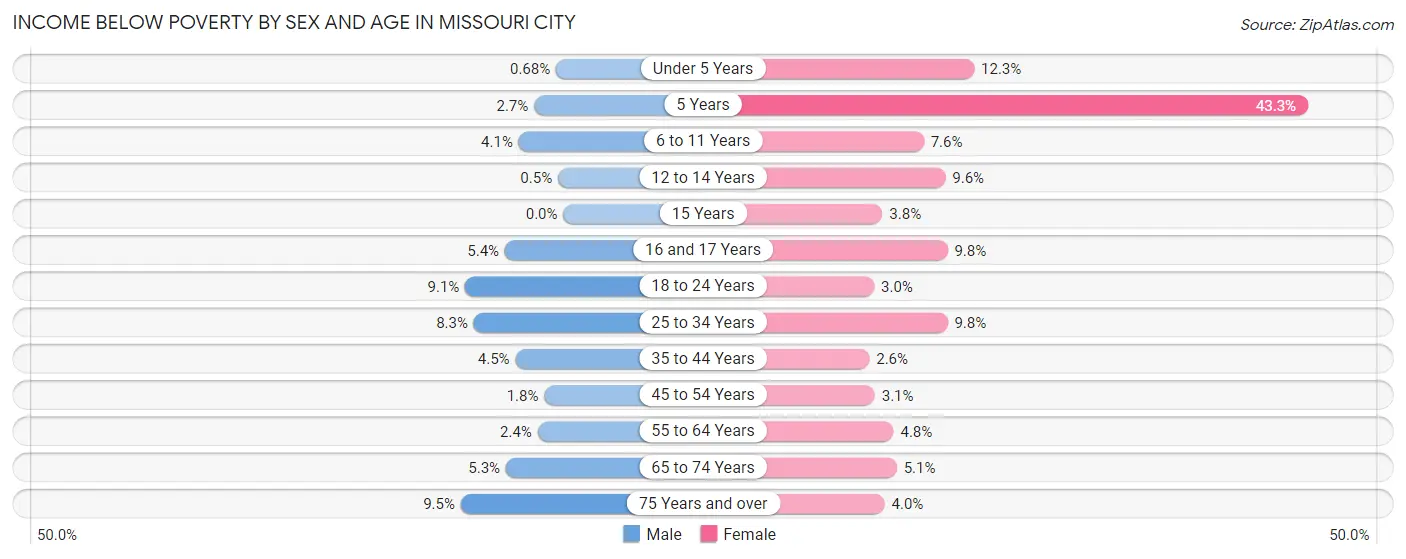
With 4.6% poverty level for males and 5.8% for females among the residents of Missouri City, 75 year old and over males and 5 year old females are the most vulnerable to poverty, with 148 males (9.5%) and 61 females (43.3%) in their respective age groups living below the poverty level.
| Age Bracket | Male | Female |
| Under 5 Years | 14 (0.7%) | 310 (12.3%) |
| 5 Years | 18 (2.7%) | 61 (43.3%) |
| 6 to 11 Years | 97 (4.1%) | 182 (7.6%) |
| 12 to 14 Years | 7 (0.5%) | 137 (9.6%) |
| 15 Years | 0 (0.0%) | 14 (3.8%) |
| 16 and 17 Years | 60 (5.4%) | 110 (9.8%) |
| 18 to 24 Years | 283 (9.1%) | 105 (3.0%) |
| 25 to 34 Years | 409 (8.3%) | 420 (9.8%) |
| 35 to 44 Years | 220 (4.4%) | 138 (2.5%) |
| 45 to 54 Years | 81 (1.8%) | 150 (3.1%) |
| 55 to 64 Years | 126 (2.4%) | 288 (4.8%) |
| 65 to 74 Years | 171 (5.3%) | 212 (5.1%) |
| 75 Years and over | 148 (9.5%) | 91 (4.0%) |
| Total | 1,634 (4.6%) | 2,218 (5.8%) |
Income Above Poverty by Sex and Age in Missouri City
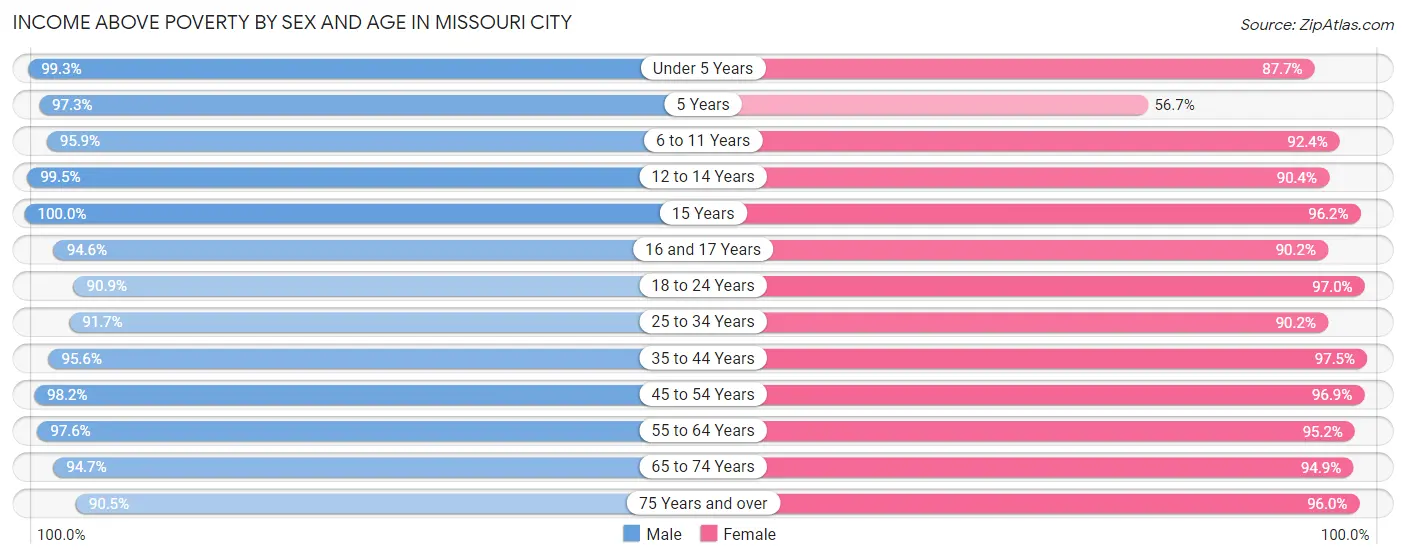
According to the poverty statistics in Missouri City, males aged 15 years and females aged 35 to 44 years are the age groups that are most secure financially, with 100.0% of males and 97.5% of females in these age groups living above the poverty line.
| Age Bracket | Male | Female |
| Under 5 Years | 2,053 (99.3%) | 2,214 (87.7%) |
| 5 Years | 645 (97.3%) | 80 (56.7%) |
| 6 to 11 Years | 2,248 (95.9%) | 2,213 (92.4%) |
| 12 to 14 Years | 1,401 (99.5%) | 1,289 (90.4%) |
| 15 Years | 372 (100.0%) | 357 (96.2%) |
| 16 and 17 Years | 1,047 (94.6%) | 1,011 (90.2%) |
| 18 to 24 Years | 2,822 (90.9%) | 3,400 (97.0%) |
| 25 to 34 Years | 4,511 (91.7%) | 3,863 (90.2%) |
| 35 to 44 Years | 4,727 (95.6%) | 5,274 (97.5%) |
| 45 to 54 Years | 4,486 (98.2%) | 4,754 (96.9%) |
| 55 to 64 Years | 5,166 (97.6%) | 5,715 (95.2%) |
| 65 to 74 Years | 3,035 (94.7%) | 3,944 (94.9%) |
| 75 Years and over | 1,407 (90.5%) | 2,204 (96.0%) |
| Total | 33,920 (95.4%) | 36,318 (94.2%) |
Income Below Poverty Among Married-Couple Families in Missouri City
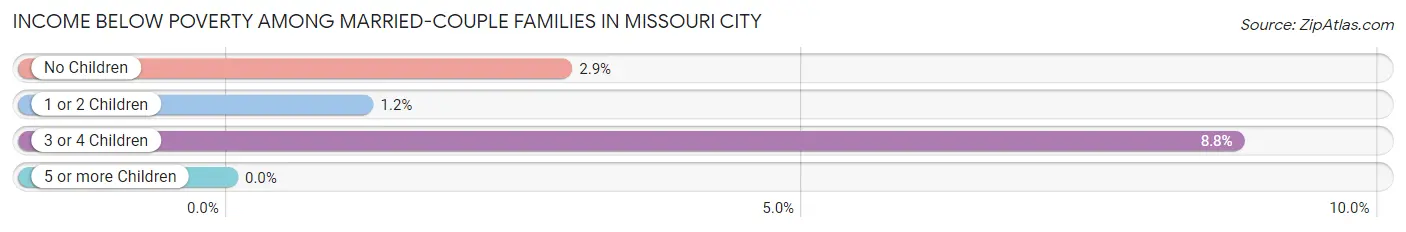
The poverty statistics for married-couple families in Missouri City show that 2.8% or 417 of the total 14,961 families live below the poverty line. Families with 3 or 4 children have the highest poverty rate of 8.8%, comprising of 100 families. On the other hand, families with 5 or more children have the lowest poverty rate of 0.0%, which includes 0 families.
| Children | Above Poverty | Below Poverty |
| No Children | 8,656 (97.1%) | 259 (2.9%) |
| 1 or 2 Children | 4,837 (98.8%) | 58 (1.2%) |
| 3 or 4 Children | 1,042 (91.2%) | 100 (8.8%) |
| 5 or more Children | 9 (100.0%) | 0 (0.0%) |
| Total | 14,544 (97.2%) | 417 (2.8%) |
Income Below Poverty Among Single-Parent Households in Missouri City
According to the poverty data in Missouri City, 8.4% or 124 single-father households and 8.1% or 320 single-mother households are living below the poverty line. Among single-father households, those with 3 or 4 children have the highest poverty rate, with 35 households (26.5%) experiencing poverty. Likewise, among single-mother households, those with 3 or 4 children have the highest poverty rate, with 69 households (19.8%) falling below the poverty line.
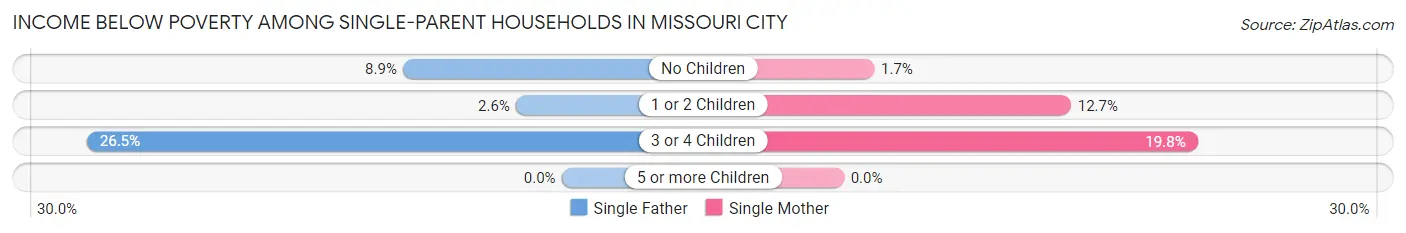
| Children | Single Father | Single Mother |
| No Children | 77 (8.9%) | 32 (1.7%) |
| 1 or 2 Children | 12 (2.6%) | 219 (12.7%) |
| 3 or 4 Children | 35 (26.5%) | 69 (19.8%) |
| 5 or more Children | 0 (0.0%) | 0 (0.0%) |
| Total | 124 (8.4%) | 320 (8.1%) |
Income Below Poverty Among Married-Couple vs Single-Parent Households in Missouri City
The poverty data for Missouri City shows that 417 of the married-couple family households (2.8%) and 444 of the single-parent households (8.2%) are living below the poverty level. Within the married-couple family households, those with 3 or 4 children have the highest poverty rate, with 100 households (8.8%) falling below the poverty line. Among the single-parent households, those with 3 or 4 children have the highest poverty rate, with 104 household (21.6%) living below poverty.
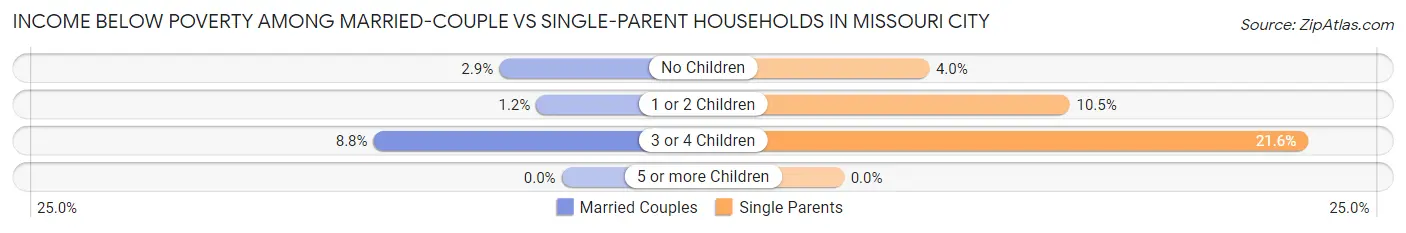
| Children | Married-Couple Families | Single-Parent Households |
| No Children | 259 (2.9%) | 109 (4.0%) |
| 1 or 2 Children | 58 (1.2%) | 231 (10.5%) |
| 3 or 4 Children | 100 (8.8%) | 104 (21.6%) |
| 5 or more Children | 0 (0.0%) | 0 (0.0%) |
| Total | 417 (2.8%) | 444 (8.2%) |
Race in Missouri City
The most populous races in Missouri City are Black / African American (30,065 | 40.4%), White / Caucasian (21,459 | 28.8%), and Hispanic or Latino (13,697 | 18.4%).
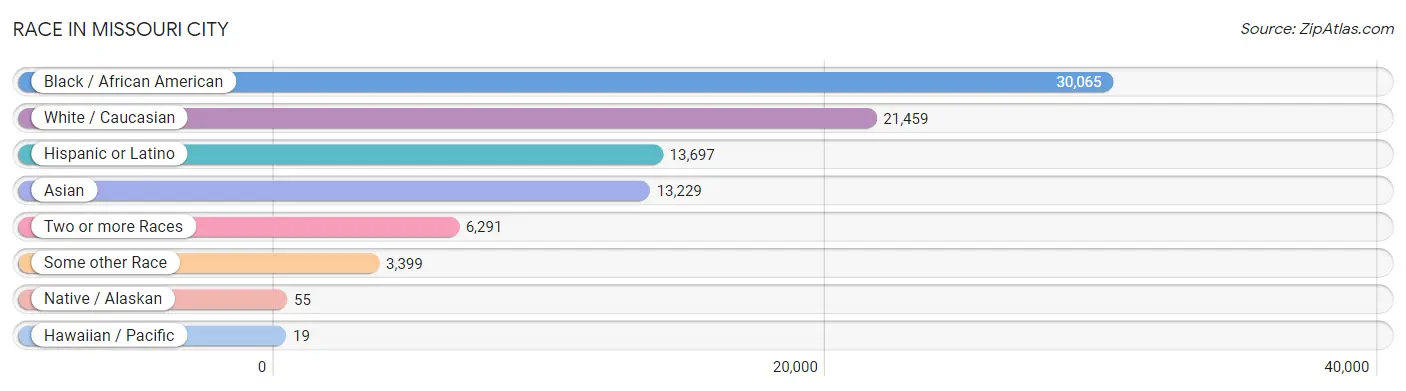
| Race | # Population | % Population |
| Asian | 13,229 | 17.7% |
| Black / African American | 30,065 | 40.4% |
| Hawaiian / Pacific | 19 | 0.0% |
| Hispanic or Latino | 13,697 | 18.4% |
| Native / Alaskan | 55 | 0.1% |
| White / Caucasian | 21,459 | 28.8% |
| Two or more Races | 6,291 | 8.4% |
| Some other Race | 3,399 | 4.6% |
| Total | 74,517 | 100.0% |
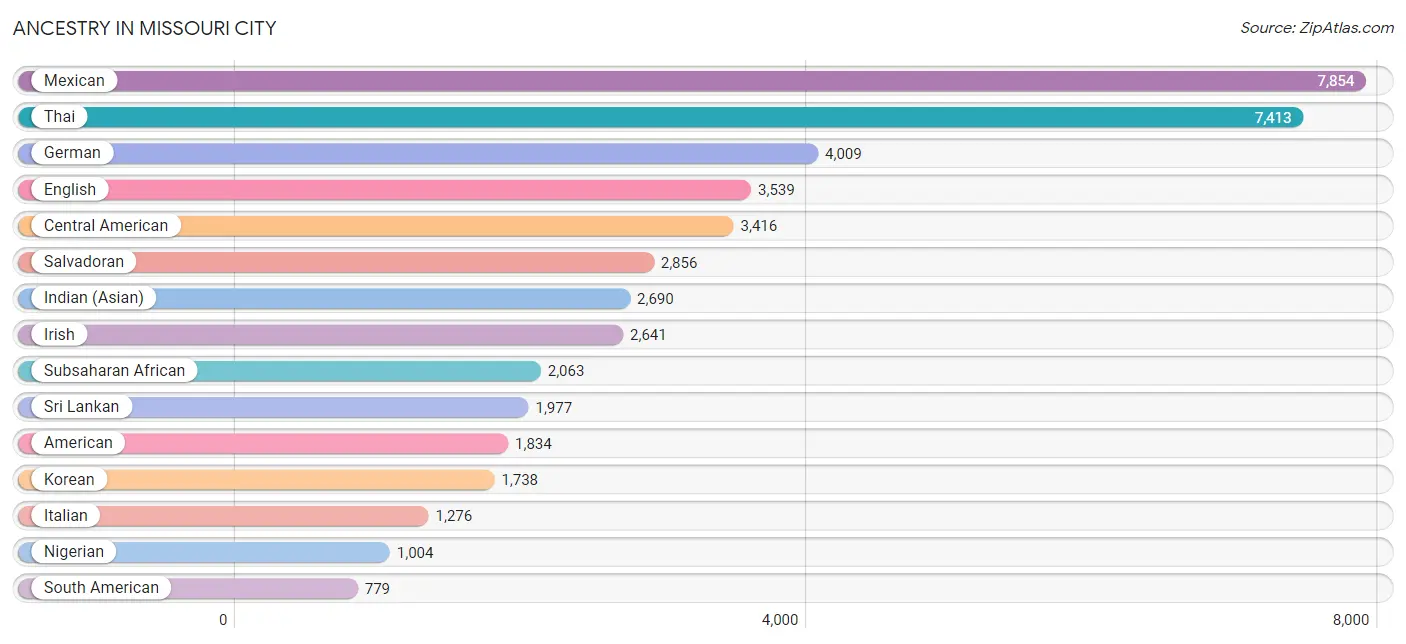
Ancestry in Missouri City
The most populous ancestries reported in Missouri City are Mexican (7,854 | 10.5%), Thai (7,413 | 10.0%), German (4,009 | 5.4%), English (3,539 | 4.8%), and Central American (3,416 | 4.6%), together accounting for 35.2% of all Missouri City residents.
| Ancestry | # Population | % Population |
| African | 724 | 1.0% |
| American | 1,834 | 2.5% |
| Arab | 577 | 0.8% |
| Argentinean | 113 | 0.2% |
| Austrian | 77 | 0.1% |
| Belgian | 80 | 0.1% |
| Belizean | 99 | 0.1% |
| Bhutanese | 176 | 0.2% |
| Blackfeet | 53 | 0.1% |
| Bolivian | 13 | 0.0% |
| British | 258 | 0.4% |
| British West Indian | 95 | 0.1% |
| Burmese | 71 | 0.1% |
| Canadian | 26 | 0.0% |
| Central American | 3,416 | 4.6% |
| Central American Indian | 4 | 0.0% |
| Cherokee | 173 | 0.2% |
| Chickasaw | 10 | 0.0% |
| Choctaw | 38 | 0.1% |
| Colombian | 482 | 0.6% |
| Costa Rican | 46 | 0.1% |
| Croatian | 89 | 0.1% |
| Cuban | 78 | 0.1% |
| Czech | 157 | 0.2% |
| Czechoslovakian | 10 | 0.0% |
| Danish | 192 | 0.3% |
| Dominican | 218 | 0.3% |
| Dutch | 172 | 0.2% |
| Eastern European | 39 | 0.1% |
| Egyptian | 76 | 0.1% |
| English | 3,539 | 4.8% |
| Ethiopian | 24 | 0.0% |
| European | 394 | 0.5% |
| Filipino | 76 | 0.1% |
| Finnish | 14 | 0.0% |
| French | 725 | 1.0% |
| French Canadian | 78 | 0.1% |
| German | 4,009 | 5.4% |
| Ghanaian | 142 | 0.2% |
| Greek | 544 | 0.7% |
| Guatemalan | 30 | 0.0% |
| Guyanese | 19 | 0.0% |
| Haitian | 45 | 0.1% |
| Honduran | 299 | 0.4% |
| Hungarian | 20 | 0.0% |
| Indian (Asian) | 2,690 | 3.6% |
| Iranian | 44 | 0.1% |
| Irish | 2,641 | 3.5% |
| Israeli | 13 | 0.0% |
| Italian | 1,276 | 1.7% |
| Jamaican | 493 | 0.7% |
| Japanese | 80 | 0.1% |
| Jordanian | 10 | 0.0% |
| Kenyan | 17 | 0.0% |
| Korean | 1,738 | 2.3% |
| Lebanese | 56 | 0.1% |
| Liberian | 31 | 0.0% |
| Lithuanian | 11 | 0.0% |
| Malaysian | 8 | 0.0% |
| Mexican | 7,854 | 10.5% |
| Mexican American Indian | 12 | 0.0% |
| Mongolian | 6 | 0.0% |
| Moroccan | 71 | 0.1% |
| Native Hawaiian | 19 | 0.0% |
| Navajo | 17 | 0.0% |
| Nicaraguan | 86 | 0.1% |
| Nigerian | 1,004 | 1.3% |
| Northern European | 19 | 0.0% |
| Norwegian | 309 | 0.4% |
| Pakistani | 45 | 0.1% |
| Palestinian | 269 | 0.4% |
| Panamanian | 99 | 0.1% |
| Peruvian | 115 | 0.2% |
| Polish | 284 | 0.4% |
| Portuguese | 334 | 0.4% |
| Puerto Rican | 230 | 0.3% |
| Romanian | 236 | 0.3% |
| Russian | 82 | 0.1% |
| Salvadoran | 2,856 | 3.8% |
| Scandinavian | 70 | 0.1% |
| Scotch-Irish | 505 | 0.7% |
| Scottish | 704 | 0.9% |
| Senegalese | 24 | 0.0% |
| Slavic | 63 | 0.1% |
| Slovak | 13 | 0.0% |
| South African | 21 | 0.0% |
| South American | 779 | 1.1% |
| Spaniard | 67 | 0.1% |
| Spanish | 154 | 0.2% |
| Sri Lankan | 1,977 | 2.6% |
| Subsaharan African | 2,063 | 2.8% |
| Swedish | 288 | 0.4% |
| Swiss | 52 | 0.1% |
| Thai | 7,413 | 10.0% |
| Trinidadian and Tobagonian | 126 | 0.2% |
| Turkish | 92 | 0.1% |
| Venezuelan | 56 | 0.1% |
| Vietnamese | 35 | 0.1% |
| Welsh | 145 | 0.2% |
| West Indian | 241 | 0.3% |
| Yugoslavian | 49 | 0.1% | View All 101 Rows |
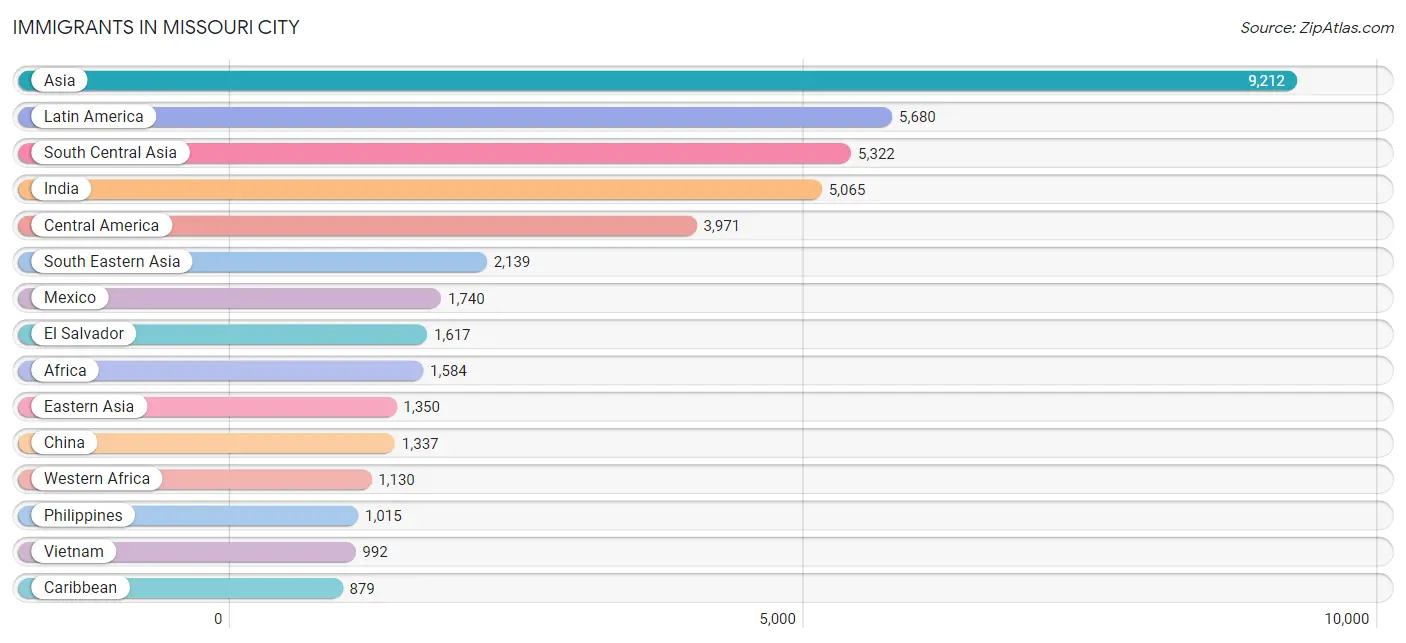
Immigrants in Missouri City
The most numerous immigrant groups reported in Missouri City came from Asia (9,212 | 12.4%), Latin America (5,680 | 7.6%), South Central Asia (5,322 | 7.1%), India (5,065 | 6.8%), and Central America (3,971 | 5.3%), together accounting for 39.3% of all Missouri City residents.
| Immigration Origin | # Population | % Population |
| Africa | 1,584 | 2.1% |
| Asia | 9,212 | 12.4% |
| Bangladesh | 35 | 0.1% |
| Barbados | 73 | 0.1% |
| Belize | 98 | 0.1% |
| Bolivia | 61 | 0.1% |
| Brazil | 233 | 0.3% |
| Cambodia | 33 | 0.0% |
| Canada | 86 | 0.1% |
| Caribbean | 879 | 1.2% |
| Central America | 3,971 | 5.3% |
| China | 1,337 | 1.8% |
| Colombia | 268 | 0.4% |
| Croatia | 22 | 0.0% |
| Cuba | 21 | 0.0% |
| Eastern Africa | 179 | 0.2% |
| Eastern Asia | 1,350 | 1.8% |
| Eastern Europe | 119 | 0.2% |
| Egypt | 76 | 0.1% |
| El Salvador | 1,617 | 2.2% |
| England | 69 | 0.1% |
| Ethiopia | 33 | 0.0% |
| Europe | 744 | 1.0% |
| Germany | 104 | 0.1% |
| Ghana | 200 | 0.3% |
| Greece | 129 | 0.2% |
| Grenada | 89 | 0.1% |
| Guatemala | 14 | 0.0% |
| Guyana | 51 | 0.1% |
| Honduras | 287 | 0.4% |
| Hong Kong | 162 | 0.2% |
| India | 5,065 | 6.8% |
| Indonesia | 50 | 0.1% |
| Iran | 24 | 0.0% |
| Iraq | 90 | 0.1% |
| Ireland | 5 | 0.0% |
| Israel | 13 | 0.0% |
| Italy | 11 | 0.0% |
| Jamaica | 500 | 0.7% |
| Jordan | 10 | 0.0% |
| Kenya | 62 | 0.1% |
| Korea | 13 | 0.0% |
| Kuwait | 36 | 0.1% |
| Latin America | 5,680 | 7.6% |
| Lebanon | 8 | 0.0% |
| Liberia | 31 | 0.0% |
| Malaysia | 32 | 0.0% |
| Mexico | 1,740 | 2.3% |
| Nepal | 54 | 0.1% |
| Netherlands | 25 | 0.0% |
| Nicaragua | 48 | 0.1% |
| Nigeria | 790 | 1.1% |
| Northern Africa | 95 | 0.1% |
| Northern Europe | 303 | 0.4% |
| Norway | 59 | 0.1% |
| Pakistan | 117 | 0.2% |
| Panama | 167 | 0.2% |
| Peru | 120 | 0.2% |
| Philippines | 1,015 | 1.4% |
| Poland | 10 | 0.0% |
| Portugal | 53 | 0.1% |
| Romania | 25 | 0.0% |
| Russia | 62 | 0.1% |
| Saudi Arabia | 99 | 0.1% |
| Scotland | 13 | 0.0% |
| Senegal | 47 | 0.1% |
| Singapore | 8 | 0.0% |
| South Africa | 48 | 0.1% |
| South America | 830 | 1.1% |
| South Central Asia | 5,322 | 7.1% |
| South Eastern Asia | 2,139 | 2.9% |
| Southern Europe | 193 | 0.3% |
| St. Vincent and the Grenadines | 28 | 0.0% |
| Taiwan | 230 | 0.3% |
| Thailand | 9 | 0.0% |
| Trinidad and Tobago | 126 | 0.2% |
| Uganda | 42 | 0.1% |
| Uzbekistan | 27 | 0.0% |
| Venezuela | 79 | 0.1% |
| Vietnam | 992 | 1.3% |
| West Indies | 17 | 0.0% |
| Western Africa | 1,130 | 1.5% |
| Western Asia | 392 | 0.5% |
| Western Europe | 129 | 0.2% |
| Zimbabwe | 15 | 0.0% | View All 85 Rows |
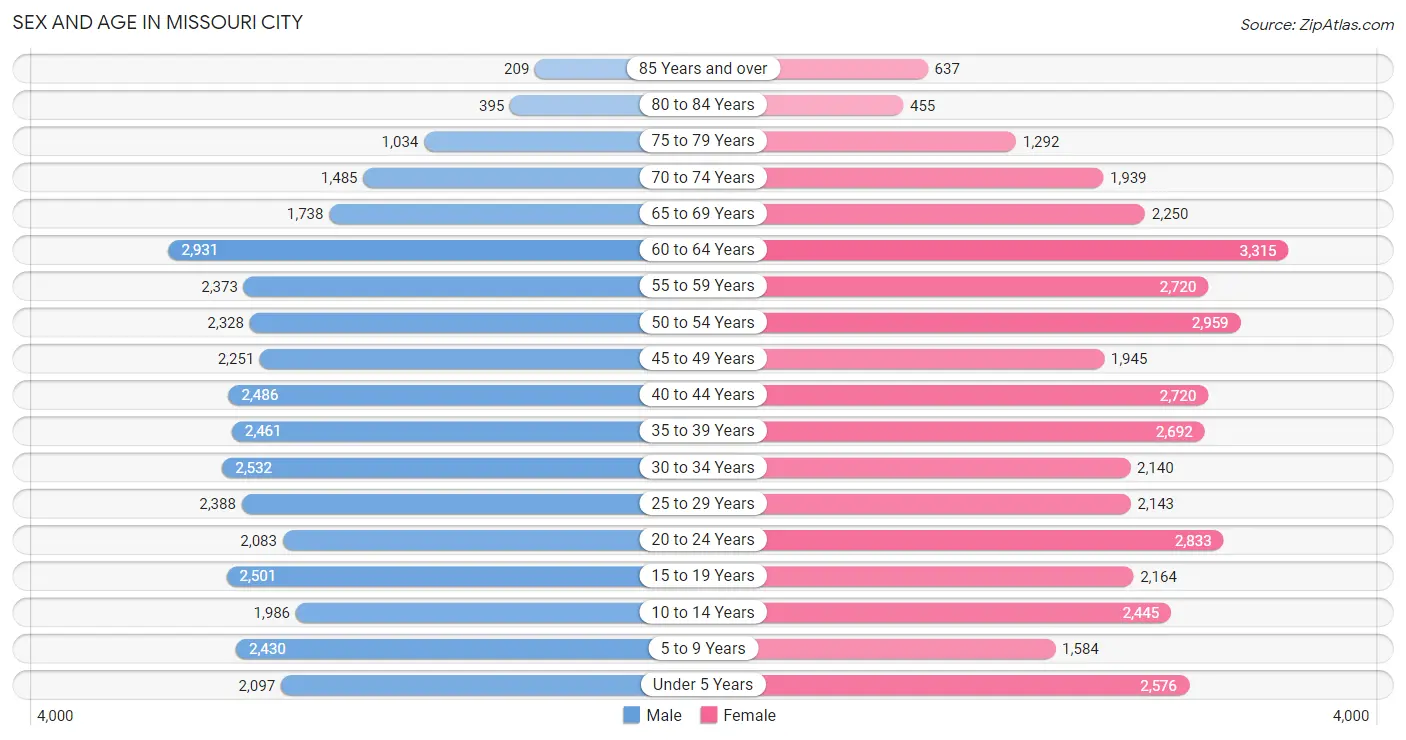
Sex and Age in Missouri City
Sex and Age in Missouri City
The most populous age groups in Missouri City are 60 to 64 Years (2,931 | 8.2%) for men and 60 to 64 Years (3,315 | 8.5%) for women.
| Age Bracket | Male | Female |
| Under 5 Years | 2,097 (5.9%) | 2,576 (6.6%) |
| 5 to 9 Years | 2,430 (6.8%) | 1,584 (4.1%) |
| 10 to 14 Years | 1,986 (5.6%) | 2,445 (6.3%) |
| 15 to 19 Years | 2,501 (7.0%) | 2,164 (5.6%) |
| 20 to 24 Years | 2,083 (5.8%) | 2,833 (7.3%) |
| 25 to 29 Years | 2,388 (6.7%) | 2,143 (5.5%) |
| 30 to 34 Years | 2,532 (7.1%) | 2,140 (5.5%) |
| 35 to 39 Years | 2,461 (6.9%) | 2,692 (6.9%) |
| 40 to 44 Years | 2,486 (7.0%) | 2,720 (7.0%) |
| 45 to 49 Years | 2,251 (6.3%) | 1,945 (5.0%) |
| 50 to 54 Years | 2,328 (6.5%) | 2,959 (7.6%) |
| 55 to 59 Years | 2,373 (6.7%) | 2,720 (7.0%) |
| 60 to 64 Years | 2,931 (8.2%) | 3,315 (8.5%) |
| 65 to 69 Years | 1,738 (4.9%) | 2,250 (5.8%) |
| 70 to 74 Years | 1,485 (4.2%) | 1,939 (5.0%) |
| 75 to 79 Years | 1,034 (2.9%) | 1,292 (3.3%) |
| 80 to 84 Years | 395 (1.1%) | 455 (1.2%) |
| 85 Years and over | 209 (0.6%) | 637 (1.6%) |
| Total | 35,708 (100.0%) | 38,809 (100.0%) |
Families and Households in Missouri City
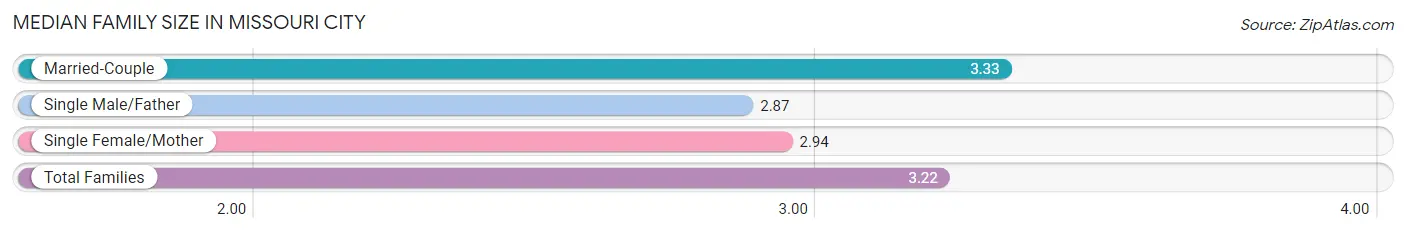
Median Family Size in Missouri City
The median family size in Missouri City is 3.22 persons per family, with married-couple families (14,961 | 73.4%) accounting for the largest median family size of 3.33 persons per family. On the other hand, single male/father families (1,469 | 7.2%) represent the smallest median family size with 2.87 persons per family.
| Family Type | # Families | Family Size |
| Married-Couple | 14,961 (73.4%) | 3.33 |
| Single Male/Father | 1,469 (7.2%) | 2.87 |
| Single Female/Mother | 3,960 (19.4%) | 2.94 |
| Total Families | 20,390 (100.0%) | 3.22 |
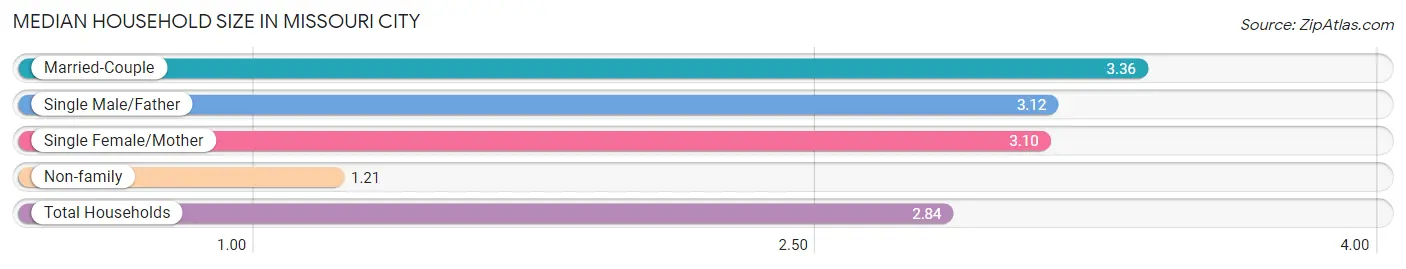
Median Household Size in Missouri City
The median household size in Missouri City is 2.84 persons per household, with married-couple households (14,961 | 57.4%) accounting for the largest median household size of 3.36 persons per household. non-family households (5,682 | 21.8%) represent the smallest median household size with 1.21 persons per household.
| Household Type | # Households | Household Size |
| Married-Couple | 14,961 (57.4%) | 3.36 |
| Single Male/Father | 1,469 (5.6%) | 3.12 |
| Single Female/Mother | 3,960 (15.2%) | 3.10 |
| Non-family | 5,682 (21.8%) | 1.21 |
| Total Households | 26,072 (100.0%) | 2.84 |
Household Size by Marriage Status in Missouri City
Out of a total of 26,072 households in Missouri City, 20,390 (78.2%) are family households, while 5,682 (21.8%) are nonfamily households. The most numerous type of family households are 2-person households, comprising 7,954, and the most common type of nonfamily households are 1-person households, comprising 4,773.
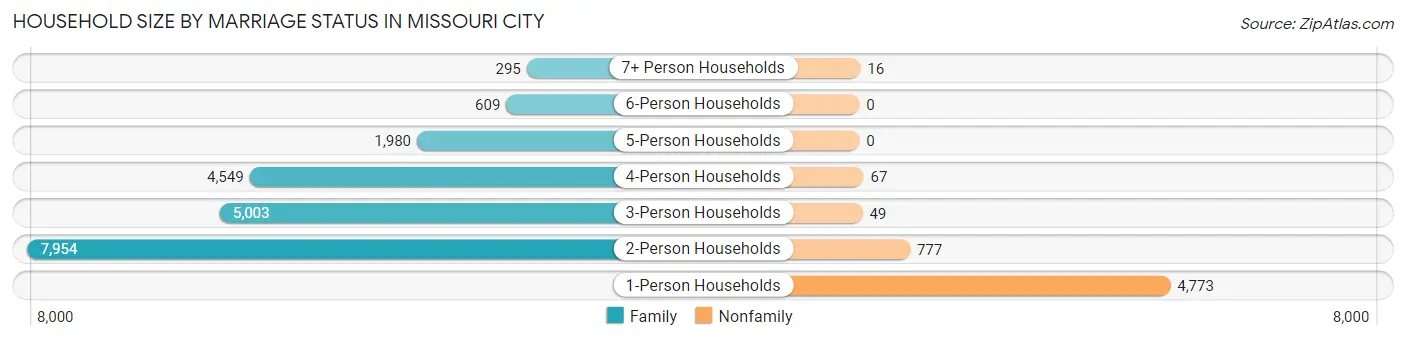
| Household Size | Family Households | Nonfamily Households |
| 1-Person Households | - | 4,773 (18.3%) |
| 2-Person Households | 7,954 (30.5%) | 777 (3.0%) |
| 3-Person Households | 5,003 (19.2%) | 49 (0.2%) |
| 4-Person Households | 4,549 (17.4%) | 67 (0.3%) |
| 5-Person Households | 1,980 (7.6%) | 0 (0.0%) |
| 6-Person Households | 609 (2.3%) | 0 (0.0%) |
| 7+ Person Households | 295 (1.1%) | 16 (0.1%) |
| Total | 20,390 (78.2%) | 5,682 (21.8%) |
Female Fertility in Missouri City
Fertility by Age in Missouri City
Average fertility rate in Missouri City is 58.0 births per 1,000 women. Women in the age bracket of 20 to 34 years have the highest fertility rate with 88.0 births per 1,000 women. Women in the age bracket of 20 to 34 years acount for 62.3% of all women with births.
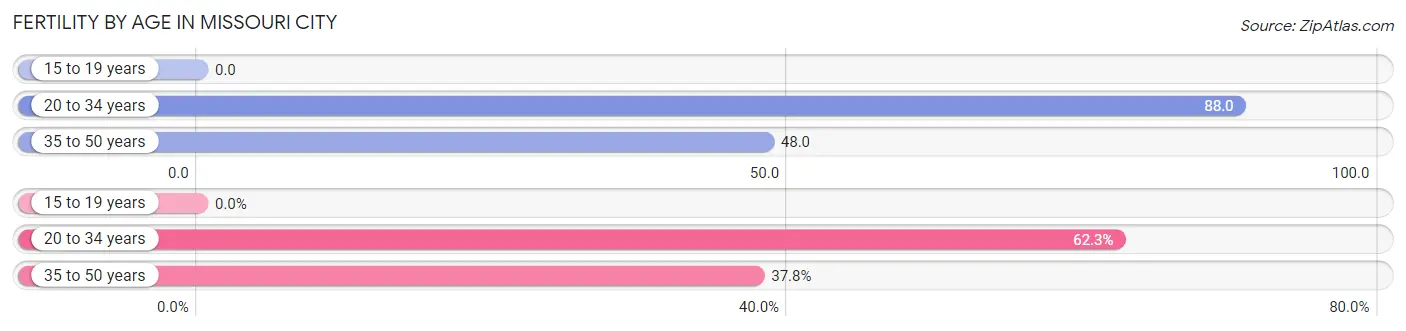
| Age Bracket | Women with Births | Births / 1,000 Women |
| 15 to 19 years | 0 (0.0%) | 0.0 |
| 20 to 34 years | 625 (62.3%) | 88.0 |
| 35 to 50 years | 379 (37.8%) | 48.0 |
| Total | 1,004 (100.0%) | 58.0 |
Fertility by Age by Marriage Status in Missouri City
75.1% of women with births (1,004) in Missouri City are married. The highest percentage of unmarried women with births falls into 20 to 34 years age bracket with 39.4% of them unmarried at the time of birth, while the lowest percentage of unmarried women with births belong to 35 to 50 years age bracket with 1.1% of them unmarried.
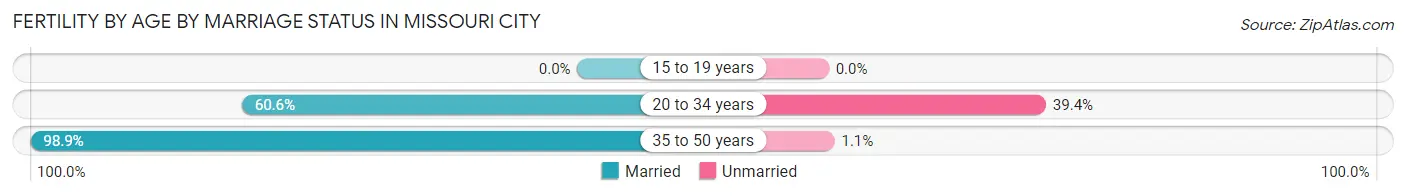
| Age Bracket | Married | Unmarried |
| 15 to 19 years | 0 (0.0%) | 0 (0.0%) |
| 20 to 34 years | 379 (60.6%) | 246 (39.4%) |
| 35 to 50 years | 375 (98.9%) | 4 (1.1%) |
| Total | 754 (75.1%) | 250 (24.9%) |
Fertility by Education in Missouri City
Average fertility rate in Missouri City is 58.0 births per 1,000 women. Women with the education attainment of bachelor's degree have the highest fertility rate of 84.0 births per 1,000 women, while women with the education attainment of less than high school have the lowest fertility at 21.0 births per 1,000 women. Women with the education attainment of bachelor's degree represent 34.2% of all women with births.
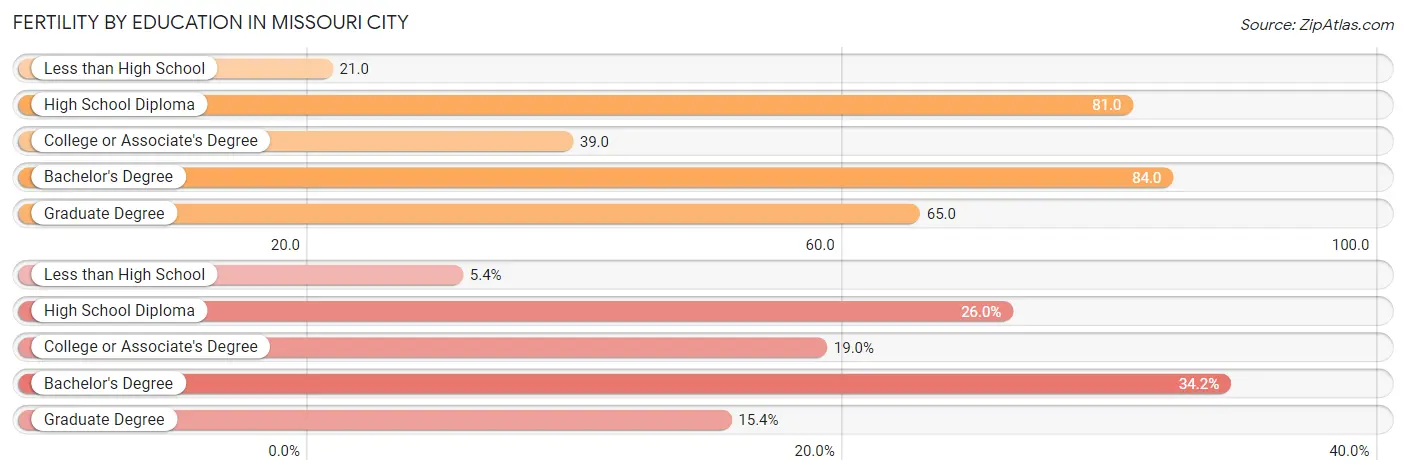
| Educational Attainment | Women with Births | Births / 1,000 Women |
| Less than High School | 54 (5.4%) | 21.0 |
| High School Diploma | 261 (26.0%) | 81.0 |
| College or Associate's Degree | 191 (19.0%) | 39.0 |
| Bachelor's Degree | 343 (34.2%) | 84.0 |
| Graduate Degree | 155 (15.4%) | 65.0 |
| Total | 1,004 (100.0%) | 58.0 |
Fertility by Education by Marriage Status in Missouri City
24.9% of women with births in Missouri City are unmarried. Women with the educational attainment of bachelor's degree are most likely to be married with 100.0% of them married at childbirth, while women with the educational attainment of college or associate's degree are least likely to be married with 56.0% of them unmarried at childbirth.
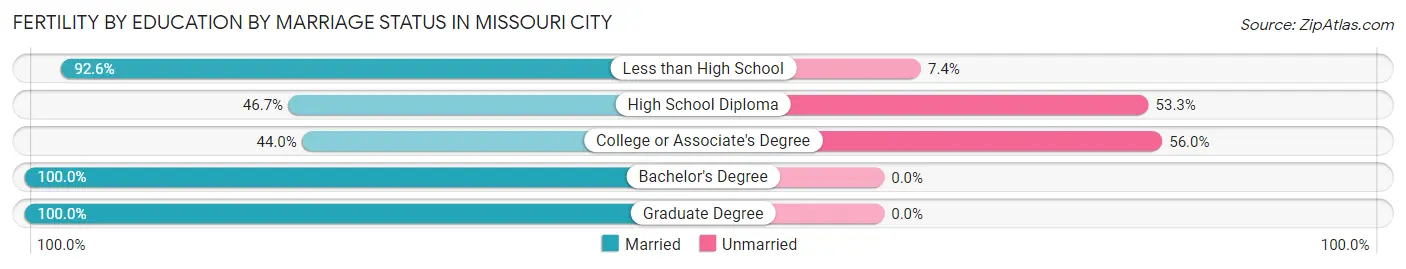
| Educational Attainment | Married | Unmarried |
| Less than High School | 50 (92.6%) | 4 (7.4%) |
| High School Diploma | 122 (46.7%) | 139 (53.3%) |
| College or Associate's Degree | 84 (44.0%) | 107 (56.0%) |
| Bachelor's Degree | 343 (100.0%) | 0 (0.0%) |
| Graduate Degree | 155 (100.0%) | 0 (0.0%) |
| Total | 754 (75.1%) | 250 (24.9%) |
Employment Characteristics in Missouri City
Employment by Class of Employer in Missouri City
Among the 36,860 employed individuals in Missouri City, private company employees (25,208 | 68.4%), local government employees (3,388 | 9.2%), and not-for-profit organizations (2,478 | 6.7%) make up the most common classes of employment.
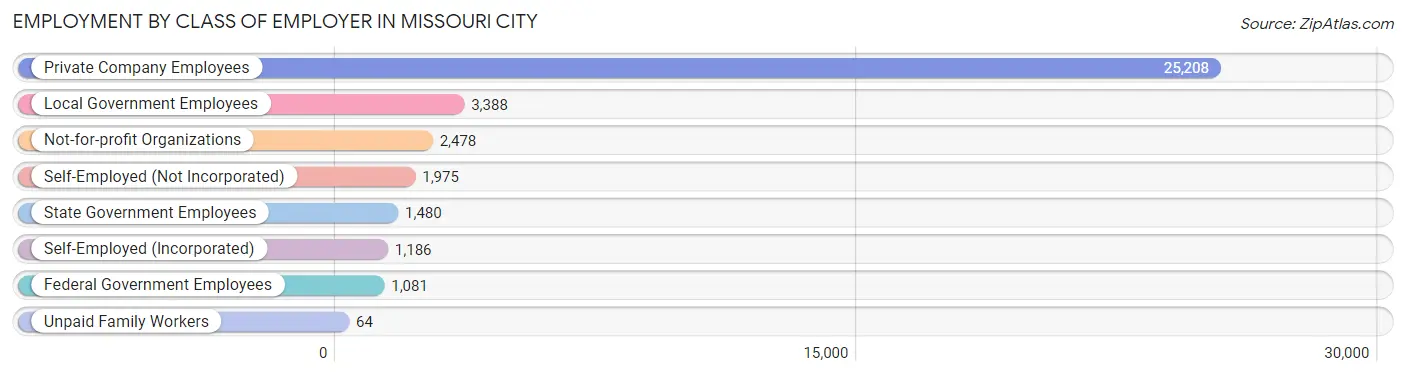
| Employer Class | # Employees | % Employees |
| Private Company Employees | 25,208 | 68.4% |
| Self-Employed (Incorporated) | 1,186 | 3.2% |
| Self-Employed (Not Incorporated) | 1,975 | 5.4% |
| Not-for-profit Organizations | 2,478 | 6.7% |
| Local Government Employees | 3,388 | 9.2% |
| State Government Employees | 1,480 | 4.0% |
| Federal Government Employees | 1,081 | 2.9% |
| Unpaid Family Workers | 64 | 0.2% |
| Total | 36,860 | 100.0% |
Employment Status by Age in Missouri City
According to the labor force statistics for Missouri City, out of the total population over 16 years of age (60,656), 65.8% or 39,912 individuals are in the labor force, with 5.7% or 2,275 of them unemployed. The age group with the highest labor force participation rate is 45 to 54 years, with 89.1% or 8,449 individuals in the labor force. Within the labor force, the 16 to 19 years age range has the highest percentage of unemployed individuals, with 15.9% or 124 of them being unemployed.
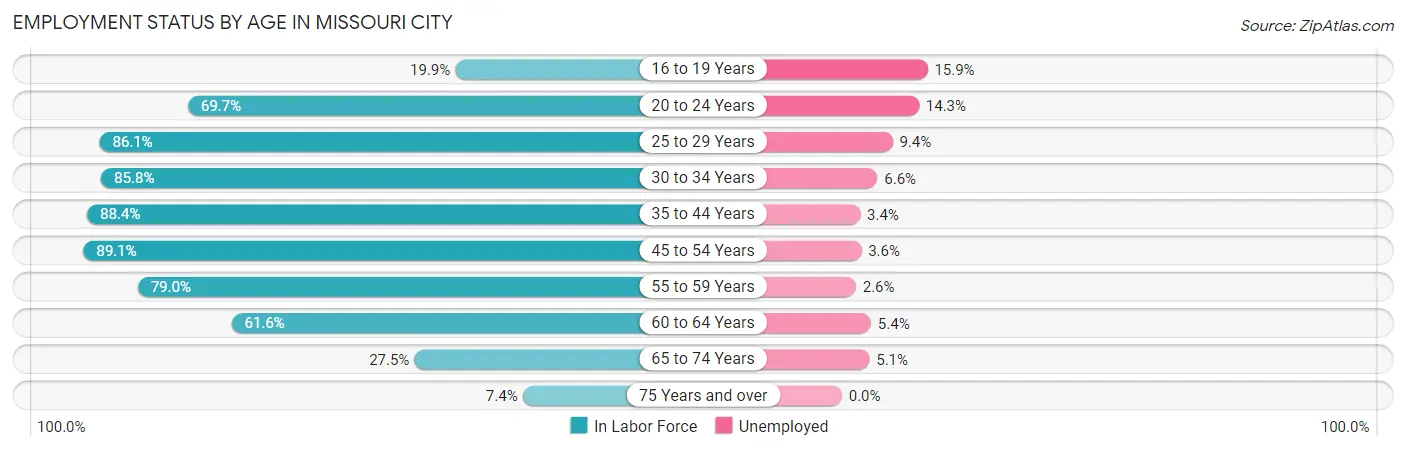
| Age Bracket | In Labor Force | Unemployed |
| 16 to 19 Years | 780 (19.9%) | 124 (15.9%) |
| 20 to 24 Years | 3,426 (69.7%) | 490 (14.3%) |
| 25 to 29 Years | 3,901 (86.1%) | 367 (9.4%) |
| 30 to 34 Years | 4,009 (85.8%) | 265 (6.6%) |
| 35 to 44 Years | 9,157 (88.4%) | 311 (3.4%) |
| 45 to 54 Years | 8,449 (89.1%) | 304 (3.6%) |
| 55 to 59 Years | 4,023 (79.0%) | 105 (2.6%) |
| 60 to 64 Years | 3,848 (61.6%) | 208 (5.4%) |
| 65 to 74 Years | 2,038 (27.5%) | 104 (5.1%) |
| 75 Years and over | 298 (7.4%) | 0 (0.0%) |
| Total | 39,912 (65.8%) | 2,275 (5.7%) |
Employment Status by Educational Attainment in Missouri City
According to labor force statistics for Missouri City, 82.7% of individuals (33,398) out of the total population between 25 and 64 years of age (40,384) are in the labor force, with 4.7% or 1,570 of them being unemployed. The group with the highest labor force participation rate are those with the educational attainment of bachelor's degree or higher, with 86.5% or 14,911 individuals in the labor force. Within the labor force, individuals with high school diploma education have the highest percentage of unemployment, with 9.8% or 627 of them being unemployed.
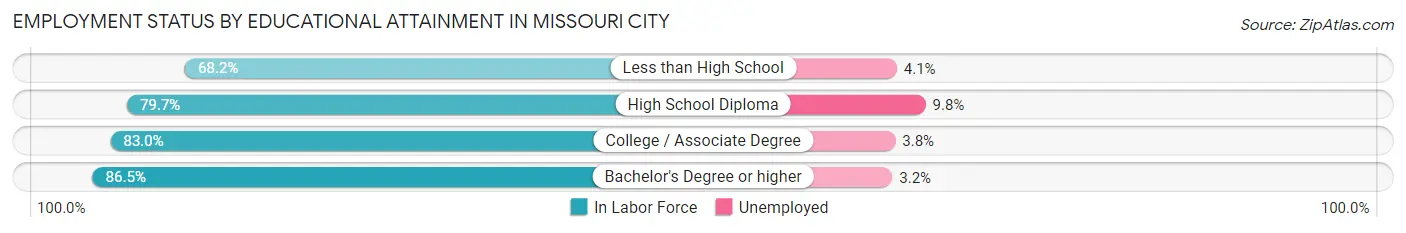
| Educational Attainment | In Labor Force | Unemployed |
| Less than High School | 2,189 (68.2%) | 132 (4.1%) |
| High School Diploma | 6,402 (79.7%) | 787 (9.8%) |
| College / Associate Degree | 9,881 (83.0%) | 452 (3.8%) |
| Bachelor's Degree or higher | 14,911 (86.5%) | 552 (3.2%) |
| Total | 33,398 (82.7%) | 1,898 (4.7%) |
Employment Occupations by Sex in Missouri City
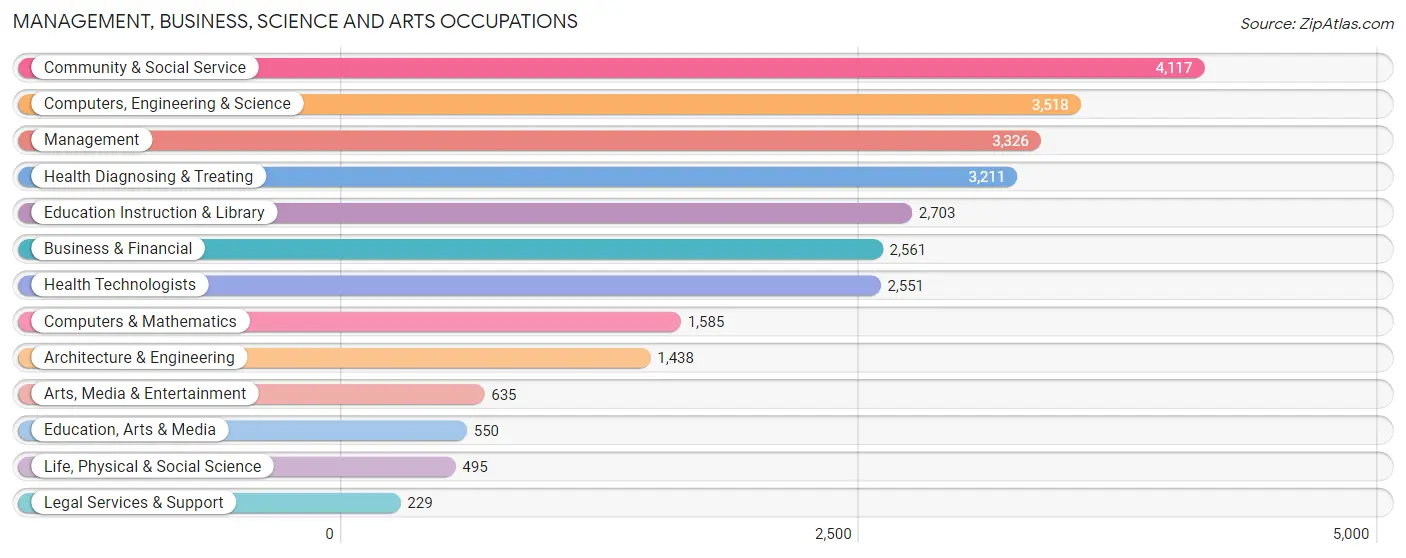
Management, Business, Science and Arts Occupations
The most common Management, Business, Science and Arts occupations in Missouri City are Community & Social Service (4,117 | 10.9%), Computers, Engineering & Science (3,518 | 9.3%), Management (3,326 | 8.8%), Health Diagnosing & Treating (3,211 | 8.5%), and Education Instruction & Library (2,703 | 7.2%).
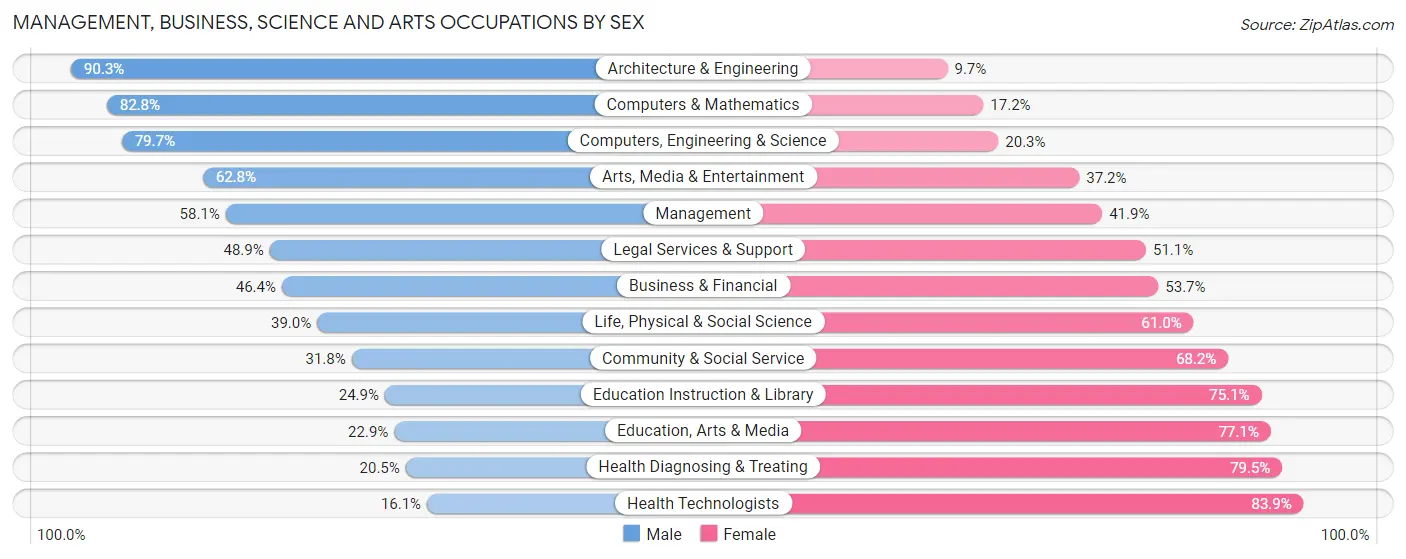
Management, Business, Science and Arts Occupations by Sex
Within the Management, Business, Science and Arts occupations in Missouri City, the most male-oriented occupations are Architecture & Engineering (90.3%), Computers & Mathematics (82.8%), and Computers, Engineering & Science (79.7%), while the most female-oriented occupations are Health Technologists (83.9%), Health Diagnosing & Treating (79.5%), and Education, Arts & Media (77.1%).
| Occupation | Male | Female |
| Management | 1,931 (58.1%) | 1,395 (41.9%) |
| Business & Financial | 1,187 (46.4%) | 1,374 (53.6%) |
| Computers, Engineering & Science | 2,805 (79.7%) | 713 (20.3%) |
| Computers & Mathematics | 1,313 (82.8%) | 272 (17.2%) |
| Architecture & Engineering | 1,299 (90.3%) | 139 (9.7%) |
| Life, Physical & Social Science | 193 (39.0%) | 302 (61.0%) |
| Community & Social Service | 1,309 (31.8%) | 2,808 (68.2%) |
| Education, Arts & Media | 126 (22.9%) | 424 (77.1%) |
| Legal Services & Support | 112 (48.9%) | 117 (51.1%) |
| Education Instruction & Library | 672 (24.9%) | 2,031 (75.1%) |
| Arts, Media & Entertainment | 399 (62.8%) | 236 (37.2%) |
| Health Diagnosing & Treating | 659 (20.5%) | 2,552 (79.5%) |
| Health Technologists | 410 (16.1%) | 2,141 (83.9%) |
| Total (Category) | 7,891 (47.2%) | 8,842 (52.8%) |
| Total (Overall) | 18,867 (50.1%) | 18,782 (49.9%) |
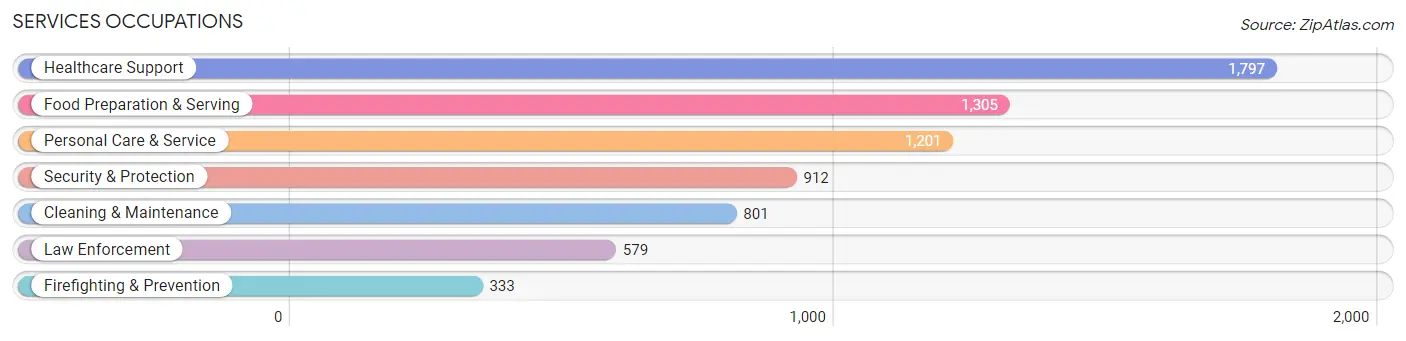
Services Occupations
The most common Services occupations in Missouri City are Healthcare Support (1,797 | 4.8%), Food Preparation & Serving (1,305 | 3.5%), Personal Care & Service (1,201 | 3.2%), Security & Protection (912 | 2.4%), and Cleaning & Maintenance (801 | 2.1%).
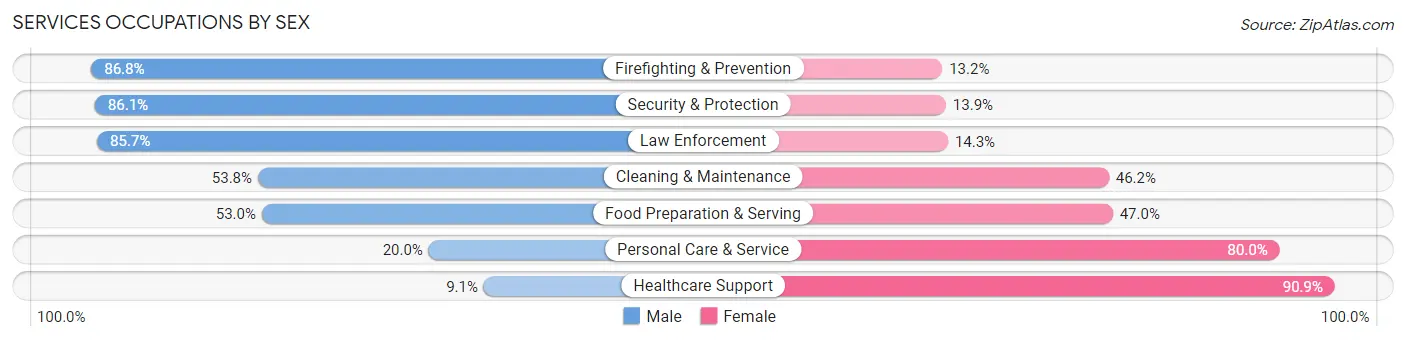
Services Occupations by Sex
Within the Services occupations in Missouri City, the most male-oriented occupations are Firefighting & Prevention (86.8%), Security & Protection (86.1%), and Law Enforcement (85.7%), while the most female-oriented occupations are Healthcare Support (90.9%), Personal Care & Service (80.0%), and Food Preparation & Serving (47.0%).
| Occupation | Male | Female |
| Healthcare Support | 163 (9.1%) | 1,634 (90.9%) |
| Security & Protection | 785 (86.1%) | 127 (13.9%) |
| Firefighting & Prevention | 289 (86.8%) | 44 (13.2%) |
| Law Enforcement | 496 (85.7%) | 83 (14.3%) |
| Food Preparation & Serving | 692 (53.0%) | 613 (47.0%) |
| Cleaning & Maintenance | 431 (53.8%) | 370 (46.2%) |
| Personal Care & Service | 240 (20.0%) | 961 (80.0%) |
| Total (Category) | 2,311 (38.4%) | 3,705 (61.6%) |
| Total (Overall) | 18,867 (50.1%) | 18,782 (49.9%) |
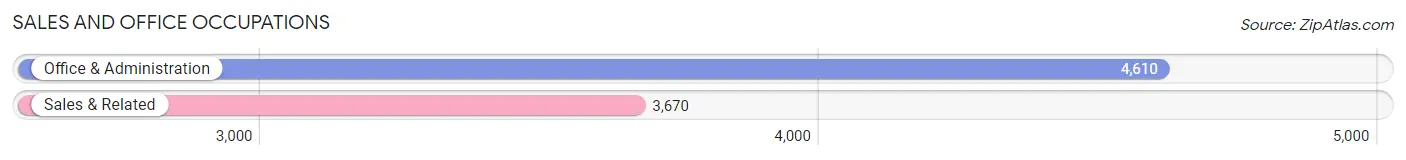
Sales and Office Occupations
The most common Sales and Office occupations in Missouri City are Office & Administration (4,610 | 12.2%), and Sales & Related (3,670 | 9.8%).
Sales and Office Occupations by Sex
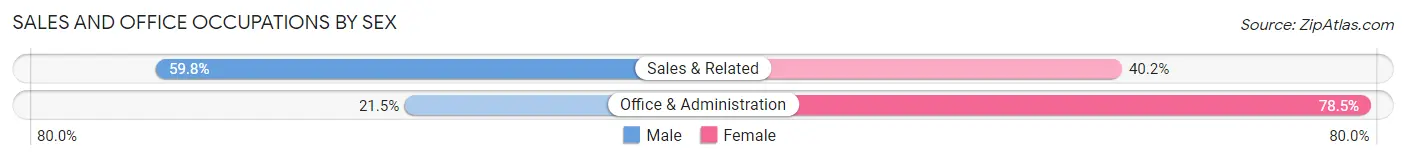
| Occupation | Male | Female |
| Sales & Related | 2,194 (59.8%) | 1,476 (40.2%) |
| Office & Administration | 990 (21.5%) | 3,620 (78.5%) |
| Total (Category) | 3,184 (38.5%) | 5,096 (61.6%) |
| Total (Overall) | 18,867 (50.1%) | 18,782 (49.9%) |
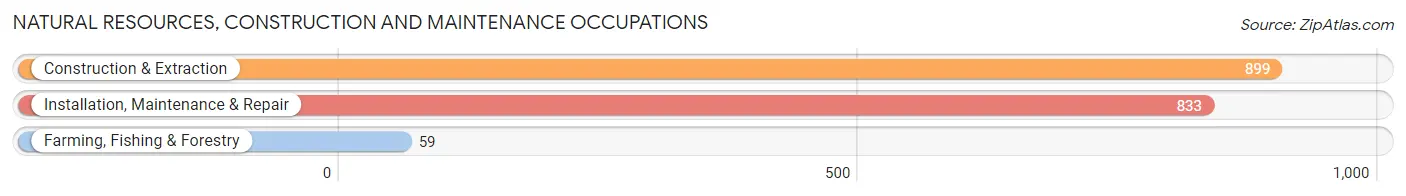
Natural Resources, Construction and Maintenance Occupations
The most common Natural Resources, Construction and Maintenance occupations in Missouri City are Construction & Extraction (899 | 2.4%), Installation, Maintenance & Repair (833 | 2.2%), and Farming, Fishing & Forestry (59 | 0.2%).
Natural Resources, Construction and Maintenance Occupations by Sex
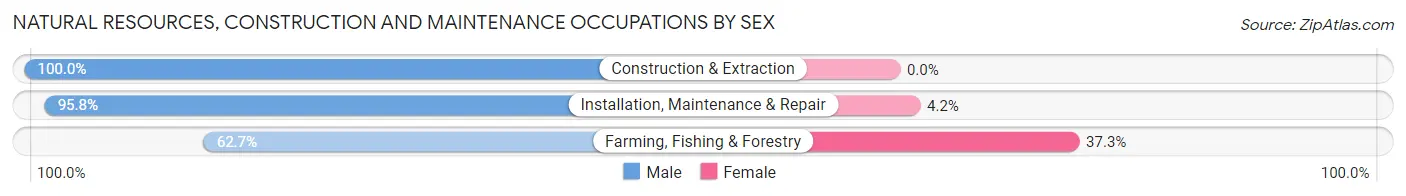
| Occupation | Male | Female |
| Farming, Fishing & Forestry | 37 (62.7%) | 22 (37.3%) |
| Construction & Extraction | 899 (100.0%) | 0 (0.0%) |
| Installation, Maintenance & Repair | 798 (95.8%) | 35 (4.2%) |
| Total (Category) | 1,734 (96.8%) | 57 (3.2%) |
| Total (Overall) | 18,867 (50.1%) | 18,782 (49.9%) |
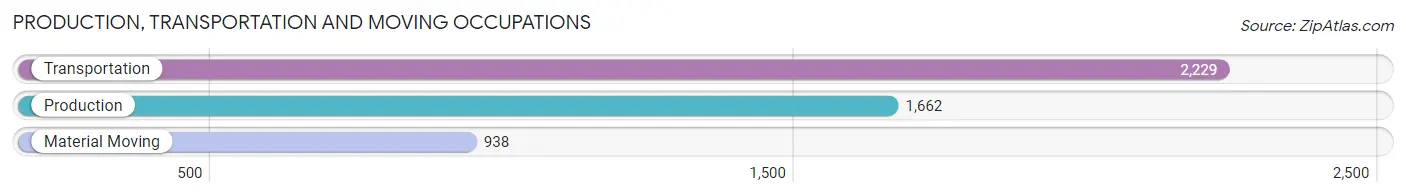
Production, Transportation and Moving Occupations
The most common Production, Transportation and Moving occupations in Missouri City are Transportation (2,229 | 5.9%), Production (1,662 | 4.4%), and Material Moving (938 | 2.5%).
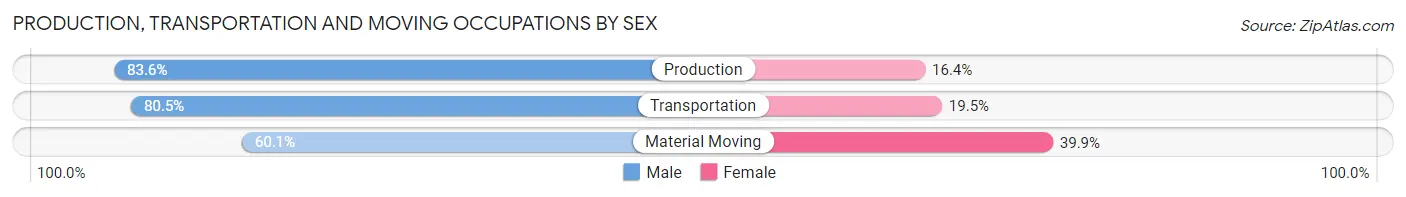
Production, Transportation and Moving Occupations by Sex
| Occupation | Male | Female |
| Production | 1,389 (83.6%) | 273 (16.4%) |
| Transportation | 1,794 (80.5%) | 435 (19.5%) |
| Material Moving | 564 (60.1%) | 374 (39.9%) |
| Total (Category) | 3,747 (77.6%) | 1,082 (22.4%) |
| Total (Overall) | 18,867 (50.1%) | 18,782 (49.9%) |
Employment Industries by Sex in Missouri City
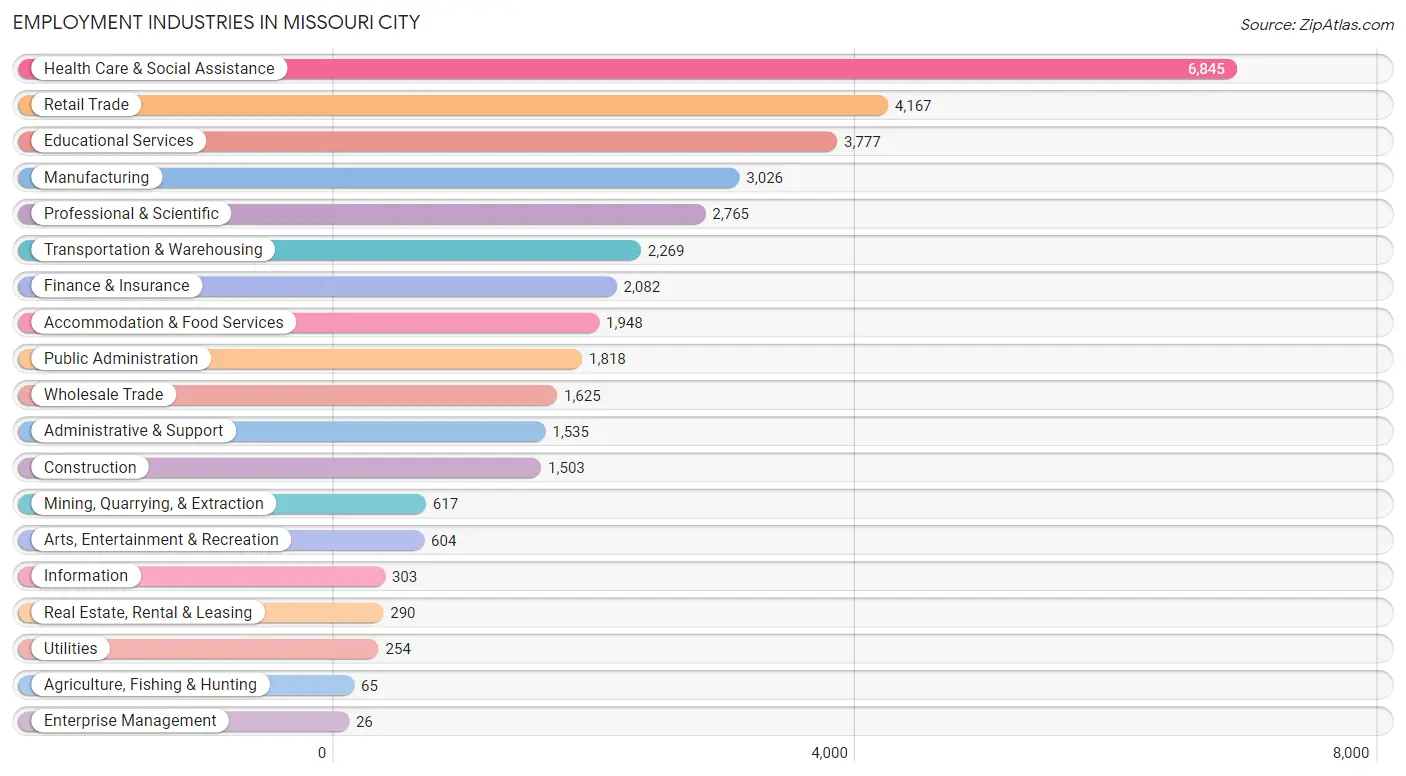
Employment Industries in Missouri City
The major employment industries in Missouri City include Health Care & Social Assistance (6,845 | 18.2%), Retail Trade (4,167 | 11.1%), Educational Services (3,777 | 10.0%), Manufacturing (3,026 | 8.0%), and Professional & Scientific (2,765 | 7.3%).
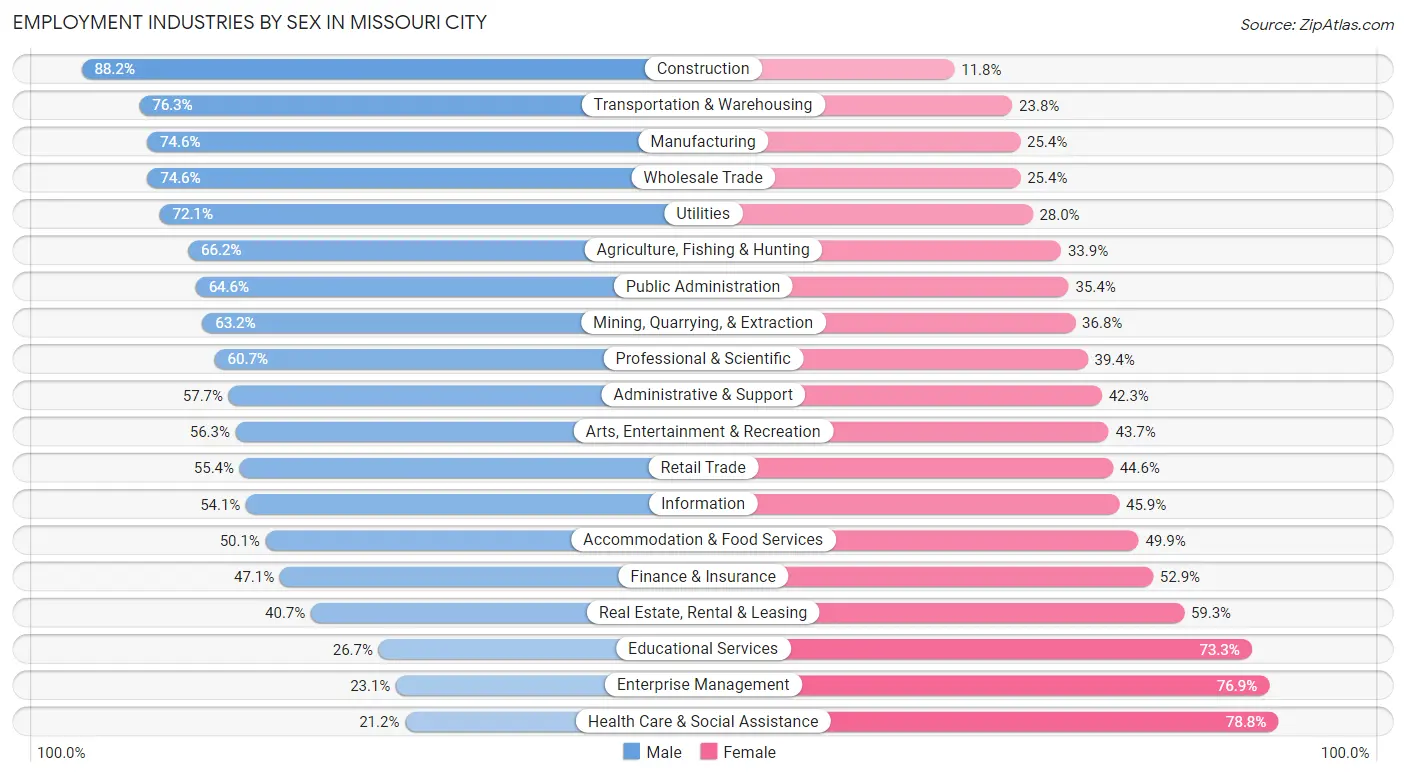
Employment Industries by Sex in Missouri City
The Missouri City industries that see more men than women are Construction (88.2%), Transportation & Warehousing (76.2%), and Manufacturing (74.6%), whereas the industries that tend to have a higher number of women are Health Care & Social Assistance (78.8%), Enterprise Management (76.9%), and Educational Services (73.3%).
| Industry | Male | Female |
| Agriculture, Fishing & Hunting | 43 (66.1%) | 22 (33.9%) |
| Mining, Quarrying, & Extraction | 390 (63.2%) | 227 (36.8%) |
| Construction | 1,326 (88.2%) | 177 (11.8%) |
| Manufacturing | 2,258 (74.6%) | 768 (25.4%) |
| Wholesale Trade | 1,212 (74.6%) | 413 (25.4%) |
| Retail Trade | 2,310 (55.4%) | 1,857 (44.6%) |
| Transportation & Warehousing | 1,730 (76.2%) | 539 (23.7%) |
| Utilities | 183 (72.1%) | 71 (28.0%) |
| Information | 164 (54.1%) | 139 (45.9%) |
| Finance & Insurance | 981 (47.1%) | 1,101 (52.9%) |
| Real Estate, Rental & Leasing | 118 (40.7%) | 172 (59.3%) |
| Professional & Scientific | 1,677 (60.7%) | 1,088 (39.4%) |
| Enterprise Management | 6 (23.1%) | 20 (76.9%) |
| Administrative & Support | 886 (57.7%) | 649 (42.3%) |
| Educational Services | 1,008 (26.7%) | 2,769 (73.3%) |
| Health Care & Social Assistance | 1,452 (21.2%) | 5,393 (78.8%) |
| Arts, Entertainment & Recreation | 340 (56.3%) | 264 (43.7%) |
| Accommodation & Food Services | 976 (50.1%) | 972 (49.9%) |
| Public Administration | 1,174 (64.6%) | 644 (35.4%) |
| Total | 18,867 (50.1%) | 18,782 (49.9%) |
Education in Missouri City
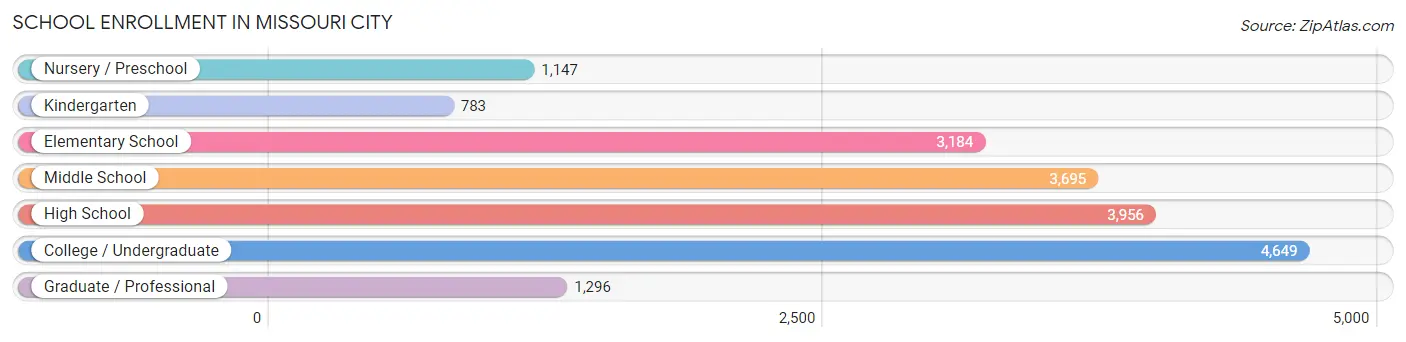
School Enrollment in Missouri City
The most common levels of schooling among the 18,710 students in Missouri City are college / undergraduate (4,649 | 24.8%), high school (3,956 | 21.1%), and middle school (3,695 | 19.8%).
| School Level | # Students | % Students |
| Nursery / Preschool | 1,147 | 6.1% |
| Kindergarten | 783 | 4.2% |
| Elementary School | 3,184 | 17.0% |
| Middle School | 3,695 | 19.8% |
| High School | 3,956 | 21.1% |
| College / Undergraduate | 4,649 | 24.8% |
| Graduate / Professional | 1,296 | 6.9% |
| Total | 18,710 | 100.0% |
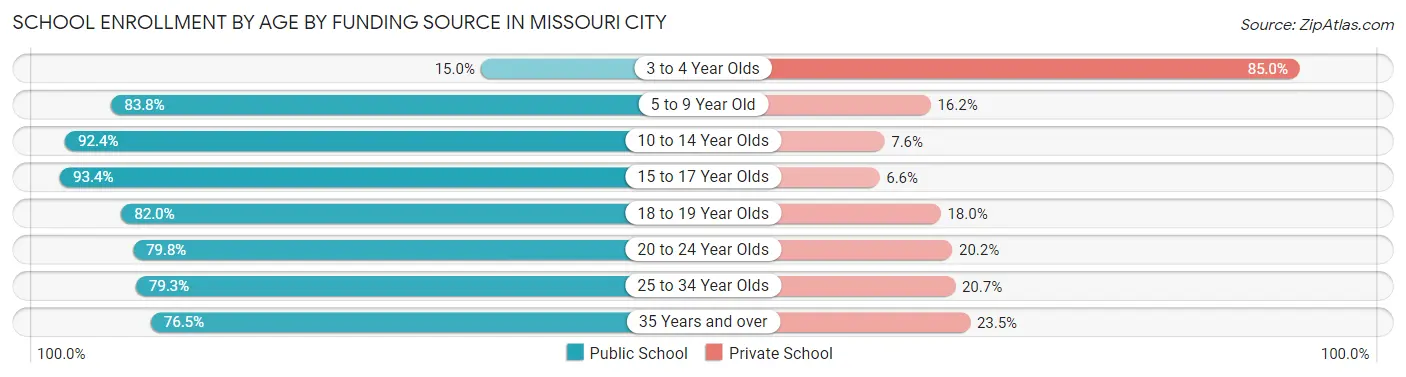
School Enrollment by Age by Funding Source in Missouri City
Out of a total of 18,710 students who are enrolled in schools in Missouri City, 3,349 (17.9%) attend a private institution, while the remaining 15,361 (82.1%) are enrolled in public schools. The age group of 3 to 4 year olds has the highest likelihood of being enrolled in private schools, with 842 (85.0% in the age bracket) enrolled. Conversely, the age group of 15 to 17 year olds has the lowest likelihood of being enrolled in a private school, with 2,660 (93.4% in the age bracket) attending a public institution.
| Age Bracket | Public School | Private School |
| 3 to 4 Year Olds | 149 (15.0%) | 842 (85.0%) |
| 5 to 9 Year Old | 3,162 (83.8%) | 610 (16.2%) |
| 10 to 14 Year Olds | 4,096 (92.4%) | 335 (7.6%) |
| 15 to 17 Year Olds | 2,660 (93.4%) | 189 (6.6%) |
| 18 to 19 Year Olds | 1,141 (82.0%) | 251 (18.0%) |
| 20 to 24 Year Olds | 1,830 (79.8%) | 463 (20.2%) |
| 25 to 34 Year Olds | 1,147 (79.3%) | 300 (20.7%) |
| 35 Years and over | 1,174 (76.5%) | 361 (23.5%) |
| Total | 15,361 (82.1%) | 3,349 (17.9%) |
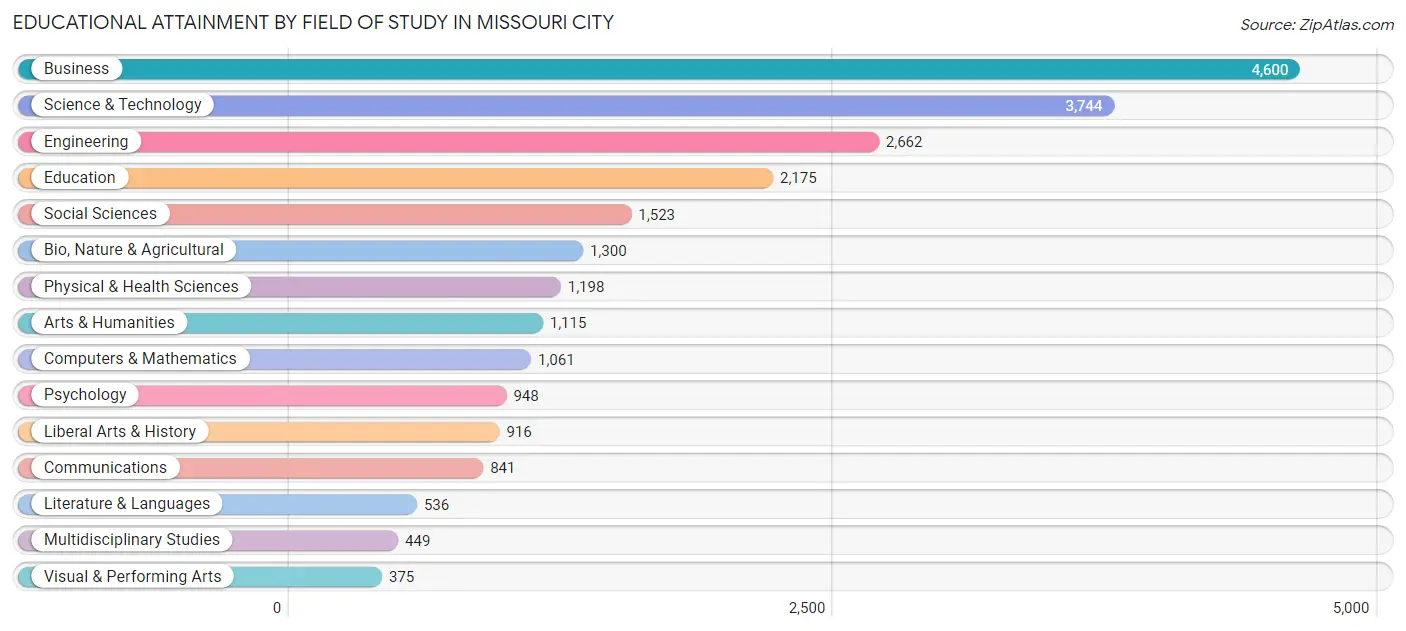
Educational Attainment by Field of Study in Missouri City
Business (4,600 | 19.6%), science & technology (3,744 | 16.0%), engineering (2,662 | 11.4%), education (2,175 | 9.3%), and social sciences (1,523 | 6.5%) are the most common fields of study among 23,443 individuals in Missouri City who have obtained a bachelor's degree or higher.
| Field of Study | # Graduates | % Graduates |
| Computers & Mathematics | 1,061 | 4.5% |
| Bio, Nature & Agricultural | 1,300 | 5.6% |
| Physical & Health Sciences | 1,198 | 5.1% |
| Psychology | 948 | 4.0% |
| Social Sciences | 1,523 | 6.5% |
| Engineering | 2,662 | 11.4% |
| Multidisciplinary Studies | 449 | 1.9% |
| Science & Technology | 3,744 | 16.0% |
| Business | 4,600 | 19.6% |
| Education | 2,175 | 9.3% |
| Literature & Languages | 536 | 2.3% |
| Liberal Arts & History | 916 | 3.9% |
| Visual & Performing Arts | 375 | 1.6% |
| Communications | 841 | 3.6% |
| Arts & Humanities | 1,115 | 4.8% |
| Total | 23,443 | 100.0% |
Transportation & Commute in Missouri City
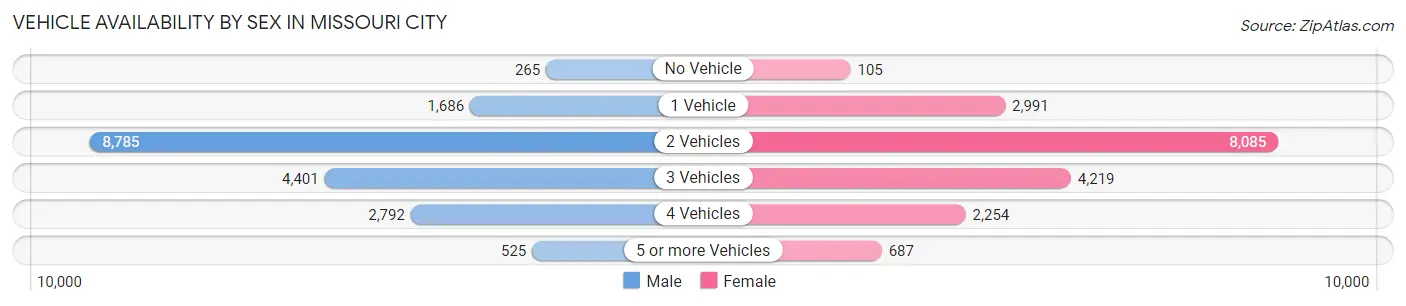
Vehicle Availability by Sex in Missouri City
The most prevalent vehicle ownership categories in Missouri City are males with 2 vehicles (8,785, accounting for 47.6%) and females with 2 vehicles (8,085, making up 47.9%).
| Vehicles Available | Male | Female |
| No Vehicle | 265 (1.4%) | 105 (0.6%) |
| 1 Vehicle | 1,686 (9.1%) | 2,991 (16.3%) |
| 2 Vehicles | 8,785 (47.6%) | 8,085 (44.1%) |
| 3 Vehicles | 4,401 (23.8%) | 4,219 (23.0%) |
| 4 Vehicles | 2,792 (15.1%) | 2,254 (12.3%) |
| 5 or more Vehicles | 525 (2.8%) | 687 (3.7%) |
| Total | 18,454 (100.0%) | 18,341 (100.0%) |
Commute Time in Missouri City
The most frequently occuring commute durations in Missouri City are 30 to 34 minutes (7,648 commuters, 23.3%), 20 to 24 minutes (4,219 commuters, 12.8%), and 45 to 59 minutes (4,104 commuters, 12.5%).
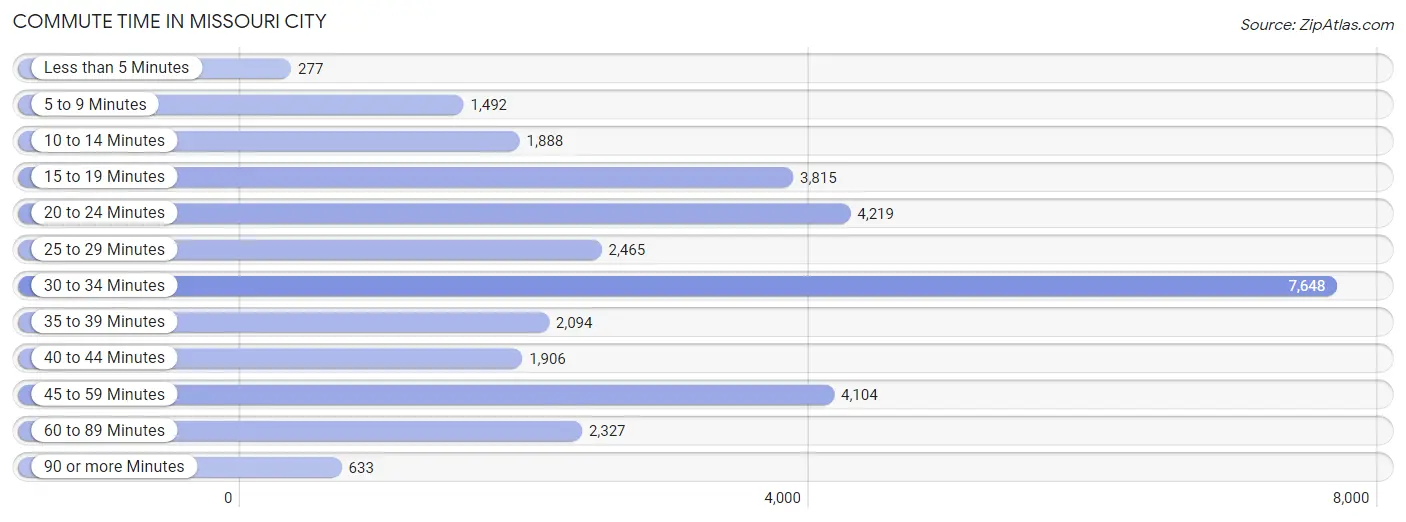
| Commute Time | # Commuters | % Commuters |
| Less than 5 Minutes | 277 | 0.8% |
| 5 to 9 Minutes | 1,492 | 4.5% |
| 10 to 14 Minutes | 1,888 | 5.7% |
| 15 to 19 Minutes | 3,815 | 11.6% |
| 20 to 24 Minutes | 4,219 | 12.8% |
| 25 to 29 Minutes | 2,465 | 7.5% |
| 30 to 34 Minutes | 7,648 | 23.3% |
| 35 to 39 Minutes | 2,094 | 6.4% |
| 40 to 44 Minutes | 1,906 | 5.8% |
| 45 to 59 Minutes | 4,104 | 12.5% |
| 60 to 89 Minutes | 2,327 | 7.1% |
| 90 or more Minutes | 633 | 1.9% |
Commute Time by Sex in Missouri City
The most common commute times in Missouri City are 30 to 34 minutes (3,522 commuters, 21.0%) for males and 30 to 34 minutes (4,126 commuters, 25.6%) for females.
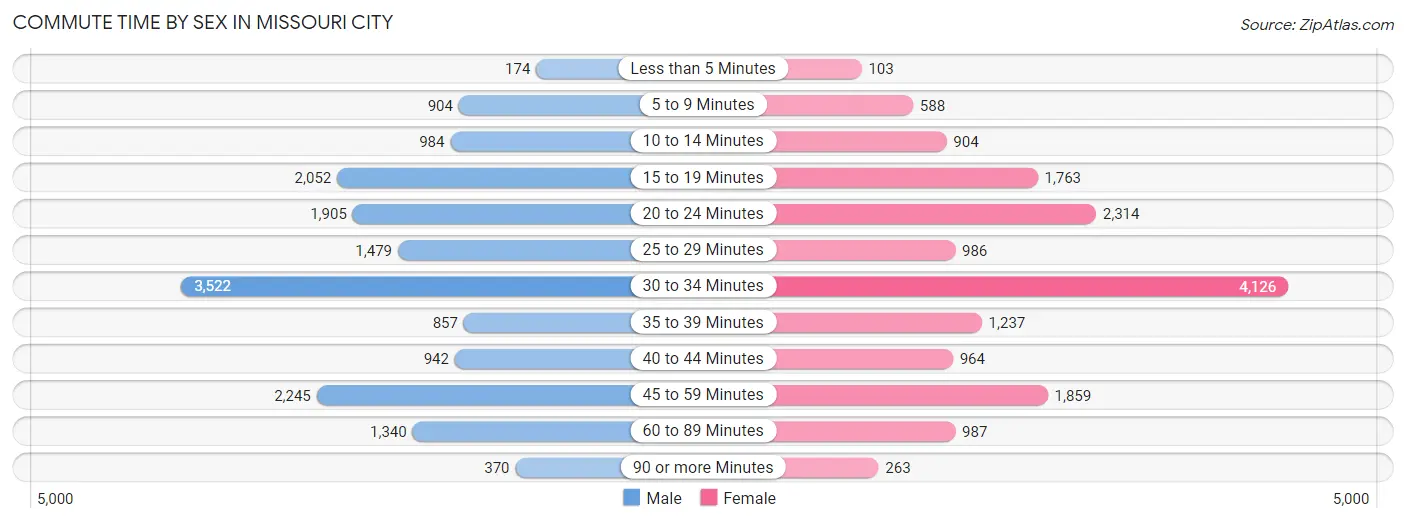
| Commute Time | Male | Female |
| Less than 5 Minutes | 174 (1.0%) | 103 (0.6%) |
| 5 to 9 Minutes | 904 (5.4%) | 588 (3.6%) |
| 10 to 14 Minutes | 984 (5.9%) | 904 (5.6%) |
| 15 to 19 Minutes | 2,052 (12.2%) | 1,763 (11.0%) |
| 20 to 24 Minutes | 1,905 (11.4%) | 2,314 (14.4%) |
| 25 to 29 Minutes | 1,479 (8.8%) | 986 (6.1%) |
| 30 to 34 Minutes | 3,522 (21.0%) | 4,126 (25.6%) |
| 35 to 39 Minutes | 857 (5.1%) | 1,237 (7.7%) |
| 40 to 44 Minutes | 942 (5.6%) | 964 (6.0%) |
| 45 to 59 Minutes | 2,245 (13.4%) | 1,859 (11.6%) |
| 60 to 89 Minutes | 1,340 (8.0%) | 987 (6.1%) |
| 90 or more Minutes | 370 (2.2%) | 263 (1.6%) |
Time of Departure to Work by Sex in Missouri City
The most frequent times of departure to work in Missouri City are 7:00 AM to 7:29 AM (2,993, 17.8%) for males and 7:00 AM to 7:29 AM (2,803, 17.4%) for females.
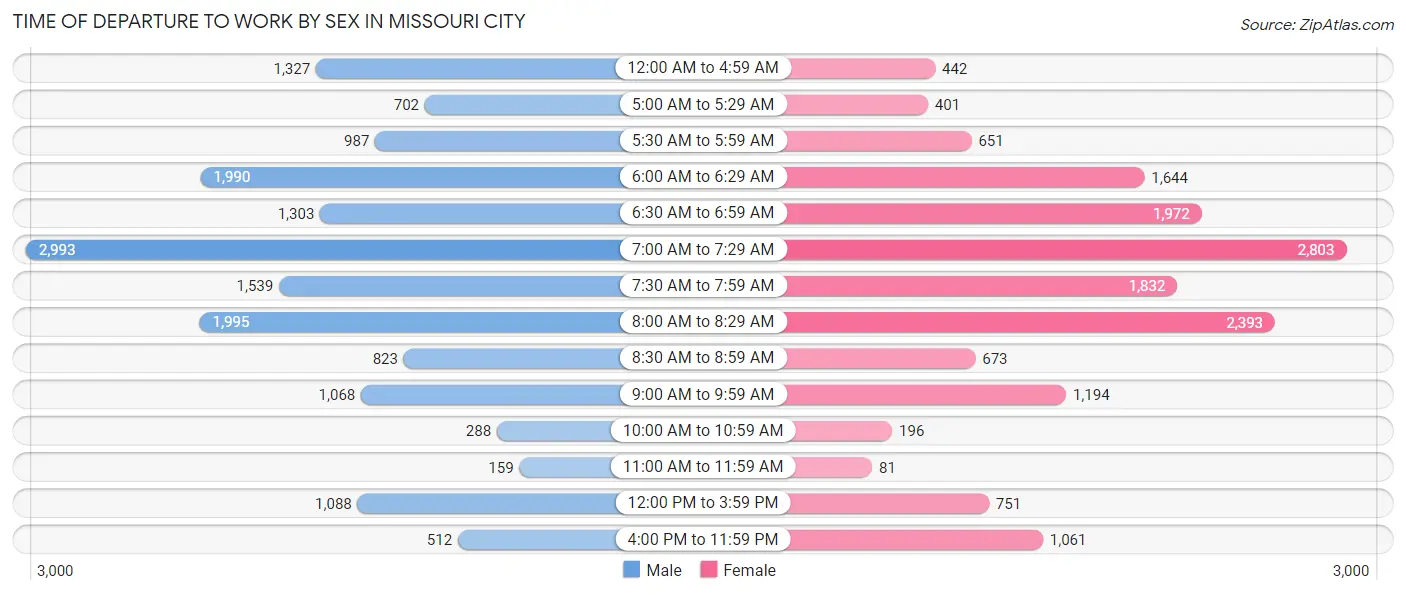
| Time of Departure | Male | Female |
| 12:00 AM to 4:59 AM | 1,327 (7.9%) | 442 (2.8%) |
| 5:00 AM to 5:29 AM | 702 (4.2%) | 401 (2.5%) |
| 5:30 AM to 5:59 AM | 987 (5.9%) | 651 (4.0%) |
| 6:00 AM to 6:29 AM | 1,990 (11.9%) | 1,644 (10.2%) |
| 6:30 AM to 6:59 AM | 1,303 (7.8%) | 1,972 (12.2%) |
| 7:00 AM to 7:29 AM | 2,993 (17.8%) | 2,803 (17.4%) |
| 7:30 AM to 7:59 AM | 1,539 (9.2%) | 1,832 (11.4%) |
| 8:00 AM to 8:29 AM | 1,995 (11.9%) | 2,393 (14.9%) |
| 8:30 AM to 8:59 AM | 823 (4.9%) | 673 (4.2%) |
| 9:00 AM to 9:59 AM | 1,068 (6.4%) | 1,194 (7.4%) |
| 10:00 AM to 10:59 AM | 288 (1.7%) | 196 (1.2%) |
| 11:00 AM to 11:59 AM | 159 (0.9%) | 81 (0.5%) |
| 12:00 PM to 3:59 PM | 1,088 (6.5%) | 751 (4.7%) |
| 4:00 PM to 11:59 PM | 512 (3.0%) | 1,061 (6.6%) |
| Total | 16,774 (100.0%) | 16,094 (100.0%) |
Housing Occupancy in Missouri City
Occupancy by Ownership in Missouri City
Of the total 26,072 dwellings in Missouri City, owner-occupied units account for 20,877 (80.1%), while renter-occupied units make up 5,195 (19.9%).
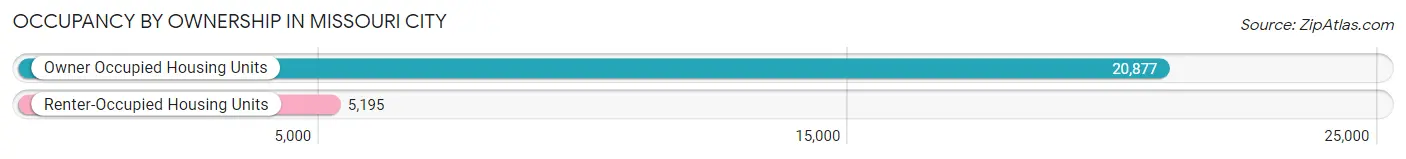
| Occupancy | # Housing Units | % Housing Units |
| Owner Occupied Housing Units | 20,877 | 80.1% |
| Renter-Occupied Housing Units | 5,195 | 19.9% |
| Total Occupied Housing Units | 26,072 | 100.0% |
Occupancy by Household Size in Missouri City
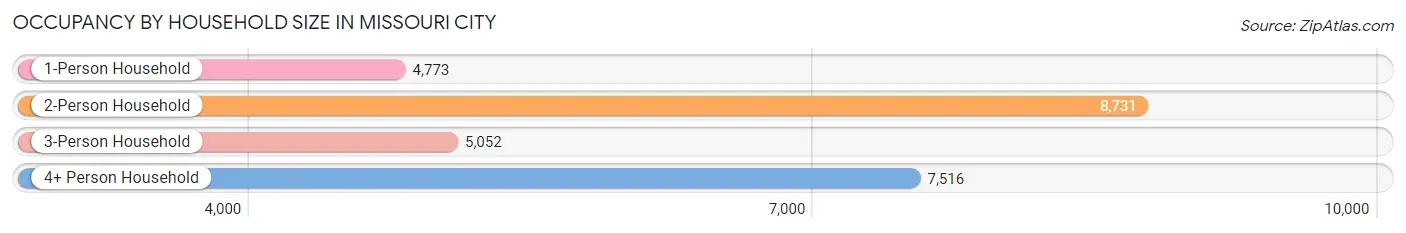
| Household Size | # Housing Units | % Housing Units |
| 1-Person Household | 4,773 | 18.3% |
| 2-Person Household | 8,731 | 33.5% |
| 3-Person Household | 5,052 | 19.4% |
| 4+ Person Household | 7,516 | 28.8% |
| Total Housing Units | 26,072 | 100.0% |
Occupancy by Ownership by Household Size in Missouri City
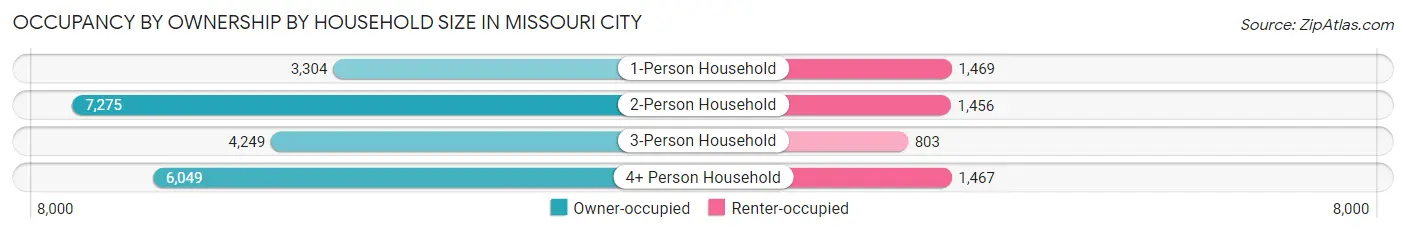
| Household Size | Owner-occupied | Renter-occupied |
| 1-Person Household | 3,304 (69.2%) | 1,469 (30.8%) |
| 2-Person Household | 7,275 (83.3%) | 1,456 (16.7%) |
| 3-Person Household | 4,249 (84.1%) | 803 (15.9%) |
| 4+ Person Household | 6,049 (80.5%) | 1,467 (19.5%) |
| Total Housing Units | 20,877 (80.1%) | 5,195 (19.9%) |
Occupancy by Educational Attainment in Missouri City
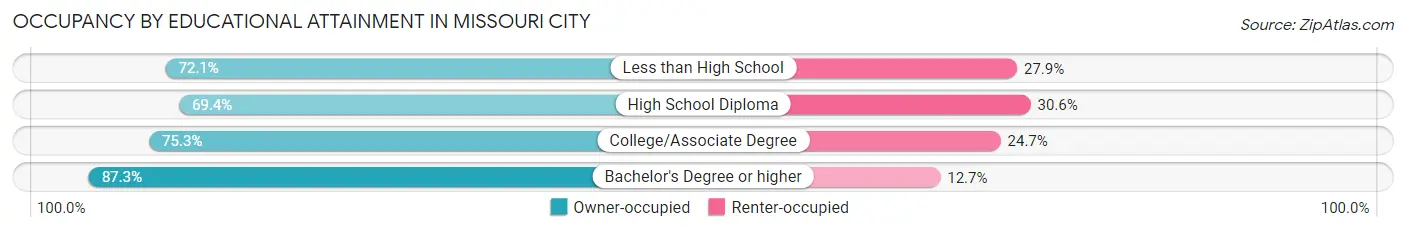
| Household Size | Owner-occupied | Renter-occupied |
| Less than High School | 947 (72.1%) | 367 (27.9%) |
| High School Diploma | 2,974 (69.4%) | 1,312 (30.6%) |
| College/Associate Degree | 5,751 (75.3%) | 1,883 (24.7%) |
| Bachelor's Degree or higher | 11,205 (87.3%) | 1,633 (12.7%) |
Occupancy by Age of Householder in Missouri City
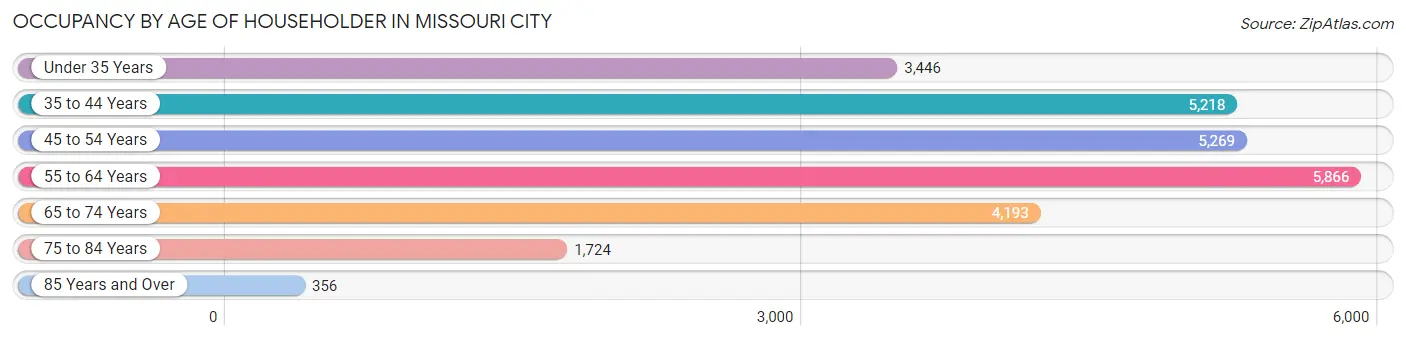
| Age Bracket | # Households | % Households |
| Under 35 Years | 3,446 | 13.2% |
| 35 to 44 Years | 5,218 | 20.0% |
| 45 to 54 Years | 5,269 | 20.2% |
| 55 to 64 Years | 5,866 | 22.5% |
| 65 to 74 Years | 4,193 | 16.1% |
| 75 to 84 Years | 1,724 | 6.6% |
| 85 Years and Over | 356 | 1.4% |
| Total | 26,072 | 100.0% |
Housing Finances in Missouri City
Median Income by Occupancy in Missouri City
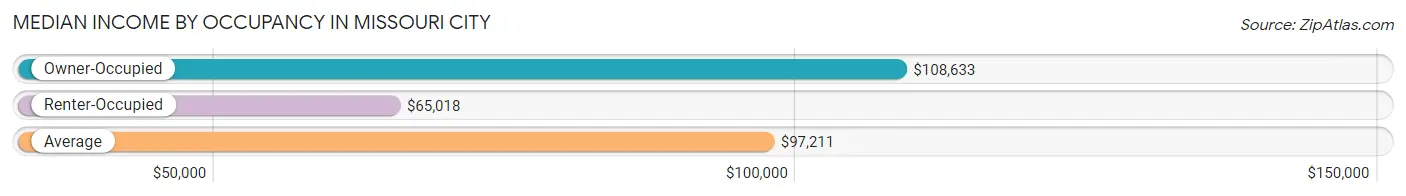
| Occupancy Type | # Households | Median Income |
| Owner-Occupied | 20,877 (80.1%) | $108,633 |
| Renter-Occupied | 5,195 (19.9%) | $65,018 |
| Average | 26,072 (100.0%) | $97,211 |
Occupancy by Householder Income Bracket in Missouri City
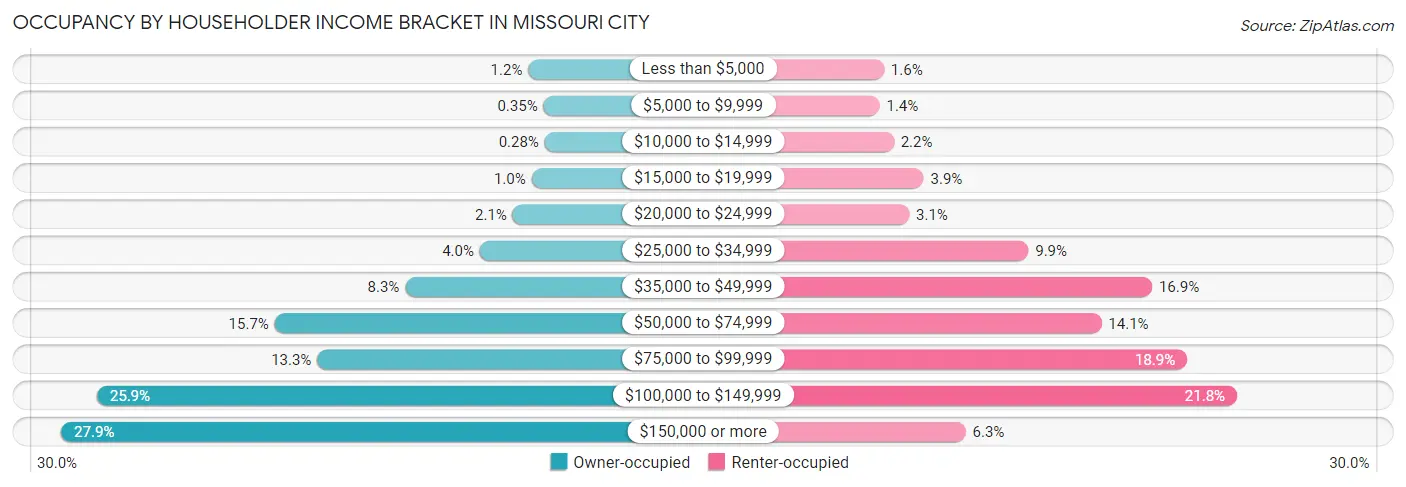
| Income Bracket | Owner-occupied | Renter-occupied |
| Less than $5,000 | 255 (1.2%) | 84 (1.6%) |
| $5,000 to $9,999 | 74 (0.4%) | 71 (1.4%) |
| $10,000 to $14,999 | 59 (0.3%) | 113 (2.2%) |
| $15,000 to $19,999 | 214 (1.0%) | 202 (3.9%) |
| $20,000 to $24,999 | 440 (2.1%) | 159 (3.1%) |
| $25,000 to $34,999 | 833 (4.0%) | 513 (9.9%) |
| $35,000 to $49,999 | 1,723 (8.3%) | 880 (16.9%) |
| $50,000 to $74,999 | 3,279 (15.7%) | 730 (14.1%) |
| $75,000 to $99,999 | 2,773 (13.3%) | 984 (18.9%) |
| $100,000 to $149,999 | 5,400 (25.9%) | 1,132 (21.8%) |
| $150,000 or more | 5,827 (27.9%) | 327 (6.3%) |
| Total | 20,877 (100.0%) | 5,195 (100.0%) |
Monthly Housing Cost Tiers in Missouri City
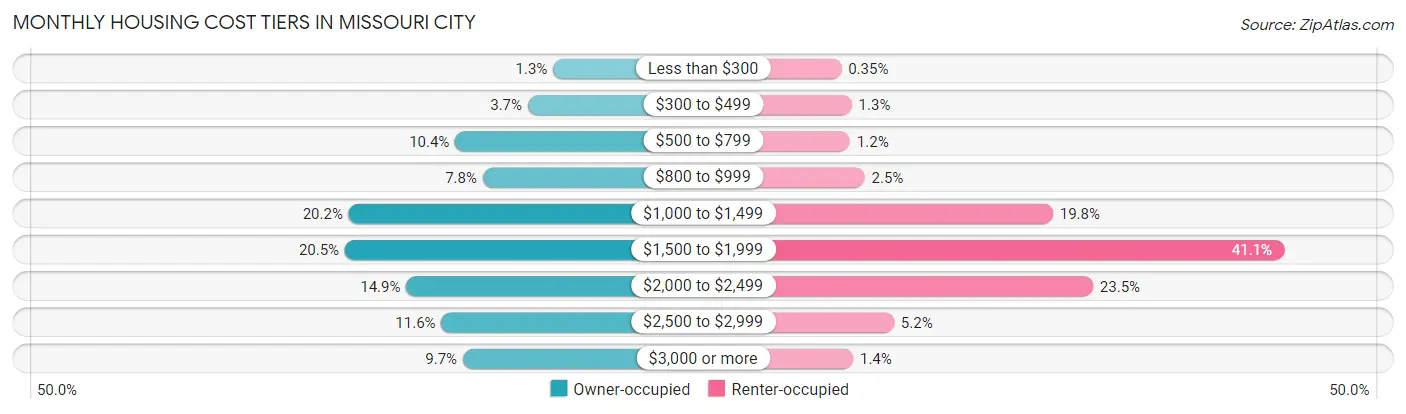
| Monthly Cost | Owner-occupied | Renter-occupied |
| Less than $300 | 279 (1.3%) | 18 (0.4%) |
| $300 to $499 | 767 (3.7%) | 68 (1.3%) |
| $500 to $799 | 2,162 (10.4%) | 60 (1.1%) |
| $800 to $999 | 1,633 (7.8%) | 130 (2.5%) |
| $1,000 to $1,499 | 4,209 (20.2%) | 1,030 (19.8%) |
| $1,500 to $1,999 | 4,282 (20.5%) | 2,135 (41.1%) |
| $2,000 to $2,499 | 3,102 (14.9%) | 1,222 (23.5%) |
| $2,500 to $2,999 | 2,428 (11.6%) | 270 (5.2%) |
| $3,000 or more | 2,015 (9.7%) | 75 (1.4%) |
| Total | 20,877 (100.0%) | 5,195 (100.0%) |
Physical Housing Characteristics in Missouri City
Housing Structures in Missouri City
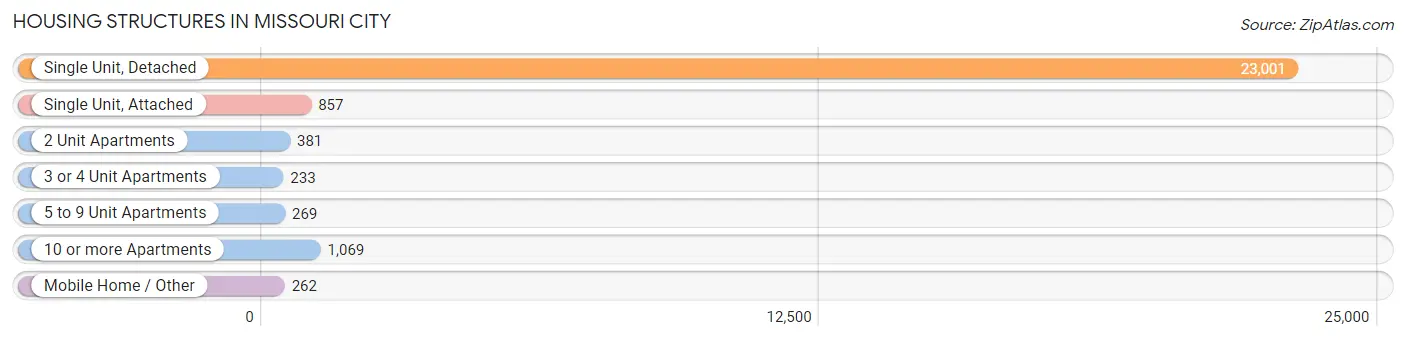
| Structure Type | # Housing Units | % Housing Units |
| Single Unit, Detached | 23,001 | 88.2% |
| Single Unit, Attached | 857 | 3.3% |
| 2 Unit Apartments | 381 | 1.5% |
| 3 or 4 Unit Apartments | 233 | 0.9% |
| 5 to 9 Unit Apartments | 269 | 1.0% |
| 10 or more Apartments | 1,069 | 4.1% |
| Mobile Home / Other | 262 | 1.0% |
| Total | 26,072 | 100.0% |
Housing Structures by Occupancy in Missouri City
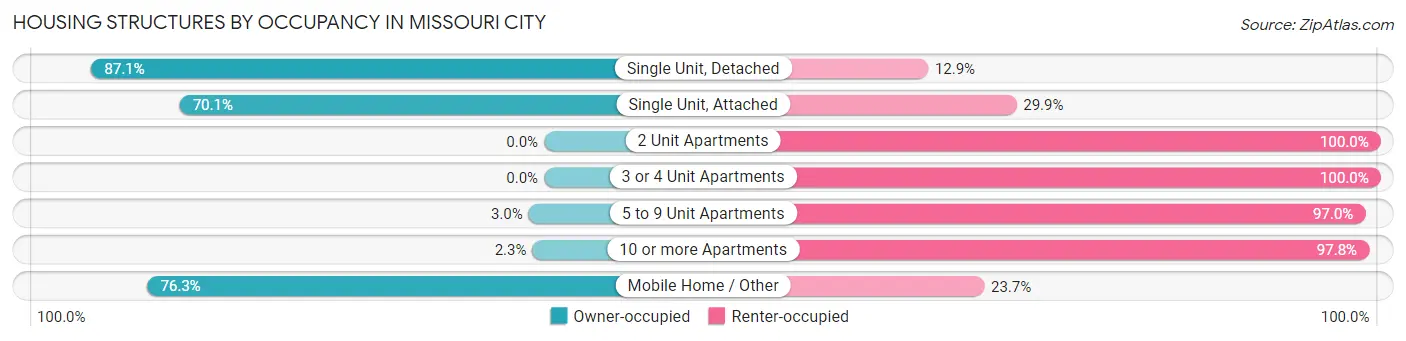
| Structure Type | Owner-occupied | Renter-occupied |
| Single Unit, Detached | 20,044 (87.1%) | 2,957 (12.9%) |
| Single Unit, Attached | 601 (70.1%) | 256 (29.9%) |
| 2 Unit Apartments | 0 (0.0%) | 381 (100.0%) |
| 3 or 4 Unit Apartments | 0 (0.0%) | 233 (100.0%) |
| 5 to 9 Unit Apartments | 8 (3.0%) | 261 (97.0%) |
| 10 or more Apartments | 24 (2.2%) | 1,045 (97.8%) |
| Mobile Home / Other | 200 (76.3%) | 62 (23.7%) |
| Total | 20,877 (80.1%) | 5,195 (19.9%) |
Housing Structures by Number of Rooms in Missouri City
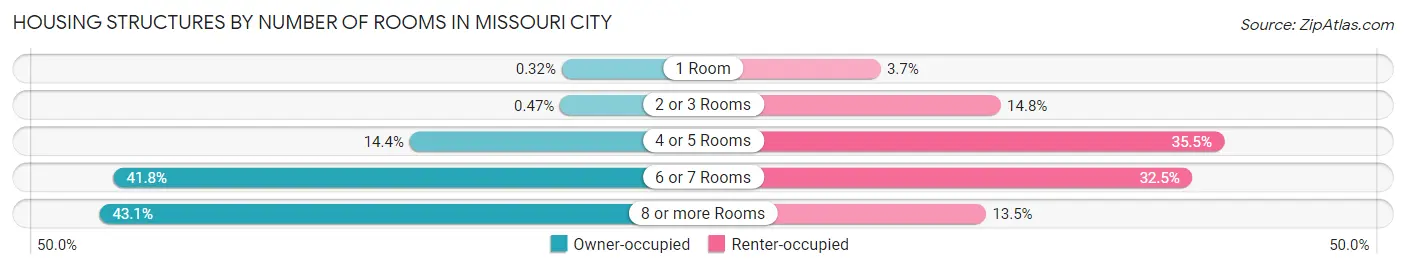
| Number of Rooms | Owner-occupied | Renter-occupied |
| 1 Room | 67 (0.3%) | 192 (3.7%) |
| 2 or 3 Rooms | 98 (0.5%) | 770 (14.8%) |
| 4 or 5 Rooms | 3,002 (14.4%) | 1,844 (35.5%) |
| 6 or 7 Rooms | 8,718 (41.8%) | 1,690 (32.5%) |
| 8 or more Rooms | 8,992 (43.1%) | 699 (13.5%) |
| Total | 20,877 (100.0%) | 5,195 (100.0%) |
Housing Structure by Heating Type in Missouri City
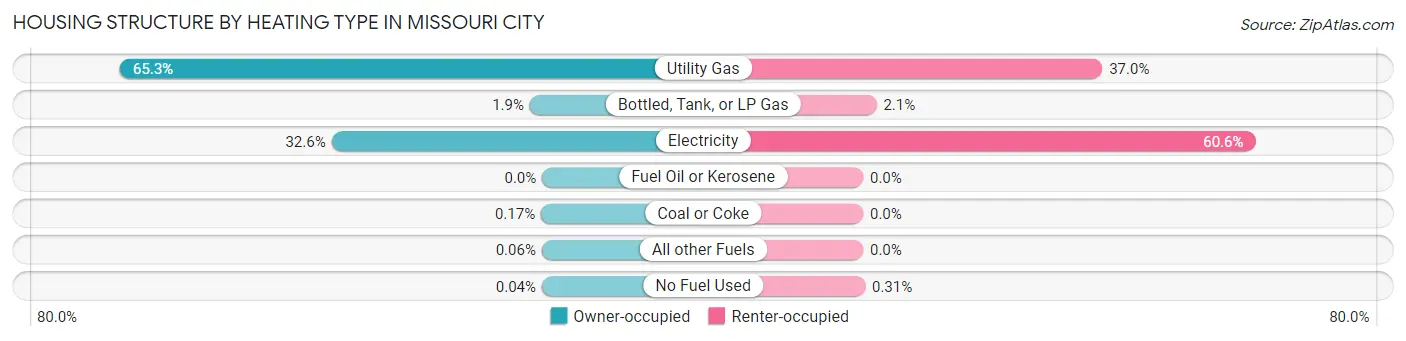
| Heating Type | Owner-occupied | Renter-occupied |
| Utility Gas | 13,625 (65.3%) | 1,921 (37.0%) |
| Bottled, Tank, or LP Gas | 397 (1.9%) | 108 (2.1%) |
| Electricity | 6,797 (32.6%) | 3,150 (60.6%) |
| Fuel Oil or Kerosene | 0 (0.0%) | 0 (0.0%) |
| Coal or Coke | 36 (0.2%) | 0 (0.0%) |
| All other Fuels | 13 (0.1%) | 0 (0.0%) |
| No Fuel Used | 9 (0.0%) | 16 (0.3%) |
| Total | 20,877 (100.0%) | 5,195 (100.0%) |
Household Vehicle Usage in Missouri City
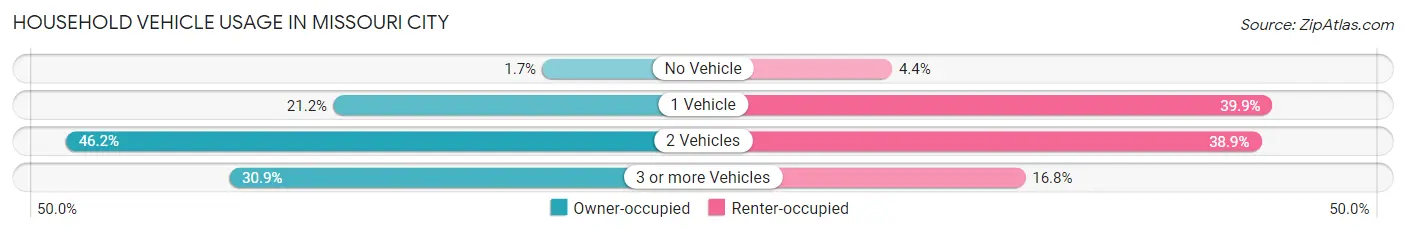
| Vehicles per Household | Owner-occupied | Renter-occupied |
| No Vehicle | 358 (1.7%) | 228 (4.4%) |
| 1 Vehicle | 4,431 (21.2%) | 2,073 (39.9%) |
| 2 Vehicles | 9,636 (46.2%) | 2,019 (38.9%) |
| 3 or more Vehicles | 6,452 (30.9%) | 875 (16.8%) |
| Total | 20,877 (100.0%) | 5,195 (100.0%) |
Real Estate & Mortgages in Missouri City
Real Estate and Mortgage Overview in Missouri City
| Characteristic | Without Mortgage | With Mortgage |
| Housing Units | 7,230 | 13,647 |
| Median Property Value | $264,500 | $270,500 |
| Median Household Income | $95,368 | $4,080 |
| Monthly Housing Costs | $888 | $1,975 |
| Real Estate Taxes | $5,242 | $168 |
Property Value by Mortgage Status in Missouri City
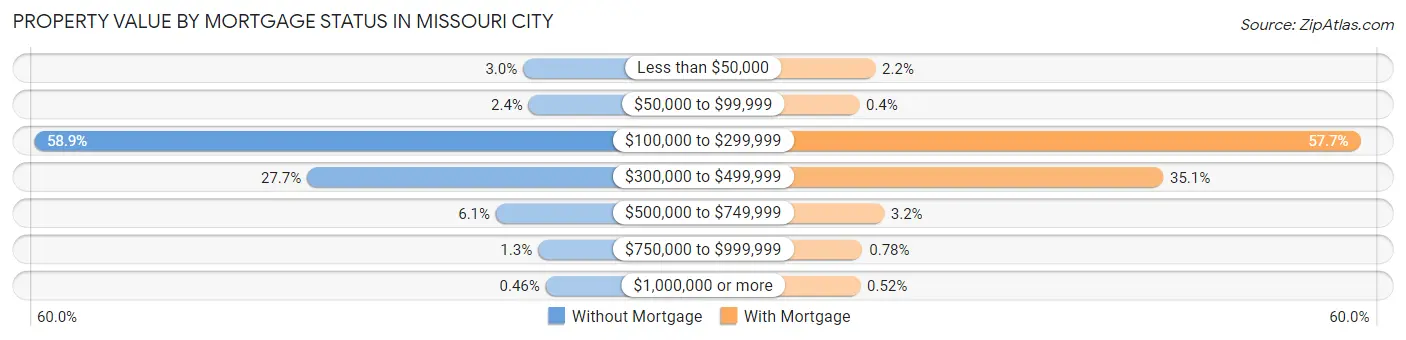
| Property Value | Without Mortgage | With Mortgage |
| Less than $50,000 | 219 (3.0%) | 306 (2.2%) |
| $50,000 to $99,999 | 173 (2.4%) | 54 (0.4%) |
| $100,000 to $299,999 | 4,261 (58.9%) | 7,874 (57.7%) |
| $300,000 to $499,999 | 2,004 (27.7%) | 4,795 (35.1%) |
| $500,000 to $749,999 | 444 (6.1%) | 441 (3.2%) |
| $750,000 to $999,999 | 96 (1.3%) | 106 (0.8%) |
| $1,000,000 or more | 33 (0.5%) | 71 (0.5%) |
| Total | 7,230 (100.0%) | 13,647 (100.0%) |
Household Income by Mortgage Status in Missouri City
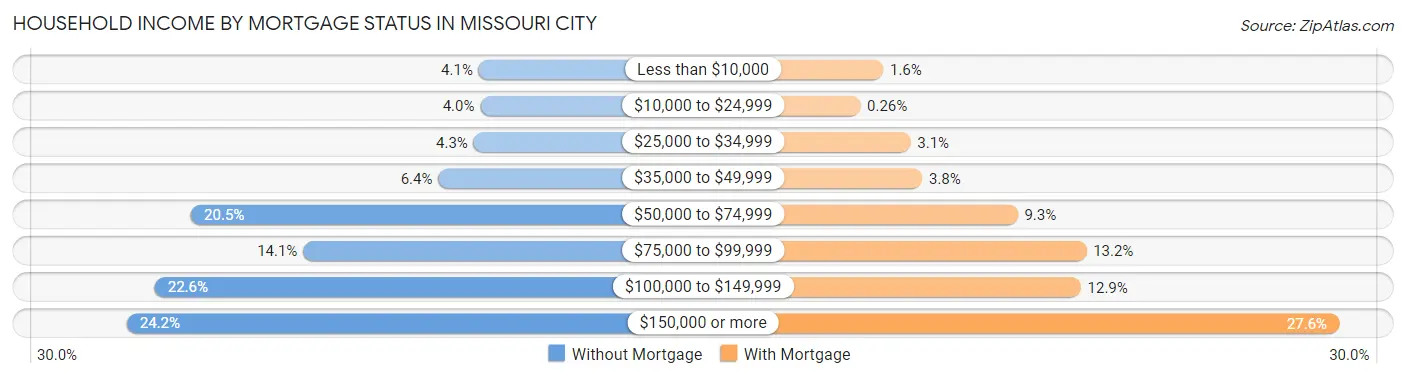
| Household Income | Without Mortgage | With Mortgage |
| Less than $10,000 | 293 (4.1%) | 214 (1.6%) |
| $10,000 to $24,999 | 286 (4.0%) | 36 (0.3%) |
| $25,000 to $34,999 | 314 (4.3%) | 427 (3.1%) |
| $35,000 to $49,999 | 460 (6.4%) | 519 (3.8%) |
| $50,000 to $74,999 | 1,481 (20.5%) | 1,263 (9.2%) |
| $75,000 to $99,999 | 1,018 (14.1%) | 1,798 (13.2%) |
| $100,000 to $149,999 | 1,631 (22.6%) | 1,755 (12.9%) |
| $150,000 or more | 1,747 (24.2%) | 3,769 (27.6%) |
| Total | 7,230 (100.0%) | 13,647 (100.0%) |
Property Value to Household Income Ratio in Missouri City
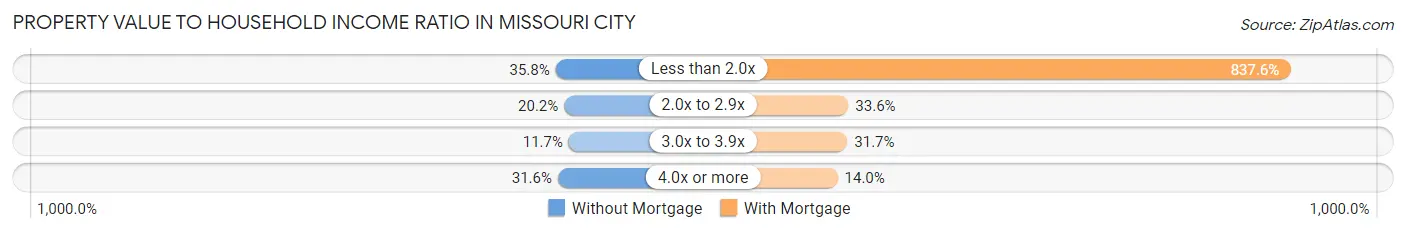
| Value-to-Income Ratio | Without Mortgage | With Mortgage |
| Less than 2.0x | 2,587 (35.8%) | 114,304 (837.6%) |
| 2.0x to 2.9x | 1,457 (20.2%) | 4,585 (33.6%) |
| 3.0x to 3.9x | 842 (11.7%) | 4,328 (31.7%) |
| 4.0x or more | 2,286 (31.6%) | 1,906 (14.0%) |
| Total | 7,230 (100.0%) | 13,647 (100.0%) |
Real Estate Taxes by Mortgage Status in Missouri City
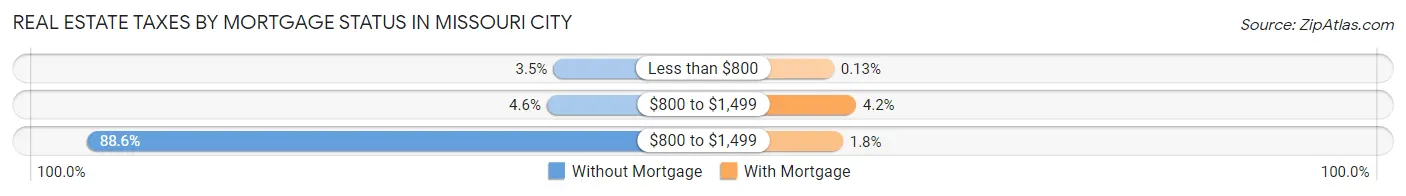
| Property Taxes | Without Mortgage | With Mortgage |
| Less than $800 | 250 (3.5%) | 18 (0.1%) |
| $800 to $1,499 | 335 (4.6%) | 568 (4.2%) |
| $800 to $1,499 | 6,409 (88.6%) | 243 (1.8%) |
| Total | 7,230 (100.0%) | 13,647 (100.0%) |
Health & Disability in Missouri City
Health Insurance Coverage by Age in Missouri City
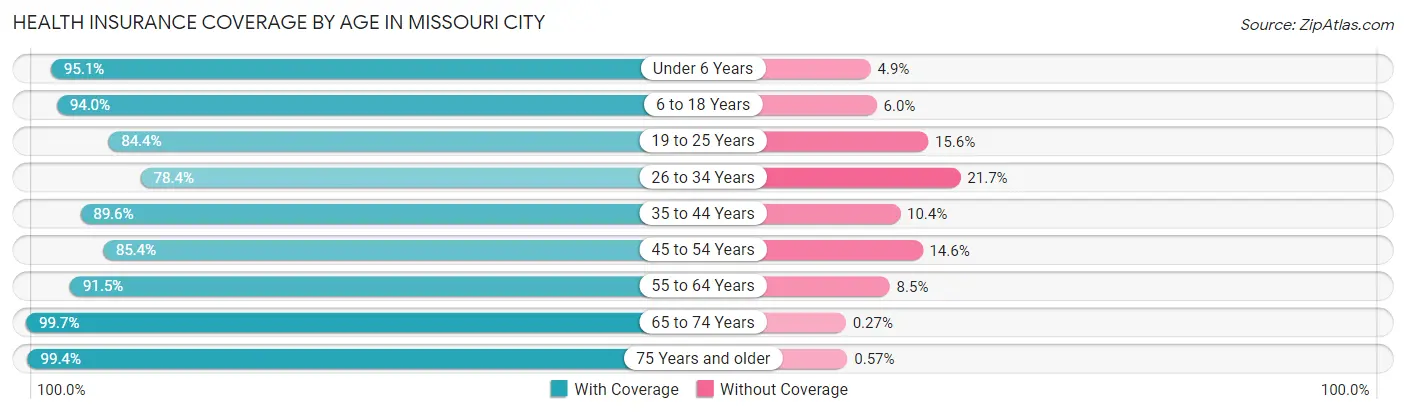
| Age Bracket | With Coverage | Without Coverage |
| Under 6 Years | 5,208 (95.1%) | 269 (4.9%) |
| 6 to 18 Years | 10,702 (94.0%) | 685 (6.0%) |
| 19 to 25 Years | 6,036 (84.4%) | 1,117 (15.6%) |
| 26 to 34 Years | 6,178 (78.3%) | 1,707 (21.6%) |
| 35 to 44 Years | 9,283 (89.6%) | 1,076 (10.4%) |
| 45 to 54 Years | 8,090 (85.4%) | 1,381 (14.6%) |
| 55 to 64 Years | 10,340 (91.5%) | 955 (8.5%) |
| 65 to 74 Years | 7,342 (99.7%) | 20 (0.3%) |
| 75 Years and older | 3,828 (99.4%) | 22 (0.6%) |
| Total | 67,007 (90.3%) | 7,232 (9.7%) |
Health Insurance Coverage by Citizenship Status in Missouri City
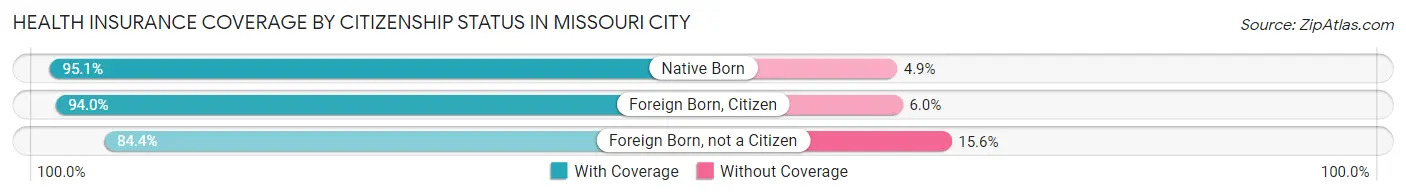
| Citizenship Status | With Coverage | Without Coverage |
| Native Born | 5,208 (95.1%) | 269 (4.9%) |
| Foreign Born, Citizen | 10,702 (94.0%) | 685 (6.0%) |
| Foreign Born, not a Citizen | 6,036 (84.4%) | 1,117 (15.6%) |
Health Insurance Coverage by Household Income in Missouri City
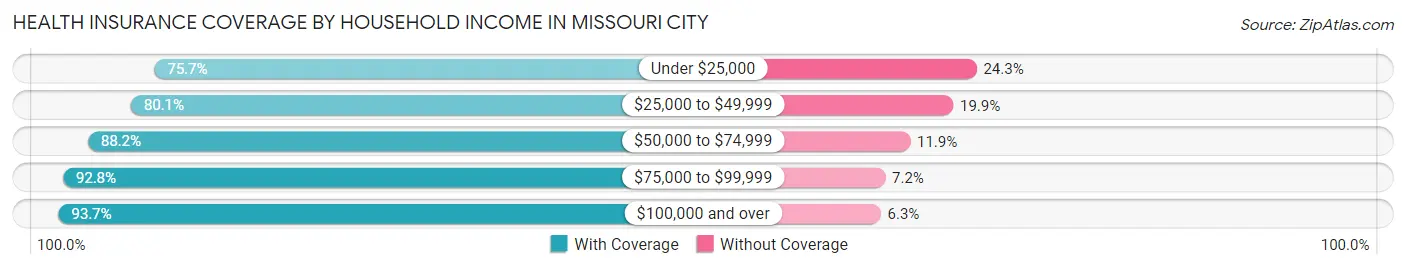
| Household Income | With Coverage | Without Coverage |
| Under $25,000 | 2,772 (75.7%) | 890 (24.3%) |
| $25,000 to $49,999 | 6,985 (80.1%) | 1,735 (19.9%) |
| $50,000 to $74,999 | 9,369 (88.1%) | 1,259 (11.8%) |
| $75,000 to $99,999 | 9,610 (92.8%) | 742 (7.2%) |
| $100,000 and over | 38,016 (93.7%) | 2,570 (6.3%) |
Public vs Private Health Insurance Coverage by Age in Missouri City
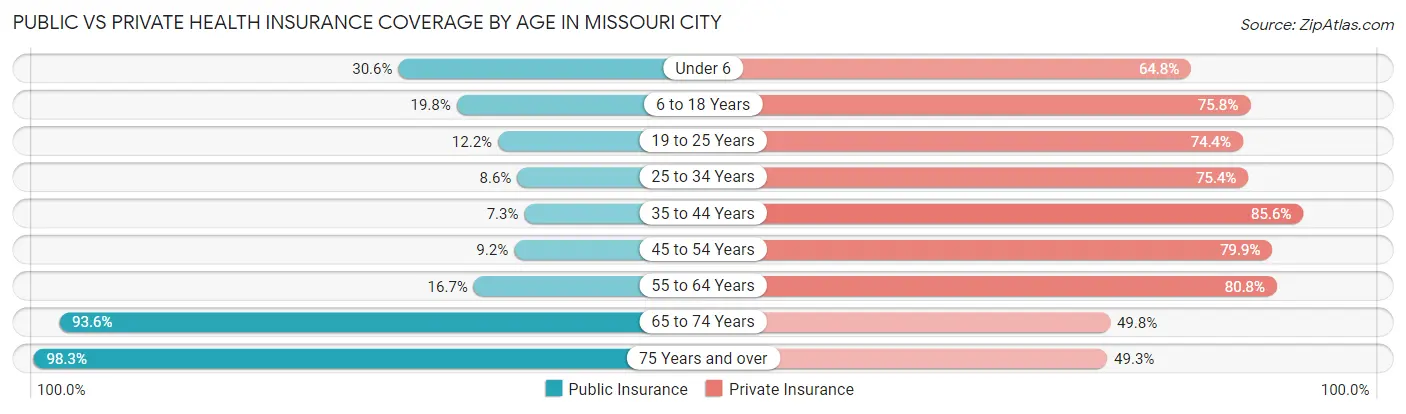
| Age Bracket | Public Insurance | Private Insurance |
| Under 6 | 1,678 (30.6%) | 3,550 (64.8%) |
| 6 to 18 Years | 2,257 (19.8%) | 8,627 (75.8%) |
| 19 to 25 Years | 869 (12.1%) | 5,325 (74.4%) |
| 25 to 34 Years | 676 (8.6%) | 5,948 (75.4%) |
| 35 to 44 Years | 751 (7.2%) | 8,870 (85.6%) |
| 45 to 54 Years | 868 (9.2%) | 7,566 (79.9%) |
| 55 to 64 Years | 1,881 (16.7%) | 9,121 (80.7%) |
| 65 to 74 Years | 6,890 (93.6%) | 3,665 (49.8%) |
| 75 Years and over | 3,786 (98.3%) | 1,896 (49.2%) |
| Total | 19,656 (26.5%) | 54,568 (73.5%) |
Disability Status by Sex by Age in Missouri City
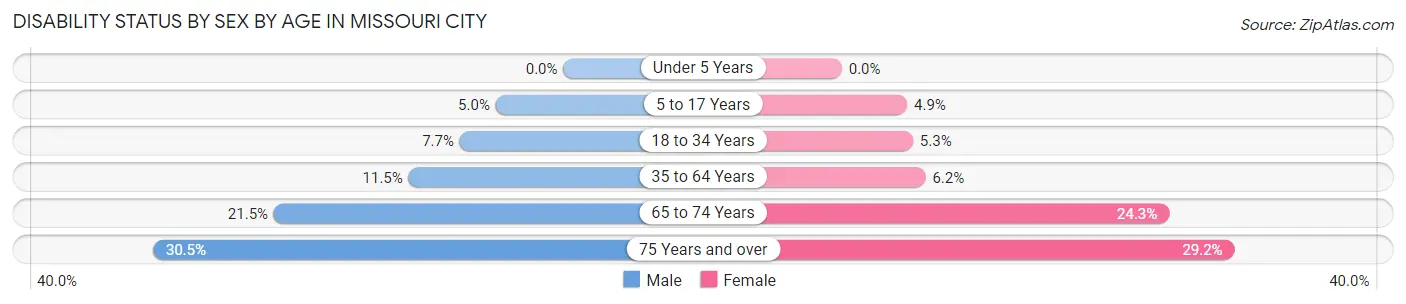
| Age Bracket | Male | Female |
| Under 5 Years | 0 (0.0%) | 0 (0.0%) |
| 5 to 17 Years | 296 (5.0%) | 268 (4.9%) |
| 18 to 34 Years | 617 (7.7%) | 411 (5.3%) |
| 35 to 64 Years | 1,701 (11.5%) | 1,013 (6.2%) |
| 65 to 74 Years | 689 (21.5%) | 1,010 (24.3%) |
| 75 Years and over | 474 (30.5%) | 669 (29.1%) |
Disability Class by Sex by Age in Missouri City
Disability Class: Hearing Difficulty
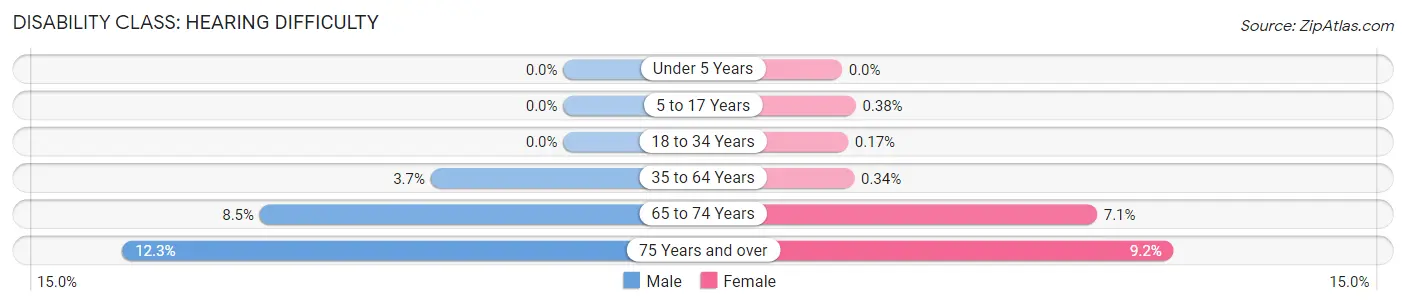
| Age Bracket | Male | Female |
| Under 5 Years | 0 (0.0%) | 0 (0.0%) |
| 5 to 17 Years | 0 (0.0%) | 21 (0.4%) |
| 18 to 34 Years | 0 (0.0%) | 13 (0.2%) |
| 35 to 64 Years | 546 (3.7%) | 56 (0.3%) |
| 65 to 74 Years | 271 (8.5%) | 295 (7.1%) |
| 75 Years and over | 191 (12.3%) | 212 (9.2%) |
Disability Class: Vision Difficulty
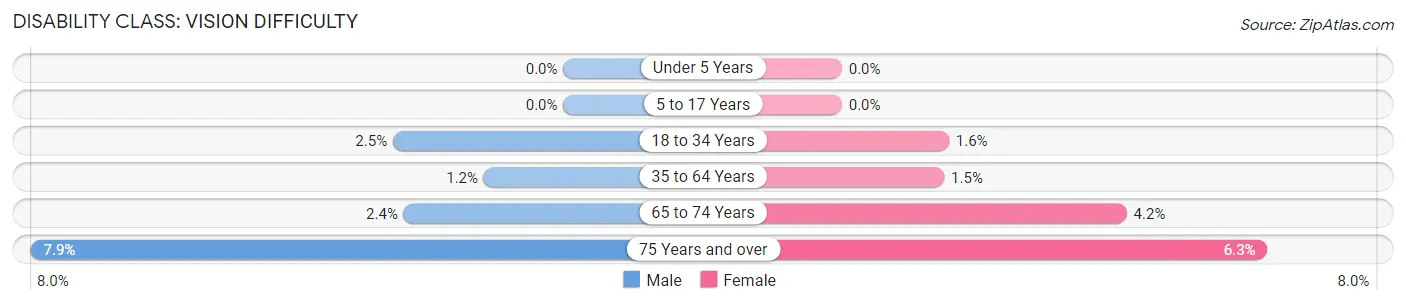
| Age Bracket | Male | Female |
| Under 5 Years | 0 (0.0%) | 0 (0.0%) |
| 5 to 17 Years | 0 (0.0%) | 0 (0.0%) |
| 18 to 34 Years | 203 (2.5%) | 124 (1.6%) |
| 35 to 64 Years | 175 (1.2%) | 248 (1.5%) |
| 65 to 74 Years | 76 (2.4%) | 176 (4.2%) |
| 75 Years and over | 123 (7.9%) | 145 (6.3%) |
Disability Class: Cognitive Difficulty
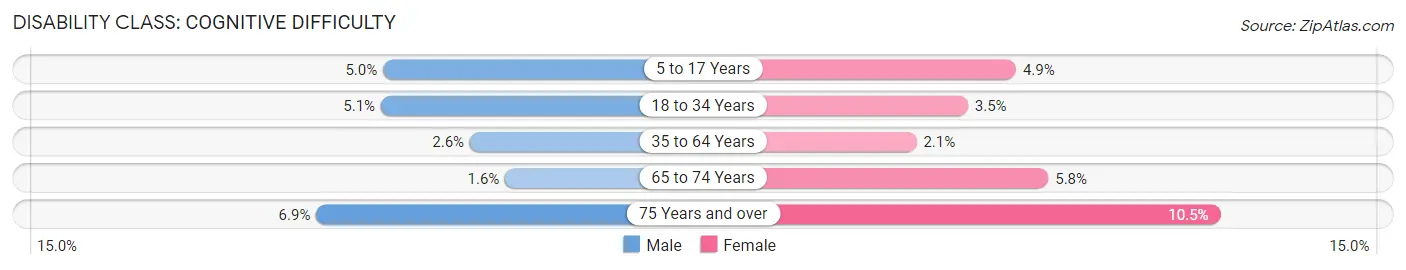
| Age Bracket | Male | Female |
| 5 to 17 Years | 296 (5.0%) | 268 (4.9%) |
| 18 to 34 Years | 408 (5.1%) | 273 (3.5%) |
| 35 to 64 Years | 385 (2.6%) | 339 (2.1%) |
| 65 to 74 Years | 52 (1.6%) | 239 (5.8%) |
| 75 Years and over | 107 (6.9%) | 242 (10.5%) |
Disability Class: Ambulatory Difficulty
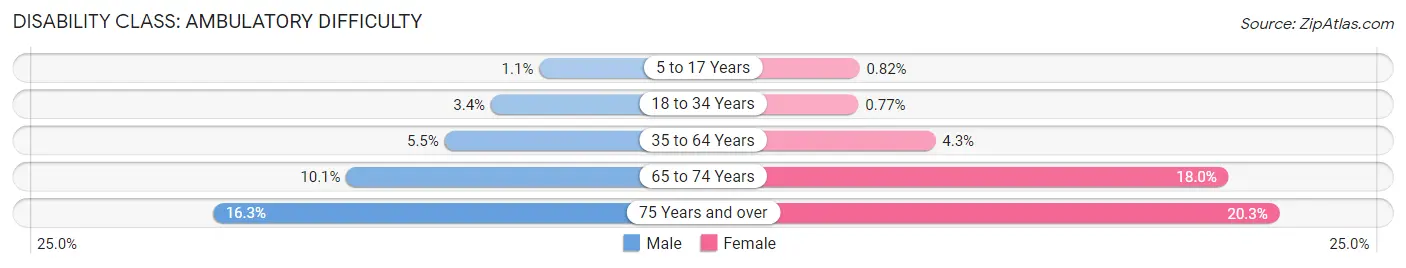
| Age Bracket | Male | Female |
| 5 to 17 Years | 66 (1.1%) | 45 (0.8%) |
| 18 to 34 Years | 270 (3.4%) | 60 (0.8%) |
| 35 to 64 Years | 816 (5.5%) | 708 (4.3%) |
| 65 to 74 Years | 323 (10.1%) | 746 (17.9%) |
| 75 Years and over | 253 (16.3%) | 466 (20.3%) |
Disability Class: Self-Care Difficulty
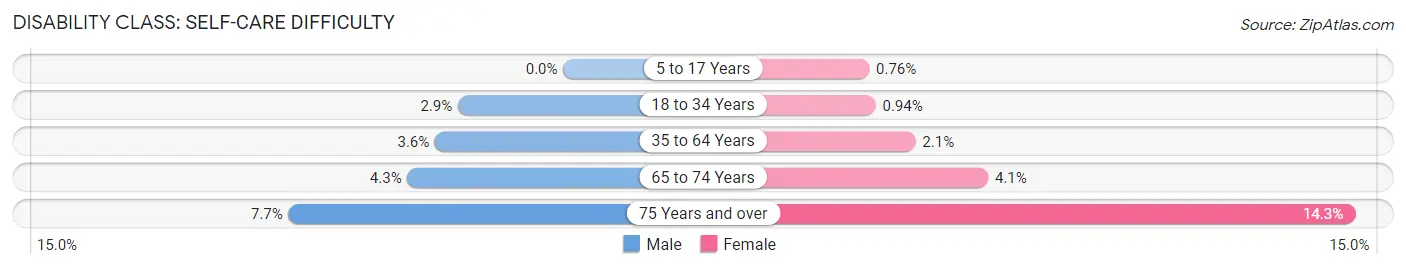
| Age Bracket | Male | Female |
| 5 to 17 Years | 0 (0.0%) | 42 (0.8%) |
| 18 to 34 Years | 235 (2.9%) | 73 (0.9%) |
| 35 to 64 Years | 528 (3.6%) | 335 (2.1%) |
| 65 to 74 Years | 139 (4.3%) | 169 (4.1%) |
| 75 Years and over | 119 (7.6%) | 328 (14.3%) |
Technology Access in Missouri City
Computing Device Access in Missouri City
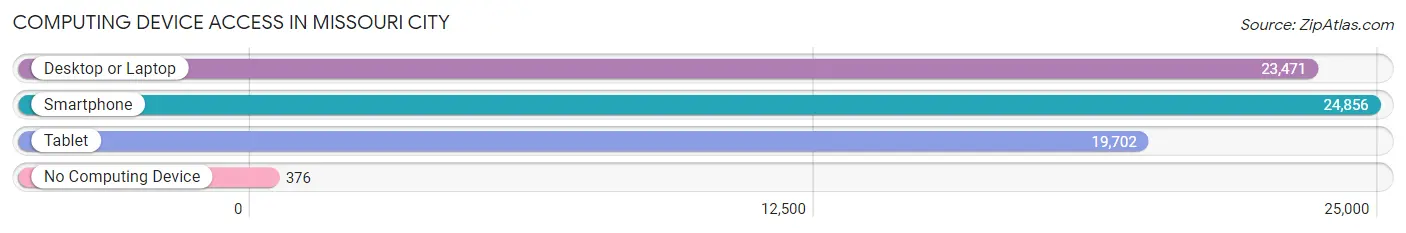
| Device Type | # Households | % Households |
| Desktop or Laptop | 23,471 | 90.0% |
| Smartphone | 24,856 | 95.3% |
| Tablet | 19,702 | 75.6% |
| No Computing Device | 376 | 1.4% |
| Total | 26,072 | 100.0% |
Internet Access in Missouri City
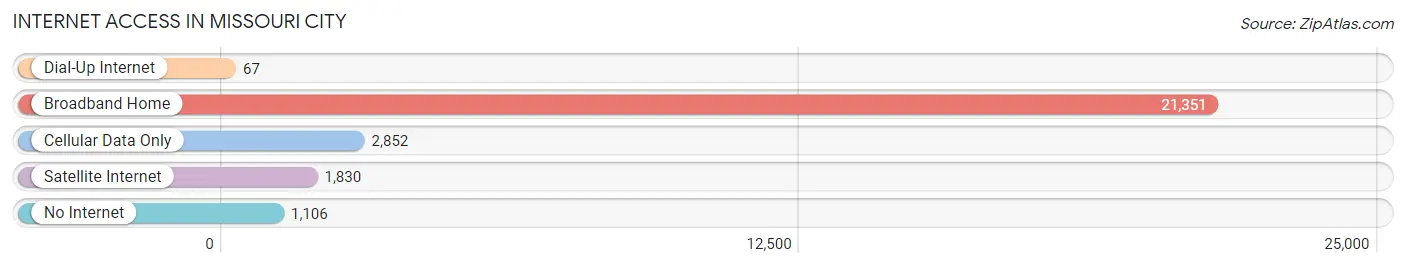
| Internet Type | # Households | % Households |
| Dial-Up Internet | 67 | 0.3% |
| Broadband Home | 21,351 | 81.9% |
| Cellular Data Only | 2,852 | 10.9% |
| Satellite Internet | 1,830 | 7.0% |
| No Internet | 1,106 | 4.2% |
| Total | 26,072 | 100.0% |
Missouri City Summary
Missouri City is a city located in Fort Bend County, Texas, United States. It is part of the Houston–The Woodlands–Sugar Land metropolitan area. The city is located in the southeastern part of the state, about 20 miles (32 km) southwest of downtown Houston. As of the 2010 census, the city had a population of 67,358, up from 52,913 in 2000.
History
The area in which Missouri City is now located holds a long and rich history. The Karankawa Indians were the first inhabitants of the area, and the land was later inhabited by the Atakapan Indians. The first European settlers arrived in the area in the early 1800s, and the area was known as “Quail Valley”.
In 1853, the town of Missouri City was founded by William B. Travis, a former Texas Ranger. The town was named after the state of Missouri, as Travis had previously lived in the state. The town was incorporated in 1956, and the population grew steadily over the next few decades.
Geography
Missouri City is located in southeastern Texas, about 20 miles (32 km) southwest of downtown Houston. It is part of the Houston–The Woodlands–Sugar Land metropolitan area. The city is situated on the banks of Oyster Creek, a tributary of the Brazos River. The city covers an area of approximately 33 square miles (85 km2).
The city has a humid subtropical climate, with hot, humid summers and mild winters. The average annual temperature is 73 °F (23 °C), and the average annual precipitation is 48.3 inches (123 cm).
Economy
Missouri City’s economy is largely based on the oil and gas industry, as well as manufacturing and retail. The city is home to several major oil and gas companies, including Chevron, Shell, and ExxonMobil. The city is also home to several manufacturing companies, including Dow Chemical and BASF.
The city’s retail sector is also thriving, with several major shopping centers and malls located in the city. The city is also home to several major employers, including the University of Houston, Houston Community College, and the Houston Independent School District.
Demographics
As of the 2010 census, the city had a population of 67,358, up from 52,913 in 2000. The racial makeup of the city was 57.2% White, 24.3% African American, 0.5% Native American, 8.2% Asian, 0.1% Pacific Islander, 6.3% from other races, and 3.4% from two or more races. Hispanic or Latino of any race were 20.2% of the population.
The median income for a household in the city was $63,945, and the median income for a family was $72,813. The per capita income for the city was $27,845. About 8.2% of families and 10.3% of the population were below the poverty line, including 14.3% of those under age 18 and 6.2% of those age 65 or over.
Common Questions
What is Per Capita Income in Missouri City?
Per Capita income in Missouri City is $41,033.
What is the Median Family Income in Missouri City?
Median Family Income in Missouri City is $106,195.
What is the Median Household income in Missouri City?
Median Household Income in Missouri City is $97,211.
What is Income or Wage Gap in Missouri City?
Income or Wage Gap in Missouri City is 27.6%.
Women in Missouri City earn 72.4 cents for every dollar earned by a man.
What is Family Income Deficit in Missouri City?
Family Income Deficit in Missouri City is $11,962.
Families that are below poverty line in Missouri City earn $11,962 less on average than the poverty threshold level.
What is Inequality or Gini Index in Missouri City?
Inequality or Gini Index in Missouri City is 0.38.
What is the Total Population of Missouri City?
Total Population of Missouri City is 74,517.
What is the Total Male Population of Missouri City?
Total Male Population of Missouri City is 35,708.
What is the Total Female Population of Missouri City?
Total Female Population of Missouri City is 38,809.
What is the Ratio of Males per 100 Females in Missouri City?
There are 92.01 Males per 100 Females in Missouri City.
What is the Ratio of Females per 100 Males in Missouri City?
There are 108.68 Females per 100 Males in Missouri City.
What is the Median Population Age in Missouri City?
Median Population Age in Missouri City is 40.2 Years.
What is the Average Family Size in Missouri City
Average Family Size in Missouri City is 3.2 People.
What is the Average Household Size in Missouri City
Average Household Size in Missouri City is 2.8 People.
How Large is the Labor Force in Missouri City?
There are 39,912 People in the Labor Forcein in Missouri City.
What is the Percentage of People in the Labor Force in Missouri City?
65.8% of People are in the Labor Force in Missouri City.
What is the Unemployment Rate in Missouri City?
Unemployment Rate in Missouri City is 5.7%.