Sierra Vista Southeast, AZ Map & Demographics
Sierra Vista Southeast Map
Sierra Vista Southeast Overview
$36,250
PER CAPITA INCOME
$87,985
AVG FAMILY INCOME
$67,893
AVG HOUSEHOLD INCOME
59.3%
WAGE / INCOME GAP [ % ]
40.7¢/ $1
WAGE / INCOME GAP [ $ ]
$8,683
FAMILY INCOME DEFICIT
0.40
INEQUALITY / GINI INDEX
14,398
TOTAL POPULATION
6,841
MALE POPULATION
7,557
FEMALE POPULATION
90.53
MALES / 100 FEMALES
110.47
FEMALES / 100 MALES
47.6
MEDIAN AGE
3.2
AVG FAMILY SIZE
2.4
AVG HOUSEHOLD SIZE
5,431
LABOR FORCE [ PEOPLE ]
47.5%
PERCENT IN LABOR FORCE
4.0%
UNEMPLOYMENT RATE
Income in Sierra Vista Southeast
Income Overview in Sierra Vista Southeast
Per Capita Income in Sierra Vista Southeast is $36,250, while median incomes of families and households are $87,985 and $67,893 respectively.
| Characteristic | Number | Measure |
| Per Capita Income | 14,398 | $36,250 |
| Median Family Income | 3,662 | $87,985 |
| Mean Family Income | 3,662 | $102,623 |
| Median Household Income | 6,050 | $67,893 |
| Mean Household Income | 6,050 | $85,153 |
| Income Deficit | 3,662 | $8,683 |
| Wage / Income Gap (%) | 14,398 | 59.34% |
| Wage / Income Gap ($) | 14,398 | 40.66¢ per $1 |
| Gini / Inequality Index | 14,398 | 0.40 |
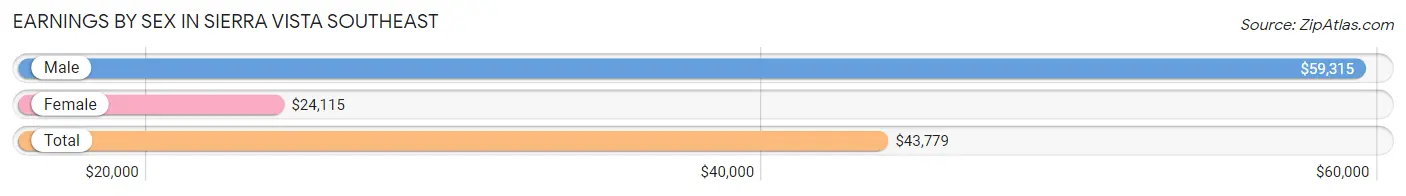
Earnings by Sex in Sierra Vista Southeast
Average Earnings in Sierra Vista Southeast are $43,779, $59,315 for men and $24,115 for women, a difference of 59.3%.
| Sex | Number | Average Earnings |
| Male | 3,108 (55.5%) | $59,315 |
| Female | 2,492 (44.5%) | $24,115 |
| Total | 5,600 (100.0%) | $43,779 |
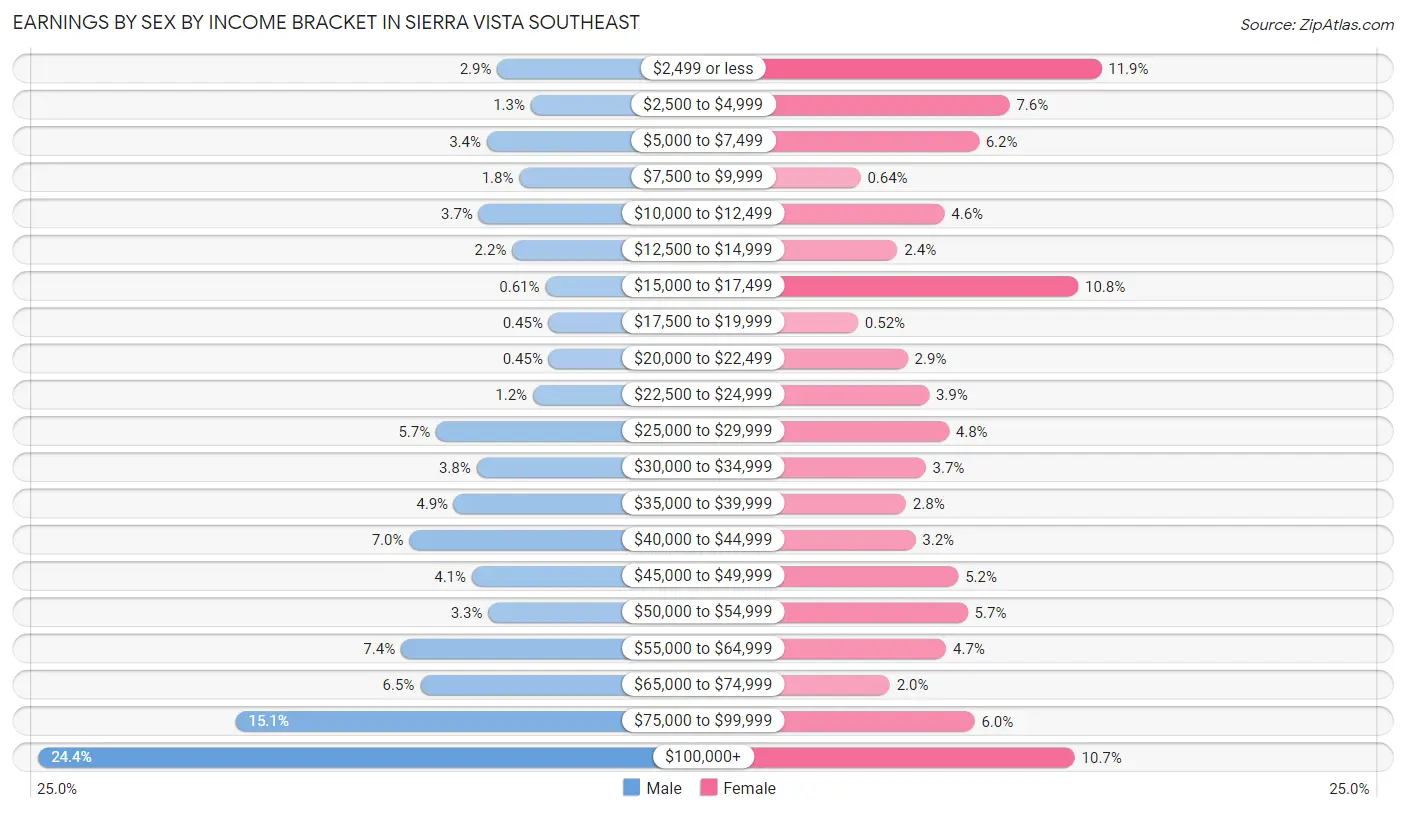
Earnings by Sex by Income Bracket in Sierra Vista Southeast
The most common earnings brackets in Sierra Vista Southeast are $100,000+ for men (757 | 24.4%) and $2,499 or less for women (297 | 11.9%).
| Income | Male | Female |
| $2,499 or less | 89 (2.9%) | 297 (11.9%) |
| $2,500 to $4,999 | 40 (1.3%) | 190 (7.6%) |
| $5,000 to $7,499 | 104 (3.4%) | 154 (6.2%) |
| $7,500 to $9,999 | 57 (1.8%) | 16 (0.6%) |
| $10,000 to $12,499 | 116 (3.7%) | 114 (4.6%) |
| $12,500 to $14,999 | 67 (2.2%) | 59 (2.4%) |
| $15,000 to $17,499 | 19 (0.6%) | 270 (10.8%) |
| $17,500 to $19,999 | 14 (0.4%) | 13 (0.5%) |
| $20,000 to $22,499 | 14 (0.4%) | 71 (2.9%) |
| $22,500 to $24,999 | 37 (1.2%) | 96 (3.8%) |
| $25,000 to $29,999 | 178 (5.7%) | 119 (4.8%) |
| $30,000 to $34,999 | 119 (3.8%) | 92 (3.7%) |
| $35,000 to $39,999 | 152 (4.9%) | 69 (2.8%) |
| $40,000 to $44,999 | 217 (7.0%) | 80 (3.2%) |
| $45,000 to $49,999 | 126 (4.1%) | 130 (5.2%) |
| $50,000 to $54,999 | 102 (3.3%) | 141 (5.7%) |
| $55,000 to $64,999 | 229 (7.4%) | 116 (4.6%) |
| $65,000 to $74,999 | 201 (6.5%) | 50 (2.0%) |
| $75,000 to $99,999 | 470 (15.1%) | 149 (6.0%) |
| $100,000+ | 757 (24.4%) | 266 (10.7%) |
| Total | 3,108 (100.0%) | 2,492 (100.0%) |
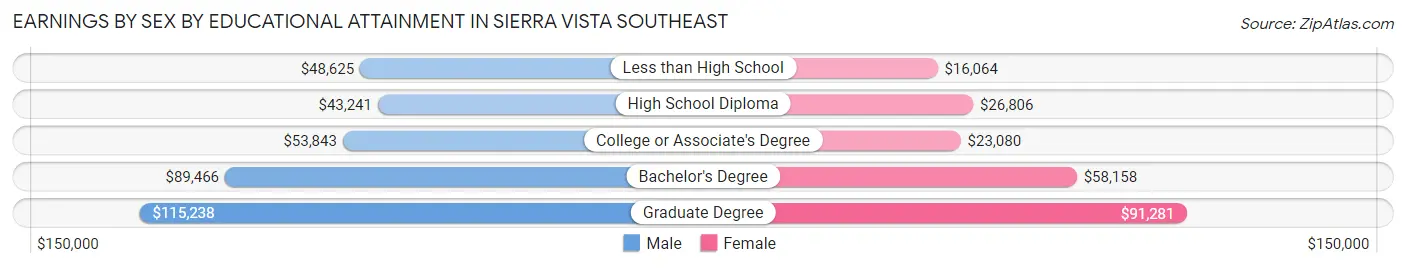
Earnings by Sex by Educational Attainment in Sierra Vista Southeast
Average earnings in Sierra Vista Southeast are $62,717 for men and $29,136 for women, a difference of 53.5%. Men with an educational attainment of graduate degree enjoy the highest average annual earnings of $115,238, while those with high school diploma education earn the least with $43,241. Women with an educational attainment of graduate degree earn the most with the average annual earnings of $91,281, while those with less than high school education have the smallest earnings of $16,064.
| Educational Attainment | Male Income | Female Income |
| Less than High School | $48,625 | $16,064 |
| High School Diploma | $43,241 | $26,806 |
| College or Associate's Degree | $53,843 | $23,080 |
| Bachelor's Degree | $89,466 | $58,158 |
| Graduate Degree | $115,238 | $91,281 |
| Total | $62,717 | $29,136 |
Family Income in Sierra Vista Southeast
Family Income Brackets in Sierra Vista Southeast
According to the Sierra Vista Southeast family income data, there are 787 families falling into the $100,000 to $149,999 income range, which is the most common income bracket and makes up 21.5% of all families. Conversely, the $10,000 to $14,999 income bracket is the least frequent group with only 26 families (0.7%) belonging to this category.
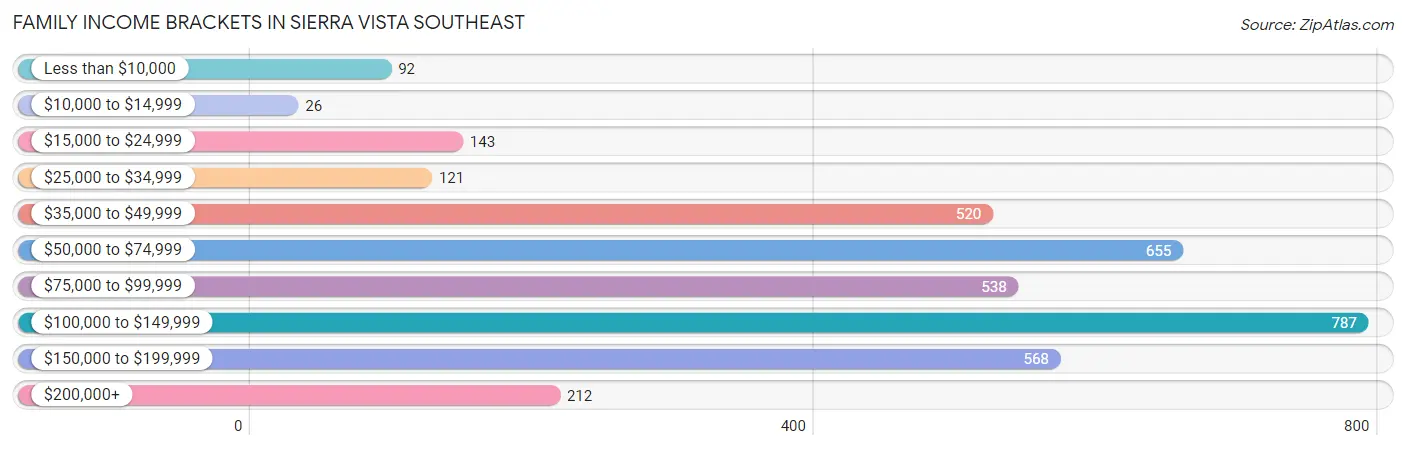
| Income Bracket | # Families | % Families |
| Less than $10,000 | 92 | 2.5% |
| $10,000 to $14,999 | 26 | 0.7% |
| $15,000 to $24,999 | 143 | 3.9% |
| $25,000 to $34,999 | 121 | 3.3% |
| $35,000 to $49,999 | 520 | 14.2% |
| $50,000 to $74,999 | 655 | 17.9% |
| $75,000 to $99,999 | 538 | 14.7% |
| $100,000 to $149,999 | 787 | 21.5% |
| $150,000 to $199,999 | 568 | 15.5% |
| $200,000+ | 212 | 5.8% |
Family Income by Famaliy Size in Sierra Vista Southeast
4-person families (512 | 14.0%) account for the highest median family income in Sierra Vista Southeast with $129,375 per family, while 2-person families (1,976 | 54.0%) have the highest median income of $40,625 per family member.
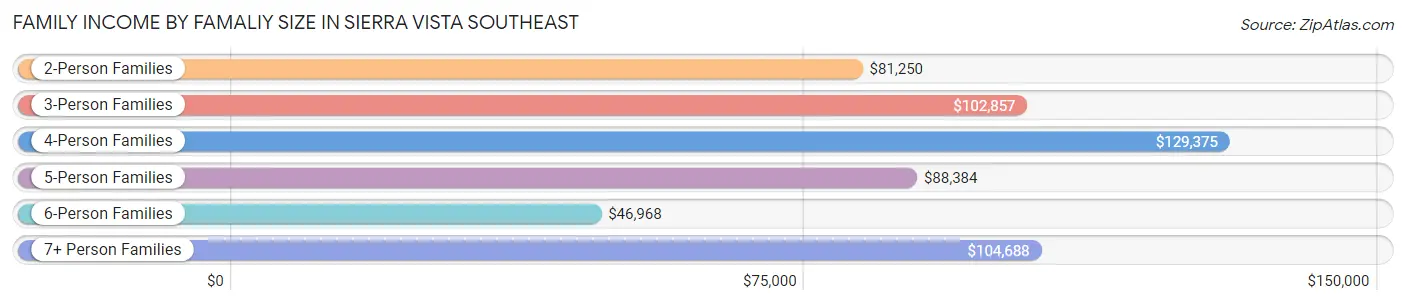
| Income Bracket | # Families | Median Income |
| 2-Person Families | 1,976 (54.0%) | $81,250 |
| 3-Person Families | 546 (14.9%) | $102,857 |
| 4-Person Families | 512 (14.0%) | $129,375 |
| 5-Person Families | 354 (9.7%) | $88,384 |
| 6-Person Families | 159 (4.3%) | $46,968 |
| 7+ Person Families | 115 (3.1%) | $104,688 |
| Total | 3,662 (100.0%) | $87,985 |
Family Income by Number of Earners in Sierra Vista Southeast
The median family income in Sierra Vista Southeast is $87,985, with families comprising 3+ earners (246) having the highest median family income of $135,179, while families with no earners (831) have the lowest median family income of $68,617, accounting for 6.7% and 22.7% of families, respectively.
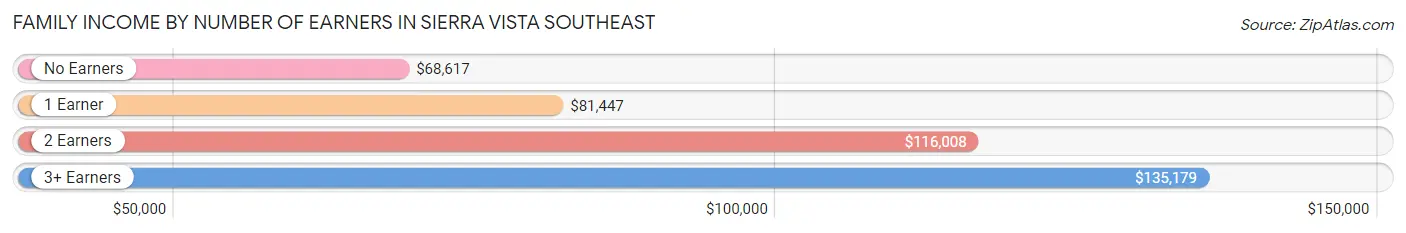
| Number of Earners | # Families | Median Income |
| No Earners | 831 (22.7%) | $68,617 |
| 1 Earner | 1,540 (42.0%) | $81,447 |
| 2 Earners | 1,045 (28.5%) | $116,008 |
| 3+ Earners | 246 (6.7%) | $135,179 |
| Total | 3,662 (100.0%) | $87,985 |
Household Income in Sierra Vista Southeast
Household Income Brackets in Sierra Vista Southeast
With 1,168 households falling in the category, the $50,000 to $74,999 income range is the most frequent in Sierra Vista Southeast, accounting for 19.3% of all households. In contrast, only 194 households (3.2%) fall into the less than $10,000 income bracket, making it the least populous group.
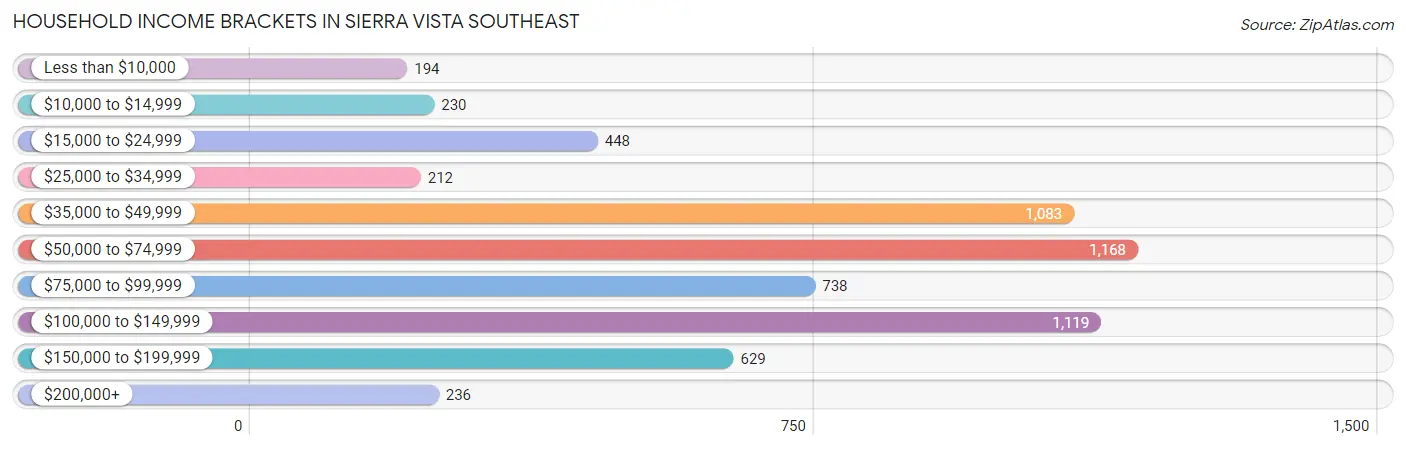
| Income Bracket | # Households | % Households |
| Less than $10,000 | 194 | 3.2% |
| $10,000 to $14,999 | 230 | 3.8% |
| $15,000 to $24,999 | 448 | 7.4% |
| $25,000 to $34,999 | 212 | 3.5% |
| $35,000 to $49,999 | 1,083 | 17.9% |
| $50,000 to $74,999 | 1,168 | 19.3% |
| $75,000 to $99,999 | 738 | 12.2% |
| $100,000 to $149,999 | 1,119 | 18.5% |
| $150,000 to $199,999 | 629 | 10.4% |
| $200,000+ | 236 | 3.9% |
Household Income by Householder Age in Sierra Vista Southeast
The median household income in Sierra Vista Southeast is $67,893, with the highest median household income of $79,233 found in the 45 to 64 years age bracket for the primary householder. A total of 2,491 households (41.2%) fall into this category. Meanwhile, the 15 to 24 years age bracket for the primary householder has the lowest median household income of $0, with 71 households (1.2%) in this group.
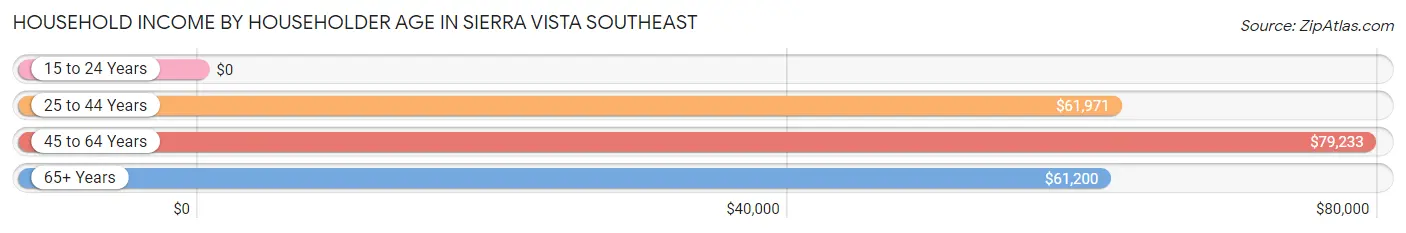
| Income Bracket | # Households | Median Income |
| 15 to 24 Years | 71 (1.2%) | $0 |
| 25 to 44 Years | 1,092 (18.0%) | $61,971 |
| 45 to 64 Years | 2,491 (41.2%) | $79,233 |
| 65+ Years | 2,396 (39.6%) | $61,200 |
| Total | 6,050 (100.0%) | $67,893 |
Poverty in Sierra Vista Southeast
Income Below Poverty by Sex and Age in Sierra Vista Southeast
With 7.1% poverty level for males and 13.2% for females among the residents of Sierra Vista Southeast, 5 year old males and under 5 year old females are the most vulnerable to poverty, with 43 males (32.6%) and 126 females (42.7%) in their respective age groups living below the poverty level.
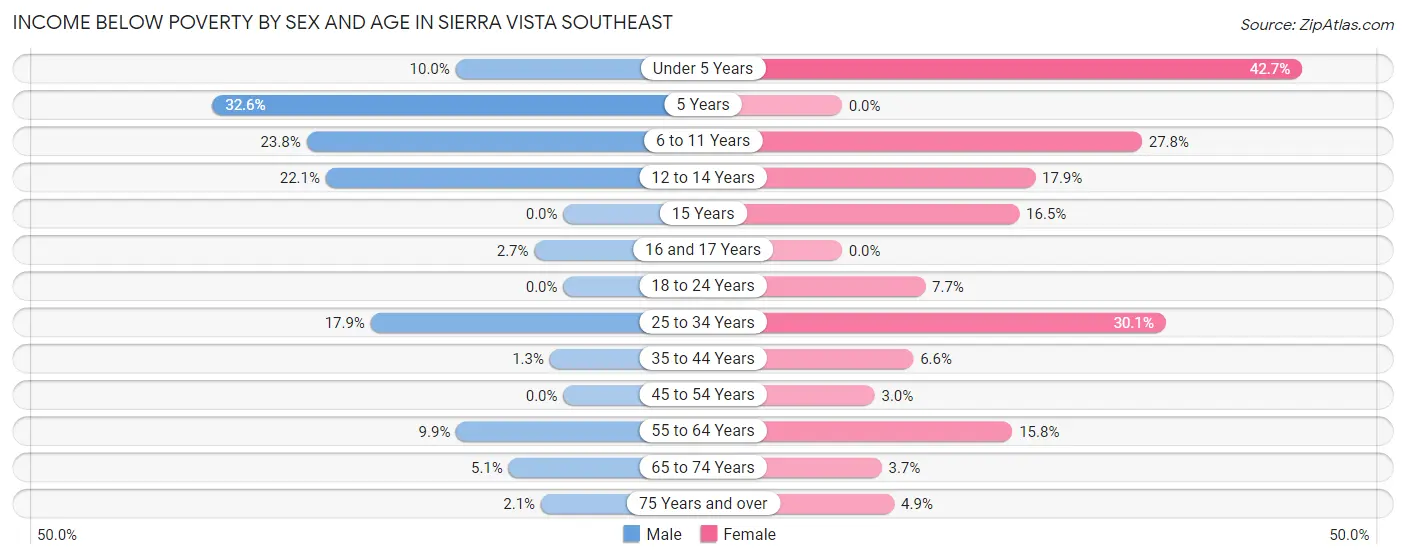
| Age Bracket | Male | Female |
| Under 5 Years | 25 (10.0%) | 126 (42.7%) |
| 5 Years | 43 (32.6%) | 0 (0.0%) |
| 6 to 11 Years | 133 (23.8%) | 162 (27.8%) |
| 12 to 14 Years | 43 (22.1%) | 87 (17.9%) |
| 15 Years | 0 (0.0%) | 13 (16.5%) |
| 16 and 17 Years | 9 (2.7%) | 0 (0.0%) |
| 18 to 24 Years | 0 (0.0%) | 42 (7.7%) |
| 25 to 34 Years | 54 (17.9%) | 199 (30.1%) |
| 35 to 44 Years | 9 (1.3%) | 49 (6.6%) |
| 45 to 54 Years | 0 (0.0%) | 22 (3.0%) |
| 55 to 64 Years | 98 (9.9%) | 211 (15.8%) |
| 65 to 74 Years | 56 (5.1%) | 35 (3.7%) |
| 75 Years and over | 17 (2.1%) | 43 (4.9%) |
| Total | 487 (7.1%) | 989 (13.2%) |
Income Above Poverty by Sex and Age in Sierra Vista Southeast
According to the poverty statistics in Sierra Vista Southeast, males aged 15 years and females aged 5 years are the age groups that are most secure financially, with 100.0% of males and 100.0% of females in these age groups living above the poverty line.
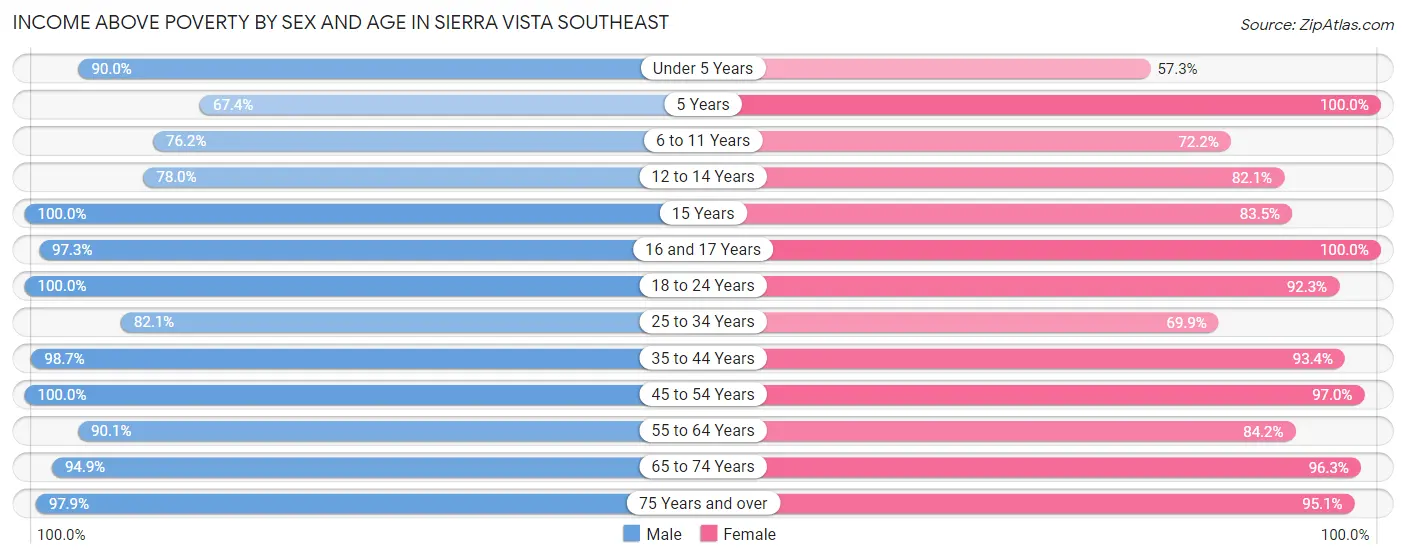
| Age Bracket | Male | Female |
| Under 5 Years | 225 (90.0%) | 169 (57.3%) |
| 5 Years | 89 (67.4%) | 103 (100.0%) |
| 6 to 11 Years | 425 (76.2%) | 420 (72.2%) |
| 12 to 14 Years | 152 (77.9%) | 398 (82.1%) |
| 15 Years | 243 (100.0%) | 66 (83.5%) |
| 16 and 17 Years | 325 (97.3%) | 143 (100.0%) |
| 18 to 24 Years | 281 (100.0%) | 501 (92.3%) |
| 25 to 34 Years | 248 (82.1%) | 463 (69.9%) |
| 35 to 44 Years | 705 (98.7%) | 690 (93.4%) |
| 45 to 54 Years | 893 (100.0%) | 702 (97.0%) |
| 55 to 64 Years | 888 (90.1%) | 1,123 (84.2%) |
| 65 to 74 Years | 1,047 (94.9%) | 913 (96.3%) |
| 75 Years and over | 802 (97.9%) | 841 (95.1%) |
| Total | 6,323 (92.8%) | 6,532 (86.9%) |
Income Below Poverty Among Married-Couple Families in Sierra Vista Southeast
The poverty statistics for married-couple families in Sierra Vista Southeast show that 3.6% or 110 of the total 3,029 families live below the poverty line. Families with 5 or more children have the highest poverty rate of 44.7%, comprising of 42 families. On the other hand, families with 1 or 2 children have the lowest poverty rate of 0.9%, which includes 7 families.
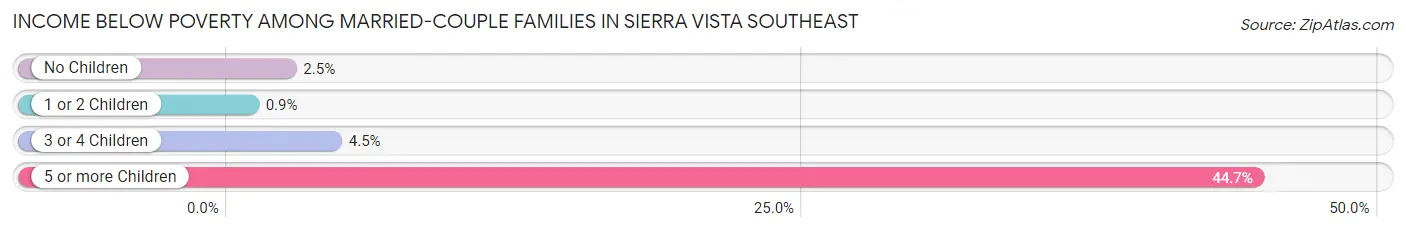
| Children | Above Poverty | Below Poverty |
| No Children | 1,800 (97.5%) | 47 (2.5%) |
| 1 or 2 Children | 771 (99.1%) | 7 (0.9%) |
| 3 or 4 Children | 296 (95.5%) | 14 (4.5%) |
| 5 or more Children | 52 (55.3%) | 42 (44.7%) |
| Total | 2,919 (96.4%) | 110 (3.6%) |
Income Below Poverty Among Single-Parent Households in Sierra Vista Southeast
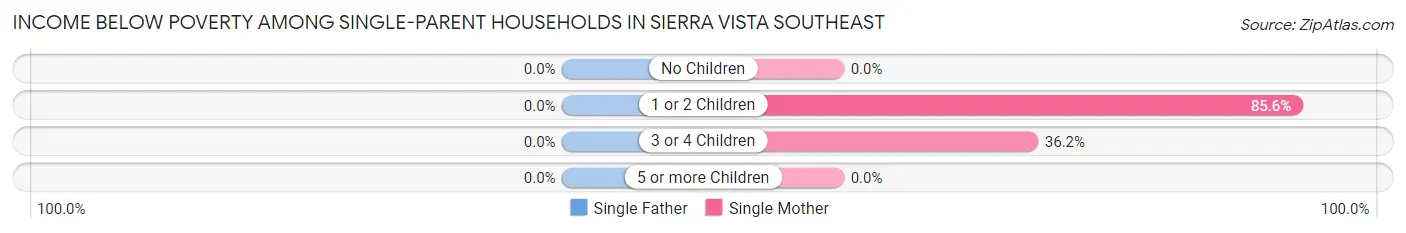
| Children | Single Father | Single Mother |
| No Children | 0 (0.0%) | 0 (0.0%) |
| 1 or 2 Children | 0 (0.0%) | 148 (85.6%) |
| 3 or 4 Children | 0 (0.0%) | 17 (36.2%) |
| 5 or more Children | 0 (0.0%) | 0 (0.0%) |
| Total | 0 (0.0%) | 165 (41.6%) |
Income Below Poverty Among Married-Couple vs Single-Parent Households in Sierra Vista Southeast
The poverty data for Sierra Vista Southeast shows that 110 of the married-couple family households (3.6%) and 165 of the single-parent households (26.1%) are living below the poverty level. Within the married-couple family households, those with 5 or more children have the highest poverty rate, with 42 households (44.7%) falling below the poverty line. Among the single-parent households, those with 1 or 2 children have the highest poverty rate, with 148 household (62.5%) living below poverty.
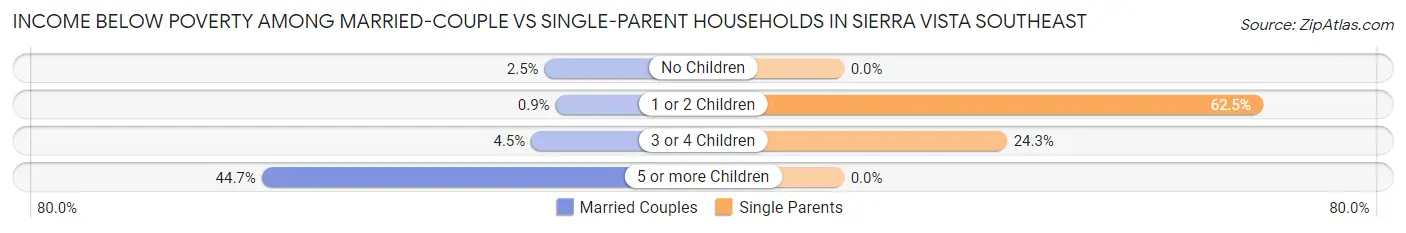
| Children | Married-Couple Families | Single-Parent Households |
| No Children | 47 (2.5%) | 0 (0.0%) |
| 1 or 2 Children | 7 (0.9%) | 148 (62.5%) |
| 3 or 4 Children | 14 (4.5%) | 17 (24.3%) |
| 5 or more Children | 42 (44.7%) | 0 (0.0%) |
| Total | 110 (3.6%) | 165 (26.1%) |
Race in Sierra Vista Southeast
The most populous races in Sierra Vista Southeast are White / Caucasian (11,860 | 82.4%), Hispanic or Latino (3,722 | 25.9%), and Two or more Races (1,762 | 12.2%).
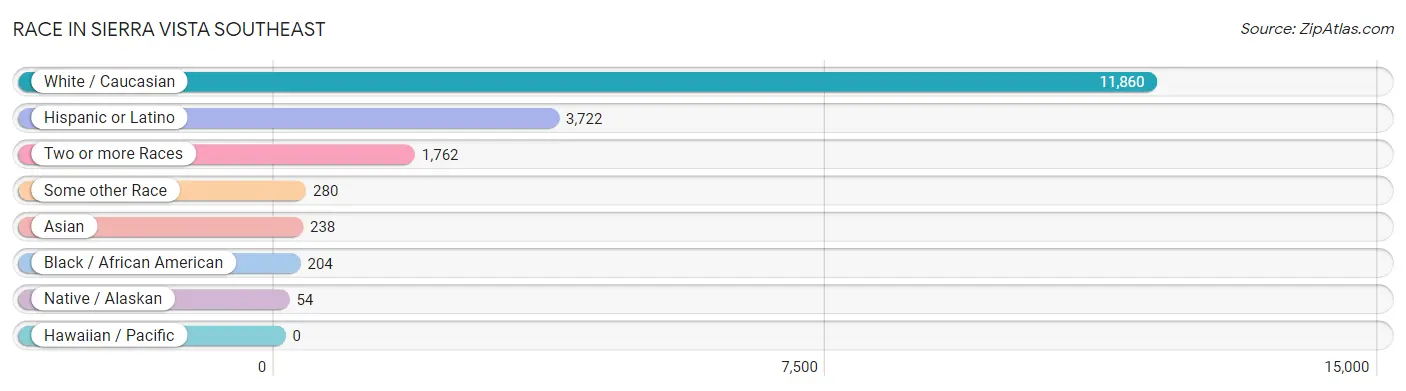
| Race | # Population | % Population |
| Asian | 238 | 1.7% |
| Black / African American | 204 | 1.4% |
| Hawaiian / Pacific | 0 | 0.0% |
| Hispanic or Latino | 3,722 | 25.9% |
| Native / Alaskan | 54 | 0.4% |
| White / Caucasian | 11,860 | 82.4% |
| Two or more Races | 1,762 | 12.2% |
| Some other Race | 280 | 1.9% |
| Total | 14,398 | 100.0% |
Ancestry in Sierra Vista Southeast
The most populous ancestries reported in Sierra Vista Southeast are German (2,653 | 18.4%), Mexican (2,640 | 18.3%), English (2,180 | 15.1%), Irish (2,099 | 14.6%), and Puerto Rican (767 | 5.3%), together accounting for 71.8% of all Sierra Vista Southeast residents.
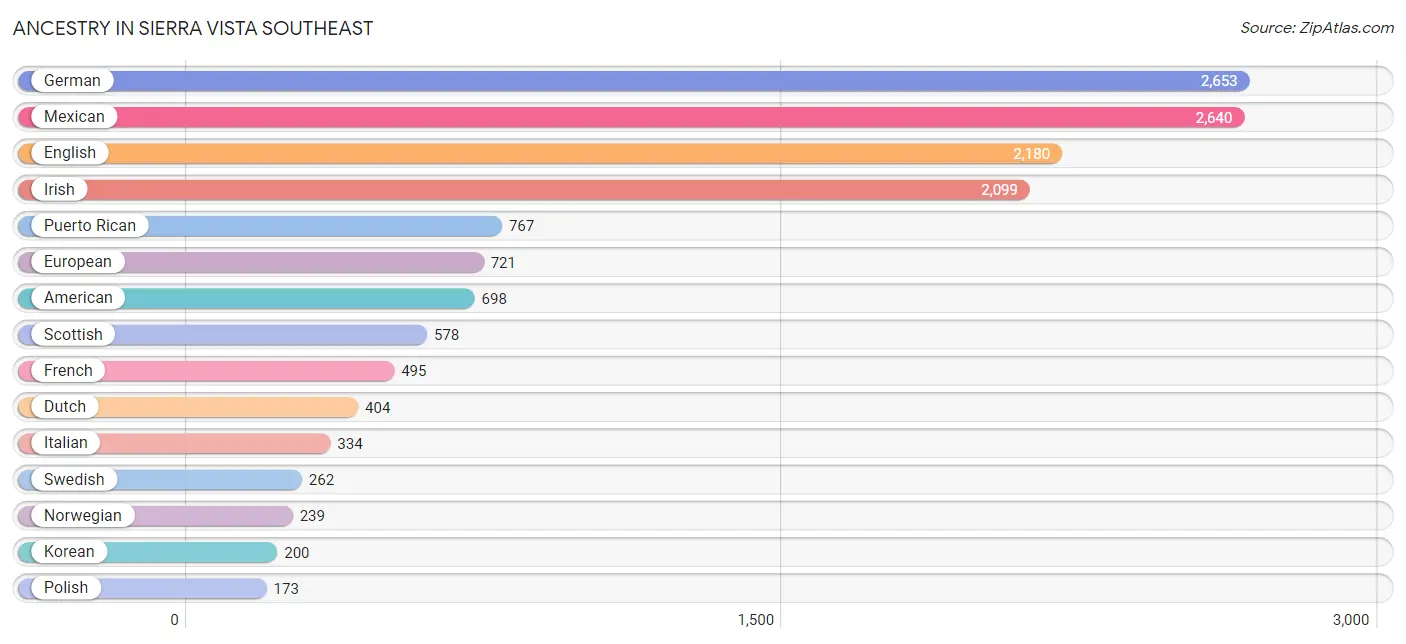
| Ancestry | # Population | % Population |
| African | 13 | 0.1% |
| Alaskan Athabascan | 4 | 0.0% |
| Albanian | 19 | 0.1% |
| American | 698 | 4.9% |
| Arab | 51 | 0.4% |
| Austrian | 14 | 0.1% |
| Belgian | 7 | 0.1% |
| Bhutanese | 112 | 0.8% |
| Blackfeet | 60 | 0.4% |
| British | 126 | 0.9% |
| Burmese | 129 | 0.9% |
| Celtic | 12 | 0.1% |
| Central American | 37 | 0.3% |
| Cherokee | 90 | 0.6% |
| Chinese | 7 | 0.1% |
| Croatian | 8 | 0.1% |
| Czech | 38 | 0.3% |
| Czechoslovakian | 14 | 0.1% |
| Danish | 120 | 0.8% |
| Dominican | 28 | 0.2% |
| Dutch | 404 | 2.8% |
| Dutch West Indian | 14 | 0.1% |
| Eastern European | 13 | 0.1% |
| English | 2,180 | 15.1% |
| European | 721 | 5.0% |
| Filipino | 25 | 0.2% |
| Finnish | 94 | 0.6% |
| French | 495 | 3.4% |
| French Canadian | 85 | 0.6% |
| German | 2,653 | 18.4% |
| Greek | 44 | 0.3% |
| Haitian | 10 | 0.1% |
| Hopi | 19 | 0.1% |
| Hungarian | 43 | 0.3% |
| Indian (Asian) | 154 | 1.1% |
| Irish | 2,099 | 14.6% |
| Iroquois | 15 | 0.1% |
| Italian | 334 | 2.3% |
| Korean | 200 | 1.4% |
| Lithuanian | 37 | 0.3% |
| Malaysian | 34 | 0.2% |
| Mexican | 2,640 | 18.3% |
| Native Hawaiian | 12 | 0.1% |
| Navajo | 17 | 0.1% |
| Northern European | 48 | 0.3% |
| Norwegian | 239 | 1.7% |
| Pima | 2 | 0.0% |
| Polish | 173 | 1.2% |
| Portuguese | 29 | 0.2% |
| Puerto Rican | 767 | 5.3% |
| Romanian | 10 | 0.1% |
| Russian | 57 | 0.4% |
| Salvadoran | 37 | 0.3% |
| Scandinavian | 47 | 0.3% |
| Scotch-Irish | 103 | 0.7% |
| Scottish | 578 | 4.0% |
| Slavic | 19 | 0.1% |
| South American | 88 | 0.6% |
| Spaniard | 118 | 0.8% |
| Subsaharan African | 13 | 0.1% |
| Swedish | 262 | 1.8% |
| Swiss | 60 | 0.4% |
| Syrian | 51 | 0.4% |
| Venezuelan | 88 | 0.6% |
| Welsh | 121 | 0.8% |
| Yugoslavian | 22 | 0.2% | View All 66 Rows |
Immigrants in Sierra Vista Southeast
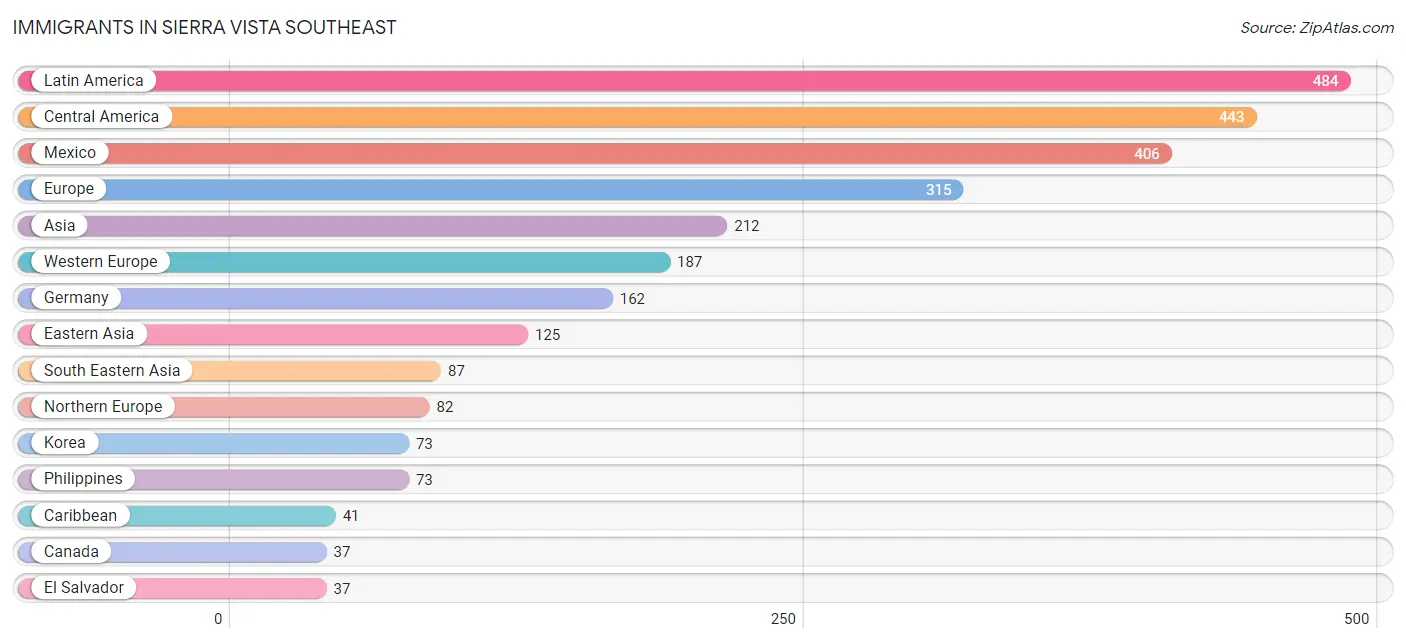
The most numerous immigrant groups reported in Sierra Vista Southeast came from Latin America (484 | 3.4%), Central America (443 | 3.1%), Mexico (406 | 2.8%), Europe (315 | 2.2%), and Asia (212 | 1.5%), together accounting for 12.9% of all Sierra Vista Southeast residents.
| Immigration Origin | # Population | % Population |
| Asia | 212 | 1.5% |
| Belgium | 25 | 0.2% |
| Canada | 37 | 0.3% |
| Caribbean | 41 | 0.3% |
| Central America | 443 | 3.1% |
| China | 21 | 0.2% |
| Cuba | 31 | 0.2% |
| Eastern Asia | 125 | 0.9% |
| Eastern Europe | 16 | 0.1% |
| El Salvador | 37 | 0.3% |
| England | 12 | 0.1% |
| Europe | 315 | 2.2% |
| Germany | 162 | 1.1% |
| Haiti | 10 | 0.1% |
| Japan | 31 | 0.2% |
| Korea | 73 | 0.5% |
| Laos | 14 | 0.1% |
| Latin America | 484 | 3.4% |
| Mexico | 406 | 2.8% |
| Northern Europe | 82 | 0.6% |
| Philippines | 73 | 0.5% |
| Poland | 14 | 0.1% |
| Romania | 2 | 0.0% |
| South Eastern Asia | 87 | 0.6% |
| Southern Europe | 30 | 0.2% |
| Spain | 30 | 0.2% |
| Taiwan | 7 | 0.1% |
| Western Europe | 187 | 1.3% | View All 28 Rows |
Sex and Age in Sierra Vista Southeast
Sex and Age in Sierra Vista Southeast
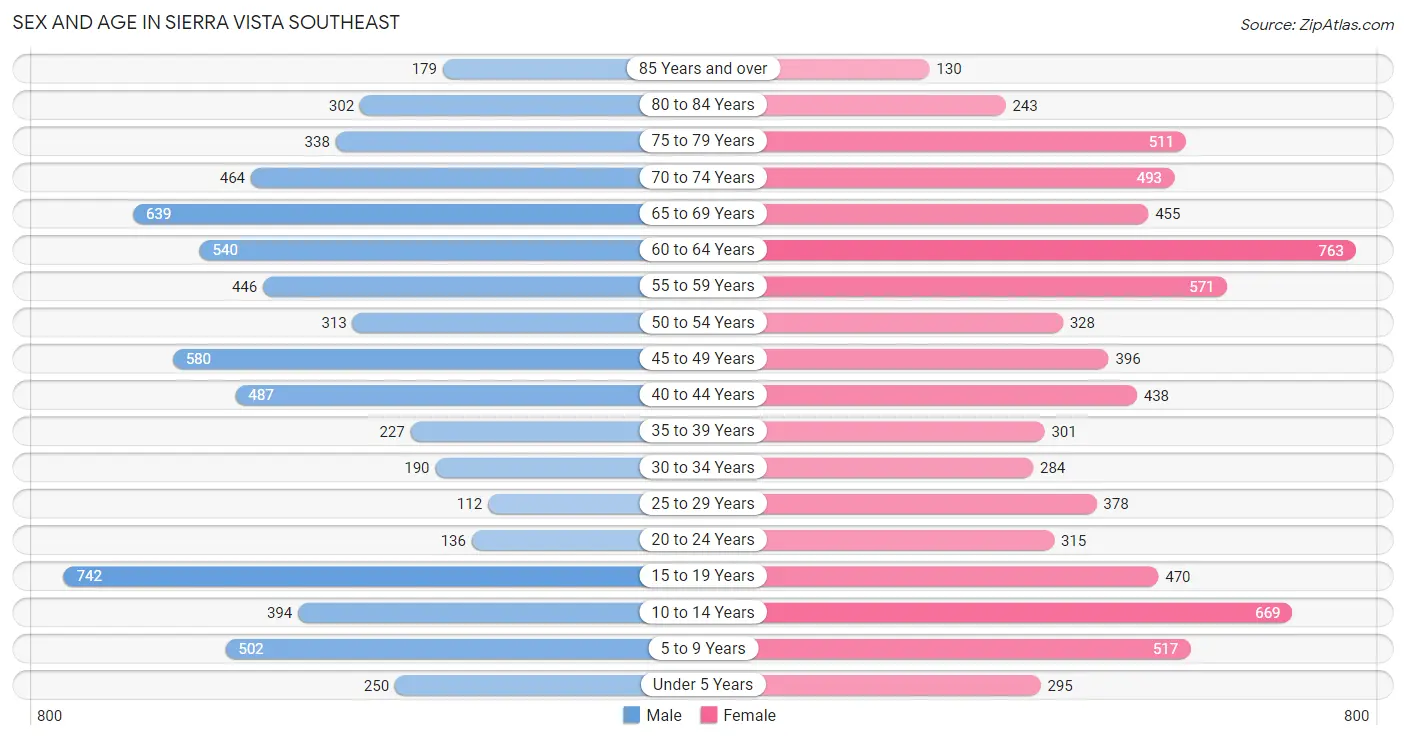
The most populous age groups in Sierra Vista Southeast are 15 to 19 Years (742 | 10.8%) for men and 60 to 64 Years (763 | 10.1%) for women.
| Age Bracket | Male | Female |
| Under 5 Years | 250 (3.6%) | 295 (3.9%) |
| 5 to 9 Years | 502 (7.3%) | 517 (6.8%) |
| 10 to 14 Years | 394 (5.8%) | 669 (8.8%) |
| 15 to 19 Years | 742 (10.8%) | 470 (6.2%) |
| 20 to 24 Years | 136 (2.0%) | 315 (4.2%) |
| 25 to 29 Years | 112 (1.6%) | 378 (5.0%) |
| 30 to 34 Years | 190 (2.8%) | 284 (3.8%) |
| 35 to 39 Years | 227 (3.3%) | 301 (4.0%) |
| 40 to 44 Years | 487 (7.1%) | 438 (5.8%) |
| 45 to 49 Years | 580 (8.5%) | 396 (5.2%) |
| 50 to 54 Years | 313 (4.6%) | 328 (4.3%) |
| 55 to 59 Years | 446 (6.5%) | 571 (7.6%) |
| 60 to 64 Years | 540 (7.9%) | 763 (10.1%) |
| 65 to 69 Years | 639 (9.3%) | 455 (6.0%) |
| 70 to 74 Years | 464 (6.8%) | 493 (6.5%) |
| 75 to 79 Years | 338 (4.9%) | 511 (6.8%) |
| 80 to 84 Years | 302 (4.4%) | 243 (3.2%) |
| 85 Years and over | 179 (2.6%) | 130 (1.7%) |
| Total | 6,841 (100.0%) | 7,557 (100.0%) |
Families and Households in Sierra Vista Southeast
Median Family Size in Sierra Vista Southeast
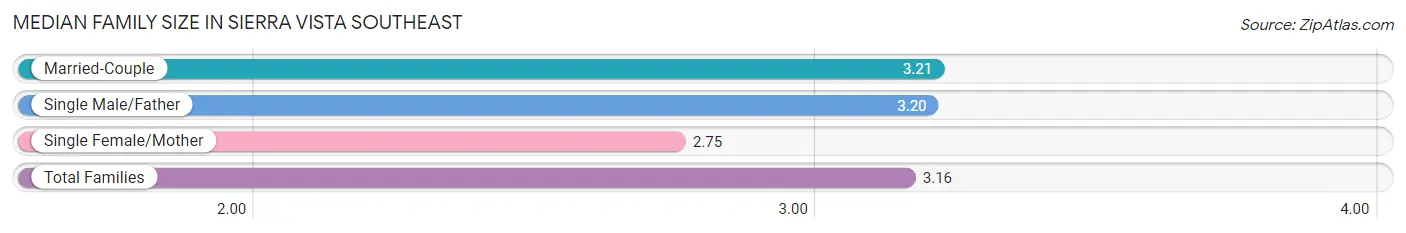
The median family size in Sierra Vista Southeast is 3.16 persons per family, with married-couple families (3,029 | 82.7%) accounting for the largest median family size of 3.21 persons per family. On the other hand, single female/mother families (397 | 10.8%) represent the smallest median family size with 2.75 persons per family.
| Family Type | # Families | Family Size |
| Married-Couple | 3,029 (82.7%) | 3.21 |
| Single Male/Father | 236 (6.4%) | 3.20 |
| Single Female/Mother | 397 (10.8%) | 2.75 |
| Total Families | 3,662 (100.0%) | 3.16 |
Median Household Size in Sierra Vista Southeast
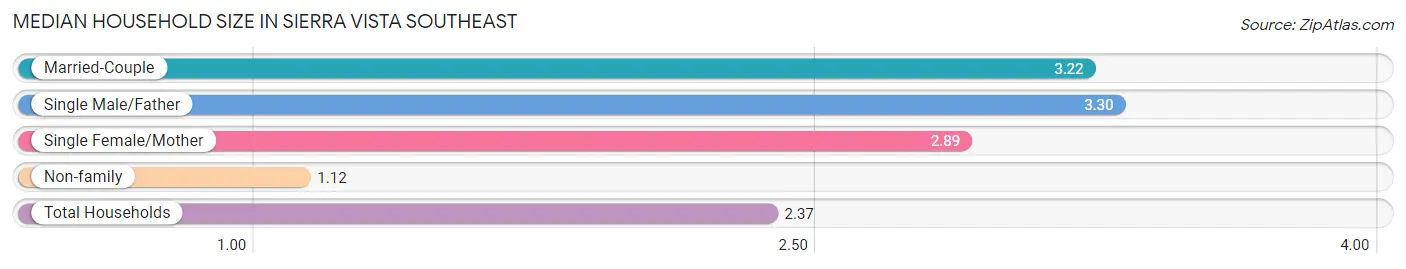
The median household size in Sierra Vista Southeast is 2.37 persons per household, with single male/father households (236 | 3.9%) accounting for the largest median household size of 3.3 persons per household. non-family households (2,388 | 39.5%) represent the smallest median household size with 1.12 persons per household.
| Household Type | # Households | Household Size |
| Married-Couple | 3,029 (50.1%) | 3.22 |
| Single Male/Father | 236 (3.9%) | 3.30 |
| Single Female/Mother | 397 (6.6%) | 2.89 |
| Non-family | 2,388 (39.5%) | 1.12 |
| Total Households | 6,050 (100.0%) | 2.37 |
Household Size by Marriage Status in Sierra Vista Southeast
Out of a total of 6,050 households in Sierra Vista Southeast, 3,662 (60.5%) are family households, while 2,388 (39.5%) are nonfamily households. The most numerous type of family households are 2-person households, comprising 1,911, and the most common type of nonfamily households are 1-person households, comprising 2,160.
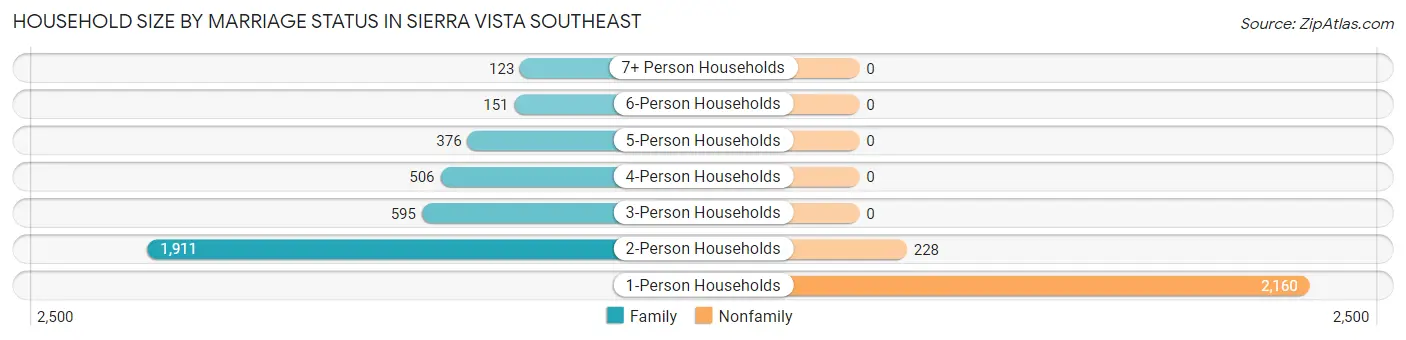
| Household Size | Family Households | Nonfamily Households |
| 1-Person Households | - | 2,160 (35.7%) |
| 2-Person Households | 1,911 (31.6%) | 228 (3.8%) |
| 3-Person Households | 595 (9.8%) | 0 (0.0%) |
| 4-Person Households | 506 (8.4%) | 0 (0.0%) |
| 5-Person Households | 376 (6.2%) | 0 (0.0%) |
| 6-Person Households | 151 (2.5%) | 0 (0.0%) |
| 7+ Person Households | 123 (2.0%) | 0 (0.0%) |
| Total | 3,662 (60.5%) | 2,388 (39.5%) |
Female Fertility in Sierra Vista Southeast
Fertility by Age in Sierra Vista Southeast
Average fertility rate in Sierra Vista Southeast is 40.0 births per 1,000 women. Women in the age bracket of 20 to 34 years have the highest fertility rate with 80.0 births per 1,000 women. Women in the age bracket of 20 to 34 years acount for 75.0% of all women with births.
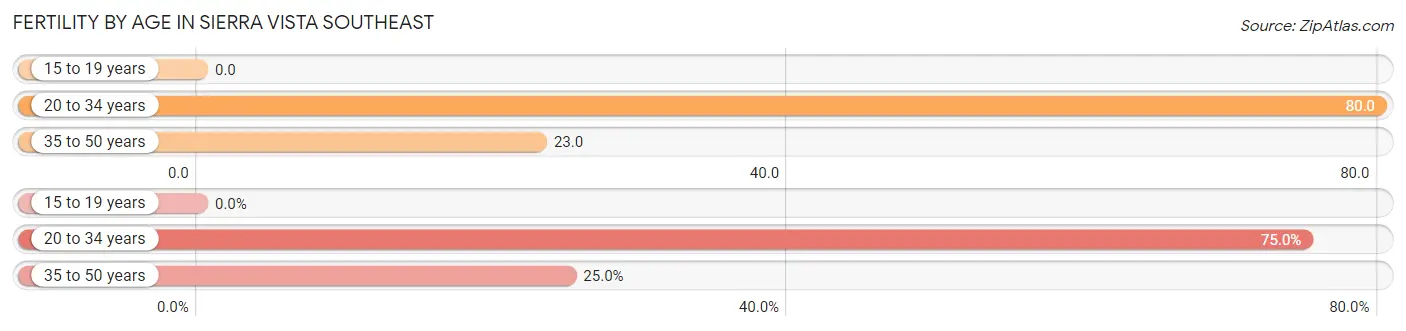
| Age Bracket | Women with Births | Births / 1,000 Women |
| 15 to 19 years | 0 (0.0%) | 0.0 |
| 20 to 34 years | 78 (75.0%) | 80.0 |
| 35 to 50 years | 26 (25.0%) | 23.0 |
| Total | 104 (100.0%) | 40.0 |
Fertility by Age by Marriage Status in Sierra Vista Southeast
99.0% of women with births (104) in Sierra Vista Southeast are married. The highest percentage of unmarried women with births falls into 35 to 50 years age bracket with 3.8% of them unmarried at the time of birth, while the lowest percentage of unmarried women with births belong to 20 to 34 years age bracket with 0.0% of them unmarried.
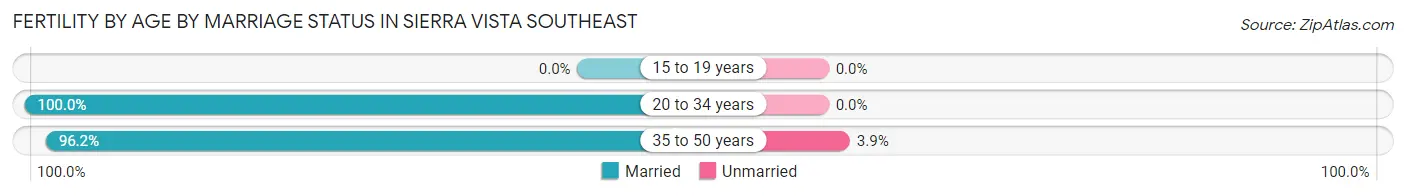
| Age Bracket | Married | Unmarried |
| 15 to 19 years | 0 (0.0%) | 0 (0.0%) |
| 20 to 34 years | 78 (100.0%) | 0 (0.0%) |
| 35 to 50 years | 25 (96.2%) | 1 (3.8%) |
| Total | 103 (99.0%) | 1 (1.0%) |
Fertility by Education in Sierra Vista Southeast
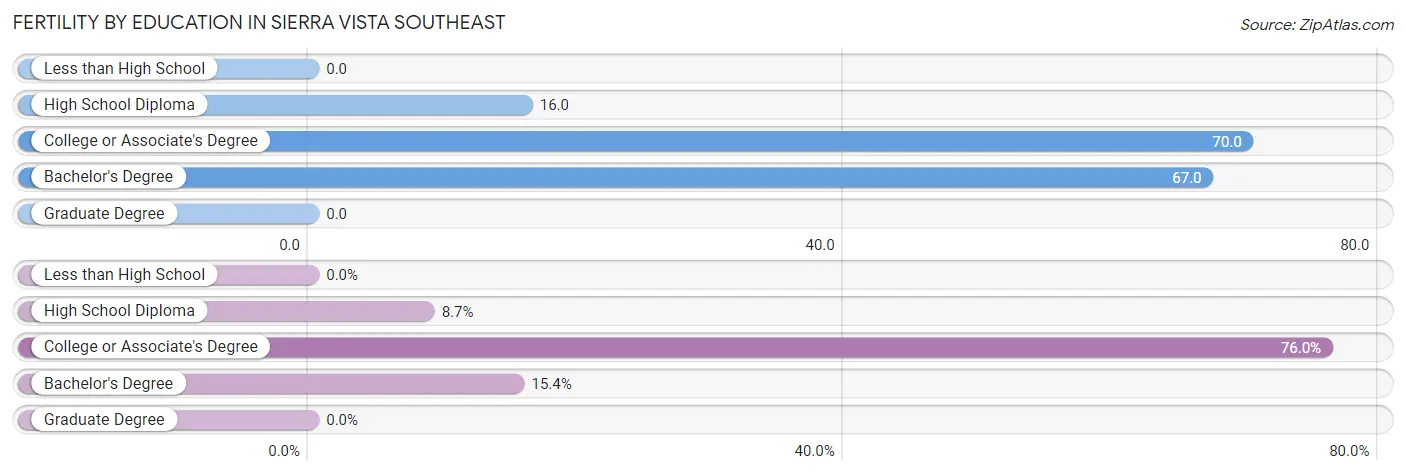
| Educational Attainment | Women with Births | Births / 1,000 Women |
| Less than High School | 0 (0.0%) | 0.0 |
| High School Diploma | 9 (8.6%) | 16.0 |
| College or Associate's Degree | 79 (76.0%) | 70.0 |
| Bachelor's Degree | 16 (15.4%) | 67.0 |
| Graduate Degree | 0 (0.0%) | 0.0 |
| Total | 104 (100.0%) | 40.0 |
Fertility by Education by Marriage Status in Sierra Vista Southeast
1.0% of women with births in Sierra Vista Southeast are unmarried. Women with the educational attainment of high school diploma are most likely to be married with 100.0% of them married at childbirth, while women with the educational attainment of college or associate's degree are least likely to be married with 1.3% of them unmarried at childbirth.
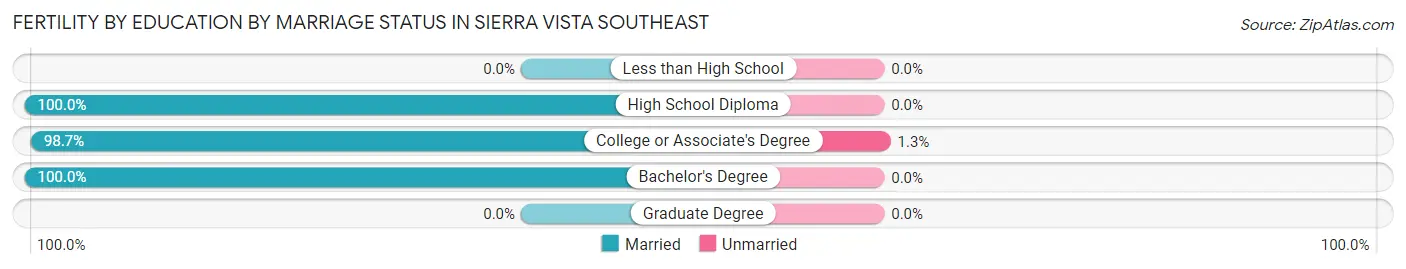
| Educational Attainment | Married | Unmarried |
| Less than High School | 0 (0.0%) | 0 (0.0%) |
| High School Diploma | 9 (100.0%) | 0 (0.0%) |
| College or Associate's Degree | 78 (98.7%) | 1 (1.3%) |
| Bachelor's Degree | 16 (100.0%) | 0 (0.0%) |
| Graduate Degree | 0 (0.0%) | 0 (0.0%) |
| Total | 103 (99.0%) | 1 (1.0%) |
Employment Characteristics in Sierra Vista Southeast
Employment by Class of Employer in Sierra Vista Southeast
Among the 5,057 employed individuals in Sierra Vista Southeast, private company employees (2,653 | 52.5%), federal government employees (925 | 18.3%), and self-employed (not incorporated) (509 | 10.1%) make up the most common classes of employment.
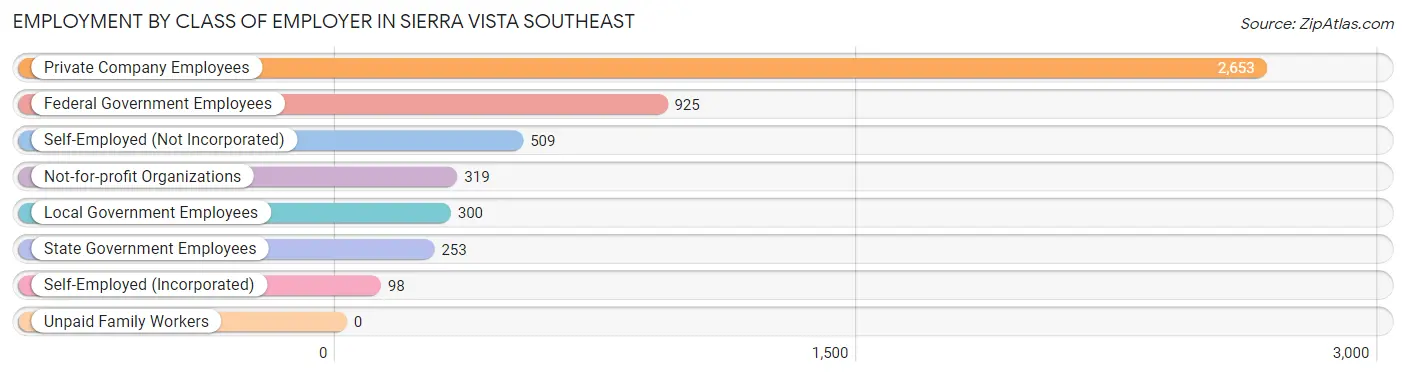
| Employer Class | # Employees | % Employees |
| Private Company Employees | 2,653 | 52.5% |
| Self-Employed (Incorporated) | 98 | 1.9% |
| Self-Employed (Not Incorporated) | 509 | 10.1% |
| Not-for-profit Organizations | 319 | 6.3% |
| Local Government Employees | 300 | 5.9% |
| State Government Employees | 253 | 5.0% |
| Federal Government Employees | 925 | 18.3% |
| Unpaid Family Workers | 0 | 0.0% |
| Total | 5,057 | 100.0% |
Employment Status by Age in Sierra Vista Southeast
According to the labor force statistics for Sierra Vista Southeast, out of the total population over 16 years of age (11,434), 47.5% or 5,431 individuals are in the labor force, with 4.0% or 217 of them unemployed. The age group with the highest labor force participation rate is 30 to 34 years, with 82.3% or 390 individuals in the labor force. Within the labor force, the 16 to 19 years age range has the highest percentage of unemployed individuals, with 11.5% or 28 of them being unemployed.
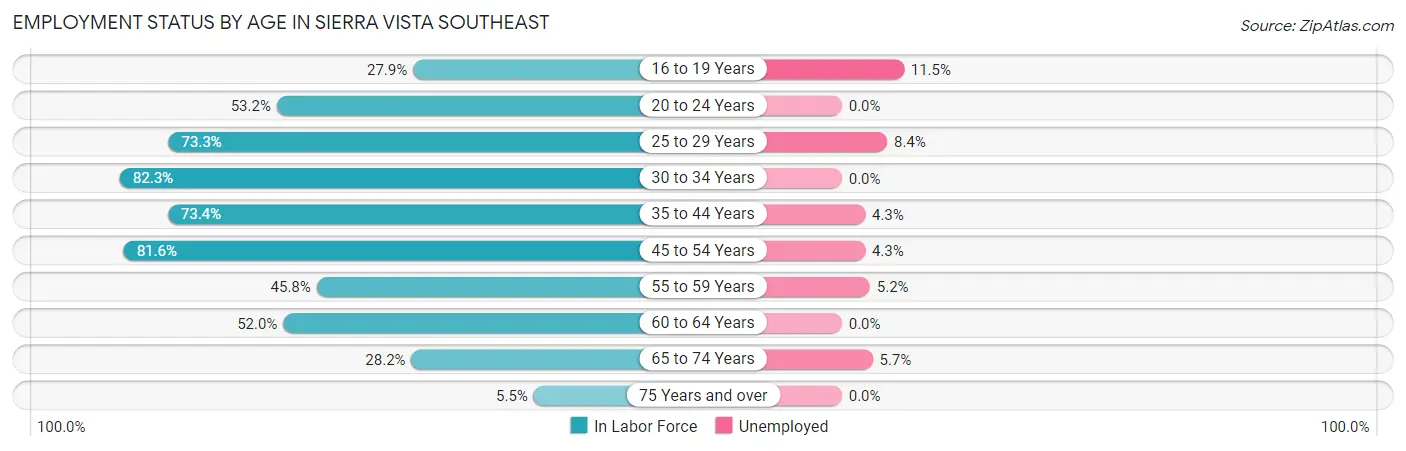
| Age Bracket | In Labor Force | Unemployed |
| 16 to 19 Years | 244 (27.9%) | 28 (11.5%) |
| 20 to 24 Years | 240 (53.2%) | 0 (0.0%) |
| 25 to 29 Years | 359 (73.3%) | 30 (8.4%) |
| 30 to 34 Years | 390 (82.3%) | 0 (0.0%) |
| 35 to 44 Years | 1,067 (73.4%) | 46 (4.3%) |
| 45 to 54 Years | 1,319 (81.6%) | 57 (4.3%) |
| 55 to 59 Years | 466 (45.8%) | 24 (5.2%) |
| 60 to 64 Years | 678 (52.0%) | 0 (0.0%) |
| 65 to 74 Years | 578 (28.2%) | 33 (5.7%) |
| 75 Years and over | 94 (5.5%) | 0 (0.0%) |
| Total | 5,431 (47.5%) | 217 (4.0%) |
Employment Status by Educational Attainment in Sierra Vista Southeast
According to labor force statistics for Sierra Vista Southeast, 67.3% of individuals (4,276) out of the total population between 25 and 64 years of age (6,354) are in the labor force, with 3.7% or 158 of them being unemployed. The group with the highest labor force participation rate are those with the educational attainment of less than high school, with 83.7% or 483 individuals in the labor force. Within the labor force, individuals with bachelor's degree or higher education have the highest percentage of unemployment, with 6.9% or 102 of them being unemployed.
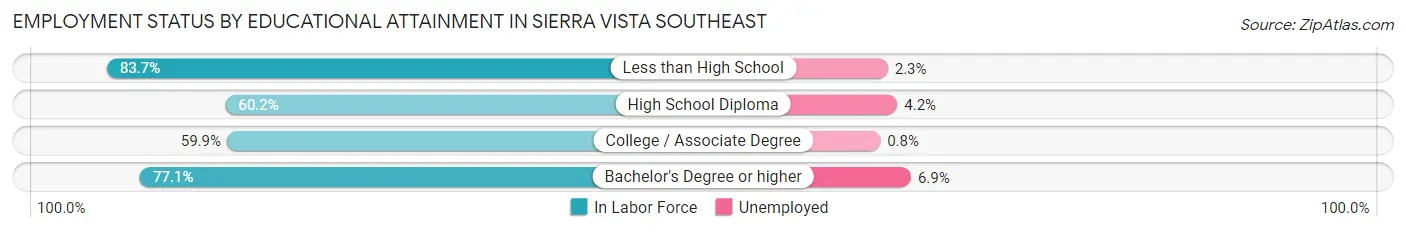
| Educational Attainment | In Labor Force | Unemployed |
| Less than High School | 483 (83.7%) | 13 (2.3%) |
| High School Diploma | 707 (60.2%) | 49 (4.2%) |
| College / Associate Degree | 1,607 (59.9%) | 21 (0.8%) |
| Bachelor's Degree or higher | 1,480 (77.1%) | 132 (6.9%) |
| Total | 4,276 (67.3%) | 235 (3.7%) |
Employment Occupations by Sex in Sierra Vista Southeast
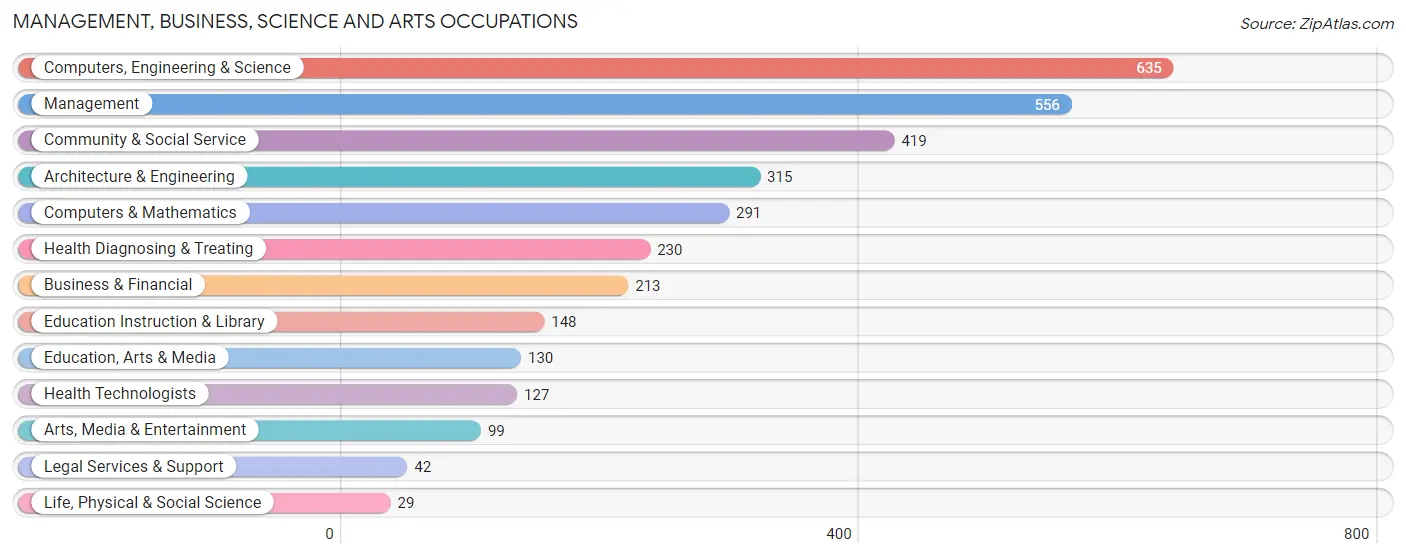
Management, Business, Science and Arts Occupations
The most common Management, Business, Science and Arts occupations in Sierra Vista Southeast are Computers, Engineering & Science (635 | 12.2%), Management (556 | 10.7%), Community & Social Service (419 | 8.1%), Architecture & Engineering (315 | 6.0%), and Computers & Mathematics (291 | 5.6%).
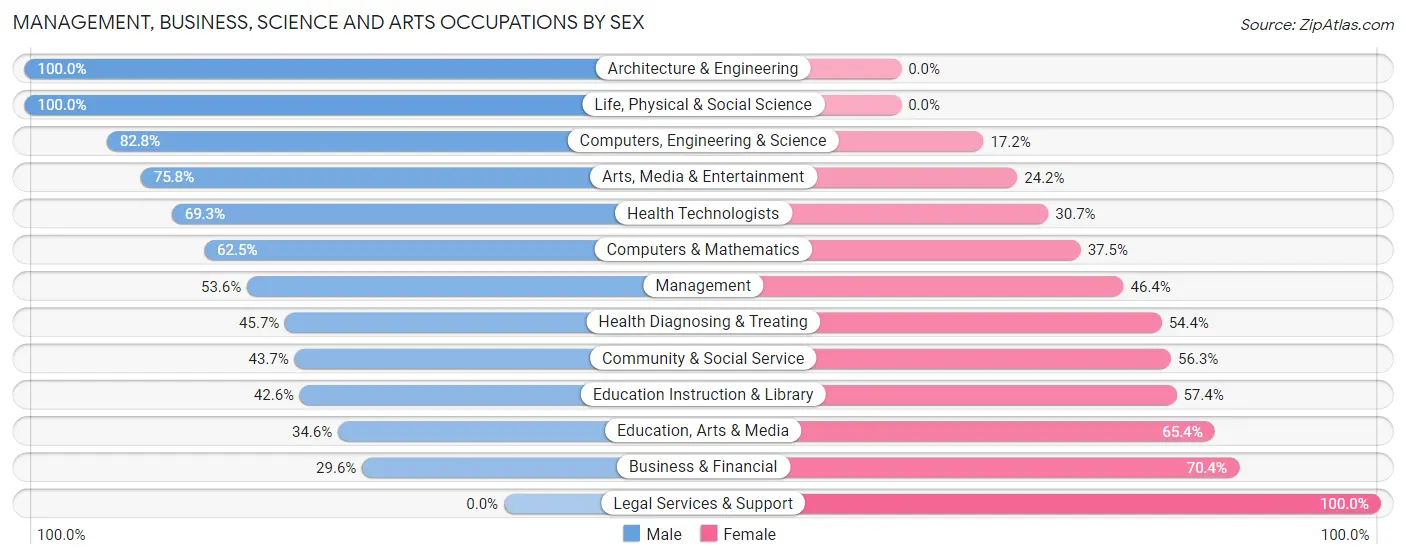
Management, Business, Science and Arts Occupations by Sex
Within the Management, Business, Science and Arts occupations in Sierra Vista Southeast, the most male-oriented occupations are Architecture & Engineering (100.0%), Life, Physical & Social Science (100.0%), and Computers, Engineering & Science (82.8%), while the most female-oriented occupations are Legal Services & Support (100.0%), Business & Financial (70.4%), and Education, Arts & Media (65.4%).
| Occupation | Male | Female |
| Management | 298 (53.6%) | 258 (46.4%) |
| Business & Financial | 63 (29.6%) | 150 (70.4%) |
| Computers, Engineering & Science | 526 (82.8%) | 109 (17.2%) |
| Computers & Mathematics | 182 (62.5%) | 109 (37.5%) |
| Architecture & Engineering | 315 (100.0%) | 0 (0.0%) |
| Life, Physical & Social Science | 29 (100.0%) | 0 (0.0%) |
| Community & Social Service | 183 (43.7%) | 236 (56.3%) |
| Education, Arts & Media | 45 (34.6%) | 85 (65.4%) |
| Legal Services & Support | 0 (0.0%) | 42 (100.0%) |
| Education Instruction & Library | 63 (42.6%) | 85 (57.4%) |
| Arts, Media & Entertainment | 75 (75.8%) | 24 (24.2%) |
| Health Diagnosing & Treating | 105 (45.7%) | 125 (54.3%) |
| Health Technologists | 88 (69.3%) | 39 (30.7%) |
| Total (Category) | 1,175 (57.2%) | 878 (42.8%) |
| Total (Overall) | 2,886 (55.4%) | 2,322 (44.6%) |
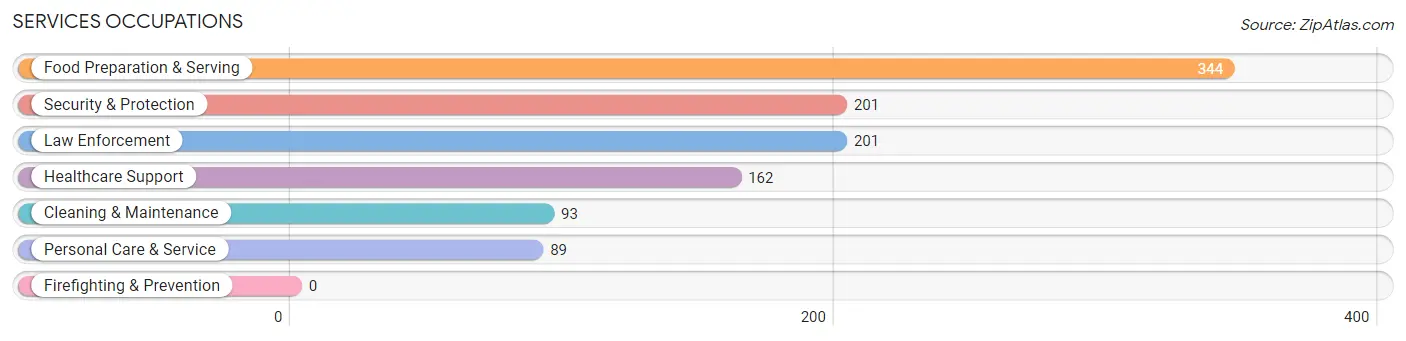
Services Occupations
The most common Services occupations in Sierra Vista Southeast are Food Preparation & Serving (344 | 6.6%), Security & Protection (201 | 3.9%), Law Enforcement (201 | 3.9%), Healthcare Support (162 | 3.1%), and Cleaning & Maintenance (93 | 1.8%).
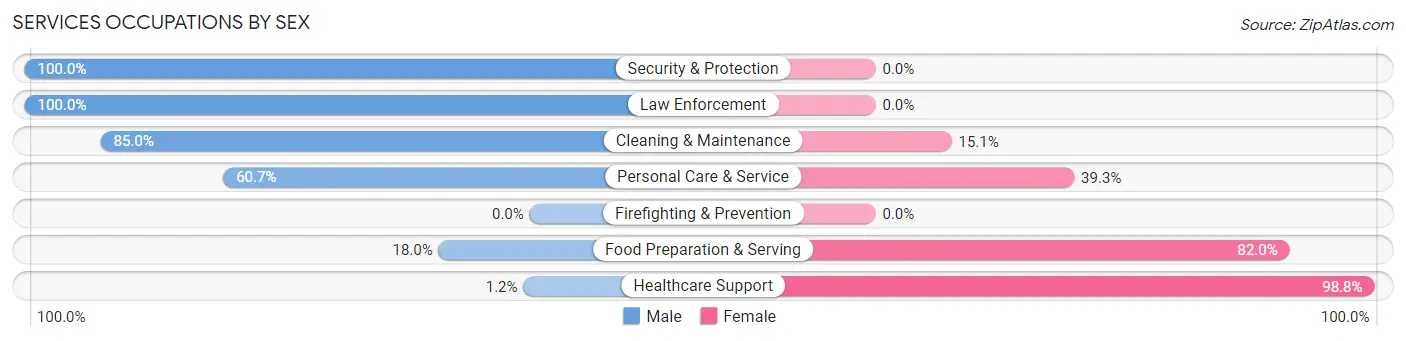
Services Occupations by Sex
Within the Services occupations in Sierra Vista Southeast, the most male-oriented occupations are Security & Protection (100.0%), Law Enforcement (100.0%), and Cleaning & Maintenance (85.0%), while the most female-oriented occupations are Healthcare Support (98.8%), Food Preparation & Serving (82.0%), and Personal Care & Service (39.3%).
| Occupation | Male | Female |
| Healthcare Support | 2 (1.2%) | 160 (98.8%) |
| Security & Protection | 201 (100.0%) | 0 (0.0%) |
| Firefighting & Prevention | 0 (0.0%) | 0 (0.0%) |
| Law Enforcement | 201 (100.0%) | 0 (0.0%) |
| Food Preparation & Serving | 62 (18.0%) | 282 (82.0%) |
| Cleaning & Maintenance | 79 (85.0%) | 14 (15.0%) |
| Personal Care & Service | 54 (60.7%) | 35 (39.3%) |
| Total (Category) | 398 (44.8%) | 491 (55.2%) |
| Total (Overall) | 2,886 (55.4%) | 2,322 (44.6%) |
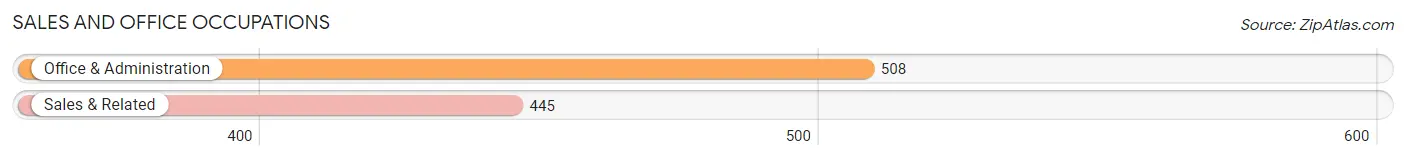
Sales and Office Occupations
The most common Sales and Office occupations in Sierra Vista Southeast are Office & Administration (508 | 9.8%), and Sales & Related (445 | 8.5%).
Sales and Office Occupations by Sex
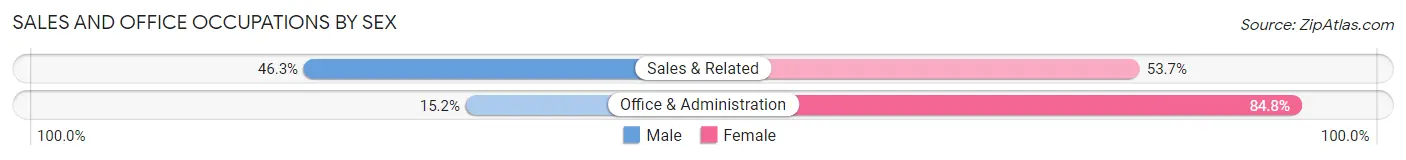
| Occupation | Male | Female |
| Sales & Related | 206 (46.3%) | 239 (53.7%) |
| Office & Administration | 77 (15.2%) | 431 (84.8%) |
| Total (Category) | 283 (29.7%) | 670 (70.3%) |
| Total (Overall) | 2,886 (55.4%) | 2,322 (44.6%) |
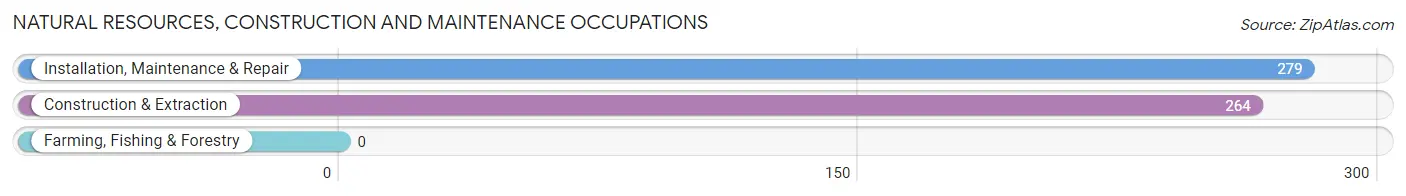
Natural Resources, Construction and Maintenance Occupations
The most common Natural Resources, Construction and Maintenance occupations in Sierra Vista Southeast are Installation, Maintenance & Repair (279 | 5.4%), and Construction & Extraction (264 | 5.1%).
Natural Resources, Construction and Maintenance Occupations by Sex
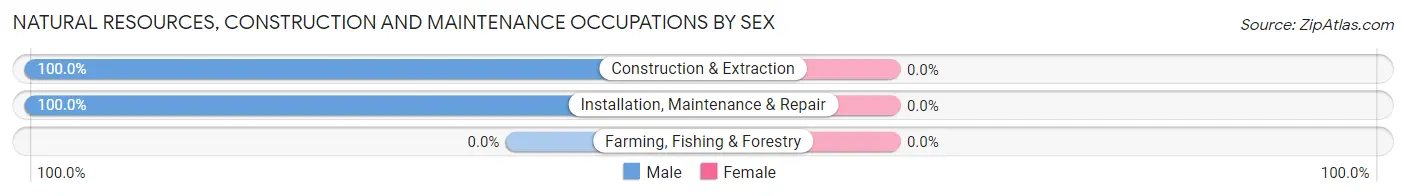
| Occupation | Male | Female |
| Farming, Fishing & Forestry | 0 (0.0%) | 0 (0.0%) |
| Construction & Extraction | 264 (100.0%) | 0 (0.0%) |
| Installation, Maintenance & Repair | 279 (100.0%) | 0 (0.0%) |
| Total (Category) | 543 (100.0%) | 0 (0.0%) |
| Total (Overall) | 2,886 (55.4%) | 2,322 (44.6%) |
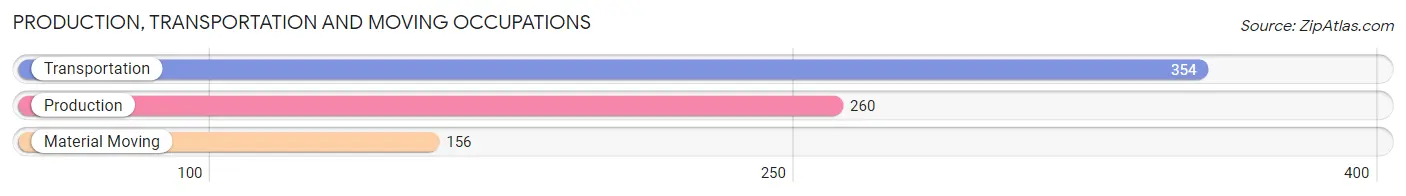
Production, Transportation and Moving Occupations
The most common Production, Transportation and Moving occupations in Sierra Vista Southeast are Transportation (354 | 6.8%), Production (260 | 5.0%), and Material Moving (156 | 3.0%).
Production, Transportation and Moving Occupations by Sex
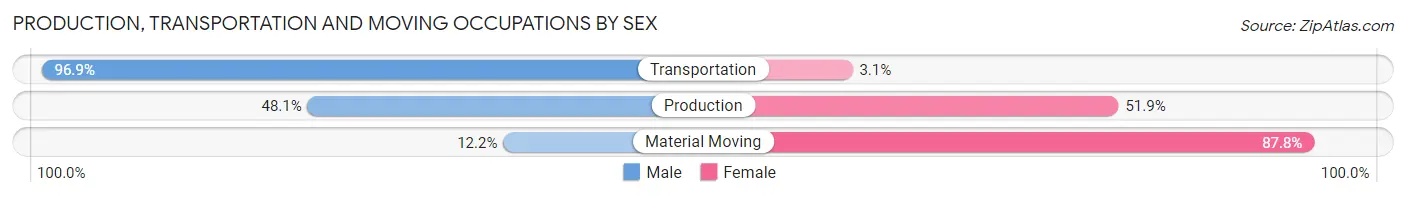
| Occupation | Male | Female |
| Production | 125 (48.1%) | 135 (51.9%) |
| Transportation | 343 (96.9%) | 11 (3.1%) |
| Material Moving | 19 (12.2%) | 137 (87.8%) |
| Total (Category) | 487 (63.2%) | 283 (36.7%) |
| Total (Overall) | 2,886 (55.4%) | 2,322 (44.6%) |
Employment Industries by Sex in Sierra Vista Southeast
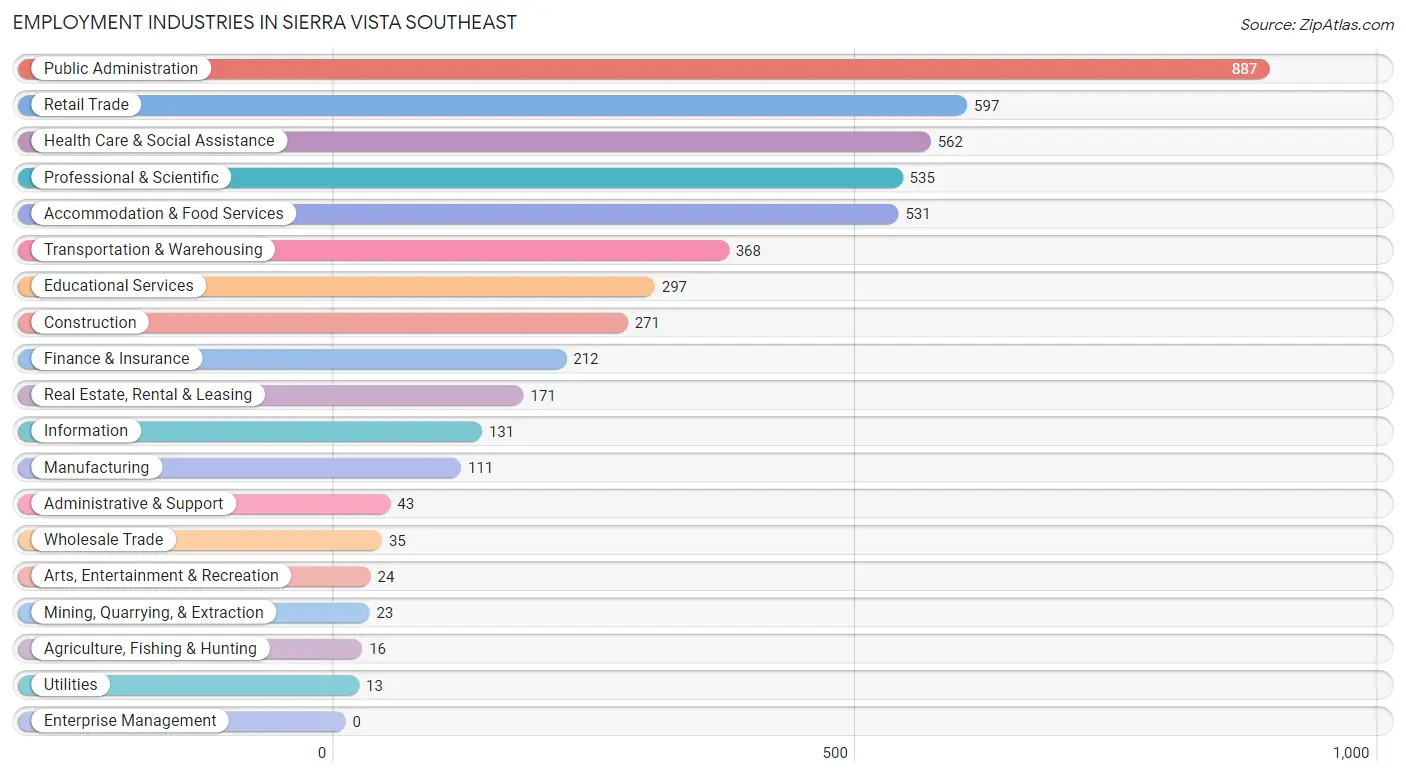
Employment Industries in Sierra Vista Southeast
The major employment industries in Sierra Vista Southeast include Public Administration (887 | 17.0%), Retail Trade (597 | 11.5%), Health Care & Social Assistance (562 | 10.8%), Professional & Scientific (535 | 10.3%), and Accommodation & Food Services (531 | 10.2%).
Employment Industries by Sex in Sierra Vista Southeast
The Sierra Vista Southeast industries that see more men than women are Agriculture, Fishing & Hunting (100.0%), Mining, Quarrying, & Extraction (100.0%), and Construction (100.0%), whereas the industries that tend to have a higher number of women are Utilities (100.0%), Arts, Entertainment & Recreation (100.0%), and Accommodation & Food Services (91.0%).
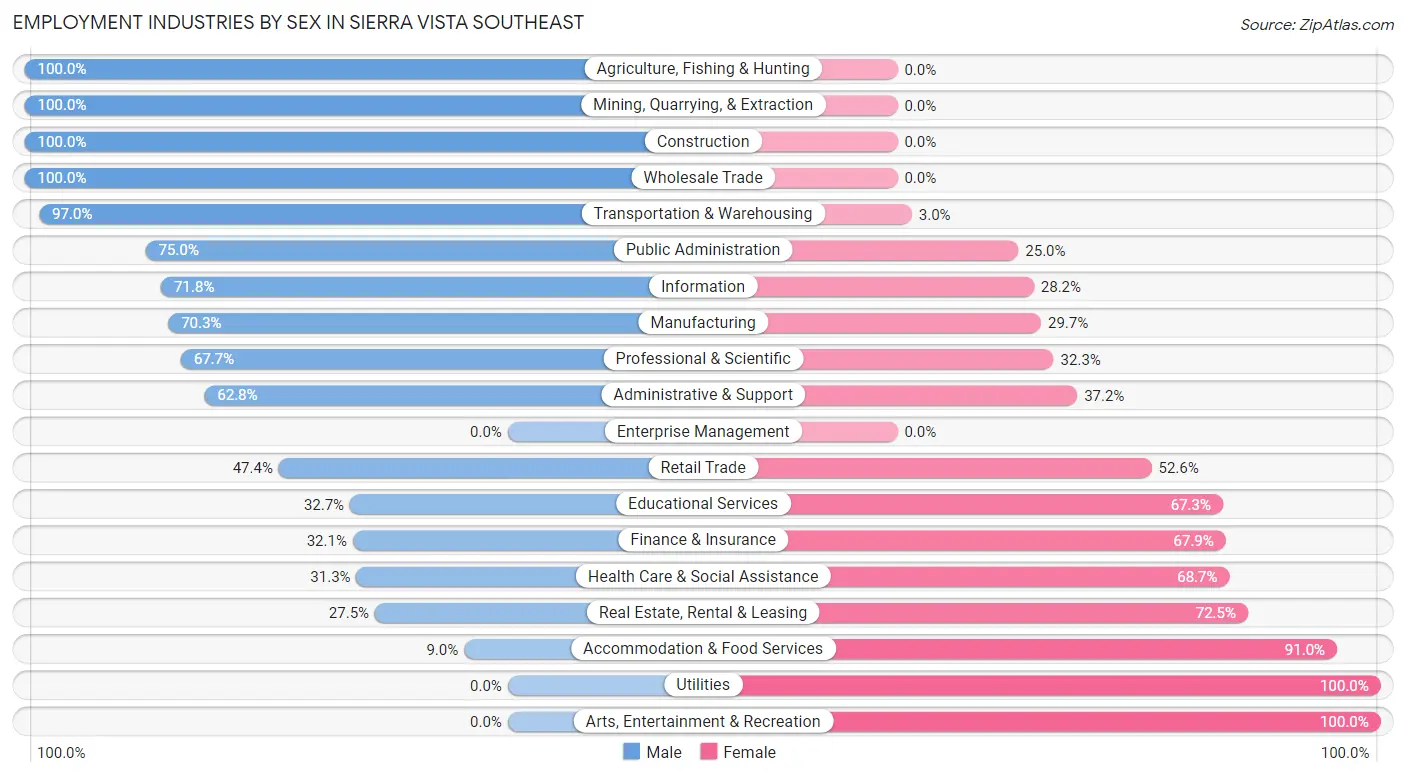
| Industry | Male | Female |
| Agriculture, Fishing & Hunting | 16 (100.0%) | 0 (0.0%) |
| Mining, Quarrying, & Extraction | 23 (100.0%) | 0 (0.0%) |
| Construction | 271 (100.0%) | 0 (0.0%) |
| Manufacturing | 78 (70.3%) | 33 (29.7%) |
| Wholesale Trade | 35 (100.0%) | 0 (0.0%) |
| Retail Trade | 283 (47.4%) | 314 (52.6%) |
| Transportation & Warehousing | 357 (97.0%) | 11 (3.0%) |
| Utilities | 0 (0.0%) | 13 (100.0%) |
| Information | 94 (71.8%) | 37 (28.2%) |
| Finance & Insurance | 68 (32.1%) | 144 (67.9%) |
| Real Estate, Rental & Leasing | 47 (27.5%) | 124 (72.5%) |
| Professional & Scientific | 362 (67.7%) | 173 (32.3%) |
| Enterprise Management | 0 (0.0%) | 0 (0.0%) |
| Administrative & Support | 27 (62.8%) | 16 (37.2%) |
| Educational Services | 97 (32.7%) | 200 (67.3%) |
| Health Care & Social Assistance | 176 (31.3%) | 386 (68.7%) |
| Arts, Entertainment & Recreation | 0 (0.0%) | 24 (100.0%) |
| Accommodation & Food Services | 48 (9.0%) | 483 (91.0%) |
| Public Administration | 665 (75.0%) | 222 (25.0%) |
| Total | 2,886 (55.4%) | 2,322 (44.6%) |
Education in Sierra Vista Southeast
School Enrollment in Sierra Vista Southeast
The most common levels of schooling among the 3,636 students in Sierra Vista Southeast are high school (1,098 | 30.2%), middle school (784 | 21.6%), and elementary school (691 | 19.0%).
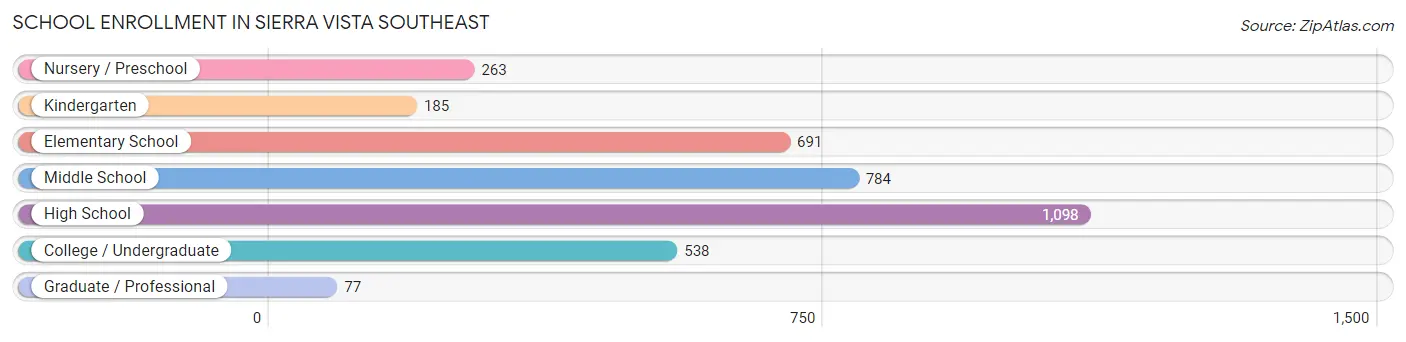
| School Level | # Students | % Students |
| Nursery / Preschool | 263 | 7.2% |
| Kindergarten | 185 | 5.1% |
| Elementary School | 691 | 19.0% |
| Middle School | 784 | 21.6% |
| High School | 1,098 | 30.2% |
| College / Undergraduate | 538 | 14.8% |
| Graduate / Professional | 77 | 2.1% |
| Total | 3,636 | 100.0% |
School Enrollment by Age by Funding Source in Sierra Vista Southeast
Out of a total of 3,636 students who are enrolled in schools in Sierra Vista Southeast, 484 (13.3%) attend a private institution, while the remaining 3,152 (86.7%) are enrolled in public schools. The age group of 3 to 4 year olds has the highest likelihood of being enrolled in private schools, with 108 (54.8% in the age bracket) enrolled. Conversely, the age group of 20 to 24 year olds has the lowest likelihood of being enrolled in a private school, with 62 (100.0% in the age bracket) attending a public institution.
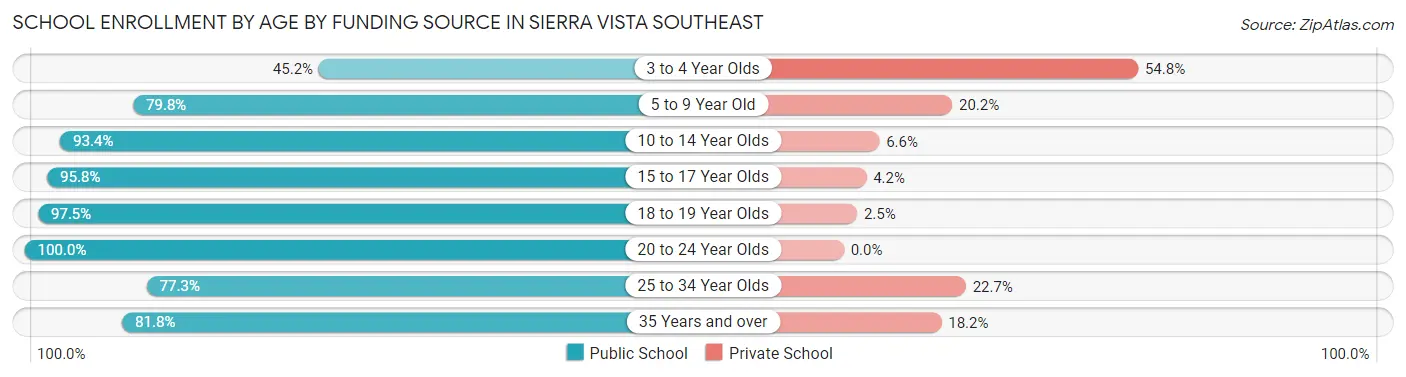
| Age Bracket | Public School | Private School |
| 3 to 4 Year Olds | 89 (45.2%) | 108 (54.8%) |
| 5 to 9 Year Old | 656 (79.8%) | 166 (20.2%) |
| 10 to 14 Year Olds | 959 (93.4%) | 68 (6.6%) |
| 15 to 17 Year Olds | 775 (95.8%) | 34 (4.2%) |
| 18 to 19 Year Olds | 197 (97.5%) | 5 (2.5%) |
| 20 to 24 Year Olds | 62 (100.0%) | 0 (0.0%) |
| 25 to 34 Year Olds | 136 (77.3%) | 40 (22.7%) |
| 35 Years and over | 279 (81.8%) | 62 (18.2%) |
| Total | 3,152 (86.7%) | 484 (13.3%) |
Educational Attainment by Field of Study in Sierra Vista Southeast
Business (510 | 14.2%), education (376 | 10.4%), arts & humanities (355 | 9.9%), computers & mathematics (354 | 9.8%), and engineering (350 | 9.7%) are the most common fields of study among 3,598 individuals in Sierra Vista Southeast who have obtained a bachelor's degree or higher.
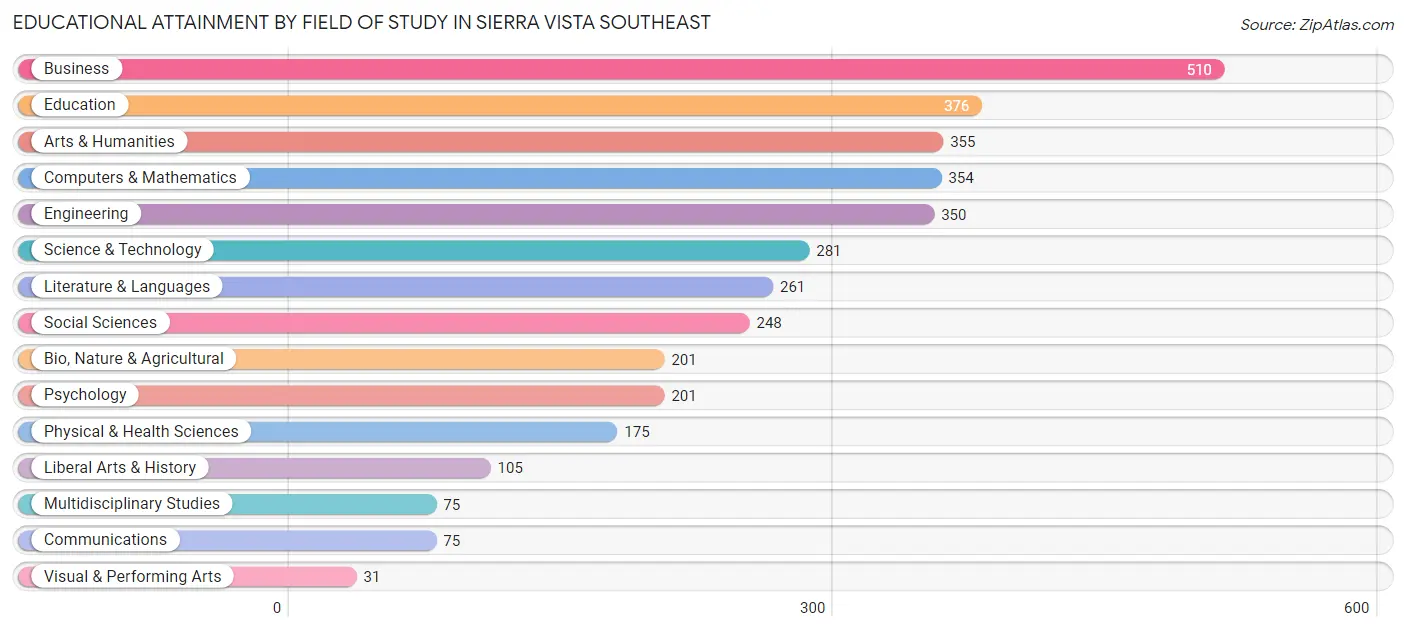
| Field of Study | # Graduates | % Graduates |
| Computers & Mathematics | 354 | 9.8% |
| Bio, Nature & Agricultural | 201 | 5.6% |
| Physical & Health Sciences | 175 | 4.9% |
| Psychology | 201 | 5.6% |
| Social Sciences | 248 | 6.9% |
| Engineering | 350 | 9.7% |
| Multidisciplinary Studies | 75 | 2.1% |
| Science & Technology | 281 | 7.8% |
| Business | 510 | 14.2% |
| Education | 376 | 10.4% |
| Literature & Languages | 261 | 7.2% |
| Liberal Arts & History | 105 | 2.9% |
| Visual & Performing Arts | 31 | 0.9% |
| Communications | 75 | 2.1% |
| Arts & Humanities | 355 | 9.9% |
| Total | 3,598 | 100.0% |
Transportation & Commute in Sierra Vista Southeast
Vehicle Availability by Sex in Sierra Vista Southeast
The most prevalent vehicle ownership categories in Sierra Vista Southeast are males with 2 vehicles (1,004, accounting for 36.0%) and females with 2 vehicles (928, making up 44.3%).
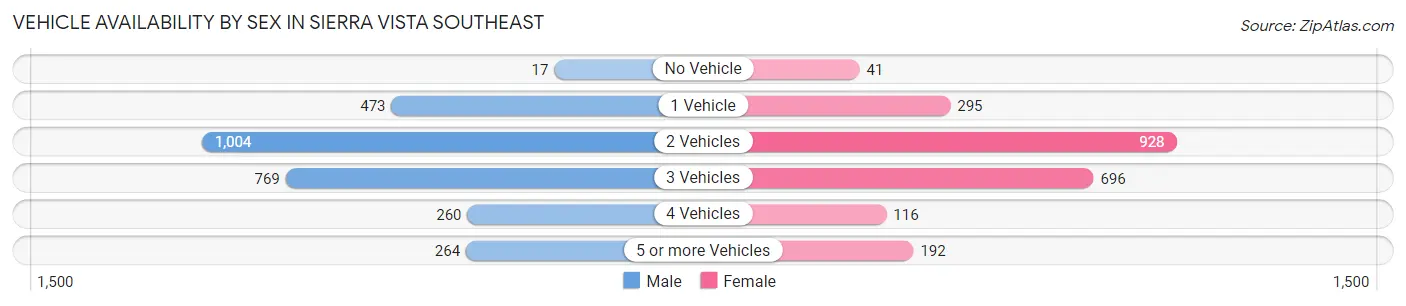
| Vehicles Available | Male | Female |
| No Vehicle | 17 (0.6%) | 41 (1.8%) |
| 1 Vehicle | 473 (17.0%) | 295 (13.0%) |
| 2 Vehicles | 1,004 (36.0%) | 928 (40.9%) |
| 3 Vehicles | 769 (27.6%) | 696 (30.7%) |
| 4 Vehicles | 260 (9.3%) | 116 (5.1%) |
| 5 or more Vehicles | 264 (9.5%) | 192 (8.5%) |
| Total | 2,787 (100.0%) | 2,268 (100.0%) |
Commute Time in Sierra Vista Southeast
The most frequently occuring commute durations in Sierra Vista Southeast are 15 to 19 minutes (1,127 commuters, 24.5%), 20 to 24 minutes (812 commuters, 17.7%), and 30 to 34 minutes (563 commuters, 12.3%).
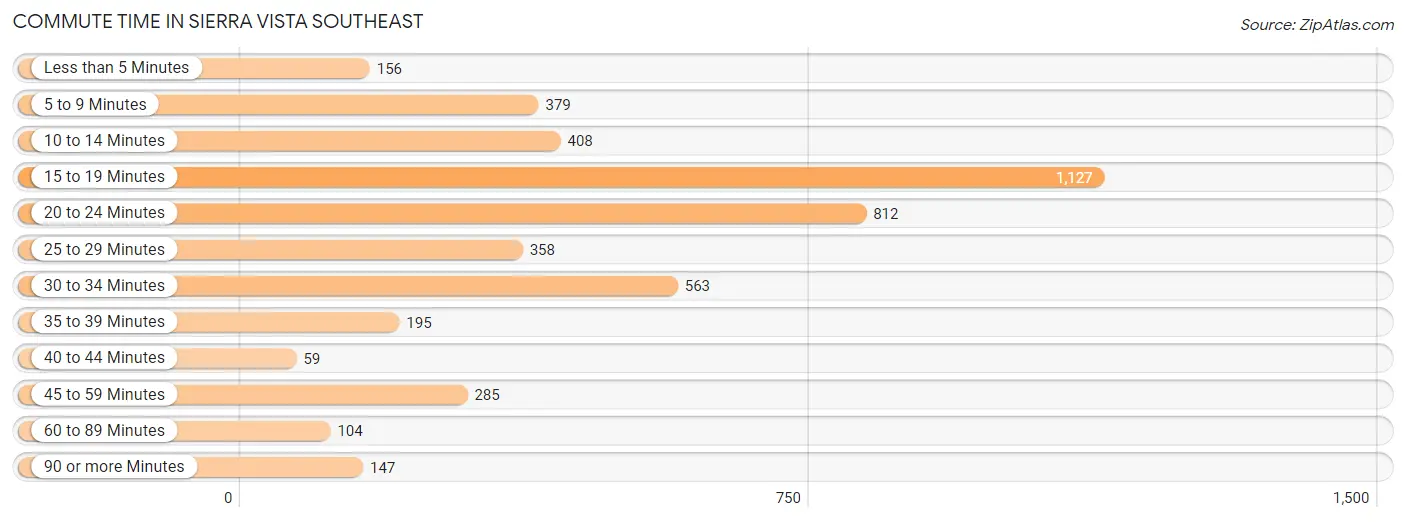
| Commute Time | # Commuters | % Commuters |
| Less than 5 Minutes | 156 | 3.4% |
| 5 to 9 Minutes | 379 | 8.3% |
| 10 to 14 Minutes | 408 | 8.9% |
| 15 to 19 Minutes | 1,127 | 24.5% |
| 20 to 24 Minutes | 812 | 17.7% |
| 25 to 29 Minutes | 358 | 7.8% |
| 30 to 34 Minutes | 563 | 12.3% |
| 35 to 39 Minutes | 195 | 4.3% |
| 40 to 44 Minutes | 59 | 1.3% |
| 45 to 59 Minutes | 285 | 6.2% |
| 60 to 89 Minutes | 104 | 2.3% |
| 90 or more Minutes | 147 | 3.2% |
Commute Time by Sex in Sierra Vista Southeast
The most common commute times in Sierra Vista Southeast are 15 to 19 minutes (631 commuters, 24.6%) for males and 15 to 19 minutes (496 commuters, 24.5%) for females.
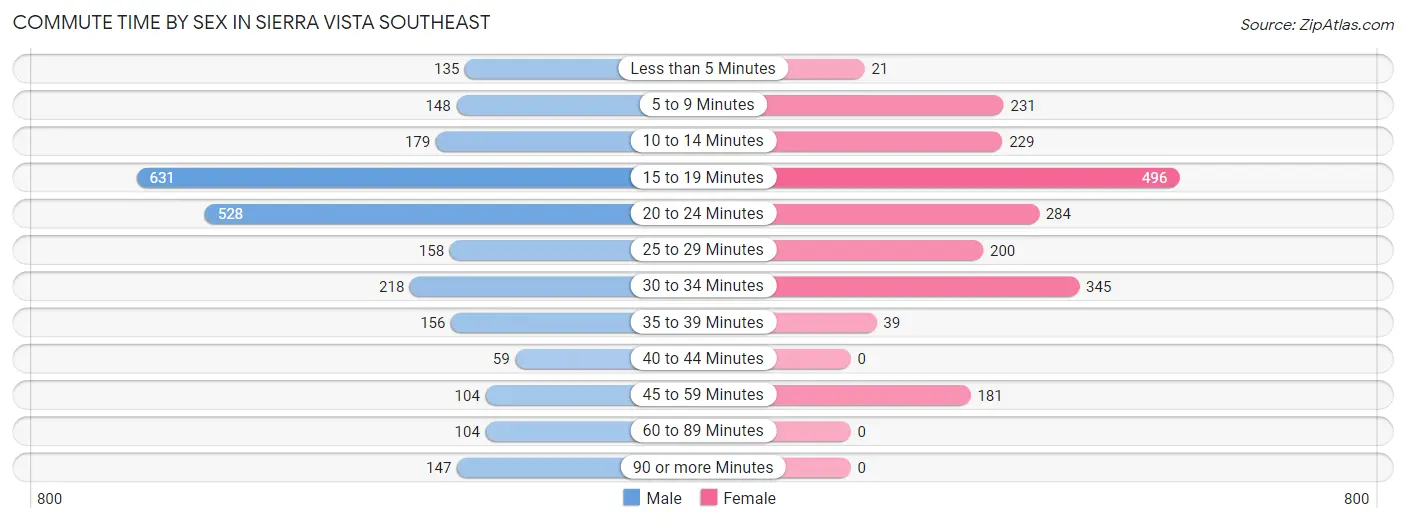
| Commute Time | Male | Female |
| Less than 5 Minutes | 135 (5.3%) | 21 (1.0%) |
| 5 to 9 Minutes | 148 (5.8%) | 231 (11.4%) |
| 10 to 14 Minutes | 179 (7.0%) | 229 (11.3%) |
| 15 to 19 Minutes | 631 (24.6%) | 496 (24.5%) |
| 20 to 24 Minutes | 528 (20.6%) | 284 (14.0%) |
| 25 to 29 Minutes | 158 (6.2%) | 200 (9.9%) |
| 30 to 34 Minutes | 218 (8.5%) | 345 (17.0%) |
| 35 to 39 Minutes | 156 (6.1%) | 39 (1.9%) |
| 40 to 44 Minutes | 59 (2.3%) | 0 (0.0%) |
| 45 to 59 Minutes | 104 (4.1%) | 181 (8.9%) |
| 60 to 89 Minutes | 104 (4.1%) | 0 (0.0%) |
| 90 or more Minutes | 147 (5.7%) | 0 (0.0%) |
Time of Departure to Work by Sex in Sierra Vista Southeast
The most frequent times of departure to work in Sierra Vista Southeast are 12:00 AM to 4:59 AM (526, 20.5%) for males and 7:00 AM to 7:29 AM (254, 12.5%) for females.
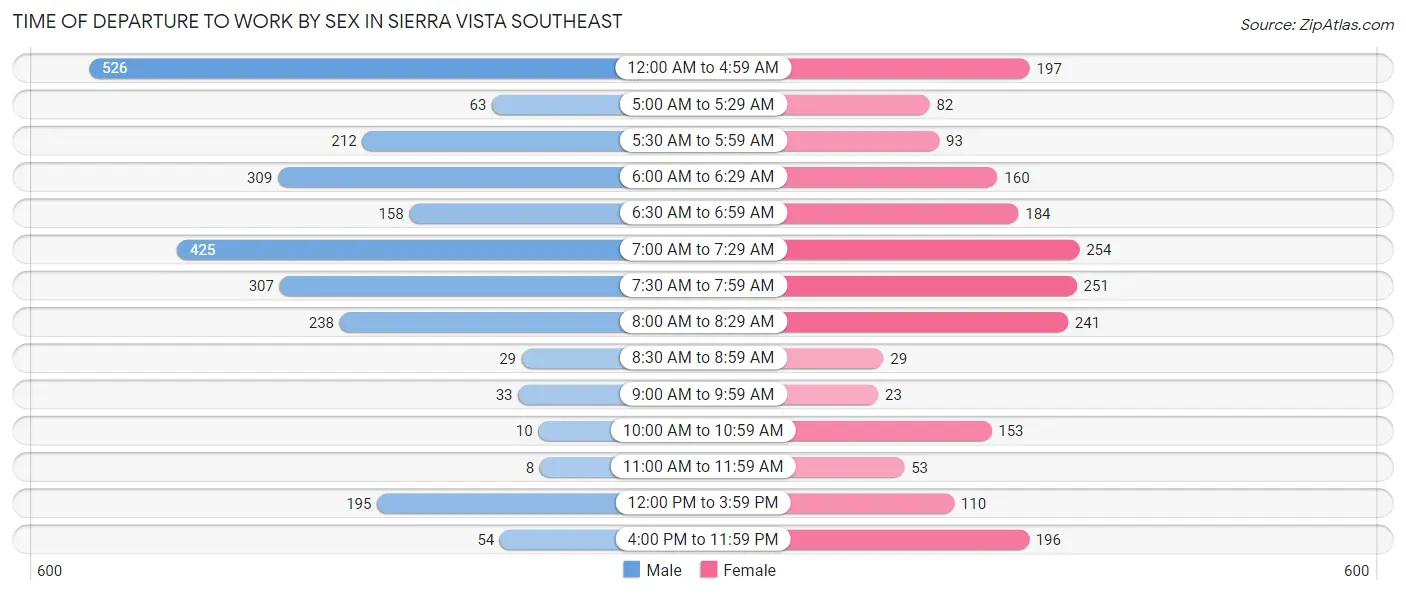
| Time of Departure | Male | Female |
| 12:00 AM to 4:59 AM | 526 (20.5%) | 197 (9.7%) |
| 5:00 AM to 5:29 AM | 63 (2.5%) | 82 (4.1%) |
| 5:30 AM to 5:59 AM | 212 (8.3%) | 93 (4.6%) |
| 6:00 AM to 6:29 AM | 309 (12.0%) | 160 (7.9%) |
| 6:30 AM to 6:59 AM | 158 (6.2%) | 184 (9.1%) |
| 7:00 AM to 7:29 AM | 425 (16.6%) | 254 (12.5%) |
| 7:30 AM to 7:59 AM | 307 (12.0%) | 251 (12.4%) |
| 8:00 AM to 8:29 AM | 238 (9.3%) | 241 (11.9%) |
| 8:30 AM to 8:59 AM | 29 (1.1%) | 29 (1.4%) |
| 9:00 AM to 9:59 AM | 33 (1.3%) | 23 (1.1%) |
| 10:00 AM to 10:59 AM | 10 (0.4%) | 153 (7.5%) |
| 11:00 AM to 11:59 AM | 8 (0.3%) | 53 (2.6%) |
| 12:00 PM to 3:59 PM | 195 (7.6%) | 110 (5.4%) |
| 4:00 PM to 11:59 PM | 54 (2.1%) | 196 (9.7%) |
| Total | 2,567 (100.0%) | 2,026 (100.0%) |
Housing Occupancy in Sierra Vista Southeast
Occupancy by Ownership in Sierra Vista Southeast
Of the total 6,050 dwellings in Sierra Vista Southeast, owner-occupied units account for 5,021 (83.0%), while renter-occupied units make up 1,029 (17.0%).
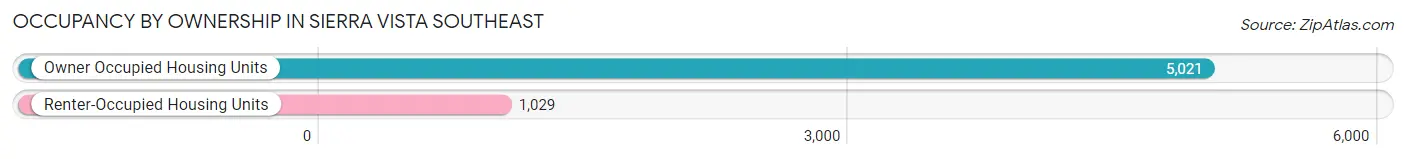
| Occupancy | # Housing Units | % Housing Units |
| Owner Occupied Housing Units | 5,021 | 83.0% |
| Renter-Occupied Housing Units | 1,029 | 17.0% |
| Total Occupied Housing Units | 6,050 | 100.0% |
Occupancy by Household Size in Sierra Vista Southeast
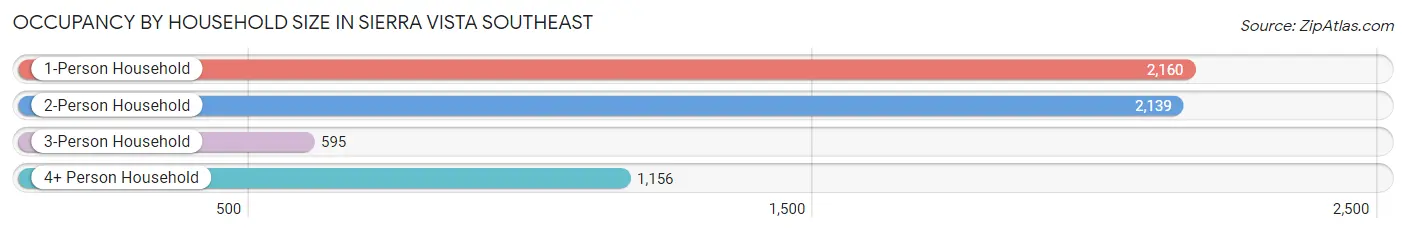
| Household Size | # Housing Units | % Housing Units |
| 1-Person Household | 2,160 | 35.7% |
| 2-Person Household | 2,139 | 35.4% |
| 3-Person Household | 595 | 9.8% |
| 4+ Person Household | 1,156 | 19.1% |
| Total Housing Units | 6,050 | 100.0% |
Occupancy by Ownership by Household Size in Sierra Vista Southeast
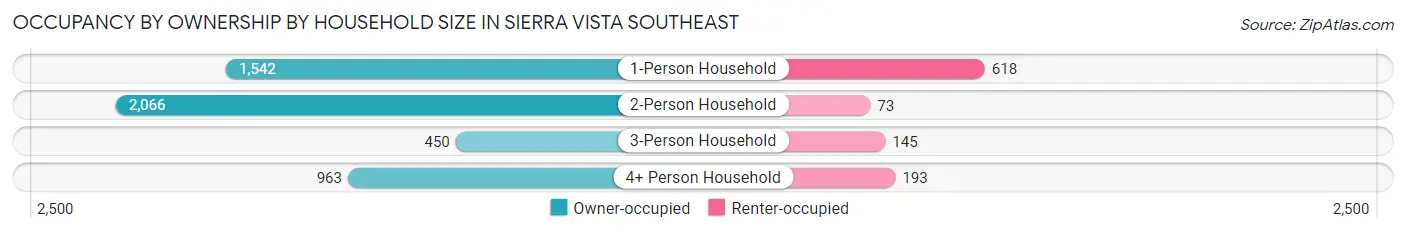
| Household Size | Owner-occupied | Renter-occupied |
| 1-Person Household | 1,542 (71.4%) | 618 (28.6%) |
| 2-Person Household | 2,066 (96.6%) | 73 (3.4%) |
| 3-Person Household | 450 (75.6%) | 145 (24.4%) |
| 4+ Person Household | 963 (83.3%) | 193 (16.7%) |
| Total Housing Units | 5,021 (83.0%) | 1,029 (17.0%) |
Occupancy by Educational Attainment in Sierra Vista Southeast
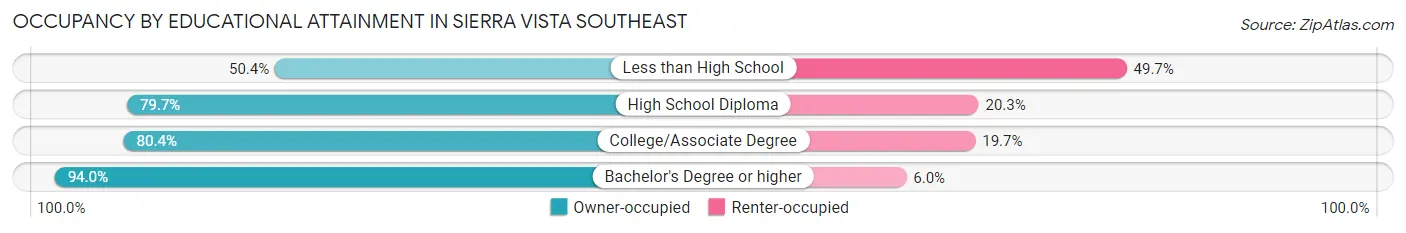
| Household Size | Owner-occupied | Renter-occupied |
| Less than High School | 214 (50.3%) | 211 (49.6%) |
| High School Diploma | 958 (79.7%) | 244 (20.3%) |
| College/Associate Degree | 1,820 (80.3%) | 445 (19.7%) |
| Bachelor's Degree or higher | 2,029 (94.0%) | 129 (6.0%) |
Occupancy by Age of Householder in Sierra Vista Southeast
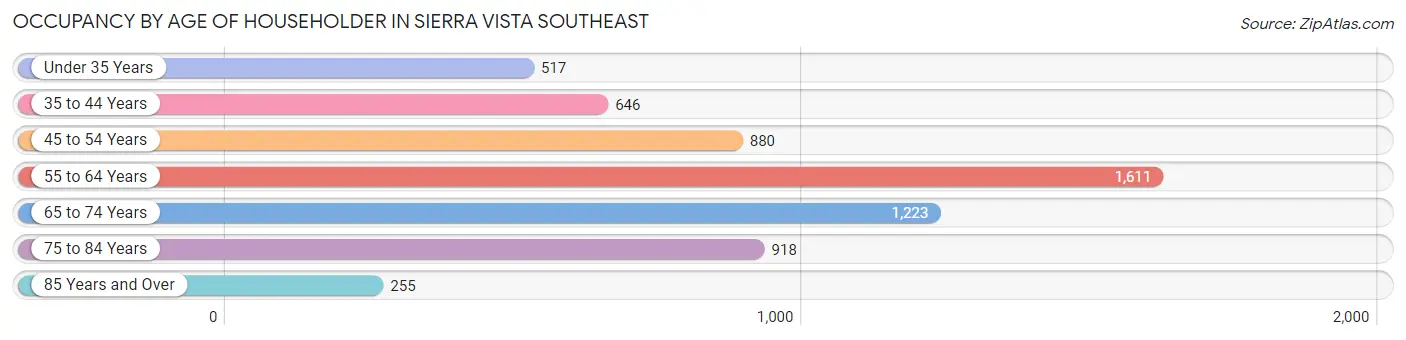
| Age Bracket | # Households | % Households |
| Under 35 Years | 517 | 8.6% |
| 35 to 44 Years | 646 | 10.7% |
| 45 to 54 Years | 880 | 14.5% |
| 55 to 64 Years | 1,611 | 26.6% |
| 65 to 74 Years | 1,223 | 20.2% |
| 75 to 84 Years | 918 | 15.2% |
| 85 Years and Over | 255 | 4.2% |
| Total | 6,050 | 100.0% |
Housing Finances in Sierra Vista Southeast
Median Income by Occupancy in Sierra Vista Southeast
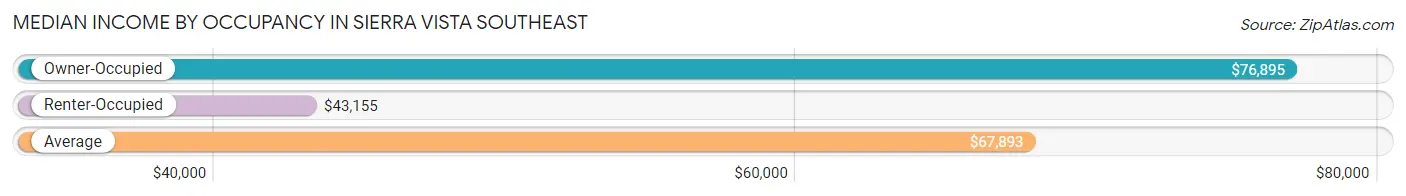
| Occupancy Type | # Households | Median Income |
| Owner-Occupied | 5,021 (83.0%) | $76,895 |
| Renter-Occupied | 1,029 (17.0%) | $43,155 |
| Average | 6,050 (100.0%) | $67,893 |
Occupancy by Householder Income Bracket in Sierra Vista Southeast
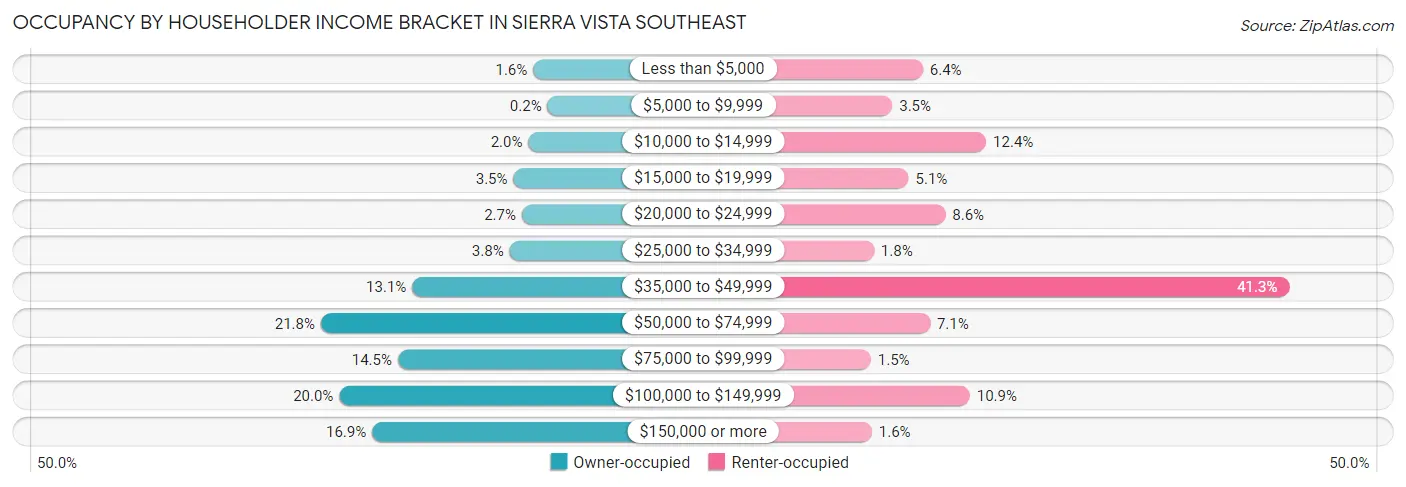
| Income Bracket | Owner-occupied | Renter-occupied |
| Less than $5,000 | 79 (1.6%) | 66 (6.4%) |
| $5,000 to $9,999 | 10 (0.2%) | 36 (3.5%) |
| $10,000 to $14,999 | 102 (2.0%) | 128 (12.4%) |
| $15,000 to $19,999 | 173 (3.5%) | 52 (5.1%) |
| $20,000 to $24,999 | 133 (2.6%) | 88 (8.6%) |
| $25,000 to $34,999 | 192 (3.8%) | 18 (1.8%) |
| $35,000 to $49,999 | 657 (13.1%) | 425 (41.3%) |
| $50,000 to $74,999 | 1,094 (21.8%) | 73 (7.1%) |
| $75,000 to $99,999 | 726 (14.5%) | 15 (1.5%) |
| $100,000 to $149,999 | 1,006 (20.0%) | 112 (10.9%) |
| $150,000 or more | 849 (16.9%) | 16 (1.5%) |
| Total | 5,021 (100.0%) | 1,029 (100.0%) |
Monthly Housing Cost Tiers in Sierra Vista Southeast
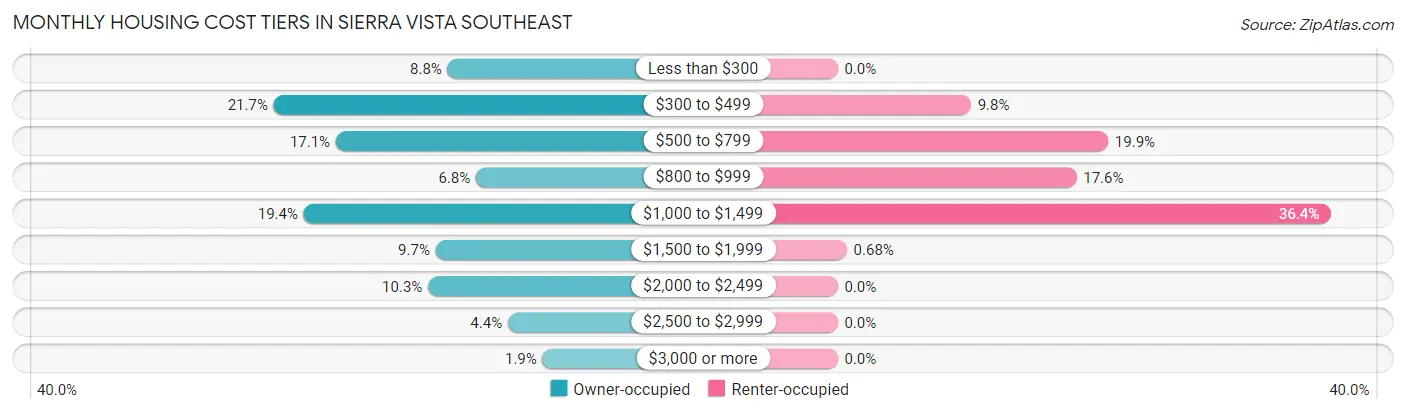
| Monthly Cost | Owner-occupied | Renter-occupied |
| Less than $300 | 444 (8.8%) | 0 (0.0%) |
| $300 to $499 | 1,087 (21.6%) | 101 (9.8%) |
| $500 to $799 | 857 (17.1%) | 205 (19.9%) |
| $800 to $999 | 339 (6.8%) | 181 (17.6%) |
| $1,000 to $1,499 | 976 (19.4%) | 374 (36.3%) |
| $1,500 to $1,999 | 488 (9.7%) | 7 (0.7%) |
| $2,000 to $2,499 | 516 (10.3%) | 0 (0.0%) |
| $2,500 to $2,999 | 221 (4.4%) | 0 (0.0%) |
| $3,000 or more | 93 (1.8%) | 0 (0.0%) |
| Total | 5,021 (100.0%) | 1,029 (100.0%) |
Physical Housing Characteristics in Sierra Vista Southeast
Housing Structures in Sierra Vista Southeast
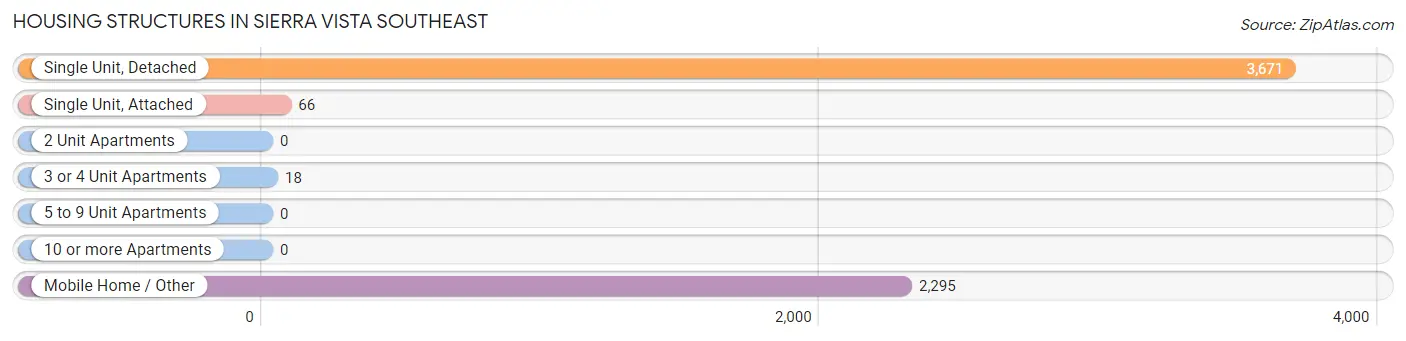
| Structure Type | # Housing Units | % Housing Units |
| Single Unit, Detached | 3,671 | 60.7% |
| Single Unit, Attached | 66 | 1.1% |
| 2 Unit Apartments | 0 | 0.0% |
| 3 or 4 Unit Apartments | 18 | 0.3% |
| 5 to 9 Unit Apartments | 0 | 0.0% |
| 10 or more Apartments | 0 | 0.0% |
| Mobile Home / Other | 2,295 | 37.9% |
| Total | 6,050 | 100.0% |
Housing Structures by Occupancy in Sierra Vista Southeast
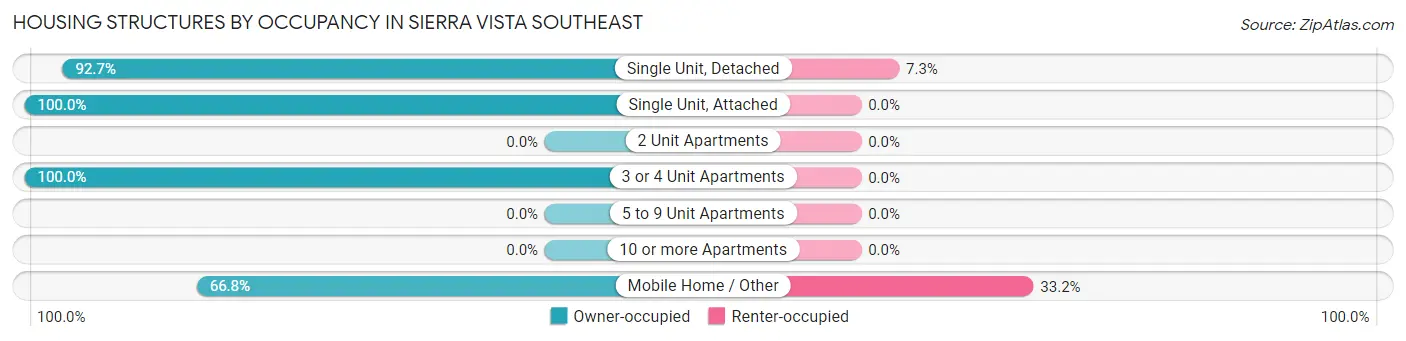
| Structure Type | Owner-occupied | Renter-occupied |
| Single Unit, Detached | 3,403 (92.7%) | 268 (7.3%) |
| Single Unit, Attached | 66 (100.0%) | 0 (0.0%) |
| 2 Unit Apartments | 0 (0.0%) | 0 (0.0%) |
| 3 or 4 Unit Apartments | 18 (100.0%) | 0 (0.0%) |
| 5 to 9 Unit Apartments | 0 (0.0%) | 0 (0.0%) |
| 10 or more Apartments | 0 (0.0%) | 0 (0.0%) |
| Mobile Home / Other | 1,534 (66.8%) | 761 (33.2%) |
| Total | 5,021 (83.0%) | 1,029 (17.0%) |
Housing Structures by Number of Rooms in Sierra Vista Southeast
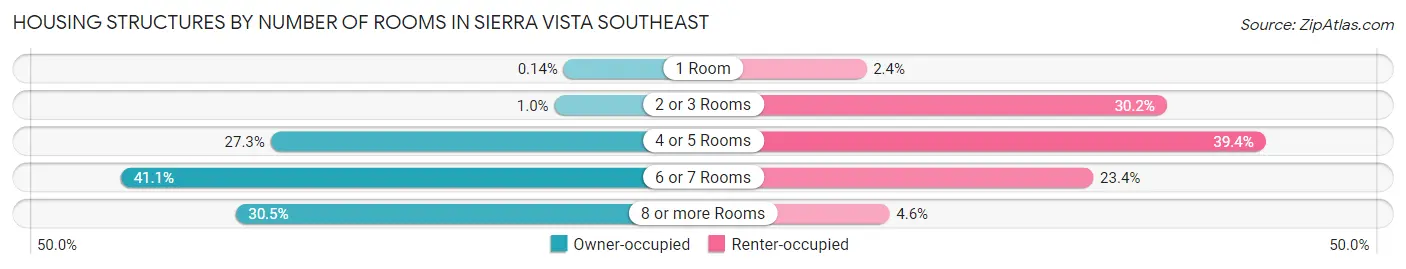
| Number of Rooms | Owner-occupied | Renter-occupied |
| 1 Room | 7 (0.1%) | 25 (2.4%) |
| 2 or 3 Rooms | 50 (1.0%) | 311 (30.2%) |
| 4 or 5 Rooms | 1,368 (27.3%) | 405 (39.4%) |
| 6 or 7 Rooms | 2,064 (41.1%) | 241 (23.4%) |
| 8 or more Rooms | 1,532 (30.5%) | 47 (4.6%) |
| Total | 5,021 (100.0%) | 1,029 (100.0%) |
Housing Structure by Heating Type in Sierra Vista Southeast
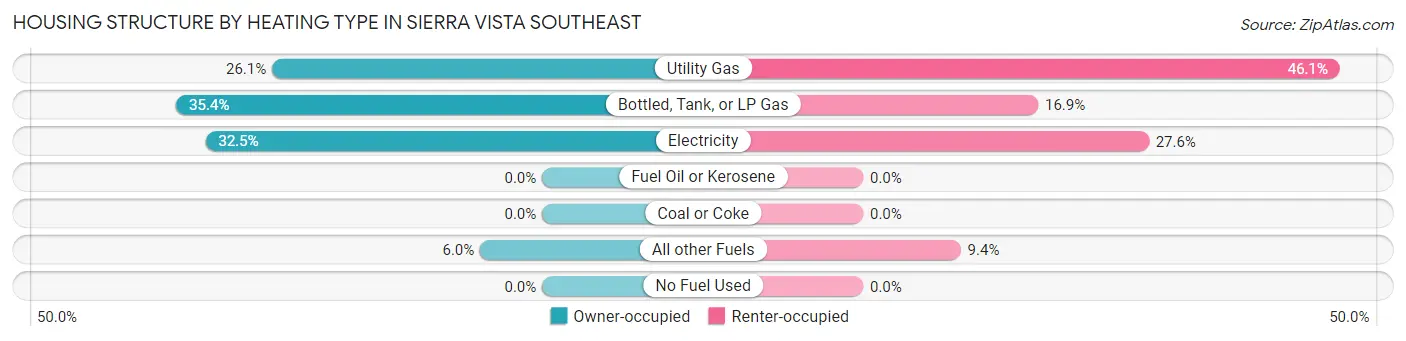
| Heating Type | Owner-occupied | Renter-occupied |
| Utility Gas | 1,310 (26.1%) | 474 (46.1%) |
| Bottled, Tank, or LP Gas | 1,776 (35.4%) | 174 (16.9%) |
| Electricity | 1,634 (32.5%) | 284 (27.6%) |
| Fuel Oil or Kerosene | 0 (0.0%) | 0 (0.0%) |
| Coal or Coke | 0 (0.0%) | 0 (0.0%) |
| All other Fuels | 301 (6.0%) | 97 (9.4%) |
| No Fuel Used | 0 (0.0%) | 0 (0.0%) |
| Total | 5,021 (100.0%) | 1,029 (100.0%) |
Household Vehicle Usage in Sierra Vista Southeast
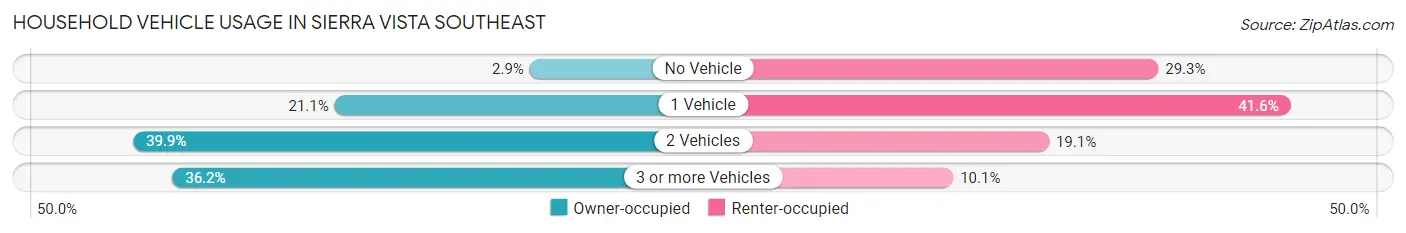
| Vehicles per Household | Owner-occupied | Renter-occupied |
| No Vehicle | 143 (2.9%) | 301 (29.2%) |
| 1 Vehicle | 1,058 (21.1%) | 428 (41.6%) |
| 2 Vehicles | 2,002 (39.9%) | 196 (19.1%) |
| 3 or more Vehicles | 1,818 (36.2%) | 104 (10.1%) |
| Total | 5,021 (100.0%) | 1,029 (100.0%) |
Real Estate & Mortgages in Sierra Vista Southeast
Real Estate and Mortgage Overview in Sierra Vista Southeast
| Characteristic | Without Mortgage | With Mortgage |
| Housing Units | 2,350 | 2,671 |
| Median Property Value | $203,500 | $264,300 |
| Median Household Income | $64,412 | $636 |
| Monthly Housing Costs | $444 | $67 |
| Real Estate Taxes | $1,697 | $75 |
Property Value by Mortgage Status in Sierra Vista Southeast
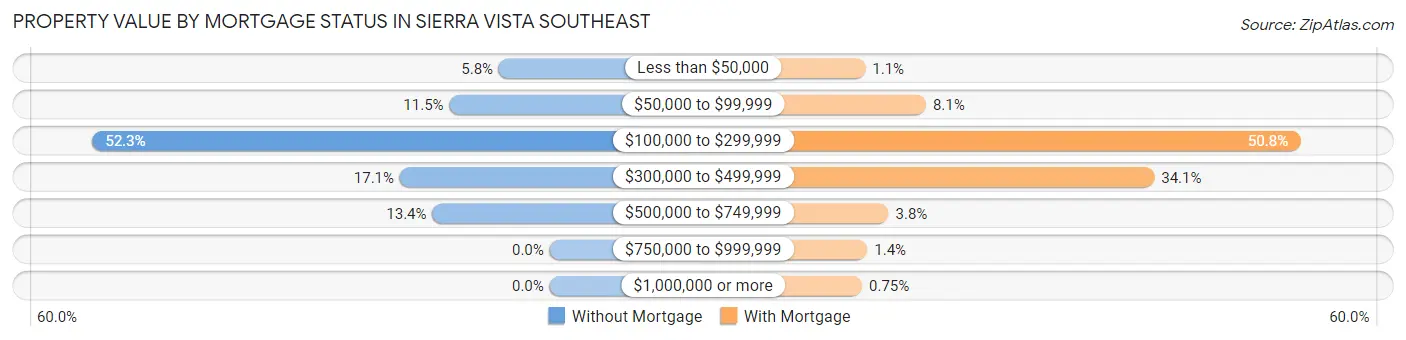
| Property Value | Without Mortgage | With Mortgage |
| Less than $50,000 | 136 (5.8%) | 30 (1.1%) |
| $50,000 to $99,999 | 269 (11.5%) | 215 (8.1%) |
| $100,000 to $299,999 | 1,228 (52.3%) | 1,357 (50.8%) |
| $300,000 to $499,999 | 402 (17.1%) | 912 (34.1%) |
| $500,000 to $749,999 | 315 (13.4%) | 101 (3.8%) |
| $750,000 to $999,999 | 0 (0.0%) | 36 (1.3%) |
| $1,000,000 or more | 0 (0.0%) | 20 (0.7%) |
| Total | 2,350 (100.0%) | 2,671 (100.0%) |
Household Income by Mortgage Status in Sierra Vista Southeast
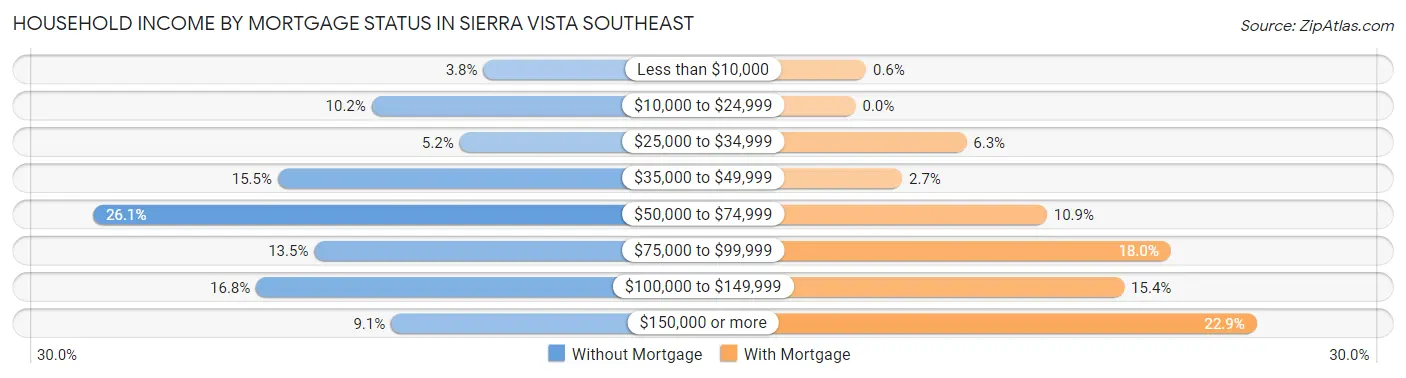
| Household Income | Without Mortgage | With Mortgage |
| Less than $10,000 | 89 (3.8%) | 16 (0.6%) |
| $10,000 to $24,999 | 239 (10.2%) | 0 (0.0%) |
| $25,000 to $34,999 | 121 (5.1%) | 169 (6.3%) |
| $35,000 to $49,999 | 365 (15.5%) | 71 (2.7%) |
| $50,000 to $74,999 | 613 (26.1%) | 292 (10.9%) |
| $75,000 to $99,999 | 316 (13.5%) | 481 (18.0%) |
| $100,000 to $149,999 | 394 (16.8%) | 410 (15.3%) |
| $150,000 or more | 213 (9.1%) | 612 (22.9%) |
| Total | 2,350 (100.0%) | 2,671 (100.0%) |
Property Value to Household Income Ratio in Sierra Vista Southeast
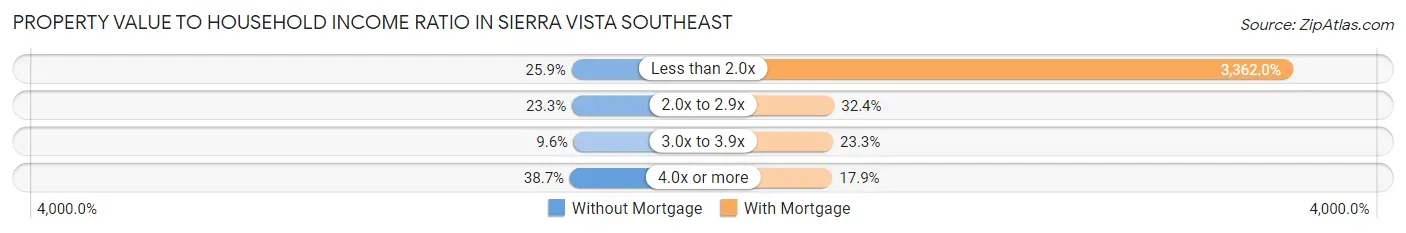
| Value-to-Income Ratio | Without Mortgage | With Mortgage |
| Less than 2.0x | 608 (25.9%) | 89,800 (3,362.0%) |
| 2.0x to 2.9x | 547 (23.3%) | 866 (32.4%) |
| 3.0x to 3.9x | 225 (9.6%) | 622 (23.3%) |
| 4.0x or more | 910 (38.7%) | 479 (17.9%) |
| Total | 2,350 (100.0%) | 2,671 (100.0%) |
Real Estate Taxes by Mortgage Status in Sierra Vista Southeast
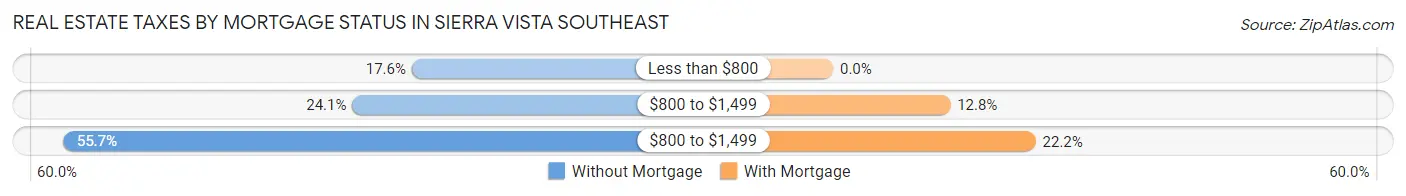
| Property Taxes | Without Mortgage | With Mortgage |
| Less than $800 | 413 (17.6%) | 0 (0.0%) |
| $800 to $1,499 | 566 (24.1%) | 343 (12.8%) |
| $800 to $1,499 | 1,309 (55.7%) | 593 (22.2%) |
| Total | 2,350 (100.0%) | 2,671 (100.0%) |
Health & Disability in Sierra Vista Southeast
Health Insurance Coverage by Age in Sierra Vista Southeast
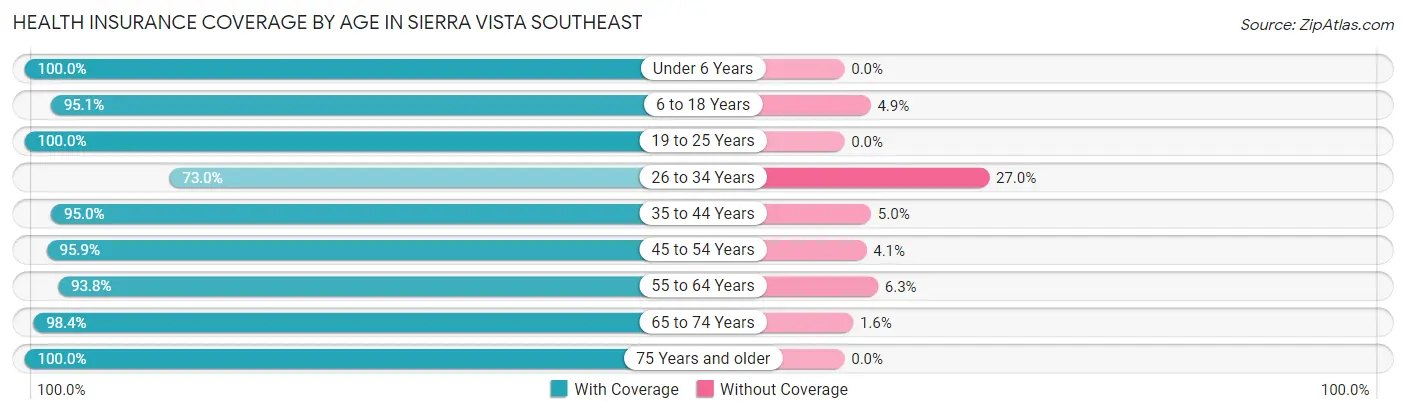
| Age Bracket | With Coverage | Without Coverage |
| Under 6 Years | 780 (100.0%) | 0 (0.0%) |
| 6 to 18 Years | 2,689 (95.1%) | 138 (4.9%) |
| 19 to 25 Years | 726 (100.0%) | 0 (0.0%) |
| 26 to 34 Years | 641 (73.0%) | 237 (27.0%) |
| 35 to 44 Years | 1,381 (95.0%) | 72 (5.0%) |
| 45 to 54 Years | 1,543 (95.9%) | 66 (4.1%) |
| 55 to 64 Years | 2,175 (93.8%) | 145 (6.2%) |
| 65 to 74 Years | 2,018 (98.4%) | 33 (1.6%) |
| 75 Years and older | 1,703 (100.0%) | 0 (0.0%) |
| Total | 13,656 (95.2%) | 691 (4.8%) |
Health Insurance Coverage by Citizenship Status in Sierra Vista Southeast
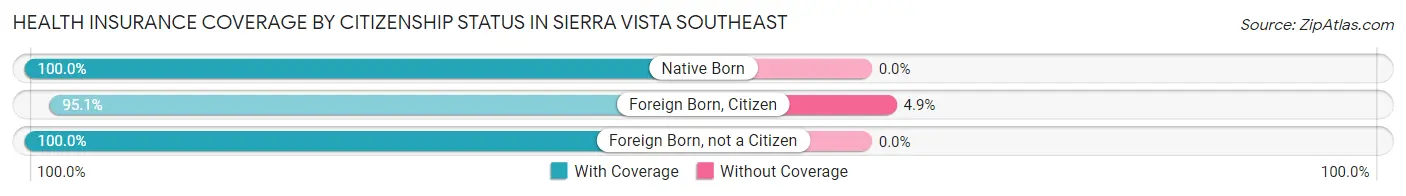
| Citizenship Status | With Coverage | Without Coverage |
| Native Born | 780 (100.0%) | 0 (0.0%) |
| Foreign Born, Citizen | 2,689 (95.1%) | 138 (4.9%) |
| Foreign Born, not a Citizen | 726 (100.0%) | 0 (0.0%) |
Health Insurance Coverage by Household Income in Sierra Vista Southeast
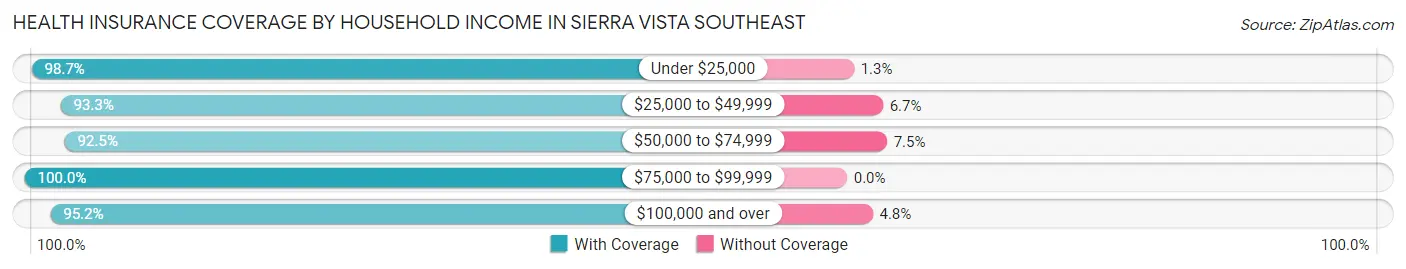
| Household Income | With Coverage | Without Coverage |
| Under $25,000 | 1,305 (98.7%) | 17 (1.3%) |
| $25,000 to $49,999 | 2,993 (93.3%) | 216 (6.7%) |
| $50,000 to $74,999 | 2,079 (92.5%) | 168 (7.5%) |
| $75,000 to $99,999 | 1,585 (100.0%) | 0 (0.0%) |
| $100,000 and over | 5,689 (95.2%) | 288 (4.8%) |
Public vs Private Health Insurance Coverage by Age in Sierra Vista Southeast
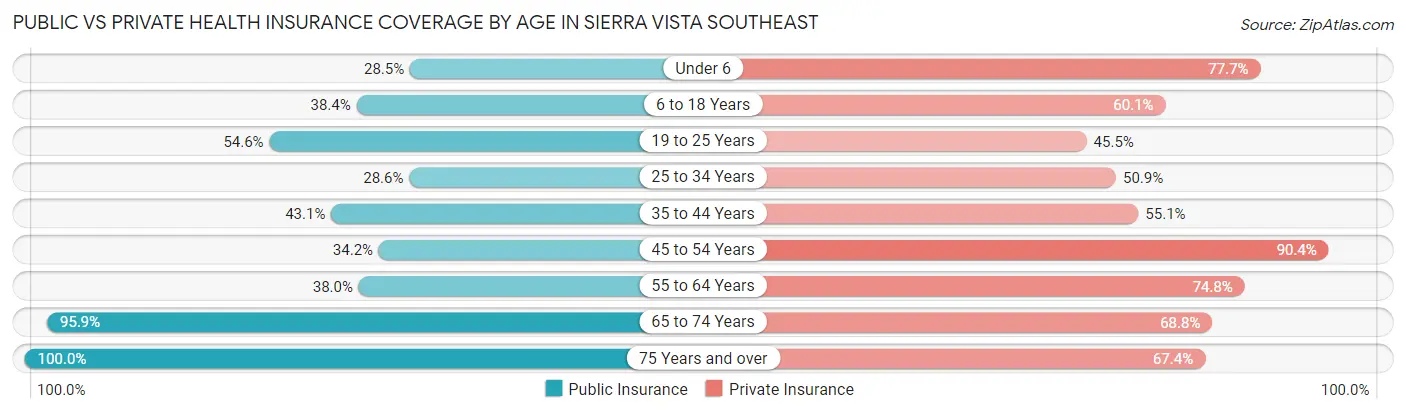
| Age Bracket | Public Insurance | Private Insurance |
| Under 6 | 222 (28.5%) | 606 (77.7%) |
| 6 to 18 Years | 1,085 (38.4%) | 1,698 (60.1%) |
| 19 to 25 Years | 396 (54.5%) | 330 (45.5%) |
| 25 to 34 Years | 251 (28.6%) | 447 (50.9%) |
| 35 to 44 Years | 626 (43.1%) | 800 (55.1%) |
| 45 to 54 Years | 551 (34.2%) | 1,454 (90.4%) |
| 55 to 64 Years | 881 (38.0%) | 1,735 (74.8%) |
| 65 to 74 Years | 1,966 (95.9%) | 1,410 (68.8%) |
| 75 Years and over | 1,703 (100.0%) | 1,148 (67.4%) |
| Total | 7,681 (53.5%) | 9,628 (67.1%) |
Disability Status by Sex by Age in Sierra Vista Southeast
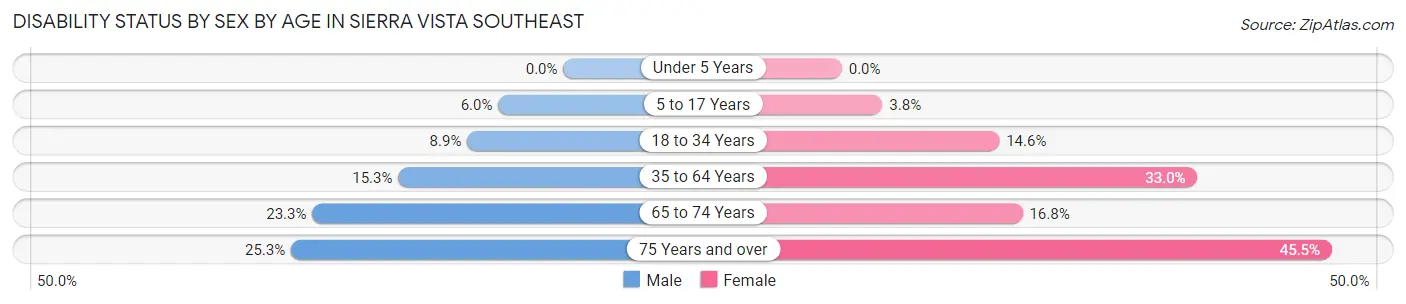
| Age Bracket | Male | Female |
| Under 5 Years | 0 (0.0%) | 0 (0.0%) |
| 5 to 17 Years | 89 (6.0%) | 53 (3.8%) |
| 18 to 34 Years | 52 (8.9%) | 176 (14.6%) |
| 35 to 64 Years | 396 (15.3%) | 923 (33.0%) |
| 65 to 74 Years | 257 (23.3%) | 159 (16.8%) |
| 75 Years and over | 207 (25.3%) | 402 (45.5%) |
Disability Class by Sex by Age in Sierra Vista Southeast
Disability Class: Hearing Difficulty
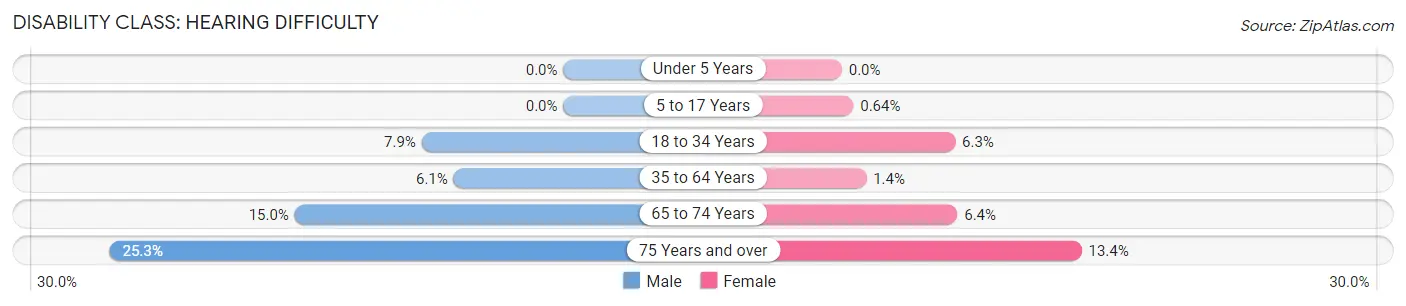
| Age Bracket | Male | Female |
| Under 5 Years | 0 (0.0%) | 0 (0.0%) |
| 5 to 17 Years | 0 (0.0%) | 9 (0.6%) |
| 18 to 34 Years | 46 (7.9%) | 76 (6.3%) |
| 35 to 64 Years | 158 (6.1%) | 38 (1.4%) |
| 65 to 74 Years | 165 (15.0%) | 61 (6.4%) |
| 75 Years and over | 207 (25.3%) | 118 (13.4%) |
Disability Class: Vision Difficulty
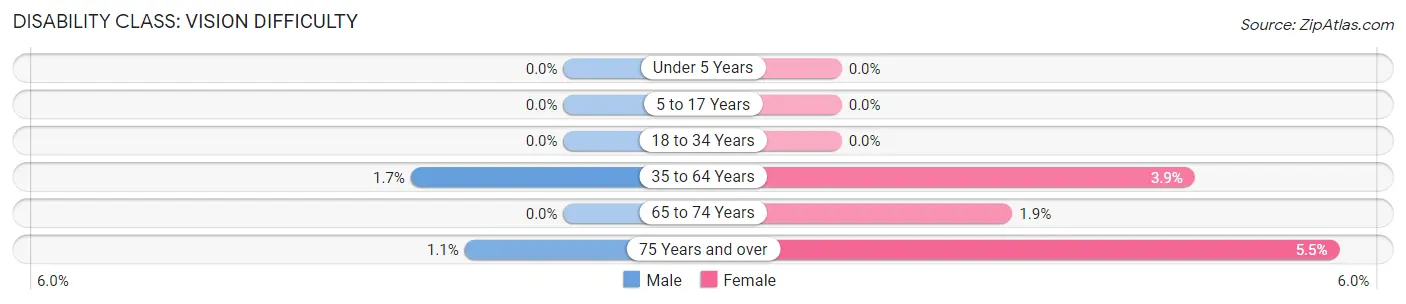
| Age Bracket | Male | Female |
| Under 5 Years | 0 (0.0%) | 0 (0.0%) |
| 5 to 17 Years | 0 (0.0%) | 0 (0.0%) |
| 18 to 34 Years | 0 (0.0%) | 0 (0.0%) |
| 35 to 64 Years | 44 (1.7%) | 110 (3.9%) |
| 65 to 74 Years | 0 (0.0%) | 18 (1.9%) |
| 75 Years and over | 9 (1.1%) | 49 (5.5%) |
Disability Class: Cognitive Difficulty
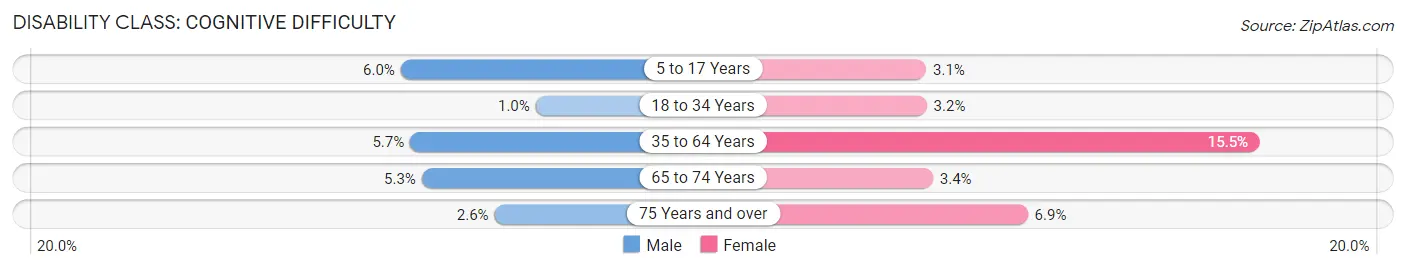
| Age Bracket | Male | Female |
| 5 to 17 Years | 89 (6.0%) | 44 (3.1%) |
| 18 to 34 Years | 6 (1.0%) | 38 (3.2%) |
| 35 to 64 Years | 147 (5.7%) | 434 (15.5%) |
| 65 to 74 Years | 58 (5.3%) | 32 (3.4%) |
| 75 Years and over | 21 (2.6%) | 61 (6.9%) |
Disability Class: Ambulatory Difficulty
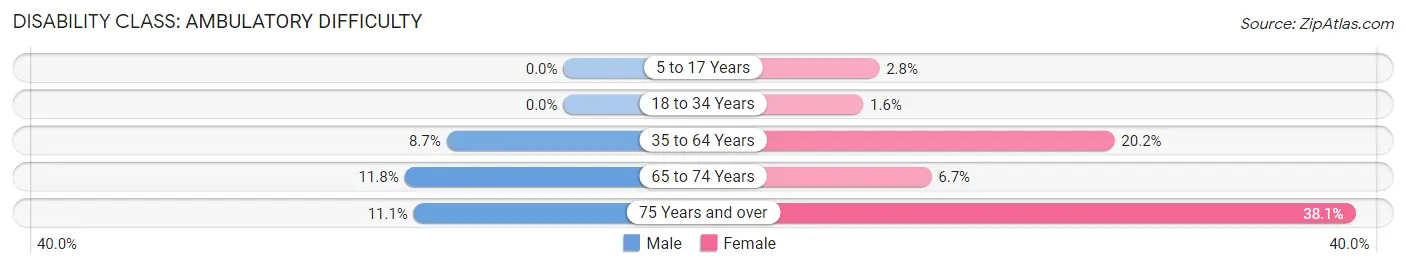
| Age Bracket | Male | Female |
| 5 to 17 Years | 0 (0.0%) | 39 (2.8%) |
| 18 to 34 Years | 0 (0.0%) | 19 (1.6%) |
| 35 to 64 Years | 224 (8.7%) | 566 (20.2%) |
| 65 to 74 Years | 130 (11.8%) | 63 (6.7%) |
| 75 Years and over | 91 (11.1%) | 337 (38.1%) |
Disability Class: Self-Care Difficulty
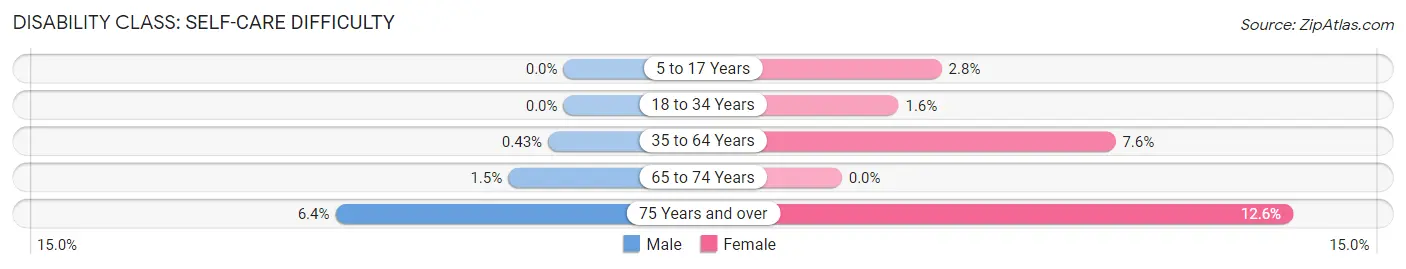
| Age Bracket | Male | Female |
| 5 to 17 Years | 0 (0.0%) | 39 (2.8%) |
| 18 to 34 Years | 0 (0.0%) | 19 (1.6%) |
| 35 to 64 Years | 11 (0.4%) | 213 (7.6%) |
| 65 to 74 Years | 17 (1.5%) | 0 (0.0%) |
| 75 Years and over | 52 (6.4%) | 111 (12.6%) |
Technology Access in Sierra Vista Southeast
Computing Device Access in Sierra Vista Southeast
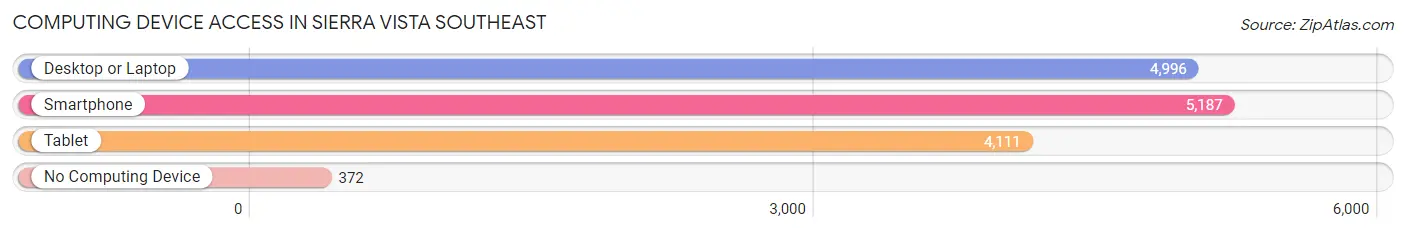
| Device Type | # Households | % Households |
| Desktop or Laptop | 4,996 | 82.6% |
| Smartphone | 5,187 | 85.7% |
| Tablet | 4,111 | 67.9% |
| No Computing Device | 372 | 6.1% |
| Total | 6,050 | 100.0% |
Internet Access in Sierra Vista Southeast
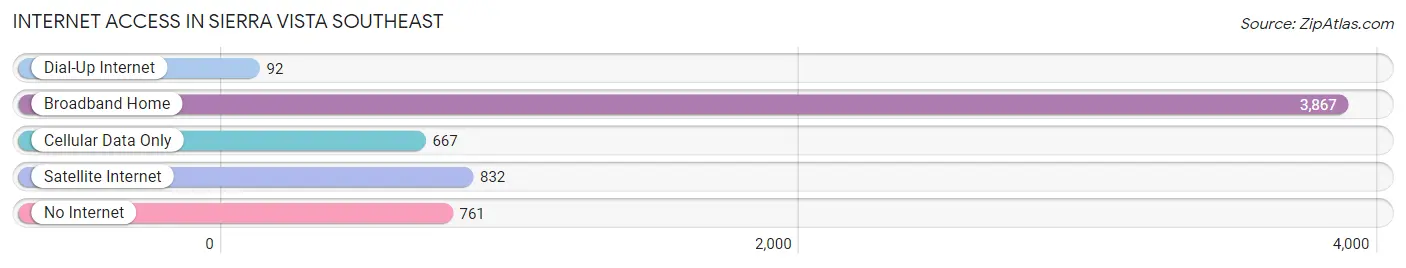
| Internet Type | # Households | % Households |
| Dial-Up Internet | 92 | 1.5% |
| Broadband Home | 3,867 | 63.9% |
| Cellular Data Only | 667 | 11.0% |
| Satellite Internet | 832 | 13.8% |
| No Internet | 761 | 12.6% |
| Total | 6,050 | 100.0% |
Sierra Vista Southeast Summary
Sierra Vista Southeast, Arizona is a census-designated place located in Cochise County, Arizona. It is located about 15 miles southeast of Sierra Vista, the county seat. The population of Sierra Vista Southeast was 8,945 at the 2010 census.
Geography
Sierra Vista Southeast is located at 31°32'25" North, 110°14'17" West (31.540278, -110.238056). It is situated in the San Pedro Valley, at an elevation of 4,000 feet (1,219 m). The area is surrounded by the Huachuca Mountains to the east, the Dragoon Mountains to the north, and the Whetstone Mountains to the west.
Climate
Sierra Vista Southeast has a semi-arid climate, with hot summers and mild winters. The average annual temperature is 68°F (20°C). The average annual precipitation is 16.5 inches (419 mm).
Demographics
As of the 2010 census, there were 8,945 people, 3,717 households, and 2,541 families residing in Sierra Vista Southeast. The population density was 1,092.3 people per square mile (421.7/km2). The racial makeup of the CDP was 79.2% White, 1.2% African American, 1.3% Native American, 0.7% Asian, 0.1% Pacific Islander, 14.7% from other races, and 3.0% from two or more races. Hispanic or Latino of any race were 33.2% of the population.
Economy
Sierra Vista Southeast is home to several businesses, including retail stores, restaurants, and medical facilities. The largest employer in the area is Fort Huachuca, a U.S. Army installation located just outside of the CDP. Other major employers include the Sierra Vista Regional Health Center, the Sierra Vista Unified School District, and the Cochise County government.
History
Sierra Vista Southeast was first settled in the late 19th century by ranchers and farmers. The area was originally known as "Fry", after the Fry family who owned a large ranch in the area. In the early 20th century, the area was annexed by the city of Sierra Vista. In the 1950s, the area was developed as a residential community. In the 1970s, the area was annexed by Cochise County and became a census-designated place.
Conclusion
Sierra Vista Southeast, Arizona is a census-designated place located in Cochise County, Arizona. It is situated in the San Pedro Valley, at an elevation of 4,000 feet (1,219 m). The population of Sierra Vista Southeast was 8,945 at the 2010 census. The area is home to several businesses, including retail stores, restaurants, and medical facilities. The largest employer in the area is Fort Huachuca, a U.S. Army installation located just outside of the CDP. Sierra Vista Southeast was first settled in the late 19th century by ranchers and farmers, and was annexed by the city of Sierra Vista in the early 20th century. In the 1970s, the area was annexed by Cochise County and became a census-designated place.
Common Questions
What is Per Capita Income in Sierra Vista Southeast?
Per Capita income in Sierra Vista Southeast is $36,250.
What is the Median Family Income in Sierra Vista Southeast?
Median Family Income in Sierra Vista Southeast is $87,985.
What is the Median Household income in Sierra Vista Southeast?
Median Household Income in Sierra Vista Southeast is $67,893.
What is Income or Wage Gap in Sierra Vista Southeast?
Income or Wage Gap in Sierra Vista Southeast is 59.3%.
Women in Sierra Vista Southeast earn 40.7 cents for every dollar earned by a man.
What is Family Income Deficit in Sierra Vista Southeast?
Family Income Deficit in Sierra Vista Southeast is $8,683.
Families that are below poverty line in Sierra Vista Southeast earn $8,683 less on average than the poverty threshold level.
What is Inequality or Gini Index in Sierra Vista Southeast?
Inequality or Gini Index in Sierra Vista Southeast is 0.40.
What is the Total Population of Sierra Vista Southeast?
Total Population of Sierra Vista Southeast is 14,398.
What is the Total Male Population of Sierra Vista Southeast?
Total Male Population of Sierra Vista Southeast is 6,841.
What is the Total Female Population of Sierra Vista Southeast?
Total Female Population of Sierra Vista Southeast is 7,557.
What is the Ratio of Males per 100 Females in Sierra Vista Southeast?
There are 90.53 Males per 100 Females in Sierra Vista Southeast.
What is the Ratio of Females per 100 Males in Sierra Vista Southeast?
There are 110.47 Females per 100 Males in Sierra Vista Southeast.
What is the Median Population Age in Sierra Vista Southeast?
Median Population Age in Sierra Vista Southeast is 47.6 Years.
What is the Average Family Size in Sierra Vista Southeast
Average Family Size in Sierra Vista Southeast is 3.2 People.
What is the Average Household Size in Sierra Vista Southeast
Average Household Size in Sierra Vista Southeast is 2.4 People.
How Large is the Labor Force in Sierra Vista Southeast?
There are 5,431 People in the Labor Forcein in Sierra Vista Southeast.
What is the Percentage of People in the Labor Force in Sierra Vista Southeast?
47.5% of People are in the Labor Force in Sierra Vista Southeast.
What is the Unemployment Rate in Sierra Vista Southeast?
Unemployment Rate in Sierra Vista Southeast is 4.0%.