Sandy Springs, GA Map & Demographics
Sandy Springs Map
Sandy Springs Overview
$75,615
PER CAPITA INCOME
$138,532
AVG FAMILY INCOME
$93,303
AVG HOUSEHOLD INCOME
26.4%
WAGE / INCOME GAP [ % ]
73.6¢/ $1
WAGE / INCOME GAP [ $ ]
$11,415
FAMILY INCOME DEFICIT
0.53
INEQUALITY / GINI INDEX
107,221
TOTAL POPULATION
51,275
MALE POPULATION
55,946
FEMALE POPULATION
91.65
MALES / 100 FEMALES
109.11
FEMALES / 100 MALES
37.4
MEDIAN AGE
2.9
AVG FAMILY SIZE
2.1
AVG HOUSEHOLD SIZE
65,251
LABOR FORCE [ PEOPLE ]
72.9%
PERCENT IN LABOR FORCE
3.7%
UNEMPLOYMENT RATE
Income in Sandy Springs
Income Overview in Sandy Springs
Per Capita Income in Sandy Springs is $75,615, while median incomes of families and households are $138,532 and $93,303 respectively.
| Characteristic | Number | Measure |
| Per Capita Income | 107,221 | $75,615 |
| Median Family Income | 25,969 | $138,532 |
| Mean Family Income | 25,969 | $219,593 |
| Median Household Income | 51,204 | $93,303 |
| Mean Household Income | 51,204 | $157,218 |
| Income Deficit | 25,969 | $11,415 |
| Wage / Income Gap (%) | 107,221 | 26.40% |
| Wage / Income Gap ($) | 107,221 | 73.60¢ per $1 |
| Gini / Inequality Index | 107,221 | 0.53 |
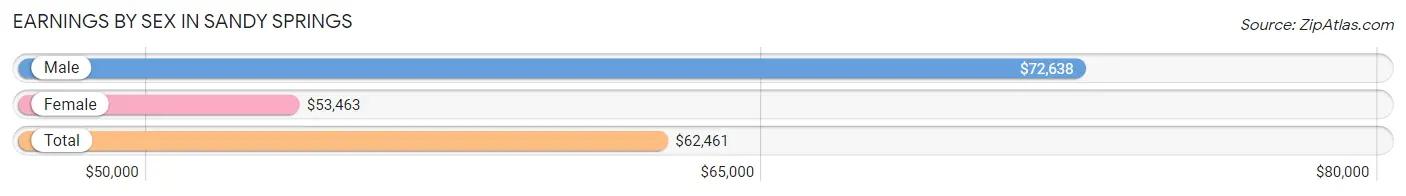
Earnings by Sex in Sandy Springs
Average Earnings in Sandy Springs are $62,461, $72,638 for men and $53,463 for women, a difference of 26.4%.
| Sex | Number | Average Earnings |
| Male | 34,892 (51.2%) | $72,638 |
| Female | 33,272 (48.8%) | $53,463 |
| Total | 68,164 (100.0%) | $62,461 |
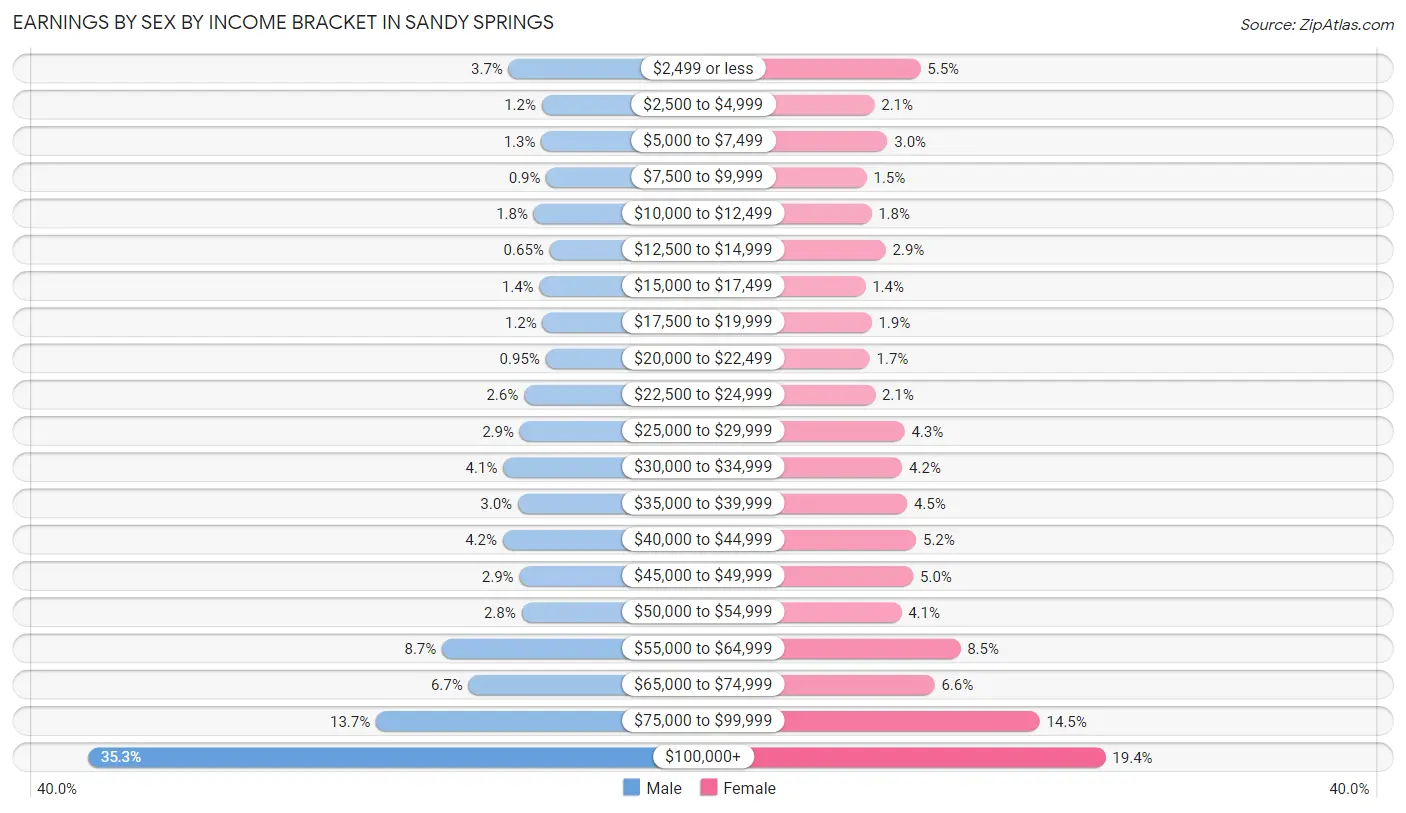
Earnings by Sex by Income Bracket in Sandy Springs
The most common earnings brackets in Sandy Springs are $100,000+ for men (12,302 | 35.3%) and $100,000+ for women (6,448 | 19.4%).
| Income | Male | Female |
| $2,499 or less | 1,298 (3.7%) | 1,834 (5.5%) |
| $2,500 to $4,999 | 432 (1.2%) | 685 (2.1%) |
| $5,000 to $7,499 | 445 (1.3%) | 1,012 (3.0%) |
| $7,500 to $9,999 | 313 (0.9%) | 492 (1.5%) |
| $10,000 to $12,499 | 642 (1.8%) | 608 (1.8%) |
| $12,500 to $14,999 | 228 (0.6%) | 968 (2.9%) |
| $15,000 to $17,499 | 496 (1.4%) | 459 (1.4%) |
| $17,500 to $19,999 | 411 (1.2%) | 616 (1.8%) |
| $20,000 to $22,499 | 331 (0.9%) | 568 (1.7%) |
| $22,500 to $24,999 | 897 (2.6%) | 701 (2.1%) |
| $25,000 to $29,999 | 1,010 (2.9%) | 1,438 (4.3%) |
| $30,000 to $34,999 | 1,440 (4.1%) | 1,382 (4.2%) |
| $35,000 to $39,999 | 1,058 (3.0%) | 1,501 (4.5%) |
| $40,000 to $44,999 | 1,452 (4.2%) | 1,727 (5.2%) |
| $45,000 to $49,999 | 1,018 (2.9%) | 1,653 (5.0%) |
| $50,000 to $54,999 | 964 (2.8%) | 1,356 (4.1%) |
| $55,000 to $64,999 | 3,040 (8.7%) | 2,829 (8.5%) |
| $65,000 to $74,999 | 2,349 (6.7%) | 2,187 (6.6%) |
| $75,000 to $99,999 | 4,766 (13.7%) | 4,808 (14.4%) |
| $100,000+ | 12,302 (35.3%) | 6,448 (19.4%) |
| Total | 34,892 (100.0%) | 33,272 (100.0%) |
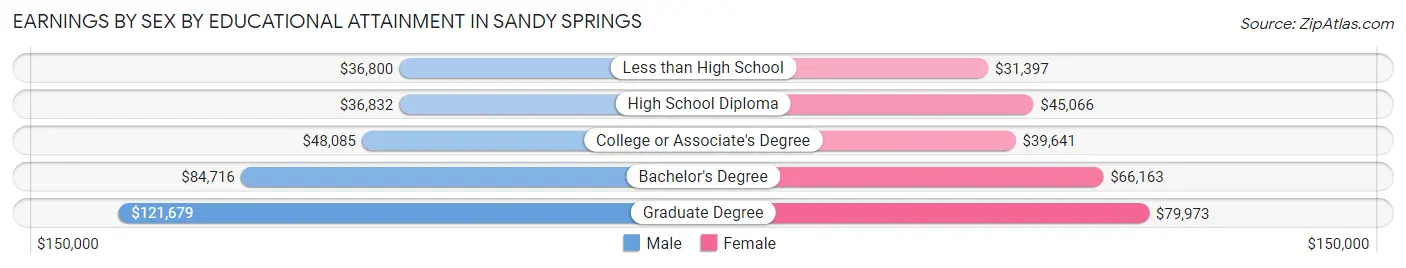
Earnings by Sex by Educational Attainment in Sandy Springs
Average earnings in Sandy Springs are $80,107 for men and $60,627 for women, a difference of 24.3%. Men with an educational attainment of graduate degree enjoy the highest average annual earnings of $121,679, while those with less than high school education earn the least with $36,800. Women with an educational attainment of graduate degree earn the most with the average annual earnings of $79,973, while those with less than high school education have the smallest earnings of $31,397.
| Educational Attainment | Male Income | Female Income |
| Less than High School | $36,800 | $31,397 |
| High School Diploma | $36,832 | $45,066 |
| College or Associate's Degree | $48,085 | $39,641 |
| Bachelor's Degree | $84,716 | $66,163 |
| Graduate Degree | $121,679 | $79,973 |
| Total | $80,107 | $60,627 |
Family Income in Sandy Springs
Family Income Brackets in Sandy Springs
According to the Sandy Springs family income data, there are 9,167 families falling into the $200,000+ income range, which is the most common income bracket and makes up 35.3% of all families. Conversely, the $10,000 to $14,999 income bracket is the least frequent group with only 364 families (1.4%) belonging to this category.
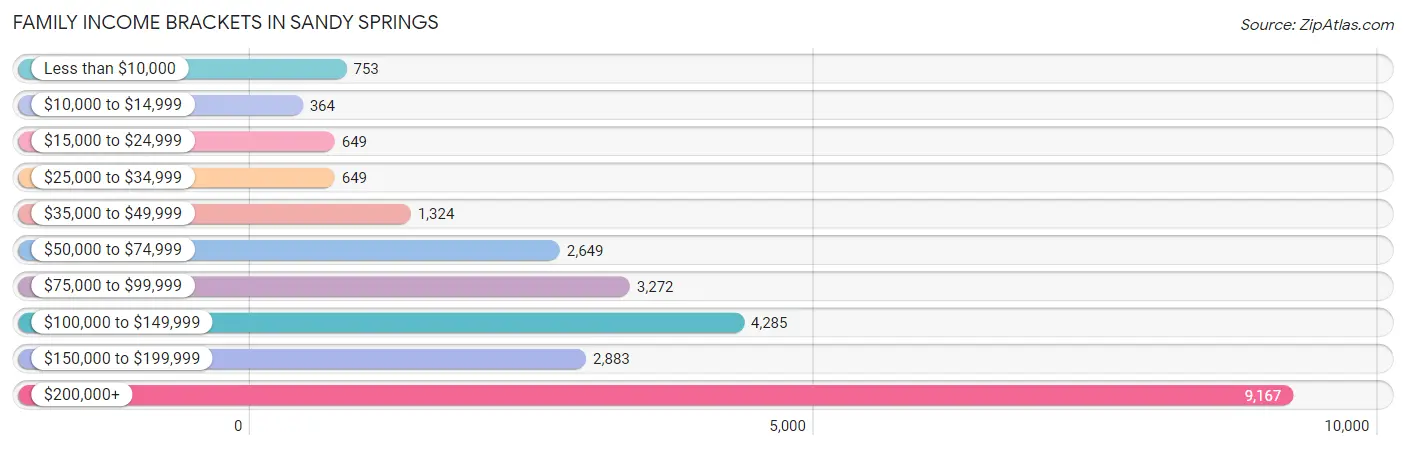
| Income Bracket | # Families | % Families |
| Less than $10,000 | 753 | 2.9% |
| $10,000 to $14,999 | 364 | 1.4% |
| $15,000 to $24,999 | 649 | 2.5% |
| $25,000 to $34,999 | 649 | 2.5% |
| $35,000 to $49,999 | 1,324 | 5.1% |
| $50,000 to $74,999 | 2,649 | 10.2% |
| $75,000 to $99,999 | 3,272 | 12.6% |
| $100,000 to $149,999 | 4,285 | 16.5% |
| $150,000 to $199,999 | 2,883 | 11.1% |
| $200,000+ | 9,167 | 35.3% |
Family Income by Famaliy Size in Sandy Springs
5-person families (1,325 | 5.1%) account for the highest median family income in Sandy Springs with $198,125 per family, while 2-person families (14,062 | 54.1%) have the highest median income of $62,538 per family member.
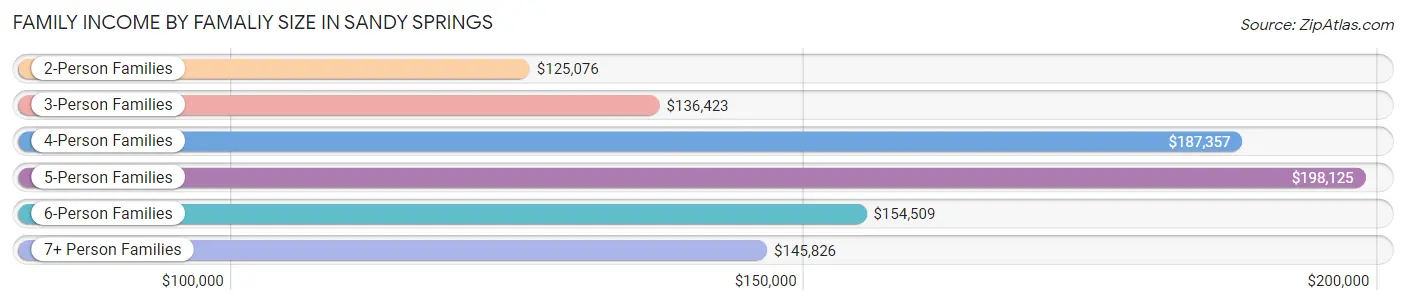
| Income Bracket | # Families | Median Income |
| 2-Person Families | 14,062 (54.1%) | $125,076 |
| 3-Person Families | 5,559 (21.4%) | $136,423 |
| 4-Person Families | 4,649 (17.9%) | $187,357 |
| 5-Person Families | 1,325 (5.1%) | $198,125 |
| 6-Person Families | 223 (0.9%) | $154,509 |
| 7+ Person Families | 151 (0.6%) | $145,826 |
| Total | 25,969 (100.0%) | $138,532 |
Family Income by Number of Earners in Sandy Springs
The median family income in Sandy Springs is $138,532, with families comprising 3+ earners (1,916) having the highest median family income of $187,448, while families with no earners (2,494) have the lowest median family income of $89,851, accounting for 7.4% and 9.6% of families, respectively.
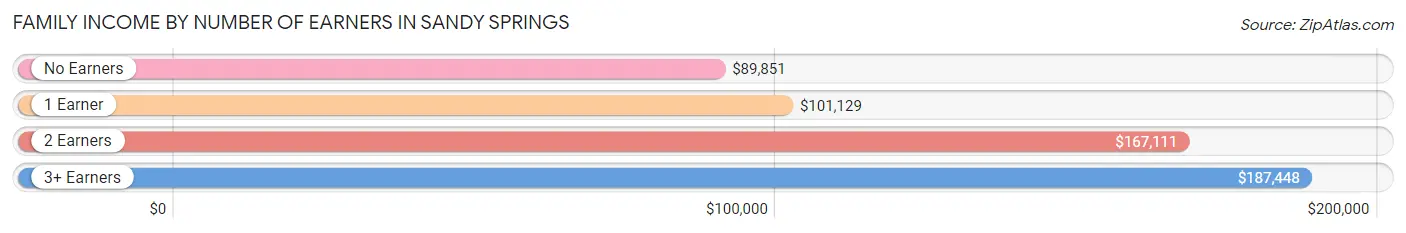
| Number of Earners | # Families | Median Income |
| No Earners | 2,494 (9.6%) | $89,851 |
| 1 Earner | 8,771 (33.8%) | $101,129 |
| 2 Earners | 12,788 (49.2%) | $167,111 |
| 3+ Earners | 1,916 (7.4%) | $187,448 |
| Total | 25,969 (100.0%) | $138,532 |
Household Income in Sandy Springs
Household Income Brackets in Sandy Springs
With 10,958 households falling in the category, the $200,000+ income range is the most frequent in Sandy Springs, accounting for 21.4% of all households. In contrast, only 1,126 households (2.2%) fall into the $10,000 to $14,999 income bracket, making it the least populous group.
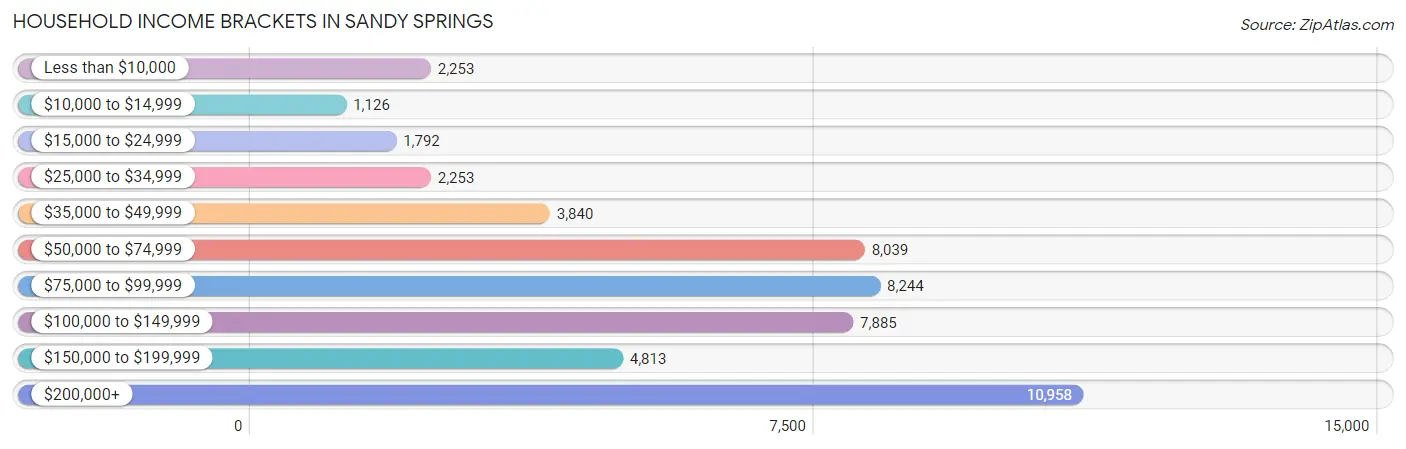
| Income Bracket | # Households | % Households |
| Less than $10,000 | 2,253 | 4.4% |
| $10,000 to $14,999 | 1,126 | 2.2% |
| $15,000 to $24,999 | 1,792 | 3.5% |
| $25,000 to $34,999 | 2,253 | 4.4% |
| $35,000 to $49,999 | 3,840 | 7.5% |
| $50,000 to $74,999 | 8,039 | 15.7% |
| $75,000 to $99,999 | 8,244 | 16.1% |
| $100,000 to $149,999 | 7,885 | 15.4% |
| $150,000 to $199,999 | 4,813 | 9.4% |
| $200,000+ | 10,958 | 21.4% |
Household Income by Householder Age in Sandy Springs
The median household income in Sandy Springs is $93,303, with the highest median household income of $119,730 found in the 45 to 64 years age bracket for the primary householder. A total of 16,352 households (31.9%) fall into this category. Meanwhile, the 15 to 24 years age bracket for the primary householder has the lowest median household income of $51,867, with 2,511 households (4.9%) in this group.
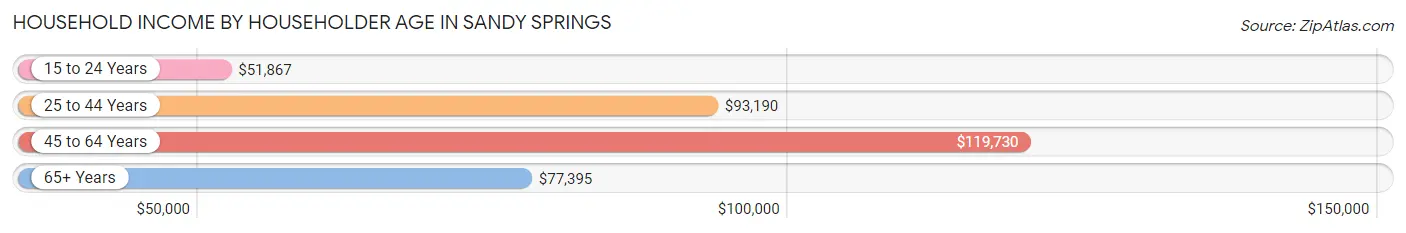
| Income Bracket | # Households | Median Income |
| 15 to 24 Years | 2,511 (4.9%) | $51,867 |
| 25 to 44 Years | 22,257 (43.5%) | $93,190 |
| 45 to 64 Years | 16,352 (31.9%) | $119,730 |
| 65+ Years | 10,084 (19.7%) | $77,395 |
| Total | 51,204 (100.0%) | $93,303 |
Poverty in Sandy Springs
Income Below Poverty by Sex and Age in Sandy Springs
With 6.2% poverty level for males and 8.0% for females among the residents of Sandy Springs, 18 to 24 year old males and 5 year old females are the most vulnerable to poverty, with 522 males (16.1%) and 144 females (21.1%) in their respective age groups living below the poverty level.
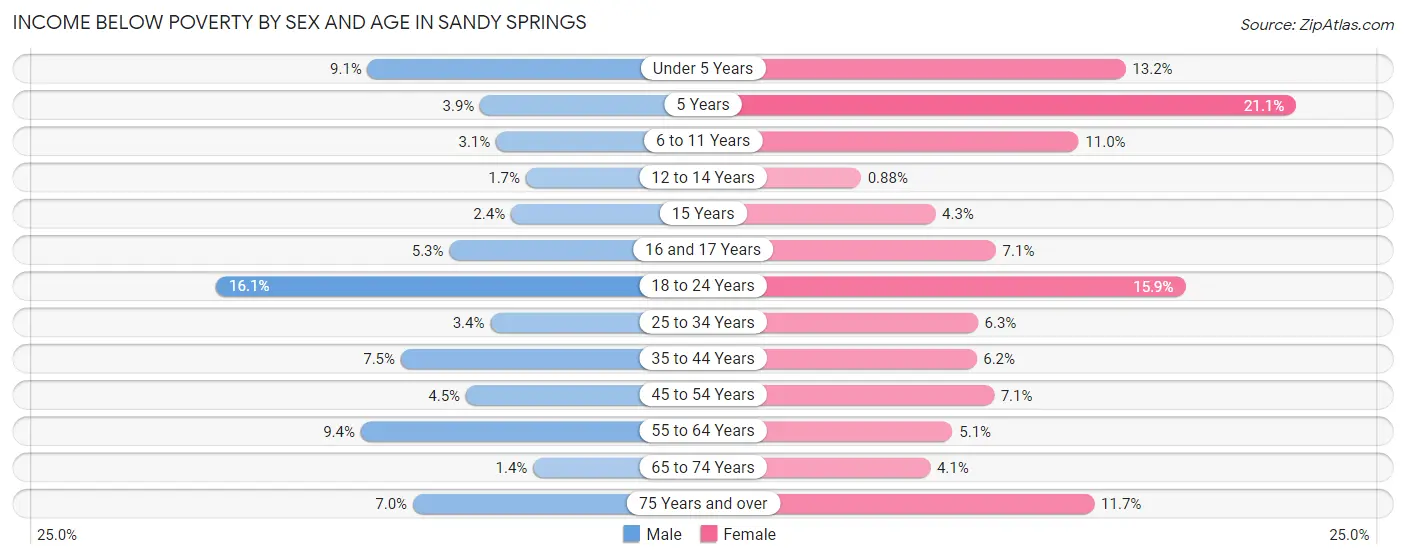
| Age Bracket | Male | Female |
| Under 5 Years | 270 (9.1%) | 357 (13.2%) |
| 5 Years | 25 (3.9%) | 144 (21.1%) |
| 6 to 11 Years | 95 (3.1%) | 370 (11.0%) |
| 12 to 14 Years | 30 (1.7%) | 12 (0.9%) |
| 15 Years | 12 (2.4%) | 28 (4.3%) |
| 16 and 17 Years | 57 (5.3%) | 95 (7.1%) |
| 18 to 24 Years | 522 (16.1%) | 772 (15.9%) |
| 25 to 34 Years | 349 (3.4%) | 642 (6.3%) |
| 35 to 44 Years | 668 (7.5%) | 473 (6.2%) |
| 45 to 54 Years | 290 (4.5%) | 585 (7.0%) |
| 55 to 64 Years | 612 (9.4%) | 284 (5.1%) |
| 65 to 74 Years | 46 (1.4%) | 189 (4.1%) |
| 75 Years and over | 175 (7.0%) | 525 (11.7%) |
| Total | 3,151 (6.2%) | 4,476 (8.0%) |
Income Above Poverty by Sex and Age in Sandy Springs
According to the poverty statistics in Sandy Springs, males aged 65 to 74 years and females aged 12 to 14 years are the age groups that are most secure financially, with 98.6% of males and 99.1% of females in these age groups living above the poverty line.
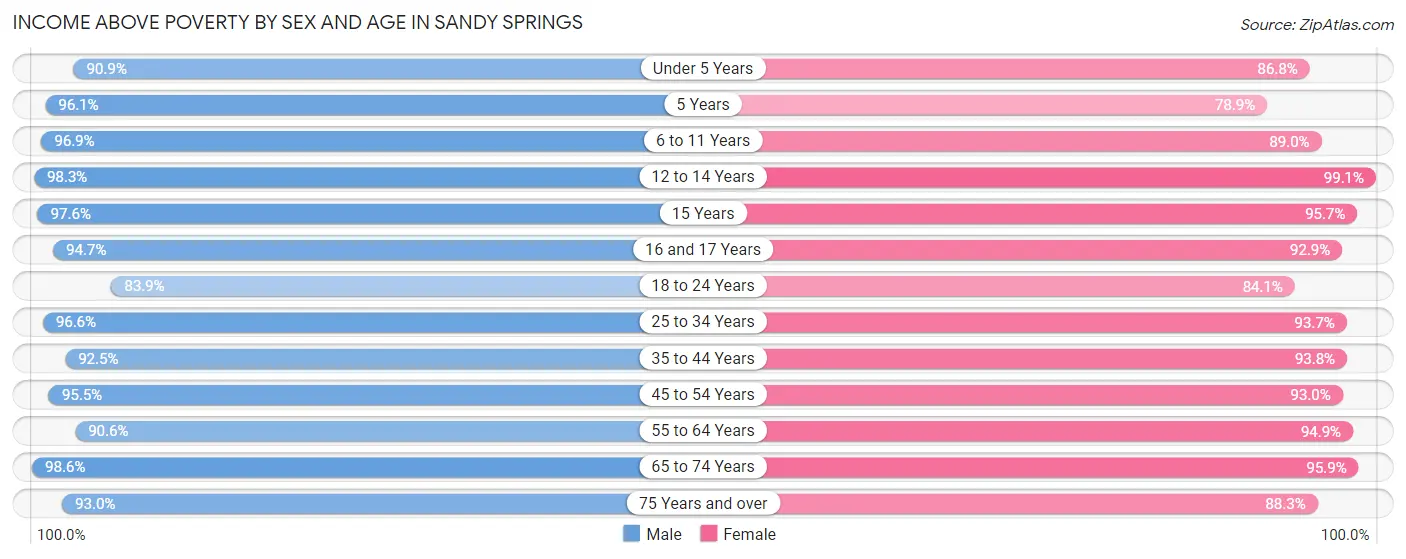
| Age Bracket | Male | Female |
| Under 5 Years | 2,702 (90.9%) | 2,355 (86.8%) |
| 5 Years | 622 (96.1%) | 539 (78.9%) |
| 6 to 11 Years | 2,949 (96.9%) | 3,001 (89.0%) |
| 12 to 14 Years | 1,699 (98.3%) | 1,348 (99.1%) |
| 15 Years | 482 (97.6%) | 619 (95.7%) |
| 16 and 17 Years | 1,020 (94.7%) | 1,236 (92.9%) |
| 18 to 24 Years | 2,719 (83.9%) | 4,071 (84.1%) |
| 25 to 34 Years | 9,947 (96.6%) | 9,553 (93.7%) |
| 35 to 44 Years | 8,197 (92.5%) | 7,111 (93.8%) |
| 45 to 54 Years | 6,132 (95.5%) | 7,717 (92.9%) |
| 55 to 64 Years | 5,902 (90.6%) | 5,247 (94.9%) |
| 65 to 74 Years | 3,239 (98.6%) | 4,432 (95.9%) |
| 75 Years and over | 2,331 (93.0%) | 3,959 (88.3%) |
| Total | 47,941 (93.8%) | 51,188 (92.0%) |
Income Below Poverty Among Married-Couple Families in Sandy Springs
The poverty statistics for married-couple families in Sandy Springs show that 2.5% or 493 of the total 19,635 families live below the poverty line. Families with no children have the highest poverty rate of 3.4%, comprising of 411 families. On the other hand, families with 3 or 4 children have the lowest poverty rate of 0.0%, which includes 0 families.
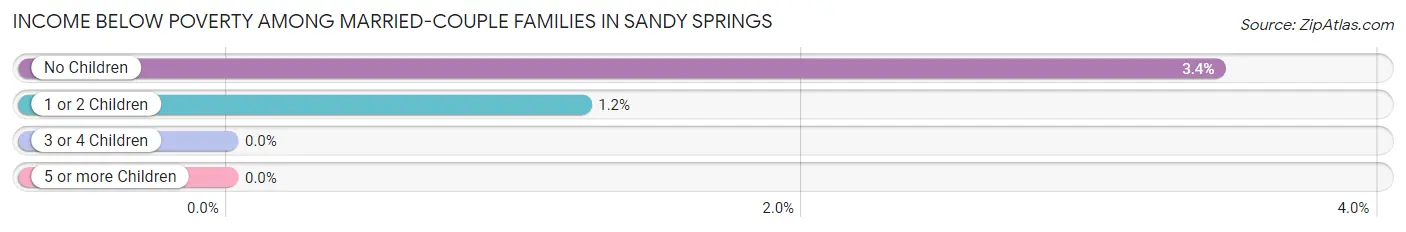
| Children | Above Poverty | Below Poverty |
| No Children | 11,523 (96.6%) | 411 (3.4%) |
| 1 or 2 Children | 6,585 (98.8%) | 82 (1.2%) |
| 3 or 4 Children | 1,017 (100.0%) | 0 (0.0%) |
| 5 or more Children | 17 (100.0%) | 0 (0.0%) |
| Total | 19,142 (97.5%) | 493 (2.5%) |
Income Below Poverty Among Single-Parent Households in Sandy Springs
According to the poverty data in Sandy Springs, 17.2% or 224 single-father households and 14.8% or 744 single-mother households are living below the poverty line. Among single-father households, those with no children have the highest poverty rate, with 126 households (25.2%) experiencing poverty. Likewise, among single-mother households, those with 3 or 4 children have the highest poverty rate, with 83 households (29.1%) falling below the poverty line.
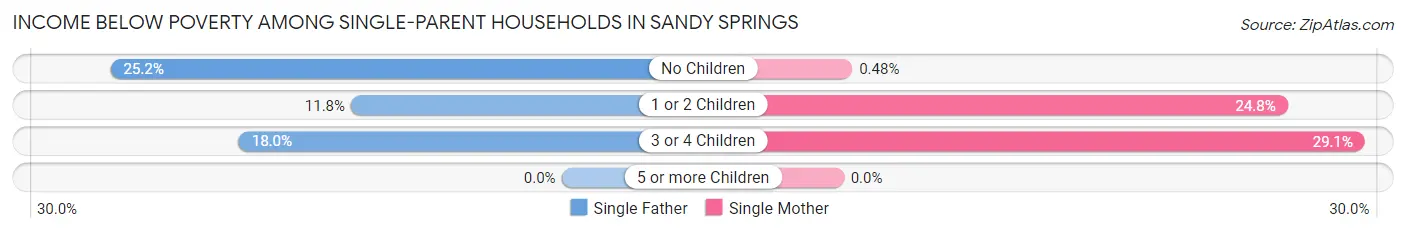
| Children | Single Father | Single Mother |
| No Children | 126 (25.2%) | 10 (0.5%) |
| 1 or 2 Children | 87 (11.8%) | 651 (24.8%) |
| 3 or 4 Children | 11 (18.0%) | 83 (29.1%) |
| 5 or more Children | 0 (0.0%) | 0 (0.0%) |
| Total | 224 (17.2%) | 744 (14.8%) |
Income Below Poverty Among Married-Couple vs Single-Parent Households in Sandy Springs
The poverty data for Sandy Springs shows that 493 of the married-couple family households (2.5%) and 968 of the single-parent households (15.3%) are living below the poverty level. Within the married-couple family households, those with no children have the highest poverty rate, with 411 households (3.4%) falling below the poverty line. Among the single-parent households, those with 3 or 4 children have the highest poverty rate, with 94 household (27.2%) living below poverty.
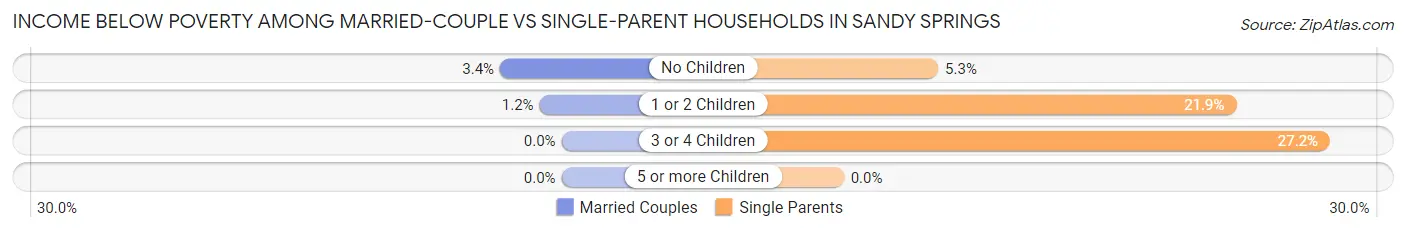
| Children | Married-Couple Families | Single-Parent Households |
| No Children | 411 (3.4%) | 136 (5.3%) |
| 1 or 2 Children | 82 (1.2%) | 738 (21.9%) |
| 3 or 4 Children | 0 (0.0%) | 94 (27.2%) |
| 5 or more Children | 0 (0.0%) | 0 (0.0%) |
| Total | 493 (2.5%) | 968 (15.3%) |
Race in Sandy Springs
The most populous races in Sandy Springs are White / Caucasian (66,318 | 61.9%), Black / African American (22,442 | 20.9%), and Hispanic or Latino (11,103 | 10.4%).
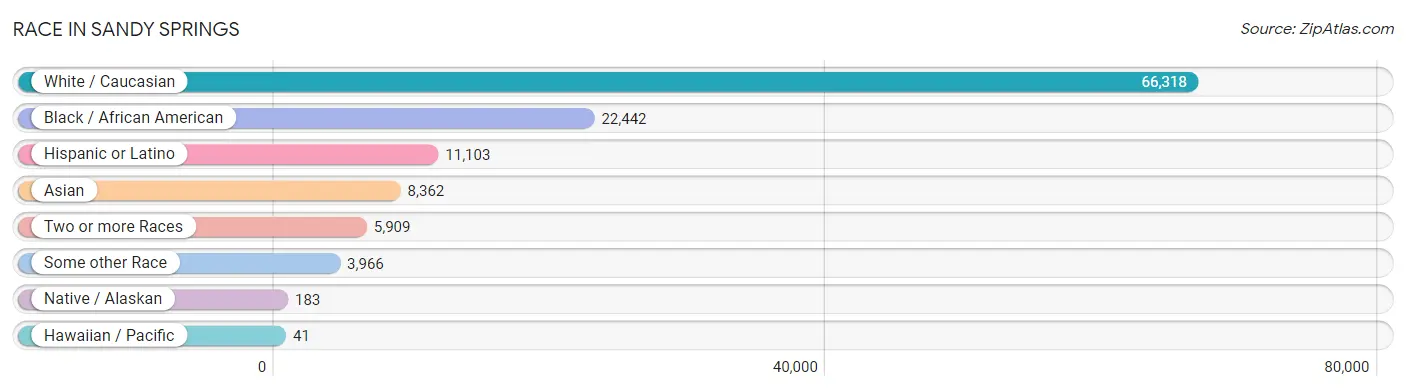
| Race | # Population | % Population |
| Asian | 8,362 | 7.8% |
| Black / African American | 22,442 | 20.9% |
| Hawaiian / Pacific | 41 | 0.0% |
| Hispanic or Latino | 11,103 | 10.4% |
| Native / Alaskan | 183 | 0.2% |
| White / Caucasian | 66,318 | 61.9% |
| Two or more Races | 5,909 | 5.5% |
| Some other Race | 3,966 | 3.7% |
| Total | 107,221 | 100.0% |
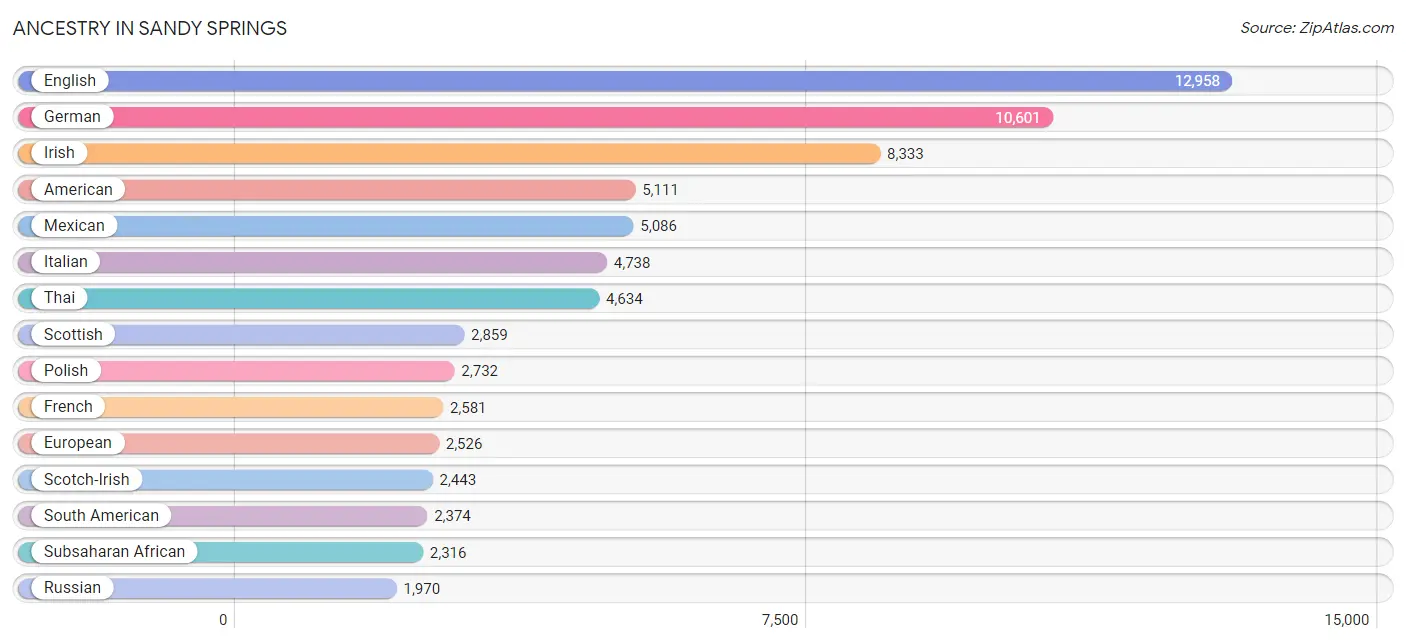
Ancestry in Sandy Springs
The most populous ancestries reported in Sandy Springs are English (12,958 | 12.1%), German (10,601 | 9.9%), Irish (8,333 | 7.8%), American (5,111 | 4.8%), and Mexican (5,086 | 4.7%), together accounting for 39.3% of all Sandy Springs residents.
| Ancestry | # Population | % Population |
| Afghan | 3 | 0.0% |
| African | 849 | 0.8% |
| American | 5,111 | 4.8% |
| Arab | 864 | 0.8% |
| Argentinean | 83 | 0.1% |
| Armenian | 107 | 0.1% |
| Assyrian / Chaldean / Syriac | 17 | 0.0% |
| Australian | 93 | 0.1% |
| Austrian | 391 | 0.4% |
| Barbadian | 18 | 0.0% |
| Belgian | 53 | 0.1% |
| Belizean | 336 | 0.3% |
| Bhutanese | 531 | 0.5% |
| Blackfeet | 14 | 0.0% |
| Bolivian | 280 | 0.3% |
| Brazilian | 374 | 0.4% |
| British | 1,230 | 1.1% |
| British West Indian | 65 | 0.1% |
| Burmese | 651 | 0.6% |
| Cajun | 8 | 0.0% |
| Canadian | 351 | 0.3% |
| Celtic | 95 | 0.1% |
| Central American | 1,256 | 1.2% |
| Central American Indian | 39 | 0.0% |
| Cherokee | 447 | 0.4% |
| Chickasaw | 11 | 0.0% |
| Chilean | 23 | 0.0% |
| Choctaw | 19 | 0.0% |
| Colombian | 621 | 0.6% |
| Costa Rican | 364 | 0.3% |
| Croatian | 83 | 0.1% |
| Crow | 2 | 0.0% |
| Cuban | 391 | 0.4% |
| Czech | 178 | 0.2% |
| Czechoslovakian | 74 | 0.1% |
| Danish | 284 | 0.3% |
| Dominican | 527 | 0.5% |
| Dutch | 983 | 0.9% |
| Eastern European | 1,700 | 1.6% |
| Ecuadorian | 269 | 0.3% |
| English | 12,958 | 12.1% |
| Ethiopian | 154 | 0.1% |
| European | 2,526 | 2.4% |
| Fijian | 6 | 0.0% |
| Filipino | 15 | 0.0% |
| Finnish | 82 | 0.1% |
| French | 2,581 | 2.4% |
| French Canadian | 305 | 0.3% |
| German | 10,601 | 9.9% |
| Ghanaian | 44 | 0.0% |
| Greek | 268 | 0.3% |
| Guamanian / Chamorro | 20 | 0.0% |
| Guatemalan | 107 | 0.1% |
| Guyanese | 211 | 0.2% |
| Haitian | 613 | 0.6% |
| Honduran | 169 | 0.2% |
| Hungarian | 278 | 0.3% |
| Indian (Asian) | 1,688 | 1.6% |
| Iranian | 261 | 0.2% |
| Iraqi | 14 | 0.0% |
| Irish | 8,333 | 7.8% |
| Israeli | 129 | 0.1% |
| Italian | 4,738 | 4.4% |
| Jamaican | 1,273 | 1.2% |
| Japanese | 37 | 0.0% |
| Jordanian | 34 | 0.0% |
| Kenyan | 117 | 0.1% |
| Korean | 814 | 0.8% |
| Laotian | 64 | 0.1% |
| Latvian | 52 | 0.1% |
| Lebanese | 509 | 0.5% |
| Liberian | 29 | 0.0% |
| Lithuanian | 842 | 0.8% |
| Lumbee | 12 | 0.0% |
| Luxembourger | 29 | 0.0% |
| Macedonian | 10 | 0.0% |
| Malaysian | 25 | 0.0% |
| Maltese | 71 | 0.1% |
| Mexican | 5,086 | 4.7% |
| Mexican American Indian | 16 | 0.0% |
| Moroccan | 84 | 0.1% |
| Native Hawaiian | 30 | 0.0% |
| New Zealander | 13 | 0.0% |
| Nicaraguan | 388 | 0.4% |
| Nigerian | 282 | 0.3% |
| Northern European | 164 | 0.2% |
| Norwegian | 697 | 0.6% |
| Pakistani | 145 | 0.1% |
| Palestinian | 60 | 0.1% |
| Panamanian | 69 | 0.1% |
| Peruvian | 153 | 0.1% |
| Polish | 2,732 | 2.5% |
| Portuguese | 621 | 0.6% |
| Puerto Rican | 861 | 0.8% |
| Romanian | 492 | 0.5% |
| Russian | 1,970 | 1.8% |
| Salvadoran | 159 | 0.2% |
| Samoan | 12 | 0.0% |
| Scandinavian | 276 | 0.3% |
| Scotch-Irish | 2,443 | 2.3% |
| Scottish | 2,859 | 2.7% |
| Senegalese | 25 | 0.0% |
| Serbian | 28 | 0.0% |
| Sioux | 11 | 0.0% |
| Slovak | 73 | 0.1% |
| Slovene | 19 | 0.0% |
| South African | 139 | 0.1% |
| South American | 2,374 | 2.2% |
| South American Indian | 2 | 0.0% |
| Spaniard | 138 | 0.1% |
| Spanish | 101 | 0.1% |
| Spanish American | 70 | 0.1% |
| Sri Lankan | 752 | 0.7% |
| Subsaharan African | 2,316 | 2.2% |
| Swedish | 751 | 0.7% |
| Swiss | 195 | 0.2% |
| Syrian | 17 | 0.0% |
| Thai | 4,634 | 4.3% |
| Trinidadian and Tobagonian | 118 | 0.1% |
| Turkish | 106 | 0.1% |
| Ukrainian | 304 | 0.3% |
| Uruguayan | 48 | 0.0% |
| Venezuelan | 897 | 0.8% |
| Vietnamese | 55 | 0.1% |
| Welsh | 680 | 0.6% |
| West Indian | 123 | 0.1% |
| Yugoslavian | 36 | 0.0% |
| Zimbabwean | 186 | 0.2% | View All 128 Rows |
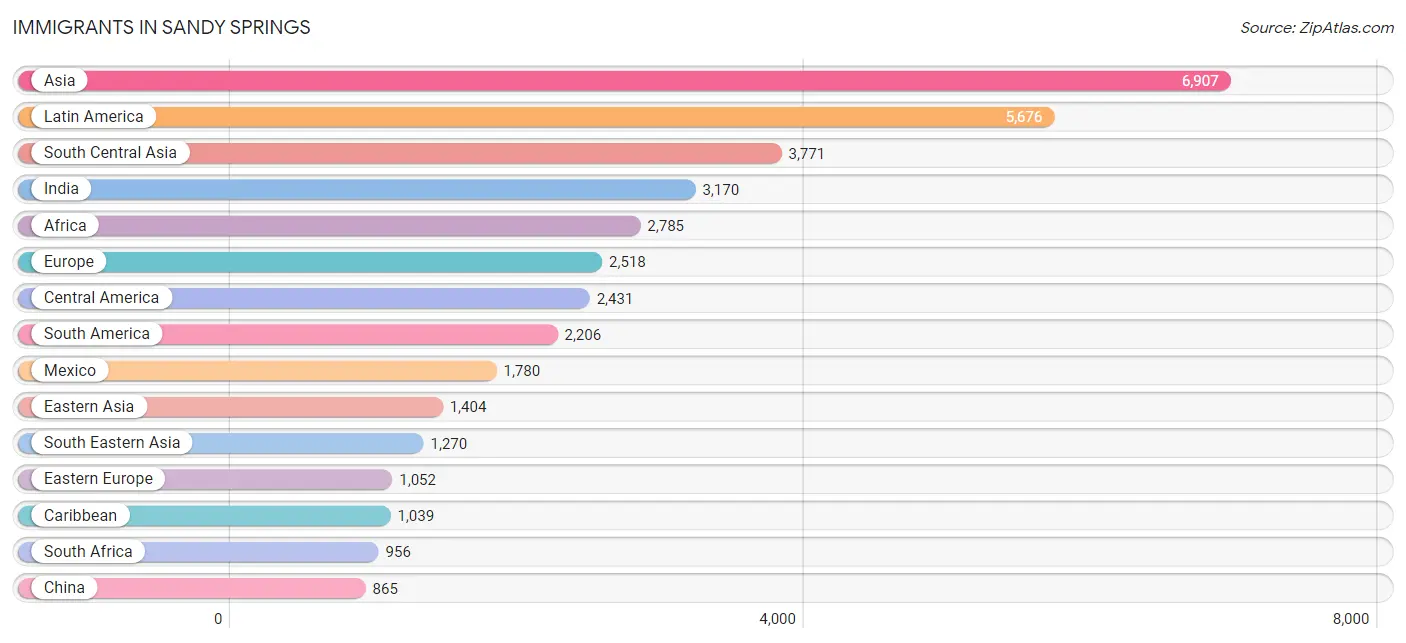
Immigrants in Sandy Springs
The most numerous immigrant groups reported in Sandy Springs came from Asia (6,907 | 6.4%), Latin America (5,676 | 5.3%), South Central Asia (3,771 | 3.5%), India (3,170 | 3.0%), and Africa (2,785 | 2.6%), together accounting for 20.8% of all Sandy Springs residents.
| Immigration Origin | # Population | % Population |
| Afghanistan | 12 | 0.0% |
| Africa | 2,785 | 2.6% |
| Argentina | 57 | 0.1% |
| Armenia | 24 | 0.0% |
| Asia | 6,907 | 6.4% |
| Australia | 10 | 0.0% |
| Austria | 9 | 0.0% |
| Bangladesh | 55 | 0.1% |
| Belarus | 113 | 0.1% |
| Belgium | 56 | 0.1% |
| Belize | 158 | 0.2% |
| Bolivia | 237 | 0.2% |
| Bosnia and Herzegovina | 17 | 0.0% |
| Brazil | 728 | 0.7% |
| Cambodia | 37 | 0.0% |
| Cameroon | 64 | 0.1% |
| Canada | 253 | 0.2% |
| Caribbean | 1,039 | 1.0% |
| Central America | 2,431 | 2.3% |
| Chile | 3 | 0.0% |
| China | 865 | 0.8% |
| Colombia | 416 | 0.4% |
| Costa Rica | 104 | 0.1% |
| Croatia | 30 | 0.0% |
| Cuba | 121 | 0.1% |
| Czechoslovakia | 55 | 0.1% |
| Denmark | 20 | 0.0% |
| Eastern Africa | 669 | 0.6% |
| Eastern Asia | 1,404 | 1.3% |
| Eastern Europe | 1,052 | 1.0% |
| Ecuador | 155 | 0.1% |
| Egypt | 44 | 0.0% |
| El Salvador | 111 | 0.1% |
| England | 206 | 0.2% |
| Ethiopia | 34 | 0.0% |
| Europe | 2,518 | 2.4% |
| France | 15 | 0.0% |
| Germany | 445 | 0.4% |
| Ghana | 138 | 0.1% |
| Greece | 12 | 0.0% |
| Grenada | 9 | 0.0% |
| Guatemala | 64 | 0.1% |
| Guyana | 7 | 0.0% |
| Haiti | 313 | 0.3% |
| Honduras | 146 | 0.1% |
| Hong Kong | 30 | 0.0% |
| India | 3,170 | 3.0% |
| Indonesia | 108 | 0.1% |
| Iran | 237 | 0.2% |
| Iraq | 14 | 0.0% |
| Ireland | 25 | 0.0% |
| Israel | 347 | 0.3% |
| Italy | 31 | 0.0% |
| Jamaica | 572 | 0.5% |
| Japan | 228 | 0.2% |
| Kazakhstan | 12 | 0.0% |
| Kenya | 202 | 0.2% |
| Korea | 311 | 0.3% |
| Laos | 40 | 0.0% |
| Latin America | 5,676 | 5.3% |
| Latvia | 10 | 0.0% |
| Lebanon | 7 | 0.0% |
| Malaysia | 15 | 0.0% |
| Mexico | 1,780 | 1.7% |
| Middle Africa | 149 | 0.1% |
| Morocco | 11 | 0.0% |
| Nepal | 79 | 0.1% |
| Netherlands | 59 | 0.1% |
| Nicaragua | 56 | 0.1% |
| Nigeria | 270 | 0.3% |
| Northern Africa | 195 | 0.2% |
| Northern Europe | 654 | 0.6% |
| Oceania | 36 | 0.0% |
| Pakistan | 80 | 0.1% |
| Panama | 12 | 0.0% |
| Peru | 98 | 0.1% |
| Philippines | 430 | 0.4% |
| Poland | 134 | 0.1% |
| Romania | 309 | 0.3% |
| Russia | 169 | 0.2% |
| Scotland | 10 | 0.0% |
| Senegal | 25 | 0.0% |
| South Africa | 956 | 0.9% |
| South America | 2,206 | 2.1% |
| South Central Asia | 3,771 | 3.5% |
| South Eastern Asia | 1,270 | 1.2% |
| Southern Europe | 218 | 0.2% |
| Spain | 175 | 0.2% |
| Sri Lanka | 40 | 0.0% |
| Switzerland | 10 | 0.0% |
| Taiwan | 121 | 0.1% |
| Thailand | 43 | 0.0% |
| Trinidad and Tobago | 24 | 0.0% |
| Turkey | 26 | 0.0% |
| Ukraine | 30 | 0.0% |
| Uruguay | 26 | 0.0% |
| Uzbekistan | 86 | 0.1% |
| Venezuela | 479 | 0.4% |
| Vietnam | 597 | 0.6% |
| Western Africa | 740 | 0.7% |
| Western Asia | 462 | 0.4% |
| Western Europe | 594 | 0.5% |
| Zaire | 45 | 0.0% |
| Zimbabwe | 198 | 0.2% | View All 104 Rows |
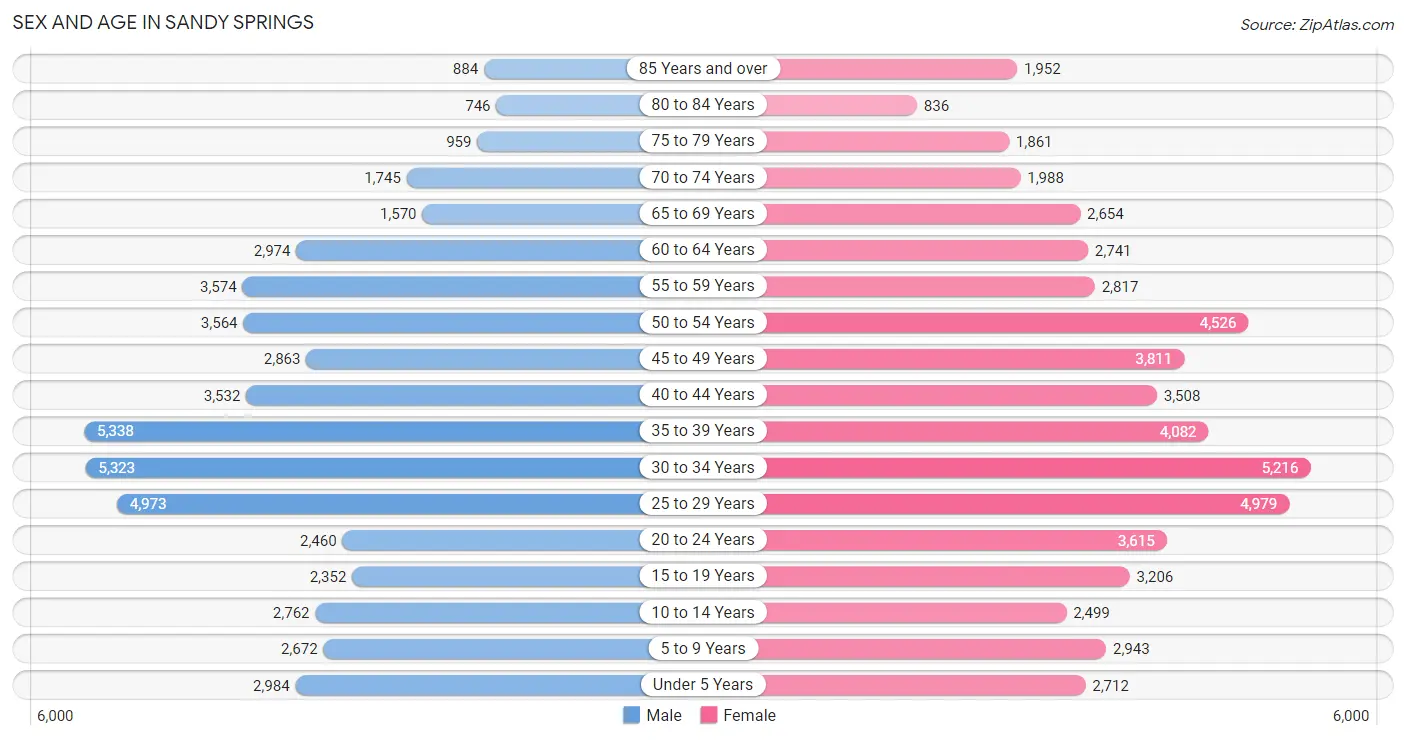
Sex and Age in Sandy Springs
Sex and Age in Sandy Springs
The most populous age groups in Sandy Springs are 35 to 39 Years (5,338 | 10.4%) for men and 30 to 34 Years (5,216 | 9.3%) for women.
| Age Bracket | Male | Female |
| Under 5 Years | 2,984 (5.8%) | 2,712 (4.9%) |
| 5 to 9 Years | 2,672 (5.2%) | 2,943 (5.3%) |
| 10 to 14 Years | 2,762 (5.4%) | 2,499 (4.5%) |
| 15 to 19 Years | 2,352 (4.6%) | 3,206 (5.7%) |
| 20 to 24 Years | 2,460 (4.8%) | 3,615 (6.5%) |
| 25 to 29 Years | 4,973 (9.7%) | 4,979 (8.9%) |
| 30 to 34 Years | 5,323 (10.4%) | 5,216 (9.3%) |
| 35 to 39 Years | 5,338 (10.4%) | 4,082 (7.3%) |
| 40 to 44 Years | 3,532 (6.9%) | 3,508 (6.3%) |
| 45 to 49 Years | 2,863 (5.6%) | 3,811 (6.8%) |
| 50 to 54 Years | 3,564 (7.0%) | 4,526 (8.1%) |
| 55 to 59 Years | 3,574 (7.0%) | 2,817 (5.0%) |
| 60 to 64 Years | 2,974 (5.8%) | 2,741 (4.9%) |
| 65 to 69 Years | 1,570 (3.1%) | 2,654 (4.7%) |
| 70 to 74 Years | 1,745 (3.4%) | 1,988 (3.5%) |
| 75 to 79 Years | 959 (1.9%) | 1,861 (3.3%) |
| 80 to 84 Years | 746 (1.5%) | 836 (1.5%) |
| 85 Years and over | 884 (1.7%) | 1,952 (3.5%) |
| Total | 51,275 (100.0%) | 55,946 (100.0%) |
Families and Households in Sandy Springs
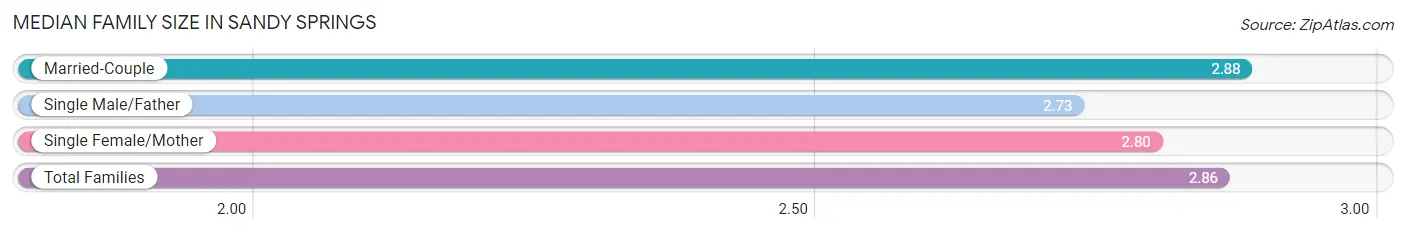
Median Family Size in Sandy Springs
The median family size in Sandy Springs is 2.86 persons per family, with married-couple families (19,635 | 75.6%) accounting for the largest median family size of 2.88 persons per family. On the other hand, single male/father families (1,300 | 5.0%) represent the smallest median family size with 2.73 persons per family.
| Family Type | # Families | Family Size |
| Married-Couple | 19,635 (75.6%) | 2.88 |
| Single Male/Father | 1,300 (5.0%) | 2.73 |
| Single Female/Mother | 5,034 (19.4%) | 2.80 |
| Total Families | 25,969 (100.0%) | 2.86 |
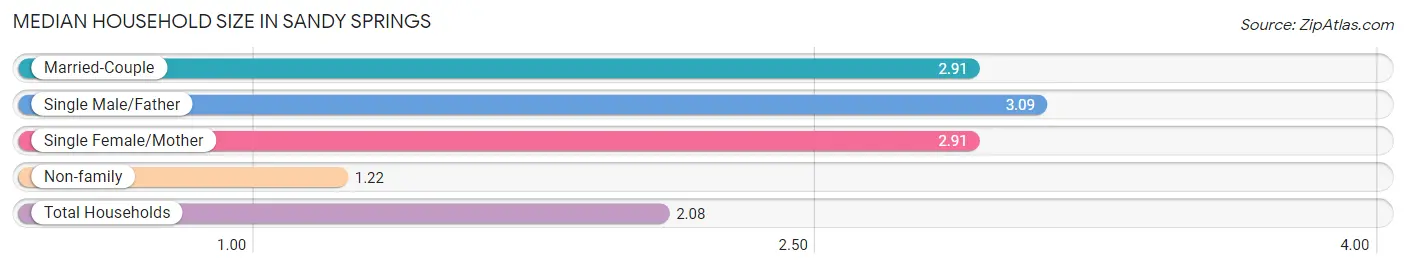
Median Household Size in Sandy Springs
The median household size in Sandy Springs is 2.08 persons per household, with single male/father households (1,300 | 2.5%) accounting for the largest median household size of 3.09 persons per household. non-family households (25,235 | 49.3%) represent the smallest median household size with 1.22 persons per household.
| Household Type | # Households | Household Size |
| Married-Couple | 19,635 (38.4%) | 2.91 |
| Single Male/Father | 1,300 (2.5%) | 3.09 |
| Single Female/Mother | 5,034 (9.8%) | 2.91 |
| Non-family | 25,235 (49.3%) | 1.22 |
| Total Households | 51,204 (100.0%) | 2.08 |
Household Size by Marriage Status in Sandy Springs
Out of a total of 51,204 households in Sandy Springs, 25,969 (50.7%) are family households, while 25,235 (49.3%) are nonfamily households. The most numerous type of family households are 2-person households, comprising 13,528, and the most common type of nonfamily households are 1-person households, comprising 20,307.
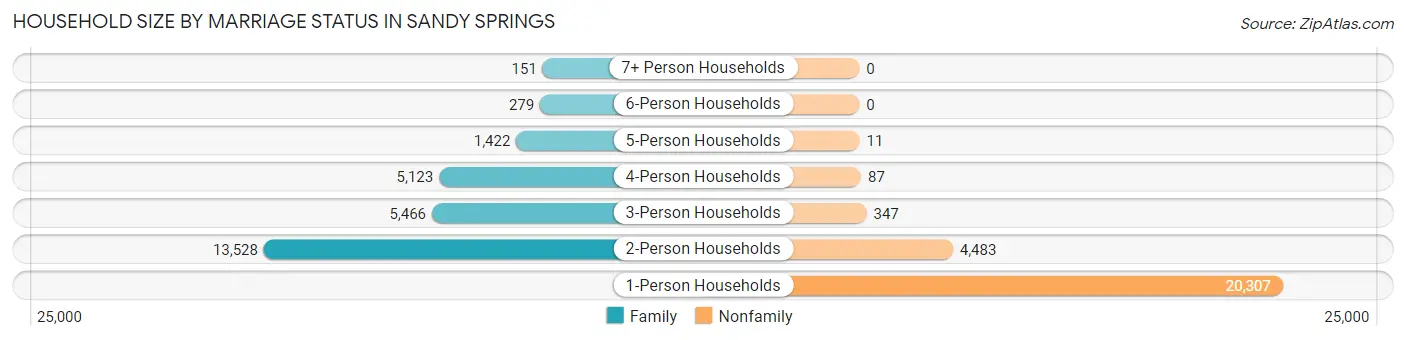
| Household Size | Family Households | Nonfamily Households |
| 1-Person Households | - | 20,307 (39.7%) |
| 2-Person Households | 13,528 (26.4%) | 4,483 (8.8%) |
| 3-Person Households | 5,466 (10.7%) | 347 (0.7%) |
| 4-Person Households | 5,123 (10.0%) | 87 (0.2%) |
| 5-Person Households | 1,422 (2.8%) | 11 (0.0%) |
| 6-Person Households | 279 (0.5%) | 0 (0.0%) |
| 7+ Person Households | 151 (0.3%) | 0 (0.0%) |
| Total | 25,969 (50.7%) | 25,235 (49.3%) |
Female Fertility in Sandy Springs
Fertility by Age in Sandy Springs
Average fertility rate in Sandy Springs is 38.0 births per 1,000 women. Women in the age bracket of 20 to 34 years have the highest fertility rate with 45.0 births per 1,000 women. Women in the age bracket of 20 to 34 years acount for 55.3% of all women with births.
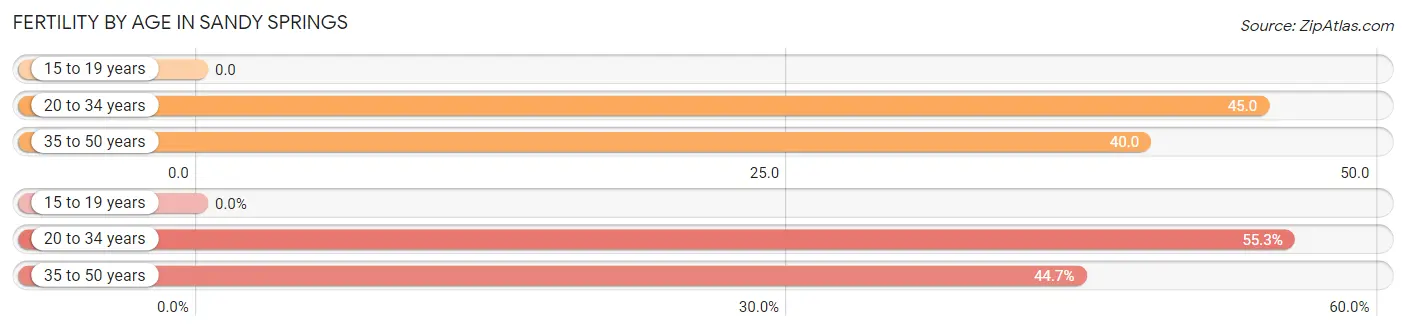
| Age Bracket | Women with Births | Births / 1,000 Women |
| 15 to 19 years | 0 (0.0%) | 0.0 |
| 20 to 34 years | 626 (55.3%) | 45.0 |
| 35 to 50 years | 506 (44.7%) | 40.0 |
| Total | 1,132 (100.0%) | 38.0 |
Fertility by Age by Marriage Status in Sandy Springs
89.9% of women with births (1,132) in Sandy Springs are married. The highest percentage of unmarried women with births falls into 20 to 34 years age bracket with 16.0% of them unmarried at the time of birth, while the lowest percentage of unmarried women with births belong to 35 to 50 years age bracket with 2.8% of them unmarried.
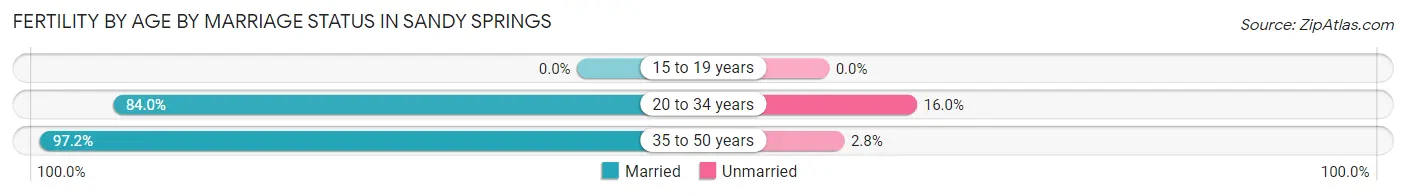
| Age Bracket | Married | Unmarried |
| 15 to 19 years | 0 (0.0%) | 0 (0.0%) |
| 20 to 34 years | 526 (84.0%) | 100 (16.0%) |
| 35 to 50 years | 492 (97.2%) | 14 (2.8%) |
| Total | 1,018 (89.9%) | 114 (10.1%) |
Fertility by Education in Sandy Springs
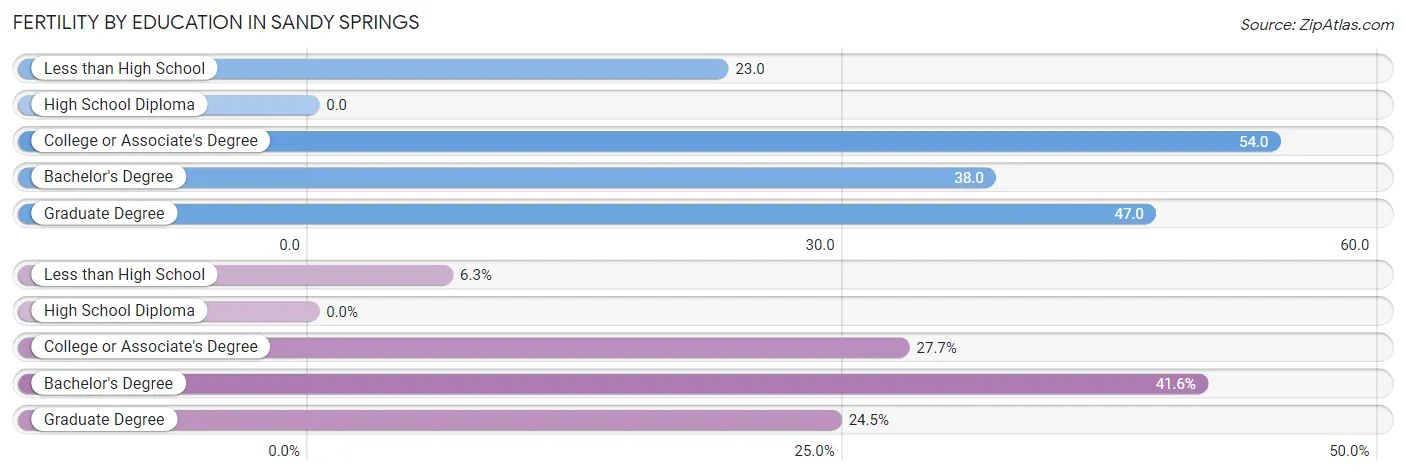
| Educational Attainment | Women with Births | Births / 1,000 Women |
| Less than High School | 71 (6.3%) | 23.0 |
| High School Diploma | 0 (0.0%) | 0.0 |
| College or Associate's Degree | 313 (27.7%) | 54.0 |
| Bachelor's Degree | 471 (41.6%) | 38.0 |
| Graduate Degree | 277 (24.5%) | 47.0 |
| Total | 1,132 (100.0%) | 38.0 |
Fertility by Education by Marriage Status in Sandy Springs
10.1% of women with births in Sandy Springs are unmarried. Women with the educational attainment of less than high school are most likely to be married with 100.0% of them married at childbirth, while women with the educational attainment of college or associate's degree are least likely to be married with 32.0% of them unmarried at childbirth.
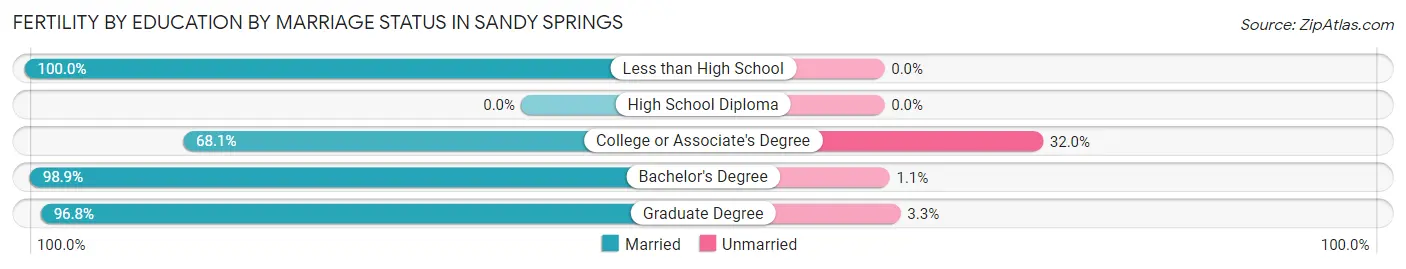
| Educational Attainment | Married | Unmarried |
| Less than High School | 71 (100.0%) | 0 (0.0%) |
| High School Diploma | 0 (0.0%) | 0 (0.0%) |
| College or Associate's Degree | 213 (68.0%) | 100 (32.0%) |
| Bachelor's Degree | 466 (98.9%) | 5 (1.1%) |
| Graduate Degree | 268 (96.8%) | 9 (3.3%) |
| Total | 1,018 (89.9%) | 114 (10.1%) |
Employment Characteristics in Sandy Springs
Employment by Class of Employer in Sandy Springs
Among the 61,892 employed individuals in Sandy Springs, private company employees (44,426 | 71.8%), not-for-profit organizations (4,614 | 7.4%), and self-employed (incorporated) (4,569 | 7.4%) make up the most common classes of employment.
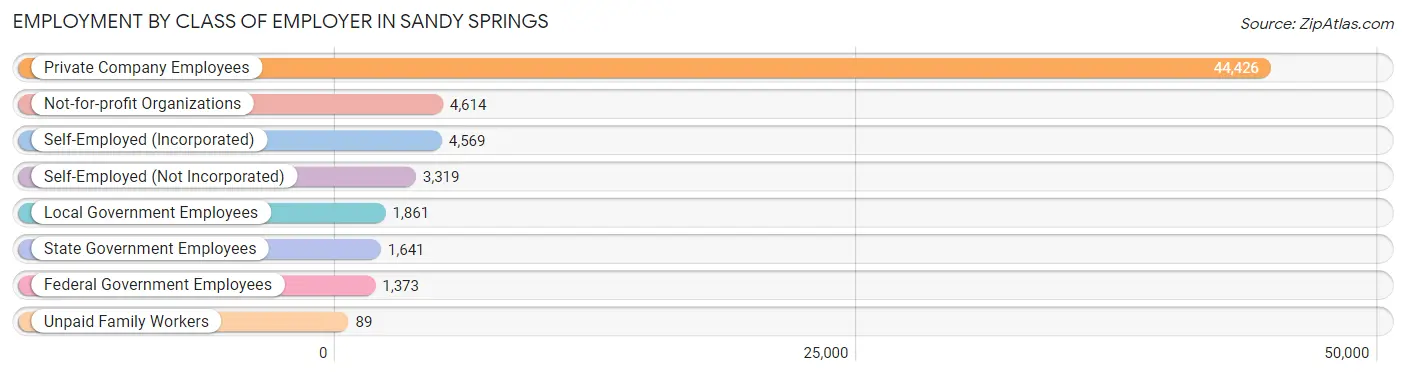
| Employer Class | # Employees | % Employees |
| Private Company Employees | 44,426 | 71.8% |
| Self-Employed (Incorporated) | 4,569 | 7.4% |
| Self-Employed (Not Incorporated) | 3,319 | 5.4% |
| Not-for-profit Organizations | 4,614 | 7.4% |
| Local Government Employees | 1,861 | 3.0% |
| State Government Employees | 1,641 | 2.6% |
| Federal Government Employees | 1,373 | 2.2% |
| Unpaid Family Workers | 89 | 0.1% |
| Total | 61,892 | 100.0% |
Employment Status by Age in Sandy Springs
According to the labor force statistics for Sandy Springs, out of the total population over 16 years of age (89,508), 72.9% or 65,251 individuals are in the labor force, with 3.7% or 2,414 of them unemployed. The age group with the highest labor force participation rate is 25 to 29 years, with 91.5% or 9,106 individuals in the labor force. Within the labor force, the 16 to 19 years age range has the highest percentage of unemployed individuals, with 8.3% or 124 of them being unemployed.
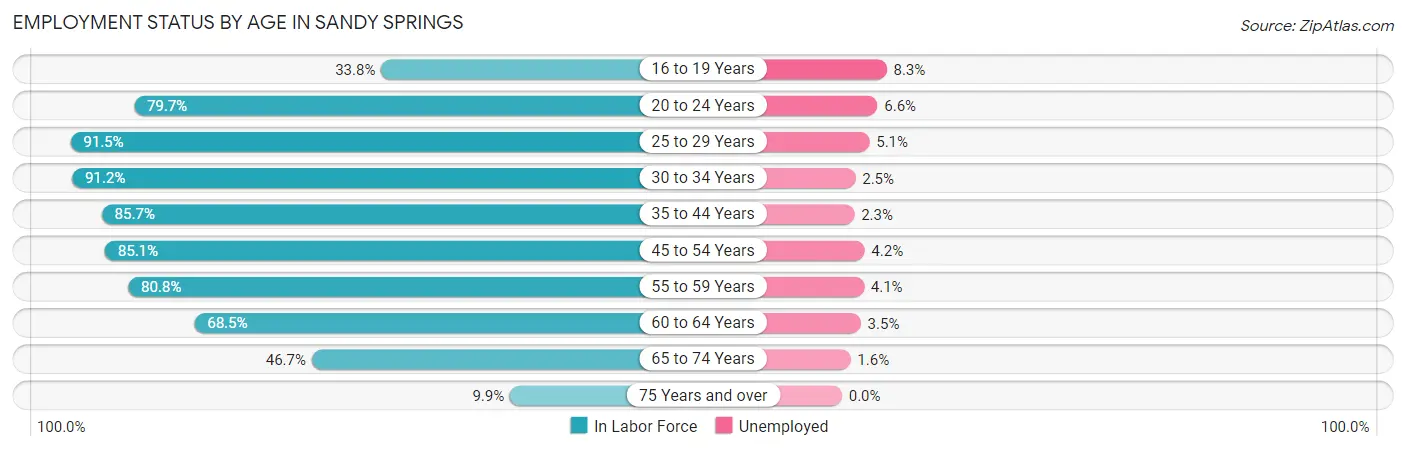
| Age Bracket | In Labor Force | Unemployed |
| 16 to 19 Years | 1,493 (33.8%) | 124 (8.3%) |
| 20 to 24 Years | 4,842 (79.7%) | 320 (6.6%) |
| 25 to 29 Years | 9,106 (91.5%) | 464 (5.1%) |
| 30 to 34 Years | 9,612 (91.2%) | 240 (2.5%) |
| 35 to 44 Years | 14,106 (85.7%) | 324 (2.3%) |
| 45 to 54 Years | 12,564 (85.1%) | 528 (4.2%) |
| 55 to 59 Years | 5,164 (80.8%) | 212 (4.1%) |
| 60 to 64 Years | 3,915 (68.5%) | 137 (3.5%) |
| 65 to 74 Years | 3,716 (46.7%) | 59 (1.6%) |
| 75 Years and over | 717 (9.9%) | 0 (0.0%) |
| Total | 65,251 (72.9%) | 2,414 (3.7%) |
Employment Status by Educational Attainment in Sandy Springs
According to labor force statistics for Sandy Springs, 85.3% of individuals (54,439) out of the total population between 25 and 64 years of age (63,821) are in the labor force, with 3.5% or 1,905 of them being unemployed. The group with the highest labor force participation rate are those with the educational attainment of bachelor's degree or higher, with 88.7% or 39,000 individuals in the labor force. Within the labor force, individuals with less than high school education have the highest percentage of unemployment, with 7.4% or 102 of them being unemployed.
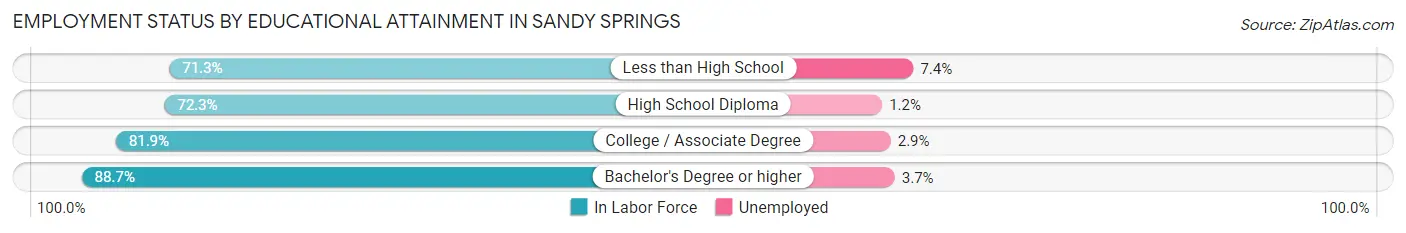
| Educational Attainment | In Labor Force | Unemployed |
| Less than High School | 1,383 (71.3%) | 144 (7.4%) |
| High School Diploma | 4,260 (72.3%) | 71 (1.2%) |
| College / Associate Degree | 9,845 (81.9%) | 349 (2.9%) |
| Bachelor's Degree or higher | 39,000 (88.7%) | 1,627 (3.7%) |
| Total | 54,439 (85.3%) | 2,234 (3.5%) |
Employment Occupations by Sex in Sandy Springs
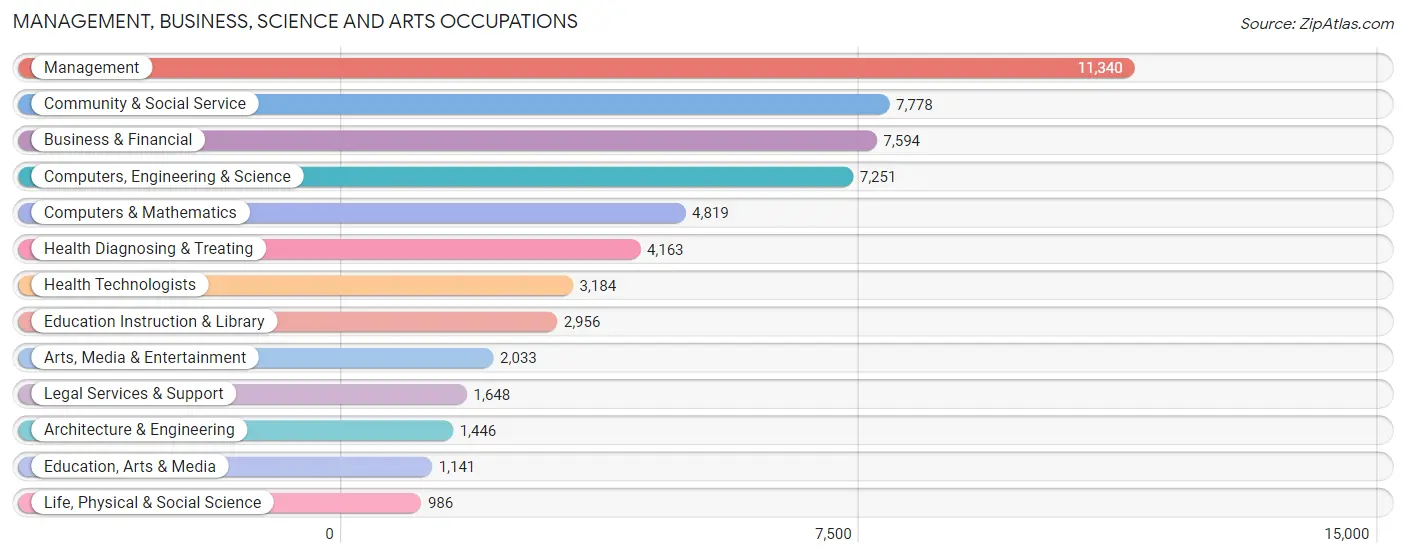
Management, Business, Science and Arts Occupations
The most common Management, Business, Science and Arts occupations in Sandy Springs are Management (11,340 | 18.1%), Community & Social Service (7,778 | 12.4%), Business & Financial (7,594 | 12.1%), Computers, Engineering & Science (7,251 | 11.6%), and Computers & Mathematics (4,819 | 7.7%).
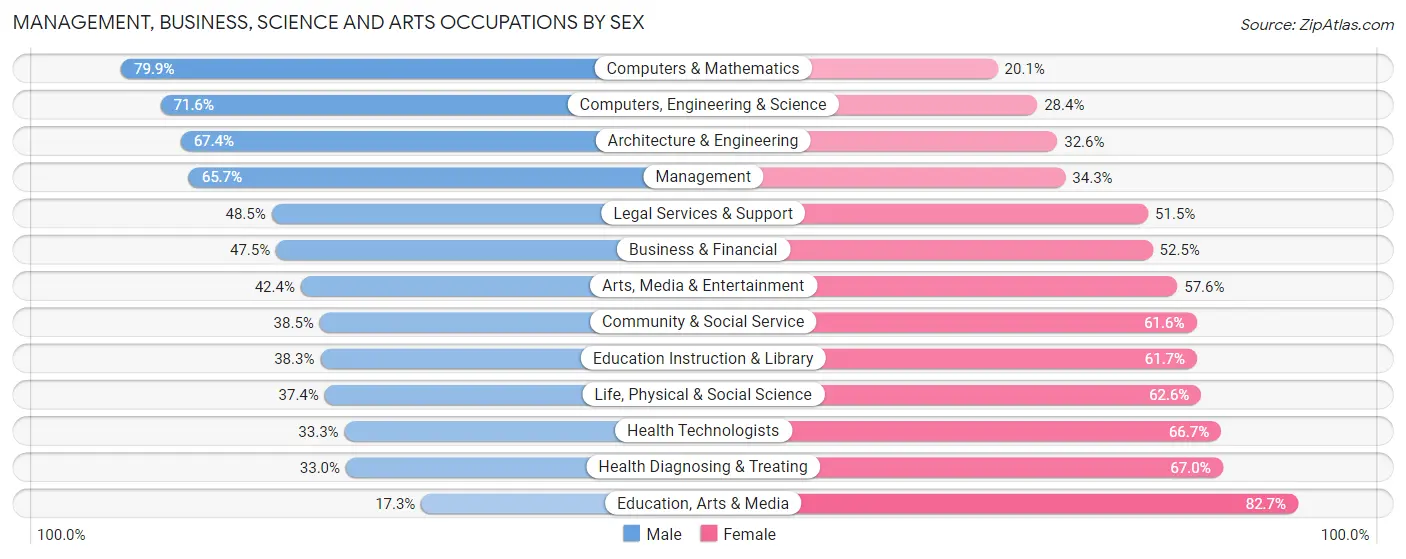
Management, Business, Science and Arts Occupations by Sex
Within the Management, Business, Science and Arts occupations in Sandy Springs, the most male-oriented occupations are Computers & Mathematics (79.9%), Computers, Engineering & Science (71.6%), and Architecture & Engineering (67.4%), while the most female-oriented occupations are Education, Arts & Media (82.7%), Health Diagnosing & Treating (67.0%), and Health Technologists (66.7%).
| Occupation | Male | Female |
| Management | 7,455 (65.7%) | 3,885 (34.3%) |
| Business & Financial | 3,610 (47.5%) | 3,984 (52.5%) |
| Computers, Engineering & Science | 5,193 (71.6%) | 2,058 (28.4%) |
| Computers & Mathematics | 3,849 (79.9%) | 970 (20.1%) |
| Architecture & Engineering | 975 (67.4%) | 471 (32.6%) |
| Life, Physical & Social Science | 369 (37.4%) | 617 (62.6%) |
| Community & Social Service | 2,991 (38.5%) | 4,787 (61.6%) |
| Education, Arts & Media | 197 (17.3%) | 944 (82.7%) |
| Legal Services & Support | 799 (48.5%) | 849 (51.5%) |
| Education Instruction & Library | 1,133 (38.3%) | 1,823 (61.7%) |
| Arts, Media & Entertainment | 862 (42.4%) | 1,171 (57.6%) |
| Health Diagnosing & Treating | 1,373 (33.0%) | 2,790 (67.0%) |
| Health Technologists | 1,060 (33.3%) | 2,124 (66.7%) |
| Total (Category) | 20,622 (54.1%) | 17,504 (45.9%) |
| Total (Overall) | 32,298 (51.5%) | 30,445 (48.5%) |
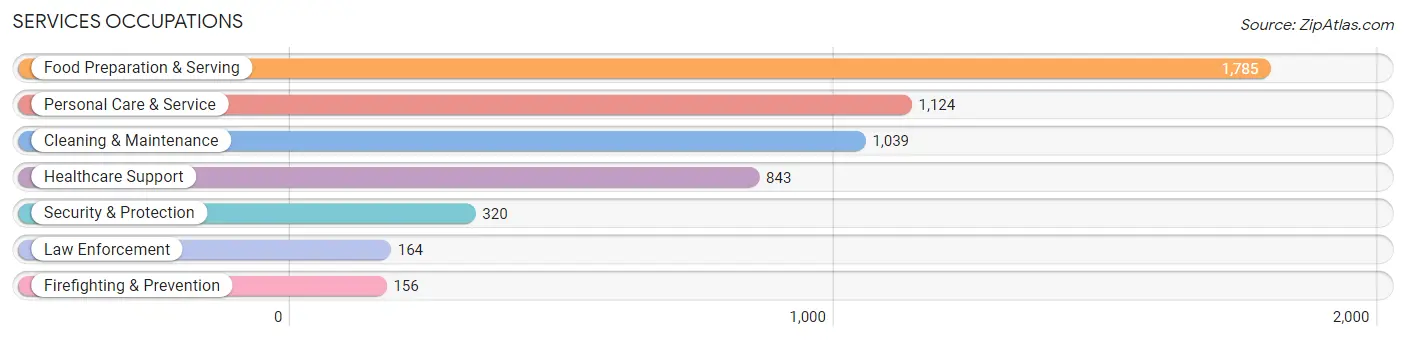
Services Occupations
The most common Services occupations in Sandy Springs are Food Preparation & Serving (1,785 | 2.8%), Personal Care & Service (1,124 | 1.8%), Cleaning & Maintenance (1,039 | 1.7%), Healthcare Support (843 | 1.3%), and Security & Protection (320 | 0.5%).
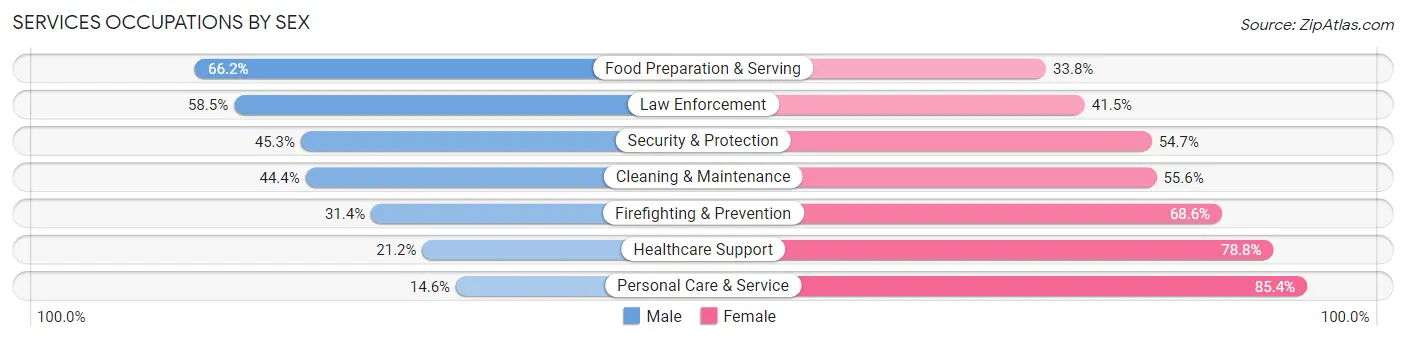
Services Occupations by Sex
Within the Services occupations in Sandy Springs, the most male-oriented occupations are Food Preparation & Serving (66.2%), Law Enforcement (58.5%), and Security & Protection (45.3%), while the most female-oriented occupations are Personal Care & Service (85.4%), Healthcare Support (78.8%), and Firefighting & Prevention (68.6%).
| Occupation | Male | Female |
| Healthcare Support | 179 (21.2%) | 664 (78.8%) |
| Security & Protection | 145 (45.3%) | 175 (54.7%) |
| Firefighting & Prevention | 49 (31.4%) | 107 (68.6%) |
| Law Enforcement | 96 (58.5%) | 68 (41.5%) |
| Food Preparation & Serving | 1,182 (66.2%) | 603 (33.8%) |
| Cleaning & Maintenance | 461 (44.4%) | 578 (55.6%) |
| Personal Care & Service | 164 (14.6%) | 960 (85.4%) |
| Total (Category) | 2,131 (41.7%) | 2,980 (58.3%) |
| Total (Overall) | 32,298 (51.5%) | 30,445 (48.5%) |
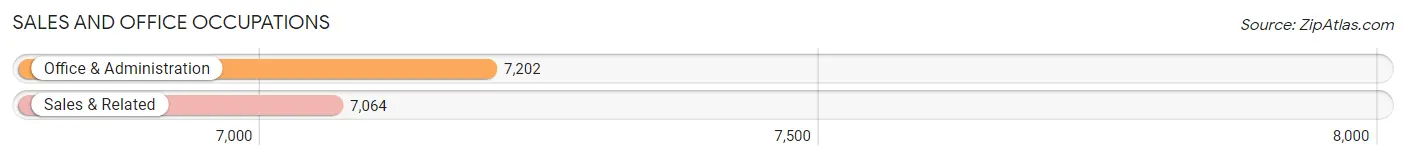
Sales and Office Occupations
The most common Sales and Office occupations in Sandy Springs are Office & Administration (7,202 | 11.5%), and Sales & Related (7,064 | 11.3%).
Sales and Office Occupations by Sex
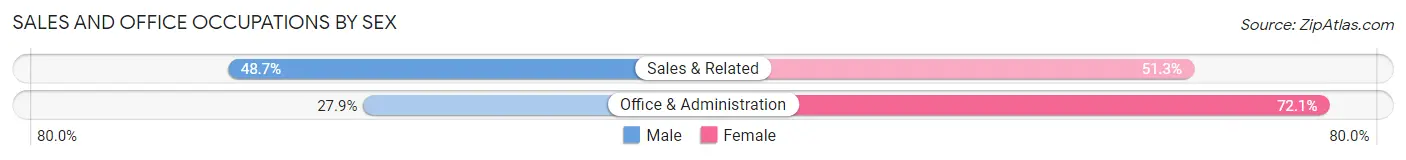
| Occupation | Male | Female |
| Sales & Related | 3,443 (48.7%) | 3,621 (51.3%) |
| Office & Administration | 2,009 (27.9%) | 5,193 (72.1%) |
| Total (Category) | 5,452 (38.2%) | 8,814 (61.8%) |
| Total (Overall) | 32,298 (51.5%) | 30,445 (48.5%) |
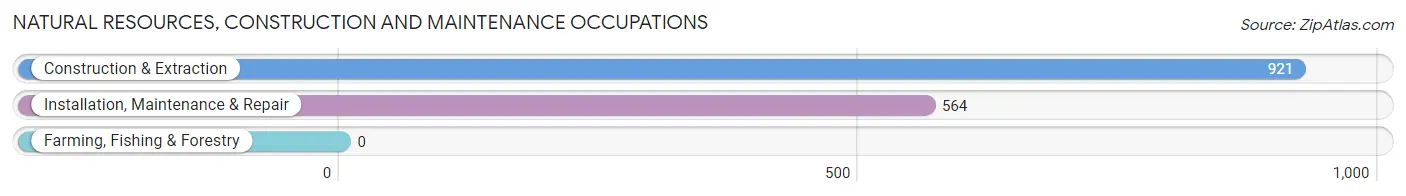
Natural Resources, Construction and Maintenance Occupations
The most common Natural Resources, Construction and Maintenance occupations in Sandy Springs are Construction & Extraction (921 | 1.5%), and Installation, Maintenance & Repair (564 | 0.9%).
Natural Resources, Construction and Maintenance Occupations by Sex
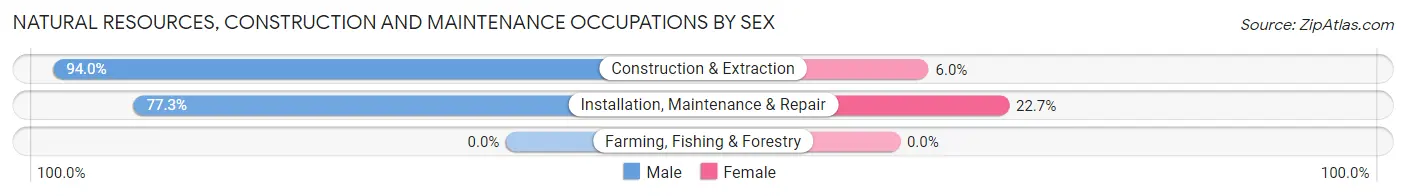
| Occupation | Male | Female |
| Farming, Fishing & Forestry | 0 (0.0%) | 0 (0.0%) |
| Construction & Extraction | 866 (94.0%) | 55 (6.0%) |
| Installation, Maintenance & Repair | 436 (77.3%) | 128 (22.7%) |
| Total (Category) | 1,302 (87.7%) | 183 (12.3%) |
| Total (Overall) | 32,298 (51.5%) | 30,445 (48.5%) |
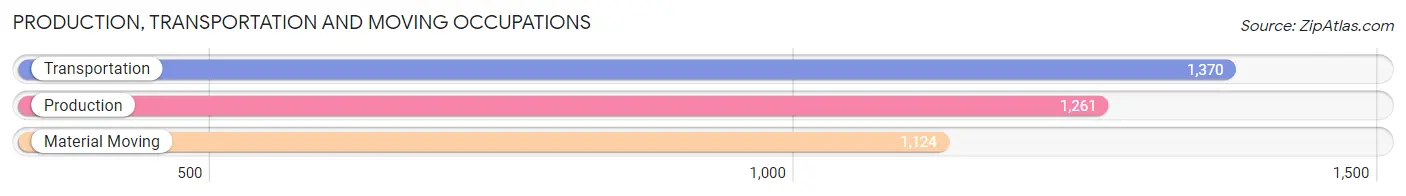
Production, Transportation and Moving Occupations
The most common Production, Transportation and Moving occupations in Sandy Springs are Transportation (1,370 | 2.2%), Production (1,261 | 2.0%), and Material Moving (1,124 | 1.8%).
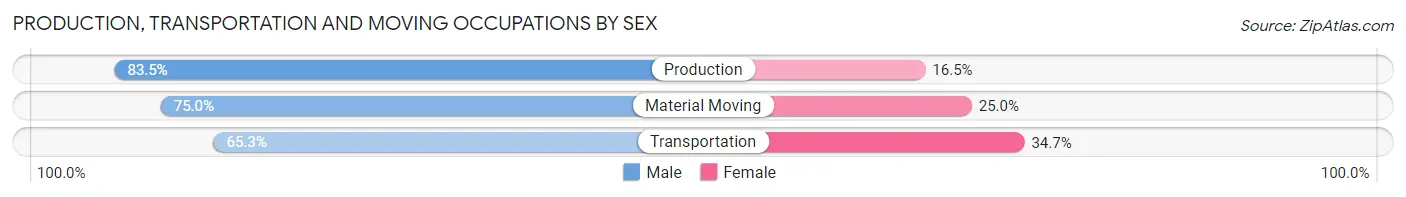
Production, Transportation and Moving Occupations by Sex
| Occupation | Male | Female |
| Production | 1,053 (83.5%) | 208 (16.5%) |
| Transportation | 895 (65.3%) | 475 (34.7%) |
| Material Moving | 843 (75.0%) | 281 (25.0%) |
| Total (Category) | 2,791 (74.3%) | 964 (25.7%) |
| Total (Overall) | 32,298 (51.5%) | 30,445 (48.5%) |
Employment Industries by Sex in Sandy Springs
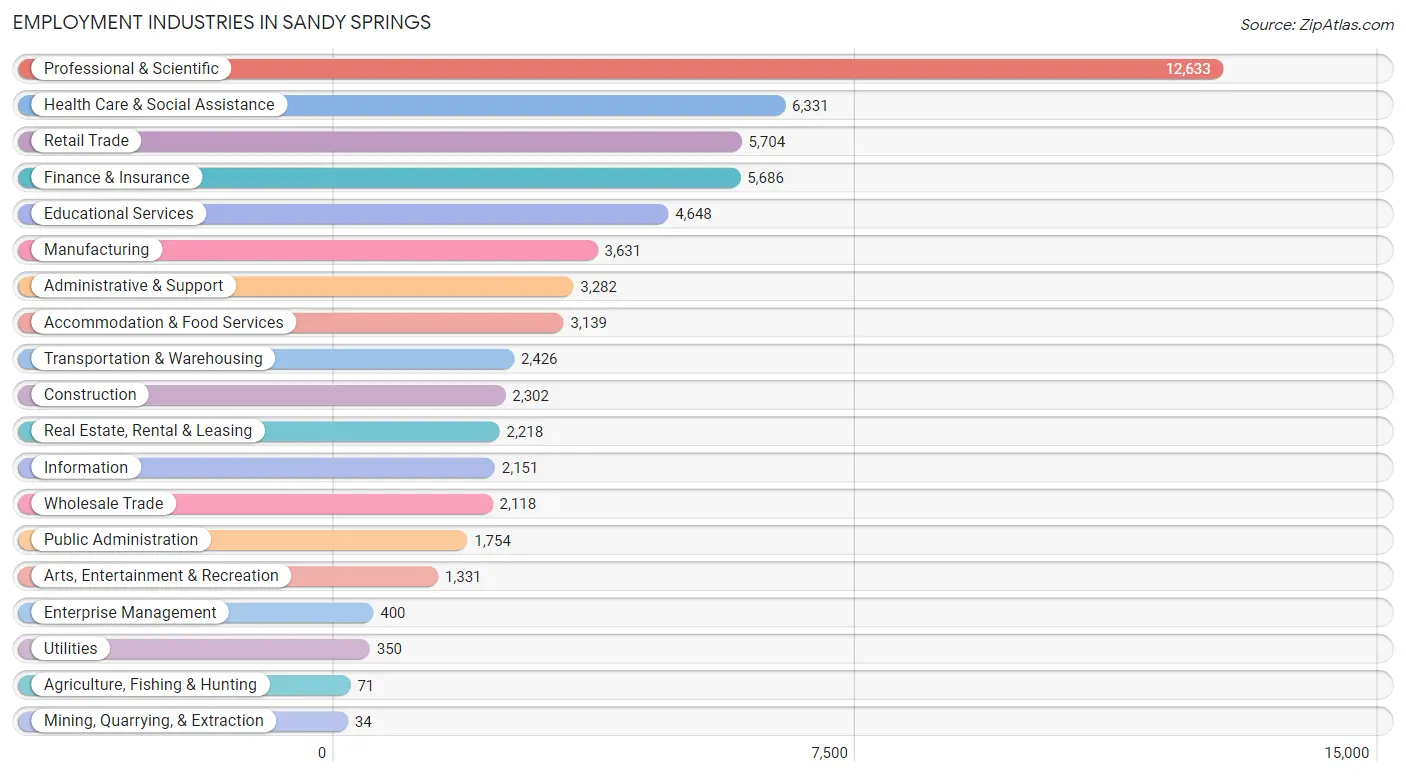
Employment Industries in Sandy Springs
The major employment industries in Sandy Springs include Professional & Scientific (12,633 | 20.1%), Health Care & Social Assistance (6,331 | 10.1%), Retail Trade (5,704 | 9.1%), Finance & Insurance (5,686 | 9.1%), and Educational Services (4,648 | 7.4%).
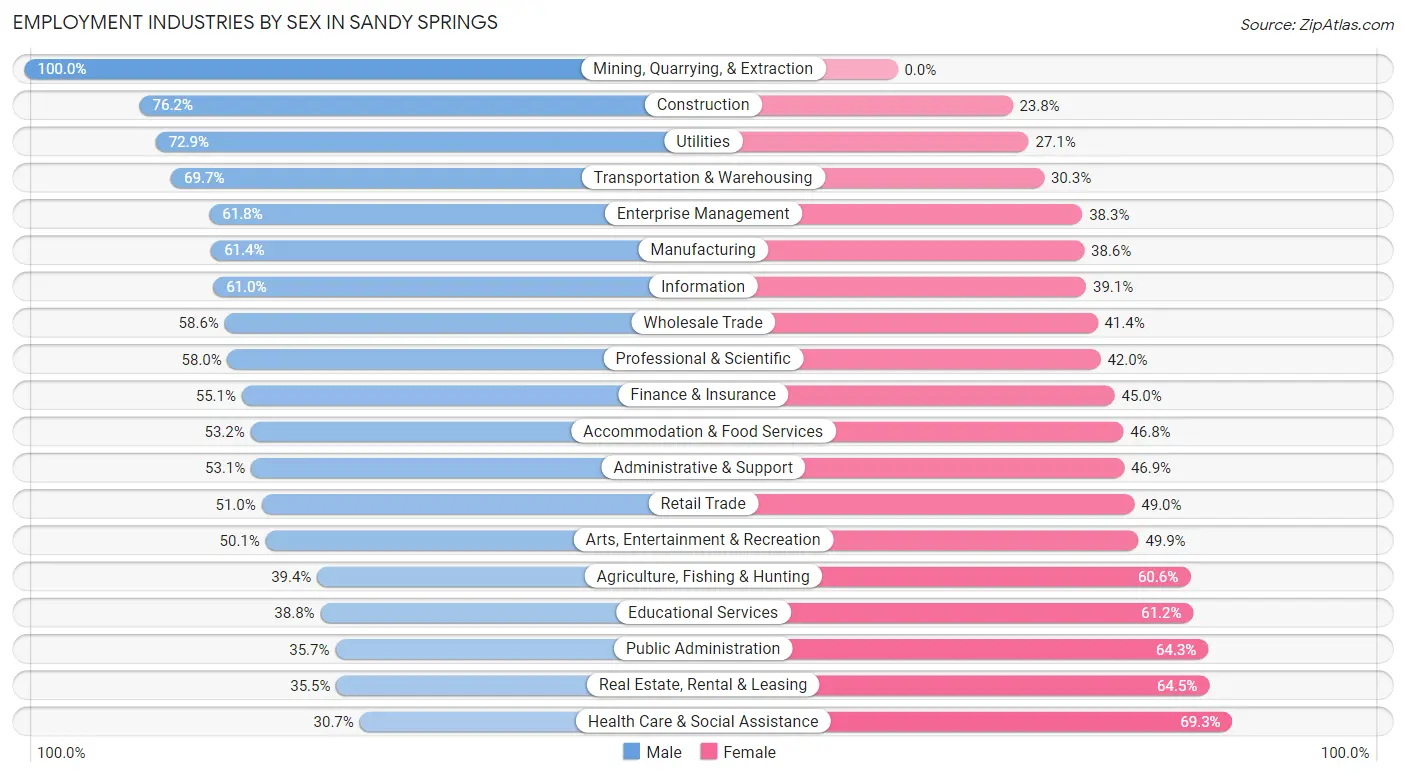
Employment Industries by Sex in Sandy Springs
The Sandy Springs industries that see more men than women are Mining, Quarrying, & Extraction (100.0%), Construction (76.2%), and Utilities (72.9%), whereas the industries that tend to have a higher number of women are Health Care & Social Assistance (69.3%), Real Estate, Rental & Leasing (64.5%), and Public Administration (64.3%).
| Industry | Male | Female |
| Agriculture, Fishing & Hunting | 28 (39.4%) | 43 (60.6%) |
| Mining, Quarrying, & Extraction | 34 (100.0%) | 0 (0.0%) |
| Construction | 1,754 (76.2%) | 548 (23.8%) |
| Manufacturing | 2,228 (61.4%) | 1,403 (38.6%) |
| Wholesale Trade | 1,241 (58.6%) | 877 (41.4%) |
| Retail Trade | 2,907 (51.0%) | 2,797 (49.0%) |
| Transportation & Warehousing | 1,690 (69.7%) | 736 (30.3%) |
| Utilities | 255 (72.9%) | 95 (27.1%) |
| Information | 1,311 (61.0%) | 840 (39.1%) |
| Finance & Insurance | 3,130 (55.0%) | 2,556 (45.0%) |
| Real Estate, Rental & Leasing | 787 (35.5%) | 1,431 (64.5%) |
| Professional & Scientific | 7,324 (58.0%) | 5,309 (42.0%) |
| Enterprise Management | 247 (61.8%) | 153 (38.3%) |
| Administrative & Support | 1,743 (53.1%) | 1,539 (46.9%) |
| Educational Services | 1,802 (38.8%) | 2,846 (61.2%) |
| Health Care & Social Assistance | 1,941 (30.7%) | 4,390 (69.3%) |
| Arts, Entertainment & Recreation | 667 (50.1%) | 664 (49.9%) |
| Accommodation & Food Services | 1,671 (53.2%) | 1,468 (46.8%) |
| Public Administration | 626 (35.7%) | 1,128 (64.3%) |
| Total | 32,298 (51.5%) | 30,445 (48.5%) |
Education in Sandy Springs
School Enrollment in Sandy Springs
The most common levels of schooling among the 21,994 students in Sandy Springs are high school (4,807 | 21.9%), middle school (4,140 | 18.8%), and college / undergraduate (4,083 | 18.6%).
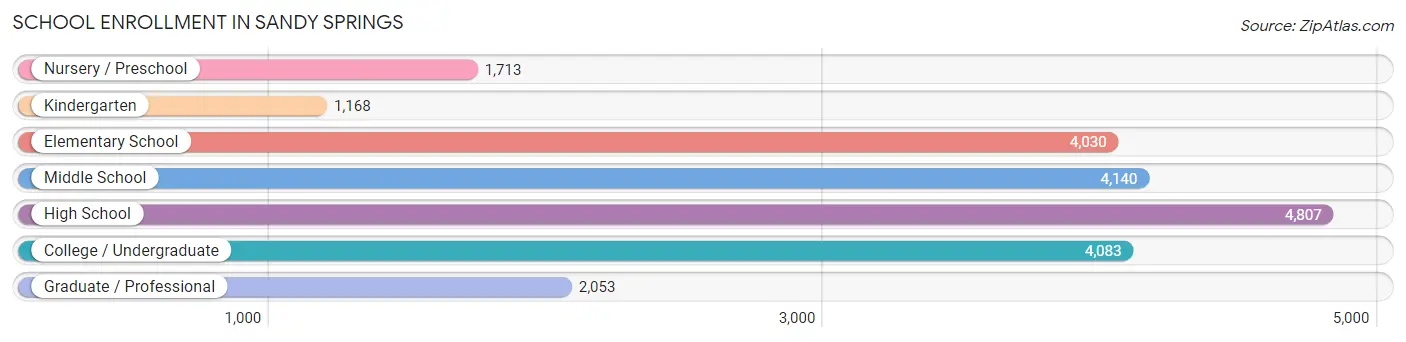
| School Level | # Students | % Students |
| Nursery / Preschool | 1,713 | 7.8% |
| Kindergarten | 1,168 | 5.3% |
| Elementary School | 4,030 | 18.3% |
| Middle School | 4,140 | 18.8% |
| High School | 4,807 | 21.9% |
| College / Undergraduate | 4,083 | 18.6% |
| Graduate / Professional | 2,053 | 9.3% |
| Total | 21,994 | 100.0% |
School Enrollment by Age by Funding Source in Sandy Springs
Out of a total of 21,994 students who are enrolled in schools in Sandy Springs, 7,610 (34.6%) attend a private institution, while the remaining 14,384 (65.4%) are enrolled in public schools. The age group of 3 to 4 year olds has the highest likelihood of being enrolled in private schools, with 708 (58.7% in the age bracket) enrolled. Conversely, the age group of 20 to 24 year olds has the lowest likelihood of being enrolled in a private school, with 1,919 (78.4% in the age bracket) attending a public institution.
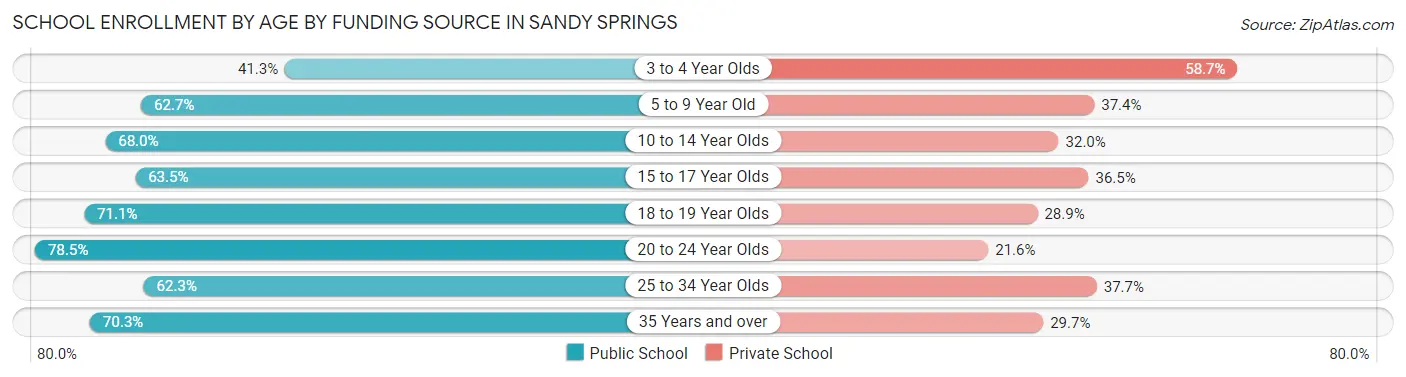
| Age Bracket | Public School | Private School |
| 3 to 4 Year Olds | 499 (41.3%) | 708 (58.7%) |
| 5 to 9 Year Old | 3,262 (62.6%) | 1,945 (37.3%) |
| 10 to 14 Year Olds | 3,512 (68.0%) | 1,655 (32.0%) |
| 15 to 17 Year Olds | 2,219 (63.5%) | 1,275 (36.5%) |
| 18 to 19 Year Olds | 778 (71.1%) | 316 (28.9%) |
| 20 to 24 Year Olds | 1,919 (78.4%) | 527 (21.5%) |
| 25 to 34 Year Olds | 1,319 (62.3%) | 799 (37.7%) |
| 35 Years and over | 886 (70.3%) | 375 (29.7%) |
| Total | 14,384 (65.4%) | 7,610 (34.6%) |
Educational Attainment by Field of Study in Sandy Springs
Business (16,413 | 28.6%), engineering (4,984 | 8.7%), social sciences (4,978 | 8.7%), education (4,162 | 7.2%), and computers & mathematics (3,943 | 6.9%) are the most common fields of study among 57,386 individuals in Sandy Springs who have obtained a bachelor's degree or higher.
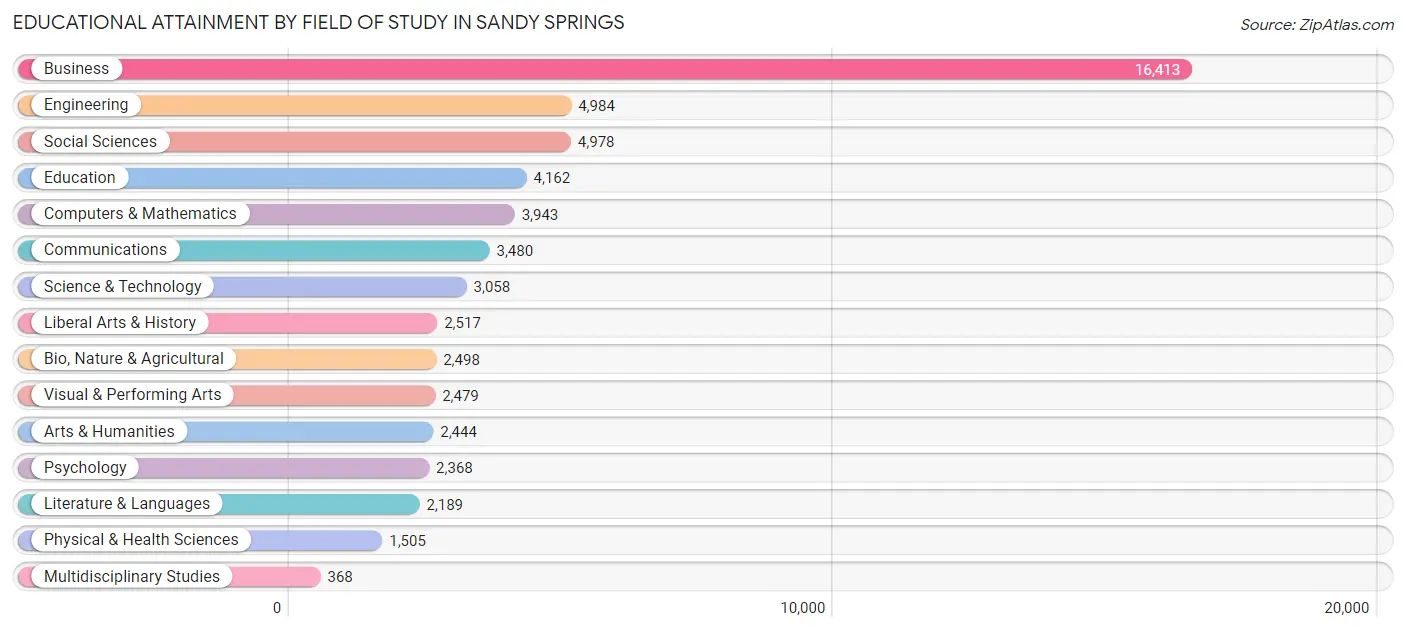
| Field of Study | # Graduates | % Graduates |
| Computers & Mathematics | 3,943 | 6.9% |
| Bio, Nature & Agricultural | 2,498 | 4.3% |
| Physical & Health Sciences | 1,505 | 2.6% |
| Psychology | 2,368 | 4.1% |
| Social Sciences | 4,978 | 8.7% |
| Engineering | 4,984 | 8.7% |
| Multidisciplinary Studies | 368 | 0.6% |
| Science & Technology | 3,058 | 5.3% |
| Business | 16,413 | 28.6% |
| Education | 4,162 | 7.2% |
| Literature & Languages | 2,189 | 3.8% |
| Liberal Arts & History | 2,517 | 4.4% |
| Visual & Performing Arts | 2,479 | 4.3% |
| Communications | 3,480 | 6.1% |
| Arts & Humanities | 2,444 | 4.3% |
| Total | 57,386 | 100.0% |
Transportation & Commute in Sandy Springs
Vehicle Availability by Sex in Sandy Springs
The most prevalent vehicle ownership categories in Sandy Springs are males with 2 vehicles (13,529, accounting for 42.1%) and females with 2 vehicles (13,040, making up 45.6%).
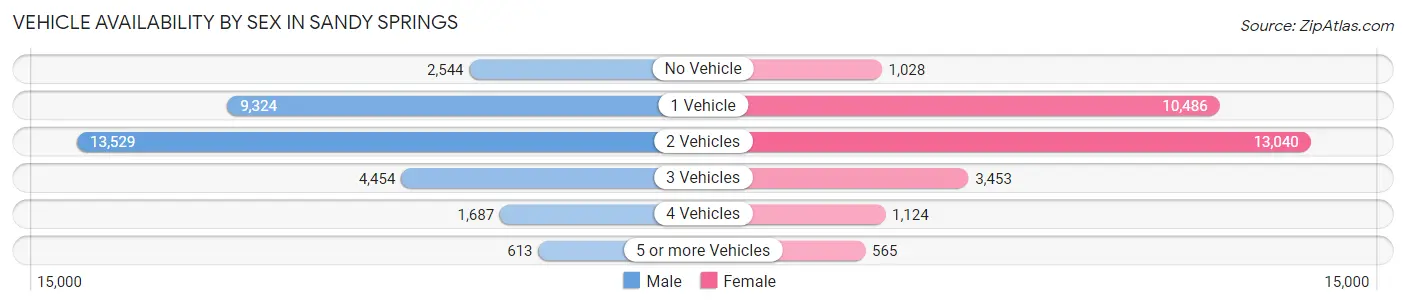
| Vehicles Available | Male | Female |
| No Vehicle | 2,544 (7.9%) | 1,028 (3.5%) |
| 1 Vehicle | 9,324 (29.0%) | 10,486 (35.3%) |
| 2 Vehicles | 13,529 (42.1%) | 13,040 (43.9%) |
| 3 Vehicles | 4,454 (13.9%) | 3,453 (11.6%) |
| 4 Vehicles | 1,687 (5.2%) | 1,124 (3.8%) |
| 5 or more Vehicles | 613 (1.9%) | 565 (1.9%) |
| Total | 32,151 (100.0%) | 29,696 (100.0%) |
Commute Time in Sandy Springs
The most frequently occuring commute durations in Sandy Springs are 20 to 24 minutes (8,646 commuters, 18.6%), 15 to 19 minutes (7,926 commuters, 17.0%), and 30 to 34 minutes (7,138 commuters, 15.3%).
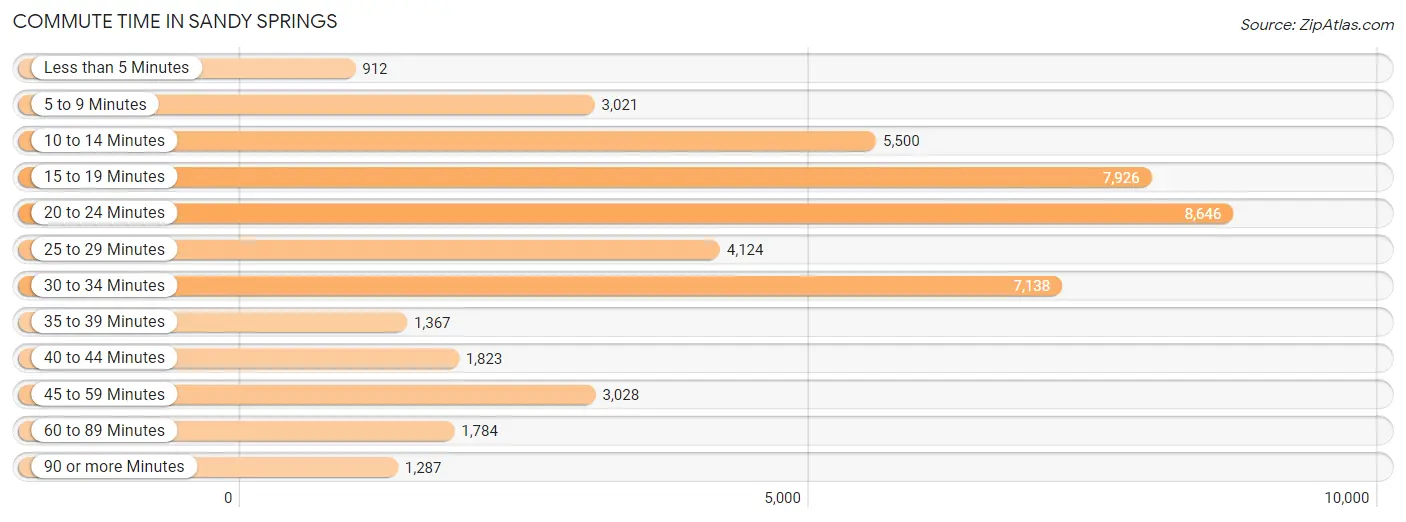
| Commute Time | # Commuters | % Commuters |
| Less than 5 Minutes | 912 | 2.0% |
| 5 to 9 Minutes | 3,021 | 6.5% |
| 10 to 14 Minutes | 5,500 | 11.8% |
| 15 to 19 Minutes | 7,926 | 17.0% |
| 20 to 24 Minutes | 8,646 | 18.6% |
| 25 to 29 Minutes | 4,124 | 8.9% |
| 30 to 34 Minutes | 7,138 | 15.3% |
| 35 to 39 Minutes | 1,367 | 2.9% |
| 40 to 44 Minutes | 1,823 | 3.9% |
| 45 to 59 Minutes | 3,028 | 6.5% |
| 60 to 89 Minutes | 1,784 | 3.8% |
| 90 or more Minutes | 1,287 | 2.8% |
Commute Time by Sex in Sandy Springs
The most common commute times in Sandy Springs are 15 to 19 minutes (4,664 commuters, 19.2%) for males and 20 to 24 minutes (4,244 commuters, 19.1%) for females.
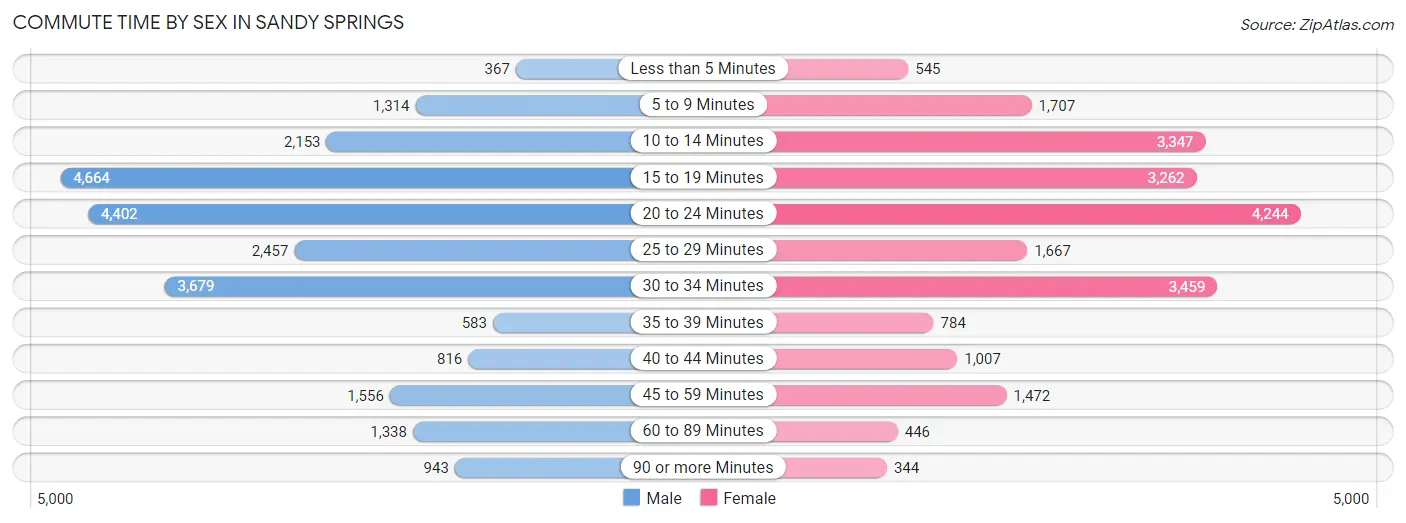
| Commute Time | Male | Female |
| Less than 5 Minutes | 367 (1.5%) | 545 (2.5%) |
| 5 to 9 Minutes | 1,314 (5.4%) | 1,707 (7.7%) |
| 10 to 14 Minutes | 2,153 (8.9%) | 3,347 (15.0%) |
| 15 to 19 Minutes | 4,664 (19.2%) | 3,262 (14.6%) |
| 20 to 24 Minutes | 4,402 (18.1%) | 4,244 (19.1%) |
| 25 to 29 Minutes | 2,457 (10.1%) | 1,667 (7.5%) |
| 30 to 34 Minutes | 3,679 (15.2%) | 3,459 (15.5%) |
| 35 to 39 Minutes | 583 (2.4%) | 784 (3.5%) |
| 40 to 44 Minutes | 816 (3.4%) | 1,007 (4.5%) |
| 45 to 59 Minutes | 1,556 (6.4%) | 1,472 (6.6%) |
| 60 to 89 Minutes | 1,338 (5.5%) | 446 (2.0%) |
| 90 or more Minutes | 943 (3.9%) | 344 (1.5%) |
Time of Departure to Work by Sex in Sandy Springs
The most frequent times of departure to work in Sandy Springs are 7:00 AM to 7:29 AM (4,446, 18.3%) for males and 7:00 AM to 7:29 AM (3,816, 17.1%) for females.
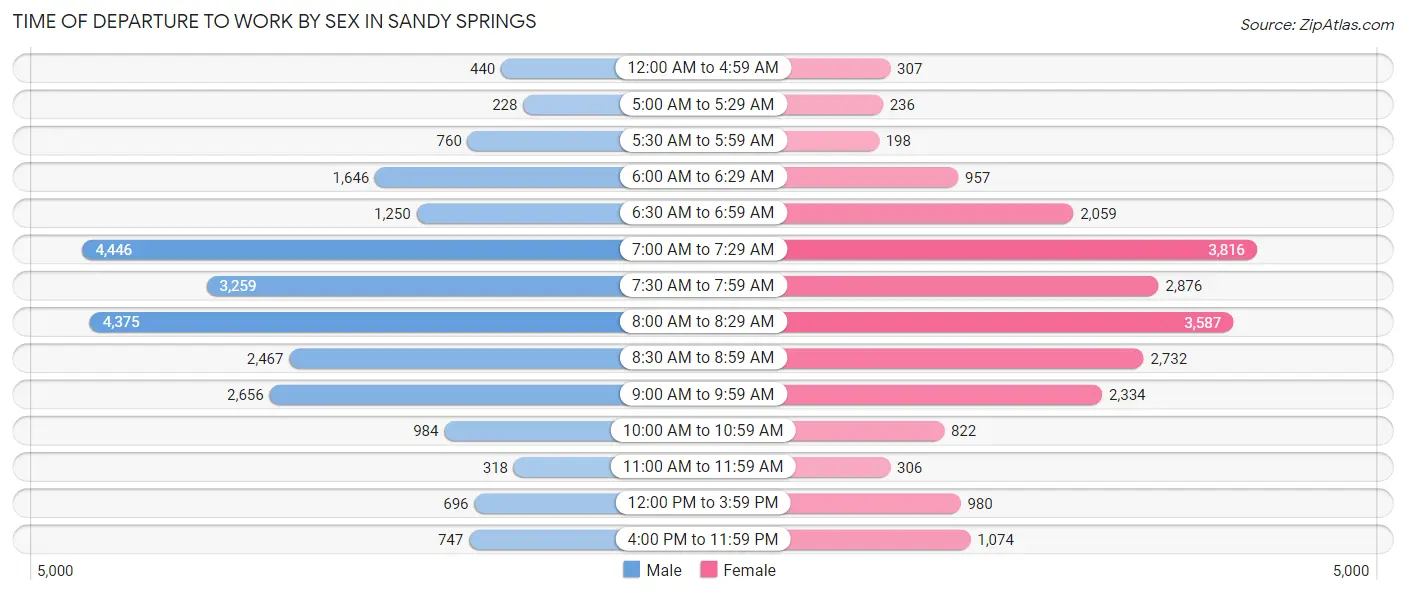
| Time of Departure | Male | Female |
| 12:00 AM to 4:59 AM | 440 (1.8%) | 307 (1.4%) |
| 5:00 AM to 5:29 AM | 228 (0.9%) | 236 (1.1%) |
| 5:30 AM to 5:59 AM | 760 (3.1%) | 198 (0.9%) |
| 6:00 AM to 6:29 AM | 1,646 (6.8%) | 957 (4.3%) |
| 6:30 AM to 6:59 AM | 1,250 (5.1%) | 2,059 (9.2%) |
| 7:00 AM to 7:29 AM | 4,446 (18.3%) | 3,816 (17.1%) |
| 7:30 AM to 7:59 AM | 3,259 (13.4%) | 2,876 (12.9%) |
| 8:00 AM to 8:29 AM | 4,375 (18.0%) | 3,587 (16.1%) |
| 8:30 AM to 8:59 AM | 2,467 (10.2%) | 2,732 (12.3%) |
| 9:00 AM to 9:59 AM | 2,656 (10.9%) | 2,334 (10.5%) |
| 10:00 AM to 10:59 AM | 984 (4.1%) | 822 (3.7%) |
| 11:00 AM to 11:59 AM | 318 (1.3%) | 306 (1.4%) |
| 12:00 PM to 3:59 PM | 696 (2.9%) | 980 (4.4%) |
| 4:00 PM to 11:59 PM | 747 (3.1%) | 1,074 (4.8%) |
| Total | 24,272 (100.0%) | 22,284 (100.0%) |
Housing Occupancy in Sandy Springs
Occupancy by Ownership in Sandy Springs
Of the total 51,204 dwellings in Sandy Springs, owner-occupied units account for 25,842 (50.5%), while renter-occupied units make up 25,362 (49.5%).
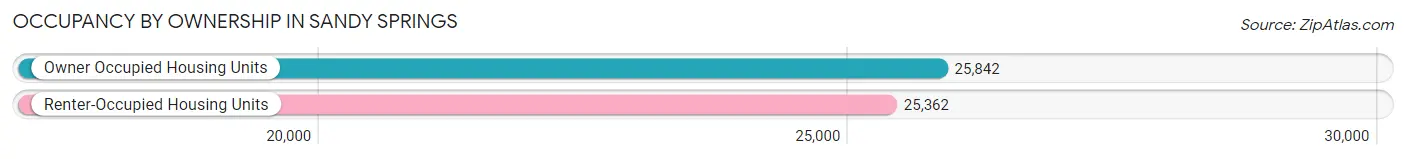
| Occupancy | # Housing Units | % Housing Units |
| Owner Occupied Housing Units | 25,842 | 50.5% |
| Renter-Occupied Housing Units | 25,362 | 49.5% |
| Total Occupied Housing Units | 51,204 | 100.0% |
Occupancy by Household Size in Sandy Springs
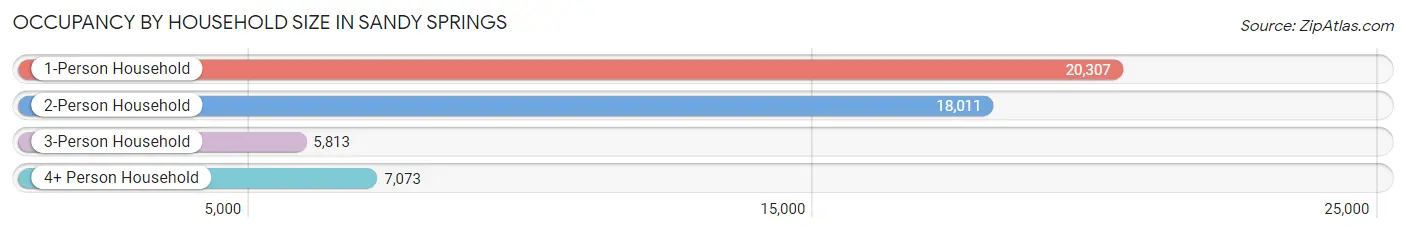
| Household Size | # Housing Units | % Housing Units |
| 1-Person Household | 20,307 | 39.7% |
| 2-Person Household | 18,011 | 35.2% |
| 3-Person Household | 5,813 | 11.4% |
| 4+ Person Household | 7,073 | 13.8% |
| Total Housing Units | 51,204 | 100.0% |
Occupancy by Ownership by Household Size in Sandy Springs
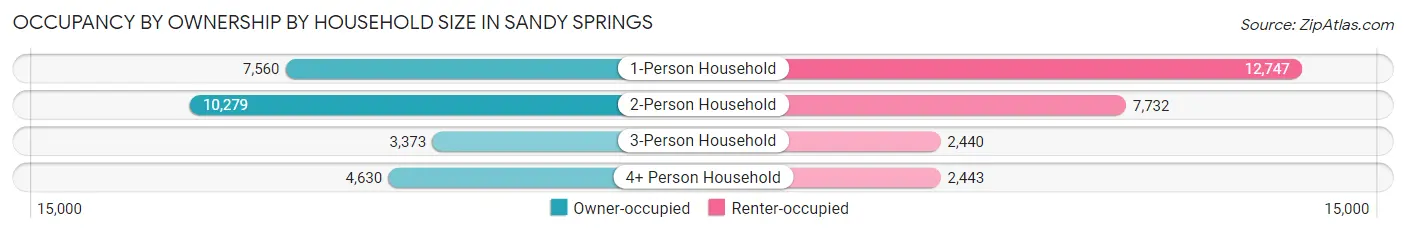
| Household Size | Owner-occupied | Renter-occupied |
| 1-Person Household | 7,560 (37.2%) | 12,747 (62.8%) |
| 2-Person Household | 10,279 (57.1%) | 7,732 (42.9%) |
| 3-Person Household | 3,373 (58.0%) | 2,440 (42.0%) |
| 4+ Person Household | 4,630 (65.5%) | 2,443 (34.5%) |
| Total Housing Units | 25,842 (50.5%) | 25,362 (49.5%) |
Occupancy by Educational Attainment in Sandy Springs
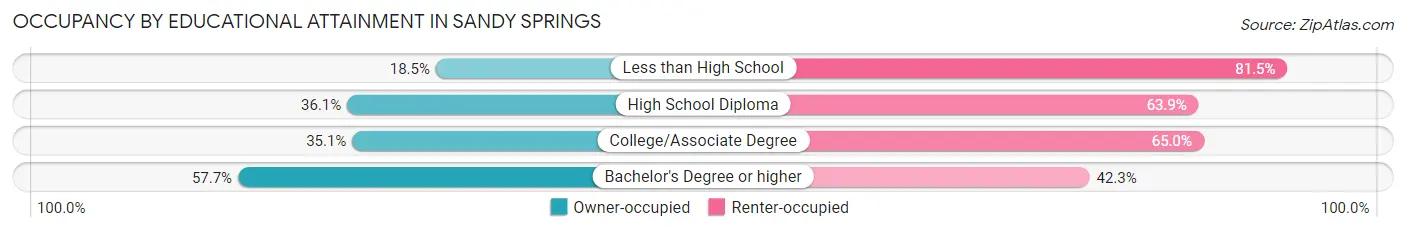
| Household Size | Owner-occupied | Renter-occupied |
| Less than High School | 202 (18.5%) | 891 (81.5%) |
| High School Diploma | 1,571 (36.1%) | 2,786 (63.9%) |
| College/Associate Degree | 3,605 (35.0%) | 6,680 (64.9%) |
| Bachelor's Degree or higher | 20,464 (57.7%) | 15,005 (42.3%) |
Occupancy by Age of Householder in Sandy Springs
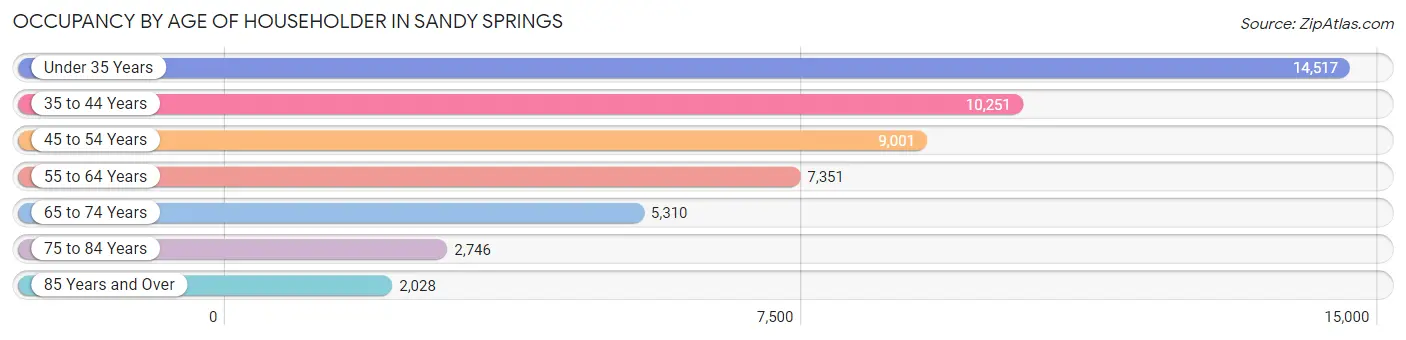
| Age Bracket | # Households | % Households |
| Under 35 Years | 14,517 | 28.3% |
| 35 to 44 Years | 10,251 | 20.0% |
| 45 to 54 Years | 9,001 | 17.6% |
| 55 to 64 Years | 7,351 | 14.4% |
| 65 to 74 Years | 5,310 | 10.4% |
| 75 to 84 Years | 2,746 | 5.4% |
| 85 Years and Over | 2,028 | 4.0% |
| Total | 51,204 | 100.0% |
Housing Finances in Sandy Springs
Median Income by Occupancy in Sandy Springs
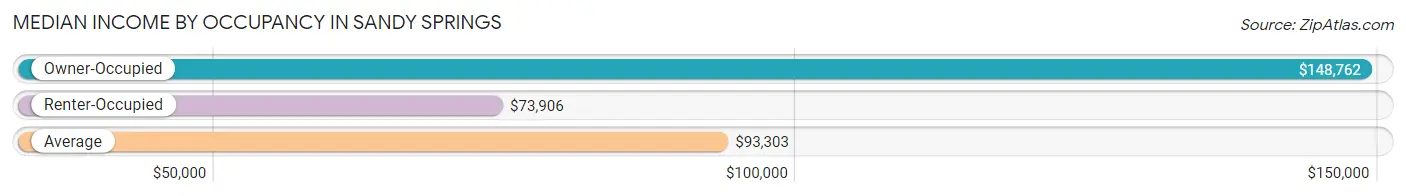
| Occupancy Type | # Households | Median Income |
| Owner-Occupied | 25,842 (50.5%) | $148,762 |
| Renter-Occupied | 25,362 (49.5%) | $73,906 |
| Average | 51,204 (100.0%) | $93,303 |
Occupancy by Householder Income Bracket in Sandy Springs
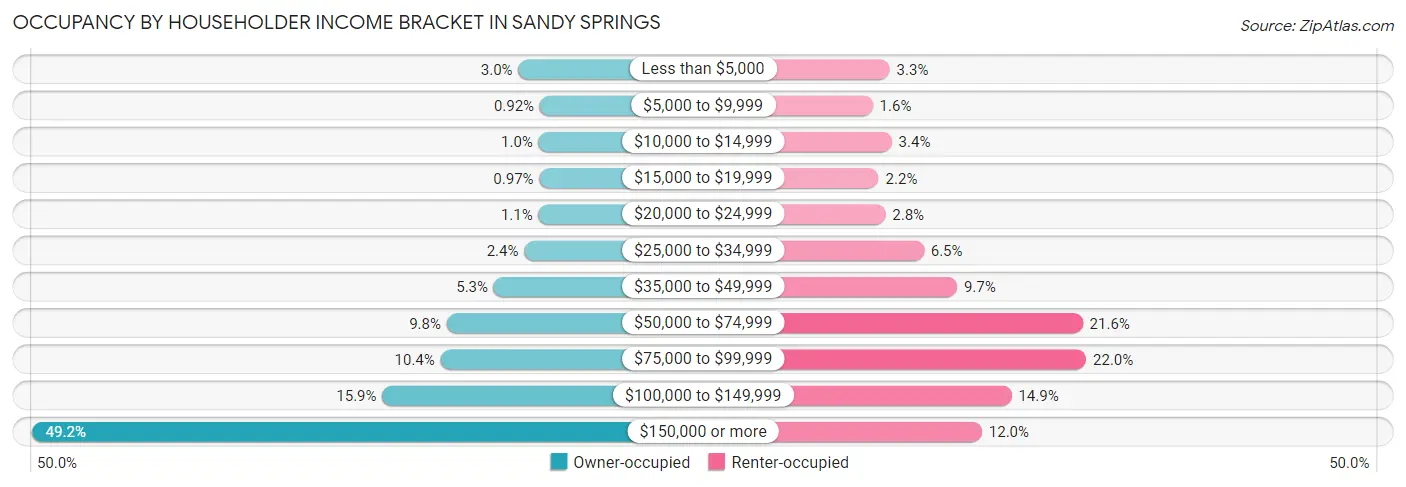
| Income Bracket | Owner-occupied | Renter-occupied |
| Less than $5,000 | 767 (3.0%) | 825 (3.3%) |
| $5,000 to $9,999 | 238 (0.9%) | 414 (1.6%) |
| $10,000 to $14,999 | 269 (1.0%) | 873 (3.4%) |
| $15,000 to $19,999 | 250 (1.0%) | 559 (2.2%) |
| $20,000 to $24,999 | 271 (1.1%) | 721 (2.8%) |
| $25,000 to $34,999 | 623 (2.4%) | 1,648 (6.5%) |
| $35,000 to $49,999 | 1,372 (5.3%) | 2,450 (9.7%) |
| $50,000 to $74,999 | 2,531 (9.8%) | 5,485 (21.6%) |
| $75,000 to $99,999 | 2,683 (10.4%) | 5,570 (22.0%) |
| $100,000 to $149,999 | 4,117 (15.9%) | 3,766 (14.8%) |
| $150,000 or more | 12,721 (49.2%) | 3,051 (12.0%) |
| Total | 25,842 (100.0%) | 25,362 (100.0%) |
Monthly Housing Cost Tiers in Sandy Springs
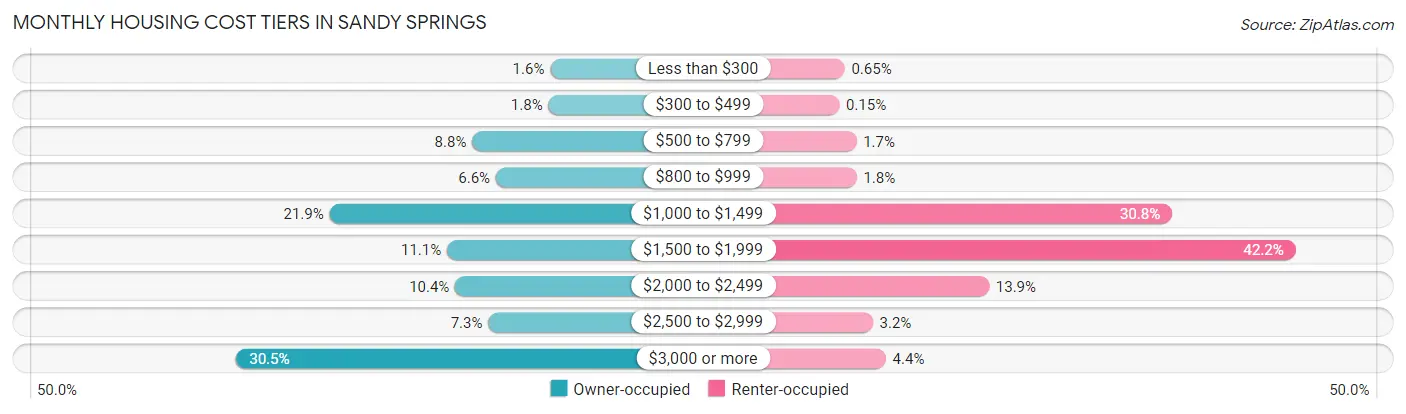
| Monthly Cost | Owner-occupied | Renter-occupied |
| Less than $300 | 415 (1.6%) | 166 (0.6%) |
| $300 to $499 | 458 (1.8%) | 37 (0.2%) |
| $500 to $799 | 2,272 (8.8%) | 440 (1.7%) |
| $800 to $999 | 1,709 (6.6%) | 445 (1.8%) |
| $1,000 to $1,499 | 5,667 (21.9%) | 7,811 (30.8%) |
| $1,500 to $1,999 | 2,871 (11.1%) | 10,697 (42.2%) |
| $2,000 to $2,499 | 2,676 (10.4%) | 3,535 (13.9%) |
| $2,500 to $2,999 | 1,889 (7.3%) | 821 (3.2%) |
| $3,000 or more | 7,885 (30.5%) | 1,127 (4.4%) |
| Total | 25,842 (100.0%) | 25,362 (100.0%) |
Physical Housing Characteristics in Sandy Springs
Housing Structures in Sandy Springs
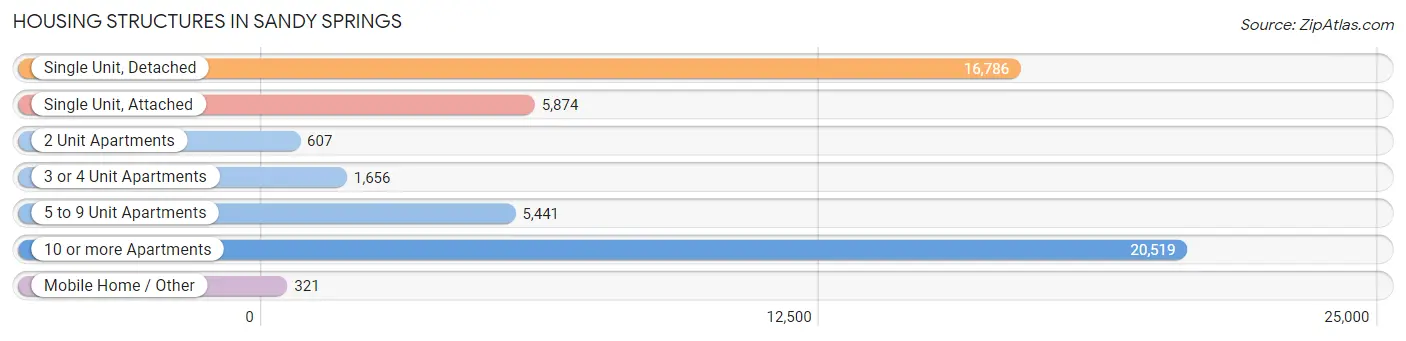
| Structure Type | # Housing Units | % Housing Units |
| Single Unit, Detached | 16,786 | 32.8% |
| Single Unit, Attached | 5,874 | 11.5% |
| 2 Unit Apartments | 607 | 1.2% |
| 3 or 4 Unit Apartments | 1,656 | 3.2% |
| 5 to 9 Unit Apartments | 5,441 | 10.6% |
| 10 or more Apartments | 20,519 | 40.1% |
| Mobile Home / Other | 321 | 0.6% |
| Total | 51,204 | 100.0% |
Housing Structures by Occupancy in Sandy Springs
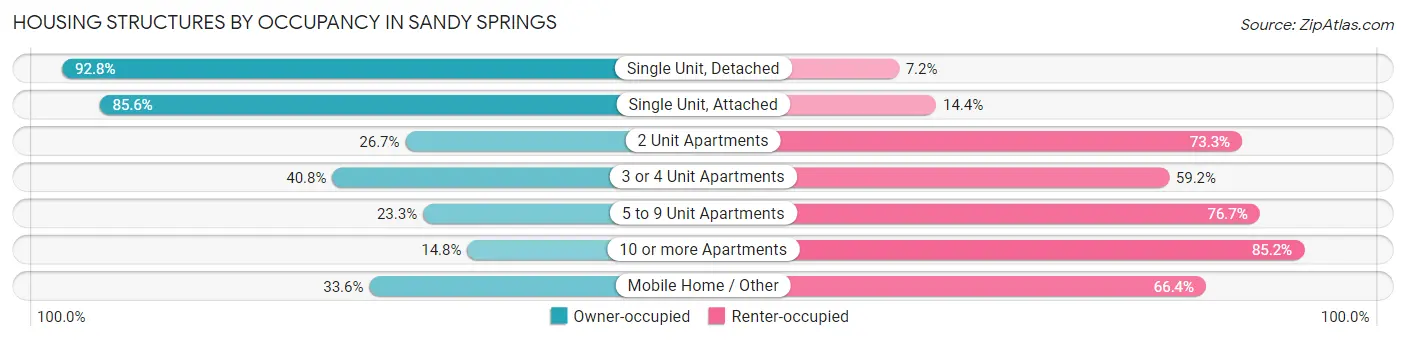
| Structure Type | Owner-occupied | Renter-occupied |
| Single Unit, Detached | 15,573 (92.8%) | 1,213 (7.2%) |
| Single Unit, Attached | 5,027 (85.6%) | 847 (14.4%) |
| 2 Unit Apartments | 162 (26.7%) | 445 (73.3%) |
| 3 or 4 Unit Apartments | 675 (40.8%) | 981 (59.2%) |
| 5 to 9 Unit Apartments | 1,268 (23.3%) | 4,173 (76.7%) |
| 10 or more Apartments | 3,029 (14.8%) | 17,490 (85.2%) |
| Mobile Home / Other | 108 (33.6%) | 213 (66.4%) |
| Total | 25,842 (50.5%) | 25,362 (49.5%) |
Housing Structures by Number of Rooms in Sandy Springs
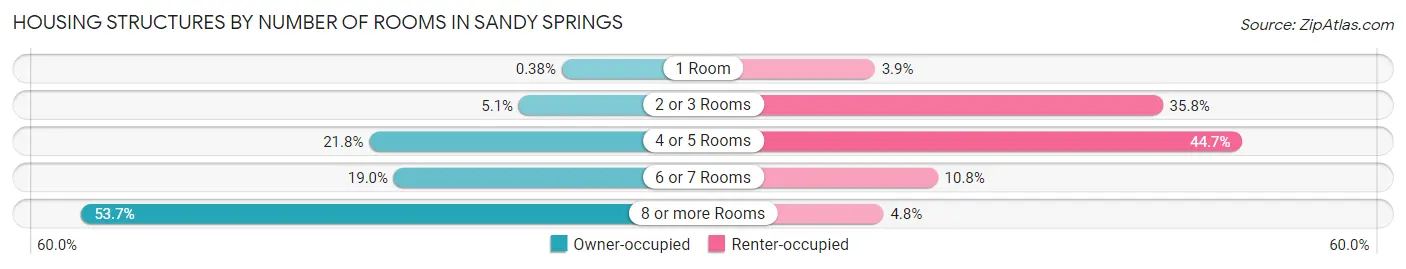
| Number of Rooms | Owner-occupied | Renter-occupied |
| 1 Room | 99 (0.4%) | 979 (3.9%) |
| 2 or 3 Rooms | 1,327 (5.1%) | 9,085 (35.8%) |
| 4 or 5 Rooms | 5,620 (21.7%) | 11,326 (44.7%) |
| 6 or 7 Rooms | 4,916 (19.0%) | 2,748 (10.8%) |
| 8 or more Rooms | 13,880 (53.7%) | 1,224 (4.8%) |
| Total | 25,842 (100.0%) | 25,362 (100.0%) |
Housing Structure by Heating Type in Sandy Springs
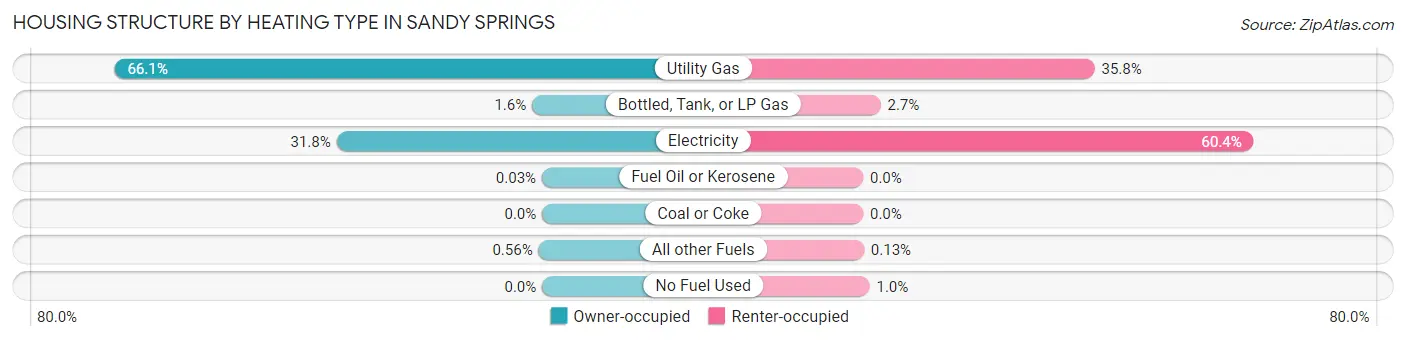
| Heating Type | Owner-occupied | Renter-occupied |
| Utility Gas | 17,081 (66.1%) | 9,078 (35.8%) |
| Bottled, Tank, or LP Gas | 401 (1.5%) | 685 (2.7%) |
| Electricity | 8,209 (31.8%) | 15,312 (60.4%) |
| Fuel Oil or Kerosene | 7 (0.0%) | 0 (0.0%) |
| Coal or Coke | 0 (0.0%) | 0 (0.0%) |
| All other Fuels | 144 (0.6%) | 34 (0.1%) |
| No Fuel Used | 0 (0.0%) | 253 (1.0%) |
| Total | 25,842 (100.0%) | 25,362 (100.0%) |
Household Vehicle Usage in Sandy Springs
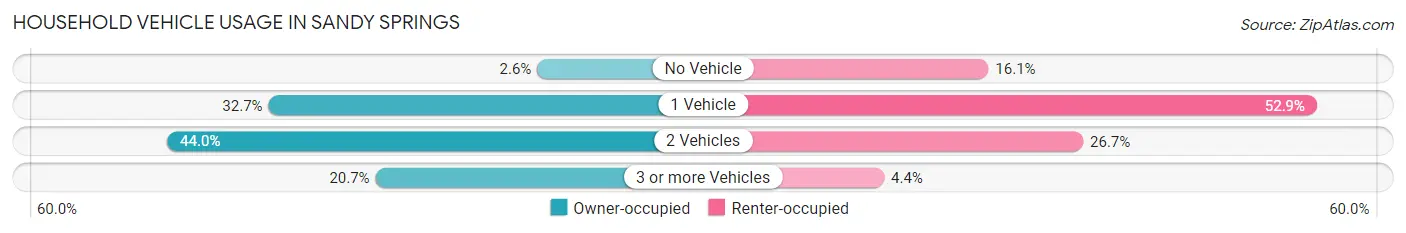
| Vehicles per Household | Owner-occupied | Renter-occupied |
| No Vehicle | 668 (2.6%) | 4,076 (16.1%) |
| 1 Vehicle | 8,447 (32.7%) | 13,407 (52.9%) |
| 2 Vehicles | 11,378 (44.0%) | 6,766 (26.7%) |
| 3 or more Vehicles | 5,349 (20.7%) | 1,113 (4.4%) |
| Total | 25,842 (100.0%) | 25,362 (100.0%) |
Real Estate & Mortgages in Sandy Springs
Real Estate and Mortgage Overview in Sandy Springs
| Characteristic | Without Mortgage | With Mortgage |
| Housing Units | 8,411 | 17,431 |
| Median Property Value | $535,900 | $566,100 |
| Median Household Income | $105,538 | $9,524 |
| Monthly Housing Costs | $1,000 | $7,765 |
| Real Estate Taxes | $5,164 | $151 |
Property Value by Mortgage Status in Sandy Springs
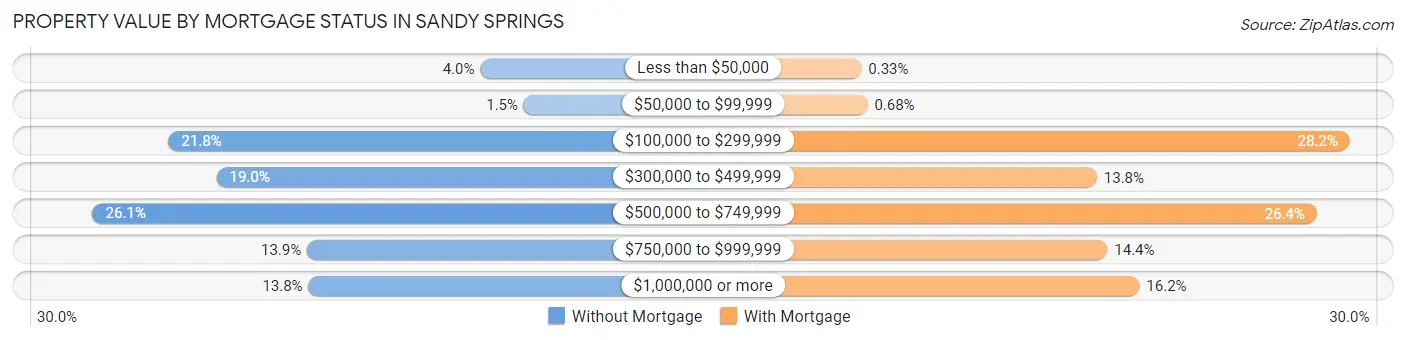
| Property Value | Without Mortgage | With Mortgage |
| Less than $50,000 | 333 (4.0%) | 57 (0.3%) |
| $50,000 to $99,999 | 124 (1.5%) | 118 (0.7%) |
| $100,000 to $299,999 | 1,832 (21.8%) | 4,922 (28.2%) |
| $300,000 to $499,999 | 1,601 (19.0%) | 2,404 (13.8%) |
| $500,000 to $749,999 | 2,196 (26.1%) | 4,594 (26.4%) |
| $750,000 to $999,999 | 1,166 (13.9%) | 2,509 (14.4%) |
| $1,000,000 or more | 1,159 (13.8%) | 2,827 (16.2%) |
| Total | 8,411 (100.0%) | 17,431 (100.0%) |
Household Income by Mortgage Status in Sandy Springs
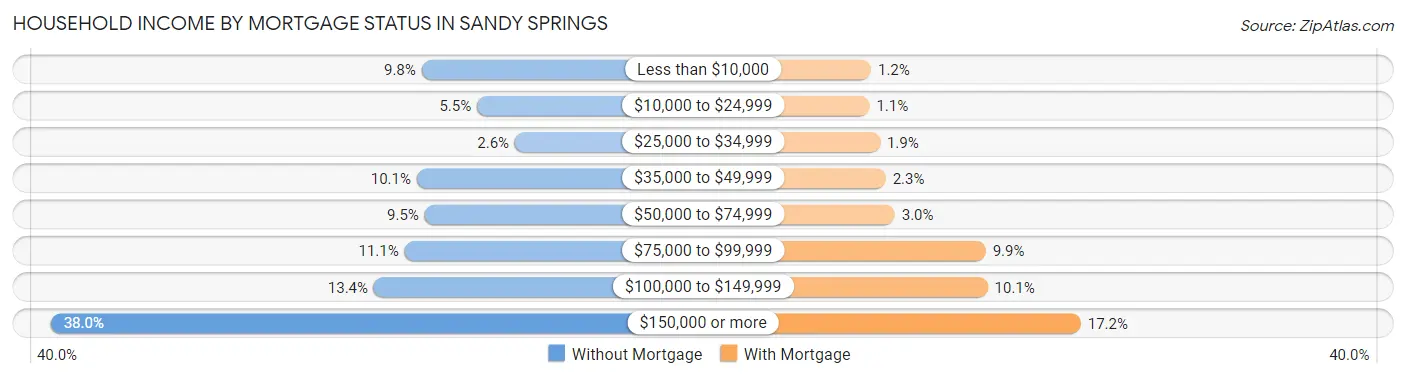
| Household Income | Without Mortgage | With Mortgage |
| Less than $10,000 | 820 (9.8%) | 205 (1.2%) |
| $10,000 to $24,999 | 465 (5.5%) | 185 (1.1%) |
| $25,000 to $34,999 | 222 (2.6%) | 325 (1.9%) |
| $35,000 to $49,999 | 851 (10.1%) | 401 (2.3%) |
| $50,000 to $74,999 | 801 (9.5%) | 521 (3.0%) |
| $75,000 to $99,999 | 929 (11.1%) | 1,730 (9.9%) |
| $100,000 to $149,999 | 1,126 (13.4%) | 1,754 (10.1%) |
| $150,000 or more | 3,197 (38.0%) | 2,991 (17.2%) |
| Total | 8,411 (100.0%) | 17,431 (100.0%) |
Property Value to Household Income Ratio in Sandy Springs
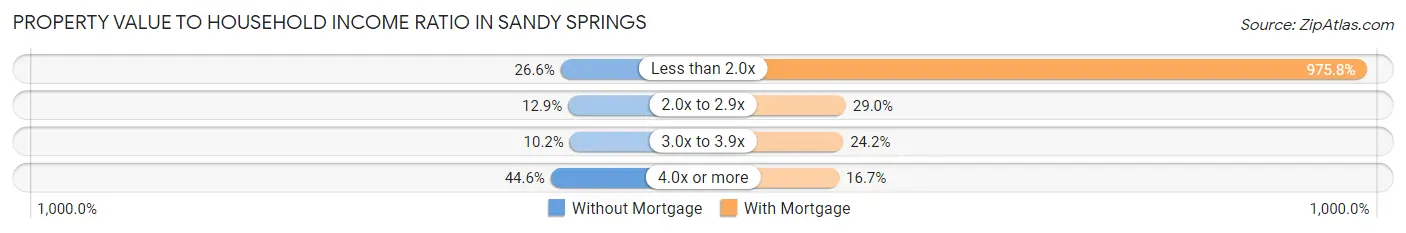
| Value-to-Income Ratio | Without Mortgage | With Mortgage |
| Less than 2.0x | 2,237 (26.6%) | 170,090 (975.8%) |
| 2.0x to 2.9x | 1,087 (12.9%) | 5,048 (29.0%) |
| 3.0x to 3.9x | 860 (10.2%) | 4,219 (24.2%) |
| 4.0x or more | 3,750 (44.6%) | 2,915 (16.7%) |
| Total | 8,411 (100.0%) | 17,431 (100.0%) |
Real Estate Taxes by Mortgage Status in Sandy Springs
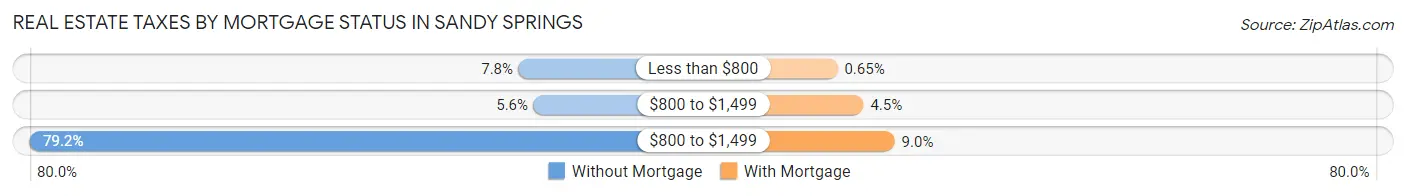
| Property Taxes | Without Mortgage | With Mortgage |
| Less than $800 | 654 (7.8%) | 113 (0.6%) |
| $800 to $1,499 | 470 (5.6%) | 775 (4.4%) |
| $800 to $1,499 | 6,662 (79.2%) | 1,568 (9.0%) |
| Total | 8,411 (100.0%) | 17,431 (100.0%) |
Health & Disability in Sandy Springs
Health Insurance Coverage by Age in Sandy Springs
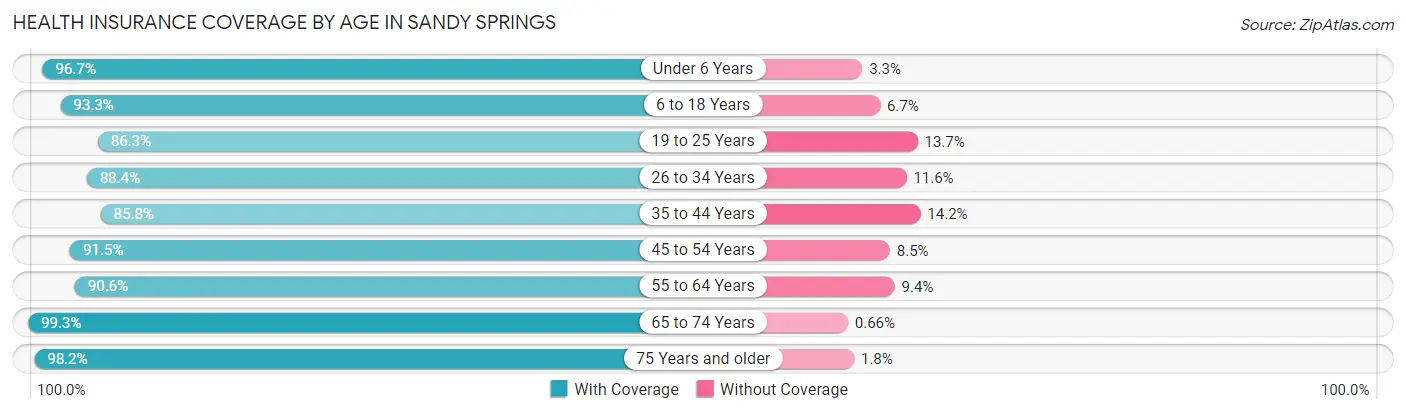
| Age Bracket | With Coverage | Without Coverage |
| Under 6 Years | 6,791 (96.7%) | 235 (3.3%) |
| 6 to 18 Years | 13,168 (93.3%) | 942 (6.7%) |
| 19 to 25 Years | 7,593 (86.3%) | 1,201 (13.7%) |
| 26 to 34 Years | 16,569 (88.4%) | 2,173 (11.6%) |
| 35 to 44 Years | 14,059 (85.8%) | 2,324 (14.2%) |
| 45 to 54 Years | 13,474 (91.5%) | 1,250 (8.5%) |
| 55 to 64 Years | 10,915 (90.6%) | 1,130 (9.4%) |
| 65 to 74 Years | 7,854 (99.3%) | 52 (0.7%) |
| 75 Years and older | 6,863 (98.2%) | 127 (1.8%) |
| Total | 97,286 (91.2%) | 9,434 (8.8%) |
Health Insurance Coverage by Citizenship Status in Sandy Springs
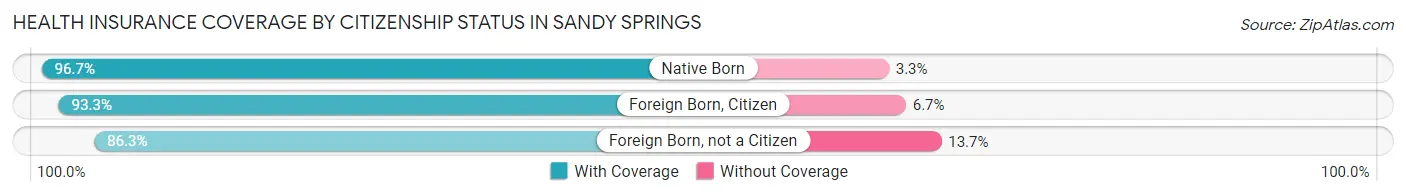
| Citizenship Status | With Coverage | Without Coverage |
| Native Born | 6,791 (96.7%) | 235 (3.3%) |
| Foreign Born, Citizen | 13,168 (93.3%) | 942 (6.7%) |
| Foreign Born, not a Citizen | 7,593 (86.3%) | 1,201 (13.7%) |
Health Insurance Coverage by Household Income in Sandy Springs
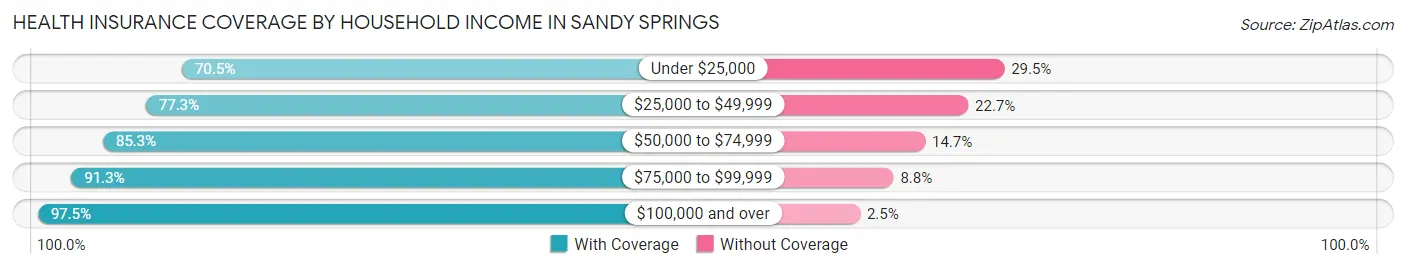
| Household Income | With Coverage | Without Coverage |
| Under $25,000 | 5,601 (70.5%) | 2,342 (29.5%) |
| $25,000 to $49,999 | 7,665 (77.3%) | 2,255 (22.7%) |
| $50,000 to $74,999 | 11,503 (85.3%) | 1,976 (14.7%) |
| $75,000 to $99,999 | 13,449 (91.2%) | 1,290 (8.7%) |
| $100,000 and over | 58,942 (97.5%) | 1,495 (2.5%) |
Public vs Private Health Insurance Coverage by Age in Sandy Springs
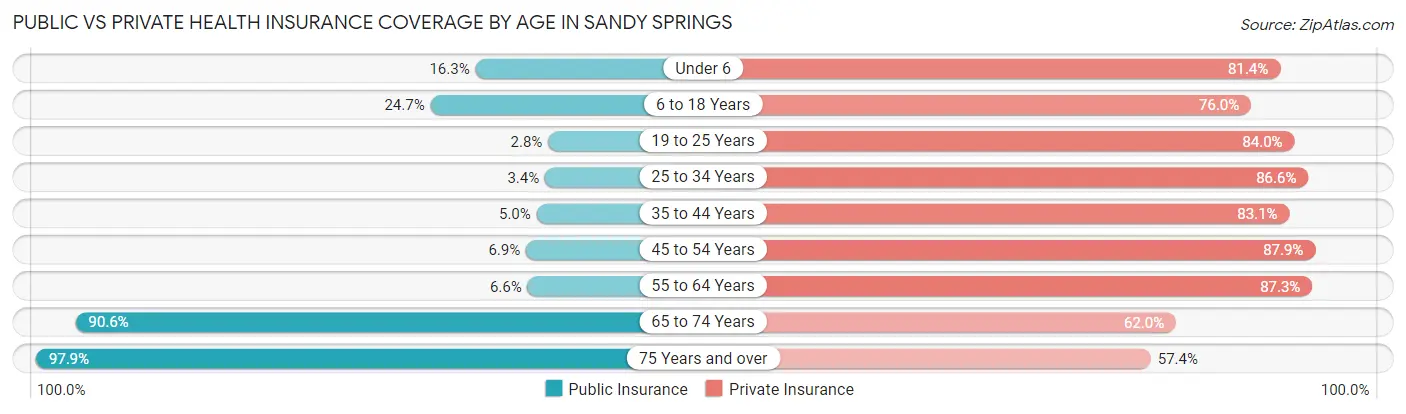
| Age Bracket | Public Insurance | Private Insurance |
| Under 6 | 1,146 (16.3%) | 5,716 (81.4%) |
| 6 to 18 Years | 3,480 (24.7%) | 10,719 (76.0%) |
| 19 to 25 Years | 247 (2.8%) | 7,388 (84.0%) |
| 25 to 34 Years | 636 (3.4%) | 16,225 (86.6%) |
| 35 to 44 Years | 813 (5.0%) | 13,611 (83.1%) |
| 45 to 54 Years | 1,020 (6.9%) | 12,937 (87.9%) |
| 55 to 64 Years | 800 (6.6%) | 10,517 (87.3%) |
| 65 to 74 Years | 7,160 (90.6%) | 4,905 (62.0%) |
| 75 Years and over | 6,843 (97.9%) | 4,009 (57.4%) |
| Total | 22,145 (20.7%) | 86,027 (80.6%) |
Disability Status by Sex by Age in Sandy Springs
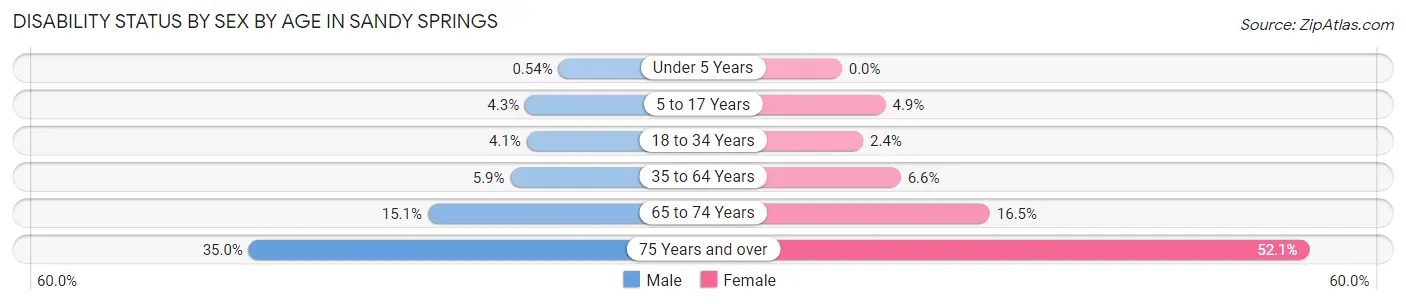
| Age Bracket | Male | Female |
| Under 5 Years | 16 (0.5%) | 0 (0.0%) |
| 5 to 17 Years | 299 (4.3%) | 361 (4.9%) |
| 18 to 34 Years | 555 (4.1%) | 356 (2.4%) |
| 35 to 64 Years | 1,282 (5.9%) | 1,404 (6.6%) |
| 65 to 74 Years | 496 (15.1%) | 762 (16.5%) |
| 75 Years and over | 878 (35.0%) | 2,335 (52.1%) |
Disability Class by Sex by Age in Sandy Springs
Disability Class: Hearing Difficulty
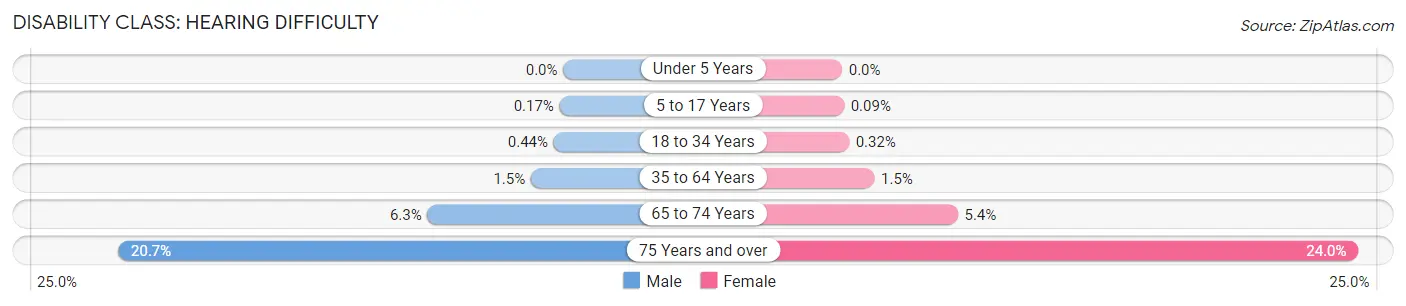
| Age Bracket | Male | Female |
| Under 5 Years | 0 (0.0%) | 0 (0.0%) |
| 5 to 17 Years | 12 (0.2%) | 7 (0.1%) |
| 18 to 34 Years | 59 (0.4%) | 48 (0.3%) |
| 35 to 64 Years | 325 (1.5%) | 321 (1.5%) |
| 65 to 74 Years | 207 (6.3%) | 248 (5.4%) |
| 75 Years and over | 518 (20.7%) | 1,075 (24.0%) |
Disability Class: Vision Difficulty
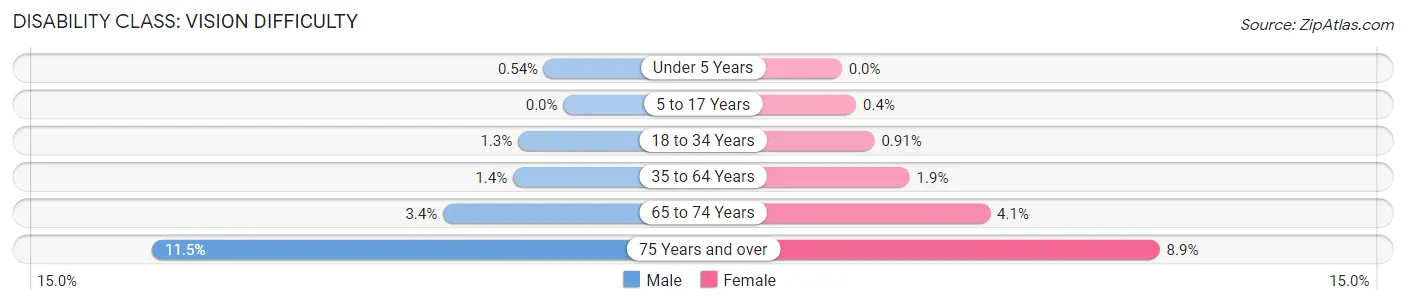
| Age Bracket | Male | Female |
| Under 5 Years | 16 (0.5%) | 0 (0.0%) |
| 5 to 17 Years | 0 (0.0%) | 30 (0.4%) |
| 18 to 34 Years | 171 (1.3%) | 136 (0.9%) |
| 35 to 64 Years | 304 (1.4%) | 404 (1.9%) |
| 65 to 74 Years | 110 (3.4%) | 191 (4.1%) |
| 75 Years and over | 287 (11.5%) | 397 (8.8%) |
Disability Class: Cognitive Difficulty
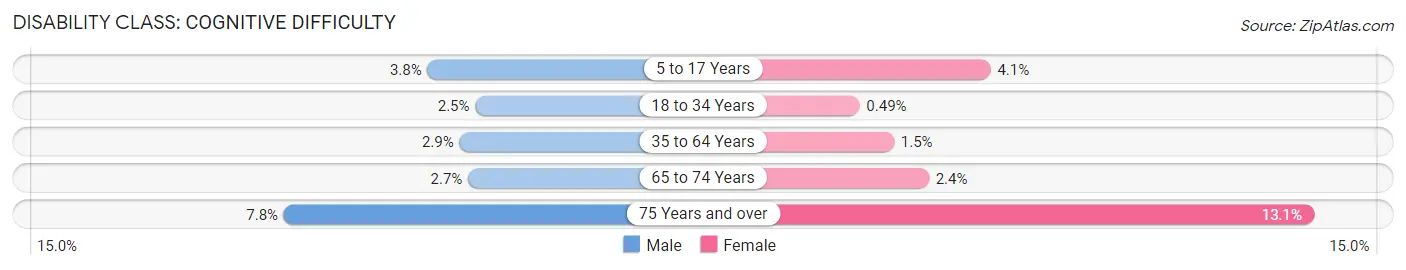
| Age Bracket | Male | Female |
| 5 to 17 Years | 265 (3.8%) | 307 (4.1%) |
| 18 to 34 Years | 332 (2.5%) | 74 (0.5%) |
| 35 to 64 Years | 628 (2.9%) | 311 (1.5%) |
| 65 to 74 Years | 87 (2.6%) | 112 (2.4%) |
| 75 Years and over | 195 (7.8%) | 589 (13.1%) |
Disability Class: Ambulatory Difficulty
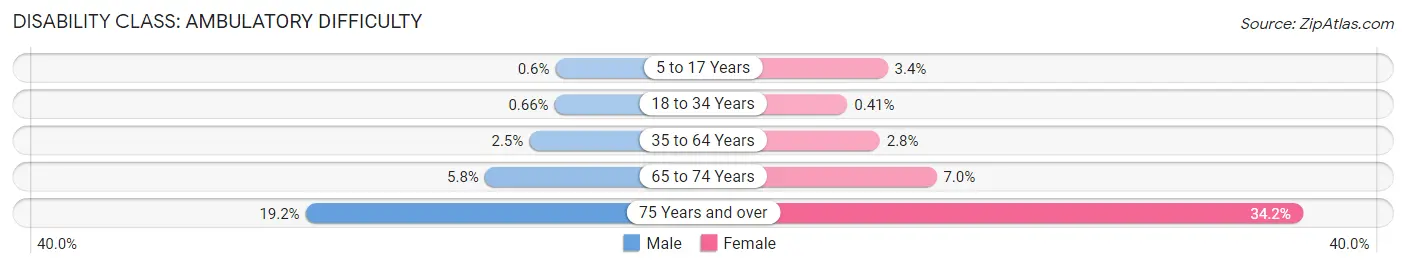
| Age Bracket | Male | Female |
| 5 to 17 Years | 42 (0.6%) | 252 (3.4%) |
| 18 to 34 Years | 90 (0.7%) | 61 (0.4%) |
| 35 to 64 Years | 551 (2.5%) | 605 (2.8%) |
| 65 to 74 Years | 192 (5.8%) | 325 (7.0%) |
| 75 Years and over | 480 (19.2%) | 1,534 (34.2%) |
Disability Class: Self-Care Difficulty
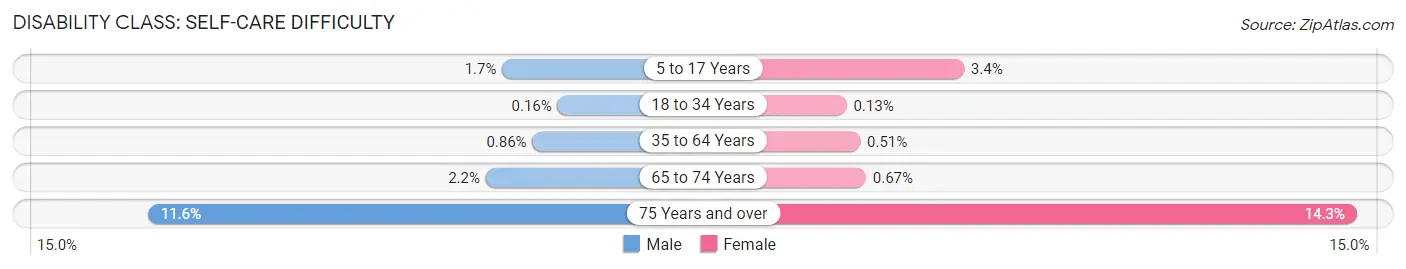
| Age Bracket | Male | Female |
| 5 to 17 Years | 119 (1.7%) | 252 (3.4%) |
| 18 to 34 Years | 22 (0.2%) | 20 (0.1%) |
| 35 to 64 Years | 187 (0.9%) | 109 (0.5%) |
| 65 to 74 Years | 71 (2.2%) | 31 (0.7%) |
| 75 Years and over | 290 (11.6%) | 643 (14.3%) |
Technology Access in Sandy Springs
Computing Device Access in Sandy Springs
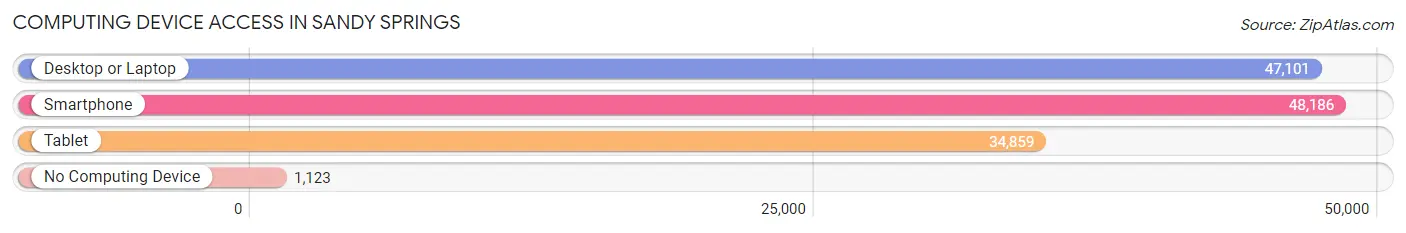
| Device Type | # Households | % Households |
| Desktop or Laptop | 47,101 | 92.0% |
| Smartphone | 48,186 | 94.1% |
| Tablet | 34,859 | 68.1% |
| No Computing Device | 1,123 | 2.2% |
| Total | 51,204 | 100.0% |
Internet Access in Sandy Springs
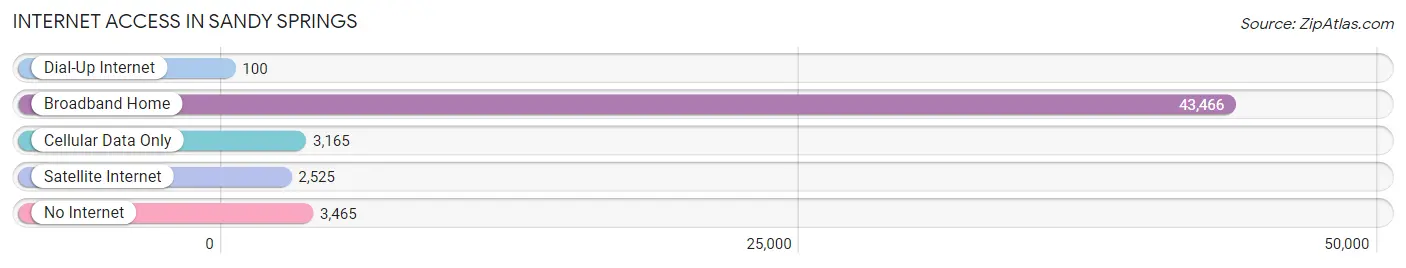
| Internet Type | # Households | % Households |
| Dial-Up Internet | 100 | 0.2% |
| Broadband Home | 43,466 | 84.9% |
| Cellular Data Only | 3,165 | 6.2% |
| Satellite Internet | 2,525 | 4.9% |
| No Internet | 3,465 | 6.8% |
| Total | 51,204 | 100.0% |
Sandy Springs Summary
Sandy Springs is a city located in the northern suburbs of Atlanta, Georgia. It is the sixth-largest city in the state and the second-largest city in the metropolitan Atlanta area. Sandy Springs is a vibrant and diverse community that is home to over 100,000 people.
History
Sandy Springs was first settled in the early 1800s by settlers from the Cherokee Nation. The area was originally known as "Rough and Ready," and was home to a small farming community. In the late 1800s, the area was renamed "Sandy Springs" after the nearby springs that provided the community with fresh water.
In the 1950s, the city began to experience rapid growth as the Atlanta metropolitan area expanded. The city was officially incorporated in 2005, and has since become one of the fastest-growing cities in the state.
Geography
Sandy Springs is located in Fulton County, Georgia, and is situated just north of Atlanta. The city is bordered by Roswell to the north, Dunwoody to the east, and Alpharetta to the south. The city covers an area of approximately 27 square miles and is located at an elevation of 1,000 feet above sea level.
The city is home to several parks and recreational areas, including the Chattahoochee River National Recreation Area, which offers a variety of outdoor activities such as fishing, boating, and hiking.
Economy
Sandy Springs is home to a diverse economy that is driven by a variety of industries. The city is home to several corporate headquarters, including UPS, Cox Communications, and Siemens. The city is also home to a number of healthcare providers, including Northside Hospital and Emory Healthcare.
The city is also home to a number of retail and dining establishments, as well as a variety of entertainment venues. The city is home to the Perimeter Mall, which is one of the largest shopping malls in the state.
Demographics
As of the 2010 census, the population of Sandy Springs was 93,853. The racial makeup of the city was 73.3% White, 15.2% African American, 0.3% Native American, 5.7% Asian, and 5.5% from other races. The median household income was $77,837, and the median age was 37.
Sandy Springs is a diverse and vibrant community that is home to a variety of cultures and backgrounds. The city is home to a number of religious institutions, including churches, synagogues, and mosques. The city is also home to a number of cultural institutions, including the Sandy Springs Historical Society and the Sandy Springs Arts Center.
Common Questions
What is Per Capita Income in Sandy Springs?
Per Capita income in Sandy Springs is $75,615.
What is the Median Family Income in Sandy Springs?
Median Family Income in Sandy Springs is $138,532.
What is the Median Household income in Sandy Springs?
Median Household Income in Sandy Springs is $93,303.
What is Income or Wage Gap in Sandy Springs?
Income or Wage Gap in Sandy Springs is 26.4%.
Women in Sandy Springs earn 73.6 cents for every dollar earned by a man.
What is Family Income Deficit in Sandy Springs?
Family Income Deficit in Sandy Springs is $11,415.
Families that are below poverty line in Sandy Springs earn $11,415 less on average than the poverty threshold level.
What is Inequality or Gini Index in Sandy Springs?
Inequality or Gini Index in Sandy Springs is 0.53.
What is the Total Population of Sandy Springs?
Total Population of Sandy Springs is 107,221.
What is the Total Male Population of Sandy Springs?
Total Male Population of Sandy Springs is 51,275.
What is the Total Female Population of Sandy Springs?
Total Female Population of Sandy Springs is 55,946.
What is the Ratio of Males per 100 Females in Sandy Springs?
There are 91.65 Males per 100 Females in Sandy Springs.
What is the Ratio of Females per 100 Males in Sandy Springs?
There are 109.11 Females per 100 Males in Sandy Springs.
What is the Median Population Age in Sandy Springs?
Median Population Age in Sandy Springs is 37.4 Years.
What is the Average Family Size in Sandy Springs
Average Family Size in Sandy Springs is 2.9 People.
What is the Average Household Size in Sandy Springs
Average Household Size in Sandy Springs is 2.1 People.
How Large is the Labor Force in Sandy Springs?
There are 65,251 People in the Labor Forcein in Sandy Springs.
What is the Percentage of People in the Labor Force in Sandy Springs?
72.9% of People are in the Labor Force in Sandy Springs.
What is the Unemployment Rate in Sandy Springs?
Unemployment Rate in Sandy Springs is 3.7%.