Marana, AZ Map & Demographics
Marana Map
Marana Overview
$48,157
PER CAPITA INCOME
$113,262
AVG FAMILY INCOME
$105,624
AVG HOUSEHOLD INCOME
33.2%
WAGE / INCOME GAP [ % ]
66.8¢/ $1
WAGE / INCOME GAP [ $ ]
0.39
INEQUALITY / GINI INDEX
52,542
TOTAL POPULATION
25,916
MALE POPULATION
26,626
FEMALE POPULATION
97.33
MALES / 100 FEMALES
102.74
FEMALES / 100 MALES
41.4
MEDIAN AGE
3.0
AVG FAMILY SIZE
2.6
AVG HOUSEHOLD SIZE
25,958
LABOR FORCE [ PEOPLE ]
62.1%
PERCENT IN LABOR FORCE
4.1%
UNEMPLOYMENT RATE
Marana Area Codes
Income in Marana
Income Overview in Marana
Per Capita Income in Marana is $48,157, while median incomes of families and households are $113,262 and $105,624 respectively.
| Characteristic | Number | Measure |
| Per Capita Income | 52,542 | $48,157 |
| Median Family Income | 15,233 | $113,262 |
| Mean Family Income | 15,233 | $133,890 |
| Median Household Income | 19,949 | $105,624 |
| Mean Household Income | 19,949 | $126,005 |
| Income Deficit | 15,233 | $0 |
| Wage / Income Gap (%) | 52,542 | 33.16% |
| Wage / Income Gap ($) | 52,542 | 66.84¢ per $1 |
| Gini / Inequality Index | 52,542 | 0.39 |
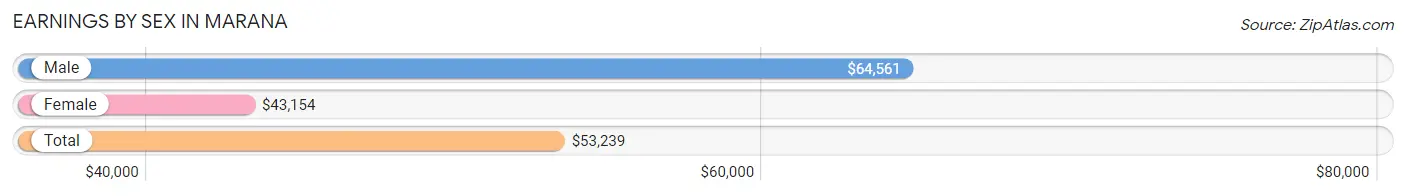
Earnings by Sex in Marana
Average Earnings in Marana are $53,239, $64,561 for men and $43,154 for women, a difference of 33.2%.
| Sex | Number | Average Earnings |
| Male | 14,577 (53.7%) | $64,561 |
| Female | 12,542 (46.3%) | $43,154 |
| Total | 27,119 (100.0%) | $53,239 |
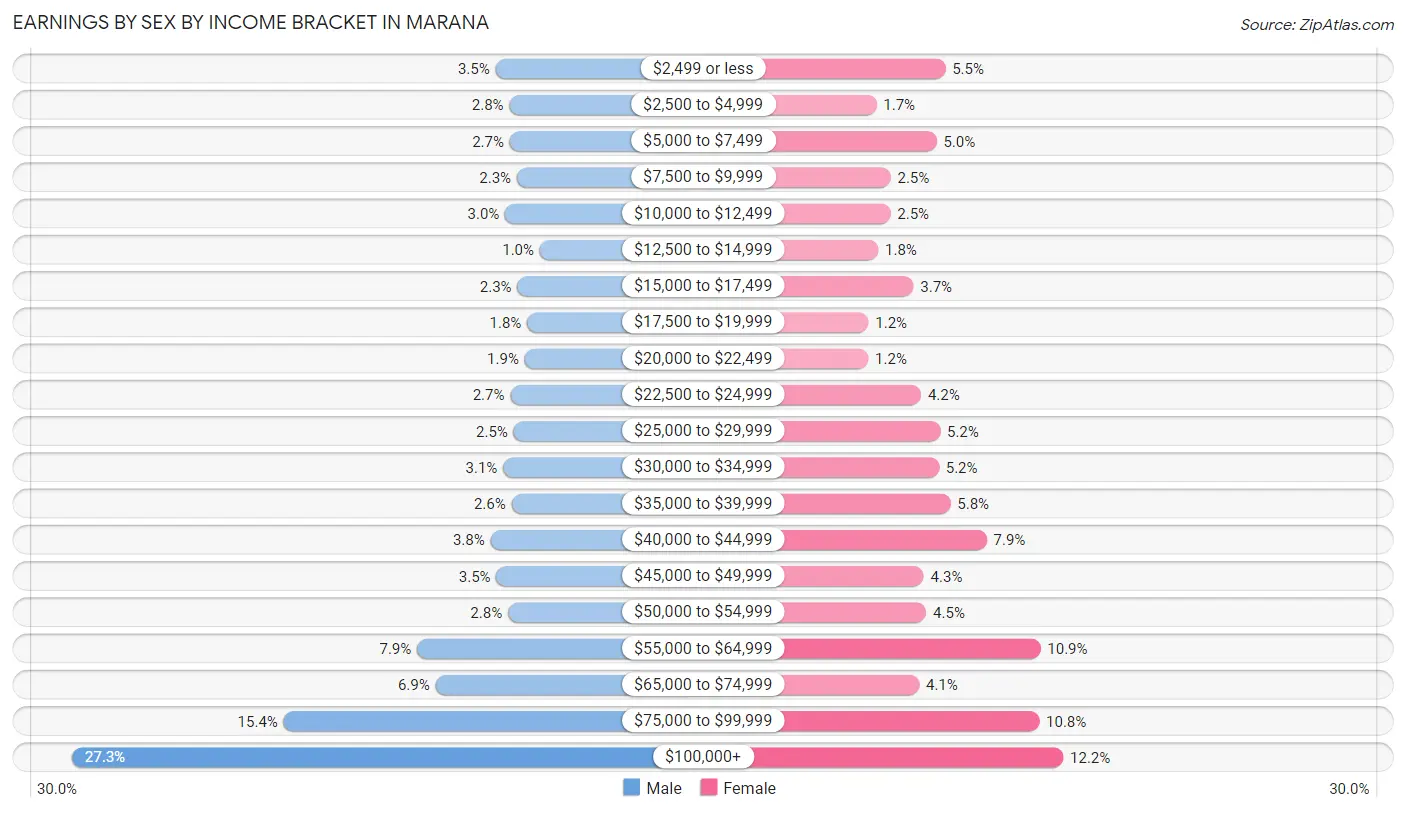
Earnings by Sex by Income Bracket in Marana
The most common earnings brackets in Marana are $100,000+ for men (3,985 | 27.3%) and $100,000+ for women (1,525 | 12.2%).
| Income | Male | Female |
| $2,499 or less | 515 (3.5%) | 693 (5.5%) |
| $2,500 to $4,999 | 401 (2.8%) | 208 (1.7%) |
| $5,000 to $7,499 | 398 (2.7%) | 632 (5.0%) |
| $7,500 to $9,999 | 340 (2.3%) | 308 (2.5%) |
| $10,000 to $12,499 | 436 (3.0%) | 307 (2.5%) |
| $12,500 to $14,999 | 152 (1.0%) | 221 (1.8%) |
| $15,000 to $17,499 | 335 (2.3%) | 469 (3.7%) |
| $17,500 to $19,999 | 255 (1.8%) | 152 (1.2%) |
| $20,000 to $22,499 | 275 (1.9%) | 151 (1.2%) |
| $22,500 to $24,999 | 393 (2.7%) | 523 (4.2%) |
| $25,000 to $29,999 | 366 (2.5%) | 657 (5.2%) |
| $30,000 to $34,999 | 452 (3.1%) | 649 (5.2%) |
| $35,000 to $39,999 | 384 (2.6%) | 730 (5.8%) |
| $40,000 to $44,999 | 555 (3.8%) | 986 (7.9%) |
| $45,000 to $49,999 | 508 (3.5%) | 542 (4.3%) |
| $50,000 to $54,999 | 413 (2.8%) | 560 (4.5%) |
| $55,000 to $64,999 | 1,157 (7.9%) | 1,364 (10.9%) |
| $65,000 to $74,999 | 1,006 (6.9%) | 509 (4.1%) |
| $75,000 to $99,999 | 2,251 (15.4%) | 1,356 (10.8%) |
| $100,000+ | 3,985 (27.3%) | 1,525 (12.2%) |
| Total | 14,577 (100.0%) | 12,542 (100.0%) |
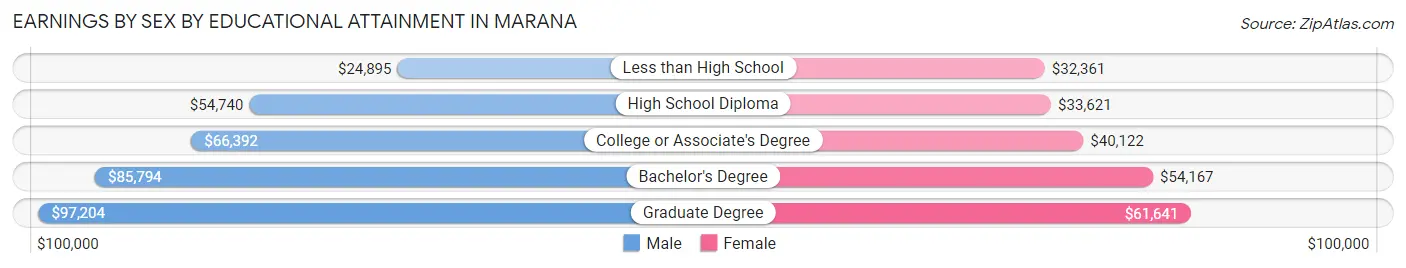
Earnings by Sex by Educational Attainment in Marana
Average earnings in Marana are $73,654 for men and $47,620 for women, a difference of 35.3%. Men with an educational attainment of graduate degree enjoy the highest average annual earnings of $97,204, while those with less than high school education earn the least with $24,895. Women with an educational attainment of graduate degree earn the most with the average annual earnings of $61,641, while those with less than high school education have the smallest earnings of $32,361.
| Educational Attainment | Male Income | Female Income |
| Less than High School | $24,895 | $32,361 |
| High School Diploma | $54,740 | $33,621 |
| College or Associate's Degree | $66,392 | $40,122 |
| Bachelor's Degree | $85,794 | $54,167 |
| Graduate Degree | $97,204 | $61,641 |
| Total | $73,654 | $47,620 |
Family Income in Marana
Family Income Brackets in Marana
According to the Marana family income data, there are 4,387 families falling into the $100,000 to $149,999 income range, which is the most common income bracket and makes up 28.8% of all families. Conversely, the less than $10,000 income bracket is the least frequent group with only 213 families (1.4%) belonging to this category.
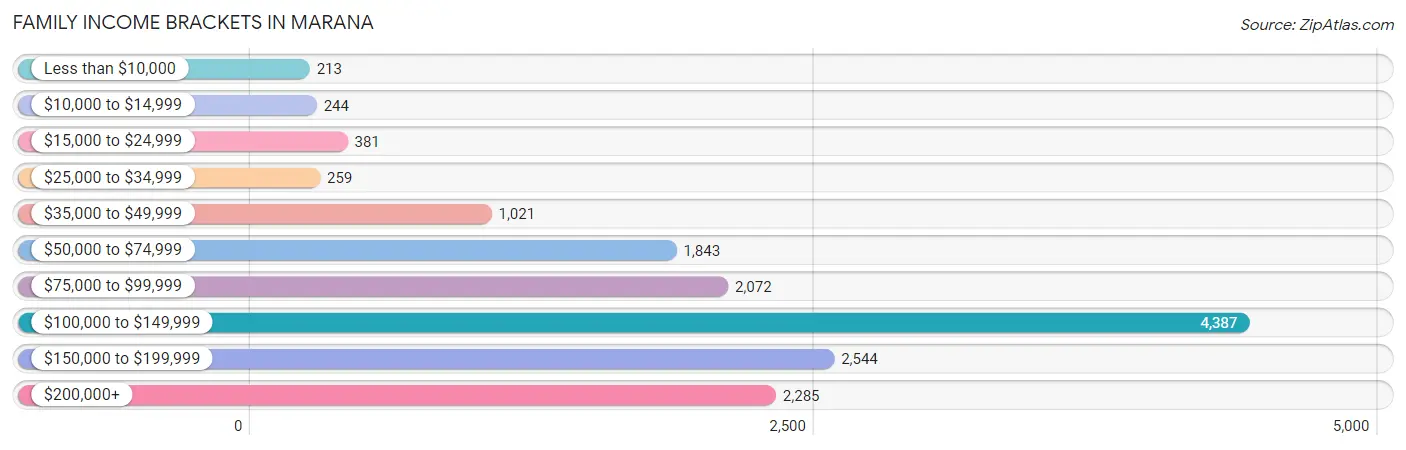
| Income Bracket | # Families | % Families |
| Less than $10,000 | 213 | 1.4% |
| $10,000 to $14,999 | 244 | 1.6% |
| $15,000 to $24,999 | 381 | 2.5% |
| $25,000 to $34,999 | 259 | 1.7% |
| $35,000 to $49,999 | 1,021 | 6.7% |
| $50,000 to $74,999 | 1,843 | 12.1% |
| $75,000 to $99,999 | 2,072 | 13.6% |
| $100,000 to $149,999 | 4,387 | 28.8% |
| $150,000 to $199,999 | 2,544 | 16.7% |
| $200,000+ | 2,285 | 15.0% |
Family Income by Famaliy Size in Marana
5-person families (1,002 | 6.6%) account for the highest median family income in Marana with $132,206 per family, while 2-person families (8,186 | 53.7%) have the highest median income of $50,267 per family member.
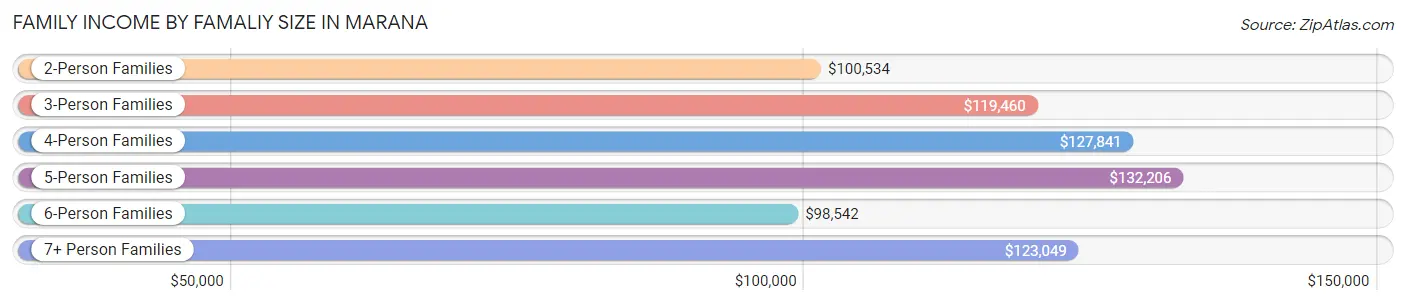
| Income Bracket | # Families | Median Income |
| 2-Person Families | 8,186 (53.7%) | $100,534 |
| 3-Person Families | 2,626 (17.2%) | $119,460 |
| 4-Person Families | 2,899 (19.0%) | $127,841 |
| 5-Person Families | 1,002 (6.6%) | $132,206 |
| 6-Person Families | 306 (2.0%) | $98,542 |
| 7+ Person Families | 214 (1.4%) | $123,049 |
| Total | 15,233 (100.0%) | $113,262 |
Family Income by Number of Earners in Marana
The median family income in Marana is $113,262, with families comprising 3+ earners (1,556) having the highest median family income of $145,352, while families with no earners (3,523) have the lowest median family income of $71,921, accounting for 10.2% and 23.1% of families, respectively.
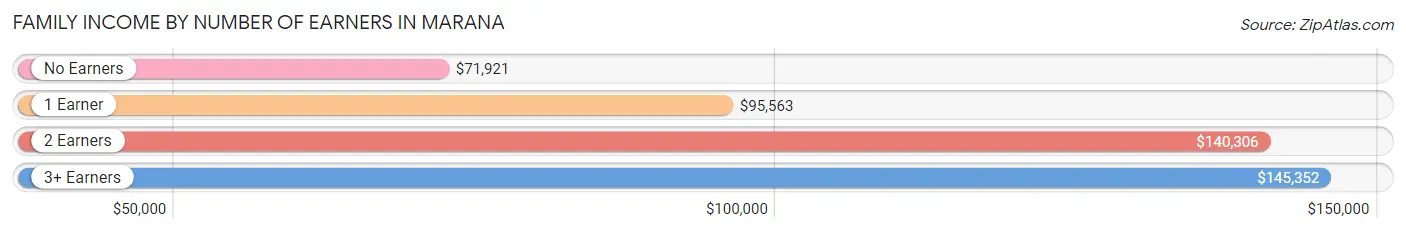
| Number of Earners | # Families | Median Income |
| No Earners | 3,523 (23.1%) | $71,921 |
| 1 Earner | 3,712 (24.4%) | $95,563 |
| 2 Earners | 6,442 (42.3%) | $140,306 |
| 3+ Earners | 1,556 (10.2%) | $145,352 |
| Total | 15,233 (100.0%) | $113,262 |
Household Income in Marana
Household Income Brackets in Marana
With 5,167 households falling in the category, the $100,000 to $149,999 income range is the most frequent in Marana, accounting for 25.9% of all households. In contrast, only 359 households (1.8%) fall into the less than $10,000 income bracket, making it the least populous group.
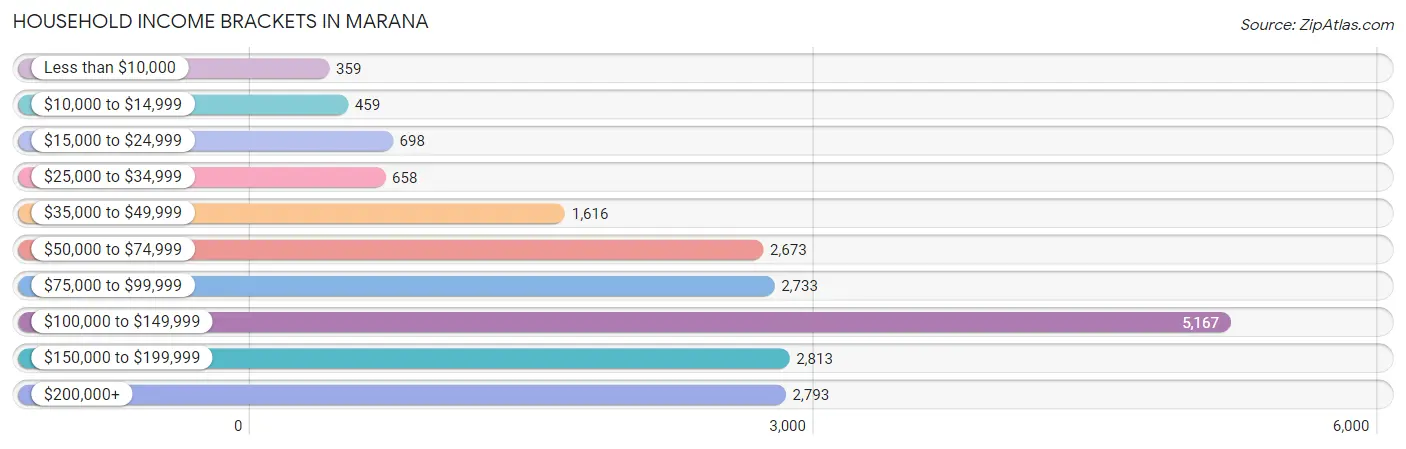
| Income Bracket | # Households | % Households |
| Less than $10,000 | 359 | 1.8% |
| $10,000 to $14,999 | 459 | 2.3% |
| $15,000 to $24,999 | 698 | 3.5% |
| $25,000 to $34,999 | 658 | 3.3% |
| $35,000 to $49,999 | 1,616 | 8.1% |
| $50,000 to $74,999 | 2,673 | 13.4% |
| $75,000 to $99,999 | 2,733 | 13.7% |
| $100,000 to $149,999 | 5,167 | 25.9% |
| $150,000 to $199,999 | 2,813 | 14.1% |
| $200,000+ | 2,793 | 14.0% |
Household Income by Householder Age in Marana
The median household income in Marana is $105,624, with the highest median household income of $126,336 found in the 45 to 64 years age bracket for the primary householder. A total of 6,451 households (32.3%) fall into this category. Meanwhile, the 15 to 24 years age bracket for the primary householder has the lowest median household income of $46,688, with 267 households (1.3%) in this group.
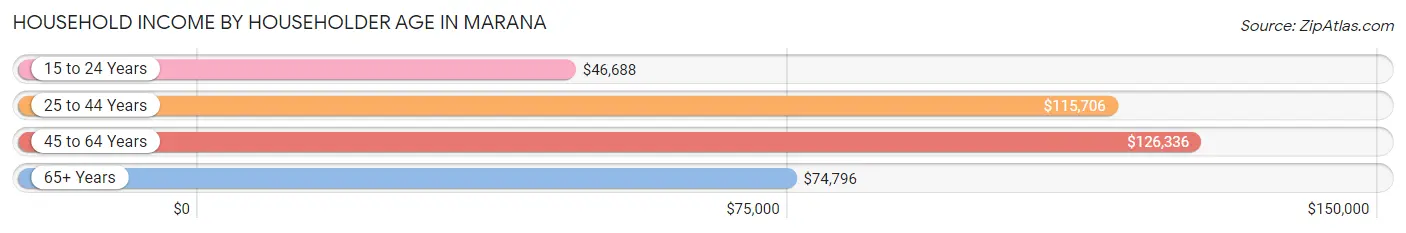
| Income Bracket | # Households | Median Income |
| 15 to 24 Years | 267 (1.3%) | $46,688 |
| 25 to 44 Years | 6,568 (32.9%) | $115,706 |
| 45 to 64 Years | 6,451 (32.3%) | $126,336 |
| 65+ Years | 6,663 (33.4%) | $74,796 |
| Total | 19,949 (100.0%) | $105,624 |
Poverty in Marana
Income Below Poverty by Sex and Age in Marana
With 3.7% poverty level for males and 6.3% for females among the residents of Marana, 18 to 24 year old males and 5 year old females are the most vulnerable to poverty, with 221 males (13.1%) and 48 females (15.5%) in their respective age groups living below the poverty level.
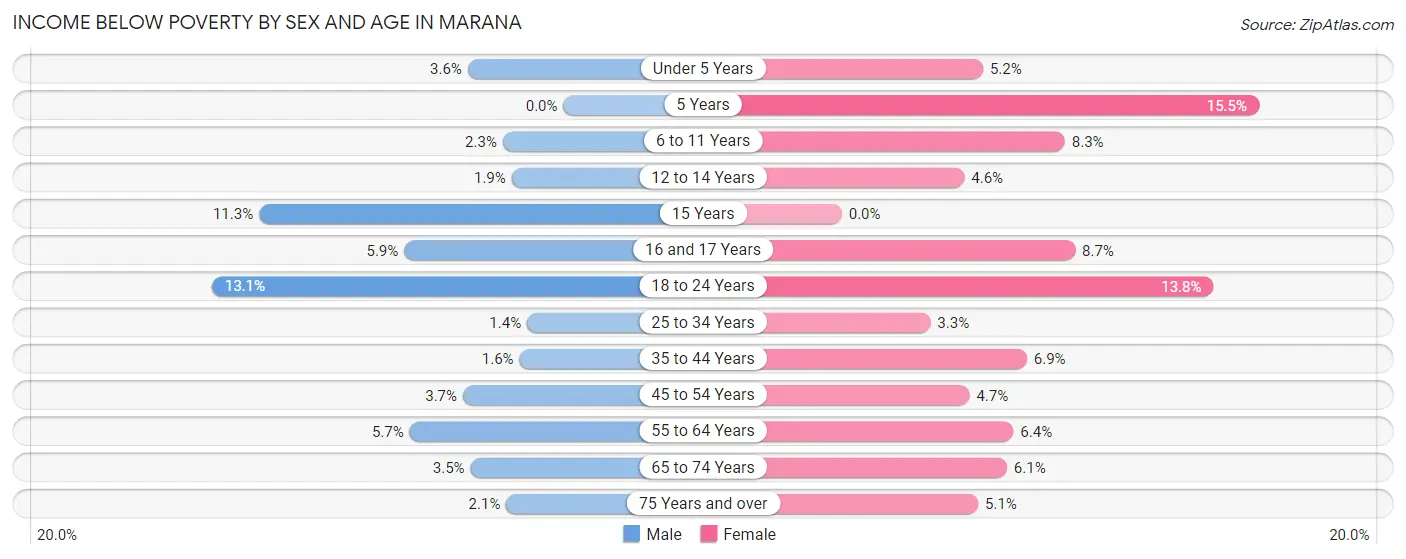
| Age Bracket | Male | Female |
| Under 5 Years | 46 (3.5%) | 98 (5.2%) |
| 5 Years | 0 (0.0%) | 48 (15.5%) |
| 6 to 11 Years | 50 (2.2%) | 196 (8.3%) |
| 12 to 14 Years | 20 (1.9%) | 36 (4.5%) |
| 15 Years | 27 (11.3%) | 0 (0.0%) |
| 16 and 17 Years | 27 (5.9%) | 61 (8.7%) |
| 18 to 24 Years | 221 (13.1%) | 215 (13.8%) |
| 25 to 34 Years | 34 (1.3%) | 108 (3.3%) |
| 35 to 44 Years | 70 (1.6%) | 227 (6.9%) |
| 45 to 54 Years | 105 (3.7%) | 152 (4.7%) |
| 55 to 64 Years | 169 (5.7%) | 190 (6.4%) |
| 65 to 74 Years | 107 (3.5%) | 228 (6.1%) |
| 75 Years and over | 49 (2.1%) | 113 (5.1%) |
| Total | 925 (3.7%) | 1,672 (6.3%) |
Income Above Poverty by Sex and Age in Marana
According to the poverty statistics in Marana, males aged 5 years and females aged 15 years are the age groups that are most secure financially, with 100.0% of males and 100.0% of females in these age groups living above the poverty line.
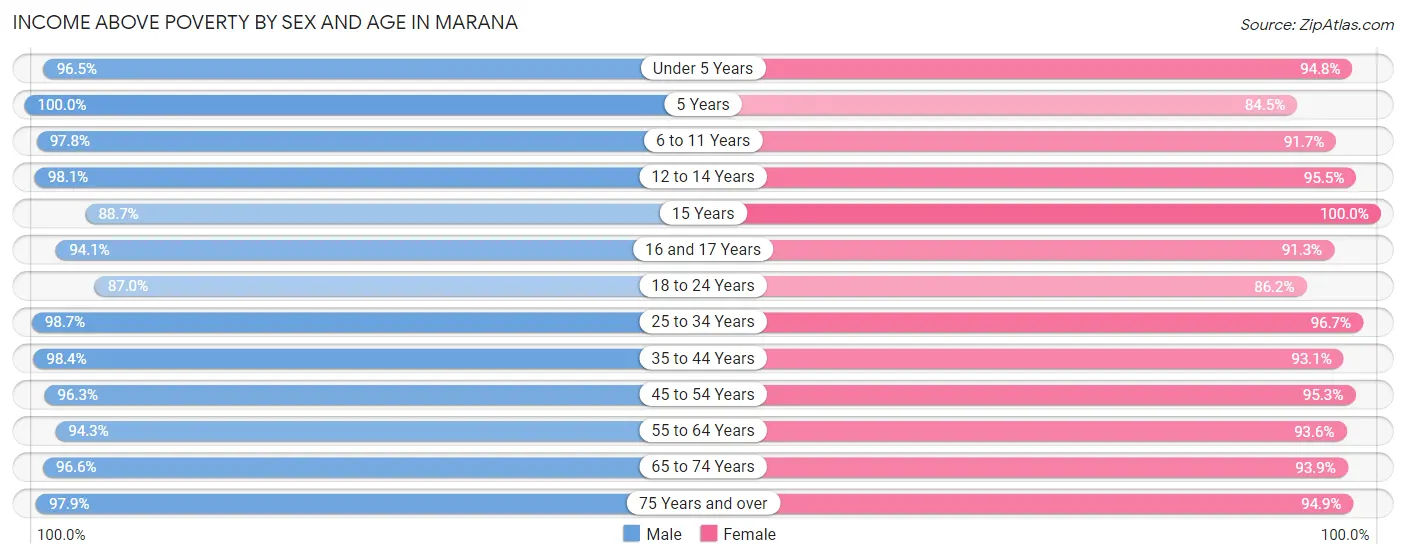
| Age Bracket | Male | Female |
| Under 5 Years | 1,250 (96.5%) | 1,774 (94.8%) |
| 5 Years | 270 (100.0%) | 262 (84.5%) |
| 6 to 11 Years | 2,169 (97.8%) | 2,172 (91.7%) |
| 12 to 14 Years | 1,022 (98.1%) | 755 (95.5%) |
| 15 Years | 212 (88.7%) | 284 (100.0%) |
| 16 and 17 Years | 430 (94.1%) | 643 (91.3%) |
| 18 to 24 Years | 1,472 (87.0%) | 1,344 (86.2%) |
| 25 to 34 Years | 2,481 (98.7%) | 3,171 (96.7%) |
| 35 to 44 Years | 4,231 (98.4%) | 3,075 (93.1%) |
| 45 to 54 Years | 2,711 (96.3%) | 3,058 (95.3%) |
| 55 to 64 Years | 2,790 (94.3%) | 2,795 (93.6%) |
| 65 to 74 Years | 2,994 (96.6%) | 3,491 (93.9%) |
| 75 Years and over | 2,260 (97.9%) | 2,118 (94.9%) |
| Total | 24,292 (96.3%) | 24,942 (93.7%) |
Income Below Poverty Among Married-Couple Families in Marana
The poverty statistics for married-couple families in Marana show that 2.3% or 299 of the total 12,751 families live below the poverty line. Families with 5 or more children have the highest poverty rate of 12.5%, comprising of 9 families. On the other hand, families with 3 or 4 children have the lowest poverty rate of 0.0%, which includes 0 families.
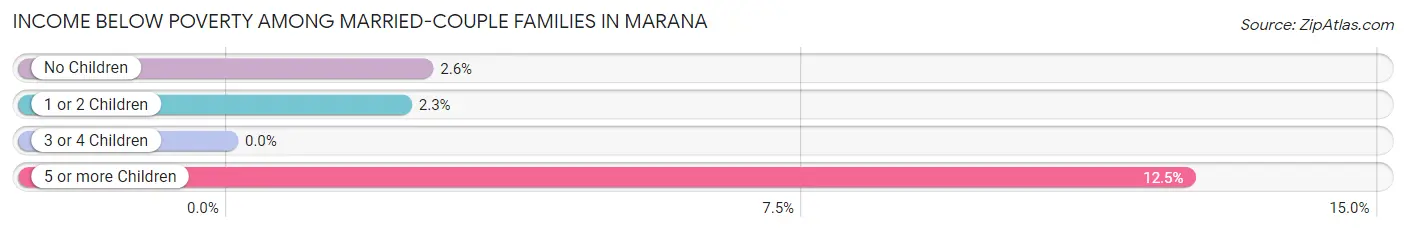
| Children | Above Poverty | Below Poverty |
| No Children | 7,457 (97.5%) | 195 (2.5%) |
| 1 or 2 Children | 4,081 (97.7%) | 95 (2.3%) |
| 3 or 4 Children | 851 (100.0%) | 0 (0.0%) |
| 5 or more Children | 63 (87.5%) | 9 (12.5%) |
| Total | 12,452 (97.7%) | 299 (2.3%) |
Income Below Poverty Among Single-Parent Households in Marana
According to the poverty data in Marana, 3.7% or 30 single-father households and 18.1% or 303 single-mother households are living below the poverty line. Among single-father households, those with no children have the highest poverty rate, with 24 households (11.8%) experiencing poverty. Likewise, among single-mother households, those with 3 or 4 children have the highest poverty rate, with 12 households (41.4%) falling below the poverty line.
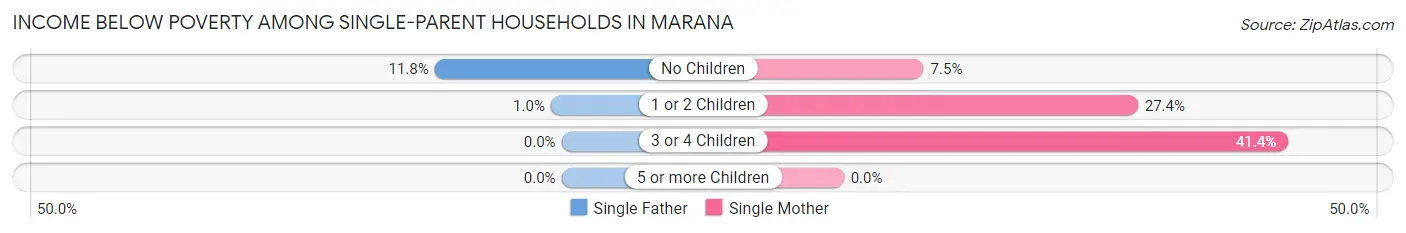
| Children | Single Father | Single Mother |
| No Children | 24 (11.8%) | 59 (7.4%) |
| 1 or 2 Children | 6 (1.0%) | 232 (27.4%) |
| 3 or 4 Children | 0 (0.0%) | 12 (41.4%) |
| 5 or more Children | 0 (0.0%) | 0 (0.0%) |
| Total | 30 (3.7%) | 303 (18.1%) |
Income Below Poverty Among Married-Couple vs Single-Parent Households in Marana
The poverty data for Marana shows that 299 of the married-couple family households (2.3%) and 333 of the single-parent households (13.4%) are living below the poverty level. Within the married-couple family households, those with 5 or more children have the highest poverty rate, with 9 households (12.5%) falling below the poverty line. Among the single-parent households, those with 3 or 4 children have the highest poverty rate, with 12 household (37.5%) living below poverty.
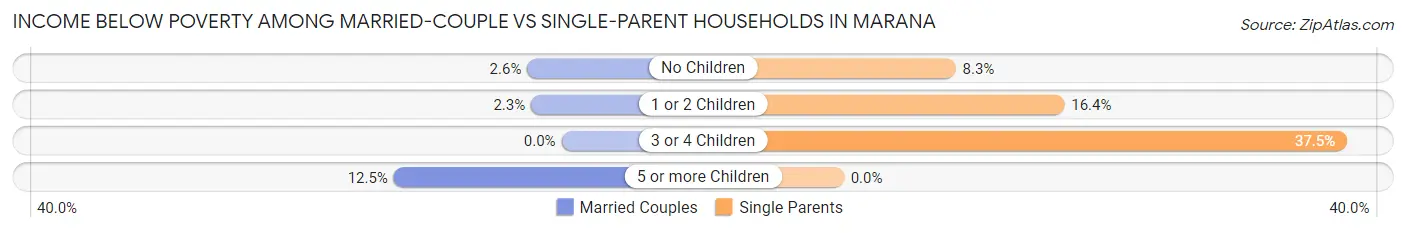
| Children | Married-Couple Families | Single-Parent Households |
| No Children | 195 (2.5%) | 83 (8.3%) |
| 1 or 2 Children | 95 (2.3%) | 238 (16.4%) |
| 3 or 4 Children | 0 (0.0%) | 12 (37.5%) |
| 5 or more Children | 9 (12.5%) | 0 (0.0%) |
| Total | 299 (2.3%) | 333 (13.4%) |
Race in Marana
The most populous races in Marana are White / Caucasian (38,345 | 73.0%), Hispanic or Latino (14,892 | 28.3%), and Two or more Races (7,038 | 13.4%).
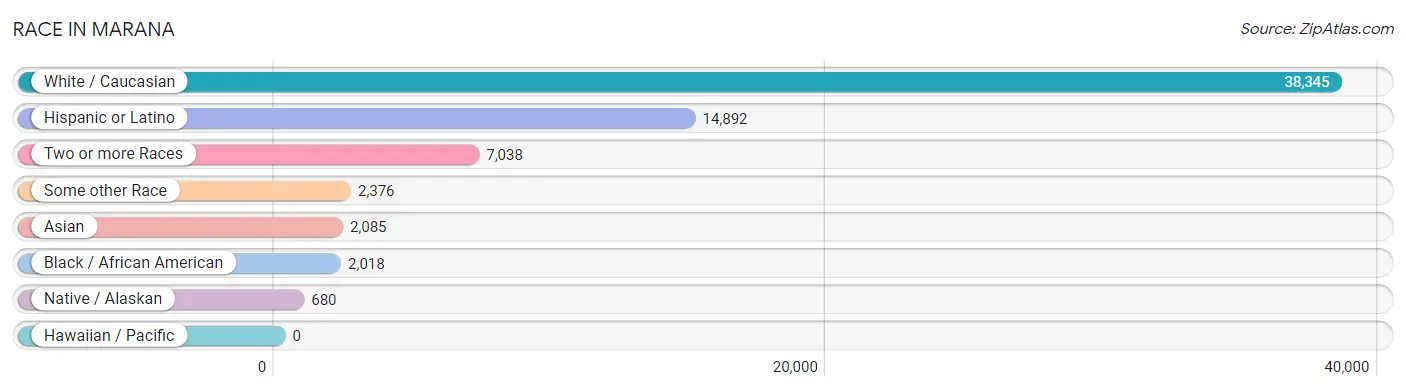
| Race | # Population | % Population |
| Asian | 2,085 | 4.0% |
| Black / African American | 2,018 | 3.8% |
| Hawaiian / Pacific | 0 | 0.0% |
| Hispanic or Latino | 14,892 | 28.3% |
| Native / Alaskan | 680 | 1.3% |
| White / Caucasian | 38,345 | 73.0% |
| Two or more Races | 7,038 | 13.4% |
| Some other Race | 2,376 | 4.5% |
| Total | 52,542 | 100.0% |
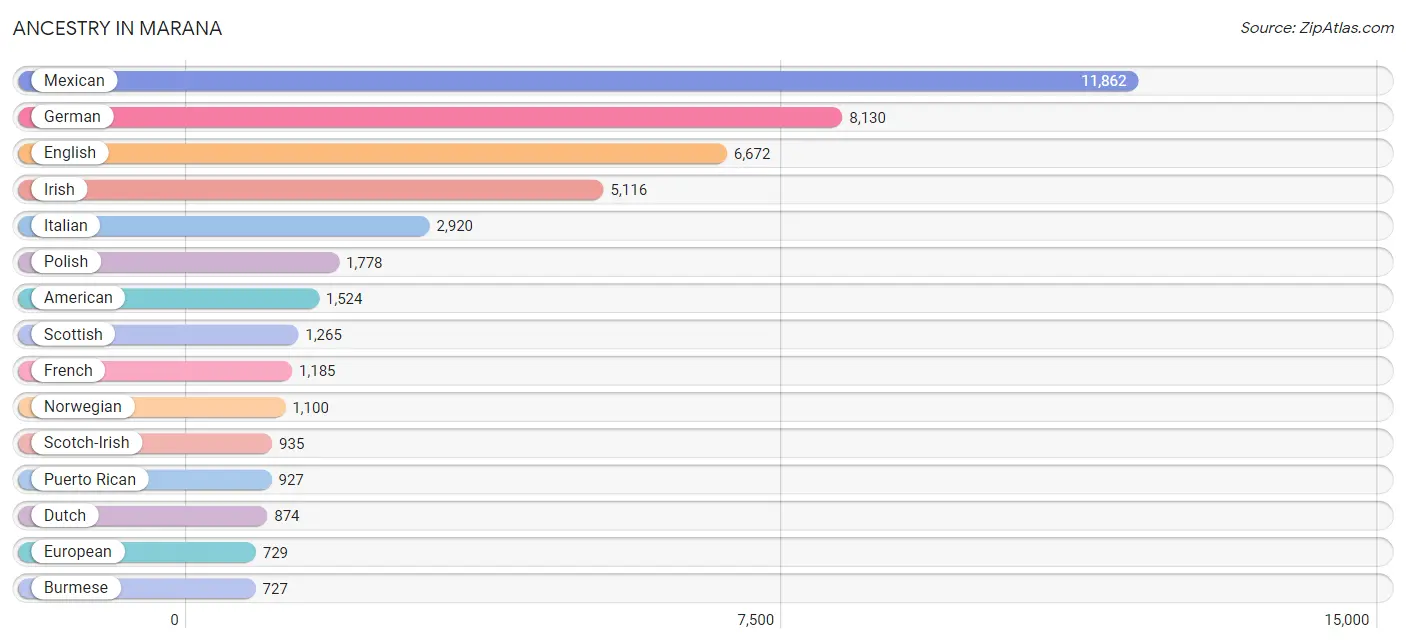
Ancestry in Marana
The most populous ancestries reported in Marana are Mexican (11,862 | 22.6%), German (8,130 | 15.5%), English (6,672 | 12.7%), Irish (5,116 | 9.7%), and Italian (2,920 | 5.6%), together accounting for 66.1% of all Marana residents.
| Ancestry | # Population | % Population |
| African | 197 | 0.4% |
| American | 1,524 | 2.9% |
| Apache | 156 | 0.3% |
| Arab | 84 | 0.2% |
| Argentinean | 72 | 0.1% |
| Australian | 34 | 0.1% |
| Austrian | 172 | 0.3% |
| Basque | 30 | 0.1% |
| Bhutanese | 177 | 0.3% |
| Blackfeet | 14 | 0.0% |
| Brazilian | 130 | 0.3% |
| British | 510 | 1.0% |
| Burmese | 727 | 1.4% |
| Canadian | 280 | 0.5% |
| Central American | 234 | 0.4% |
| Central American Indian | 70 | 0.1% |
| Cherokee | 111 | 0.2% |
| Chippewa | 26 | 0.1% |
| Colombian | 81 | 0.2% |
| Costa Rican | 19 | 0.0% |
| Creek | 58 | 0.1% |
| Croatian | 51 | 0.1% |
| Cuban | 49 | 0.1% |
| Czech | 317 | 0.6% |
| Czechoslovakian | 135 | 0.3% |
| Danish | 259 | 0.5% |
| Dutch | 874 | 1.7% |
| Eastern European | 167 | 0.3% |
| Ecuadorian | 67 | 0.1% |
| Egyptian | 16 | 0.0% |
| English | 6,672 | 12.7% |
| European | 729 | 1.4% |
| Finnish | 51 | 0.1% |
| French | 1,185 | 2.3% |
| French American Indian | 1 | 0.0% |
| French Canadian | 351 | 0.7% |
| German | 8,130 | 15.5% |
| Ghanaian | 118 | 0.2% |
| Greek | 66 | 0.1% |
| Guamanian / Chamorro | 101 | 0.2% |
| Haitian | 17 | 0.0% |
| Honduran | 34 | 0.1% |
| Hungarian | 141 | 0.3% |
| Icelander | 21 | 0.0% |
| Indian (Asian) | 583 | 1.1% |
| Iranian | 82 | 0.2% |
| Irish | 5,116 | 9.7% |
| Iroquois | 96 | 0.2% |
| Israeli | 43 | 0.1% |
| Italian | 2,920 | 5.6% |
| Jamaican | 10 | 0.0% |
| Japanese | 59 | 0.1% |
| Korean | 726 | 1.4% |
| Lebanese | 46 | 0.1% |
| Lithuanian | 75 | 0.1% |
| Mexican | 11,862 | 22.6% |
| Mexican American Indian | 9 | 0.0% |
| Native Hawaiian | 129 | 0.3% |
| Navajo | 296 | 0.6% |
| New Zealander | 14 | 0.0% |
| Nigerian | 26 | 0.1% |
| Northern European | 22 | 0.0% |
| Norwegian | 1,100 | 2.1% |
| Pakistani | 172 | 0.3% |
| Panamanian | 10 | 0.0% |
| Peruvian | 154 | 0.3% |
| Polish | 1,778 | 3.4% |
| Portuguese | 197 | 0.4% |
| Puerto Rican | 927 | 1.8% |
| Romanian | 20 | 0.0% |
| Russian | 287 | 0.5% |
| Salvadoran | 171 | 0.3% |
| Samoan | 101 | 0.2% |
| Scandinavian | 115 | 0.2% |
| Scotch-Irish | 935 | 1.8% |
| Scottish | 1,265 | 2.4% |
| Serbian | 117 | 0.2% |
| Sioux | 32 | 0.1% |
| Slovak | 184 | 0.4% |
| Slovene | 54 | 0.1% |
| South American | 440 | 0.8% |
| Spaniard | 91 | 0.2% |
| Spanish | 245 | 0.5% |
| Spanish American Indian | 48 | 0.1% |
| Sri Lankan | 317 | 0.6% |
| Subsaharan African | 341 | 0.6% |
| Swedish | 479 | 0.9% |
| Swiss | 133 | 0.3% |
| Thai | 608 | 1.2% |
| Tohono O'Odham | 89 | 0.2% |
| Trinidadian and Tobagonian | 271 | 0.5% |
| U.S. Virgin Islander | 12 | 0.0% |
| Ukrainian | 184 | 0.4% |
| Venezuelan | 35 | 0.1% |
| Welsh | 467 | 0.9% |
| West Indian | 23 | 0.0% |
| Yaqui | 213 | 0.4% |
| Yugoslavian | 68 | 0.1% |
| Yup'ik | 16 | 0.0% | View All 99 Rows |
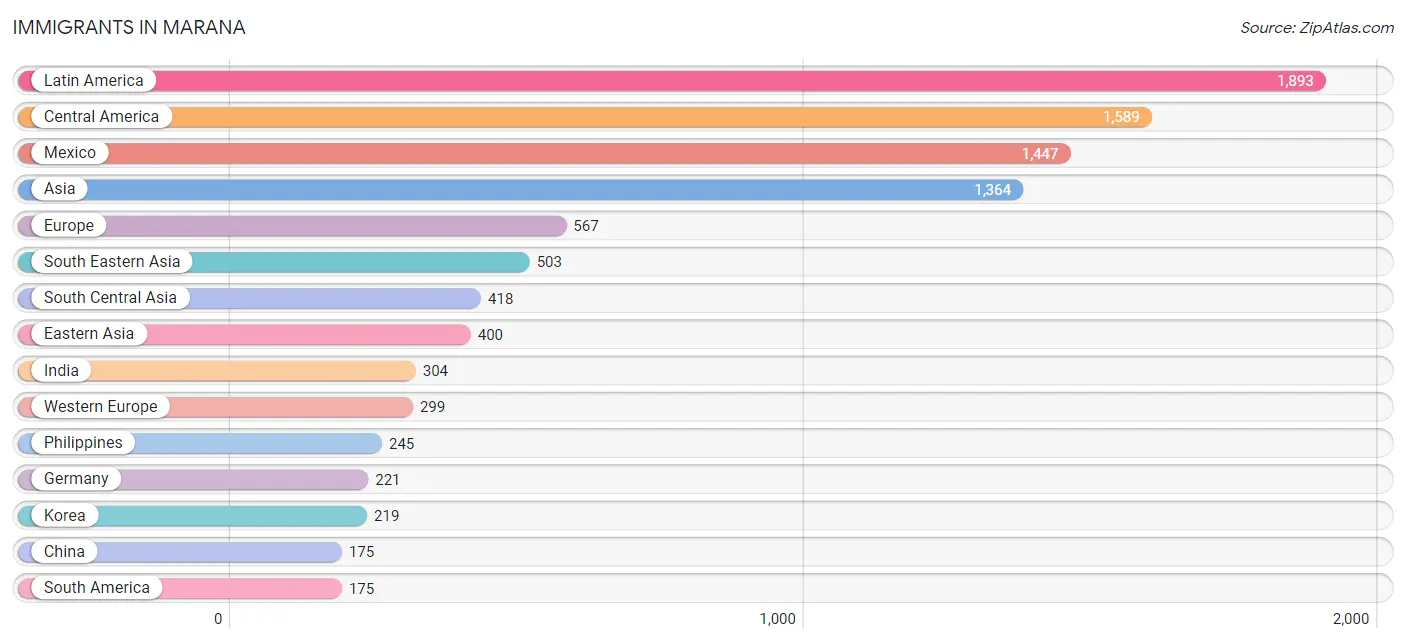
Immigrants in Marana
The most numerous immigrant groups reported in Marana came from Latin America (1,893 | 3.6%), Central America (1,589 | 3.0%), Mexico (1,447 | 2.8%), Asia (1,364 | 2.6%), and Europe (567 | 1.1%), together accounting for 13.0% of all Marana residents.
| Immigration Origin | # Population | % Population |
| Africa | 134 | 0.3% |
| Argentina | 25 | 0.1% |
| Asia | 1,364 | 2.6% |
| Australia | 45 | 0.1% |
| Bahamas | 6 | 0.0% |
| Belgium | 23 | 0.0% |
| Brazil | 59 | 0.1% |
| Cambodia | 32 | 0.1% |
| Canada | 170 | 0.3% |
| Caribbean | 129 | 0.3% |
| Central America | 1,589 | 3.0% |
| China | 175 | 0.3% |
| Costa Rica | 19 | 0.0% |
| Cuba | 14 | 0.0% |
| Czechoslovakia | 107 | 0.2% |
| Denmark | 18 | 0.0% |
| Dominican Republic | 46 | 0.1% |
| Eastern Asia | 400 | 0.8% |
| Eastern Europe | 151 | 0.3% |
| Egypt | 16 | 0.0% |
| El Salvador | 111 | 0.2% |
| England | 56 | 0.1% |
| Europe | 567 | 1.1% |
| Germany | 221 | 0.4% |
| Ghana | 33 | 0.1% |
| Greece | 16 | 0.0% |
| Honduras | 12 | 0.0% |
| India | 304 | 0.6% |
| Iran | 76 | 0.1% |
| Ireland | 18 | 0.0% |
| Japan | 6 | 0.0% |
| Korea | 219 | 0.4% |
| Latin America | 1,893 | 3.6% |
| Malaysia | 8 | 0.0% |
| Mexico | 1,447 | 2.8% |
| Netherlands | 38 | 0.1% |
| Nigeria | 10 | 0.0% |
| Northern Africa | 38 | 0.1% |
| Northern Europe | 101 | 0.2% |
| Oceania | 59 | 0.1% |
| Pakistan | 38 | 0.1% |
| Peru | 91 | 0.2% |
| Philippines | 245 | 0.5% |
| Russia | 33 | 0.1% |
| Sierra Leone | 53 | 0.1% |
| Singapore | 11 | 0.0% |
| South America | 175 | 0.3% |
| South Central Asia | 418 | 0.8% |
| South Eastern Asia | 503 | 1.0% |
| Southern Europe | 16 | 0.0% |
| Switzerland | 17 | 0.0% |
| Thailand | 59 | 0.1% |
| Trinidad and Tobago | 63 | 0.1% |
| Turkey | 43 | 0.1% |
| Ukraine | 11 | 0.0% |
| Vietnam | 148 | 0.3% |
| Western Africa | 96 | 0.2% |
| Western Asia | 43 | 0.1% |
| Western Europe | 299 | 0.6% | View All 59 Rows |
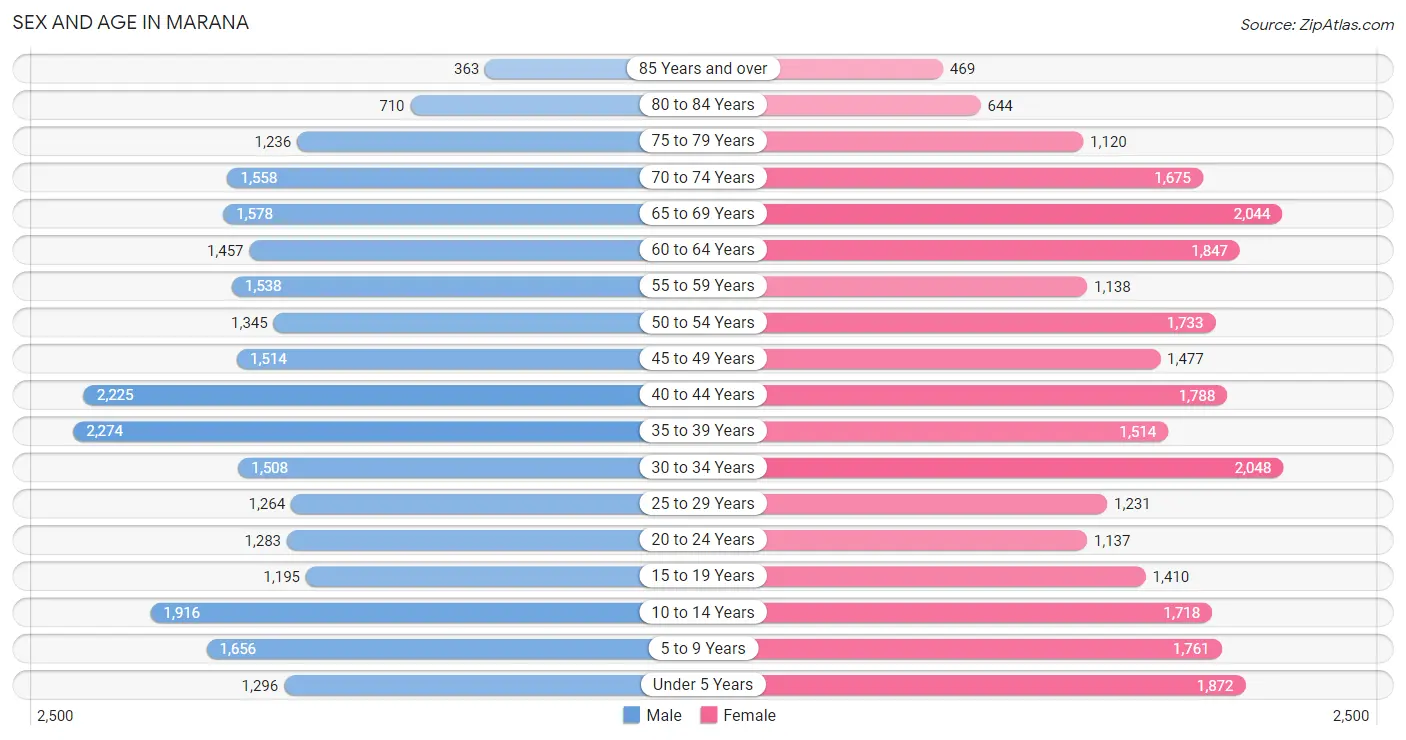
Sex and Age in Marana
Sex and Age in Marana
The most populous age groups in Marana are 35 to 39 Years (2,274 | 8.8%) for men and 30 to 34 Years (2,048 | 7.7%) for women.
| Age Bracket | Male | Female |
| Under 5 Years | 1,296 (5.0%) | 1,872 (7.0%) |
| 5 to 9 Years | 1,656 (6.4%) | 1,761 (6.6%) |
| 10 to 14 Years | 1,916 (7.4%) | 1,718 (6.5%) |
| 15 to 19 Years | 1,195 (4.6%) | 1,410 (5.3%) |
| 20 to 24 Years | 1,283 (5.0%) | 1,137 (4.3%) |
| 25 to 29 Years | 1,264 (4.9%) | 1,231 (4.6%) |
| 30 to 34 Years | 1,508 (5.8%) | 2,048 (7.7%) |
| 35 to 39 Years | 2,274 (8.8%) | 1,514 (5.7%) |
| 40 to 44 Years | 2,225 (8.6%) | 1,788 (6.7%) |
| 45 to 49 Years | 1,514 (5.8%) | 1,477 (5.6%) |
| 50 to 54 Years | 1,345 (5.2%) | 1,733 (6.5%) |
| 55 to 59 Years | 1,538 (5.9%) | 1,138 (4.3%) |
| 60 to 64 Years | 1,457 (5.6%) | 1,847 (6.9%) |
| 65 to 69 Years | 1,578 (6.1%) | 2,044 (7.7%) |
| 70 to 74 Years | 1,558 (6.0%) | 1,675 (6.3%) |
| 75 to 79 Years | 1,236 (4.8%) | 1,120 (4.2%) |
| 80 to 84 Years | 710 (2.7%) | 644 (2.4%) |
| 85 Years and over | 363 (1.4%) | 469 (1.8%) |
| Total | 25,916 (100.0%) | 26,626 (100.0%) |
Families and Households in Marana
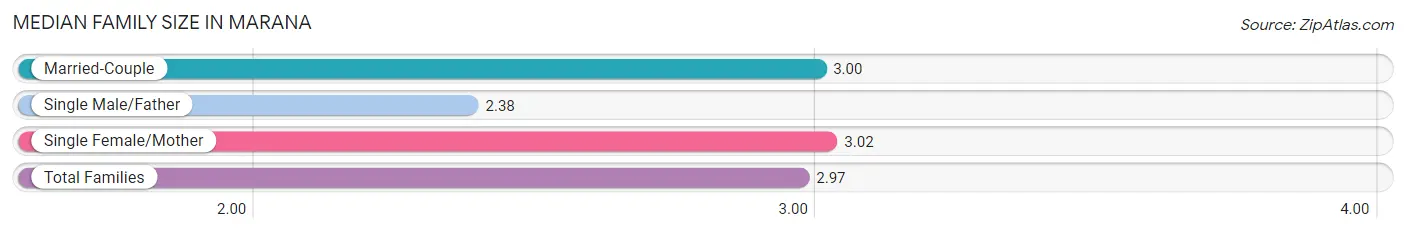
Median Family Size in Marana
The median family size in Marana is 2.97 persons per family, with single female/mother families (1,675 | 11.0%) accounting for the largest median family size of 3.02 persons per family. On the other hand, single male/father families (807 | 5.3%) represent the smallest median family size with 2.38 persons per family.
| Family Type | # Families | Family Size |
| Married-Couple | 12,751 (83.7%) | 3.00 |
| Single Male/Father | 807 (5.3%) | 2.38 |
| Single Female/Mother | 1,675 (11.0%) | 3.02 |
| Total Families | 15,233 (100.0%) | 2.97 |
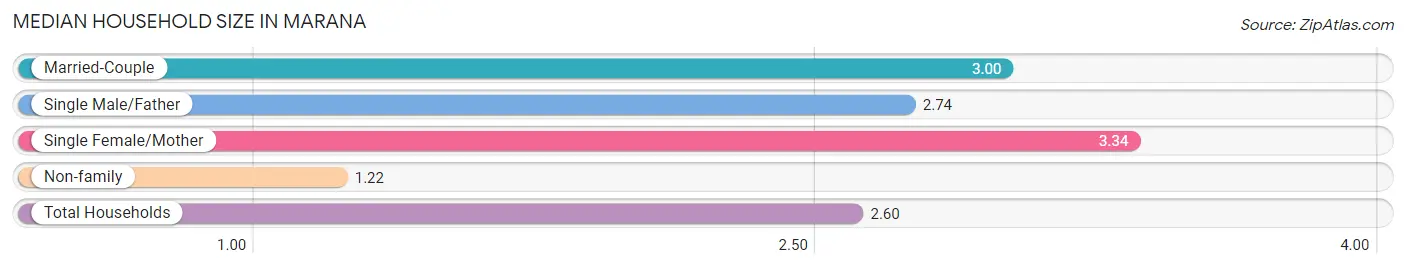
Median Household Size in Marana
The median household size in Marana is 2.60 persons per household, with single female/mother households (1,675 | 8.4%) accounting for the largest median household size of 3.34 persons per household. non-family households (4,716 | 23.6%) represent the smallest median household size with 1.22 persons per household.
| Household Type | # Households | Household Size |
| Married-Couple | 12,751 (63.9%) | 3.00 |
| Single Male/Father | 807 (4.1%) | 2.74 |
| Single Female/Mother | 1,675 (8.4%) | 3.34 |
| Non-family | 4,716 (23.6%) | 1.22 |
| Total Households | 19,949 (100.0%) | 2.60 |
Household Size by Marriage Status in Marana
Out of a total of 19,949 households in Marana, 15,233 (76.4%) are family households, while 4,716 (23.6%) are nonfamily households. The most numerous type of family households are 2-person households, comprising 7,792, and the most common type of nonfamily households are 1-person households, comprising 3,806.
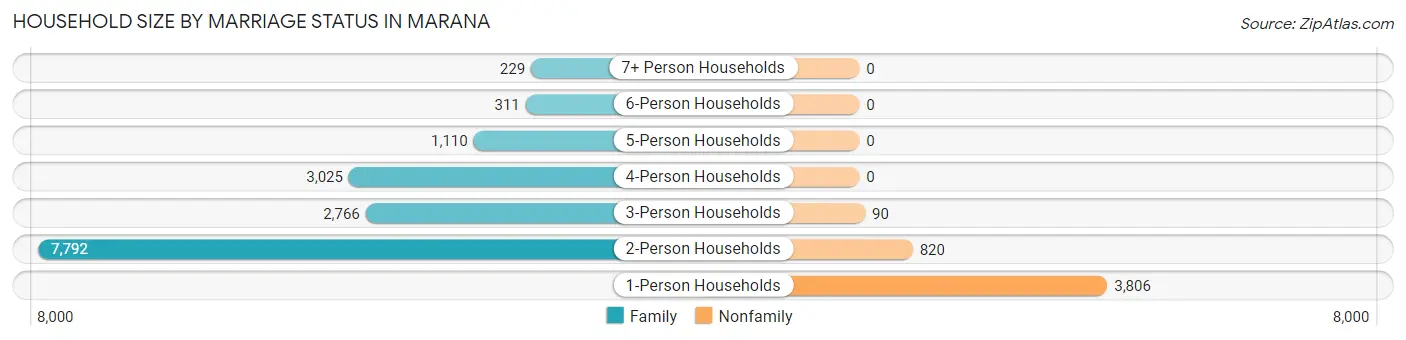
| Household Size | Family Households | Nonfamily Households |
| 1-Person Households | - | 3,806 (19.1%) |
| 2-Person Households | 7,792 (39.1%) | 820 (4.1%) |
| 3-Person Households | 2,766 (13.9%) | 90 (0.4%) |
| 4-Person Households | 3,025 (15.2%) | 0 (0.0%) |
| 5-Person Households | 1,110 (5.6%) | 0 (0.0%) |
| 6-Person Households | 311 (1.6%) | 0 (0.0%) |
| 7+ Person Households | 229 (1.1%) | 0 (0.0%) |
| Total | 15,233 (76.4%) | 4,716 (23.6%) |
Female Fertility in Marana
Fertility by Age in Marana
Average fertility rate in Marana is 71.0 births per 1,000 women. Women in the age bracket of 20 to 34 years have the highest fertility rate with 131.0 births per 1,000 women. Women in the age bracket of 20 to 34 years acount for 74.5% of all women with births.
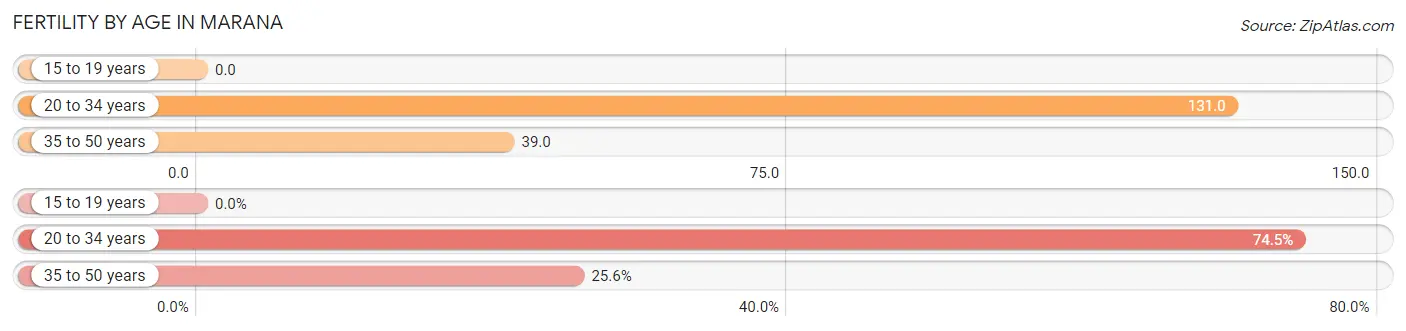
| Age Bracket | Women with Births | Births / 1,000 Women |
| 15 to 19 years | 0 (0.0%) | 0.0 |
| 20 to 34 years | 577 (74.5%) | 131.0 |
| 35 to 50 years | 198 (25.6%) | 39.0 |
| Total | 775 (100.0%) | 71.0 |
Fertility by Age by Marriage Status in Marana
94.6% of women with births (775) in Marana are married. The highest percentage of unmarried women with births falls into 20 to 34 years age bracket with 6.1% of them unmarried at the time of birth, while the lowest percentage of unmarried women with births belong to 35 to 50 years age bracket with 3.5% of them unmarried.
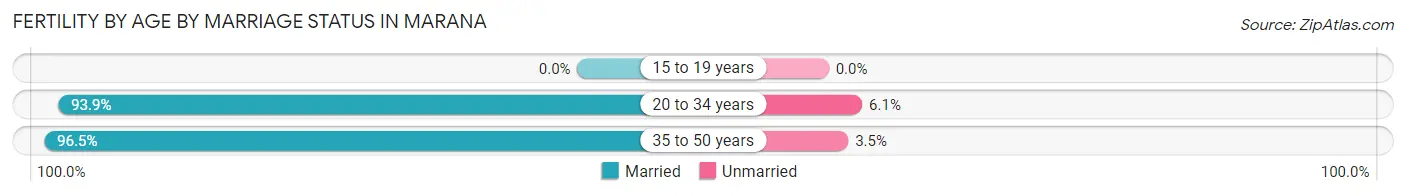
| Age Bracket | Married | Unmarried |
| 15 to 19 years | 0 (0.0%) | 0 (0.0%) |
| 20 to 34 years | 542 (93.9%) | 35 (6.1%) |
| 35 to 50 years | 191 (96.5%) | 7 (3.5%) |
| Total | 733 (94.6%) | 42 (5.4%) |
Fertility by Education in Marana
Average fertility rate in Marana is 71.0 births per 1,000 women. Women with the education attainment of bachelor's degree have the highest fertility rate of 127.0 births per 1,000 women, while women with the education attainment of less than high school have the lowest fertility at 23.0 births per 1,000 women. Women with the education attainment of bachelor's degree represent 52.5% of all women with births.
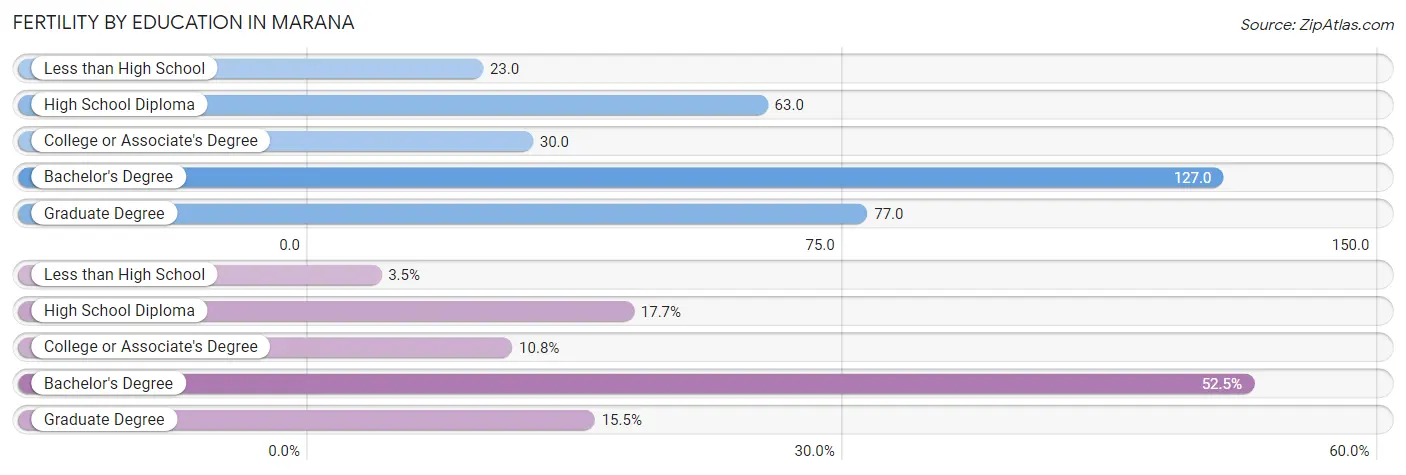
| Educational Attainment | Women with Births | Births / 1,000 Women |
| Less than High School | 27 (3.5%) | 23.0 |
| High School Diploma | 137 (17.7%) | 63.0 |
| College or Associate's Degree | 84 (10.8%) | 30.0 |
| Bachelor's Degree | 407 (52.5%) | 127.0 |
| Graduate Degree | 120 (15.5%) | 77.0 |
| Total | 775 (100.0%) | 71.0 |
Fertility by Education by Marriage Status in Marana
5.4% of women with births in Marana are unmarried. Women with the educational attainment of less than high school are most likely to be married with 100.0% of them married at childbirth, while women with the educational attainment of high school diploma are least likely to be married with 17.5% of them unmarried at childbirth.
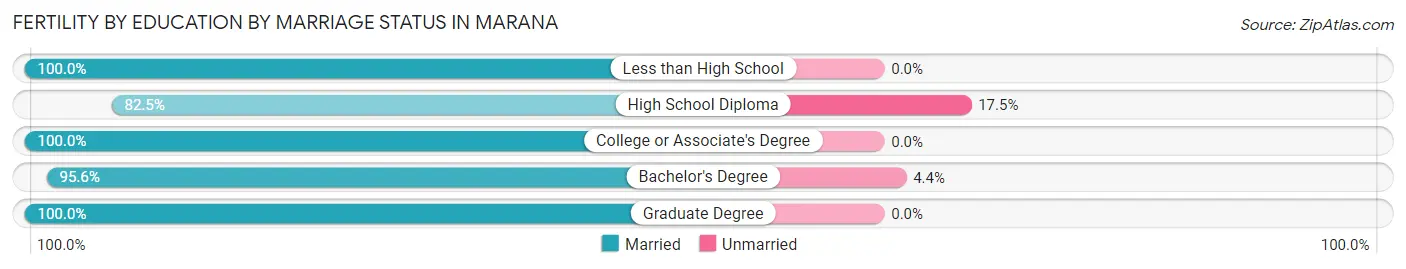
| Educational Attainment | Married | Unmarried |
| Less than High School | 27 (100.0%) | 0 (0.0%) |
| High School Diploma | 113 (82.5%) | 24 (17.5%) |
| College or Associate's Degree | 84 (100.0%) | 0 (0.0%) |
| Bachelor's Degree | 389 (95.6%) | 18 (4.4%) |
| Graduate Degree | 120 (100.0%) | 0 (0.0%) |
| Total | 733 (94.6%) | 42 (5.4%) |
Employment Characteristics in Marana
Employment by Class of Employer in Marana
Among the 24,502 employed individuals in Marana, private company employees (14,923 | 60.9%), local government employees (2,361 | 9.6%), and not-for-profit organizations (1,843 | 7.5%) make up the most common classes of employment.
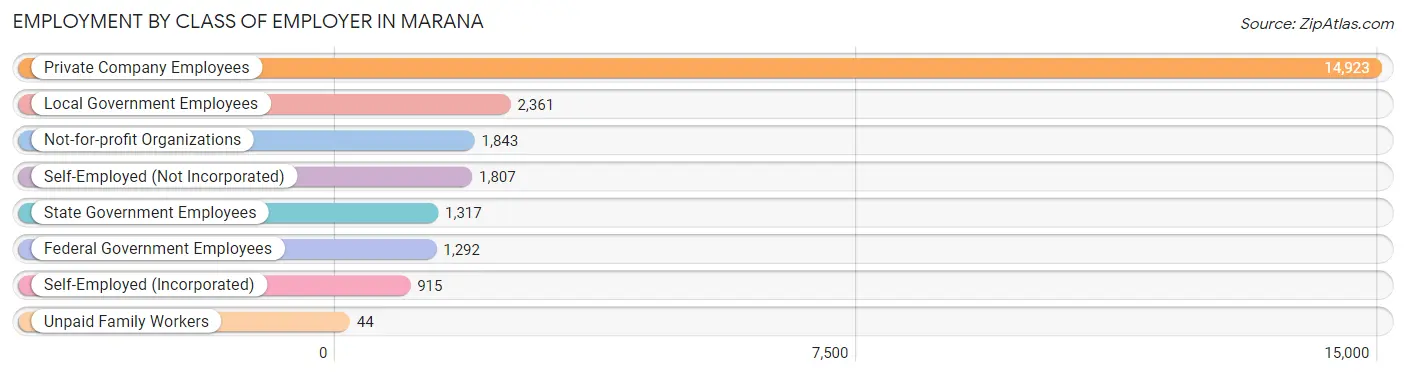
| Employer Class | # Employees | % Employees |
| Private Company Employees | 14,923 | 60.9% |
| Self-Employed (Incorporated) | 915 | 3.7% |
| Self-Employed (Not Incorporated) | 1,807 | 7.4% |
| Not-for-profit Organizations | 1,843 | 7.5% |
| Local Government Employees | 2,361 | 9.6% |
| State Government Employees | 1,317 | 5.4% |
| Federal Government Employees | 1,292 | 5.3% |
| Unpaid Family Workers | 44 | 0.2% |
| Total | 24,502 | 100.0% |
Employment Status by Age in Marana
According to the labor force statistics for Marana, out of the total population over 16 years of age (41,800), 62.1% or 25,958 individuals are in the labor force, with 4.1% or 1,064 of them unemployed. The age group with the highest labor force participation rate is 30 to 34 years, with 88.3% or 3,140 individuals in the labor force. Within the labor force, the 20 to 24 years age range has the highest percentage of unemployed individuals, with 18.5% or 365 of them being unemployed.
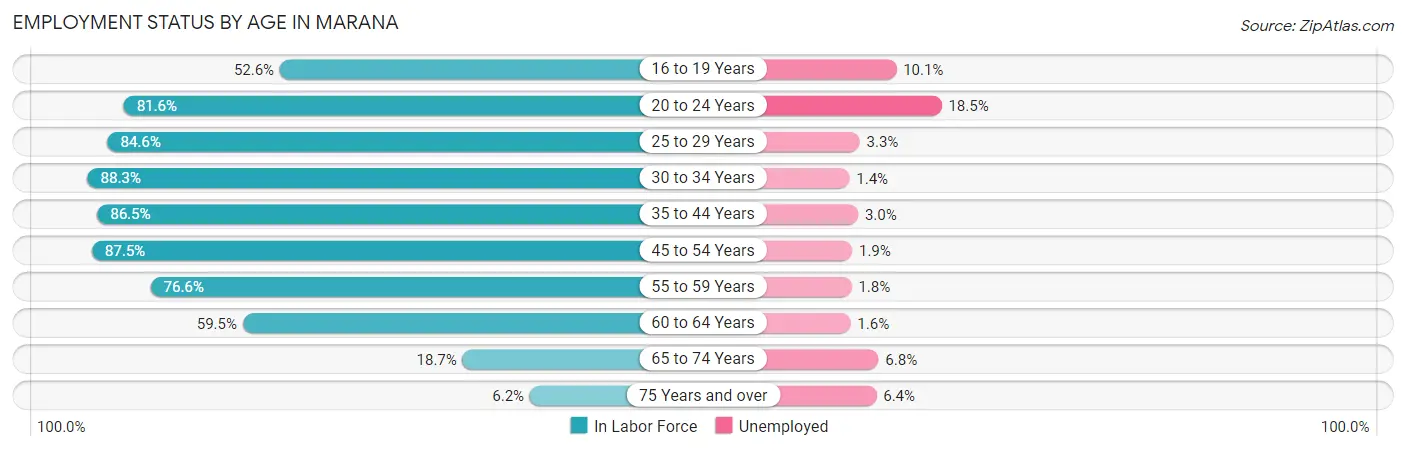
| Age Bracket | In Labor Force | Unemployed |
| 16 to 19 Years | 1,095 (52.6%) | 111 (10.1%) |
| 20 to 24 Years | 1,975 (81.6%) | 365 (18.5%) |
| 25 to 29 Years | 2,111 (84.6%) | 70 (3.3%) |
| 30 to 34 Years | 3,140 (88.3%) | 44 (1.4%) |
| 35 to 44 Years | 6,748 (86.5%) | 202 (3.0%) |
| 45 to 54 Years | 5,310 (87.5%) | 101 (1.9%) |
| 55 to 59 Years | 2,050 (76.6%) | 37 (1.8%) |
| 60 to 64 Years | 1,966 (59.5%) | 31 (1.6%) |
| 65 to 74 Years | 1,282 (18.7%) | 87 (6.8%) |
| 75 Years and over | 282 (6.2%) | 18 (6.4%) |
| Total | 25,958 (62.1%) | 1,064 (4.1%) |
Employment Status by Educational Attainment in Marana
According to labor force statistics for Marana, 82.3% of individuals (21,317) out of the total population between 25 and 64 years of age (25,901) are in the labor force, with 2.3% or 490 of them being unemployed. The group with the highest labor force participation rate are those with the educational attainment of bachelor's degree or higher, with 88.5% or 11,004 individuals in the labor force. Within the labor force, individuals with less than high school education have the highest percentage of unemployment, with 4.7% or 31 of them being unemployed.
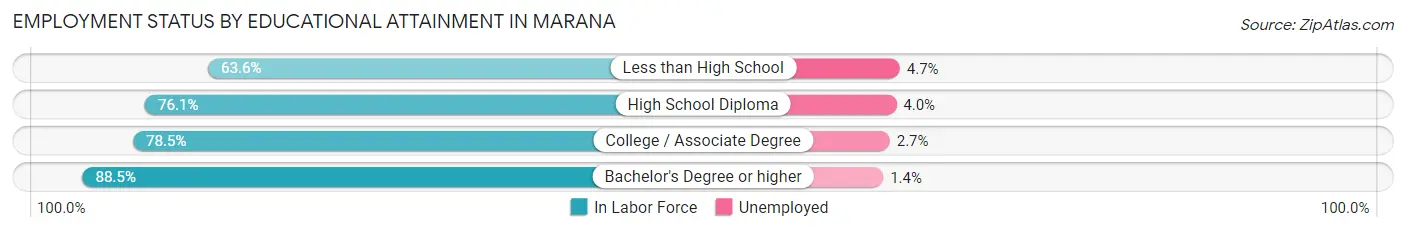
| Educational Attainment | In Labor Force | Unemployed |
| Less than High School | 656 (63.6%) | 48 (4.7%) |
| High School Diploma | 3,068 (76.1%) | 161 (4.0%) |
| College / Associate Degree | 6,597 (78.5%) | 227 (2.7%) |
| Bachelor's Degree or higher | 11,004 (88.5%) | 174 (1.4%) |
| Total | 21,317 (82.3%) | 596 (2.3%) |
Employment Occupations by Sex in Marana
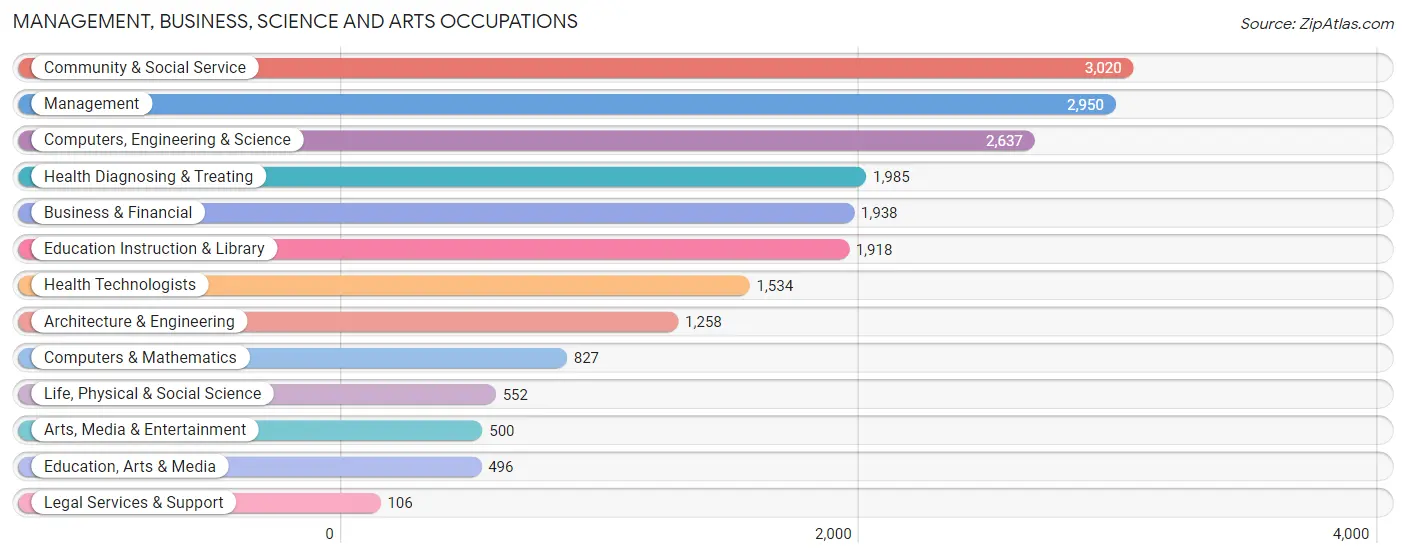
Management, Business, Science and Arts Occupations
The most common Management, Business, Science and Arts occupations in Marana are Community & Social Service (3,020 | 12.3%), Management (2,950 | 12.0%), Computers, Engineering & Science (2,637 | 10.7%), Health Diagnosing & Treating (1,985 | 8.1%), and Business & Financial (1,938 | 7.9%).
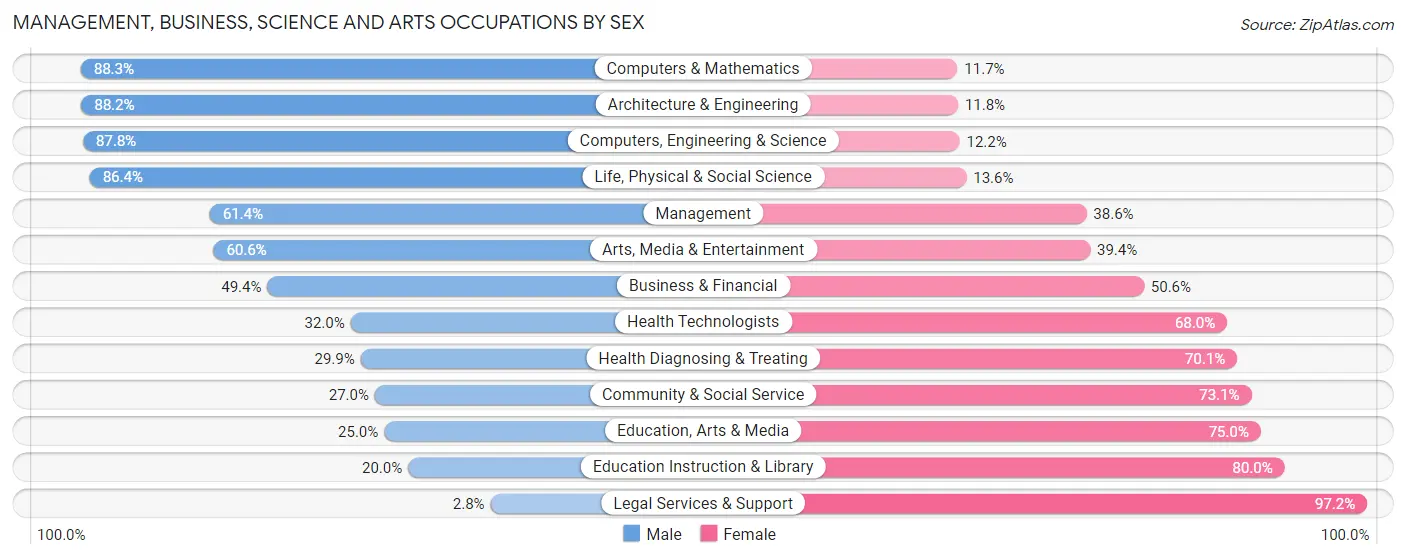
Management, Business, Science and Arts Occupations by Sex
Within the Management, Business, Science and Arts occupations in Marana, the most male-oriented occupations are Computers & Mathematics (88.3%), Architecture & Engineering (88.2%), and Computers, Engineering & Science (87.8%), while the most female-oriented occupations are Legal Services & Support (97.2%), Education Instruction & Library (80.0%), and Education, Arts & Media (75.0%).
| Occupation | Male | Female |
| Management | 1,810 (61.4%) | 1,140 (38.6%) |
| Business & Financial | 957 (49.4%) | 981 (50.6%) |
| Computers, Engineering & Science | 2,316 (87.8%) | 321 (12.2%) |
| Computers & Mathematics | 730 (88.3%) | 97 (11.7%) |
| Architecture & Engineering | 1,109 (88.2%) | 149 (11.8%) |
| Life, Physical & Social Science | 477 (86.4%) | 75 (13.6%) |
| Community & Social Service | 814 (27.0%) | 2,206 (73.1%) |
| Education, Arts & Media | 124 (25.0%) | 372 (75.0%) |
| Legal Services & Support | 3 (2.8%) | 103 (97.2%) |
| Education Instruction & Library | 384 (20.0%) | 1,534 (80.0%) |
| Arts, Media & Entertainment | 303 (60.6%) | 197 (39.4%) |
| Health Diagnosing & Treating | 594 (29.9%) | 1,391 (70.1%) |
| Health Technologists | 491 (32.0%) | 1,043 (68.0%) |
| Total (Category) | 6,491 (51.8%) | 6,039 (48.2%) |
| Total (Overall) | 13,309 (54.1%) | 11,285 (45.9%) |
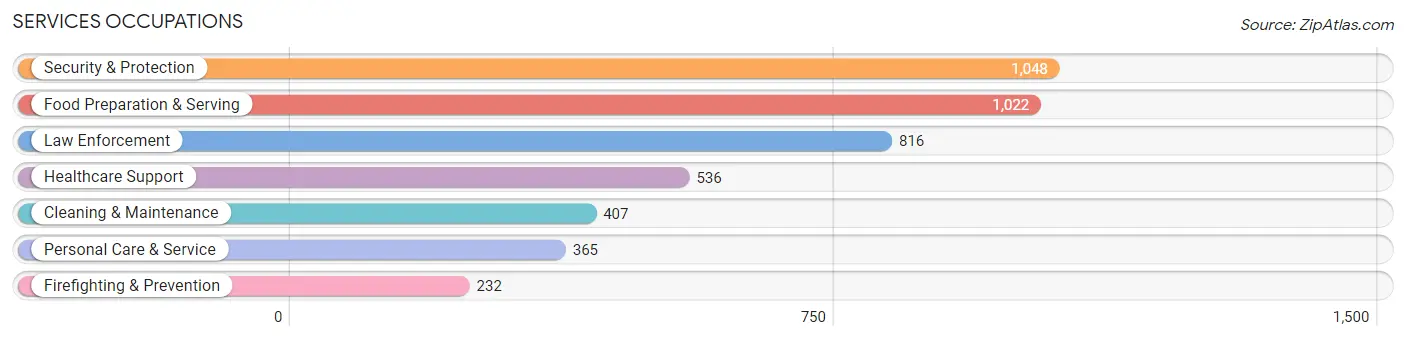
Services Occupations
The most common Services occupations in Marana are Security & Protection (1,048 | 4.3%), Food Preparation & Serving (1,022 | 4.2%), Law Enforcement (816 | 3.3%), Healthcare Support (536 | 2.2%), and Cleaning & Maintenance (407 | 1.7%).
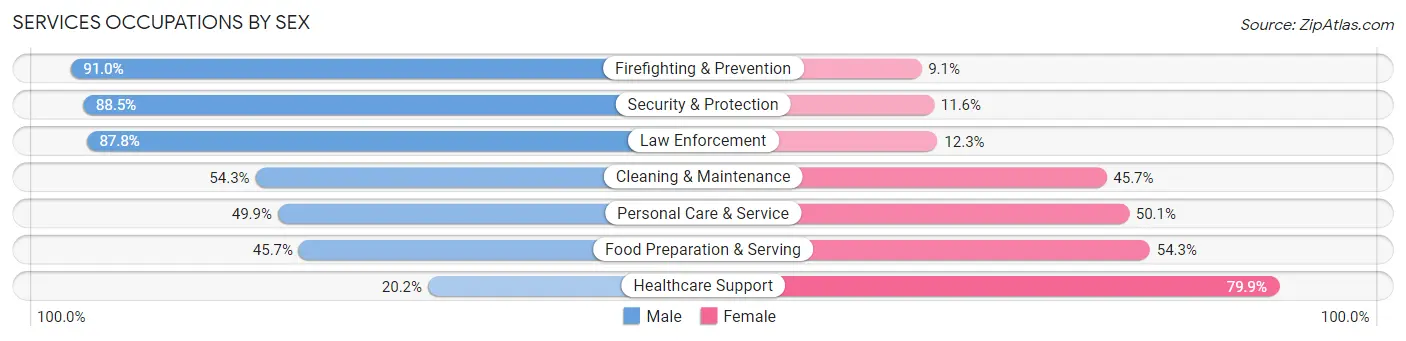
Services Occupations by Sex
Within the Services occupations in Marana, the most male-oriented occupations are Firefighting & Prevention (90.9%), Security & Protection (88.4%), and Law Enforcement (87.7%), while the most female-oriented occupations are Healthcare Support (79.8%), Food Preparation & Serving (54.3%), and Personal Care & Service (50.1%).
| Occupation | Male | Female |
| Healthcare Support | 108 (20.2%) | 428 (79.8%) |
| Security & Protection | 927 (88.4%) | 121 (11.6%) |
| Firefighting & Prevention | 211 (90.9%) | 21 (9.0%) |
| Law Enforcement | 716 (87.7%) | 100 (12.2%) |
| Food Preparation & Serving | 467 (45.7%) | 555 (54.3%) |
| Cleaning & Maintenance | 221 (54.3%) | 186 (45.7%) |
| Personal Care & Service | 182 (49.9%) | 183 (50.1%) |
| Total (Category) | 1,905 (56.4%) | 1,473 (43.6%) |
| Total (Overall) | 13,309 (54.1%) | 11,285 (45.9%) |
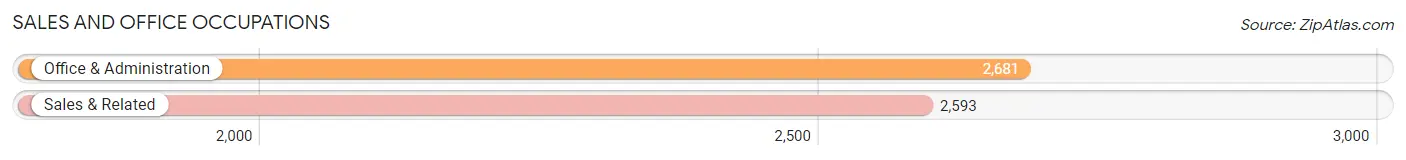
Sales and Office Occupations
The most common Sales and Office occupations in Marana are Office & Administration (2,681 | 10.9%), and Sales & Related (2,593 | 10.5%).
Sales and Office Occupations by Sex
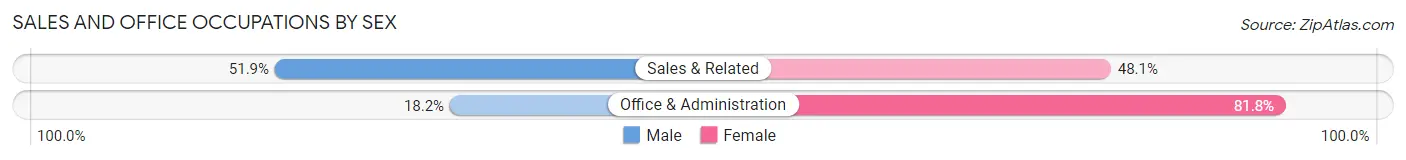
| Occupation | Male | Female |
| Sales & Related | 1,345 (51.9%) | 1,248 (48.1%) |
| Office & Administration | 488 (18.2%) | 2,193 (81.8%) |
| Total (Category) | 1,833 (34.8%) | 3,441 (65.2%) |
| Total (Overall) | 13,309 (54.1%) | 11,285 (45.9%) |
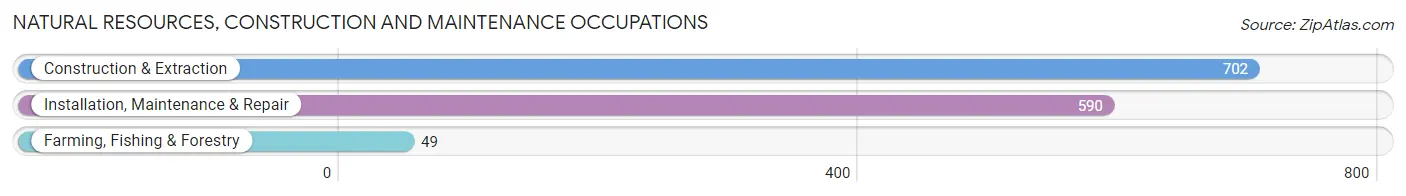
Natural Resources, Construction and Maintenance Occupations
The most common Natural Resources, Construction and Maintenance occupations in Marana are Construction & Extraction (702 | 2.9%), Installation, Maintenance & Repair (590 | 2.4%), and Farming, Fishing & Forestry (49 | 0.2%).
Natural Resources, Construction and Maintenance Occupations by Sex
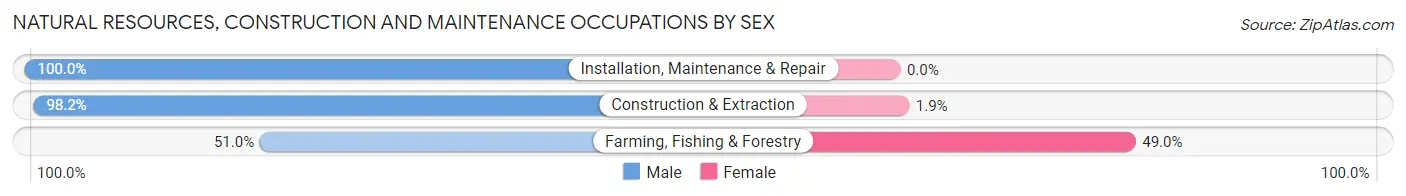
| Occupation | Male | Female |
| Farming, Fishing & Forestry | 25 (51.0%) | 24 (49.0%) |
| Construction & Extraction | 689 (98.2%) | 13 (1.8%) |
| Installation, Maintenance & Repair | 590 (100.0%) | 0 (0.0%) |
| Total (Category) | 1,304 (97.2%) | 37 (2.8%) |
| Total (Overall) | 13,309 (54.1%) | 11,285 (45.9%) |
Production, Transportation and Moving Occupations
The most common Production, Transportation and Moving occupations in Marana are Material Moving (849 | 3.5%), Transportation (703 | 2.9%), and Production (519 | 2.1%).
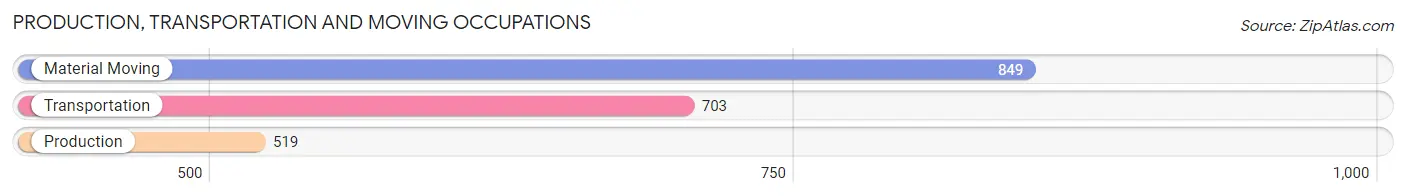
Production, Transportation and Moving Occupations by Sex
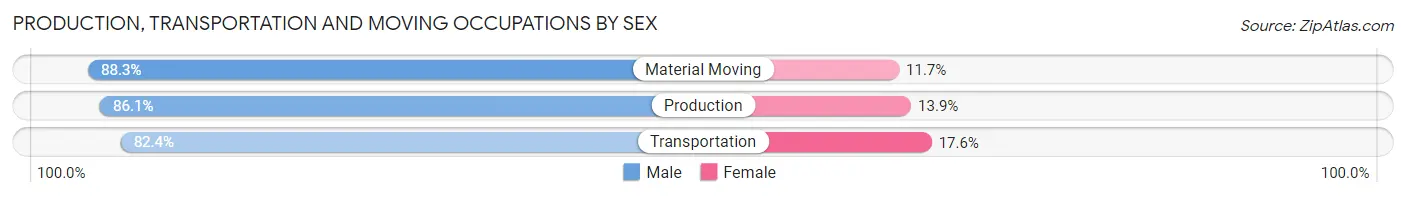
| Occupation | Male | Female |
| Production | 447 (86.1%) | 72 (13.9%) |
| Transportation | 579 (82.4%) | 124 (17.6%) |
| Material Moving | 750 (88.3%) | 99 (11.7%) |
| Total (Category) | 1,776 (85.8%) | 295 (14.2%) |
| Total (Overall) | 13,309 (54.1%) | 11,285 (45.9%) |
Employment Industries by Sex in Marana
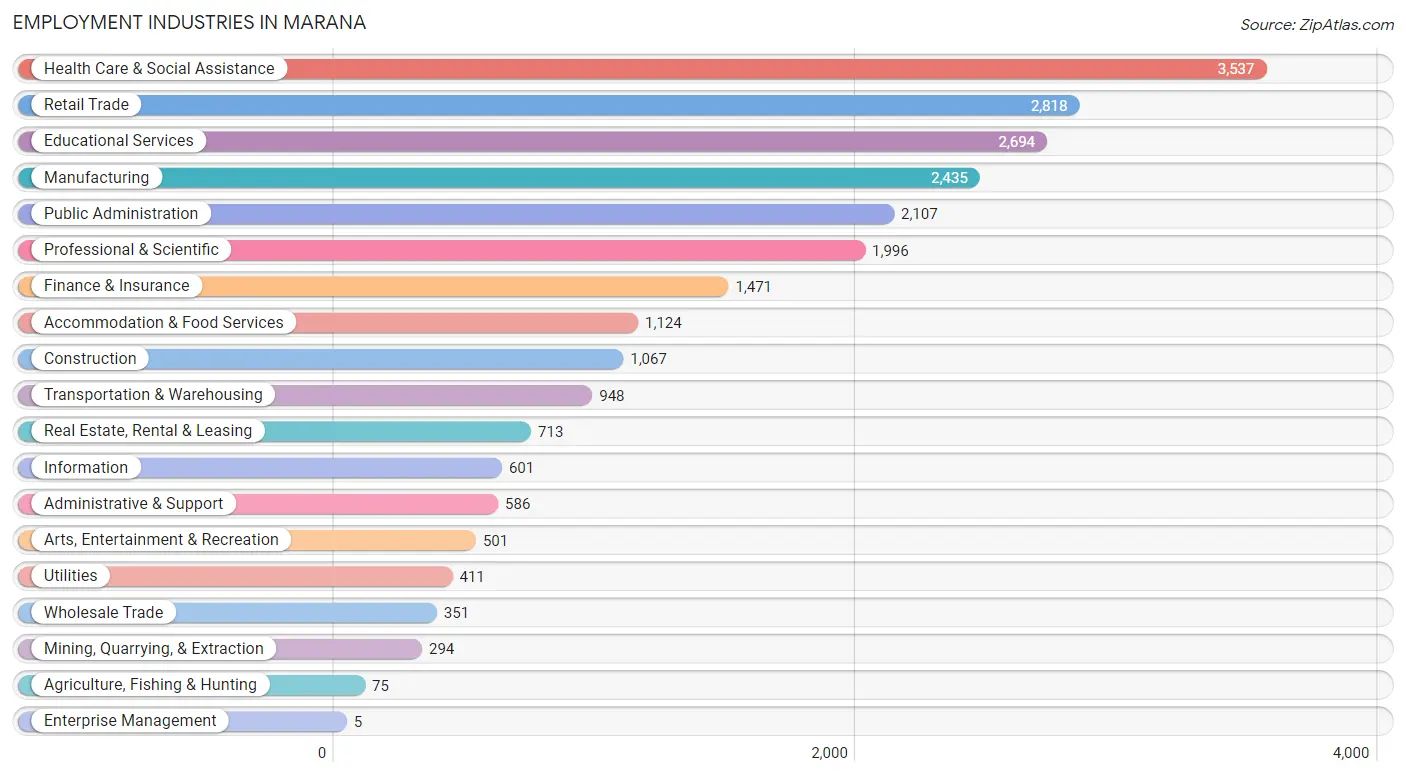
Employment Industries in Marana
The major employment industries in Marana include Health Care & Social Assistance (3,537 | 14.4%), Retail Trade (2,818 | 11.5%), Educational Services (2,694 | 11.0%), Manufacturing (2,435 | 9.9%), and Public Administration (2,107 | 8.6%).
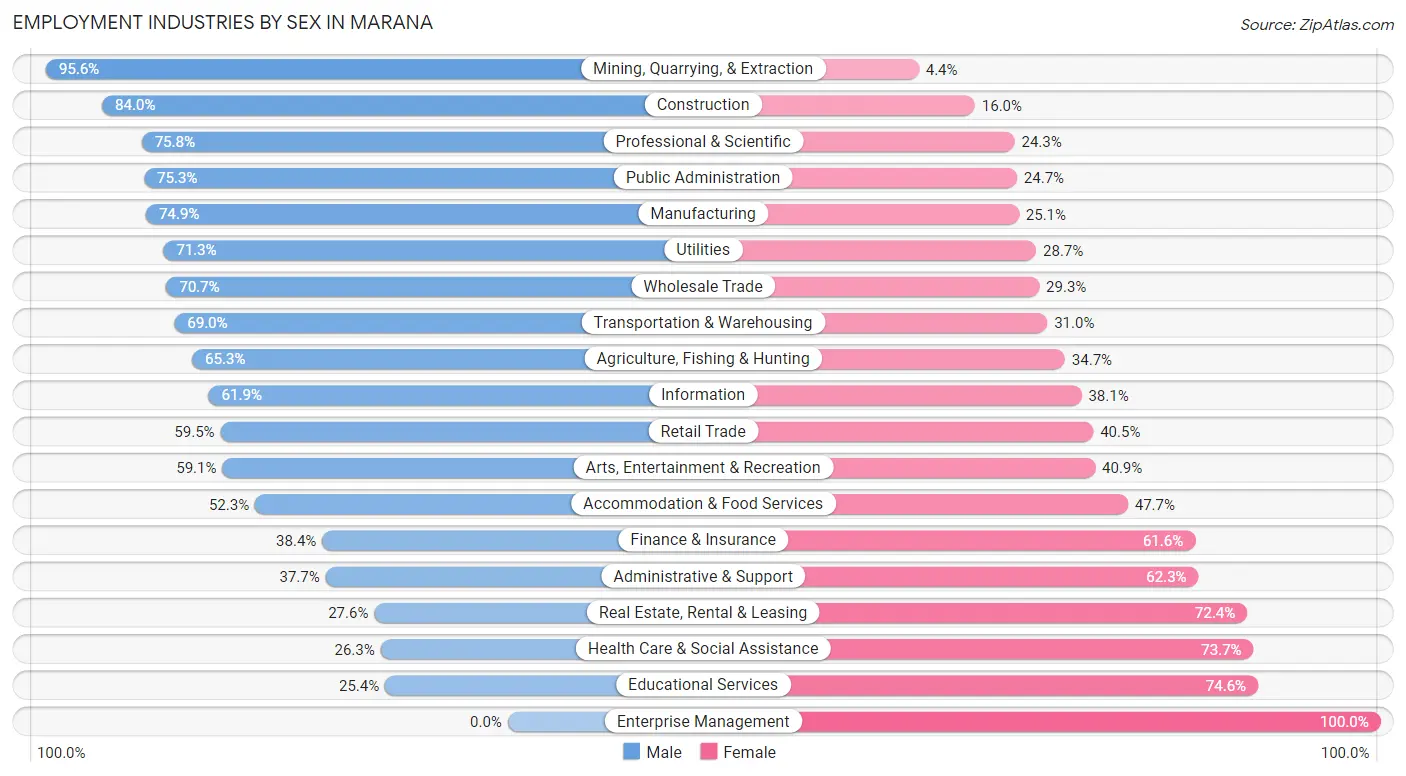
Employment Industries by Sex in Marana
The Marana industries that see more men than women are Mining, Quarrying, & Extraction (95.6%), Construction (84.0%), and Professional & Scientific (75.7%), whereas the industries that tend to have a higher number of women are Enterprise Management (100.0%), Educational Services (74.6%), and Health Care & Social Assistance (73.7%).
| Industry | Male | Female |
| Agriculture, Fishing & Hunting | 49 (65.3%) | 26 (34.7%) |
| Mining, Quarrying, & Extraction | 281 (95.6%) | 13 (4.4%) |
| Construction | 896 (84.0%) | 171 (16.0%) |
| Manufacturing | 1,823 (74.9%) | 612 (25.1%) |
| Wholesale Trade | 248 (70.7%) | 103 (29.3%) |
| Retail Trade | 1,676 (59.5%) | 1,142 (40.5%) |
| Transportation & Warehousing | 654 (69.0%) | 294 (31.0%) |
| Utilities | 293 (71.3%) | 118 (28.7%) |
| Information | 372 (61.9%) | 229 (38.1%) |
| Finance & Insurance | 565 (38.4%) | 906 (61.6%) |
| Real Estate, Rental & Leasing | 197 (27.6%) | 516 (72.4%) |
| Professional & Scientific | 1,512 (75.7%) | 484 (24.2%) |
| Enterprise Management | 0 (0.0%) | 5 (100.0%) |
| Administrative & Support | 221 (37.7%) | 365 (62.3%) |
| Educational Services | 684 (25.4%) | 2,010 (74.6%) |
| Health Care & Social Assistance | 931 (26.3%) | 2,606 (73.7%) |
| Arts, Entertainment & Recreation | 296 (59.1%) | 205 (40.9%) |
| Accommodation & Food Services | 588 (52.3%) | 536 (47.7%) |
| Public Administration | 1,586 (75.3%) | 521 (24.7%) |
| Total | 13,309 (54.1%) | 11,285 (45.9%) |
Education in Marana
School Enrollment in Marana
The most common levels of schooling among the 12,044 students in Marana are middle school (2,802 | 23.3%), elementary school (2,524 | 21.0%), and college / undergraduate (2,216 | 18.4%).
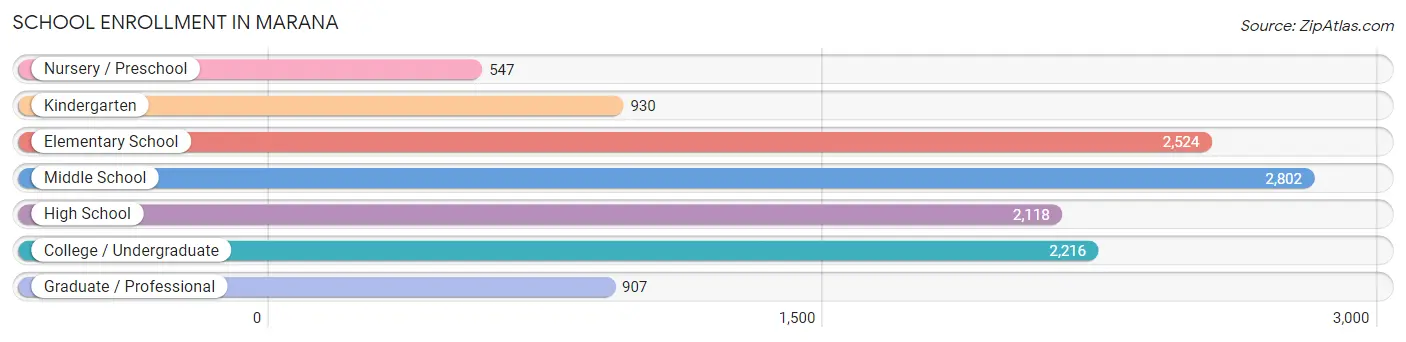
| School Level | # Students | % Students |
| Nursery / Preschool | 547 | 4.5% |
| Kindergarten | 930 | 7.7% |
| Elementary School | 2,524 | 21.0% |
| Middle School | 2,802 | 23.3% |
| High School | 2,118 | 17.6% |
| College / Undergraduate | 2,216 | 18.4% |
| Graduate / Professional | 907 | 7.5% |
| Total | 12,044 | 100.0% |
School Enrollment by Age by Funding Source in Marana
Out of a total of 12,044 students who are enrolled in schools in Marana, 2,072 (17.2%) attend a private institution, while the remaining 9,972 (82.8%) are enrolled in public schools. The age group of 25 to 34 year olds has the highest likelihood of being enrolled in private schools, with 382 (41.9% in the age bracket) enrolled. Conversely, the age group of 18 to 19 year olds has the lowest likelihood of being enrolled in a private school, with 571 (100.0% in the age bracket) attending a public institution.
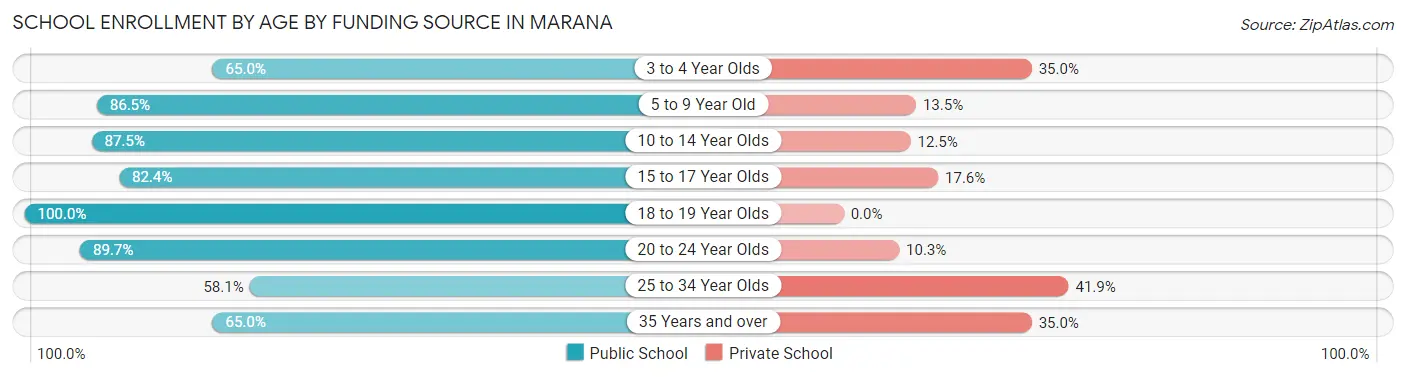
| Age Bracket | Public School | Private School |
| 3 to 4 Year Olds | 243 (65.0%) | 131 (35.0%) |
| 5 to 9 Year Old | 2,866 (86.5%) | 446 (13.5%) |
| 10 to 14 Year Olds | 3,109 (87.5%) | 443 (12.5%) |
| 15 to 17 Year Olds | 1,274 (82.4%) | 272 (17.6%) |
| 18 to 19 Year Olds | 571 (100.0%) | 0 (0.0%) |
| 20 to 24 Year Olds | 833 (89.7%) | 96 (10.3%) |
| 25 to 34 Year Olds | 530 (58.1%) | 382 (41.9%) |
| 35 Years and over | 551 (65.0%) | 297 (35.0%) |
| Total | 9,972 (82.8%) | 2,072 (17.2%) |
Educational Attainment by Field of Study in Marana
Business (3,794 | 20.2%), education (2,361 | 12.6%), science & technology (2,059 | 11.0%), engineering (1,798 | 9.6%), and social sciences (1,313 | 7.0%) are the most common fields of study among 18,749 individuals in Marana who have obtained a bachelor's degree or higher.
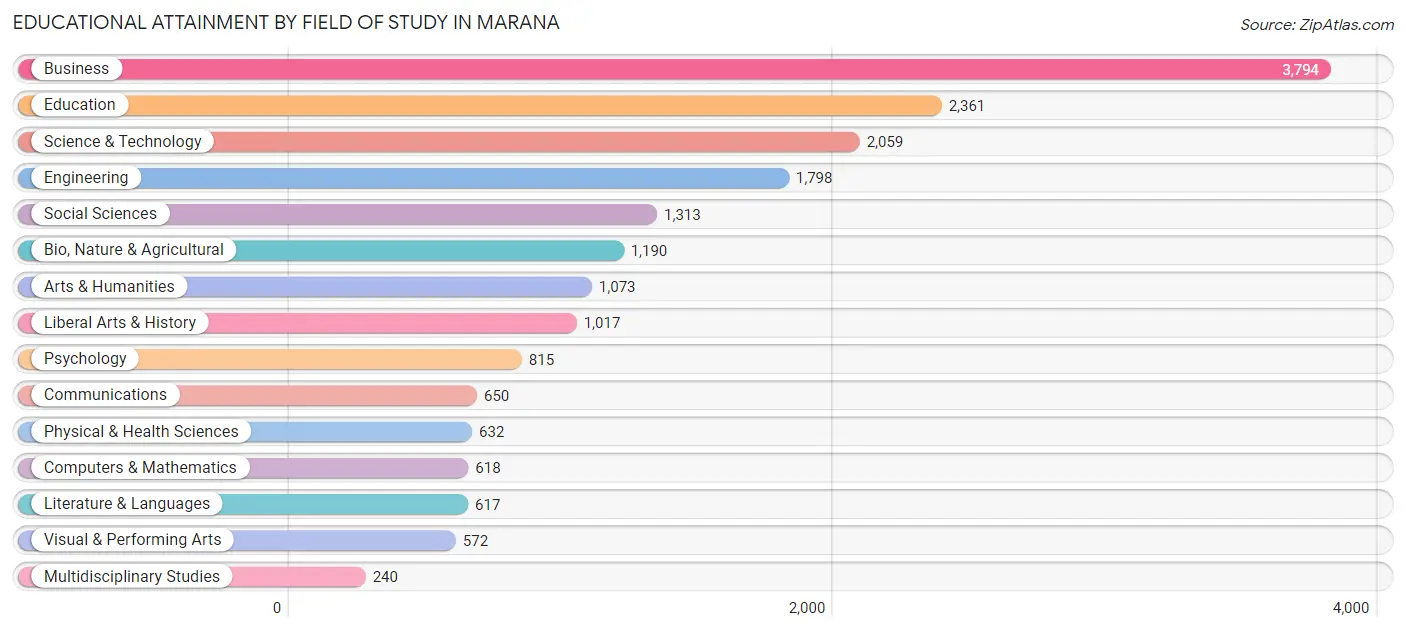
| Field of Study | # Graduates | % Graduates |
| Computers & Mathematics | 618 | 3.3% |
| Bio, Nature & Agricultural | 1,190 | 6.4% |
| Physical & Health Sciences | 632 | 3.4% |
| Psychology | 815 | 4.3% |
| Social Sciences | 1,313 | 7.0% |
| Engineering | 1,798 | 9.6% |
| Multidisciplinary Studies | 240 | 1.3% |
| Science & Technology | 2,059 | 11.0% |
| Business | 3,794 | 20.2% |
| Education | 2,361 | 12.6% |
| Literature & Languages | 617 | 3.3% |
| Liberal Arts & History | 1,017 | 5.4% |
| Visual & Performing Arts | 572 | 3.0% |
| Communications | 650 | 3.5% |
| Arts & Humanities | 1,073 | 5.7% |
| Total | 18,749 | 100.0% |
Transportation & Commute in Marana
Vehicle Availability by Sex in Marana
The most prevalent vehicle ownership categories in Marana are males with 2 vehicles (6,646, accounting for 49.3%) and females with 2 vehicles (5,033, making up 60.3%).
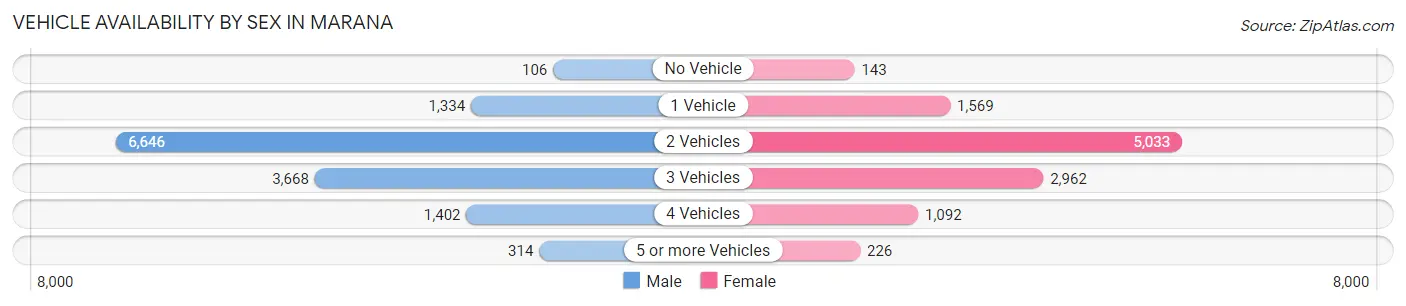
| Vehicles Available | Male | Female |
| No Vehicle | 106 (0.8%) | 143 (1.3%) |
| 1 Vehicle | 1,334 (9.9%) | 1,569 (14.2%) |
| 2 Vehicles | 6,646 (49.3%) | 5,033 (45.7%) |
| 3 Vehicles | 3,668 (27.2%) | 2,962 (26.9%) |
| 4 Vehicles | 1,402 (10.4%) | 1,092 (9.9%) |
| 5 or more Vehicles | 314 (2.3%) | 226 (2.1%) |
| Total | 13,470 (100.0%) | 11,025 (100.0%) |
Commute Time in Marana
The most frequently occuring commute durations in Marana are 30 to 34 minutes (4,518 commuters, 22.8%), 20 to 24 minutes (3,407 commuters, 17.2%), and 25 to 29 minutes (2,304 commuters, 11.7%).
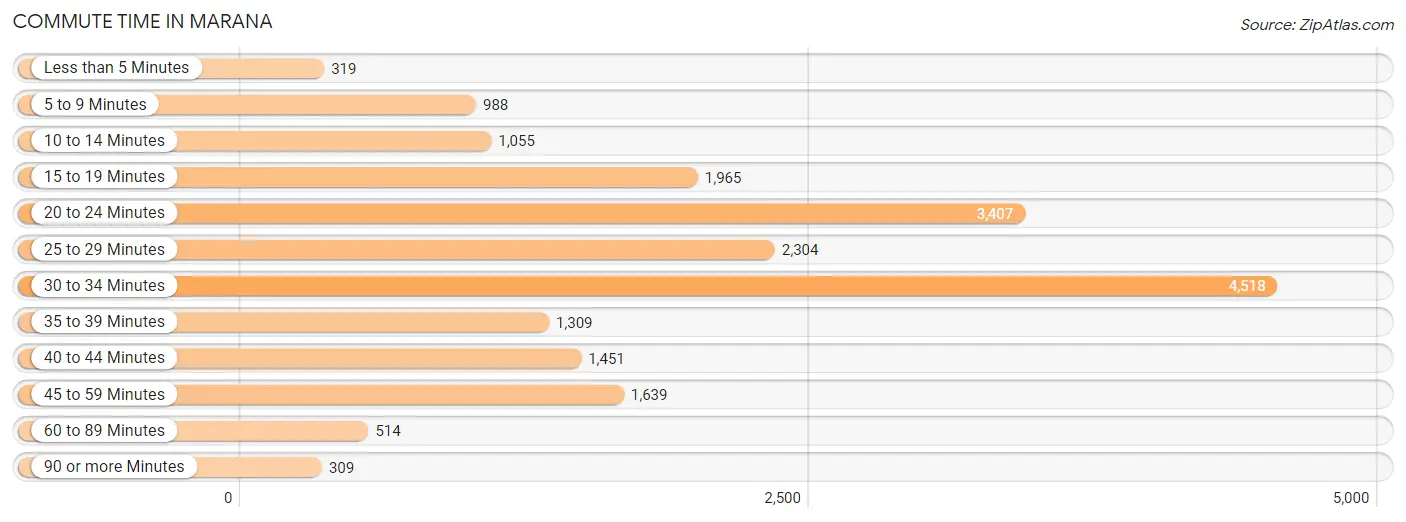
| Commute Time | # Commuters | % Commuters |
| Less than 5 Minutes | 319 | 1.6% |
| 5 to 9 Minutes | 988 | 5.0% |
| 10 to 14 Minutes | 1,055 | 5.3% |
| 15 to 19 Minutes | 1,965 | 9.9% |
| 20 to 24 Minutes | 3,407 | 17.2% |
| 25 to 29 Minutes | 2,304 | 11.7% |
| 30 to 34 Minutes | 4,518 | 22.8% |
| 35 to 39 Minutes | 1,309 | 6.6% |
| 40 to 44 Minutes | 1,451 | 7.3% |
| 45 to 59 Minutes | 1,639 | 8.3% |
| 60 to 89 Minutes | 514 | 2.6% |
| 90 or more Minutes | 309 | 1.6% |
Commute Time by Sex in Marana
The most common commute times in Marana are 30 to 34 minutes (2,389 commuters, 21.2%) for males and 30 to 34 minutes (2,129 commuters, 25.0%) for females.
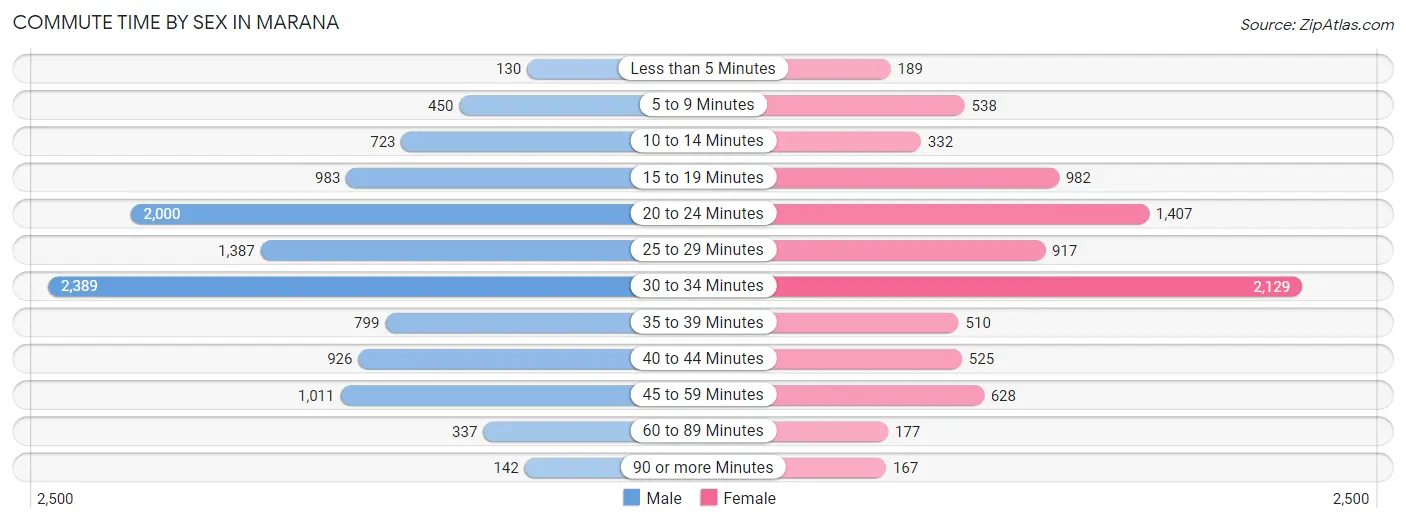
| Commute Time | Male | Female |
| Less than 5 Minutes | 130 (1.1%) | 189 (2.2%) |
| 5 to 9 Minutes | 450 (4.0%) | 538 (6.3%) |
| 10 to 14 Minutes | 723 (6.4%) | 332 (3.9%) |
| 15 to 19 Minutes | 983 (8.7%) | 982 (11.6%) |
| 20 to 24 Minutes | 2,000 (17.7%) | 1,407 (16.6%) |
| 25 to 29 Minutes | 1,387 (12.3%) | 917 (10.8%) |
| 30 to 34 Minutes | 2,389 (21.2%) | 2,129 (25.0%) |
| 35 to 39 Minutes | 799 (7.1%) | 510 (6.0%) |
| 40 to 44 Minutes | 926 (8.2%) | 525 (6.2%) |
| 45 to 59 Minutes | 1,011 (9.0%) | 628 (7.4%) |
| 60 to 89 Minutes | 337 (3.0%) | 177 (2.1%) |
| 90 or more Minutes | 142 (1.3%) | 167 (2.0%) |
Time of Departure to Work by Sex in Marana
The most frequent times of departure to work in Marana are 7:00 AM to 7:29 AM (1,860, 16.5%) for males and 7:00 AM to 7:29 AM (1,515, 17.8%) for females.
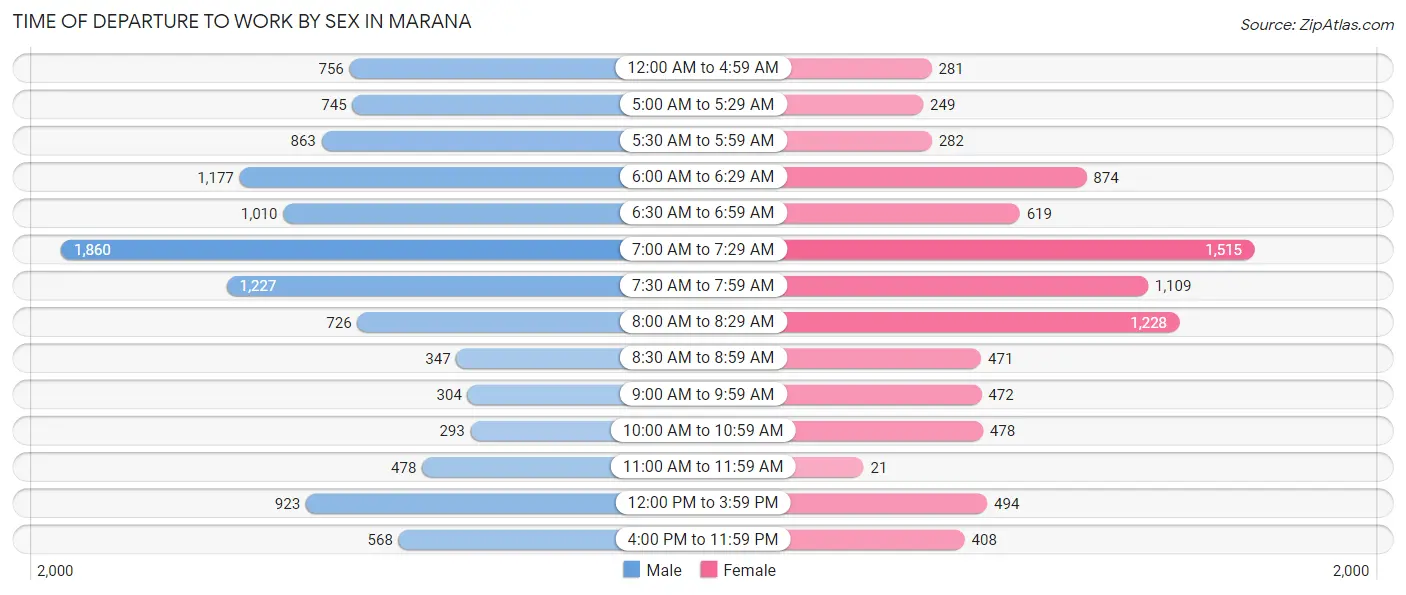
| Time of Departure | Male | Female |
| 12:00 AM to 4:59 AM | 756 (6.7%) | 281 (3.3%) |
| 5:00 AM to 5:29 AM | 745 (6.6%) | 249 (2.9%) |
| 5:30 AM to 5:59 AM | 863 (7.6%) | 282 (3.3%) |
| 6:00 AM to 6:29 AM | 1,177 (10.4%) | 874 (10.3%) |
| 6:30 AM to 6:59 AM | 1,010 (9.0%) | 619 (7.3%) |
| 7:00 AM to 7:29 AM | 1,860 (16.5%) | 1,515 (17.8%) |
| 7:30 AM to 7:59 AM | 1,227 (10.9%) | 1,109 (13.1%) |
| 8:00 AM to 8:29 AM | 726 (6.4%) | 1,228 (14.4%) |
| 8:30 AM to 8:59 AM | 347 (3.1%) | 471 (5.5%) |
| 9:00 AM to 9:59 AM | 304 (2.7%) | 472 (5.6%) |
| 10:00 AM to 10:59 AM | 293 (2.6%) | 478 (5.6%) |
| 11:00 AM to 11:59 AM | 478 (4.2%) | 21 (0.3%) |
| 12:00 PM to 3:59 PM | 923 (8.2%) | 494 (5.8%) |
| 4:00 PM to 11:59 PM | 568 (5.0%) | 408 (4.8%) |
| Total | 11,277 (100.0%) | 8,501 (100.0%) |
Housing Occupancy in Marana
Occupancy by Ownership in Marana
Of the total 19,949 dwellings in Marana, owner-occupied units account for 16,524 (82.8%), while renter-occupied units make up 3,425 (17.2%).
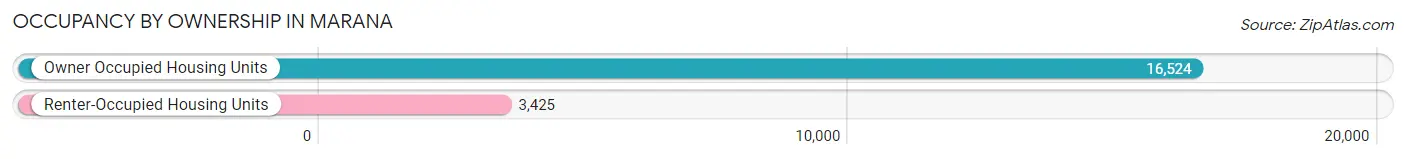
| Occupancy | # Housing Units | % Housing Units |
| Owner Occupied Housing Units | 16,524 | 82.8% |
| Renter-Occupied Housing Units | 3,425 | 17.2% |
| Total Occupied Housing Units | 19,949 | 100.0% |
Occupancy by Household Size in Marana
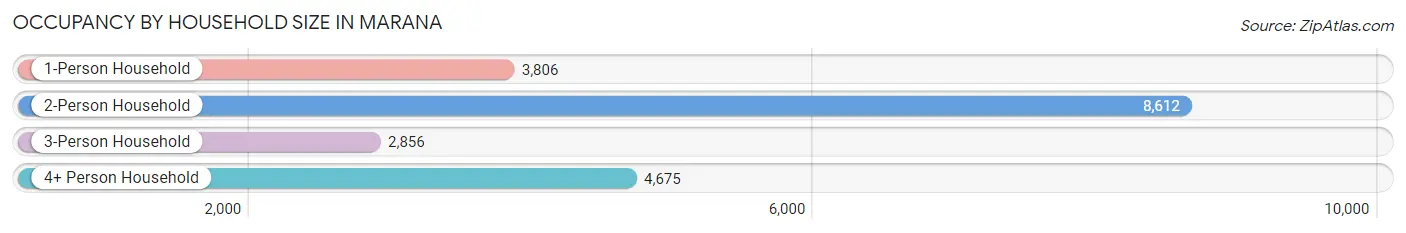
| Household Size | # Housing Units | % Housing Units |
| 1-Person Household | 3,806 | 19.1% |
| 2-Person Household | 8,612 | 43.2% |
| 3-Person Household | 2,856 | 14.3% |
| 4+ Person Household | 4,675 | 23.4% |
| Total Housing Units | 19,949 | 100.0% |
Occupancy by Ownership by Household Size in Marana
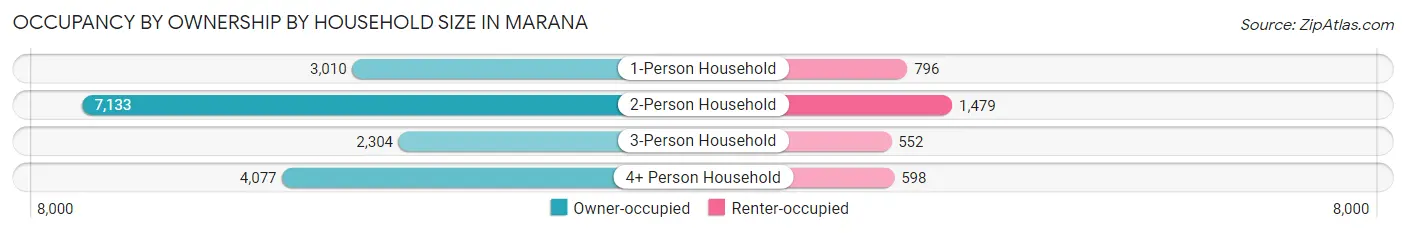
| Household Size | Owner-occupied | Renter-occupied |
| 1-Person Household | 3,010 (79.1%) | 796 (20.9%) |
| 2-Person Household | 7,133 (82.8%) | 1,479 (17.2%) |
| 3-Person Household | 2,304 (80.7%) | 552 (19.3%) |
| 4+ Person Household | 4,077 (87.2%) | 598 (12.8%) |
| Total Housing Units | 16,524 (82.8%) | 3,425 (17.2%) |
Occupancy by Educational Attainment in Marana
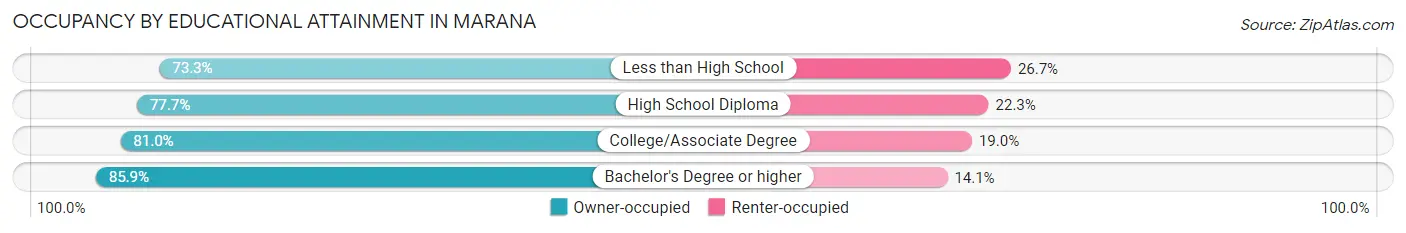
| Household Size | Owner-occupied | Renter-occupied |
| Less than High School | 299 (73.3%) | 109 (26.7%) |
| High School Diploma | 2,235 (77.7%) | 641 (22.3%) |
| College/Associate Degree | 5,319 (81.0%) | 1,248 (19.0%) |
| Bachelor's Degree or higher | 8,671 (85.9%) | 1,427 (14.1%) |
Occupancy by Age of Householder in Marana
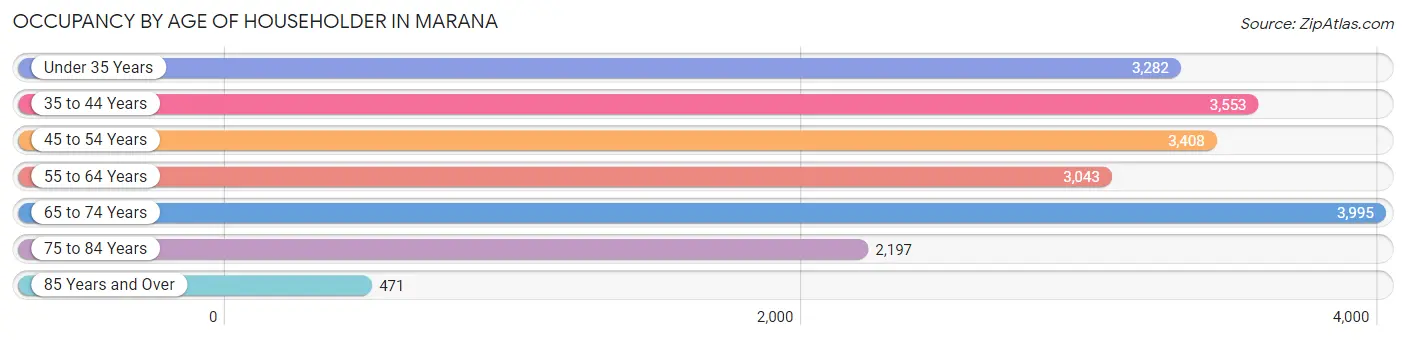
| Age Bracket | # Households | % Households |
| Under 35 Years | 3,282 | 16.5% |
| 35 to 44 Years | 3,553 | 17.8% |
| 45 to 54 Years | 3,408 | 17.1% |
| 55 to 64 Years | 3,043 | 15.2% |
| 65 to 74 Years | 3,995 | 20.0% |
| 75 to 84 Years | 2,197 | 11.0% |
| 85 Years and Over | 471 | 2.4% |
| Total | 19,949 | 100.0% |
Housing Finances in Marana
Median Income by Occupancy in Marana
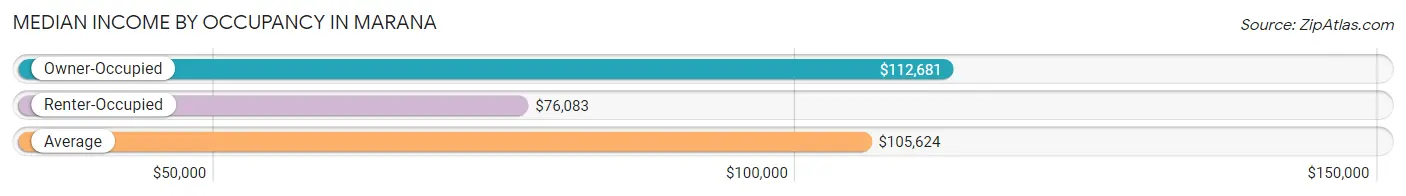
| Occupancy Type | # Households | Median Income |
| Owner-Occupied | 16,524 (82.8%) | $112,681 |
| Renter-Occupied | 3,425 (17.2%) | $76,083 |
| Average | 19,949 (100.0%) | $105,624 |
Occupancy by Householder Income Bracket in Marana
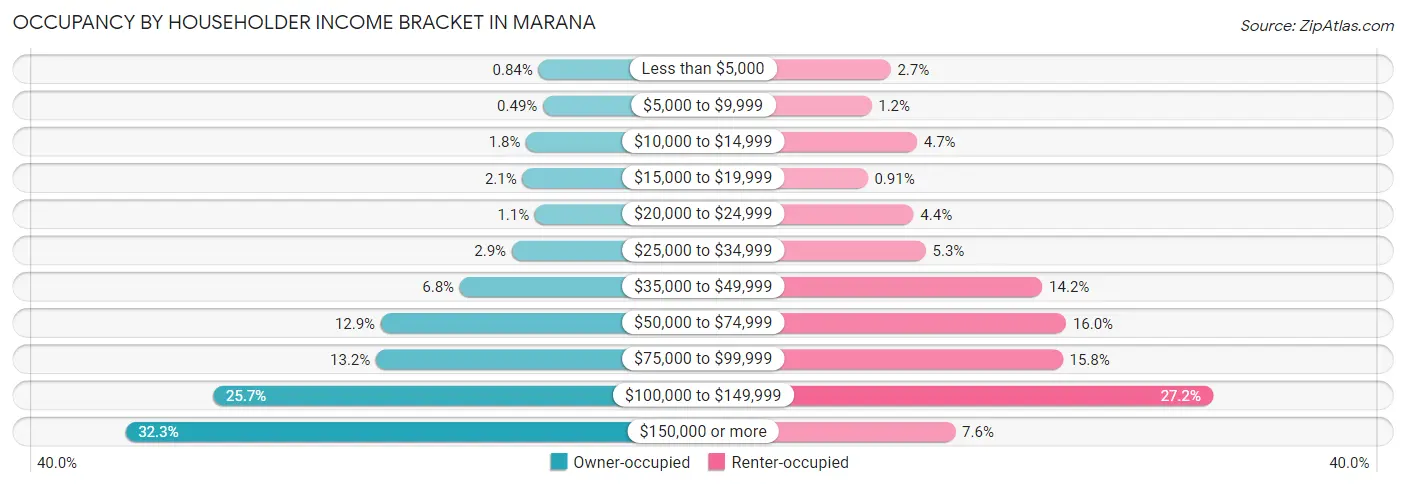
| Income Bracket | Owner-occupied | Renter-occupied |
| Less than $5,000 | 138 (0.8%) | 91 (2.7%) |
| $5,000 to $9,999 | 81 (0.5%) | 41 (1.2%) |
| $10,000 to $14,999 | 292 (1.8%) | 160 (4.7%) |
| $15,000 to $19,999 | 341 (2.1%) | 31 (0.9%) |
| $20,000 to $24,999 | 183 (1.1%) | 151 (4.4%) |
| $25,000 to $34,999 | 474 (2.9%) | 183 (5.3%) |
| $35,000 to $49,999 | 1,128 (6.8%) | 487 (14.2%) |
| $50,000 to $74,999 | 2,123 (12.9%) | 549 (16.0%) |
| $75,000 to $99,999 | 2,184 (13.2%) | 540 (15.8%) |
| $100,000 to $149,999 | 4,238 (25.7%) | 932 (27.2%) |
| $150,000 or more | 5,342 (32.3%) | 260 (7.6%) |
| Total | 16,524 (100.0%) | 3,425 (100.0%) |
Monthly Housing Cost Tiers in Marana
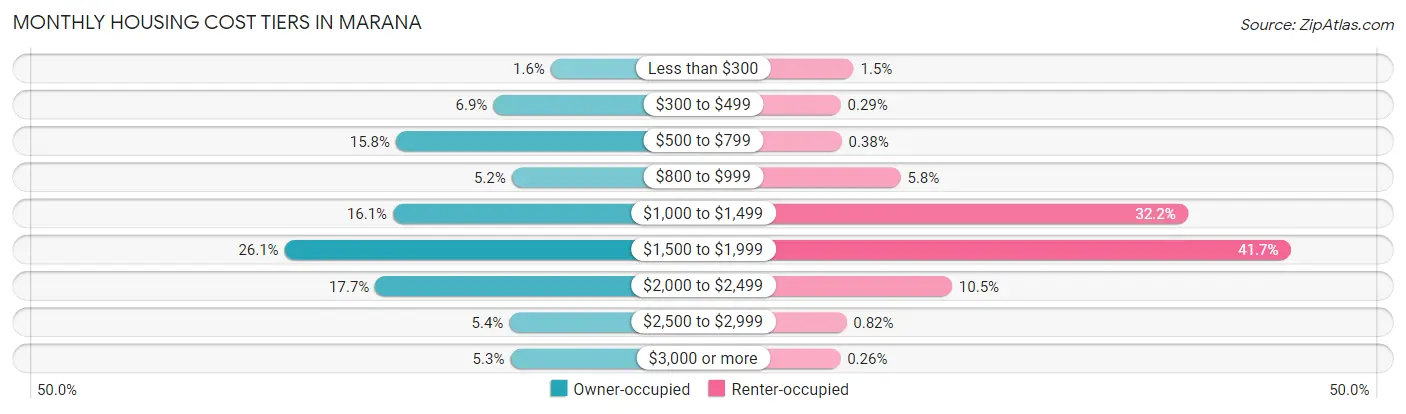
| Monthly Cost | Owner-occupied | Renter-occupied |
| Less than $300 | 260 (1.6%) | 51 (1.5%) |
| $300 to $499 | 1,133 (6.9%) | 10 (0.3%) |
| $500 to $799 | 2,615 (15.8%) | 13 (0.4%) |
| $800 to $999 | 854 (5.2%) | 199 (5.8%) |
| $1,000 to $1,499 | 2,659 (16.1%) | 1,104 (32.2%) |
| $1,500 to $1,999 | 4,309 (26.1%) | 1,428 (41.7%) |
| $2,000 to $2,499 | 2,930 (17.7%) | 361 (10.5%) |
| $2,500 to $2,999 | 890 (5.4%) | 28 (0.8%) |
| $3,000 or more | 874 (5.3%) | 9 (0.3%) |
| Total | 16,524 (100.0%) | 3,425 (100.0%) |
Physical Housing Characteristics in Marana
Housing Structures in Marana
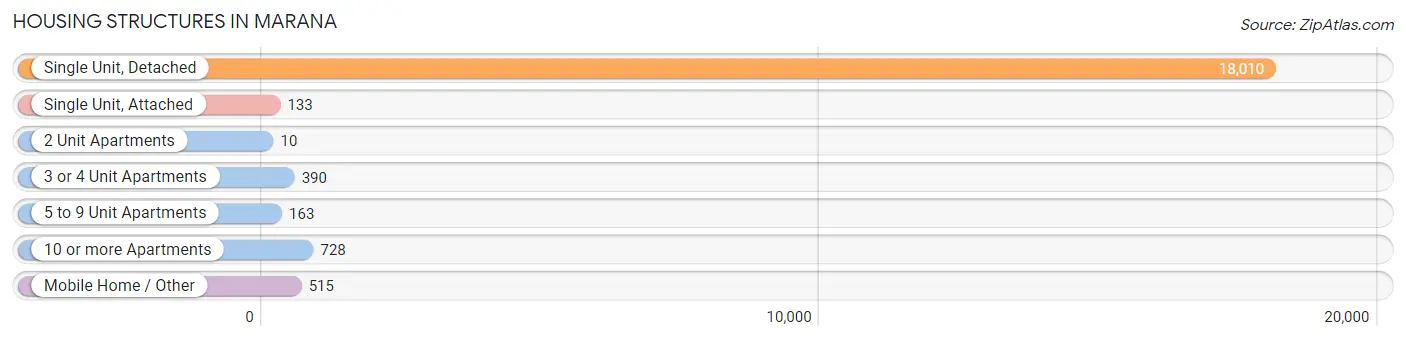
| Structure Type | # Housing Units | % Housing Units |
| Single Unit, Detached | 18,010 | 90.3% |
| Single Unit, Attached | 133 | 0.7% |
| 2 Unit Apartments | 10 | 0.1% |
| 3 or 4 Unit Apartments | 390 | 1.9% |
| 5 to 9 Unit Apartments | 163 | 0.8% |
| 10 or more Apartments | 728 | 3.6% |
| Mobile Home / Other | 515 | 2.6% |
| Total | 19,949 | 100.0% |
Housing Structures by Occupancy in Marana
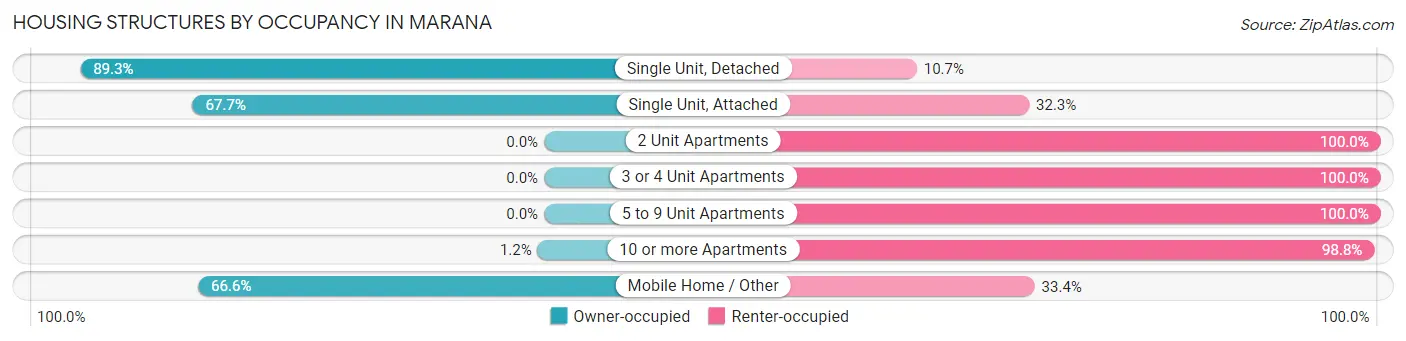
| Structure Type | Owner-occupied | Renter-occupied |
| Single Unit, Detached | 16,082 (89.3%) | 1,928 (10.7%) |
| Single Unit, Attached | 90 (67.7%) | 43 (32.3%) |
| 2 Unit Apartments | 0 (0.0%) | 10 (100.0%) |
| 3 or 4 Unit Apartments | 0 (0.0%) | 390 (100.0%) |
| 5 to 9 Unit Apartments | 0 (0.0%) | 163 (100.0%) |
| 10 or more Apartments | 9 (1.2%) | 719 (98.8%) |
| Mobile Home / Other | 343 (66.6%) | 172 (33.4%) |
| Total | 16,524 (82.8%) | 3,425 (17.2%) |
Housing Structures by Number of Rooms in Marana
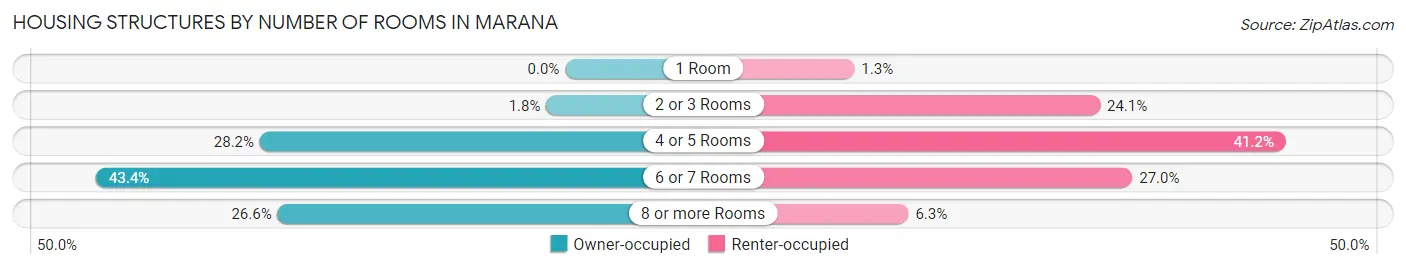
| Number of Rooms | Owner-occupied | Renter-occupied |
| 1 Room | 0 (0.0%) | 46 (1.3%) |
| 2 or 3 Rooms | 289 (1.8%) | 824 (24.1%) |
| 4 or 5 Rooms | 4,667 (28.2%) | 1,412 (41.2%) |
| 6 or 7 Rooms | 7,171 (43.4%) | 926 (27.0%) |
| 8 or more Rooms | 4,397 (26.6%) | 217 (6.3%) |
| Total | 16,524 (100.0%) | 3,425 (100.0%) |
Housing Structure by Heating Type in Marana
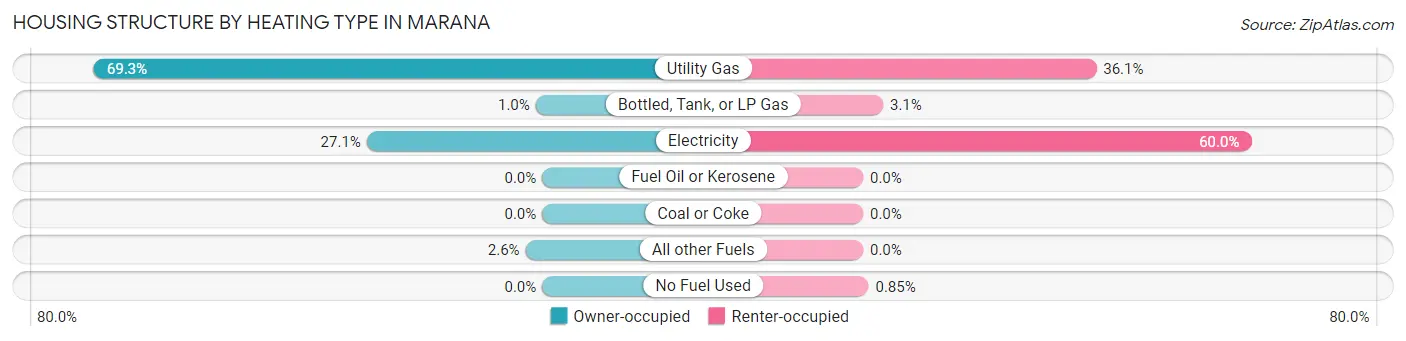
| Heating Type | Owner-occupied | Renter-occupied |
| Utility Gas | 11,449 (69.3%) | 1,235 (36.1%) |
| Bottled, Tank, or LP Gas | 166 (1.0%) | 106 (3.1%) |
| Electricity | 4,482 (27.1%) | 2,055 (60.0%) |
| Fuel Oil or Kerosene | 0 (0.0%) | 0 (0.0%) |
| Coal or Coke | 0 (0.0%) | 0 (0.0%) |
| All other Fuels | 427 (2.6%) | 0 (0.0%) |
| No Fuel Used | 0 (0.0%) | 29 (0.9%) |
| Total | 16,524 (100.0%) | 3,425 (100.0%) |
Household Vehicle Usage in Marana
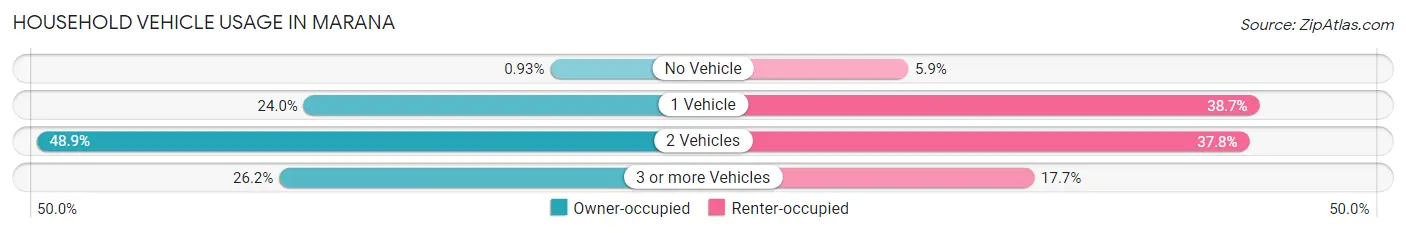
| Vehicles per Household | Owner-occupied | Renter-occupied |
| No Vehicle | 154 (0.9%) | 202 (5.9%) |
| 1 Vehicle | 3,958 (23.9%) | 1,325 (38.7%) |
| 2 Vehicles | 8,076 (48.9%) | 1,293 (37.8%) |
| 3 or more Vehicles | 4,336 (26.2%) | 605 (17.7%) |
| Total | 16,524 (100.0%) | 3,425 (100.0%) |
Real Estate & Mortgages in Marana
Real Estate and Mortgage Overview in Marana
| Characteristic | Without Mortgage | With Mortgage |
| Housing Units | 4,589 | 11,935 |
| Median Property Value | $348,600 | $347,400 |
| Median Household Income | $85,735 | $4,230 |
| Monthly Housing Costs | $610 | $874 |
| Real Estate Taxes | $3,531 | $240 |
Property Value by Mortgage Status in Marana
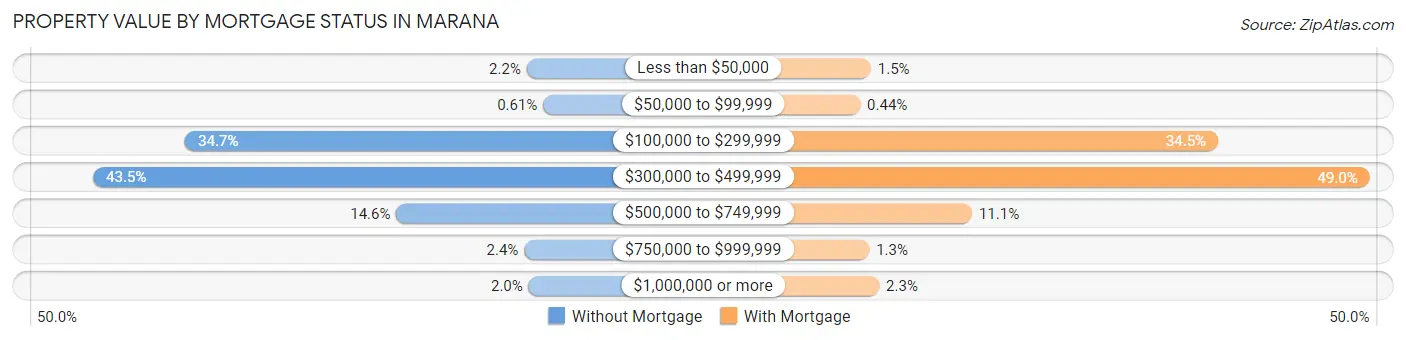
| Property Value | Without Mortgage | With Mortgage |
| Less than $50,000 | 100 (2.2%) | 174 (1.5%) |
| $50,000 to $99,999 | 28 (0.6%) | 52 (0.4%) |
| $100,000 to $299,999 | 1,593 (34.7%) | 4,119 (34.5%) |
| $300,000 to $499,999 | 1,995 (43.5%) | 5,843 (49.0%) |
| $500,000 to $749,999 | 670 (14.6%) | 1,324 (11.1%) |
| $750,000 to $999,999 | 111 (2.4%) | 155 (1.3%) |
| $1,000,000 or more | 92 (2.0%) | 268 (2.2%) |
| Total | 4,589 (100.0%) | 11,935 (100.0%) |
Household Income by Mortgage Status in Marana
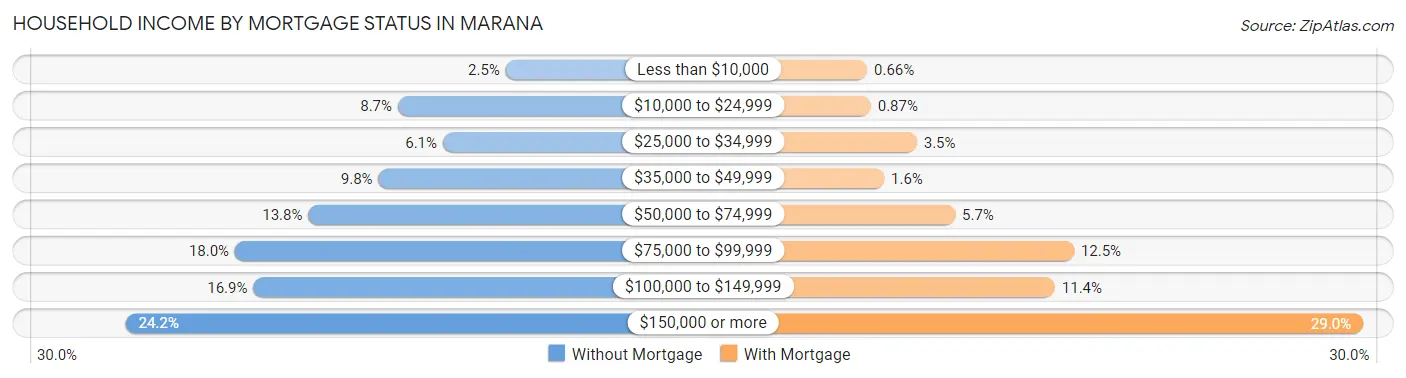
| Household Income | Without Mortgage | With Mortgage |
| Less than $10,000 | 115 (2.5%) | 79 (0.7%) |
| $10,000 to $24,999 | 398 (8.7%) | 104 (0.9%) |
| $25,000 to $34,999 | 280 (6.1%) | 418 (3.5%) |
| $35,000 to $49,999 | 449 (9.8%) | 194 (1.6%) |
| $50,000 to $74,999 | 633 (13.8%) | 679 (5.7%) |
| $75,000 to $99,999 | 825 (18.0%) | 1,490 (12.5%) |
| $100,000 to $149,999 | 777 (16.9%) | 1,359 (11.4%) |
| $150,000 or more | 1,112 (24.2%) | 3,461 (29.0%) |
| Total | 4,589 (100.0%) | 11,935 (100.0%) |
Property Value to Household Income Ratio in Marana
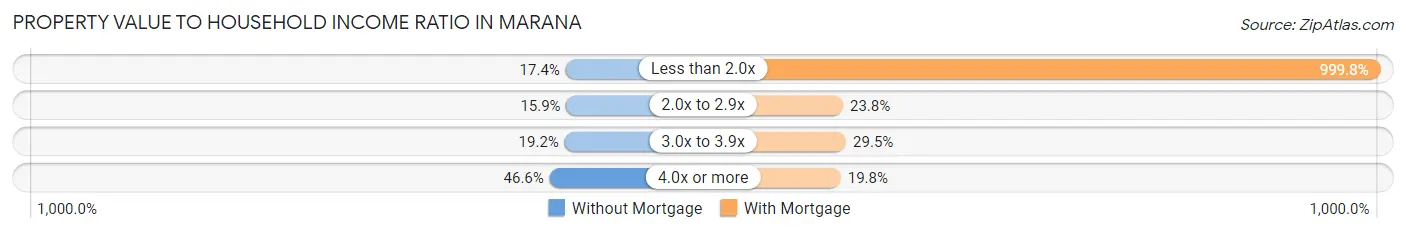
| Value-to-Income Ratio | Without Mortgage | With Mortgage |
| Less than 2.0x | 799 (17.4%) | 119,327 (999.8%) |
| 2.0x to 2.9x | 731 (15.9%) | 2,841 (23.8%) |
| 3.0x to 3.9x | 880 (19.2%) | 3,518 (29.5%) |
| 4.0x or more | 2,136 (46.6%) | 2,357 (19.8%) |
| Total | 4,589 (100.0%) | 11,935 (100.0%) |
Real Estate Taxes by Mortgage Status in Marana
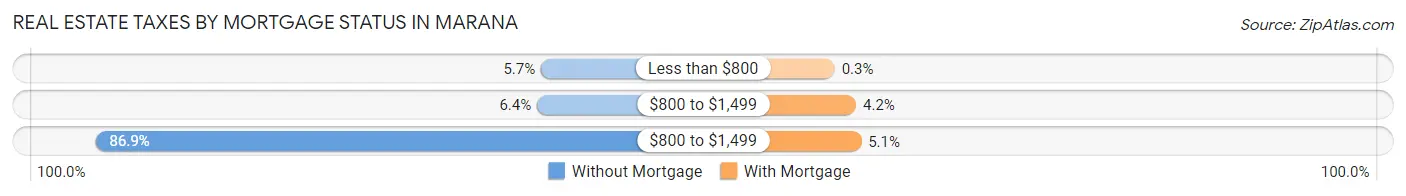
| Property Taxes | Without Mortgage | With Mortgage |
| Less than $800 | 260 (5.7%) | 36 (0.3%) |
| $800 to $1,499 | 294 (6.4%) | 503 (4.2%) |
| $800 to $1,499 | 3,987 (86.9%) | 614 (5.1%) |
| Total | 4,589 (100.0%) | 11,935 (100.0%) |
Health & Disability in Marana
Health Insurance Coverage by Age in Marana
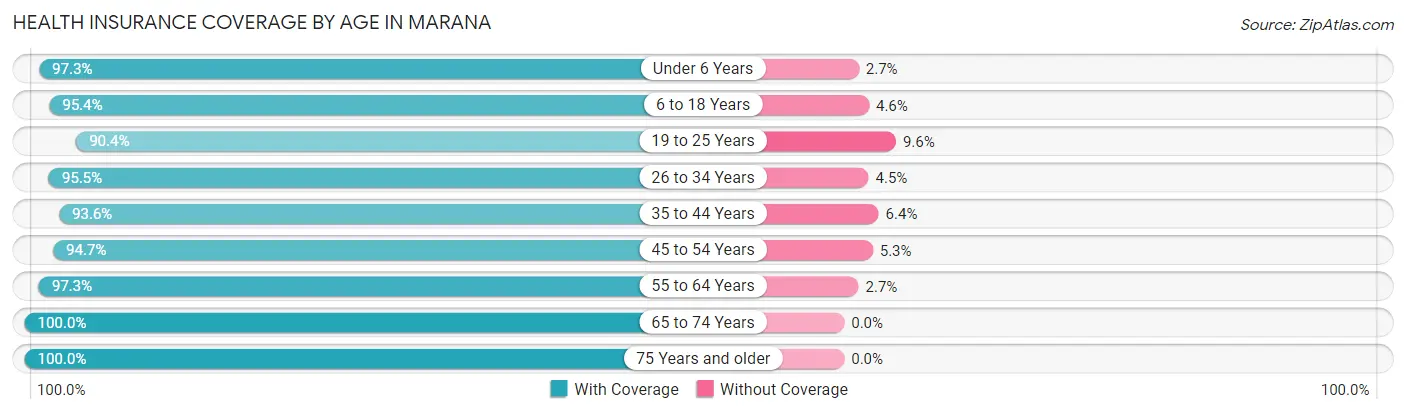
| Age Bracket | With Coverage | Without Coverage |
| Under 6 Years | 3,646 (97.3%) | 102 (2.7%) |
| 6 to 18 Years | 8,302 (95.4%) | 401 (4.6%) |
| 19 to 25 Years | 2,756 (90.4%) | 294 (9.6%) |
| 26 to 34 Years | 5,058 (95.5%) | 240 (4.5%) |
| 35 to 44 Years | 6,981 (93.6%) | 478 (6.4%) |
| 45 to 54 Years | 5,684 (94.7%) | 319 (5.3%) |
| 55 to 64 Years | 5,786 (97.3%) | 158 (2.7%) |
| 65 to 74 Years | 6,820 (100.0%) | 0 (0.0%) |
| 75 Years and older | 4,540 (100.0%) | 0 (0.0%) |
| Total | 49,573 (96.1%) | 1,992 (3.9%) |
Health Insurance Coverage by Citizenship Status in Marana
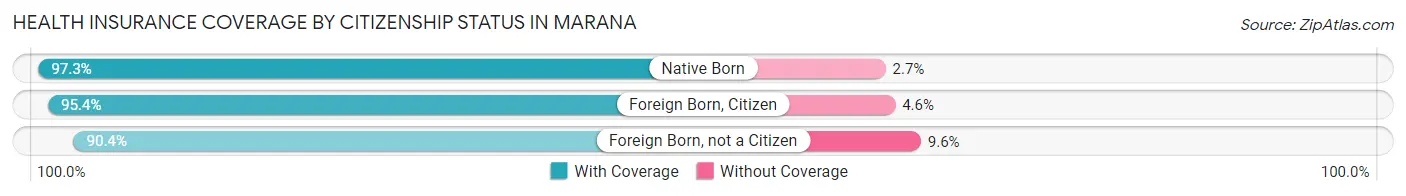
| Citizenship Status | With Coverage | Without Coverage |
| Native Born | 3,646 (97.3%) | 102 (2.7%) |
| Foreign Born, Citizen | 8,302 (95.4%) | 401 (4.6%) |
| Foreign Born, not a Citizen | 2,756 (90.4%) | 294 (9.6%) |
Health Insurance Coverage by Household Income in Marana
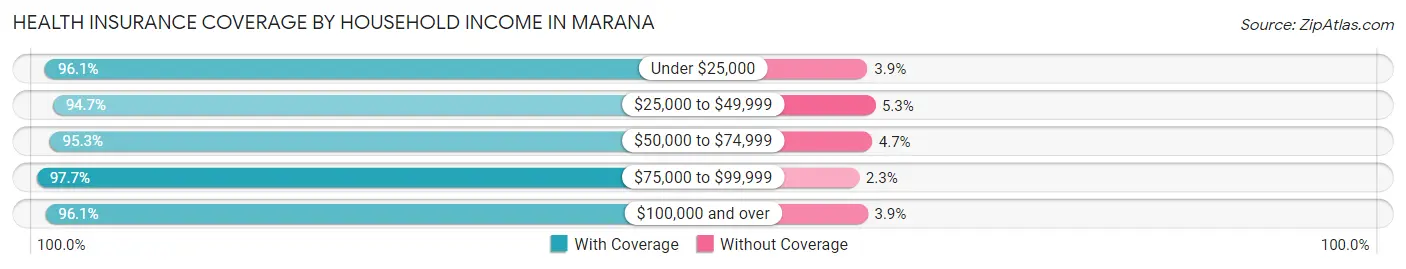
| Household Income | With Coverage | Without Coverage |
| Under $25,000 | 2,740 (96.1%) | 110 (3.9%) |
| $25,000 to $49,999 | 4,063 (94.7%) | 226 (5.3%) |
| $50,000 to $74,999 | 5,254 (95.3%) | 259 (4.7%) |
| $75,000 to $99,999 | 6,795 (97.7%) | 158 (2.3%) |
| $100,000 and over | 30,707 (96.1%) | 1,238 (3.9%) |
Public vs Private Health Insurance Coverage by Age in Marana
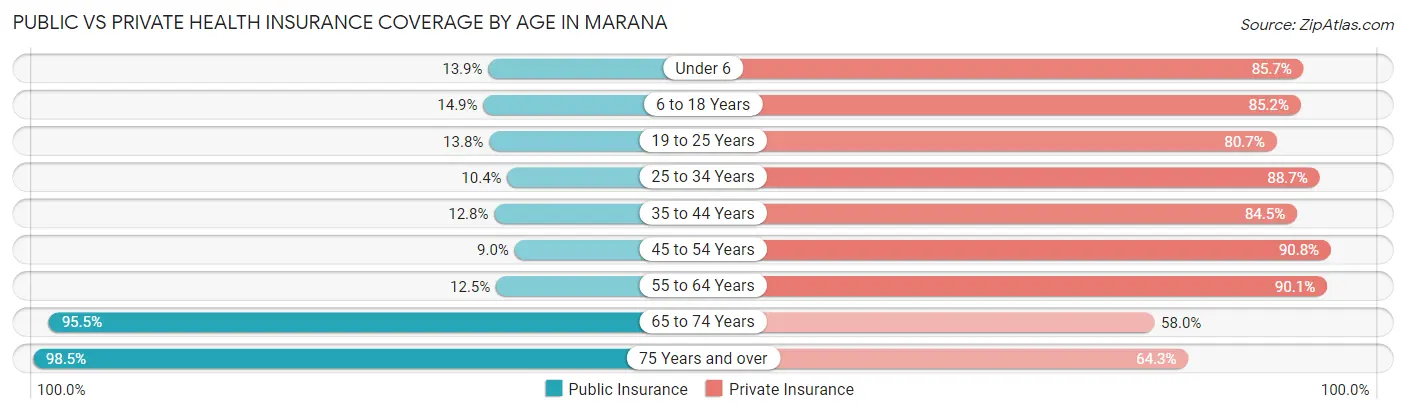
| Age Bracket | Public Insurance | Private Insurance |
| Under 6 | 522 (13.9%) | 3,213 (85.7%) |
| 6 to 18 Years | 1,292 (14.8%) | 7,414 (85.2%) |
| 19 to 25 Years | 420 (13.8%) | 2,461 (80.7%) |
| 25 to 34 Years | 550 (10.4%) | 4,698 (88.7%) |
| 35 to 44 Years | 956 (12.8%) | 6,302 (84.5%) |
| 45 to 54 Years | 542 (9.0%) | 5,450 (90.8%) |
| 55 to 64 Years | 742 (12.5%) | 5,354 (90.1%) |
| 65 to 74 Years | 6,514 (95.5%) | 3,954 (58.0%) |
| 75 Years and over | 4,470 (98.5%) | 2,920 (64.3%) |
| Total | 16,008 (31.0%) | 41,766 (81.0%) |
Disability Status by Sex by Age in Marana
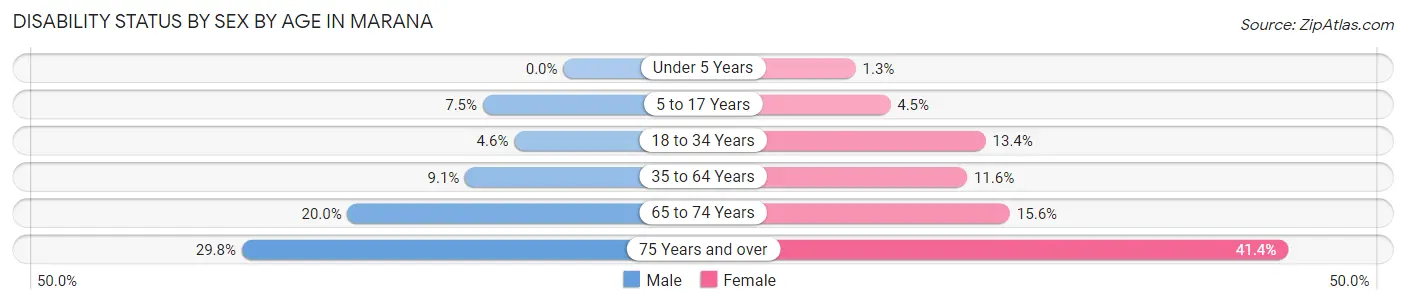
| Age Bracket | Male | Female |
| Under 5 Years | 0 (0.0%) | 24 (1.3%) |
| 5 to 17 Years | 319 (7.5%) | 201 (4.5%) |
| 18 to 34 Years | 185 (4.6%) | 646 (13.4%) |
| 35 to 64 Years | 907 (9.1%) | 1,098 (11.6%) |
| 65 to 74 Years | 621 (20.0%) | 580 (15.6%) |
| 75 Years and over | 689 (29.8%) | 924 (41.4%) |
Disability Class by Sex by Age in Marana
Disability Class: Hearing Difficulty
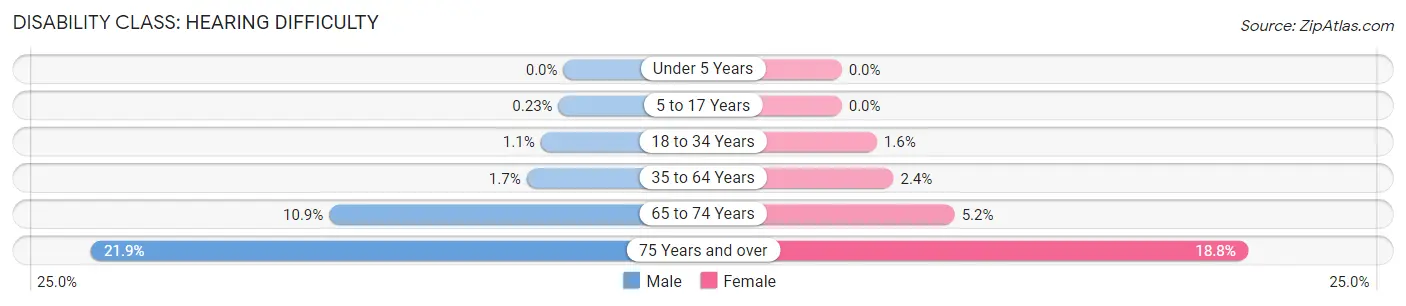
| Age Bracket | Male | Female |
| Under 5 Years | 0 (0.0%) | 0 (0.0%) |
| 5 to 17 Years | 10 (0.2%) | 0 (0.0%) |
| 18 to 34 Years | 43 (1.1%) | 79 (1.6%) |
| 35 to 64 Years | 170 (1.7%) | 227 (2.4%) |
| 65 to 74 Years | 337 (10.9%) | 195 (5.2%) |
| 75 Years and over | 506 (21.9%) | 420 (18.8%) |
Disability Class: Vision Difficulty
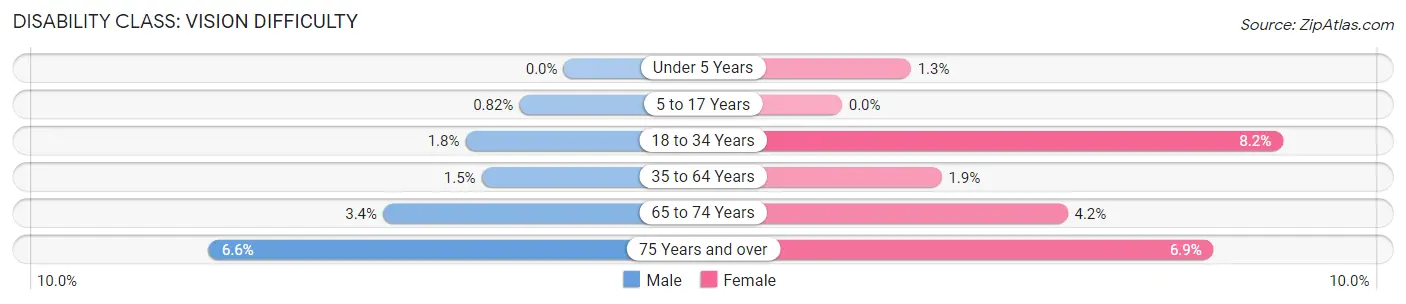
| Age Bracket | Male | Female |
| Under 5 Years | 0 (0.0%) | 24 (1.3%) |
| 5 to 17 Years | 35 (0.8%) | 0 (0.0%) |
| 18 to 34 Years | 74 (1.8%) | 396 (8.2%) |
| 35 to 64 Years | 151 (1.5%) | 175 (1.8%) |
| 65 to 74 Years | 104 (3.4%) | 156 (4.2%) |
| 75 Years and over | 152 (6.6%) | 154 (6.9%) |
Disability Class: Cognitive Difficulty
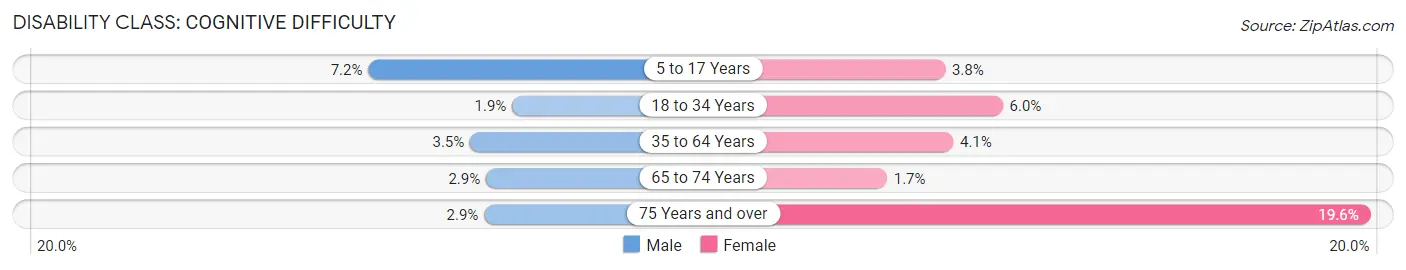
| Age Bracket | Male | Female |
| 5 to 17 Years | 309 (7.2%) | 171 (3.8%) |
| 18 to 34 Years | 77 (1.9%) | 289 (6.0%) |
| 35 to 64 Years | 345 (3.5%) | 390 (4.1%) |
| 65 to 74 Years | 89 (2.9%) | 62 (1.7%) |
| 75 Years and over | 68 (2.9%) | 438 (19.6%) |
Disability Class: Ambulatory Difficulty
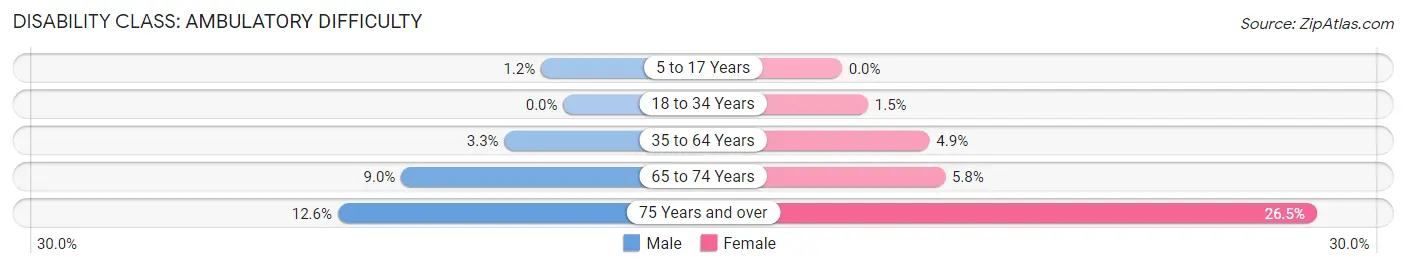
| Age Bracket | Male | Female |
| 5 to 17 Years | 53 (1.2%) | 0 (0.0%) |
| 18 to 34 Years | 0 (0.0%) | 70 (1.5%) |
| 35 to 64 Years | 327 (3.3%) | 461 (4.9%) |
| 65 to 74 Years | 280 (9.0%) | 214 (5.8%) |
| 75 Years and over | 290 (12.6%) | 590 (26.5%) |
Disability Class: Self-Care Difficulty
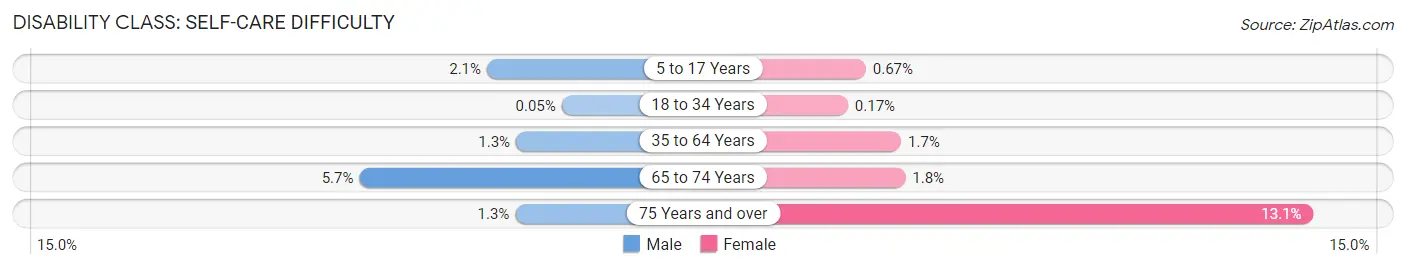
| Age Bracket | Male | Female |
| 5 to 17 Years | 91 (2.1%) | 30 (0.7%) |
| 18 to 34 Years | 2 (0.1%) | 8 (0.2%) |
| 35 to 64 Years | 131 (1.3%) | 156 (1.7%) |
| 65 to 74 Years | 176 (5.7%) | 66 (1.8%) |
| 75 Years and over | 31 (1.3%) | 293 (13.1%) |
Technology Access in Marana
Computing Device Access in Marana
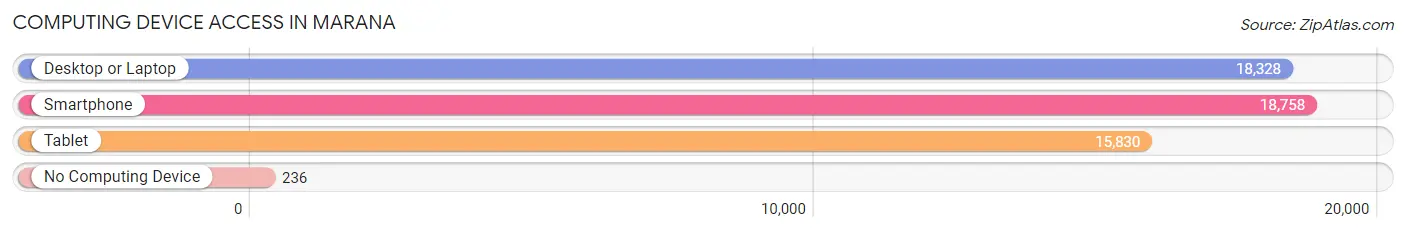
| Device Type | # Households | % Households |
| Desktop or Laptop | 18,328 | 91.9% |
| Smartphone | 18,758 | 94.0% |
| Tablet | 15,830 | 79.3% |
| No Computing Device | 236 | 1.2% |
| Total | 19,949 | 100.0% |
Internet Access in Marana
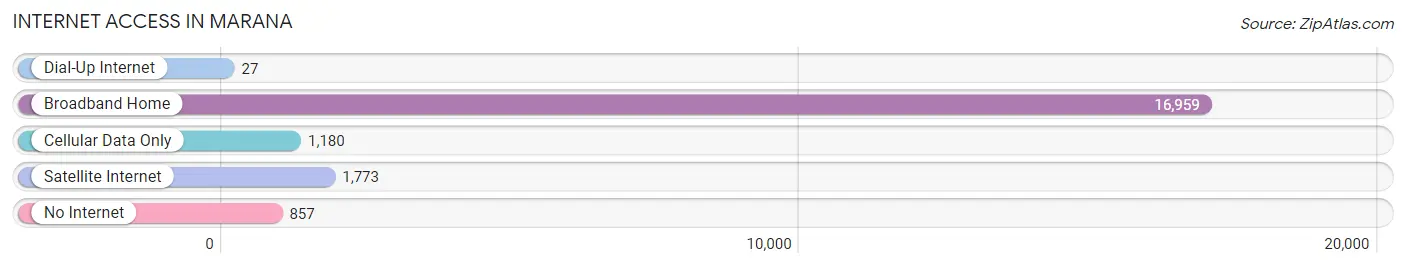
| Internet Type | # Households | % Households |
| Dial-Up Internet | 27 | 0.1% |
| Broadband Home | 16,959 | 85.0% |
| Cellular Data Only | 1,180 | 5.9% |
| Satellite Internet | 1,773 | 8.9% |
| No Internet | 857 | 4.3% |
| Total | 19,949 | 100.0% |
Marana Summary
Marana is a town located in Pima County, Arizona, United States. It is situated northwest of Tucson, and is a part of the Tucson metropolitan area. As of the 2010 census, the population of Marana was 34,961, an increase of 186.7% from the 2000 census population of 12,206.
Geography
Marana is located at 32°25'17" North, 111°7'45" West (32.4214, -111.1293). According to the United States Census Bureau, the town has a total area of 81.2 square miles (210.2 km2), of which 81.1 square miles (210.1 km2) is land and 0.1 square miles (0.2 km2) (0.12%) is water.
Marana is located in the Sonoran Desert, and is bordered by the Tortolita Mountains to the north, the Santa Catalina Mountains to the east, and the Tucson Mountains to the south. The town is located along Interstate 10, which runs through the center of town.
History
Marana was first settled by the Hohokam people, who built irrigation canals in the area. The area was later settled by Spanish missionaries in the late 1700s. The town was officially founded in 1881, when the Southern Pacific Railroad built a line through the area. The town was named after the Spanish word for "thicket," in reference to the thick vegetation in the area.
In the early 1900s, Marana was a small farming community, with cotton, citrus, and alfalfa being the main crops. The town was incorporated in 1977, and has since grown rapidly, due to its proximity to Tucson and its access to Interstate 10.
Economy
Marana's economy is largely based on agriculture, manufacturing, and tourism. The town is home to several large agricultural operations, including cotton, citrus, and alfalfa farms. The town is also home to several manufacturing companies, including Honeywell, Raytheon, and Caterpillar.
Marana is also a popular tourist destination, due to its proximity to Tucson and its access to Interstate 10. The town is home to several golf courses, as well as the Arizona-Sonora Desert Museum, which is a popular attraction.
Demographics
As of the 2010 census, there were 34,961 people, 11,845 households, and 8,945 families residing in the town. The population density was 431.3 people per square mile (166.3/km2). There were 12,845 housing units at an average density of 158.2 per square mile (61.1/km2). The racial makeup of the town was 77.2% White, 1.7% African American, 1.2% Native American, 0.9% Asian, 0.1% Pacific Islander, 16.3% from other races, and 3.6% from two or more races. Hispanic or Latino of any race were 44.2% of the population.
There were 11,845 households, out of which 37.2% had children under the age of 18 living with them, 56.2% were married couples living together, 12.7% had a female householder with no husband present, and 25.2% were non-families. 19.7% of all households were made up of individuals, and 6.2% had someone living alone who was 65 years of age or older. The average household size was 2.93 and the average family size was 3.37.
In the town, the population was spread out, with 28.7% under the age of 18, 8.7% from 18 to 24, 28.3% from 25 to 44, 24.2% from 45 to 64, and 10.1% who were 65 years of age or older. The median age was 34 years. For every 100 females, there were 97.2 males. For every 100 females age 18 and over, there were 94.2 males.
The median income for a household in the town was $45,837, and the median income for a family was $50,945. Males had a median income of $36,945 versus $27,813 for females. The per capita income for the town was $20,845. About 8.3% of families and 11.2% of the population were below the poverty line, including 15.2% of those under age 18 and 6.2% of those age 65 or over.
Common Questions
What is Per Capita Income in Marana?
Per Capita income in Marana is $48,157.
What is the Median Family Income in Marana?
Median Family Income in Marana is $113,262.
What is the Median Household income in Marana?
Median Household Income in Marana is $105,624.
What is Income or Wage Gap in Marana?
Income or Wage Gap in Marana is 33.2%.
Women in Marana earn 66.8 cents for every dollar earned by a man.
What is Inequality or Gini Index in Marana?
Inequality or Gini Index in Marana is 0.39.
What is the Total Population of Marana?
Total Population of Marana is 52,542.
What is the Total Male Population of Marana?
Total Male Population of Marana is 25,916.
What is the Total Female Population of Marana?
Total Female Population of Marana is 26,626.
What is the Ratio of Males per 100 Females in Marana?
There are 97.33 Males per 100 Females in Marana.
What is the Ratio of Females per 100 Males in Marana?
There are 102.74 Females per 100 Males in Marana.
What is the Median Population Age in Marana?
Median Population Age in Marana is 41.4 Years.
What is the Average Family Size in Marana
Average Family Size in Marana is 3.0 People.
What is the Average Household Size in Marana
Average Household Size in Marana is 2.6 People.
How Large is the Labor Force in Marana?
There are 25,958 People in the Labor Forcein in Marana.
What is the Percentage of People in the Labor Force in Marana?
62.1% of People are in the Labor Force in Marana.
What is the Unemployment Rate in Marana?
Unemployment Rate in Marana is 4.1%.