Elliston, VA Map & Demographics
Elliston Map
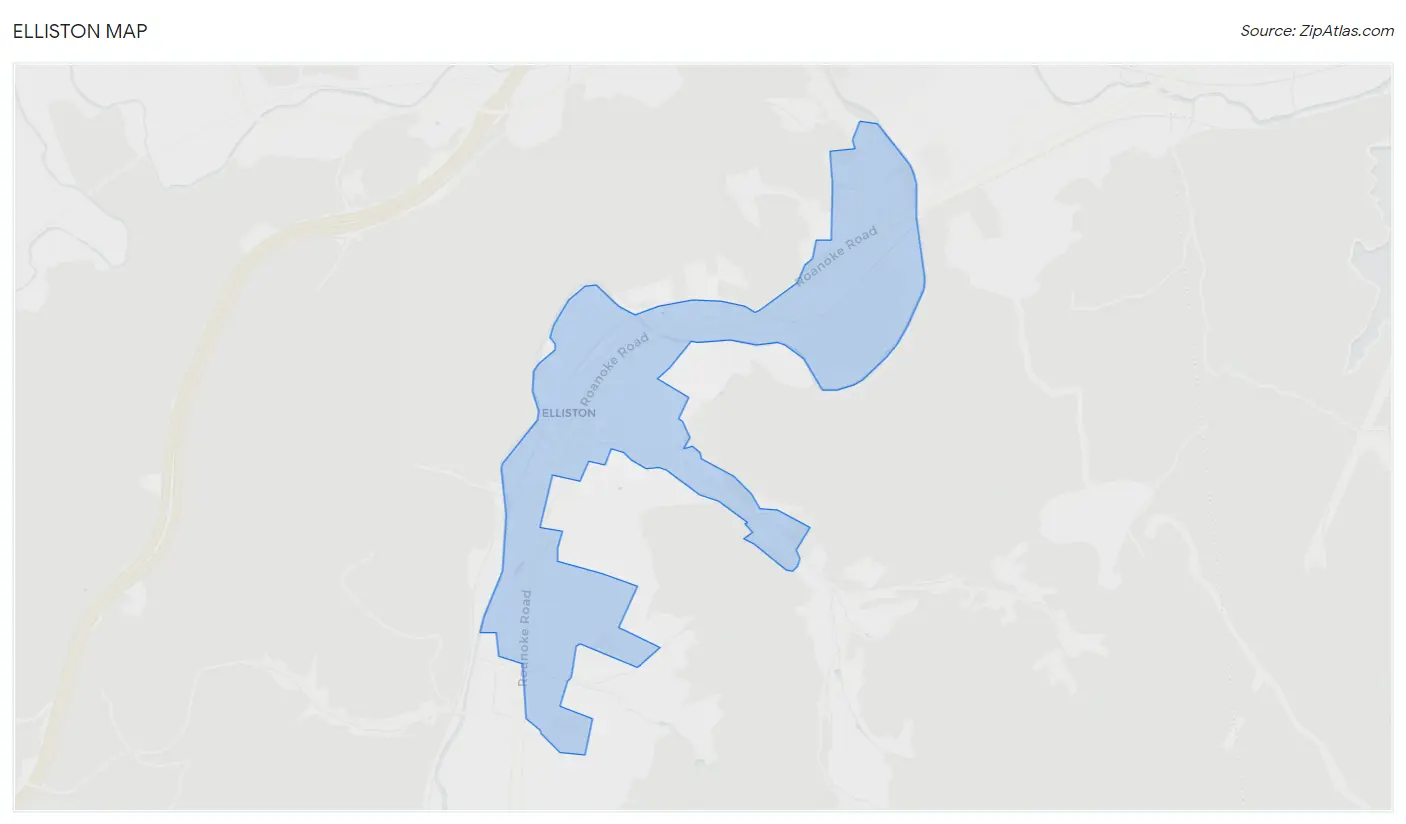
Elliston Overview
$23,847
PER CAPITA INCOME
$33,870
AVG HOUSEHOLD INCOME
0.47
INEQUALITY / GINI INDEX
1,092
TOTAL POPULATION
438
MALE POPULATION
654
FEMALE POPULATION
66.97
MALES / 100 FEMALES
149.32
FEMALES / 100 MALES
23.1
MEDIAN AGE
4.0
AVG FAMILY SIZE
3.2
AVG HOUSEHOLD SIZE
391
LABOR FORCE [ PEOPLE ]
47.7%
PERCENT IN LABOR FORCE
Elliston Zip Codes
Elliston Area Codes
Income in Elliston
Income Overview in Elliston
| Characteristic | Number | Measure |
| Per Capita Income | 1,092 | $23,847 |
| Median Family Income | 242 | $0 |
| Mean Family Income | 242 | $94,976 |
| Median Household Income | 343 | $33,870 |
| Mean Household Income | 343 | $77,822 |
| Income Deficit | 242 | $0 |
| Wage / Income Gap (%) | 1,092 | 0.00% |
| Wage / Income Gap ($) | 1,092 | 100.00¢ per $1 |
| Gini / Inequality Index | 1,092 | 0.47 |
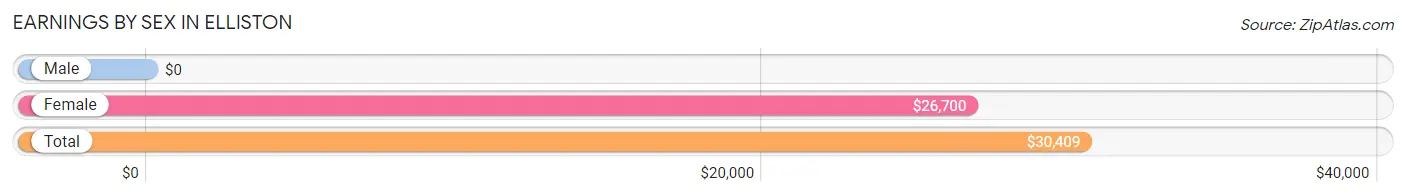
Earnings by Sex in Elliston
| Sex | Number | Average Earnings |
| Male | 206 (51.8%) | $0 |
| Female | 192 (48.2%) | $26,700 |
| Total | 398 (100.0%) | $30,409 |
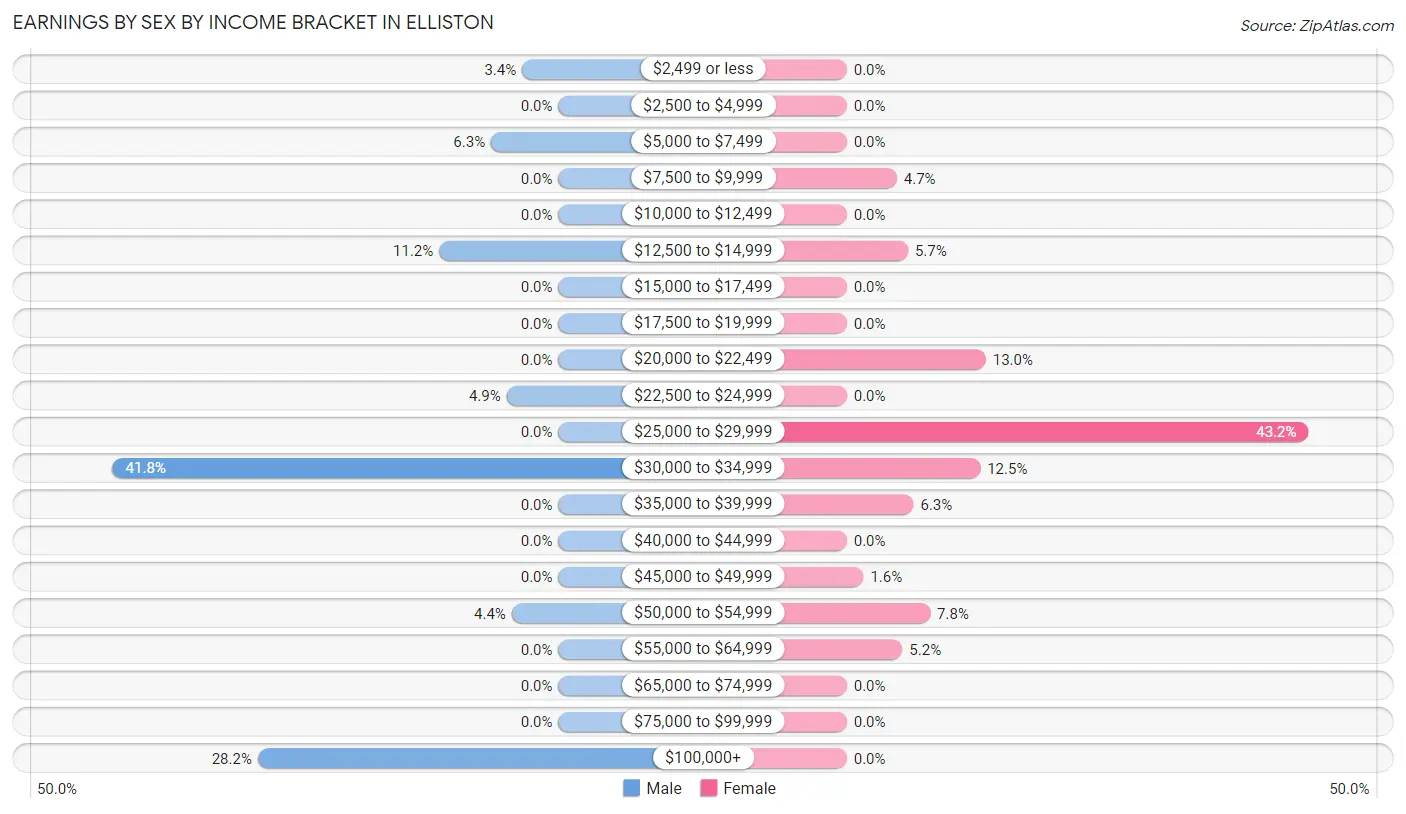
Earnings by Sex by Income Bracket in Elliston
The most common earnings brackets in Elliston are $30,000 to $34,999 for men (86 | 41.7%) and $25,000 to $29,999 for women (83 | 43.2%).
| Income | Male | Female |
| $2,499 or less | 7 (3.4%) | 0 (0.0%) |
| $2,500 to $4,999 | 0 (0.0%) | 0 (0.0%) |
| $5,000 to $7,499 | 13 (6.3%) | 0 (0.0%) |
| $7,500 to $9,999 | 0 (0.0%) | 9 (4.7%) |
| $10,000 to $12,499 | 0 (0.0%) | 0 (0.0%) |
| $12,500 to $14,999 | 23 (11.2%) | 11 (5.7%) |
| $15,000 to $17,499 | 0 (0.0%) | 0 (0.0%) |
| $17,500 to $19,999 | 0 (0.0%) | 0 (0.0%) |
| $20,000 to $22,499 | 0 (0.0%) | 25 (13.0%) |
| $22,500 to $24,999 | 10 (4.9%) | 0 (0.0%) |
| $25,000 to $29,999 | 0 (0.0%) | 83 (43.2%) |
| $30,000 to $34,999 | 86 (41.7%) | 24 (12.5%) |
| $35,000 to $39,999 | 0 (0.0%) | 12 (6.2%) |
| $40,000 to $44,999 | 0 (0.0%) | 0 (0.0%) |
| $45,000 to $49,999 | 0 (0.0%) | 3 (1.6%) |
| $50,000 to $54,999 | 9 (4.4%) | 15 (7.8%) |
| $55,000 to $64,999 | 0 (0.0%) | 10 (5.2%) |
| $65,000 to $74,999 | 0 (0.0%) | 0 (0.0%) |
| $75,000 to $99,999 | 0 (0.0%) | 0 (0.0%) |
| $100,000+ | 58 (28.2%) | 0 (0.0%) |
| Total | 206 (100.0%) | 192 (100.0%) |
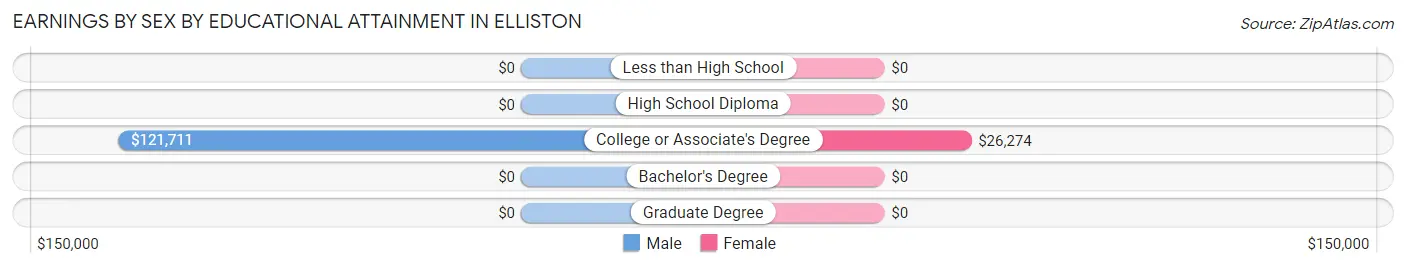
Earnings by Sex by Educational Attainment in Elliston
| Educational Attainment | Male Income | Female Income |
| Less than High School | - | - |
| High School Diploma | - | - |
| College or Associate's Degree | $121,711 | $26,274 |
| Bachelor's Degree | - | - |
| Graduate Degree | - | - |
| Total | - | - |
Family Income in Elliston
Family Income Brackets in Elliston
According to the Elliston family income data, there are 114 families falling into the $25,000 to $34,999 income range, which is the most common income bracket and makes up 47.1% of all families.
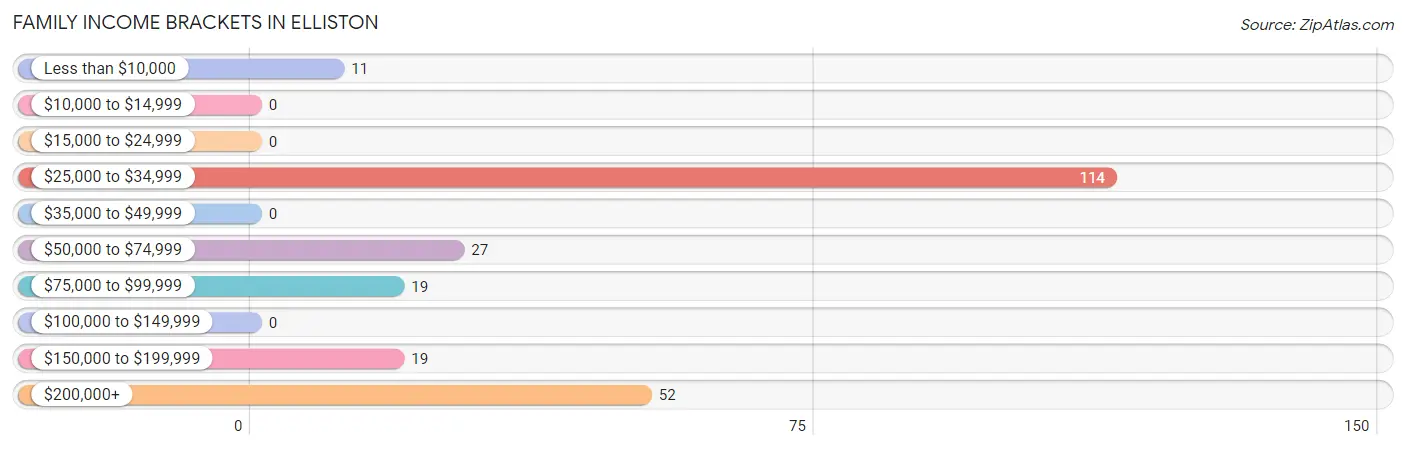
| Income Bracket | # Families | % Families |
| Less than $10,000 | 11 | 4.5% |
| $10,000 to $14,999 | 0 | 0.0% |
| $15,000 to $24,999 | 0 | 0.0% |
| $25,000 to $34,999 | 114 | 47.1% |
| $35,000 to $49,999 | 0 | 0.0% |
| $50,000 to $74,999 | 27 | 11.2% |
| $75,000 to $99,999 | 19 | 7.9% |
| $100,000 to $149,999 | 0 | 0.0% |
| $150,000 to $199,999 | 19 | 7.9% |
| $200,000+ | 52 | 21.5% |
Family Income by Famaliy Size in Elliston
2-person families (70 | 28.9%) account for the highest median family income in Elliston with $228,214 per family, while 2-person families (70 | 28.9%) have the highest median income of $114,107 per family member.
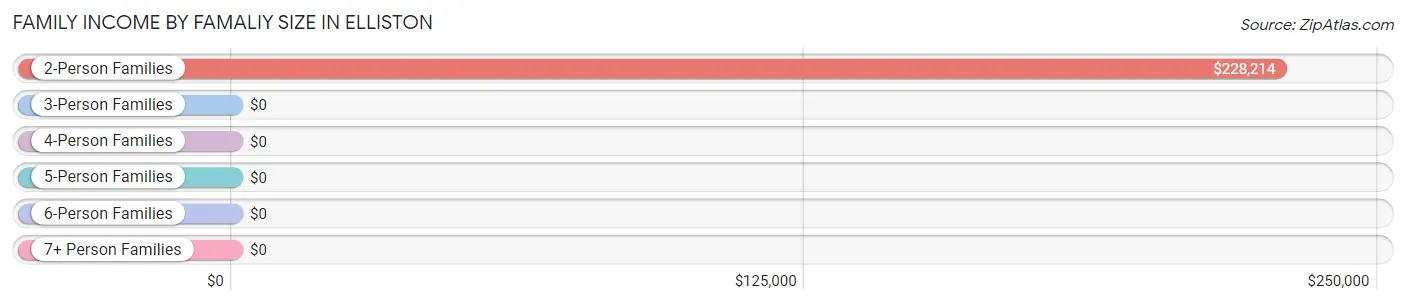
| Income Bracket | # Families | Median Income |
| 2-Person Families | 70 (28.9%) | $228,214 |
| 3-Person Families | 18 (7.4%) | $0 |
| 4-Person Families | 40 (16.5%) | $0 |
| 5-Person Families | 86 (35.5%) | $0 |
| 6-Person Families | 0 (0.0%) | $0 |
| 7+ Person Families | 28 (11.6%) | $0 |
| Total | 242 (100.0%) | $0 |
Family Income by Number of Earners in Elliston
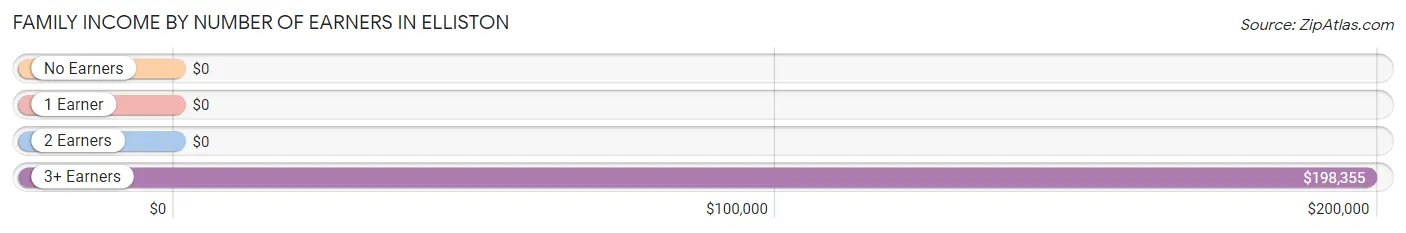
| Number of Earners | # Families | Median Income |
| No Earners | 39 (16.1%) | $0 |
| 1 Earner | 145 (59.9%) | $0 |
| 2 Earners | 27 (11.2%) | $0 |
| 3+ Earners | 31 (12.8%) | $198,355 |
| Total | 242 (100.0%) | $0 |
Household Income in Elliston
Household Income Brackets in Elliston
With 184 households falling in the category, the $25,000 to $34,999 income range is the most frequent in Elliston, accounting for 53.6% of all households.
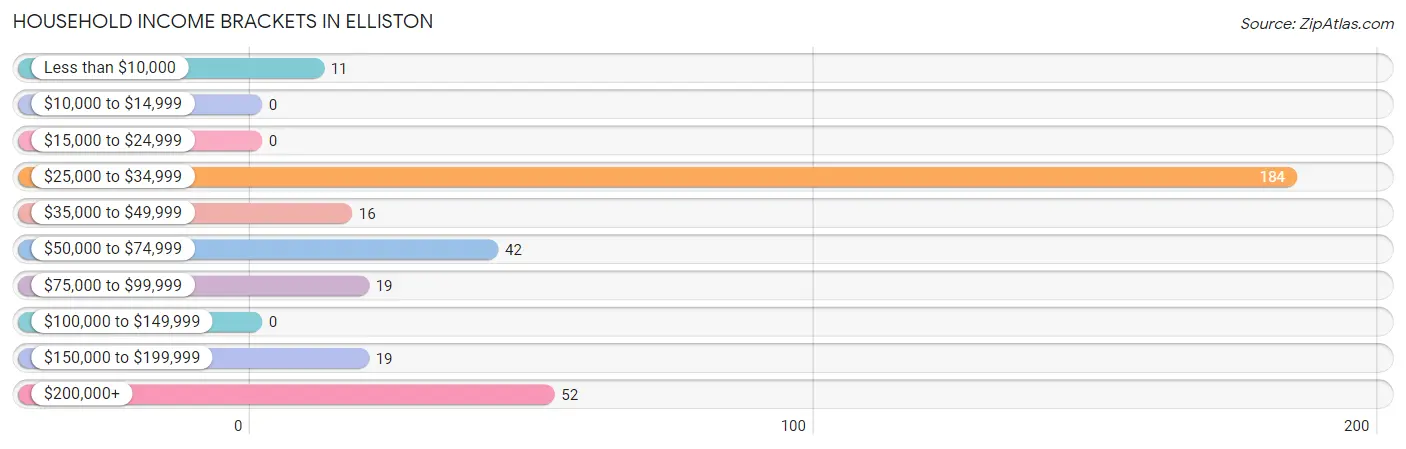
| Income Bracket | # Households | % Households |
| Less than $10,000 | 11 | 3.2% |
| $10,000 to $14,999 | 0 | 0.0% |
| $15,000 to $24,999 | 0 | 0.0% |
| $25,000 to $34,999 | 184 | 53.6% |
| $35,000 to $49,999 | 16 | 4.7% |
| $50,000 to $74,999 | 42 | 12.2% |
| $75,000 to $99,999 | 19 | 5.5% |
| $100,000 to $149,999 | 0 | 0.0% |
| $150,000 to $199,999 | 19 | 5.5% |
| $200,000+ | 52 | 15.2% |
Household Income by Householder Age in Elliston
The median household income in Elliston is $33,870, with the highest median household income of $41,016 found in the 65+ years age bracket for the primary householder. A total of 49 households (14.3%) fall into this category.
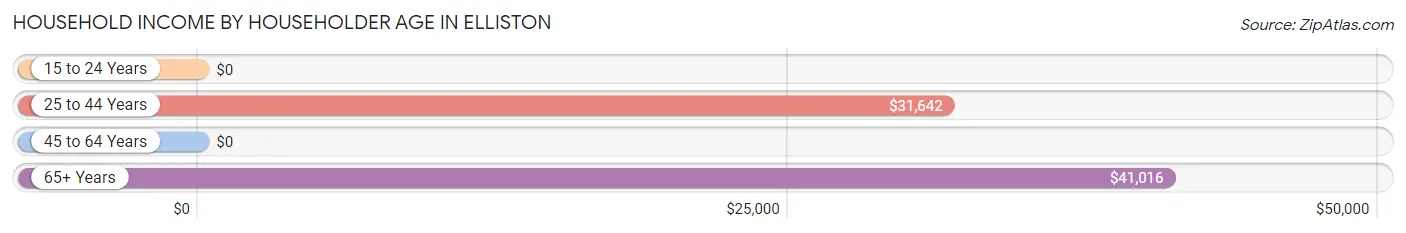
| Income Bracket | # Households | Median Income |
| 15 to 24 Years | 0 (0.0%) | $0 |
| 25 to 44 Years | 113 (32.9%) | $31,642 |
| 45 to 64 Years | 181 (52.8%) | $0 |
| 65+ Years | 49 (14.3%) | $41,016 |
| Total | 343 (100.0%) | $33,870 |
Poverty in Elliston
Income Below Poverty by Sex and Age in Elliston
With 59.8% poverty level for males and 59.8% for females among the residents of Elliston, under 5 year old males and under 5 year old females are the most vulnerable to poverty, with 30 males (100.0%) and 106 females (100.0%) in their respective age groups living below the poverty level.
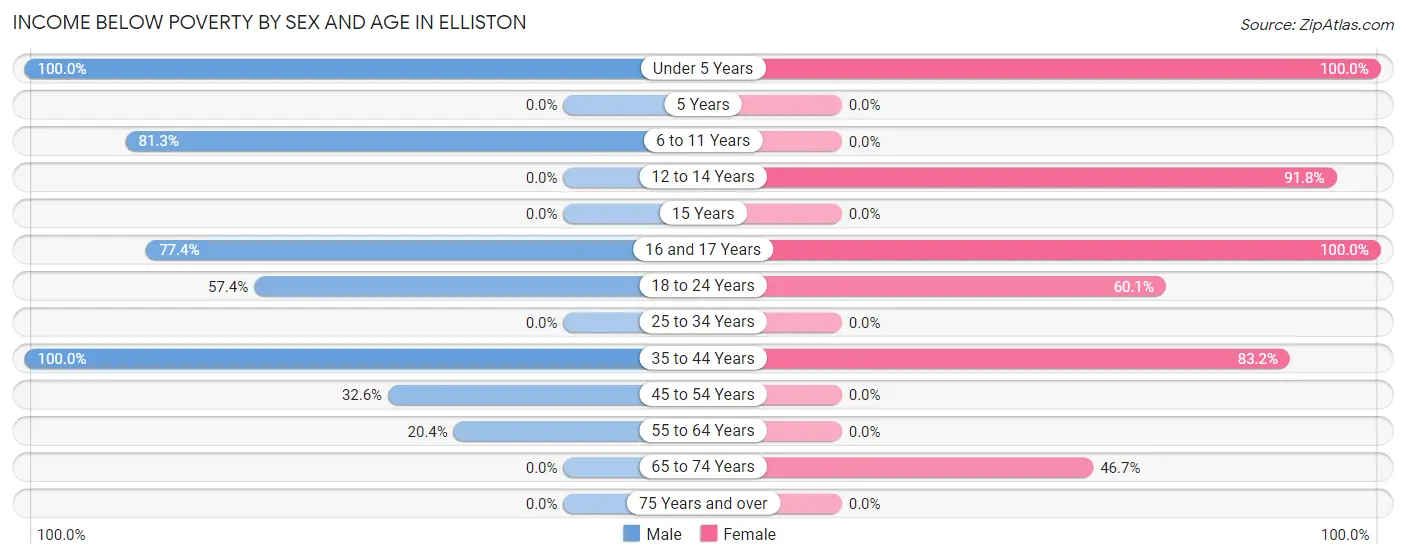
| Age Bracket | Male | Female |
| Under 5 Years | 30 (100.0%) | 106 (100.0%) |
| 5 Years | 0 (0.0%) | 0 (0.0%) |
| 6 to 11 Years | 52 (81.2%) | 0 (0.0%) |
| 12 to 14 Years | 0 (0.0%) | 67 (91.8%) |
| 15 Years | 0 (0.0%) | 0 (0.0%) |
| 16 and 17 Years | 24 (77.4%) | 29 (100.0%) |
| 18 to 24 Years | 31 (57.4%) | 101 (60.1%) |
| 25 to 34 Years | 0 (0.0%) | 0 (0.0%) |
| 35 to 44 Years | 86 (100.0%) | 74 (83.2%) |
| 45 to 54 Years | 28 (32.6%) | 0 (0.0%) |
| 55 to 64 Years | 11 (20.4%) | 0 (0.0%) |
| 65 to 74 Years | 0 (0.0%) | 14 (46.7%) |
| 75 Years and over | 0 (0.0%) | 0 (0.0%) |
| Total | 262 (59.8%) | 391 (59.8%) |
Income Above Poverty by Sex and Age in Elliston
According to the poverty statistics in Elliston, males aged 65 to 74 years and females aged 25 to 34 years are the age groups that are most secure financially, with 100.0% of males and 100.0% of females in these age groups living above the poverty line.
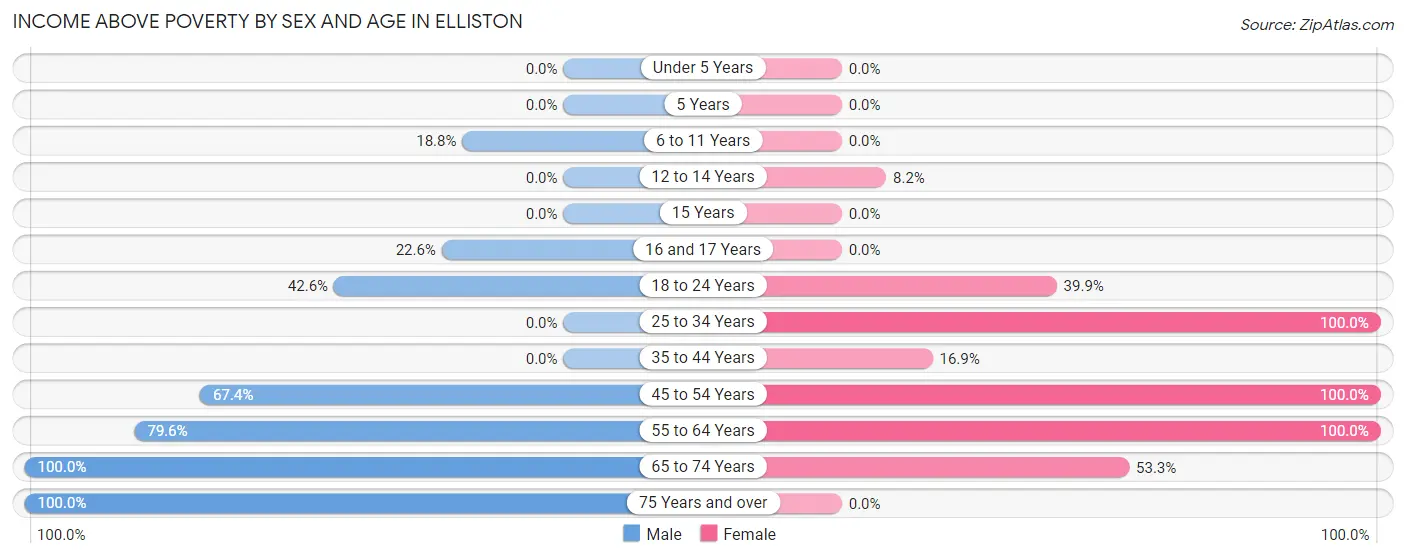
| Age Bracket | Male | Female |
| Under 5 Years | 0 (0.0%) | 0 (0.0%) |
| 5 Years | 0 (0.0%) | 0 (0.0%) |
| 6 to 11 Years | 12 (18.8%) | 0 (0.0%) |
| 12 to 14 Years | 0 (0.0%) | 6 (8.2%) |
| 15 Years | 0 (0.0%) | 0 (0.0%) |
| 16 and 17 Years | 7 (22.6%) | 0 (0.0%) |
| 18 to 24 Years | 23 (42.6%) | 67 (39.9%) |
| 25 to 34 Years | 0 (0.0%) | 12 (100.0%) |
| 35 to 44 Years | 0 (0.0%) | 15 (16.9%) |
| 45 to 54 Years | 58 (67.4%) | 36 (100.0%) |
| 55 to 64 Years | 43 (79.6%) | 111 (100.0%) |
| 65 to 74 Years | 18 (100.0%) | 16 (53.3%) |
| 75 Years and over | 15 (100.0%) | 0 (0.0%) |
| Total | 176 (40.2%) | 263 (40.2%) |
Income Below Poverty Among Married-Couple Families in Elliston
The poverty statistics for married-couple families in Elliston show that 55.9% or 114 of the total 204 families live below the poverty line. Families with 3 or 4 children have the highest poverty rate of 100.0%, comprising of 114 families. On the other hand, families with no children have the lowest poverty rate of 0.0%, which includes 0 families.
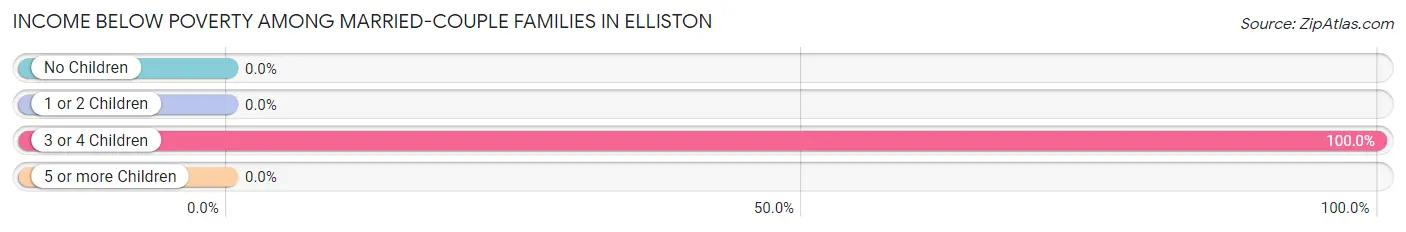
| Children | Above Poverty | Below Poverty |
| No Children | 81 (100.0%) | 0 (0.0%) |
| 1 or 2 Children | 9 (100.0%) | 0 (0.0%) |
| 3 or 4 Children | 0 (0.0%) | 114 (100.0%) |
| 5 or more Children | 0 (0.0%) | 0 (0.0%) |
| Total | 90 (44.1%) | 114 (55.9%) |
Income Below Poverty Among Single-Parent Households in Elliston
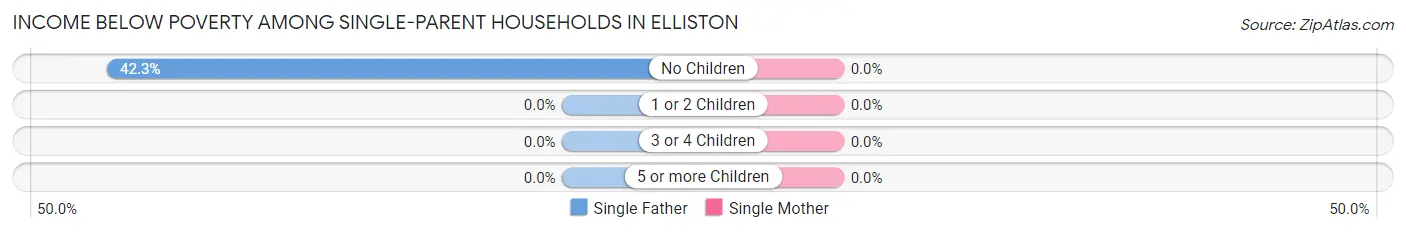
| Children | Single Father | Single Mother |
| No Children | 11 (42.3%) | 0 (0.0%) |
| 1 or 2 Children | 0 (0.0%) | 0 (0.0%) |
| 3 or 4 Children | 0 (0.0%) | 0 (0.0%) |
| 5 or more Children | 0 (0.0%) | 0 (0.0%) |
| Total | 11 (42.3%) | 0 (0.0%) |
Income Below Poverty Among Married-Couple vs Single-Parent Households in Elliston
The poverty data for Elliston shows that 114 of the married-couple family households (55.9%) and 11 of the single-parent households (28.9%) are living below the poverty level. Within the married-couple family households, those with 3 or 4 children have the highest poverty rate, with 114 households (100.0%) falling below the poverty line. Among the single-parent households, those with no children have the highest poverty rate, with 11 household (42.3%) living below poverty.
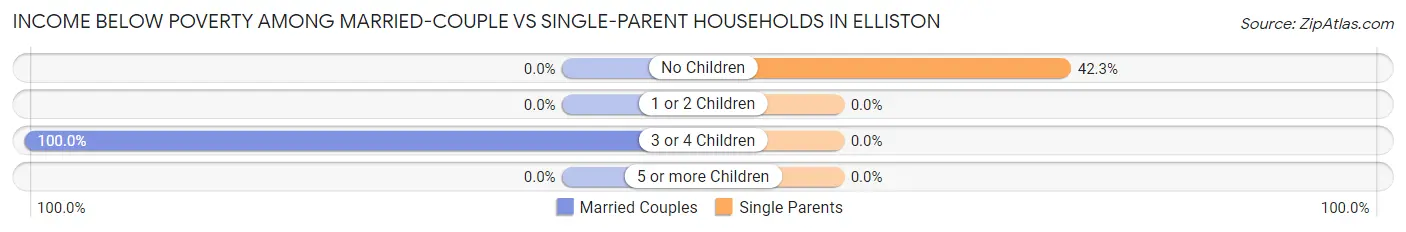
| Children | Married-Couple Families | Single-Parent Households |
| No Children | 0 (0.0%) | 11 (42.3%) |
| 1 or 2 Children | 0 (0.0%) | 0 (0.0%) |
| 3 or 4 Children | 114 (100.0%) | 0 (0.0%) |
| 5 or more Children | 0 (0.0%) | 0 (0.0%) |
| Total | 114 (55.9%) | 11 (28.9%) |
Race in Elliston
The most populous races in Elliston are White / Caucasian (727 | 66.6%), Hispanic or Latino (373 | 34.2%), and Some other Race (365 | 33.4%).
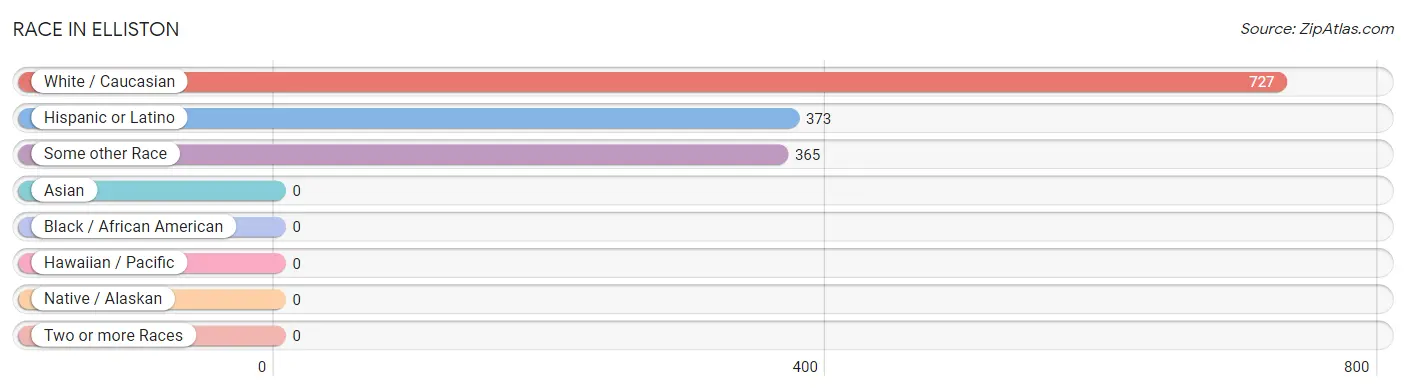
| Race | # Population | % Population |
| Asian | 0 | 0.0% |
| Black / African American | 0 | 0.0% |
| Hawaiian / Pacific | 0 | 0.0% |
| Hispanic or Latino | 373 | 34.2% |
| Native / Alaskan | 0 | 0.0% |
| White / Caucasian | 727 | 66.6% |
| Two or more Races | 0 | 0.0% |
| Some other Race | 365 | 33.4% |
| Total | 1,092 | 100.0% |
Ancestry in Elliston
The most populous ancestries reported in Elliston are Mexican (373 | 34.2%), European (73 | 6.7%), German (52 | 4.8%), American (48 | 4.4%), and English (37 | 3.4%), together accounting for 53.4% of all Elliston residents.
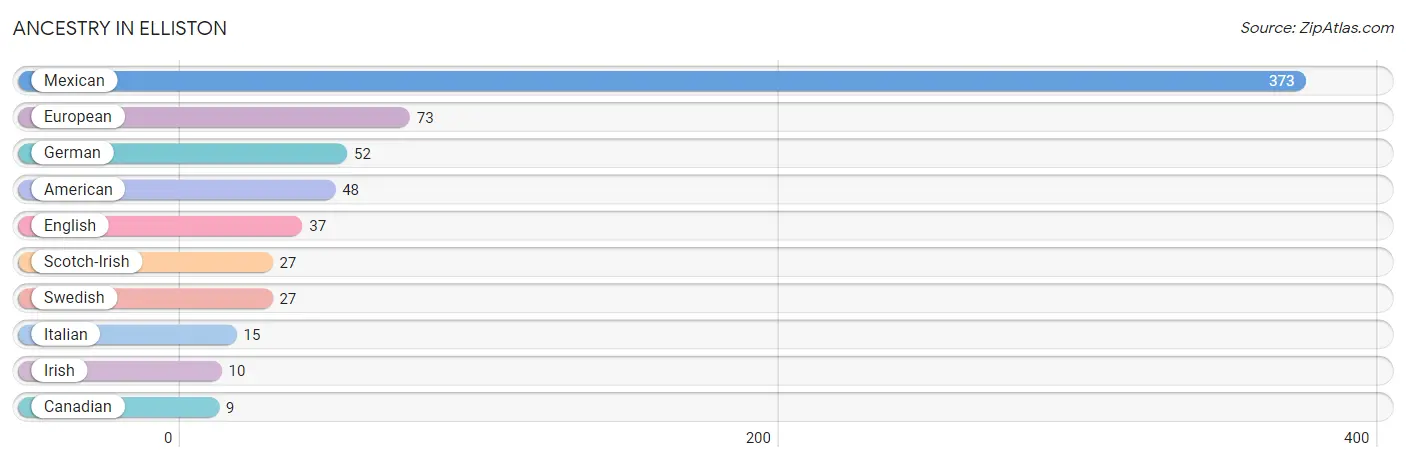
| Ancestry | # Population | % Population |
| American | 48 | 4.4% |
| Canadian | 9 | 0.8% |
| English | 37 | 3.4% |
| European | 73 | 6.7% |
| German | 52 | 4.8% |
| Irish | 10 | 0.9% |
| Italian | 15 | 1.4% |
| Mexican | 373 | 34.2% |
| Scotch-Irish | 27 | 2.5% |
| Swedish | 27 | 2.5% | View All 10 Rows |
Immigrants in Elliston
The most numerous immigrant groups reported in Elliston came from Central America (98 | 9.0%), Latin America (98 | 9.0%), and Mexico (98 | 9.0%), together accounting for 26.9% of all Elliston residents.
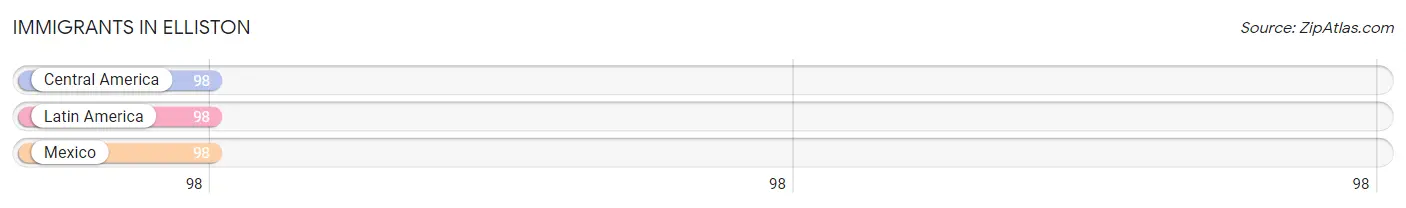
| Immigration Origin | # Population | % Population |
| Central America | 98 | 9.0% |
| Latin America | 98 | 9.0% |
| Mexico | 98 | 9.0% | View All 3 Rows |
Sex and Age in Elliston
Sex and Age in Elliston
The most populous age groups in Elliston are 40 to 44 Years (86 | 19.6%) for men and 15 to 19 Years (137 | 20.9%) for women.
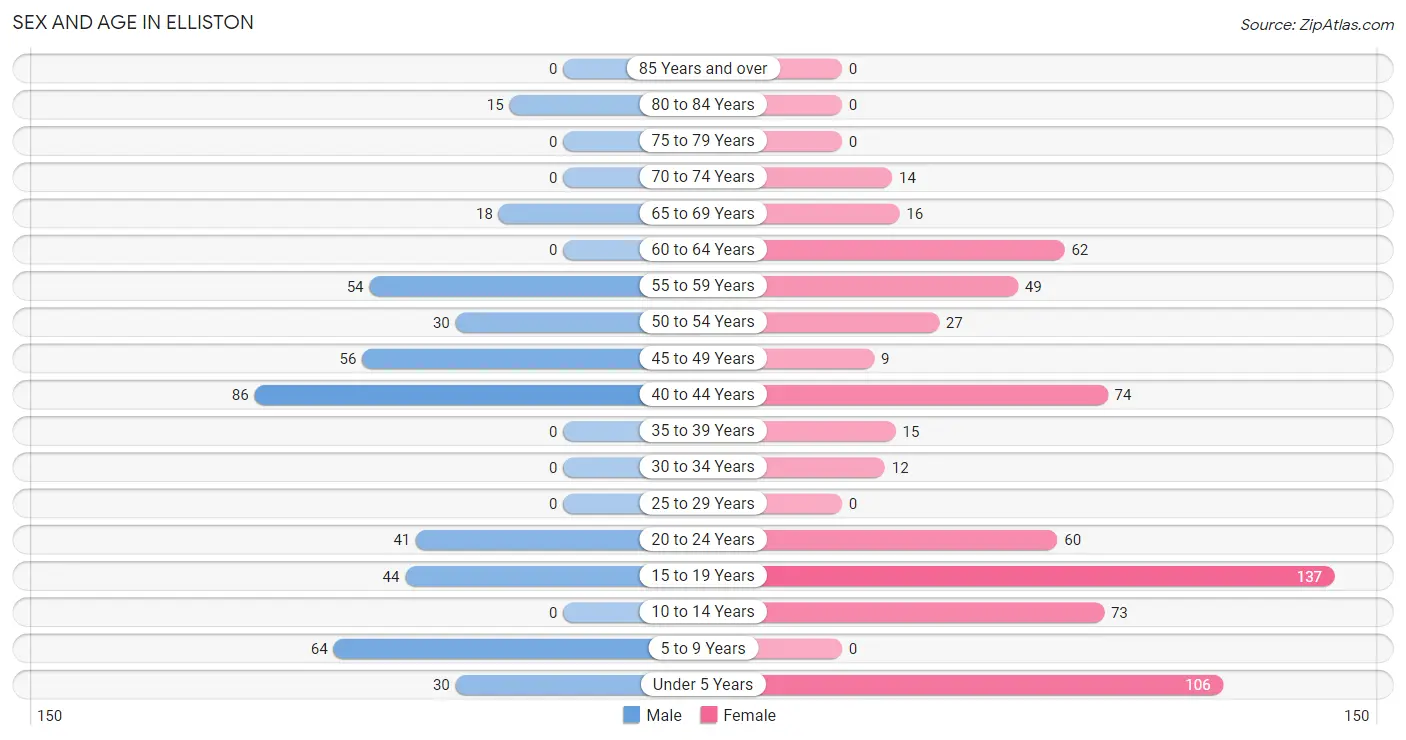
| Age Bracket | Male | Female |
| Under 5 Years | 30 (6.9%) | 106 (16.2%) |
| 5 to 9 Years | 64 (14.6%) | 0 (0.0%) |
| 10 to 14 Years | 0 (0.0%) | 73 (11.2%) |
| 15 to 19 Years | 44 (10.1%) | 137 (20.9%) |
| 20 to 24 Years | 41 (9.4%) | 60 (9.2%) |
| 25 to 29 Years | 0 (0.0%) | 0 (0.0%) |
| 30 to 34 Years | 0 (0.0%) | 12 (1.8%) |
| 35 to 39 Years | 0 (0.0%) | 15 (2.3%) |
| 40 to 44 Years | 86 (19.6%) | 74 (11.3%) |
| 45 to 49 Years | 56 (12.8%) | 9 (1.4%) |
| 50 to 54 Years | 30 (6.9%) | 27 (4.1%) |
| 55 to 59 Years | 54 (12.3%) | 49 (7.5%) |
| 60 to 64 Years | 0 (0.0%) | 62 (9.5%) |
| 65 to 69 Years | 18 (4.1%) | 16 (2.5%) |
| 70 to 74 Years | 0 (0.0%) | 14 (2.1%) |
| 75 to 79 Years | 0 (0.0%) | 0 (0.0%) |
| 80 to 84 Years | 15 (3.4%) | 0 (0.0%) |
| 85 Years and over | 0 (0.0%) | 0 (0.0%) |
| Total | 438 (100.0%) | 654 (100.0%) |
Families and Households in Elliston
Median Family Size in Elliston
The median family size in Elliston is 3.97 persons per family, with married-couple families (204 | 84.3%) accounting for the largest median family size of 4.15 persons per family. On the other hand, single male/father families (26 | 10.7%) represent the smallest median family size with 2.92 persons per family.
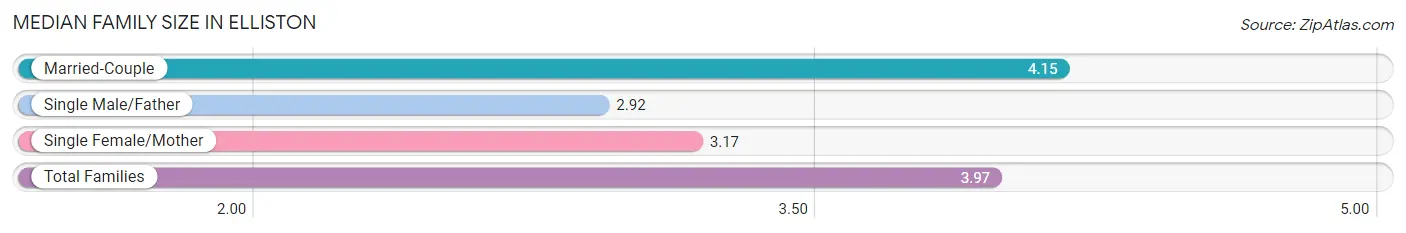
| Family Type | # Families | Family Size |
| Married-Couple | 204 (84.3%) | 4.15 |
| Single Male/Father | 26 (10.7%) | 2.92 |
| Single Female/Mother | 12 (5.0%) | 3.17 |
| Total Families | 242 (100.0%) | 3.97 |
Median Household Size in Elliston
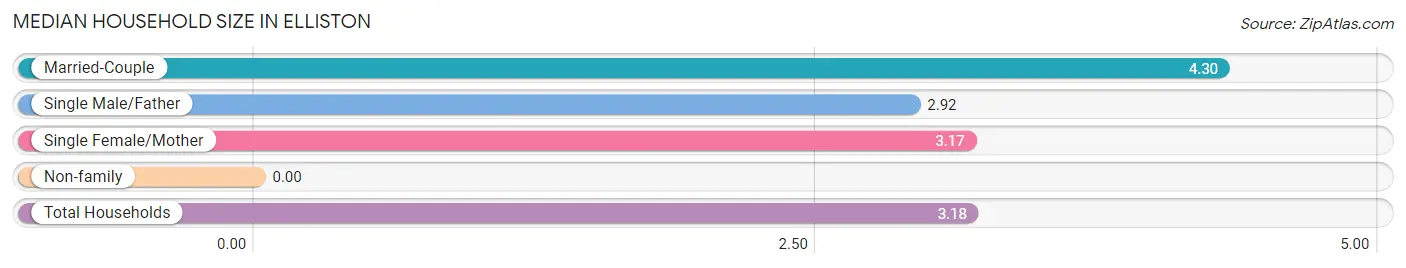
| Household Type | # Households | Household Size |
| Married-Couple | 204 (59.5%) | 4.30 |
| Single Male/Father | 26 (7.6%) | 2.92 |
| Single Female/Mother | 12 (3.5%) | 3.17 |
| Non-family | 101 (29.4%) | - |
| Total Households | 343 (100.0%) | 3.18 |
Household Size by Marriage Status in Elliston
Out of a total of 343 households in Elliston, 242 (70.6%) are family households, while 101 (29.4%) are nonfamily households. The most numerous type of family households are 5-person households, comprising 86, and the most common type of nonfamily households are 1-person households, comprising 101.
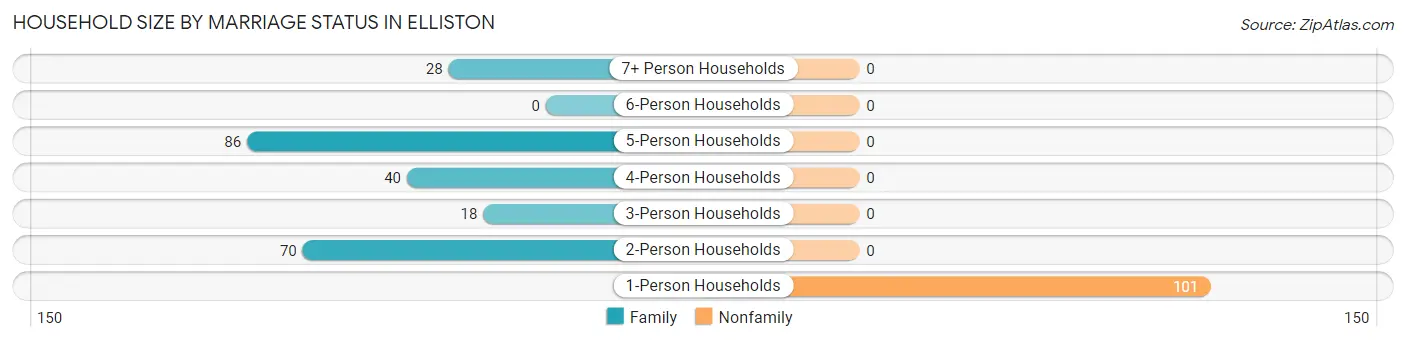
| Household Size | Family Households | Nonfamily Households |
| 1-Person Households | - | 101 (29.4%) |
| 2-Person Households | 70 (20.4%) | 0 (0.0%) |
| 3-Person Households | 18 (5.2%) | 0 (0.0%) |
| 4-Person Households | 40 (11.7%) | 0 (0.0%) |
| 5-Person Households | 86 (25.1%) | 0 (0.0%) |
| 6-Person Households | 0 (0.0%) | 0 (0.0%) |
| 7+ Person Households | 28 (8.2%) | 0 (0.0%) |
| Total | 242 (70.6%) | 101 (29.4%) |
Female Fertility in Elliston
Fertility by Age in Elliston
| Age Bracket | Women with Births | Births / 1,000 Women |
| 15 to 19 years | 0 (0.0%) | 0.0 |
| 20 to 34 years | 0 (0.0%) | 0.0 |
| 35 to 50 years | 0 (0.0%) | 0.0 |
| Total | 0 (0.0%) | 0.0 |
Fertility by Age by Marriage Status in Elliston
| Age Bracket | Married | Unmarried |
| 15 to 19 years | 0 (0.0%) | 0 (0.0%) |
| 20 to 34 years | 0 (0.0%) | 0 (0.0%) |
| 35 to 50 years | 0 (0.0%) | 0 (0.0%) |
| Total | 0 (0.0%) | 0 (0.0%) |
Fertility by Education in Elliston
| Educational Attainment | Women with Births | Births / 1,000 Women |
| Less than High School | 0 (0.0%) | 0.0 |
| High School Diploma | 0 (0.0%) | 0.0 |
| College or Associate's Degree | 0 (0.0%) | 0.0 |
| Bachelor's Degree | 0 (0.0%) | 0.0 |
| Graduate Degree | 0 (0.0%) | 0.0 |
| Total | 0 (0.0%) | 0.0 |
Fertility by Education by Marriage Status in Elliston
| Educational Attainment | Married | Unmarried |
| Less than High School | 0 (0.0%) | 0 (0.0%) |
| High School Diploma | 0 (0.0%) | 0 (0.0%) |
| College or Associate's Degree | 0 (0.0%) | 0 (0.0%) |
| Bachelor's Degree | 0 (0.0%) | 0 (0.0%) |
| Graduate Degree | 0 (0.0%) | 0 (0.0%) |
| Total | 0 (0.0%) | 0 (0.0%) |
Employment Characteristics in Elliston
Employment by Class of Employer in Elliston
Among the 391 employed individuals in Elliston, private company employees (295 | 75.4%), not-for-profit organizations (41 | 10.5%), and local government employees (36 | 9.2%) make up the most common classes of employment.
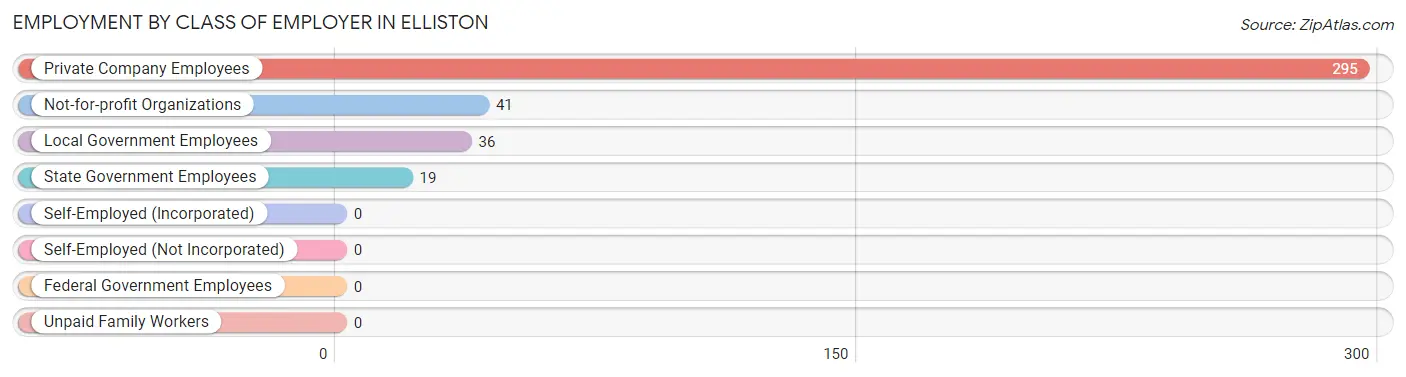
| Employer Class | # Employees | % Employees |
| Private Company Employees | 295 | 75.4% |
| Self-Employed (Incorporated) | 0 | 0.0% |
| Self-Employed (Not Incorporated) | 0 | 0.0% |
| Not-for-profit Organizations | 41 | 10.5% |
| Local Government Employees | 36 | 9.2% |
| State Government Employees | 19 | 4.9% |
| Federal Government Employees | 0 | 0.0% |
| Unpaid Family Workers | 0 | 0.0% |
| Total | 391 | 100.0% |
Employment Status by Age in Elliston
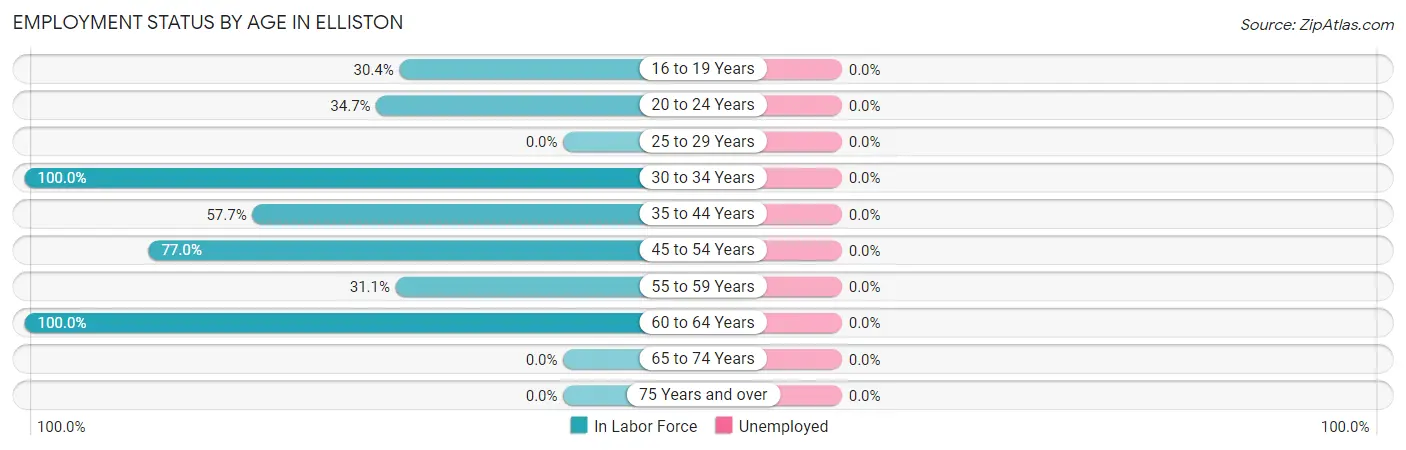
| Age Bracket | In Labor Force | Unemployed |
| 16 to 19 Years | 55 (30.4%) | 0 (0.0%) |
| 20 to 24 Years | 35 (34.7%) | 0 (0.0%) |
| 25 to 29 Years | 0 (0.0%) | 0 (0.0%) |
| 30 to 34 Years | 12 (100.0%) | 0 (0.0%) |
| 35 to 44 Years | 101 (57.7%) | 0 (0.0%) |
| 45 to 54 Years | 94 (77.0%) | 0 (0.0%) |
| 55 to 59 Years | 32 (31.1%) | 0 (0.0%) |
| 60 to 64 Years | 62 (100.0%) | 0 (0.0%) |
| 65 to 74 Years | 0 (0.0%) | 0 (0.0%) |
| 75 Years and over | 0 (0.0%) | 0 (0.0%) |
| Total | 391 (47.7%) | 0 (0.0%) |
Employment Status by Educational Attainment in Elliston
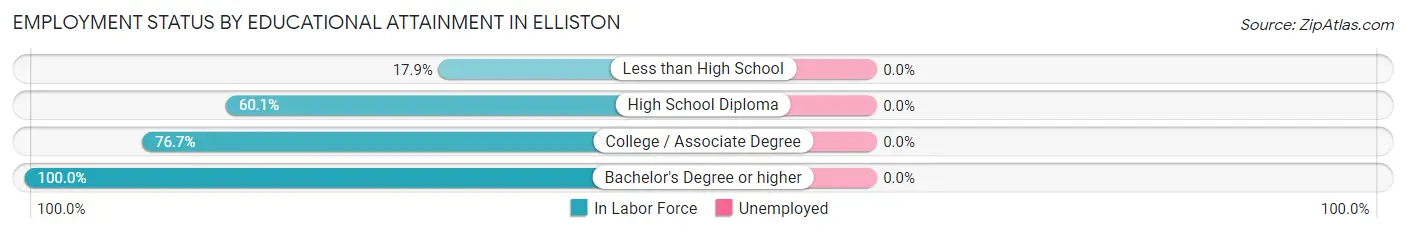
| Educational Attainment | In Labor Force | Unemployed |
| Less than High School | 12 (17.9%) | 0 (0.0%) |
| High School Diploma | 104 (60.1%) | 0 (0.0%) |
| College / Associate Degree | 161 (76.7%) | 0 (0.0%) |
| Bachelor's Degree or higher | 24 (100.0%) | 0 (0.0%) |
| Total | 301 (63.5%) | 0 (0.0%) |
Employment Occupations by Sex in Elliston
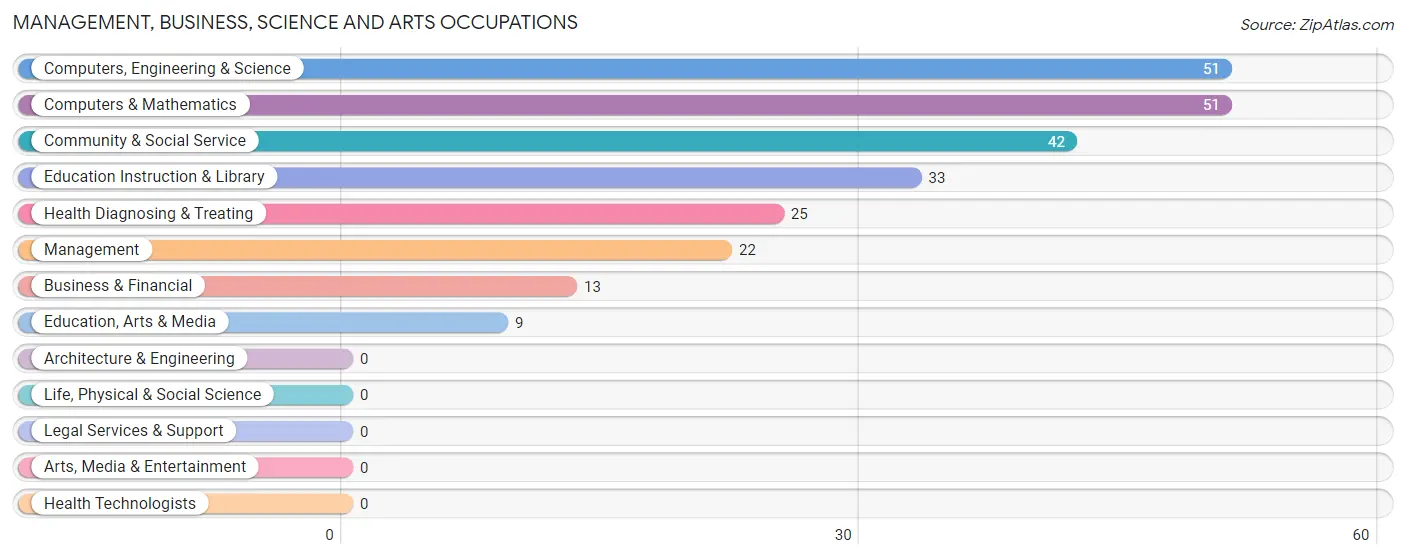
Management, Business, Science and Arts Occupations
The most common Management, Business, Science and Arts occupations in Elliston are Computers, Engineering & Science (51 | 13.0%), Computers & Mathematics (51 | 13.0%), Community & Social Service (42 | 10.7%), Education Instruction & Library (33 | 8.4%), and Health Diagnosing & Treating (25 | 6.4%).
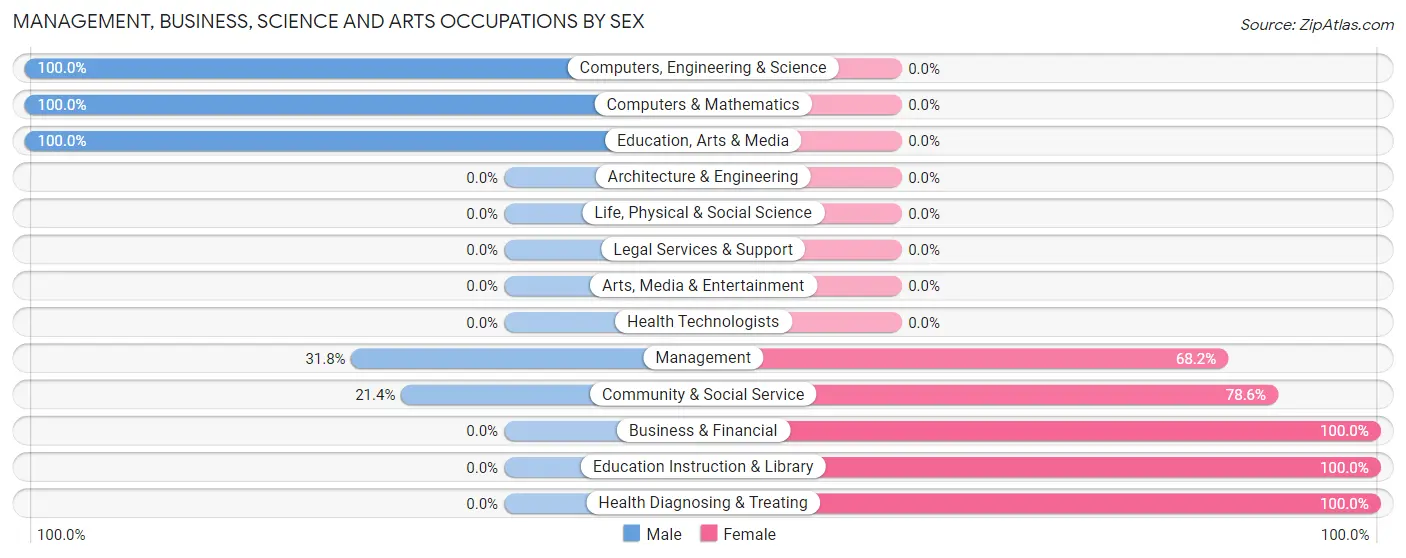
Management, Business, Science and Arts Occupations by Sex
Within the Management, Business, Science and Arts occupations in Elliston, the most male-oriented occupations are Computers, Engineering & Science (100.0%), Computers & Mathematics (100.0%), and Education, Arts & Media (100.0%), while the most female-oriented occupations are Business & Financial (100.0%), Education Instruction & Library (100.0%), and Health Diagnosing & Treating (100.0%).
| Occupation | Male | Female |
| Management | 7 (31.8%) | 15 (68.2%) |
| Business & Financial | 0 (0.0%) | 13 (100.0%) |
| Computers, Engineering & Science | 51 (100.0%) | 0 (0.0%) |
| Computers & Mathematics | 51 (100.0%) | 0 (0.0%) |
| Architecture & Engineering | 0 (0.0%) | 0 (0.0%) |
| Life, Physical & Social Science | 0 (0.0%) | 0 (0.0%) |
| Community & Social Service | 9 (21.4%) | 33 (78.6%) |
| Education, Arts & Media | 9 (100.0%) | 0 (0.0%) |
| Legal Services & Support | 0 (0.0%) | 0 (0.0%) |
| Education Instruction & Library | 0 (0.0%) | 33 (100.0%) |
| Arts, Media & Entertainment | 0 (0.0%) | 0 (0.0%) |
| Health Diagnosing & Treating | 0 (0.0%) | 25 (100.0%) |
| Health Technologists | 0 (0.0%) | 0 (0.0%) |
| Total (Category) | 67 (43.8%) | 86 (56.2%) |
| Total (Overall) | 199 (50.9%) | 192 (49.1%) |
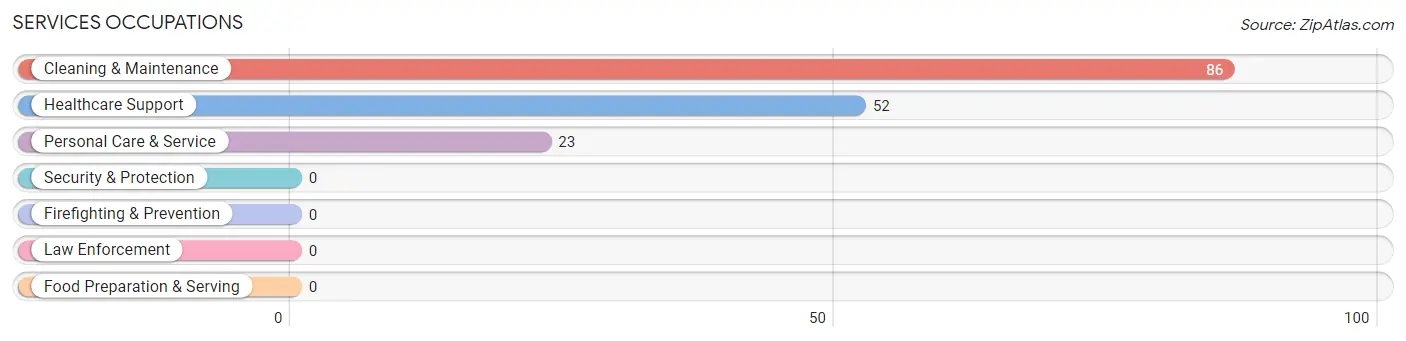
Services Occupations
The most common Services occupations in Elliston are Cleaning & Maintenance (86 | 22.0%), Healthcare Support (52 | 13.3%), and Personal Care & Service (23 | 5.9%).
Services Occupations by Sex
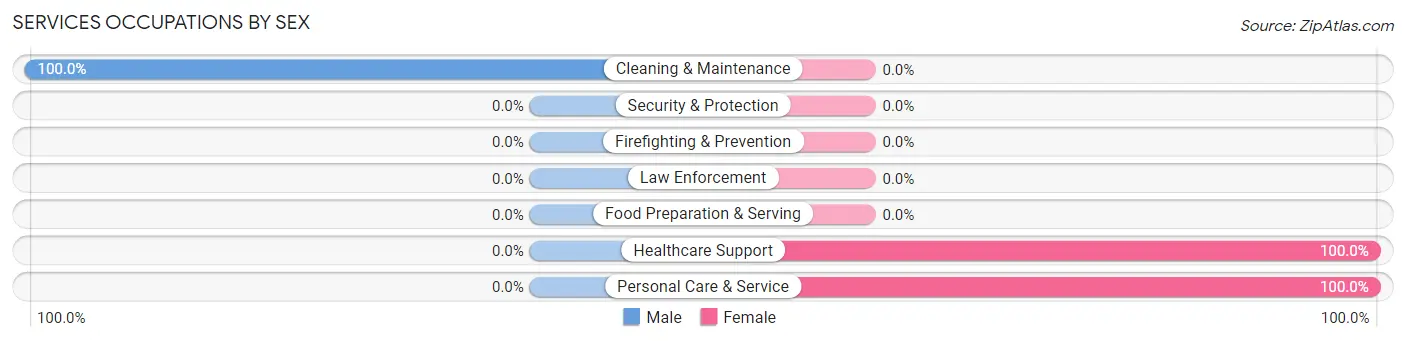
| Occupation | Male | Female |
| Healthcare Support | 0 (0.0%) | 52 (100.0%) |
| Security & Protection | 0 (0.0%) | 0 (0.0%) |
| Firefighting & Prevention | 0 (0.0%) | 0 (0.0%) |
| Law Enforcement | 0 (0.0%) | 0 (0.0%) |
| Food Preparation & Serving | 0 (0.0%) | 0 (0.0%) |
| Cleaning & Maintenance | 86 (100.0%) | 0 (0.0%) |
| Personal Care & Service | 0 (0.0%) | 23 (100.0%) |
| Total (Category) | 86 (53.4%) | 75 (46.6%) |
| Total (Overall) | 199 (50.9%) | 192 (49.1%) |
Sales and Office Occupations
The most common Sales and Office occupations in Elliston are Sales & Related (33 | 8.4%), and Office & Administration (20 | 5.1%).
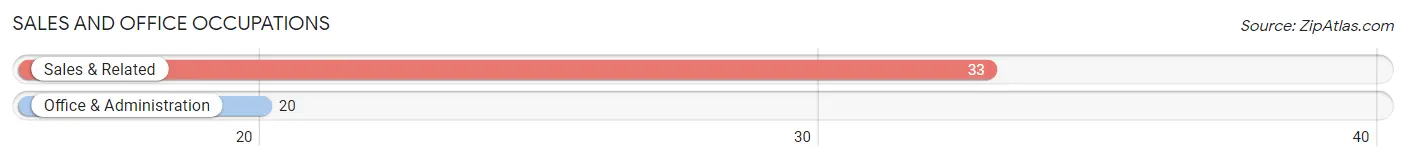
Sales and Office Occupations by Sex

| Occupation | Male | Female |
| Sales & Related | 33 (100.0%) | 0 (0.0%) |
| Office & Administration | 0 (0.0%) | 20 (100.0%) |
| Total (Category) | 33 (62.3%) | 20 (37.7%) |
| Total (Overall) | 199 (50.9%) | 192 (49.1%) |
Natural Resources, Construction and Maintenance Occupations
The most common Natural Resources, Construction and Maintenance occupations in Elliston are , and Installation, Maintenance & Repair (13 | 3.3%).
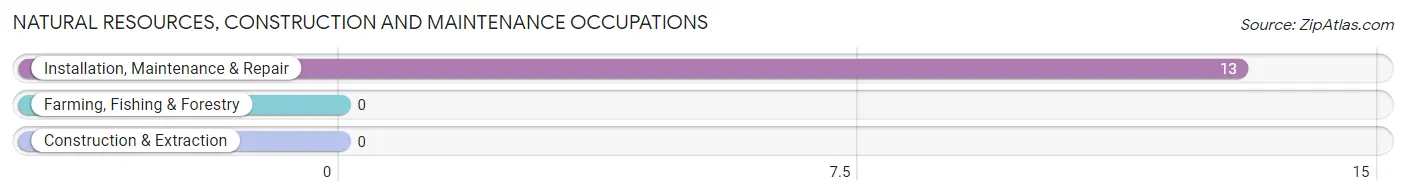
Natural Resources, Construction and Maintenance Occupations by Sex
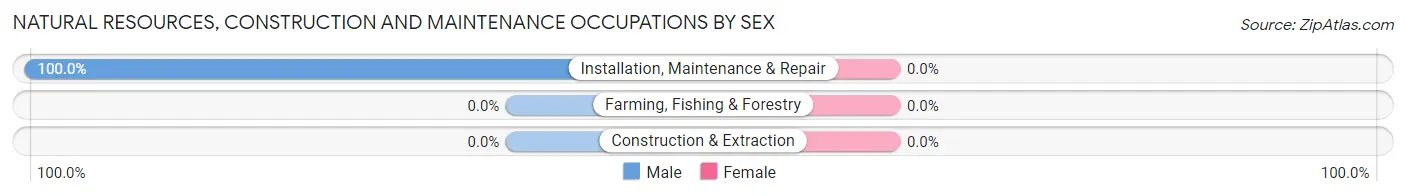
| Occupation | Male | Female |
| Farming, Fishing & Forestry | 0 (0.0%) | 0 (0.0%) |
| Construction & Extraction | 0 (0.0%) | 0 (0.0%) |
| Installation, Maintenance & Repair | 13 (100.0%) | 0 (0.0%) |
| Total (Category) | 13 (100.0%) | 0 (0.0%) |
| Total (Overall) | 199 (50.9%) | 192 (49.1%) |
Production, Transportation and Moving Occupations
The most common Production, Transportation and Moving occupations in Elliston are , and Production (11 | 2.8%).
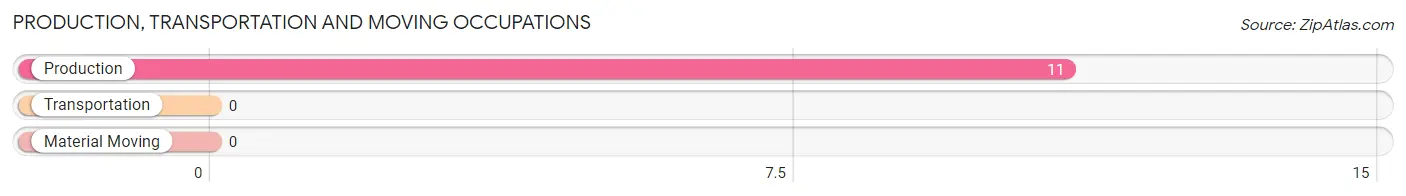
Production, Transportation and Moving Occupations by Sex
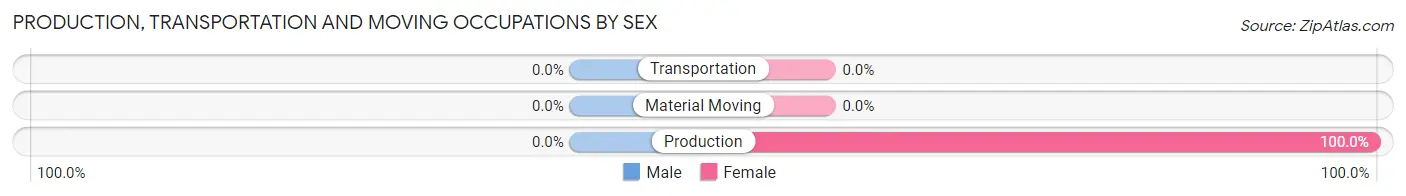
| Occupation | Male | Female |
| Production | 0 (0.0%) | 11 (100.0%) |
| Transportation | 0 (0.0%) | 0 (0.0%) |
| Material Moving | 0 (0.0%) | 0 (0.0%) |
| Total (Category) | 0 (0.0%) | 11 (100.0%) |
| Total (Overall) | 199 (50.9%) | 192 (49.1%) |
Employment Industries by Sex in Elliston
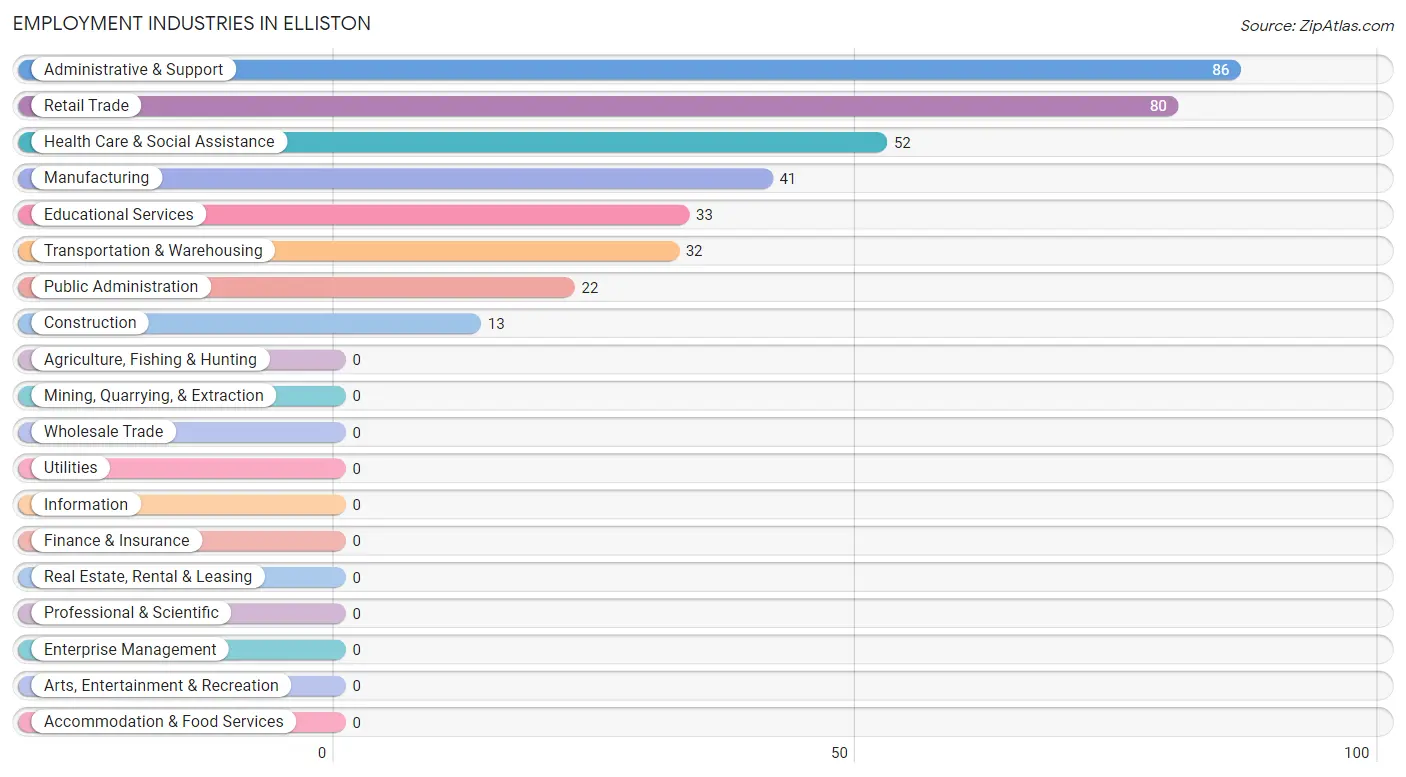
Employment Industries in Elliston
The major employment industries in Elliston include Administrative & Support (86 | 22.0%), Retail Trade (80 | 20.5%), Health Care & Social Assistance (52 | 13.3%), Manufacturing (41 | 10.5%), and Educational Services (33 | 8.4%).
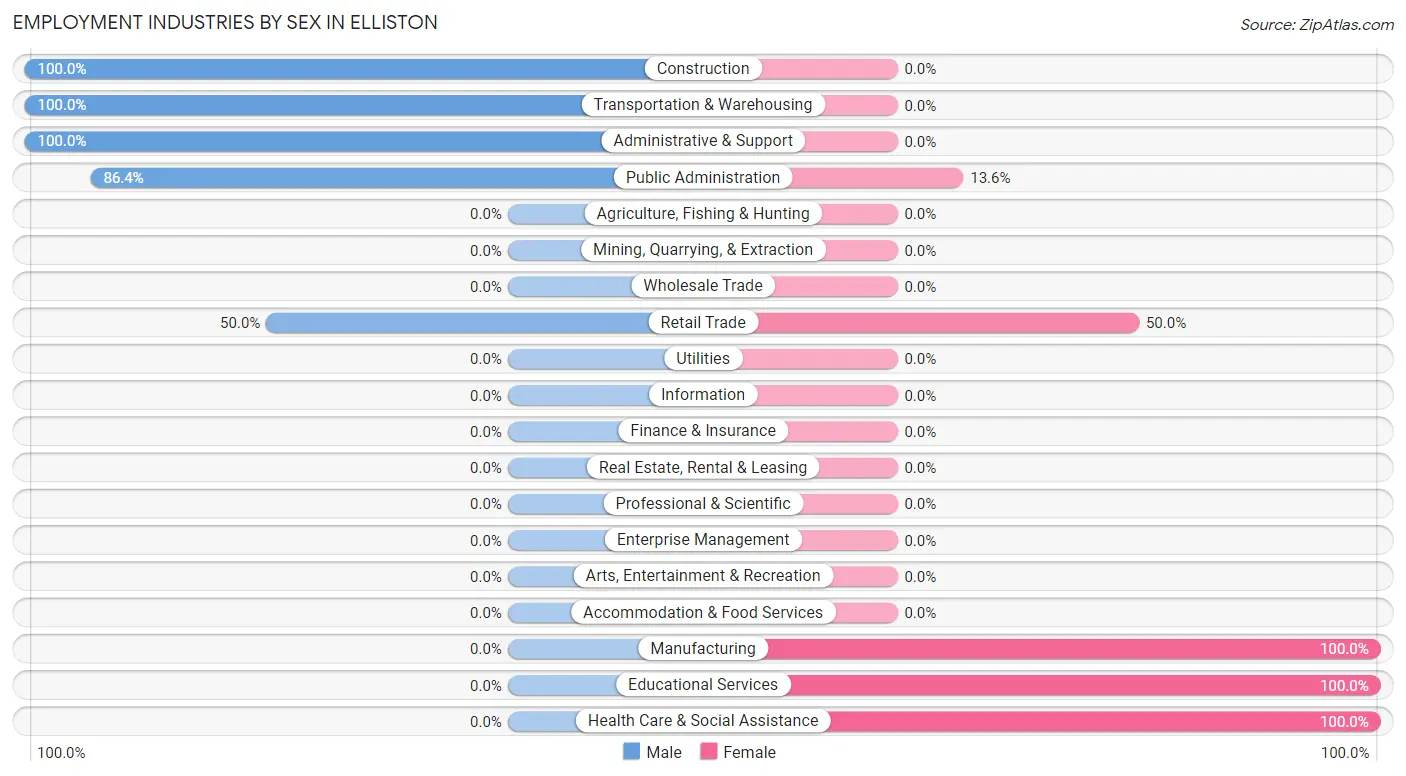
Employment Industries by Sex in Elliston
The Elliston industries that see more men than women are Construction (100.0%), Transportation & Warehousing (100.0%), and Administrative & Support (100.0%), whereas the industries that tend to have a higher number of women are Manufacturing (100.0%), Educational Services (100.0%), and Health Care & Social Assistance (100.0%).
| Industry | Male | Female |
| Agriculture, Fishing & Hunting | 0 (0.0%) | 0 (0.0%) |
| Mining, Quarrying, & Extraction | 0 (0.0%) | 0 (0.0%) |
| Construction | 13 (100.0%) | 0 (0.0%) |
| Manufacturing | 0 (0.0%) | 41 (100.0%) |
| Wholesale Trade | 0 (0.0%) | 0 (0.0%) |
| Retail Trade | 40 (50.0%) | 40 (50.0%) |
| Transportation & Warehousing | 32 (100.0%) | 0 (0.0%) |
| Utilities | 0 (0.0%) | 0 (0.0%) |
| Information | 0 (0.0%) | 0 (0.0%) |
| Finance & Insurance | 0 (0.0%) | 0 (0.0%) |
| Real Estate, Rental & Leasing | 0 (0.0%) | 0 (0.0%) |
| Professional & Scientific | 0 (0.0%) | 0 (0.0%) |
| Enterprise Management | 0 (0.0%) | 0 (0.0%) |
| Administrative & Support | 86 (100.0%) | 0 (0.0%) |
| Educational Services | 0 (0.0%) | 33 (100.0%) |
| Health Care & Social Assistance | 0 (0.0%) | 52 (100.0%) |
| Arts, Entertainment & Recreation | 0 (0.0%) | 0 (0.0%) |
| Accommodation & Food Services | 0 (0.0%) | 0 (0.0%) |
| Public Administration | 19 (86.4%) | 3 (13.6%) |
| Total | 199 (50.9%) | 192 (49.1%) |
Education in Elliston
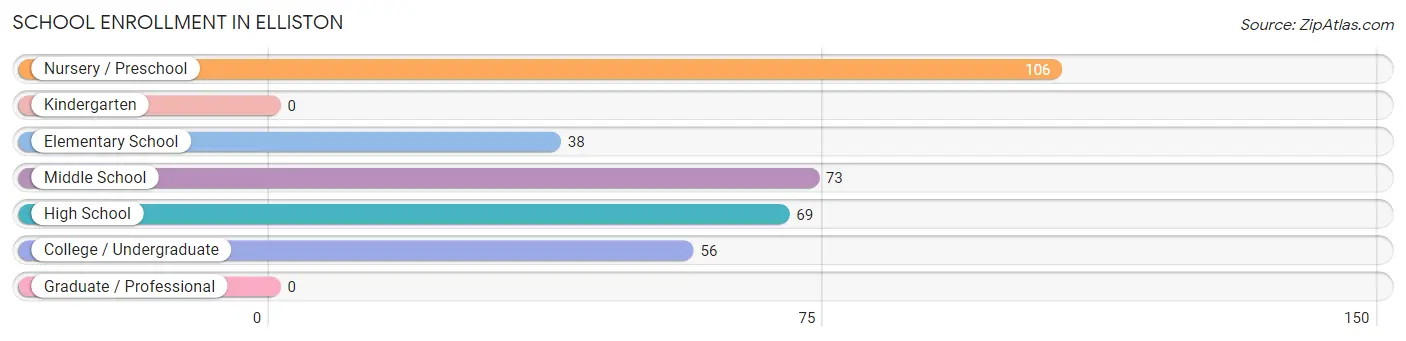
School Enrollment in Elliston
The most common levels of schooling among the 342 students in Elliston are nursery / preschool (106 | 31.0%), middle school (73 | 21.3%), and high school (69 | 20.2%).
| School Level | # Students | % Students |
| Nursery / Preschool | 106 | 31.0% |
| Kindergarten | 0 | 0.0% |
| Elementary School | 38 | 11.1% |
| Middle School | 73 | 21.3% |
| High School | 69 | 20.2% |
| College / Undergraduate | 56 | 16.4% |
| Graduate / Professional | 0 | 0.0% |
| Total | 342 | 100.0% |
School Enrollment by Age by Funding Source in Elliston
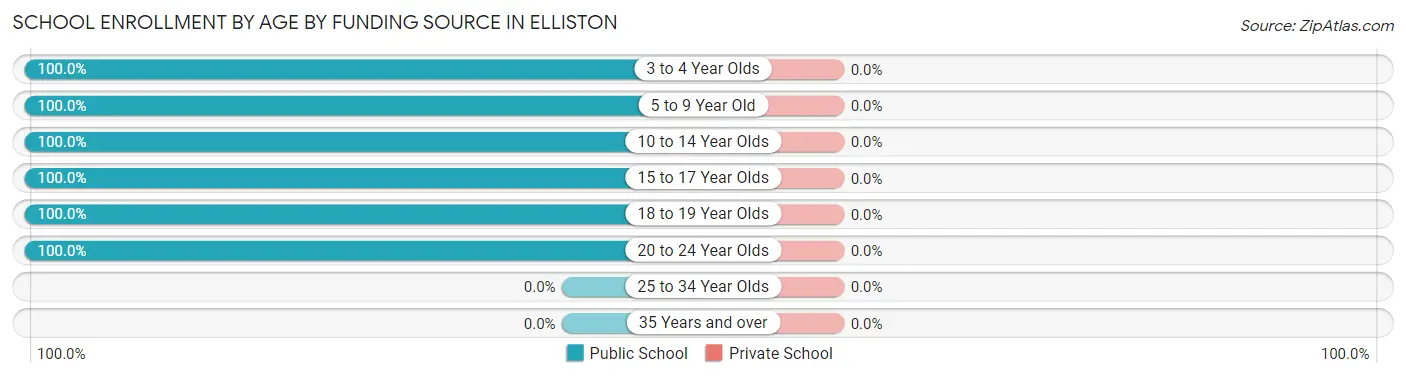
| Age Bracket | Public School | Private School |
| 3 to 4 Year Olds | 106 (100.0%) | 0 (0.0%) |
| 5 to 9 Year Old | 38 (100.0%) | 0 (0.0%) |
| 10 to 14 Year Olds | 73 (100.0%) | 0 (0.0%) |
| 15 to 17 Year Olds | 36 (100.0%) | 0 (0.0%) |
| 18 to 19 Year Olds | 54 (100.0%) | 0 (0.0%) |
| 20 to 24 Year Olds | 35 (100.0%) | 0 (0.0%) |
| 25 to 34 Year Olds | 0 (0.0%) | 0 (0.0%) |
| 35 Years and over | 0 (0.0%) | 0 (0.0%) |
| Total | 342 (100.0%) | 0 (0.0%) |
Educational Attainment by Field of Study in Elliston
Visual & performing arts (24 | 61.5%), and bio, nature & agricultural (15 | 38.5%) are the most common fields of study among 39 individuals in Elliston who have obtained a bachelor's degree or higher.
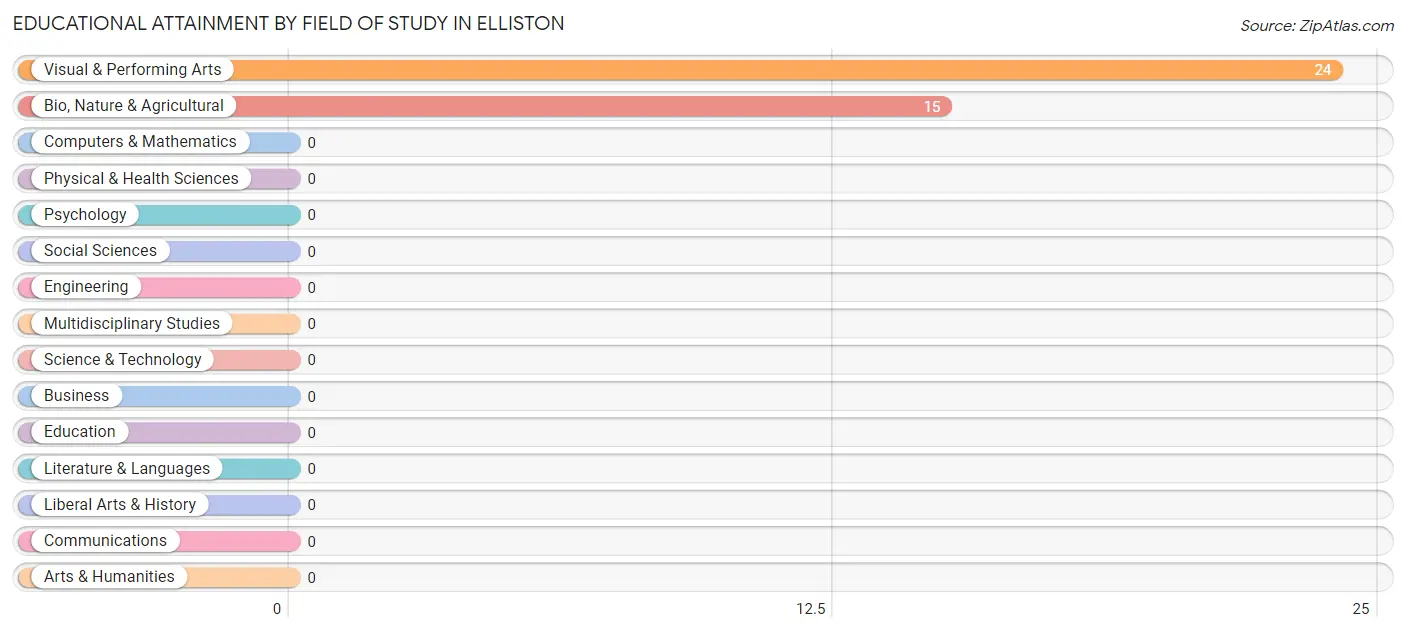
| Field of Study | # Graduates | % Graduates |
| Computers & Mathematics | 0 | 0.0% |
| Bio, Nature & Agricultural | 15 | 38.5% |
| Physical & Health Sciences | 0 | 0.0% |
| Psychology | 0 | 0.0% |
| Social Sciences | 0 | 0.0% |
| Engineering | 0 | 0.0% |
| Multidisciplinary Studies | 0 | 0.0% |
| Science & Technology | 0 | 0.0% |
| Business | 0 | 0.0% |
| Education | 0 | 0.0% |
| Literature & Languages | 0 | 0.0% |
| Liberal Arts & History | 0 | 0.0% |
| Visual & Performing Arts | 24 | 61.5% |
| Communications | 0 | 0.0% |
| Arts & Humanities | 0 | 0.0% |
| Total | 39 | 100.0% |
Transportation & Commute in Elliston
Vehicle Availability by Sex in Elliston
The most prevalent vehicle ownership categories in Elliston are males with 3 vehicles (167, accounting for 83.9%) and females with 3 vehicles (95, making up 87.0%).
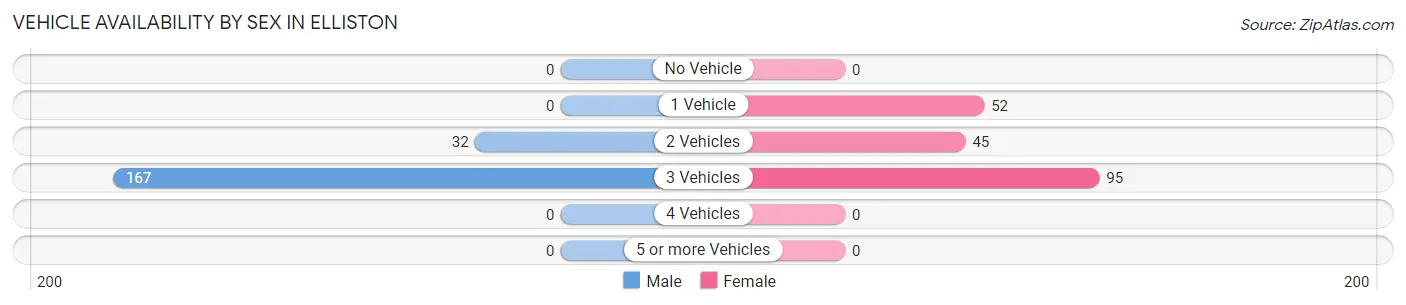
| Vehicles Available | Male | Female |
| No Vehicle | 0 (0.0%) | 0 (0.0%) |
| 1 Vehicle | 0 (0.0%) | 52 (27.1%) |
| 2 Vehicles | 32 (16.1%) | 45 (23.4%) |
| 3 Vehicles | 167 (83.9%) | 95 (49.5%) |
| 4 Vehicles | 0 (0.0%) | 0 (0.0%) |
| 5 or more Vehicles | 0 (0.0%) | 0 (0.0%) |
| Total | 199 (100.0%) | 192 (100.0%) |
Commute Time in Elliston
The most frequently occuring commute durations in Elliston are 10 to 14 minutes (138 commuters, 35.3%), 20 to 24 minutes (72 commuters, 18.4%), and 60 to 89 minutes (55 commuters, 14.1%).
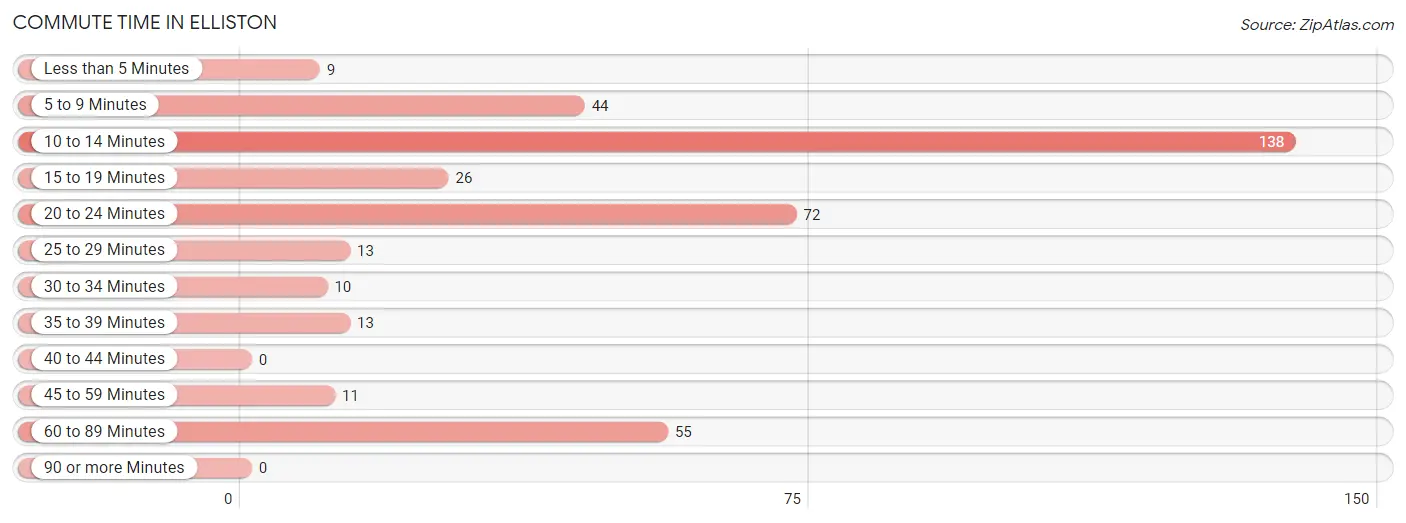
| Commute Time | # Commuters | % Commuters |
| Less than 5 Minutes | 9 | 2.3% |
| 5 to 9 Minutes | 44 | 11.3% |
| 10 to 14 Minutes | 138 | 35.3% |
| 15 to 19 Minutes | 26 | 6.7% |
| 20 to 24 Minutes | 72 | 18.4% |
| 25 to 29 Minutes | 13 | 3.3% |
| 30 to 34 Minutes | 10 | 2.6% |
| 35 to 39 Minutes | 13 | 3.3% |
| 40 to 44 Minutes | 0 | 0.0% |
| 45 to 59 Minutes | 11 | 2.8% |
| 60 to 89 Minutes | 55 | 14.1% |
| 90 or more Minutes | 0 | 0.0% |
Commute Time by Sex in Elliston
The most common commute times in Elliston are 10 to 14 minutes (86 commuters, 43.2%) for males and 20 to 24 minutes (72 commuters, 37.5%) for females.
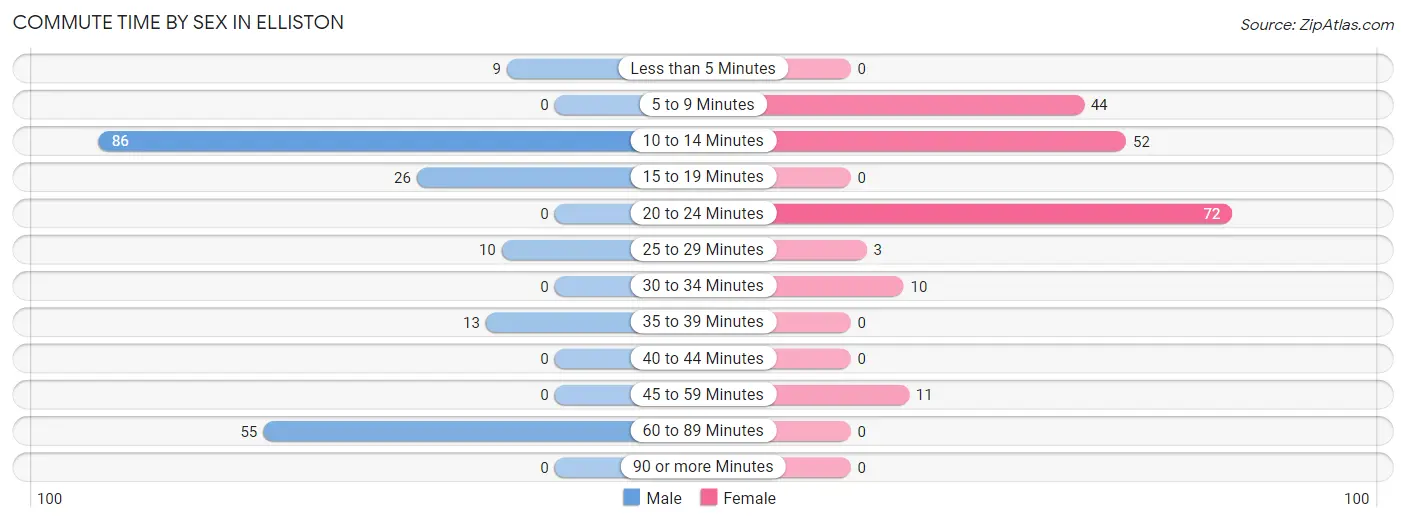
| Commute Time | Male | Female |
| Less than 5 Minutes | 9 (4.5%) | 0 (0.0%) |
| 5 to 9 Minutes | 0 (0.0%) | 44 (22.9%) |
| 10 to 14 Minutes | 86 (43.2%) | 52 (27.1%) |
| 15 to 19 Minutes | 26 (13.1%) | 0 (0.0%) |
| 20 to 24 Minutes | 0 (0.0%) | 72 (37.5%) |
| 25 to 29 Minutes | 10 (5.0%) | 3 (1.6%) |
| 30 to 34 Minutes | 0 (0.0%) | 10 (5.2%) |
| 35 to 39 Minutes | 13 (6.5%) | 0 (0.0%) |
| 40 to 44 Minutes | 0 (0.0%) | 0 (0.0%) |
| 45 to 59 Minutes | 0 (0.0%) | 11 (5.7%) |
| 60 to 89 Minutes | 55 (27.6%) | 0 (0.0%) |
| 90 or more Minutes | 0 (0.0%) | 0 (0.0%) |
Time of Departure to Work by Sex in Elliston
The most frequent times of departure to work in Elliston are 5:30 AM to 5:59 AM (119, 59.8%) for males and 5:30 AM to 5:59 AM (52, 27.1%) for females.
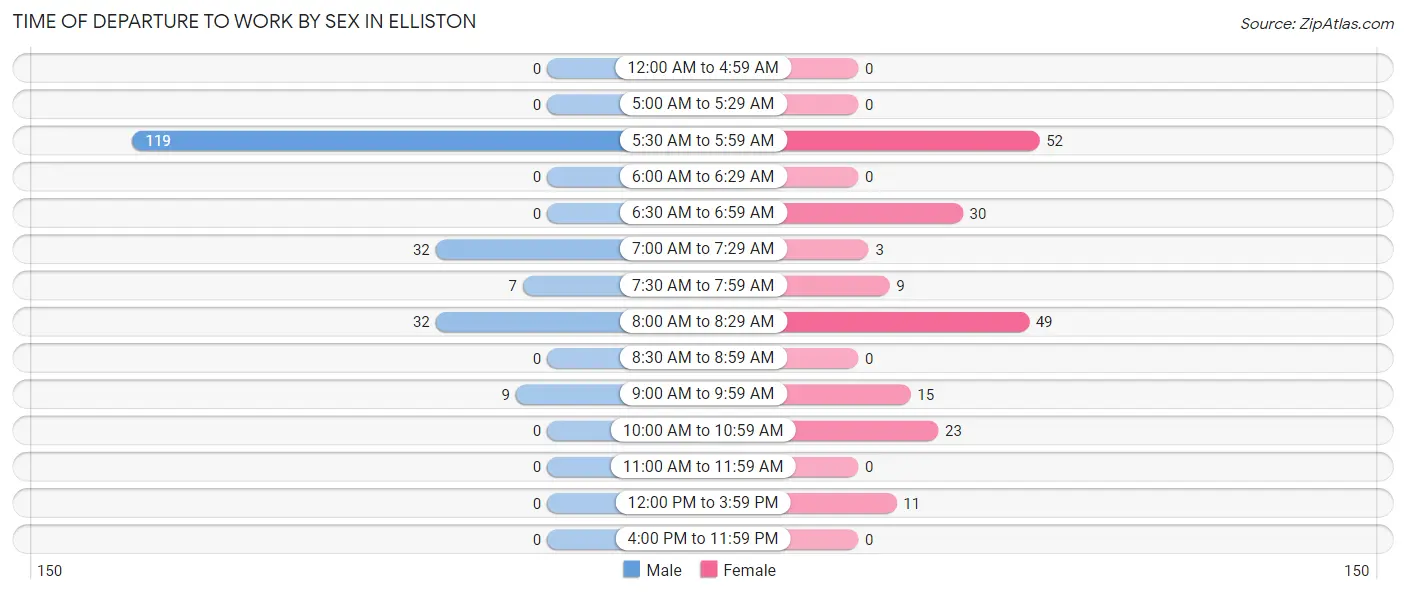
| Time of Departure | Male | Female |
| 12:00 AM to 4:59 AM | 0 (0.0%) | 0 (0.0%) |
| 5:00 AM to 5:29 AM | 0 (0.0%) | 0 (0.0%) |
| 5:30 AM to 5:59 AM | 119 (59.8%) | 52 (27.1%) |
| 6:00 AM to 6:29 AM | 0 (0.0%) | 0 (0.0%) |
| 6:30 AM to 6:59 AM | 0 (0.0%) | 30 (15.6%) |
| 7:00 AM to 7:29 AM | 32 (16.1%) | 3 (1.6%) |
| 7:30 AM to 7:59 AM | 7 (3.5%) | 9 (4.7%) |
| 8:00 AM to 8:29 AM | 32 (16.1%) | 49 (25.5%) |
| 8:30 AM to 8:59 AM | 0 (0.0%) | 0 (0.0%) |
| 9:00 AM to 9:59 AM | 9 (4.5%) | 15 (7.8%) |
| 10:00 AM to 10:59 AM | 0 (0.0%) | 23 (12.0%) |
| 11:00 AM to 11:59 AM | 0 (0.0%) | 0 (0.0%) |
| 12:00 PM to 3:59 PM | 0 (0.0%) | 11 (5.7%) |
| 4:00 PM to 11:59 PM | 0 (0.0%) | 0 (0.0%) |
| Total | 199 (100.0%) | 192 (100.0%) |
Housing Occupancy in Elliston
Occupancy by Ownership in Elliston
Of the total 343 dwellings in Elliston, owner-occupied units account for 181 (52.8%), while renter-occupied units make up 162 (47.2%).
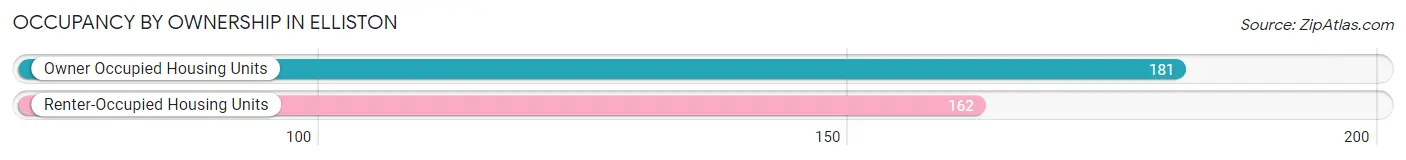
| Occupancy | # Housing Units | % Housing Units |
| Owner Occupied Housing Units | 181 | 52.8% |
| Renter-Occupied Housing Units | 162 | 47.2% |
| Total Occupied Housing Units | 343 | 100.0% |
Occupancy by Household Size in Elliston
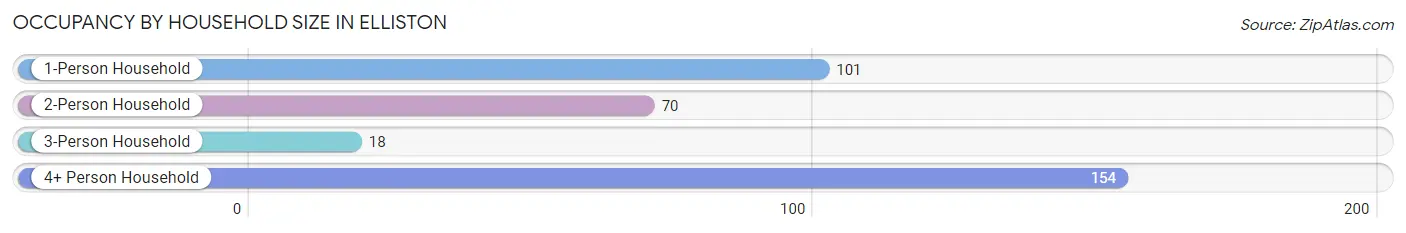
| Household Size | # Housing Units | % Housing Units |
| 1-Person Household | 101 | 29.4% |
| 2-Person Household | 70 | 20.4% |
| 3-Person Household | 18 | 5.2% |
| 4+ Person Household | 154 | 44.9% |
| Total Housing Units | 343 | 100.0% |
Occupancy by Ownership by Household Size in Elliston
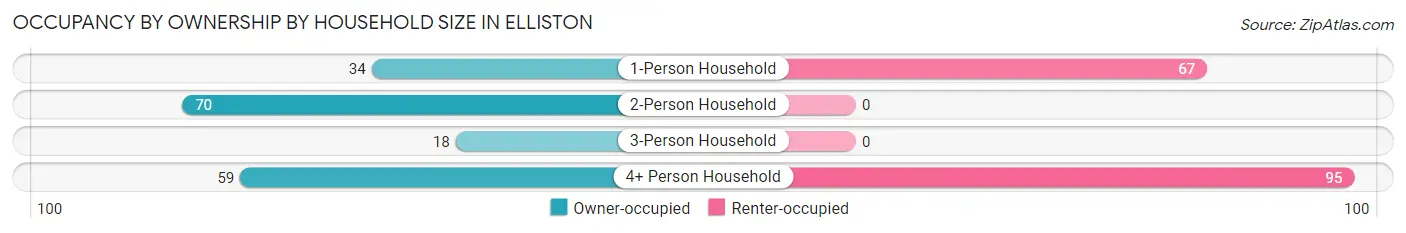
| Household Size | Owner-occupied | Renter-occupied |
| 1-Person Household | 34 (33.7%) | 67 (66.3%) |
| 2-Person Household | 70 (100.0%) | 0 (0.0%) |
| 3-Person Household | 18 (100.0%) | 0 (0.0%) |
| 4+ Person Household | 59 (38.3%) | 95 (61.7%) |
| Total Housing Units | 181 (52.8%) | 162 (47.2%) |
Occupancy by Educational Attainment in Elliston
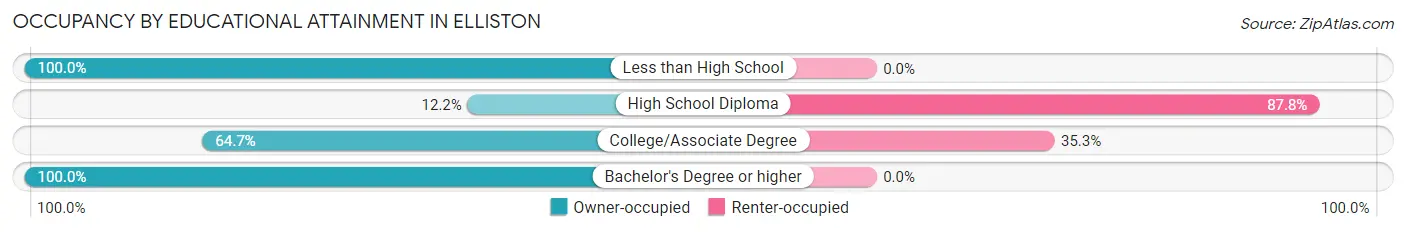
| Household Size | Owner-occupied | Renter-occupied |
| Less than High School | 40 (100.0%) | 0 (0.0%) |
| High School Diploma | 14 (12.2%) | 101 (87.8%) |
| College/Associate Degree | 112 (64.7%) | 61 (35.3%) |
| Bachelor's Degree or higher | 15 (100.0%) | 0 (0.0%) |
Occupancy by Age of Householder in Elliston
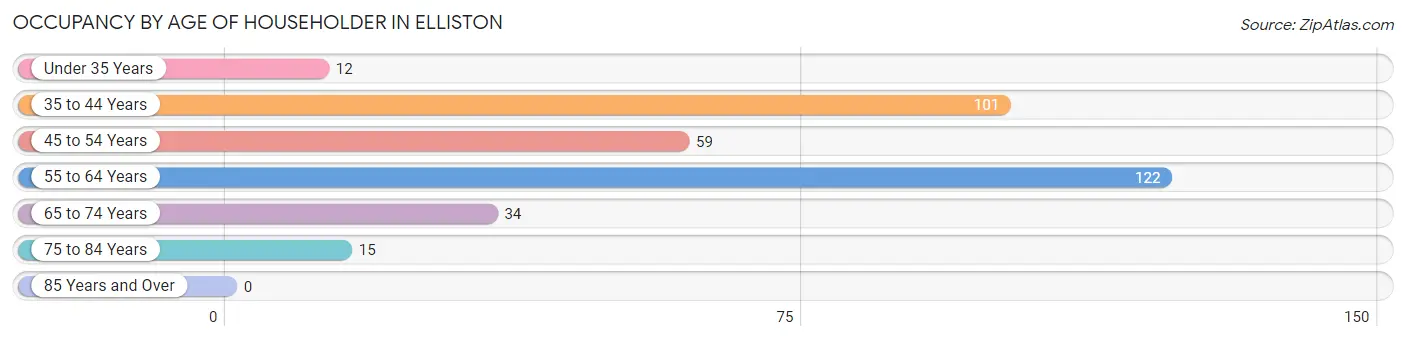
| Age Bracket | # Households | % Households |
| Under 35 Years | 12 | 3.5% |
| 35 to 44 Years | 101 | 29.4% |
| 45 to 54 Years | 59 | 17.2% |
| 55 to 64 Years | 122 | 35.6% |
| 65 to 74 Years | 34 | 9.9% |
| 75 to 84 Years | 15 | 4.4% |
| 85 Years and Over | 0 | 0.0% |
| Total | 343 | 100.0% |
Housing Finances in Elliston
Median Income by Occupancy in Elliston
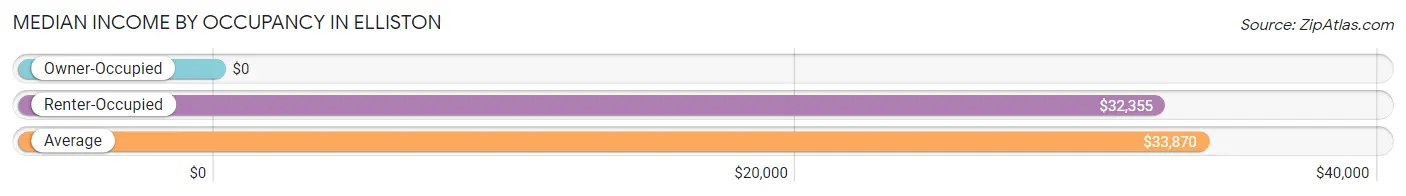
| Occupancy Type | # Households | Median Income |
| Owner-Occupied | 181 (52.8%) | $0 |
| Renter-Occupied | 162 (47.2%) | $32,355 |
| Average | 343 (100.0%) | $33,870 |
Occupancy by Householder Income Bracket in Elliston
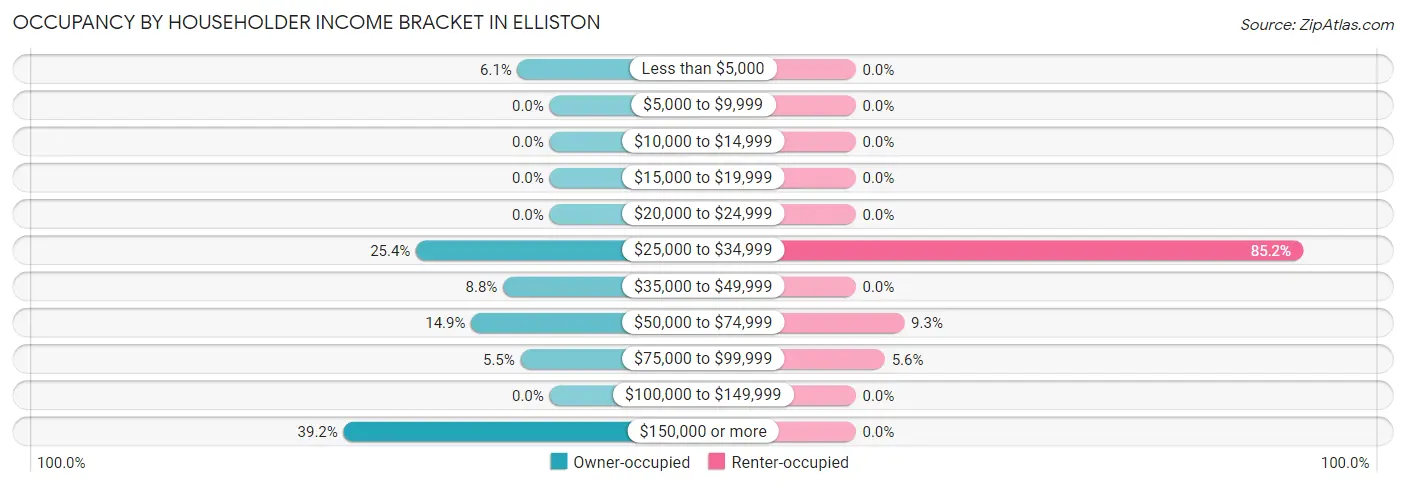
| Income Bracket | Owner-occupied | Renter-occupied |
| Less than $5,000 | 11 (6.1%) | 0 (0.0%) |
| $5,000 to $9,999 | 0 (0.0%) | 0 (0.0%) |
| $10,000 to $14,999 | 0 (0.0%) | 0 (0.0%) |
| $15,000 to $19,999 | 0 (0.0%) | 0 (0.0%) |
| $20,000 to $24,999 | 0 (0.0%) | 0 (0.0%) |
| $25,000 to $34,999 | 46 (25.4%) | 138 (85.2%) |
| $35,000 to $49,999 | 16 (8.8%) | 0 (0.0%) |
| $50,000 to $74,999 | 27 (14.9%) | 15 (9.3%) |
| $75,000 to $99,999 | 10 (5.5%) | 9 (5.6%) |
| $100,000 to $149,999 | 0 (0.0%) | 0 (0.0%) |
| $150,000 or more | 71 (39.2%) | 0 (0.0%) |
| Total | 181 (100.0%) | 162 (100.0%) |
Monthly Housing Cost Tiers in Elliston
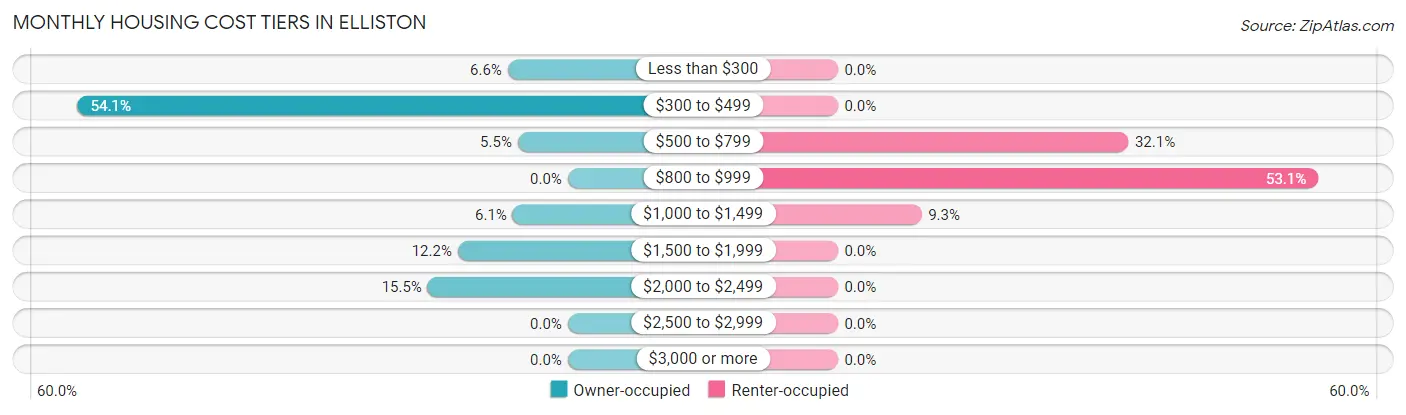
| Monthly Cost | Owner-occupied | Renter-occupied |
| Less than $300 | 12 (6.6%) | 0 (0.0%) |
| $300 to $499 | 98 (54.1%) | 0 (0.0%) |
| $500 to $799 | 10 (5.5%) | 52 (32.1%) |
| $800 to $999 | 0 (0.0%) | 86 (53.1%) |
| $1,000 to $1,499 | 11 (6.1%) | 15 (9.3%) |
| $1,500 to $1,999 | 22 (12.1%) | 0 (0.0%) |
| $2,000 to $2,499 | 28 (15.5%) | 0 (0.0%) |
| $2,500 to $2,999 | 0 (0.0%) | 0 (0.0%) |
| $3,000 or more | 0 (0.0%) | 0 (0.0%) |
| Total | 181 (100.0%) | 162 (100.0%) |
Physical Housing Characteristics in Elliston
Housing Structures in Elliston
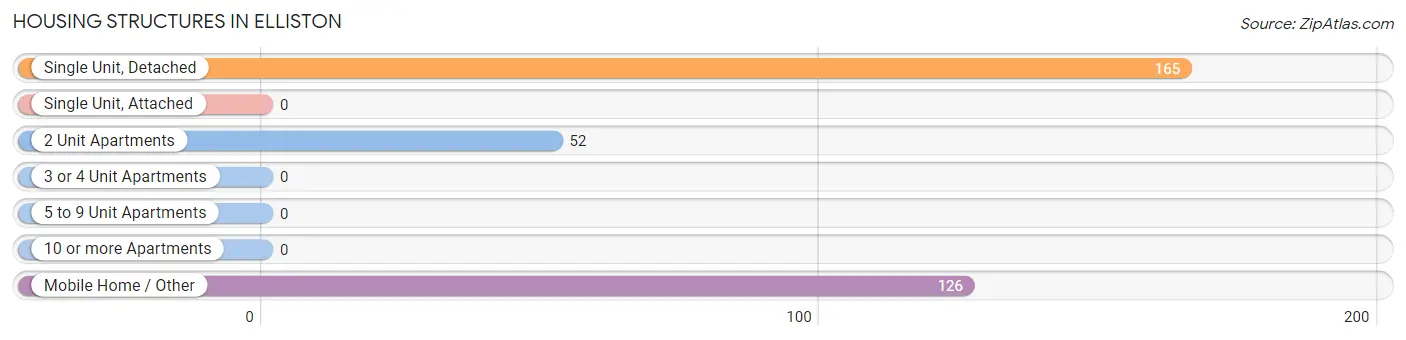
| Structure Type | # Housing Units | % Housing Units |
| Single Unit, Detached | 165 | 48.1% |
| Single Unit, Attached | 0 | 0.0% |
| 2 Unit Apartments | 52 | 15.2% |
| 3 or 4 Unit Apartments | 0 | 0.0% |
| 5 to 9 Unit Apartments | 0 | 0.0% |
| 10 or more Apartments | 0 | 0.0% |
| Mobile Home / Other | 126 | 36.7% |
| Total | 343 | 100.0% |
Housing Structures by Occupancy in Elliston
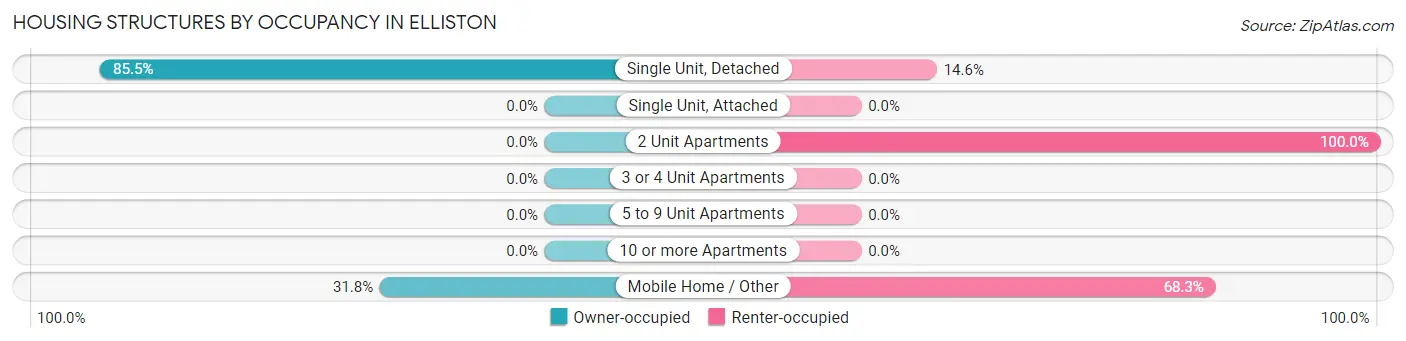
| Structure Type | Owner-occupied | Renter-occupied |
| Single Unit, Detached | 141 (85.5%) | 24 (14.5%) |
| Single Unit, Attached | 0 (0.0%) | 0 (0.0%) |
| 2 Unit Apartments | 0 (0.0%) | 52 (100.0%) |
| 3 or 4 Unit Apartments | 0 (0.0%) | 0 (0.0%) |
| 5 to 9 Unit Apartments | 0 (0.0%) | 0 (0.0%) |
| 10 or more Apartments | 0 (0.0%) | 0 (0.0%) |
| Mobile Home / Other | 40 (31.8%) | 86 (68.2%) |
| Total | 181 (52.8%) | 162 (47.2%) |
Housing Structures by Number of Rooms in Elliston
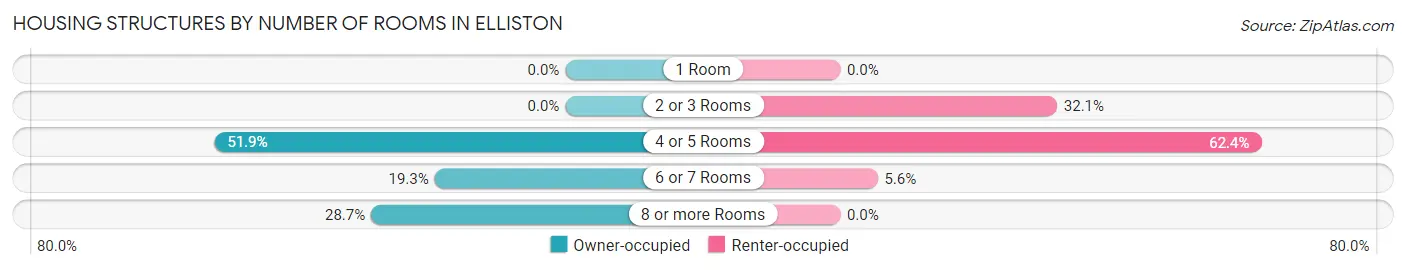
| Number of Rooms | Owner-occupied | Renter-occupied |
| 1 Room | 0 (0.0%) | 0 (0.0%) |
| 2 or 3 Rooms | 0 (0.0%) | 52 (32.1%) |
| 4 or 5 Rooms | 94 (51.9%) | 101 (62.4%) |
| 6 or 7 Rooms | 35 (19.3%) | 9 (5.6%) |
| 8 or more Rooms | 52 (28.7%) | 0 (0.0%) |
| Total | 181 (100.0%) | 162 (100.0%) |
Housing Structure by Heating Type in Elliston
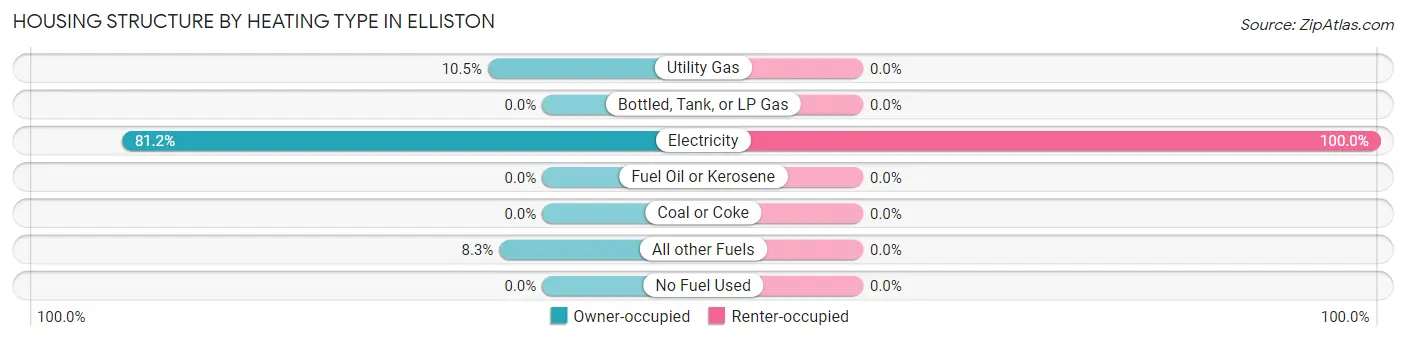
| Heating Type | Owner-occupied | Renter-occupied |
| Utility Gas | 19 (10.5%) | 0 (0.0%) |
| Bottled, Tank, or LP Gas | 0 (0.0%) | 0 (0.0%) |
| Electricity | 147 (81.2%) | 162 (100.0%) |
| Fuel Oil or Kerosene | 0 (0.0%) | 0 (0.0%) |
| Coal or Coke | 0 (0.0%) | 0 (0.0%) |
| All other Fuels | 15 (8.3%) | 0 (0.0%) |
| No Fuel Used | 0 (0.0%) | 0 (0.0%) |
| Total | 181 (100.0%) | 162 (100.0%) |
Household Vehicle Usage in Elliston
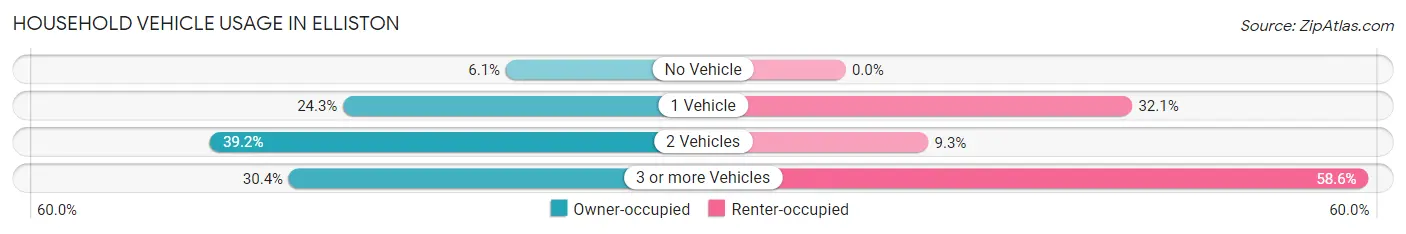
| Vehicles per Household | Owner-occupied | Renter-occupied |
| No Vehicle | 11 (6.1%) | 0 (0.0%) |
| 1 Vehicle | 44 (24.3%) | 52 (32.1%) |
| 2 Vehicles | 71 (39.2%) | 15 (9.3%) |
| 3 or more Vehicles | 55 (30.4%) | 95 (58.6%) |
| Total | 181 (100.0%) | 162 (100.0%) |
Real Estate & Mortgages in Elliston
Real Estate and Mortgage Overview in Elliston
| Characteristic | Without Mortgage | With Mortgage |
| Housing Units | 121 | 60 |
| Median Property Value | - | - |
| Median Household Income | - | - |
| Monthly Housing Costs | $370 | $0 |
| Real Estate Taxes | - | - |
Property Value by Mortgage Status in Elliston
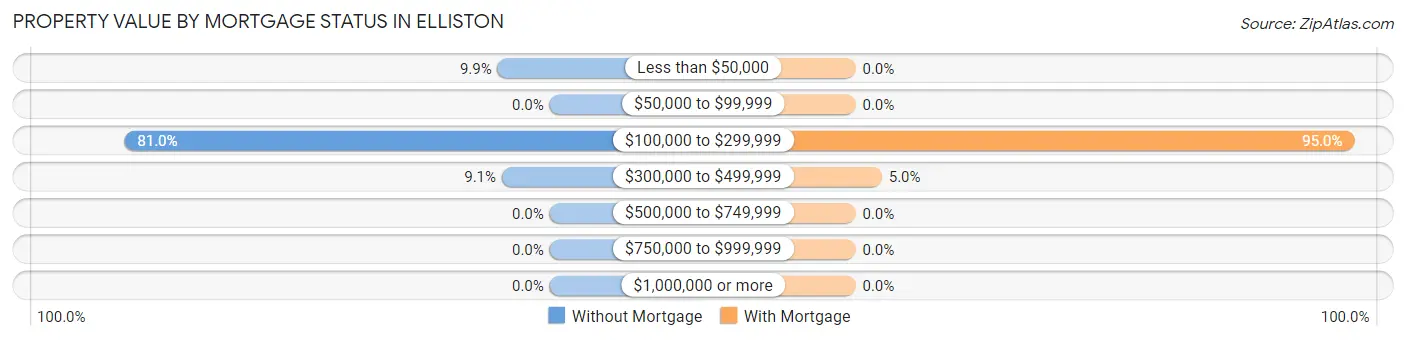
| Property Value | Without Mortgage | With Mortgage |
| Less than $50,000 | 12 (9.9%) | 0 (0.0%) |
| $50,000 to $99,999 | 0 (0.0%) | 0 (0.0%) |
| $100,000 to $299,999 | 98 (81.0%) | 57 (95.0%) |
| $300,000 to $499,999 | 11 (9.1%) | 3 (5.0%) |
| $500,000 to $749,999 | 0 (0.0%) | 0 (0.0%) |
| $750,000 to $999,999 | 0 (0.0%) | 0 (0.0%) |
| $1,000,000 or more | 0 (0.0%) | 0 (0.0%) |
| Total | 121 (100.0%) | 60 (100.0%) |
Household Income by Mortgage Status in Elliston
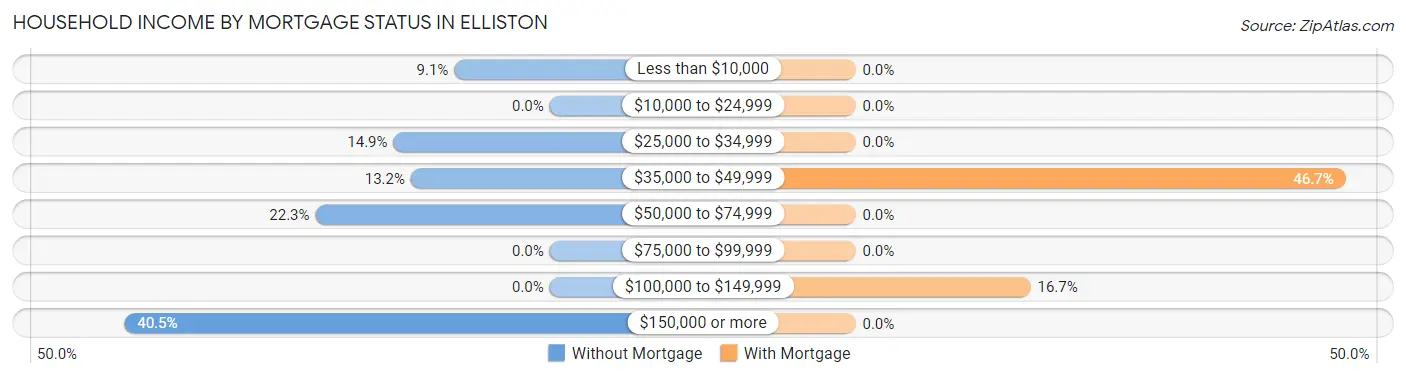
| Household Income | Without Mortgage | With Mortgage |
| Less than $10,000 | 11 (9.1%) | 0 (0.0%) |
| $10,000 to $24,999 | 0 (0.0%) | 0 (0.0%) |
| $25,000 to $34,999 | 18 (14.9%) | 0 (0.0%) |
| $35,000 to $49,999 | 16 (13.2%) | 28 (46.7%) |
| $50,000 to $74,999 | 27 (22.3%) | 0 (0.0%) |
| $75,000 to $99,999 | 0 (0.0%) | 0 (0.0%) |
| $100,000 to $149,999 | 0 (0.0%) | 10 (16.7%) |
| $150,000 or more | 49 (40.5%) | 0 (0.0%) |
| Total | 121 (100.0%) | 60 (100.0%) |
Property Value to Household Income Ratio in Elliston
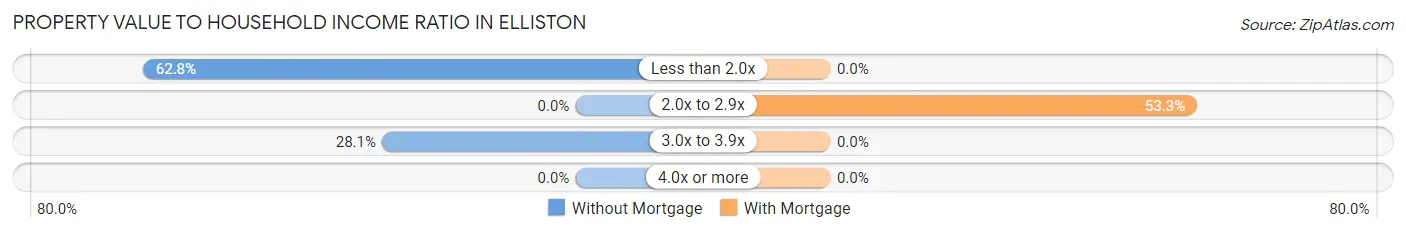
| Value-to-Income Ratio | Without Mortgage | With Mortgage |
| Less than 2.0x | 76 (62.8%) | 0 (0.0%) |
| 2.0x to 2.9x | 0 (0.0%) | 32 (53.3%) |
| 3.0x to 3.9x | 34 (28.1%) | 0 (0.0%) |
| 4.0x or more | 0 (0.0%) | 0 (0.0%) |
| Total | 121 (100.0%) | 60 (100.0%) |
Real Estate Taxes by Mortgage Status in Elliston
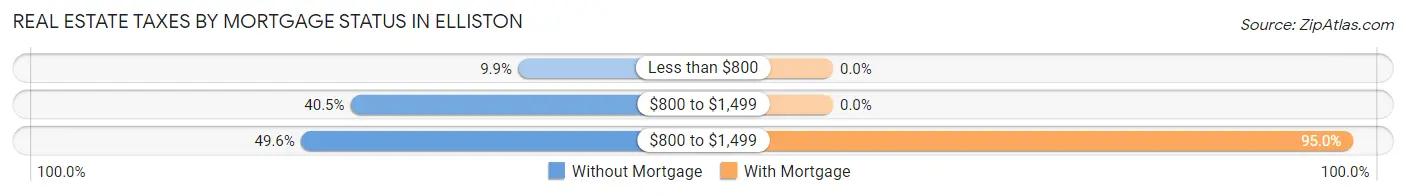
| Property Taxes | Without Mortgage | With Mortgage |
| Less than $800 | 12 (9.9%) | 0 (0.0%) |
| $800 to $1,499 | 49 (40.5%) | 0 (0.0%) |
| $800 to $1,499 | 60 (49.6%) | 57 (95.0%) |
| Total | 121 (100.0%) | 60 (100.0%) |
Health & Disability in Elliston
Health Insurance Coverage by Age in Elliston
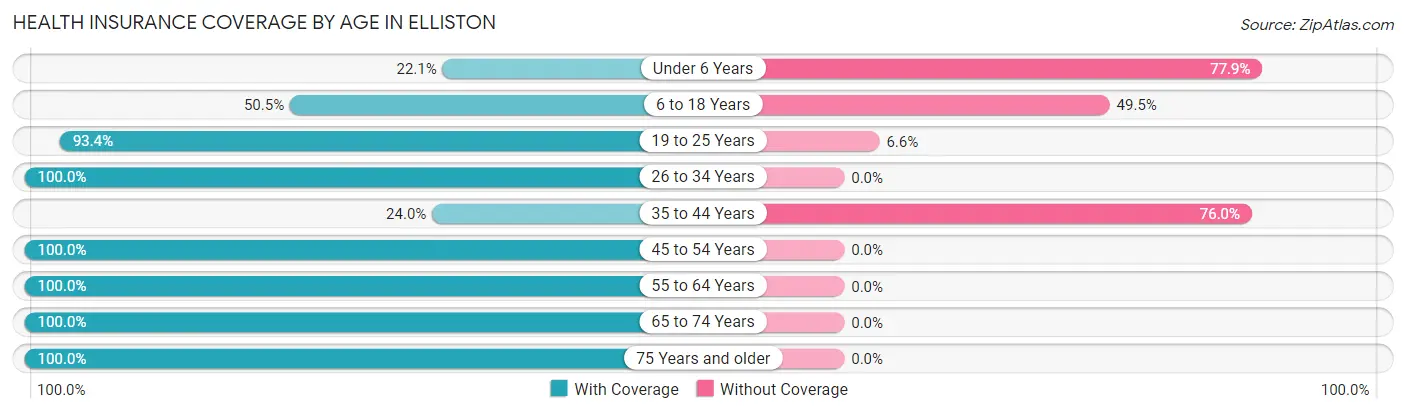
| Age Bracket | With Coverage | Without Coverage |
| Under 6 Years | 30 (22.1%) | 106 (77.9%) |
| 6 to 18 Years | 150 (50.5%) | 147 (49.5%) |
| 19 to 25 Years | 114 (93.4%) | 8 (6.6%) |
| 26 to 34 Years | 12 (100.0%) | 0 (0.0%) |
| 35 to 44 Years | 42 (24.0%) | 133 (76.0%) |
| 45 to 54 Years | 122 (100.0%) | 0 (0.0%) |
| 55 to 64 Years | 165 (100.0%) | 0 (0.0%) |
| 65 to 74 Years | 48 (100.0%) | 0 (0.0%) |
| 75 Years and older | 15 (100.0%) | 0 (0.0%) |
| Total | 698 (63.9%) | 394 (36.1%) |
Health Insurance Coverage by Citizenship Status in Elliston
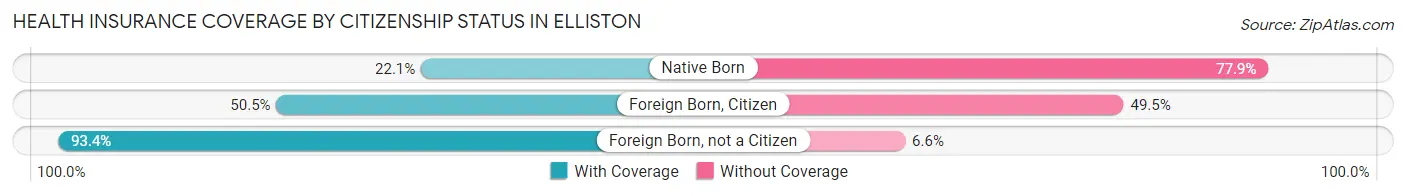
| Citizenship Status | With Coverage | Without Coverage |
| Native Born | 30 (22.1%) | 106 (77.9%) |
| Foreign Born, Citizen | 150 (50.5%) | 147 (49.5%) |
| Foreign Born, not a Citizen | 114 (93.4%) | 8 (6.6%) |
Health Insurance Coverage by Household Income in Elliston
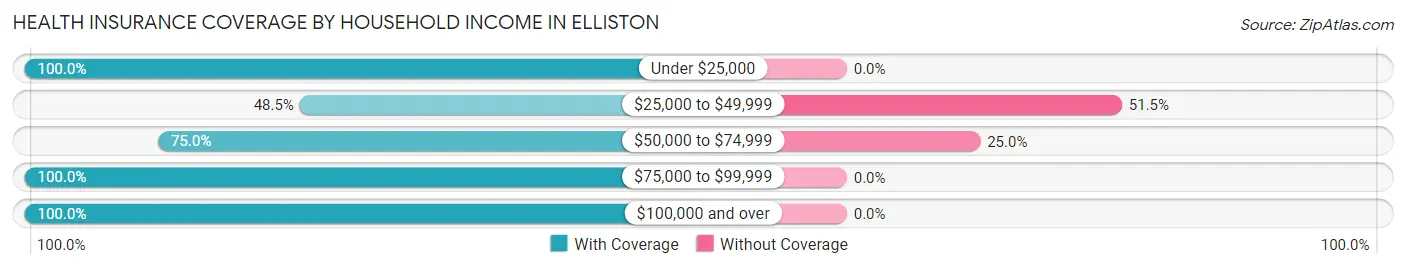
| Household Income | With Coverage | Without Coverage |
| Under $25,000 | 25 (100.0%) | 0 (0.0%) |
| $25,000 to $49,999 | 346 (48.5%) | 368 (51.5%) |
| $50,000 to $74,999 | 78 (75.0%) | 26 (25.0%) |
| $75,000 to $99,999 | 57 (100.0%) | 0 (0.0%) |
| $100,000 and over | 192 (100.0%) | 0 (0.0%) |
Public vs Private Health Insurance Coverage by Age in Elliston
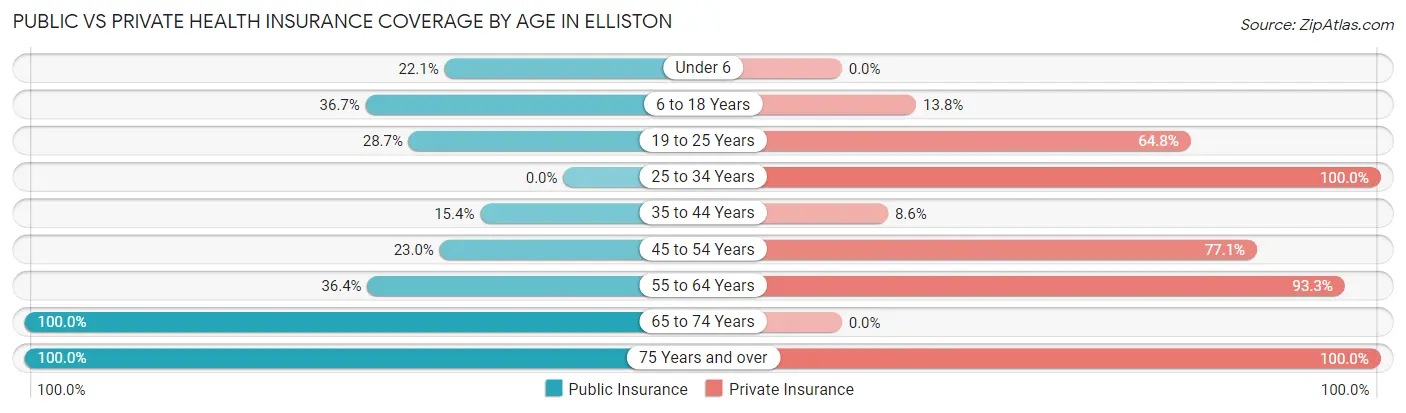
| Age Bracket | Public Insurance | Private Insurance |
| Under 6 | 30 (22.1%) | 0 (0.0%) |
| 6 to 18 Years | 109 (36.7%) | 41 (13.8%) |
| 19 to 25 Years | 35 (28.7%) | 79 (64.7%) |
| 25 to 34 Years | 0 (0.0%) | 12 (100.0%) |
| 35 to 44 Years | 27 (15.4%) | 15 (8.6%) |
| 45 to 54 Years | 28 (23.0%) | 94 (77.0%) |
| 55 to 64 Years | 60 (36.4%) | 154 (93.3%) |
| 65 to 74 Years | 48 (100.0%) | 0 (0.0%) |
| 75 Years and over | 15 (100.0%) | 15 (100.0%) |
| Total | 352 (32.2%) | 410 (37.6%) |
Disability Status by Sex by Age in Elliston
| Age Bracket | Male | Female |
| Under 5 Years | 0 (0.0%) | 0 (0.0%) |
| 5 to 17 Years | 0 (0.0%) | 0 (0.0%) |
| 18 to 34 Years | 0 (0.0%) | 0 (0.0%) |
| 35 to 64 Years | 0 (0.0%) | 0 (0.0%) |
| 65 to 74 Years | 0 (0.0%) | 0 (0.0%) |
| 75 Years and over | 0 (0.0%) | 0 (0.0%) |
Disability Class by Sex by Age in Elliston
Disability Class: Hearing Difficulty
| Age Bracket | Male | Female |
| Under 5 Years | 0 (0.0%) | 0 (0.0%) |
| 5 to 17 Years | 0 (0.0%) | 0 (0.0%) |
| 18 to 34 Years | 0 (0.0%) | 0 (0.0%) |
| 35 to 64 Years | 0 (0.0%) | 0 (0.0%) |
| 65 to 74 Years | 0 (0.0%) | 0 (0.0%) |
| 75 Years and over | 0 (0.0%) | 0 (0.0%) |
Disability Class: Vision Difficulty
| Age Bracket | Male | Female |
| Under 5 Years | 0 (0.0%) | 0 (0.0%) |
| 5 to 17 Years | 0 (0.0%) | 0 (0.0%) |
| 18 to 34 Years | 0 (0.0%) | 0 (0.0%) |
| 35 to 64 Years | 0 (0.0%) | 0 (0.0%) |
| 65 to 74 Years | 0 (0.0%) | 0 (0.0%) |
| 75 Years and over | 0 (0.0%) | 0 (0.0%) |
Disability Class: Cognitive Difficulty
| Age Bracket | Male | Female |
| 5 to 17 Years | 0 (0.0%) | 0 (0.0%) |
| 18 to 34 Years | 0 (0.0%) | 0 (0.0%) |
| 35 to 64 Years | 0 (0.0%) | 0 (0.0%) |
| 65 to 74 Years | 0 (0.0%) | 0 (0.0%) |
| 75 Years and over | 0 (0.0%) | 0 (0.0%) |
Disability Class: Ambulatory Difficulty
| Age Bracket | Male | Female |
| 5 to 17 Years | 0 (0.0%) | 0 (0.0%) |
| 18 to 34 Years | 0 (0.0%) | 0 (0.0%) |
| 35 to 64 Years | 0 (0.0%) | 0 (0.0%) |
| 65 to 74 Years | 0 (0.0%) | 0 (0.0%) |
| 75 Years and over | 0 (0.0%) | 0 (0.0%) |
Disability Class: Self-Care Difficulty

| Age Bracket | Male | Female |
| 5 to 17 Years | 0 (0.0%) | 0 (0.0%) |
| 18 to 34 Years | 0 (0.0%) | 0 (0.0%) |
| 35 to 64 Years | 0 (0.0%) | 0 (0.0%) |
| 65 to 74 Years | 0 (0.0%) | 0 (0.0%) |
| 75 Years and over | 0 (0.0%) | 0 (0.0%) |
Technology Access in Elliston
Computing Device Access in Elliston
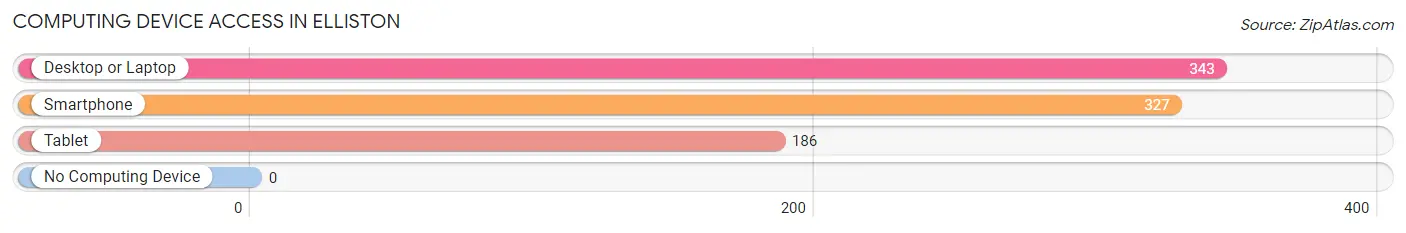
| Device Type | # Households | % Households |
| Desktop or Laptop | 343 | 100.0% |
| Smartphone | 327 | 95.3% |
| Tablet | 186 | 54.2% |
| No Computing Device | 0 | 0.0% |
| Total | 343 | 100.0% |
Internet Access in Elliston
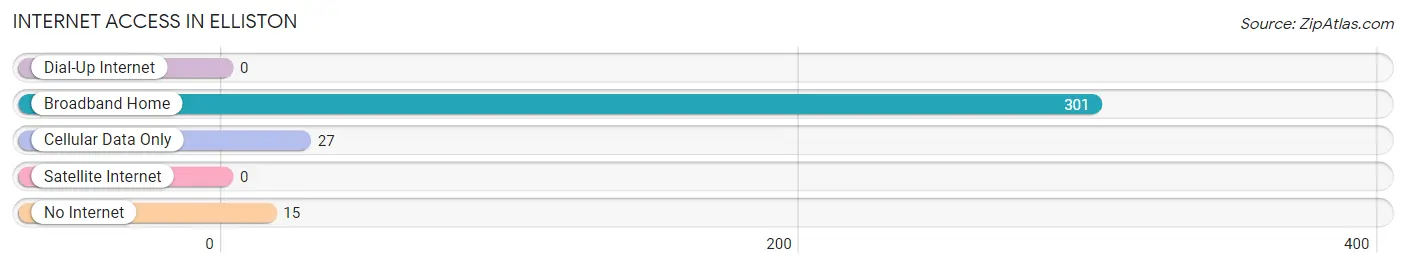
| Internet Type | # Households | % Households |
| Dial-Up Internet | 0 | 0.0% |
| Broadband Home | 301 | 87.8% |
| Cellular Data Only | 27 | 7.9% |
| Satellite Internet | 0 | 0.0% |
| No Internet | 15 | 4.4% |
| Total | 343 | 100.0% |
Elliston Summary
Elliston, Virginia is a small town located in Montgomery County, Virginia. It is situated in the Roanoke Valley, approximately 10 miles north of the city of Roanoke. The town was established in 1837 and is named after the family of William Elliston, who owned the land on which the town was built. The population of Elliston was 1,072 as of the 2010 census.
History
The area that is now Elliston was originally inhabited by the Monacan Indians. The first European settlers arrived in the area in the late 1700s. The town of Elliston was established in 1837 and was named after the family of William Elliston, who owned the land on which the town was built.
In the late 1800s, Elliston was a thriving agricultural community. The town was home to several mills, including a grist mill, a saw mill, and a woolen mill. The town also had a post office, a general store, and a blacksmith shop.
In the early 1900s, Elliston began to decline as the railroad bypassed the town. The mills closed and the population began to decline. The town was revitalized in the 1950s when the Elliston-Lafayette Industrial Park was established. The industrial park brought new jobs to the area and the population began to grow again.
Geography
Elliston is located in the Roanoke Valley in Montgomery County, Virginia. The town is situated at the intersection of US Route 11 and Virginia State Route 614. The town is approximately 10 miles north of the city of Roanoke.
The terrain around Elliston is mostly rolling hills and valleys. The town is located in the Appalachian Mountains and is surrounded by the Blue Ridge Mountains to the east and the Allegheny Mountains to the west.
Economy
The economy of Elliston is largely based on agriculture and manufacturing. The town is home to several farms, which produce a variety of crops, including corn, soybeans, and hay. The Elliston-Lafayette Industrial Park is also located in the town and is home to several manufacturing companies.
The town is also home to several small businesses, including restaurants, retail stores, and service providers. The town also has a post office, a bank, and a library.
Demographics
As of the 2010 census, the population of Elliston was 1,072. The racial makeup of the town was 95.3% White, 2.2% African American, 0.3% Native American, 0.3% Asian, 0.2% from other races, and 1.7% from two or more races. Hispanic or Latino of any race were 1.2% of the population.
The median household income in Elliston was $37,917, and the median family income was $45,000. The per capita income for the town was $19,945. About 11.2% of families and 14.2% of the population were below the poverty line, including 18.2% of those under age 18 and 8.3% of those age 65 or over.
Common Questions
What is Per Capita Income in Elliston?
Per Capita income in Elliston is $23,847.
What is the Median Household income in Elliston?
Median Household Income in Elliston is $33,870.
What is Inequality or Gini Index in Elliston?
Inequality or Gini Index in Elliston is 0.47.
What is the Total Population of Elliston?
Total Population of Elliston is 1,092.
What is the Total Male Population of Elliston?
Total Male Population of Elliston is 438.
What is the Total Female Population of Elliston?
Total Female Population of Elliston is 654.
What is the Ratio of Males per 100 Females in Elliston?
There are 66.97 Males per 100 Females in Elliston.
What is the Ratio of Females per 100 Males in Elliston?
There are 149.32 Females per 100 Males in Elliston.
What is the Median Population Age in Elliston?
Median Population Age in Elliston is 23.1 Years.
What is the Average Family Size in Elliston
Average Family Size in Elliston is 4.0 People.
What is the Average Household Size in Elliston
Average Household Size in Elliston is 3.2 People.
How Large is the Labor Force in Elliston?
There are 391 People in the Labor Forcein in Elliston.
What is the Percentage of People in the Labor Force in Elliston?
47.7% of People are in the Labor Force in Elliston.