Loch Lomond, VA Map & Demographics
Loch Lomond Map
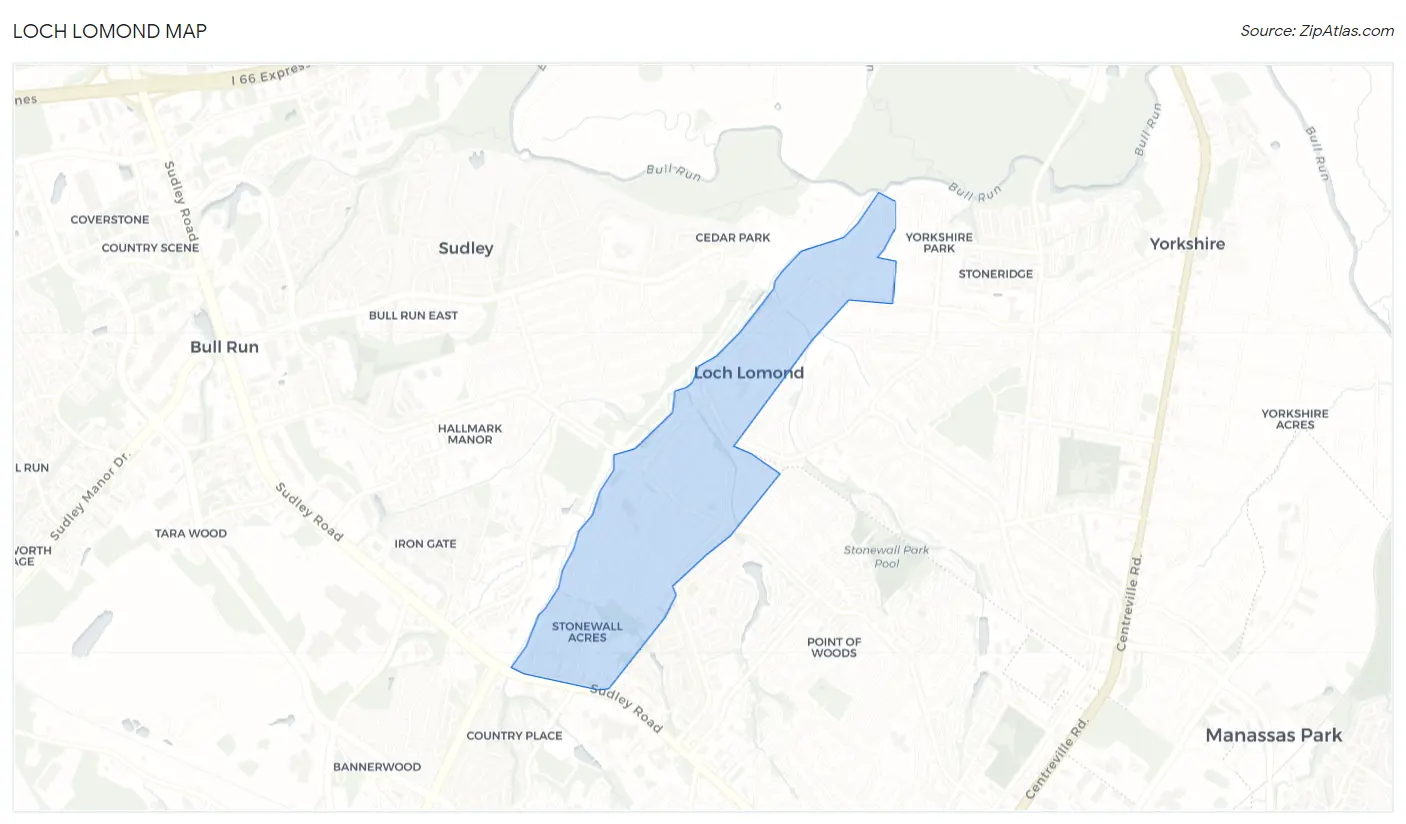
Loch Lomond Overview
$33,767
PER CAPITA INCOME
$106,447
AVG FAMILY INCOME
$106,024
AVG HOUSEHOLD INCOME
25.8%
WAGE / INCOME GAP [ % ]
74.2¢/ $1
WAGE / INCOME GAP [ $ ]
0.29
INEQUALITY / GINI INDEX
3,851
TOTAL POPULATION
1,926
MALE POPULATION
1,925
FEMALE POPULATION
100.05
MALES / 100 FEMALES
99.95
FEMALES / 100 MALES
37.0
MEDIAN AGE
3.7
AVG FAMILY SIZE
3.6
AVG HOUSEHOLD SIZE
2,190
LABOR FORCE [ PEOPLE ]
69.6%
PERCENT IN LABOR FORCE
10.0%
UNEMPLOYMENT RATE
Income in Loch Lomond
Income Overview in Loch Lomond
Per Capita Income in Loch Lomond is $33,767, while median incomes of families and households are $106,447 and $106,024 respectively.
| Characteristic | Number | Measure |
| Per Capita Income | 3,851 | $33,767 |
| Median Family Income | 930 | $106,447 |
| Mean Family Income | 930 | $121,548 |
| Median Household Income | 1,075 | $106,024 |
| Mean Household Income | 1,075 | $120,032 |
| Income Deficit | 930 | $0 |
| Wage / Income Gap (%) | 3,851 | 25.79% |
| Wage / Income Gap ($) | 3,851 | 74.21¢ per $1 |
| Gini / Inequality Index | 3,851 | 0.29 |
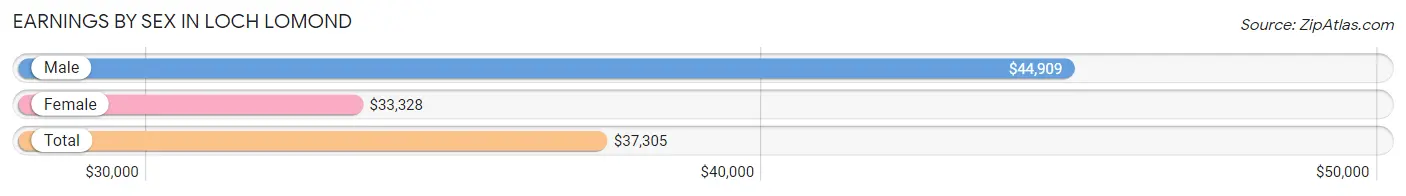
Earnings by Sex in Loch Lomond
Average Earnings in Loch Lomond are $37,305, $44,909 for men and $33,328 for women, a difference of 25.8%.
| Sex | Number | Average Earnings |
| Male | 1,343 (60.3%) | $44,909 |
| Female | 883 (39.7%) | $33,328 |
| Total | 2,226 (100.0%) | $37,305 |
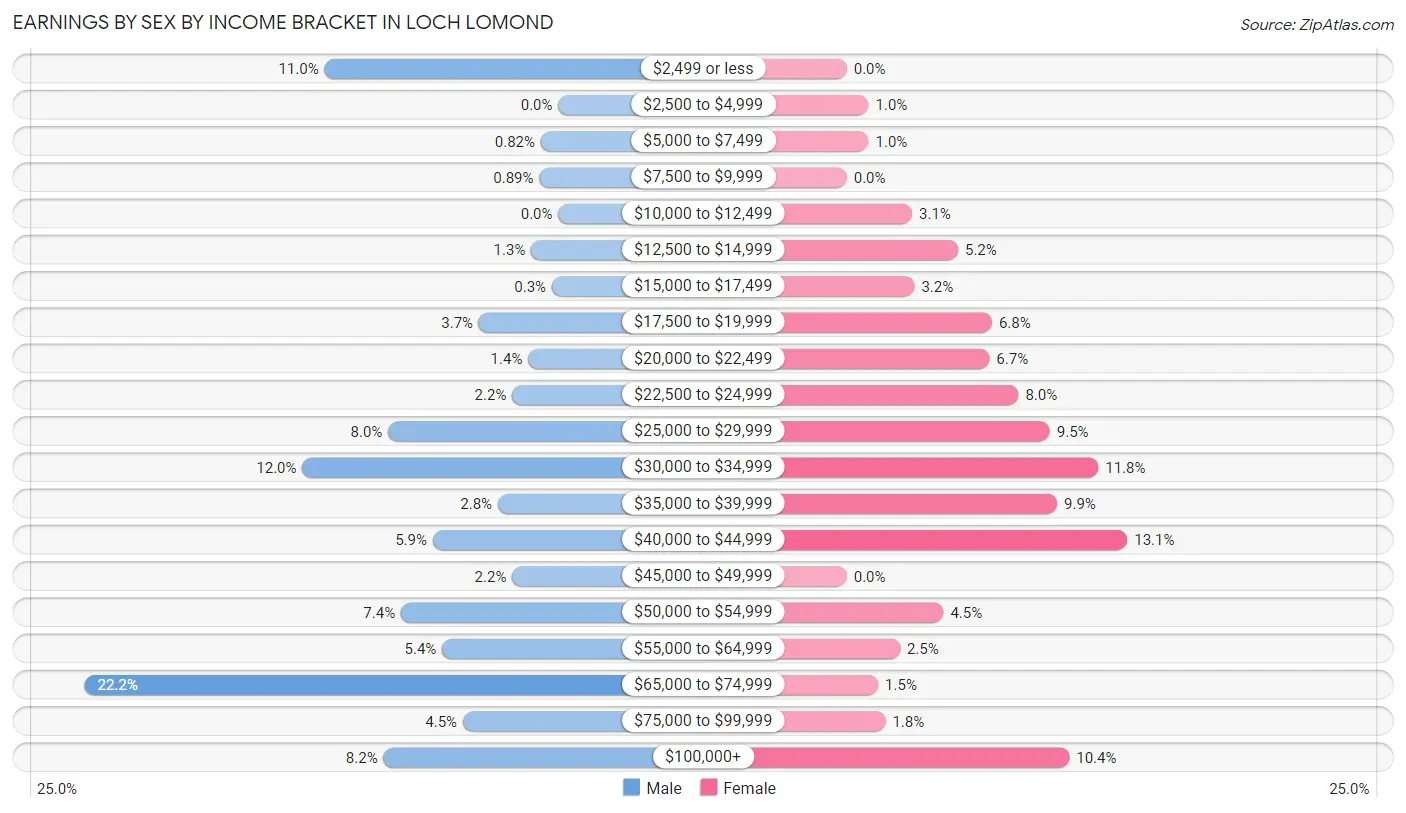
Earnings by Sex by Income Bracket in Loch Lomond
The most common earnings brackets in Loch Lomond are $65,000 to $74,999 for men (298 | 22.2%) and $40,000 to $44,999 for women (116 | 13.1%).
| Income | Male | Female |
| $2,499 or less | 147 (11.0%) | 0 (0.0%) |
| $2,500 to $4,999 | 0 (0.0%) | 9 (1.0%) |
| $5,000 to $7,499 | 11 (0.8%) | 9 (1.0%) |
| $7,500 to $9,999 | 12 (0.9%) | 0 (0.0%) |
| $10,000 to $12,499 | 0 (0.0%) | 27 (3.1%) |
| $12,500 to $14,999 | 17 (1.3%) | 46 (5.2%) |
| $15,000 to $17,499 | 4 (0.3%) | 28 (3.2%) |
| $17,500 to $19,999 | 50 (3.7%) | 60 (6.8%) |
| $20,000 to $22,499 | 19 (1.4%) | 59 (6.7%) |
| $22,500 to $24,999 | 29 (2.2%) | 71 (8.0%) |
| $25,000 to $29,999 | 107 (8.0%) | 84 (9.5%) |
| $30,000 to $34,999 | 161 (12.0%) | 104 (11.8%) |
| $35,000 to $39,999 | 38 (2.8%) | 87 (9.9%) |
| $40,000 to $44,999 | 79 (5.9%) | 116 (13.1%) |
| $45,000 to $49,999 | 29 (2.2%) | 0 (0.0%) |
| $50,000 to $54,999 | 99 (7.4%) | 40 (4.5%) |
| $55,000 to $64,999 | 73 (5.4%) | 22 (2.5%) |
| $65,000 to $74,999 | 298 (22.2%) | 13 (1.5%) |
| $75,000 to $99,999 | 60 (4.5%) | 16 (1.8%) |
| $100,000+ | 110 (8.2%) | 92 (10.4%) |
| Total | 1,343 (100.0%) | 883 (100.0%) |
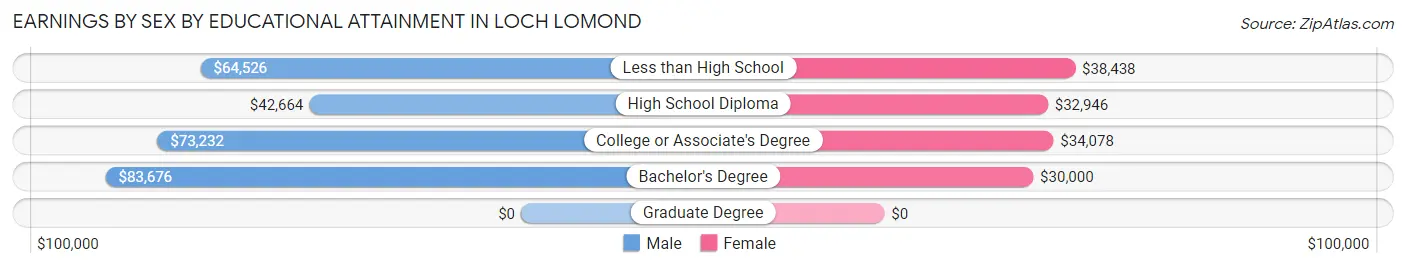
Earnings by Sex by Educational Attainment in Loch Lomond
Average earnings in Loch Lomond are $63,182 for men and $34,548 for women, a difference of 45.3%. Men with an educational attainment of bachelor's degree enjoy the highest average annual earnings of $83,676, while those with high school diploma education earn the least with $42,664. Women with an educational attainment of less than high school earn the most with the average annual earnings of $38,438, while those with bachelor's degree education have the smallest earnings of $30,000.
| Educational Attainment | Male Income | Female Income |
| Less than High School | $64,526 | $38,438 |
| High School Diploma | $42,664 | $32,946 |
| College or Associate's Degree | $73,232 | $34,078 |
| Bachelor's Degree | $83,676 | $30,000 |
| Graduate Degree | - | - |
| Total | $63,182 | $34,548 |
Family Income in Loch Lomond
Family Income Brackets in Loch Lomond
According to the Loch Lomond family income data, there are 454 families falling into the $100,000 to $149,999 income range, which is the most common income bracket and makes up 48.8% of all families.
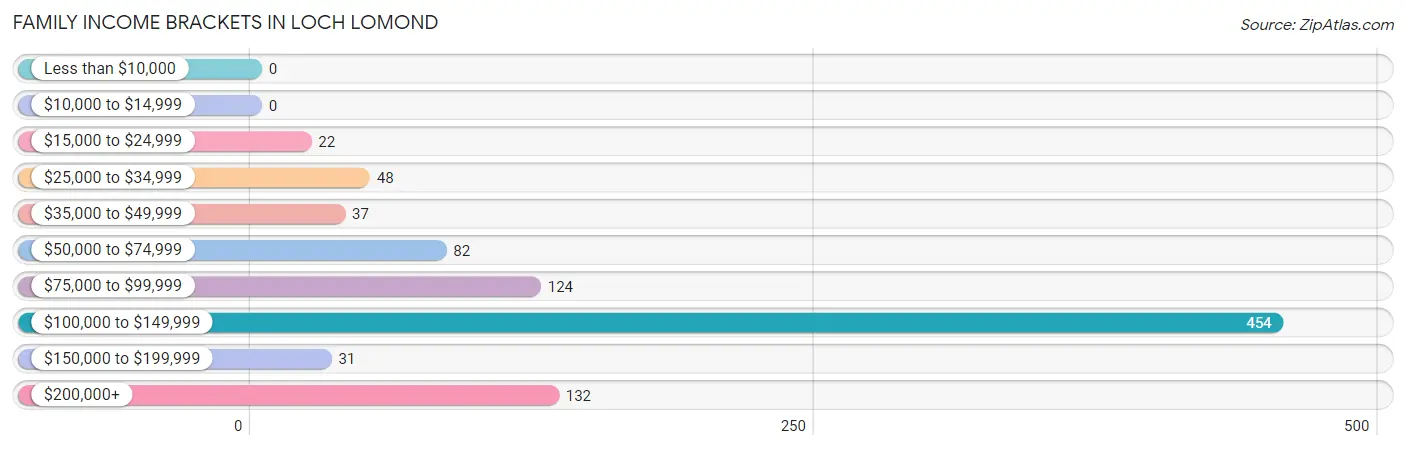
| Income Bracket | # Families | % Families |
| Less than $10,000 | 0 | 0.0% |
| $10,000 to $14,999 | 0 | 0.0% |
| $15,000 to $24,999 | 22 | 2.4% |
| $25,000 to $34,999 | 48 | 5.2% |
| $35,000 to $49,999 | 37 | 4.0% |
| $50,000 to $74,999 | 82 | 8.8% |
| $75,000 to $99,999 | 124 | 13.3% |
| $100,000 to $149,999 | 454 | 48.8% |
| $150,000 to $199,999 | 31 | 3.3% |
| $200,000+ | 132 | 14.2% |
Family Income by Famaliy Size in Loch Lomond
3-person families (94 | 10.1%) account for the highest median family income in Loch Lomond with $140,294 per family, while 2-person families (345 | 37.1%) have the highest median income of $52,704 per family member.
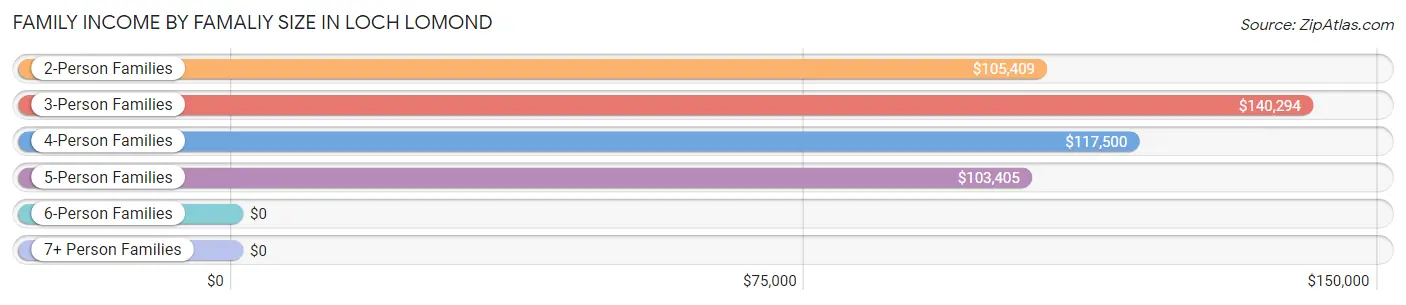
| Income Bracket | # Families | Median Income |
| 2-Person Families | 345 (37.1%) | $105,409 |
| 3-Person Families | 94 (10.1%) | $140,294 |
| 4-Person Families | 248 (26.7%) | $117,500 |
| 5-Person Families | 90 (9.7%) | $103,405 |
| 6-Person Families | 136 (14.6%) | $0 |
| 7+ Person Families | 17 (1.8%) | $0 |
| Total | 930 (100.0%) | $106,447 |
Family Income by Number of Earners in Loch Lomond
The median family income in Loch Lomond is $106,447, with families comprising 3+ earners (230) having the highest median family income of $130,918, while families with 1 earner (223) have the lowest median family income of $74,646, accounting for 24.7% and 24.0% of families, respectively.
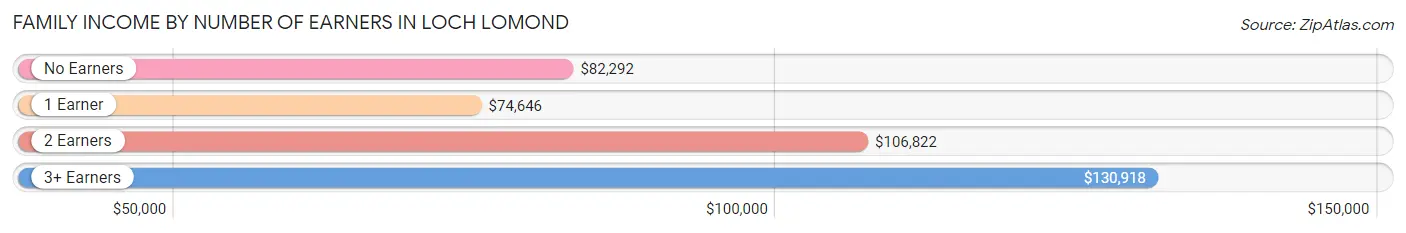
| Number of Earners | # Families | Median Income |
| No Earners | 47 (5.1%) | $82,292 |
| 1 Earner | 223 (24.0%) | $74,646 |
| 2 Earners | 430 (46.2%) | $106,822 |
| 3+ Earners | 230 (24.7%) | $130,918 |
| Total | 930 (100.0%) | $106,447 |
Household Income in Loch Lomond
Household Income Brackets in Loch Lomond
With 433 households falling in the category, the $100,000 to $149,999 income range is the most frequent in Loch Lomond, accounting for 40.3% of all households.
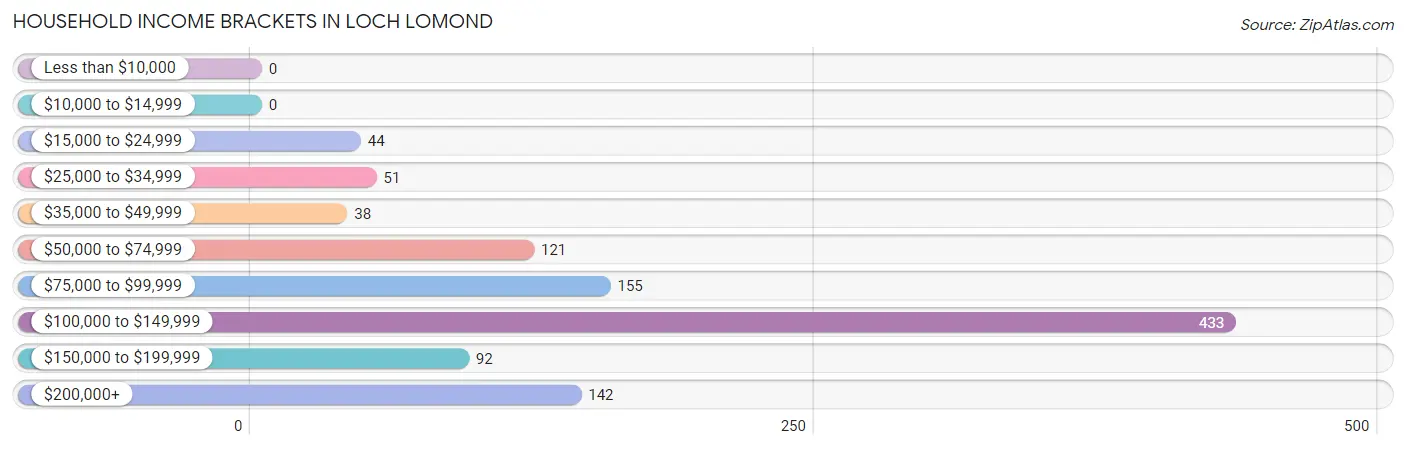
| Income Bracket | # Households | % Households |
| Less than $10,000 | 0 | 0.0% |
| $10,000 to $14,999 | 0 | 0.0% |
| $15,000 to $24,999 | 44 | 4.1% |
| $25,000 to $34,999 | 51 | 4.7% |
| $35,000 to $49,999 | 38 | 3.5% |
| $50,000 to $74,999 | 121 | 11.3% |
| $75,000 to $99,999 | 155 | 14.4% |
| $100,000 to $149,999 | 433 | 40.3% |
| $150,000 to $199,999 | 92 | 8.6% |
| $200,000+ | 142 | 13.2% |
Household Income by Householder Age in Loch Lomond
The median household income in Loch Lomond is $106,024, with the highest median household income of $106,659 found in the 25 to 44 years age bracket for the primary householder. A total of 216 households (20.1%) fall into this category. Meanwhile, the 15 to 24 years age bracket for the primary householder has the lowest median household income of $0, with 9 households (0.8%) in this group.
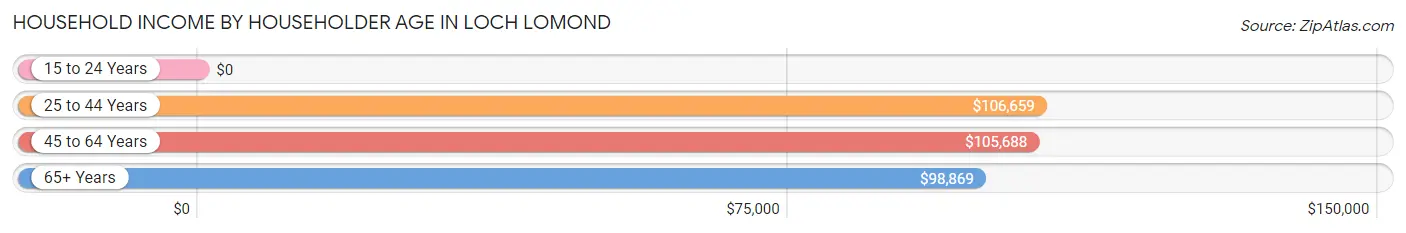
| Income Bracket | # Households | Median Income |
| 15 to 24 Years | 9 (0.8%) | $0 |
| 25 to 44 Years | 216 (20.1%) | $106,659 |
| 45 to 64 Years | 525 (48.8%) | $105,688 |
| 65+ Years | 325 (30.2%) | $98,869 |
| Total | 1,075 (100.0%) | $106,024 |
Poverty in Loch Lomond
Income Below Poverty by Sex and Age in Loch Lomond
With 2.2% poverty level for males and 8.9% for females among the residents of Loch Lomond, 25 to 34 year old males and under 5 year old females are the most vulnerable to poverty, with 24 males (10.5%) and 26 females (54.2%) in their respective age groups living below the poverty level.
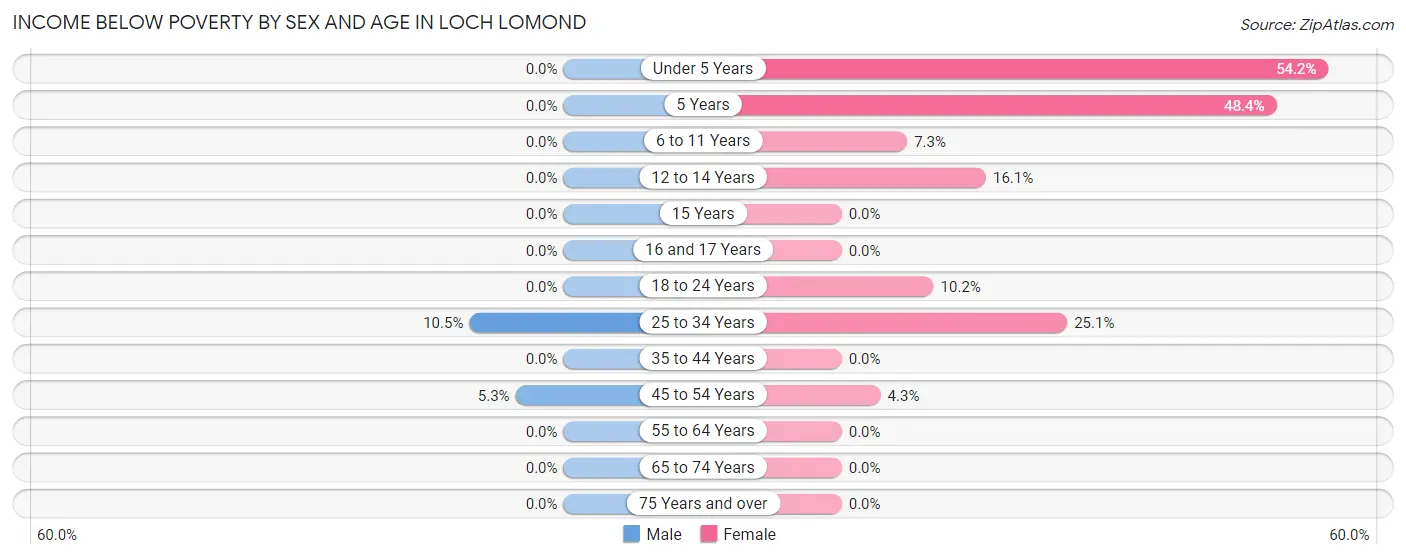
| Age Bracket | Male | Female |
| Under 5 Years | 0 (0.0%) | 26 (54.2%) |
| 5 Years | 0 (0.0%) | 15 (48.4%) |
| 6 to 11 Years | 0 (0.0%) | 18 (7.3%) |
| 12 to 14 Years | 0 (0.0%) | 18 (16.1%) |
| 15 Years | 0 (0.0%) | 0 (0.0%) |
| 16 and 17 Years | 0 (0.0%) | 0 (0.0%) |
| 18 to 24 Years | 0 (0.0%) | 18 (10.2%) |
| 25 to 34 Years | 24 (10.5%) | 57 (25.1%) |
| 35 to 44 Years | 0 (0.0%) | 0 (0.0%) |
| 45 to 54 Years | 18 (5.3%) | 17 (4.3%) |
| 55 to 64 Years | 0 (0.0%) | 0 (0.0%) |
| 65 to 74 Years | 0 (0.0%) | 0 (0.0%) |
| 75 Years and over | 0 (0.0%) | 0 (0.0%) |
| Total | 42 (2.2%) | 169 (8.9%) |
Income Above Poverty by Sex and Age in Loch Lomond
According to the poverty statistics in Loch Lomond, males aged under 5 years and females aged 16 and 17 years are the age groups that are most secure financially, with 100.0% of males and 100.0% of females in these age groups living above the poverty line.
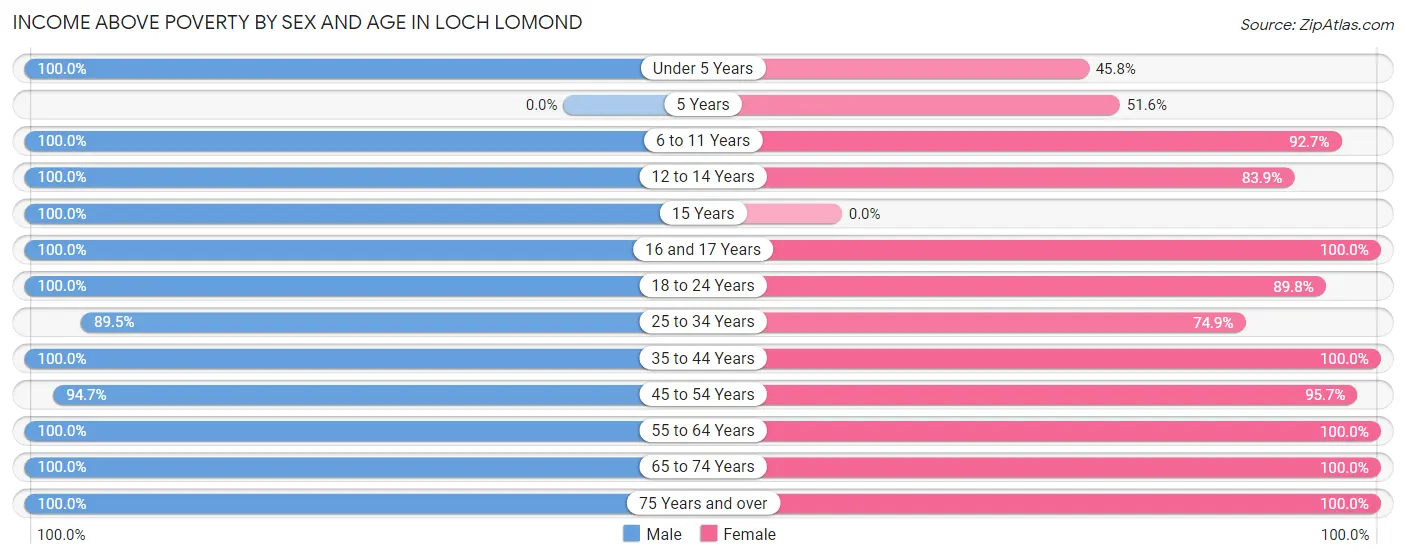
| Age Bracket | Male | Female |
| Under 5 Years | 68 (100.0%) | 22 (45.8%) |
| 5 Years | 0 (0.0%) | 16 (51.6%) |
| 6 to 11 Years | 101 (100.0%) | 229 (92.7%) |
| 12 to 14 Years | 10 (100.0%) | 94 (83.9%) |
| 15 Years | 57 (100.0%) | 0 (0.0%) |
| 16 and 17 Years | 91 (100.0%) | 64 (100.0%) |
| 18 to 24 Years | 365 (100.0%) | 158 (89.8%) |
| 25 to 34 Years | 205 (89.5%) | 170 (74.9%) |
| 35 to 44 Years | 279 (100.0%) | 160 (100.0%) |
| 45 to 54 Years | 319 (94.7%) | 376 (95.7%) |
| 55 to 64 Years | 166 (100.0%) | 151 (100.0%) |
| 65 to 74 Years | 109 (100.0%) | 171 (100.0%) |
| 75 Years and over | 114 (100.0%) | 114 (100.0%) |
| Total | 1,884 (97.8%) | 1,725 (91.1%) |
Income Below Poverty Among Married-Couple Families in Loch Lomond
The poverty statistics for married-couple families in Loch Lomond show that 3.0% or 17 of the total 575 families live below the poverty line. Families with 1 or 2 children have the highest poverty rate of 7.9%, comprising of 17 families. On the other hand, families with no children have the lowest poverty rate of 0.0%, which includes 0 families.
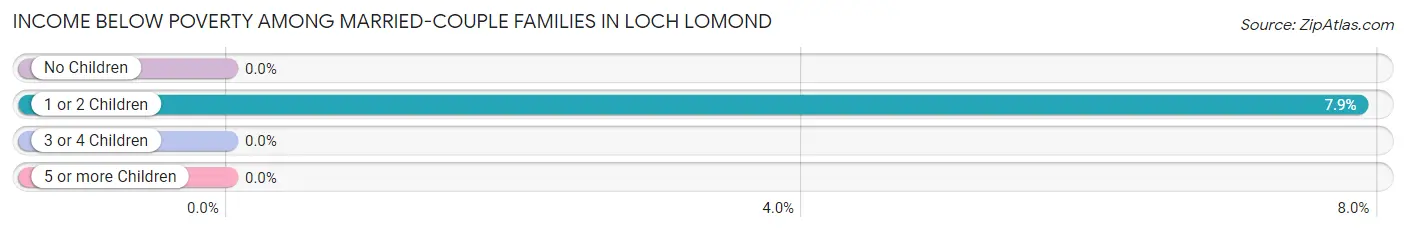
| Children | Above Poverty | Below Poverty |
| No Children | 296 (100.0%) | 0 (0.0%) |
| 1 or 2 Children | 199 (92.1%) | 17 (7.9%) |
| 3 or 4 Children | 63 (100.0%) | 0 (0.0%) |
| 5 or more Children | 0 (0.0%) | 0 (0.0%) |
| Total | 558 (97.0%) | 17 (3.0%) |
Income Below Poverty Among Single-Parent Households in Loch Lomond
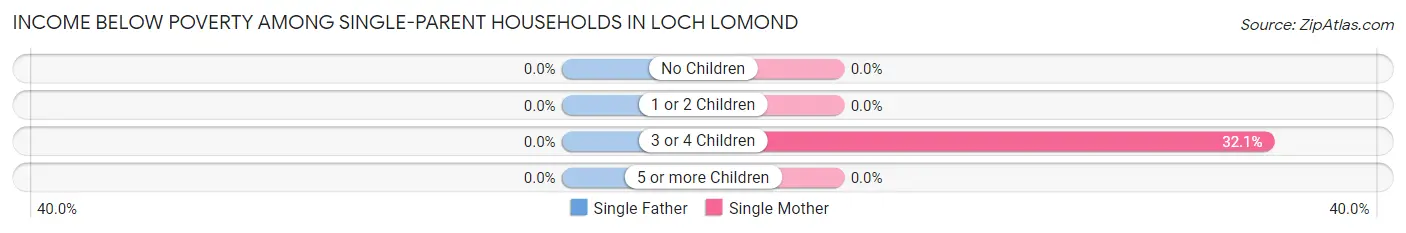
| Children | Single Father | Single Mother |
| No Children | 0 (0.0%) | 0 (0.0%) |
| 1 or 2 Children | 0 (0.0%) | 0 (0.0%) |
| 3 or 4 Children | 0 (0.0%) | 17 (32.1%) |
| 5 or more Children | 0 (0.0%) | 0 (0.0%) |
| Total | 0 (0.0%) | 17 (7.8%) |
Income Below Poverty Among Married-Couple vs Single-Parent Households in Loch Lomond
The poverty data for Loch Lomond shows that 17 of the married-couple family households (3.0%) and 17 of the single-parent households (4.8%) are living below the poverty level. Within the married-couple family households, those with 1 or 2 children have the highest poverty rate, with 17 households (7.9%) falling below the poverty line. Among the single-parent households, those with 3 or 4 children have the highest poverty rate, with 17 household (32.1%) living below poverty.
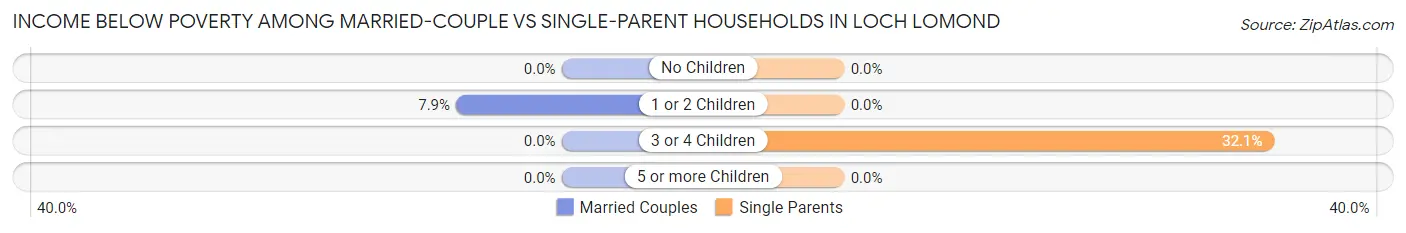
| Children | Married-Couple Families | Single-Parent Households |
| No Children | 0 (0.0%) | 0 (0.0%) |
| 1 or 2 Children | 17 (7.9%) | 0 (0.0%) |
| 3 or 4 Children | 0 (0.0%) | 17 (32.1%) |
| 5 or more Children | 0 (0.0%) | 0 (0.0%) |
| Total | 17 (3.0%) | 17 (4.8%) |
Race in Loch Lomond
The most populous races in Loch Lomond are Hispanic or Latino (2,394 | 62.2%), White / Caucasian (1,808 | 46.9%), and Some other Race (1,127 | 29.3%).
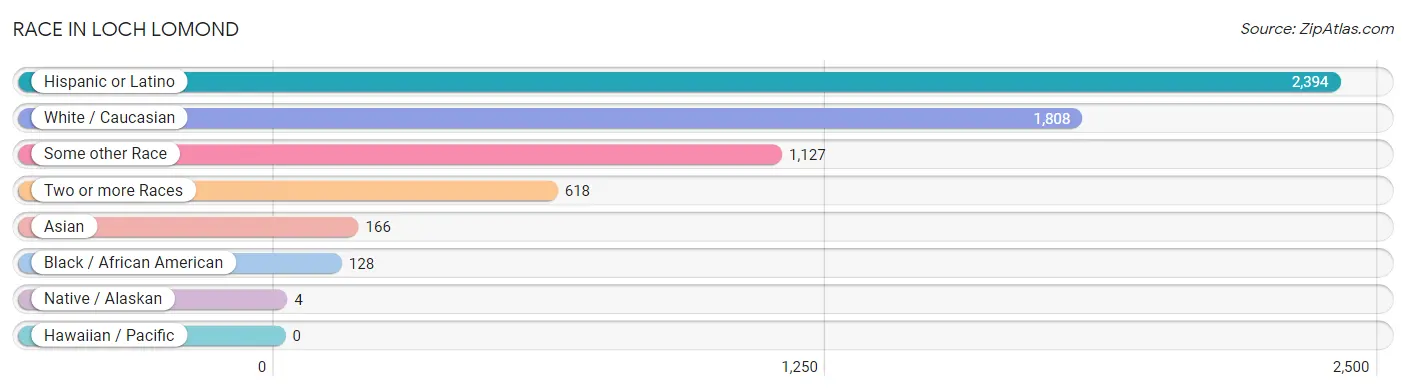
| Race | # Population | % Population |
| Asian | 166 | 4.3% |
| Black / African American | 128 | 3.3% |
| Hawaiian / Pacific | 0 | 0.0% |
| Hispanic or Latino | 2,394 | 62.2% |
| Native / Alaskan | 4 | 0.1% |
| White / Caucasian | 1,808 | 46.9% |
| Two or more Races | 618 | 16.1% |
| Some other Race | 1,127 | 29.3% |
| Total | 3,851 | 100.0% |
Ancestry in Loch Lomond
The most populous ancestries reported in Loch Lomond are Central American (1,299 | 33.7%), Salvadoran (1,065 | 27.7%), Mexican (569 | 14.8%), South American (422 | 11.0%), and Bolivian (345 | 9.0%), together accounting for 96.1% of all Loch Lomond residents.
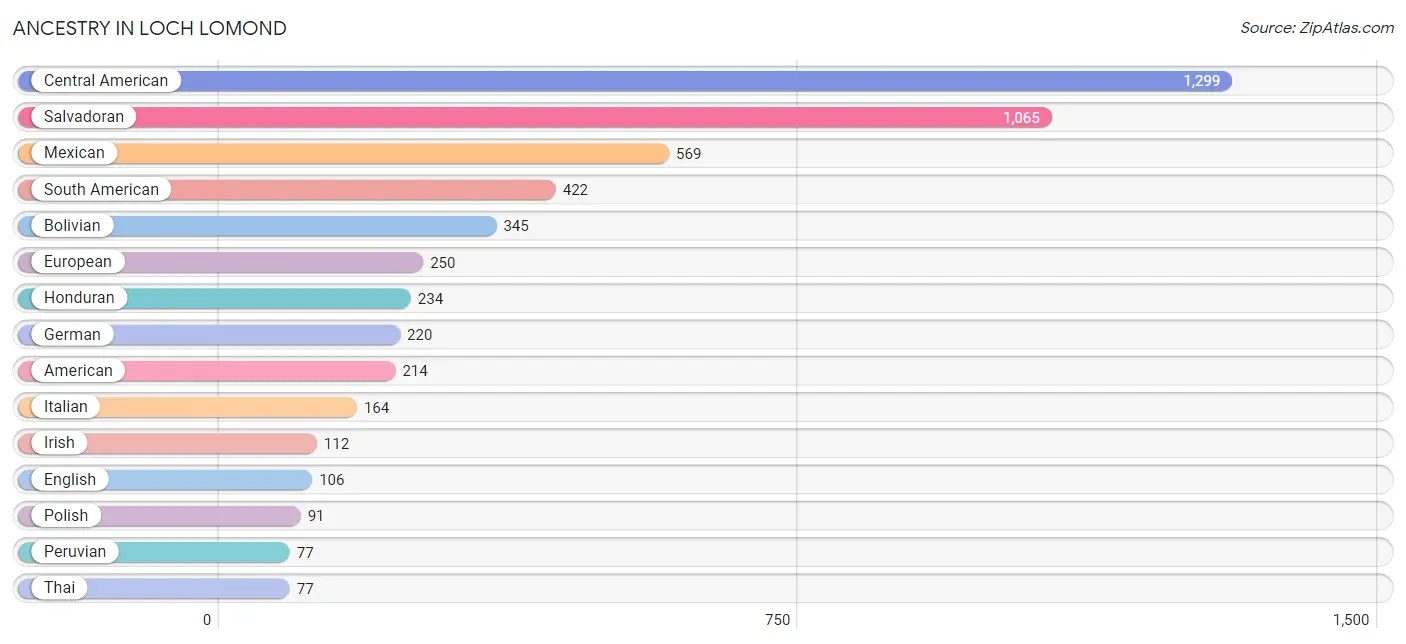
| Ancestry | # Population | % Population |
| American | 214 | 5.6% |
| Bolivian | 345 | 9.0% |
| British | 7 | 0.2% |
| Central American | 1,299 | 33.7% |
| Czech | 10 | 0.3% |
| English | 106 | 2.8% |
| European | 250 | 6.5% |
| French | 17 | 0.4% |
| French Canadian | 18 | 0.5% |
| German | 220 | 5.7% |
| Greek | 16 | 0.4% |
| Honduran | 234 | 6.1% |
| Irish | 112 | 2.9% |
| Italian | 164 | 4.3% |
| Korean | 26 | 0.7% |
| Mexican | 569 | 14.8% |
| Nigerian | 73 | 1.9% |
| Peruvian | 77 | 2.0% |
| Polish | 91 | 2.4% |
| Salvadoran | 1,065 | 27.7% |
| Scotch-Irish | 28 | 0.7% |
| Scottish | 24 | 0.6% |
| South American | 422 | 11.0% |
| Subsaharan African | 73 | 1.9% |
| Thai | 77 | 2.0% |
| Ukrainian | 34 | 0.9% | View All 26 Rows |
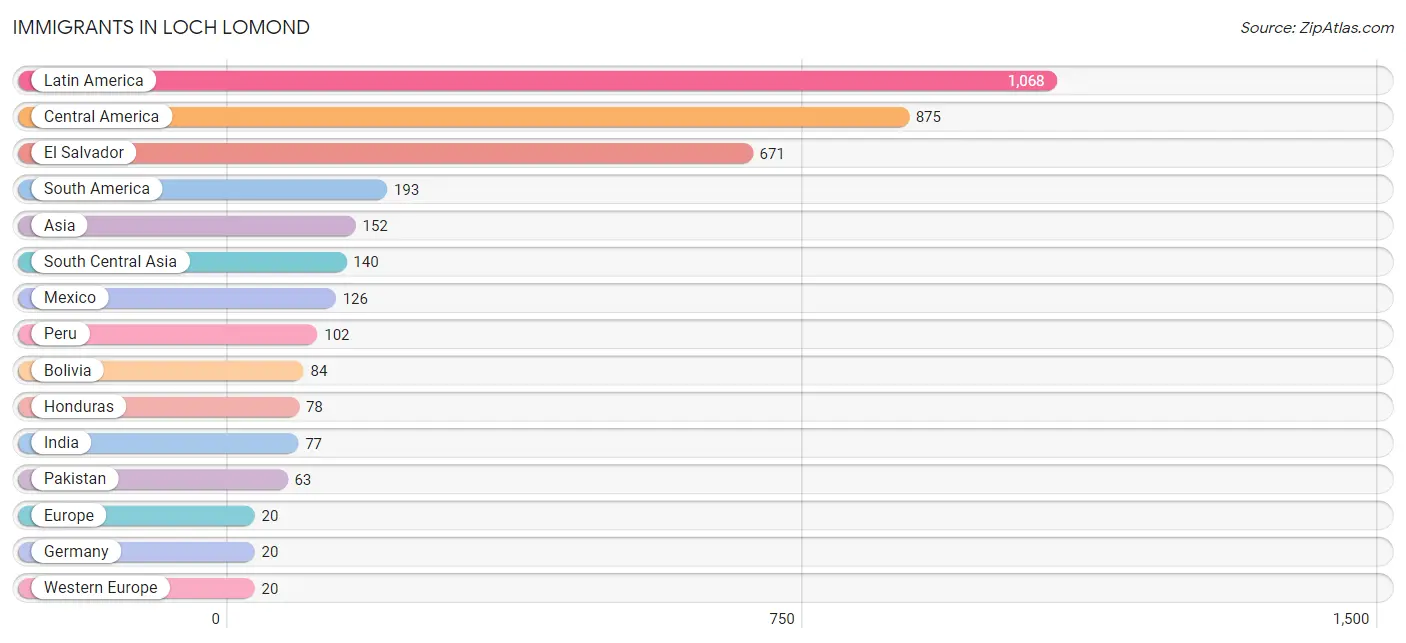
Immigrants in Loch Lomond
The most numerous immigrant groups reported in Loch Lomond came from Latin America (1,068 | 27.7%), Central America (875 | 22.7%), El Salvador (671 | 17.4%), South America (193 | 5.0%), and Asia (152 | 4.0%), together accounting for 76.8% of all Loch Lomond residents.
| Immigration Origin | # Population | % Population |
| Africa | 18 | 0.5% |
| Argentina | 7 | 0.2% |
| Asia | 152 | 4.0% |
| Bolivia | 84 | 2.2% |
| Canada | 6 | 0.2% |
| Central America | 875 | 22.7% |
| El Salvador | 671 | 17.4% |
| Europe | 20 | 0.5% |
| Germany | 20 | 0.5% |
| Ghana | 18 | 0.5% |
| Honduras | 78 | 2.0% |
| India | 77 | 2.0% |
| Latin America | 1,068 | 27.7% |
| Mexico | 126 | 3.3% |
| Pakistan | 63 | 1.6% |
| Peru | 102 | 2.6% |
| Philippines | 12 | 0.3% |
| South America | 193 | 5.0% |
| South Central Asia | 140 | 3.6% |
| South Eastern Asia | 12 | 0.3% |
| Western Africa | 18 | 0.5% |
| Western Europe | 20 | 0.5% | View All 22 Rows |
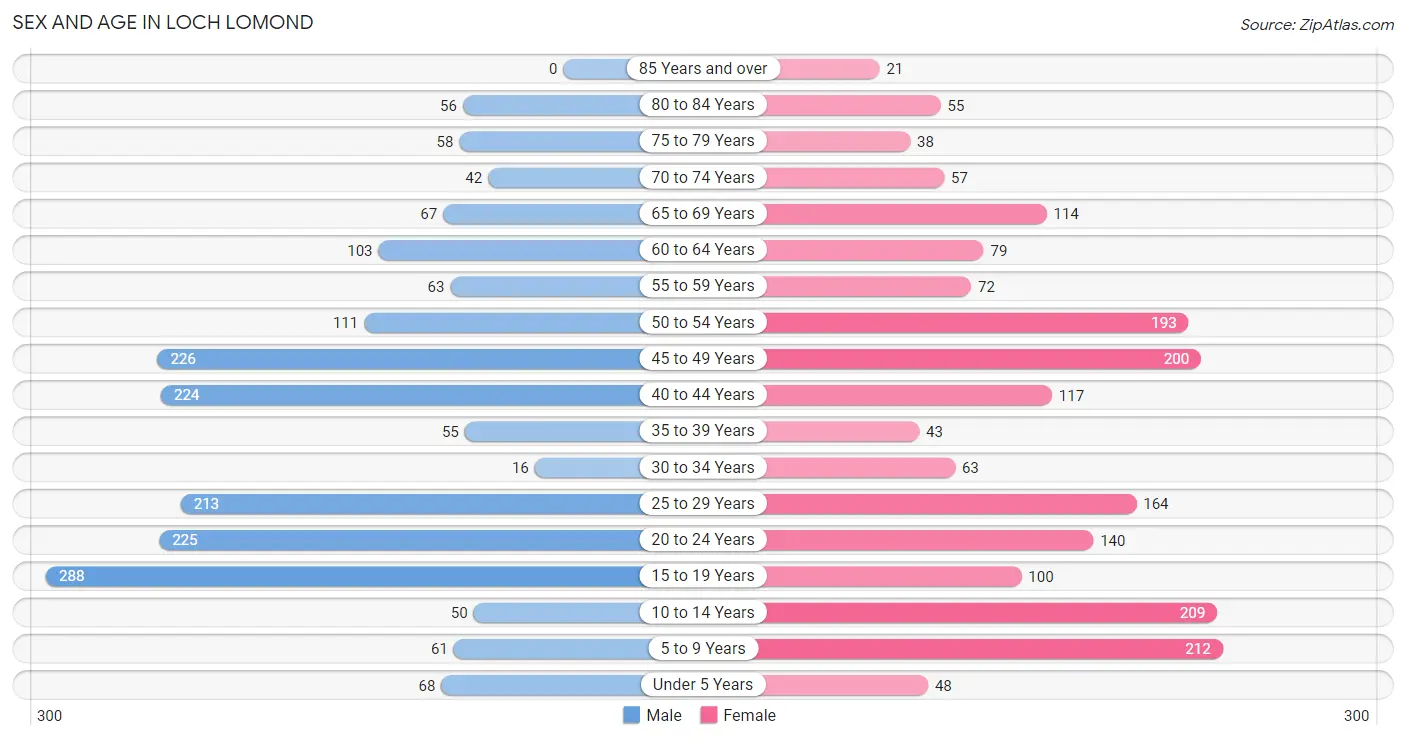
Sex and Age in Loch Lomond
Sex and Age in Loch Lomond
The most populous age groups in Loch Lomond are 15 to 19 Years (288 | 14.9%) for men and 5 to 9 Years (212 | 11.0%) for women.
| Age Bracket | Male | Female |
| Under 5 Years | 68 (3.5%) | 48 (2.5%) |
| 5 to 9 Years | 61 (3.2%) | 212 (11.0%) |
| 10 to 14 Years | 50 (2.6%) | 209 (10.9%) |
| 15 to 19 Years | 288 (14.9%) | 100 (5.2%) |
| 20 to 24 Years | 225 (11.7%) | 140 (7.3%) |
| 25 to 29 Years | 213 (11.1%) | 164 (8.5%) |
| 30 to 34 Years | 16 (0.8%) | 63 (3.3%) |
| 35 to 39 Years | 55 (2.9%) | 43 (2.2%) |
| 40 to 44 Years | 224 (11.6%) | 117 (6.1%) |
| 45 to 49 Years | 226 (11.7%) | 200 (10.4%) |
| 50 to 54 Years | 111 (5.8%) | 193 (10.0%) |
| 55 to 59 Years | 63 (3.3%) | 72 (3.7%) |
| 60 to 64 Years | 103 (5.3%) | 79 (4.1%) |
| 65 to 69 Years | 67 (3.5%) | 114 (5.9%) |
| 70 to 74 Years | 42 (2.2%) | 57 (3.0%) |
| 75 to 79 Years | 58 (3.0%) | 38 (2.0%) |
| 80 to 84 Years | 56 (2.9%) | 55 (2.9%) |
| 85 Years and over | 0 (0.0%) | 21 (1.1%) |
| Total | 1,926 (100.0%) | 1,925 (100.0%) |
Families and Households in Loch Lomond
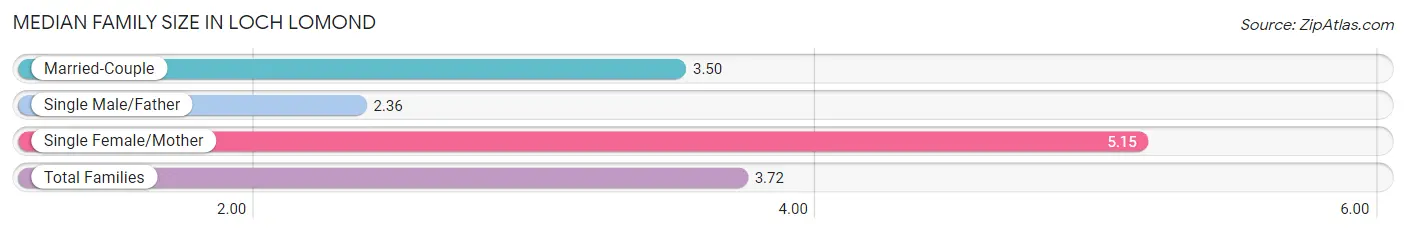
Median Family Size in Loch Lomond
The median family size in Loch Lomond is 3.72 persons per family, with single female/mother families (218 | 23.4%) accounting for the largest median family size of 5.15 persons per family. On the other hand, single male/father families (137 | 14.7%) represent the smallest median family size with 2.36 persons per family.
| Family Type | # Families | Family Size |
| Married-Couple | 575 (61.8%) | 3.50 |
| Single Male/Father | 137 (14.7%) | 2.36 |
| Single Female/Mother | 218 (23.4%) | 5.15 |
| Total Families | 930 (100.0%) | 3.72 |
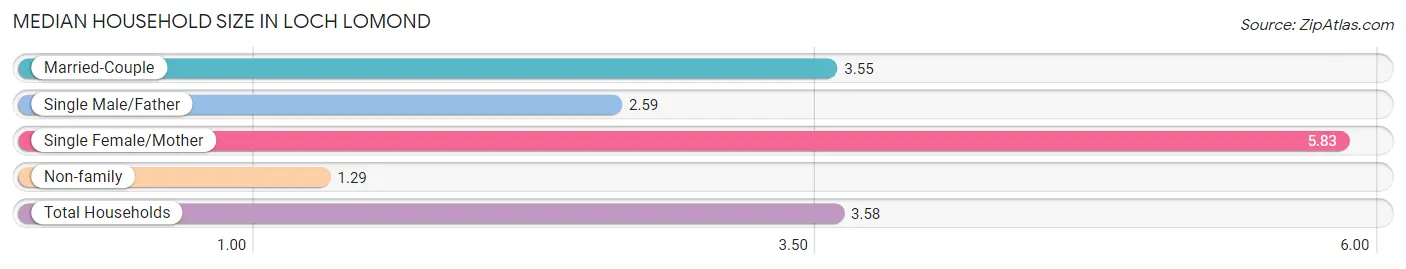
Median Household Size in Loch Lomond
The median household size in Loch Lomond is 3.58 persons per household, with single female/mother households (218 | 20.3%) accounting for the largest median household size of 5.83 persons per household. non-family households (145 | 13.5%) represent the smallest median household size with 1.29 persons per household.
| Household Type | # Households | Household Size |
| Married-Couple | 575 (53.5%) | 3.55 |
| Single Male/Father | 137 (12.7%) | 2.59 |
| Single Female/Mother | 218 (20.3%) | 5.83 |
| Non-family | 145 (13.5%) | 1.29 |
| Total Households | 1,075 (100.0%) | 3.58 |
Household Size by Marriage Status in Loch Lomond
Out of a total of 1,075 households in Loch Lomond, 930 (86.5%) are family households, while 145 (13.5%) are nonfamily households. The most numerous type of family households are 2-person households, comprising 336, and the most common type of nonfamily households are 1-person households, comprising 120.
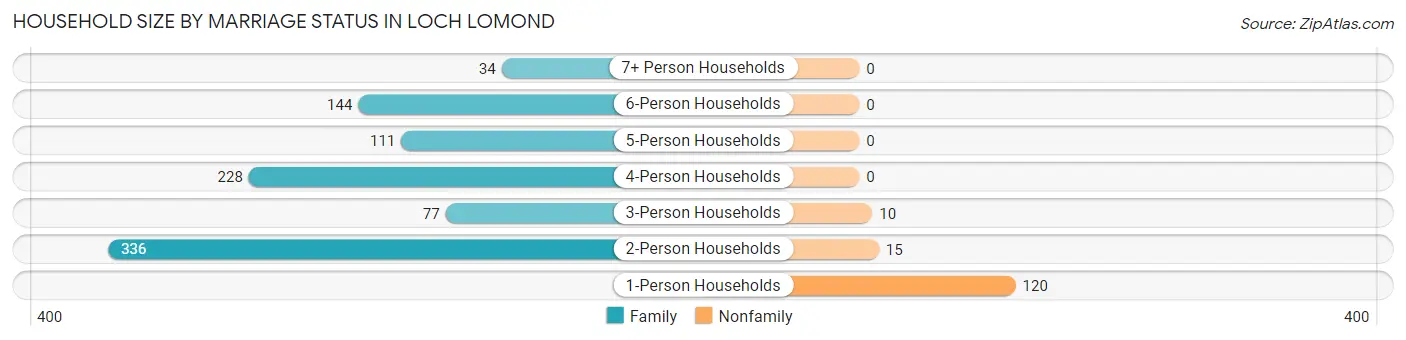
| Household Size | Family Households | Nonfamily Households |
| 1-Person Households | - | 120 (11.2%) |
| 2-Person Households | 336 (31.3%) | 15 (1.4%) |
| 3-Person Households | 77 (7.2%) | 10 (0.9%) |
| 4-Person Households | 228 (21.2%) | 0 (0.0%) |
| 5-Person Households | 111 (10.3%) | 0 (0.0%) |
| 6-Person Households | 144 (13.4%) | 0 (0.0%) |
| 7+ Person Households | 34 (3.2%) | 0 (0.0%) |
| Total | 930 (86.5%) | 145 (13.5%) |
Female Fertility in Loch Lomond
Fertility by Age in Loch Lomond
Average fertility rate in Loch Lomond is 67.0 births per 1,000 women. Women in the age bracket of 20 to 34 years have the highest fertility rate with 109.0 births per 1,000 women. Women in the age bracket of 20 to 34 years acount for 70.2% of all women with births.
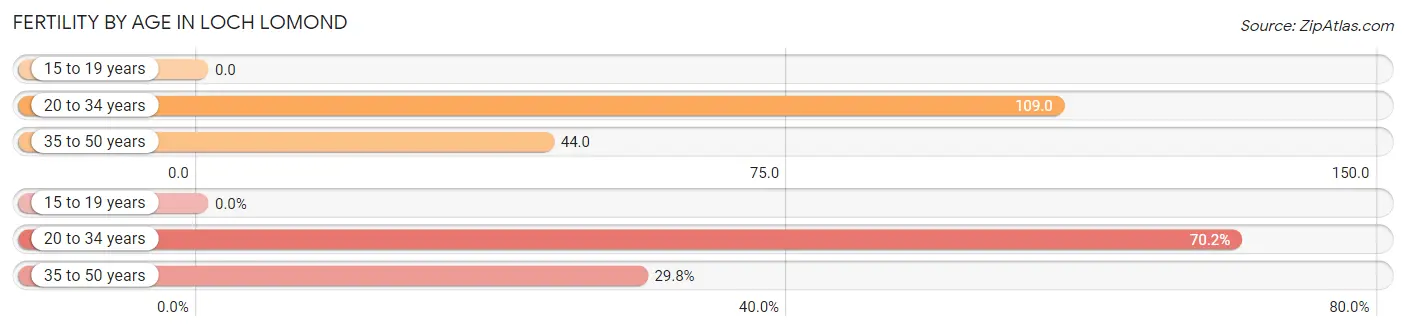
| Age Bracket | Women with Births | Births / 1,000 Women |
| 15 to 19 years | 0 (0.0%) | 0.0 |
| 20 to 34 years | 40 (70.2%) | 109.0 |
| 35 to 50 years | 17 (29.8%) | 44.0 |
| Total | 57 (100.0%) | 67.0 |
Fertility by Age by Marriage Status in Loch Lomond
29.8% of women with births (57) in Loch Lomond are married. The highest percentage of unmarried women with births falls into 20 to 34 years age bracket with 100.0% of them unmarried at the time of birth, while the lowest percentage of unmarried women with births belong to 35 to 50 years age bracket with 0.0% of them unmarried.
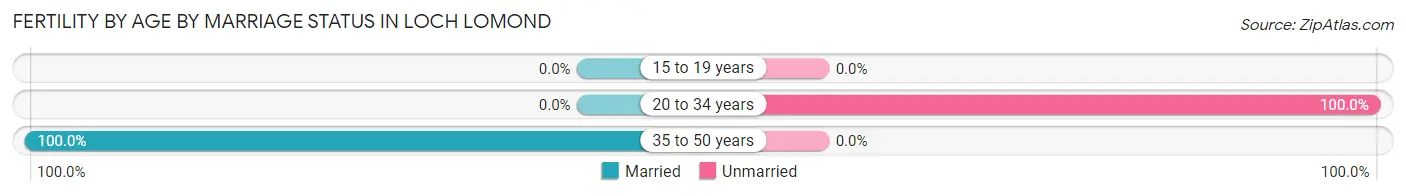
| Age Bracket | Married | Unmarried |
| 15 to 19 years | 0 (0.0%) | 0 (0.0%) |
| 20 to 34 years | 0 (0.0%) | 40 (100.0%) |
| 35 to 50 years | 17 (100.0%) | 0 (0.0%) |
| Total | 17 (29.8%) | 40 (70.2%) |
Fertility by Education in Loch Lomond
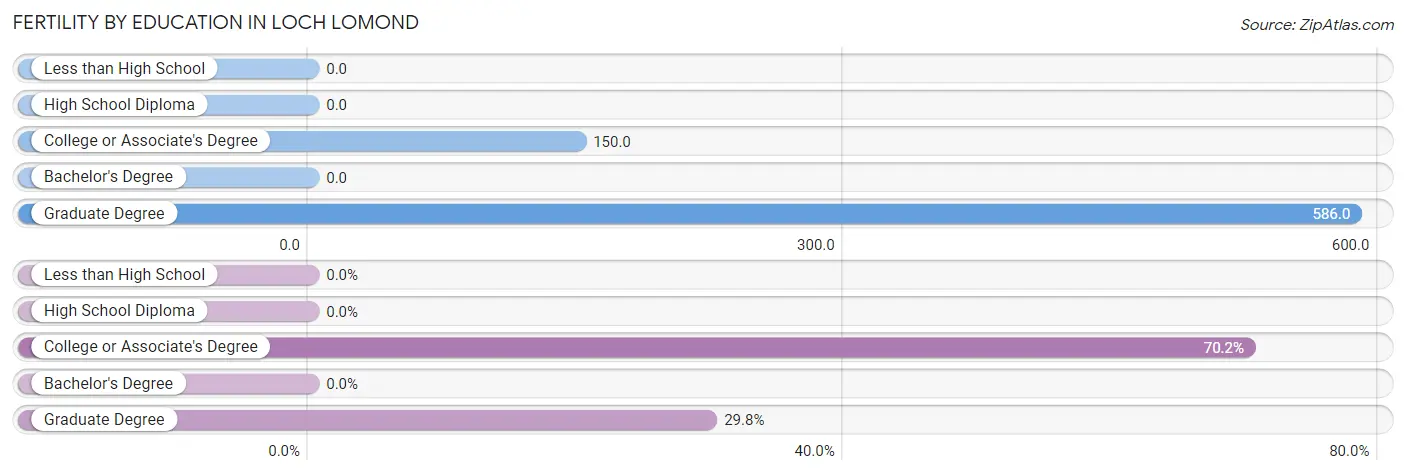
| Educational Attainment | Women with Births | Births / 1,000 Women |
| Less than High School | 0 (0.0%) | 0.0 |
| High School Diploma | 0 (0.0%) | 0.0 |
| College or Associate's Degree | 40 (70.2%) | 150.0 |
| Bachelor's Degree | 0 (0.0%) | 0.0 |
| Graduate Degree | 17 (29.8%) | 586.0 |
| Total | 57 (100.0%) | 67.0 |
Fertility by Education by Marriage Status in Loch Lomond
70.2% of women with births in Loch Lomond are unmarried. Women with the educational attainment of graduate degree are most likely to be married with 100.0% of them married at childbirth, while women with the educational attainment of college or associate's degree are least likely to be married with 100.0% of them unmarried at childbirth.
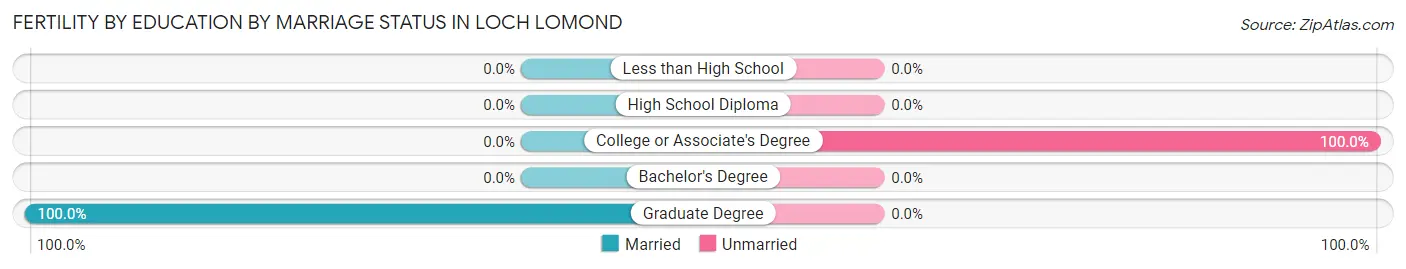
| Educational Attainment | Married | Unmarried |
| Less than High School | 0 (0.0%) | 0 (0.0%) |
| High School Diploma | 0 (0.0%) | 0 (0.0%) |
| College or Associate's Degree | 0 (0.0%) | 40 (100.0%) |
| Bachelor's Degree | 0 (0.0%) | 0 (0.0%) |
| Graduate Degree | 17 (100.0%) | 0 (0.0%) |
| Total | 17 (29.8%) | 40 (70.2%) |
Employment Characteristics in Loch Lomond
Employment by Class of Employer in Loch Lomond
Among the 1,953 employed individuals in Loch Lomond, private company employees (1,504 | 77.0%), self-employed (not incorporated) (131 | 6.7%), and not-for-profit organizations (113 | 5.8%) make up the most common classes of employment.
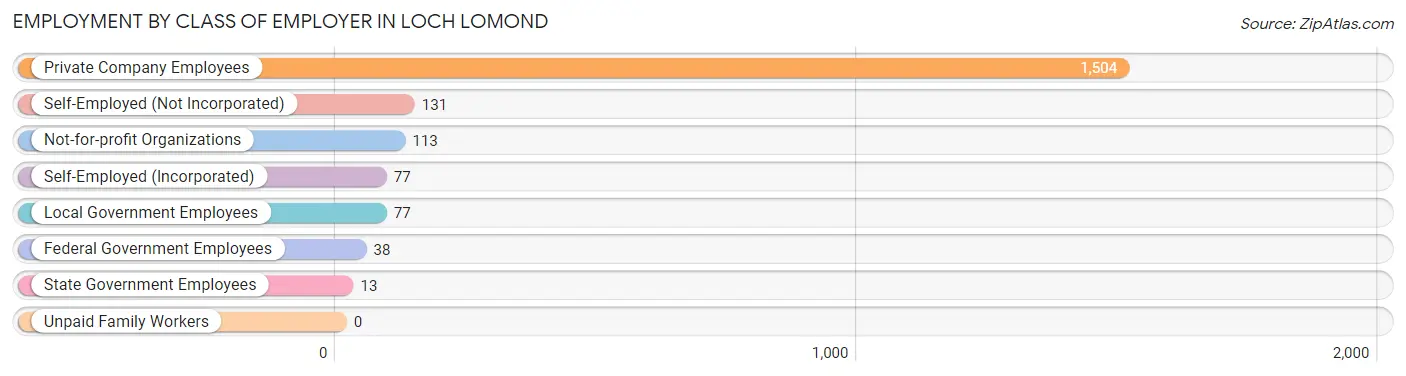
| Employer Class | # Employees | % Employees |
| Private Company Employees | 1,504 | 77.0% |
| Self-Employed (Incorporated) | 77 | 3.9% |
| Self-Employed (Not Incorporated) | 131 | 6.7% |
| Not-for-profit Organizations | 113 | 5.8% |
| Local Government Employees | 77 | 3.9% |
| State Government Employees | 13 | 0.7% |
| Federal Government Employees | 38 | 1.9% |
| Unpaid Family Workers | 0 | 0.0% |
| Total | 1,953 | 100.0% |
Employment Status by Age in Loch Lomond
According to the labor force statistics for Loch Lomond, out of the total population over 16 years of age (3,146), 69.6% or 2,190 individuals are in the labor force, with 10.0% or 219 of them unemployed. The age group with the highest labor force participation rate is 55 to 59 years, with 96.3% or 130 individuals in the labor force. Within the labor force, the 16 to 19 years age range has the highest percentage of unemployed individuals, with 56.3% or 72 of them being unemployed.
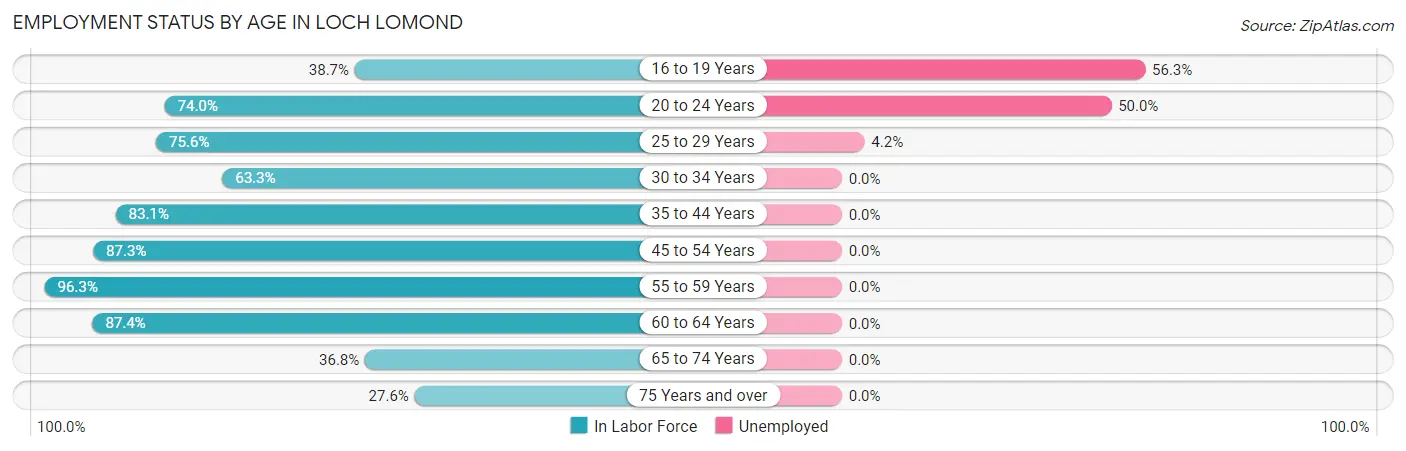
| Age Bracket | In Labor Force | Unemployed |
| 16 to 19 Years | 128 (38.7%) | 72 (56.3%) |
| 20 to 24 Years | 270 (74.0%) | 135 (50.0%) |
| 25 to 29 Years | 285 (75.6%) | 12 (4.2%) |
| 30 to 34 Years | 50 (63.3%) | 0 (0.0%) |
| 35 to 44 Years | 365 (83.1%) | 0 (0.0%) |
| 45 to 54 Years | 637 (87.3%) | 0 (0.0%) |
| 55 to 59 Years | 130 (96.3%) | 0 (0.0%) |
| 60 to 64 Years | 159 (87.4%) | 0 (0.0%) |
| 65 to 74 Years | 103 (36.8%) | 0 (0.0%) |
| 75 Years and over | 63 (27.6%) | 0 (0.0%) |
| Total | 2,190 (69.6%) | 219 (10.0%) |
Employment Status by Educational Attainment in Loch Lomond
According to labor force statistics for Loch Lomond, 83.7% of individuals (1,625) out of the total population between 25 and 64 years of age (1,942) are in the labor force, with 0.7% or 11 of them being unemployed. The group with the highest labor force participation rate are those with the educational attainment of college / associate degree, with 90.1% or 444 individuals in the labor force. Within the labor force, individuals with high school diploma education have the highest percentage of unemployment, with 2.5% or 12 of them being unemployed.
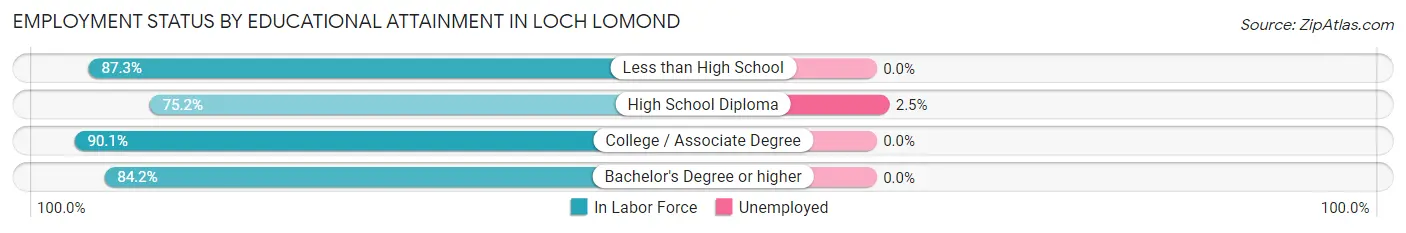
| Educational Attainment | In Labor Force | Unemployed |
| Less than High School | 514 (87.3%) | 0 (0.0%) |
| High School Diploma | 471 (75.2%) | 16 (2.5%) |
| College / Associate Degree | 444 (90.1%) | 0 (0.0%) |
| Bachelor's Degree or higher | 197 (84.2%) | 0 (0.0%) |
| Total | 1,625 (83.7%) | 14 (0.7%) |
Employment Occupations by Sex in Loch Lomond
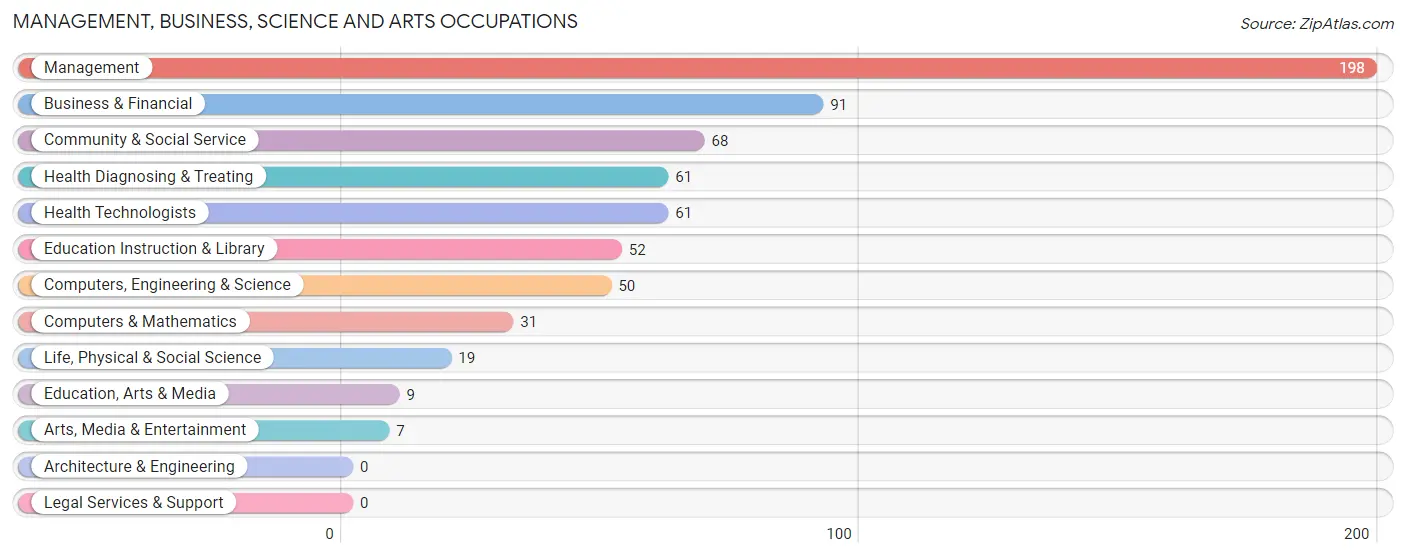
Management, Business, Science and Arts Occupations
The most common Management, Business, Science and Arts occupations in Loch Lomond are Management (198 | 10.1%), Business & Financial (91 | 4.6%), Community & Social Service (68 | 3.5%), Health Diagnosing & Treating (61 | 3.1%), and Health Technologists (61 | 3.1%).
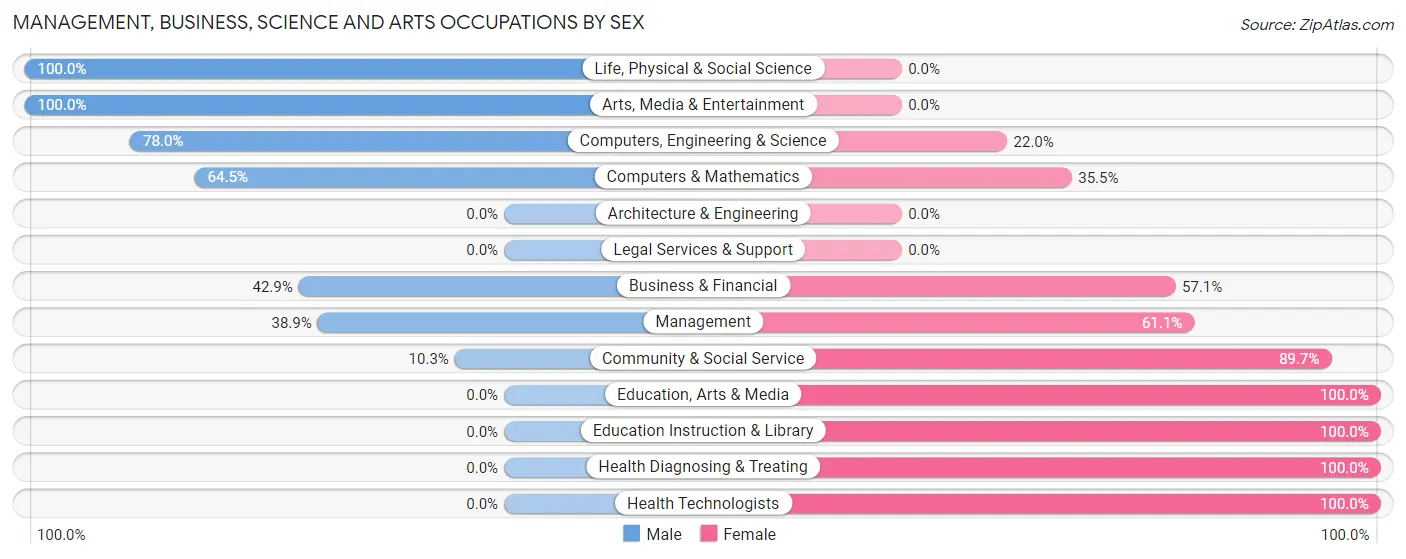
Management, Business, Science and Arts Occupations by Sex
Within the Management, Business, Science and Arts occupations in Loch Lomond, the most male-oriented occupations are Life, Physical & Social Science (100.0%), Arts, Media & Entertainment (100.0%), and Computers, Engineering & Science (78.0%), while the most female-oriented occupations are Education, Arts & Media (100.0%), Education Instruction & Library (100.0%), and Health Diagnosing & Treating (100.0%).
| Occupation | Male | Female |
| Management | 77 (38.9%) | 121 (61.1%) |
| Business & Financial | 39 (42.9%) | 52 (57.1%) |
| Computers, Engineering & Science | 39 (78.0%) | 11 (22.0%) |
| Computers & Mathematics | 20 (64.5%) | 11 (35.5%) |
| Architecture & Engineering | 0 (0.0%) | 0 (0.0%) |
| Life, Physical & Social Science | 19 (100.0%) | 0 (0.0%) |
| Community & Social Service | 7 (10.3%) | 61 (89.7%) |
| Education, Arts & Media | 0 (0.0%) | 9 (100.0%) |
| Legal Services & Support | 0 (0.0%) | 0 (0.0%) |
| Education Instruction & Library | 0 (0.0%) | 52 (100.0%) |
| Arts, Media & Entertainment | 7 (100.0%) | 0 (0.0%) |
| Health Diagnosing & Treating | 0 (0.0%) | 61 (100.0%) |
| Health Technologists | 0 (0.0%) | 61 (100.0%) |
| Total (Category) | 162 (34.6%) | 306 (65.4%) |
| Total (Overall) | 1,099 (55.8%) | 872 (44.2%) |
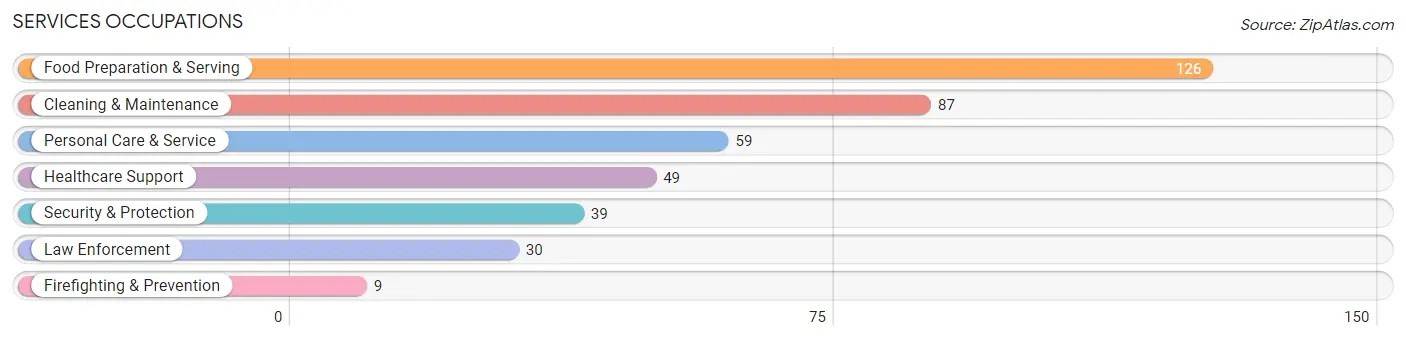
Services Occupations
The most common Services occupations in Loch Lomond are Food Preparation & Serving (126 | 6.4%), Cleaning & Maintenance (87 | 4.4%), Personal Care & Service (59 | 3.0%), Healthcare Support (49 | 2.5%), and Security & Protection (39 | 2.0%).
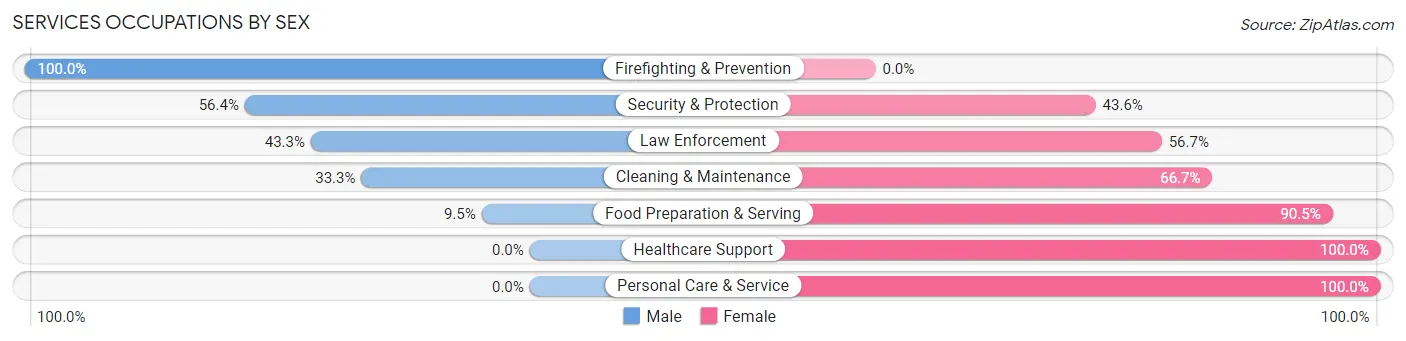
Services Occupations by Sex
Within the Services occupations in Loch Lomond, the most male-oriented occupations are Firefighting & Prevention (100.0%), Security & Protection (56.4%), and Law Enforcement (43.3%), while the most female-oriented occupations are Healthcare Support (100.0%), Personal Care & Service (100.0%), and Food Preparation & Serving (90.5%).
| Occupation | Male | Female |
| Healthcare Support | 0 (0.0%) | 49 (100.0%) |
| Security & Protection | 22 (56.4%) | 17 (43.6%) |
| Firefighting & Prevention | 9 (100.0%) | 0 (0.0%) |
| Law Enforcement | 13 (43.3%) | 17 (56.7%) |
| Food Preparation & Serving | 12 (9.5%) | 114 (90.5%) |
| Cleaning & Maintenance | 29 (33.3%) | 58 (66.7%) |
| Personal Care & Service | 0 (0.0%) | 59 (100.0%) |
| Total (Category) | 63 (17.5%) | 297 (82.5%) |
| Total (Overall) | 1,099 (55.8%) | 872 (44.2%) |
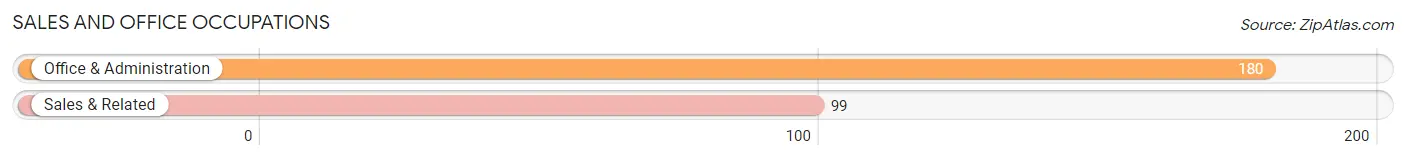
Sales and Office Occupations
The most common Sales and Office occupations in Loch Lomond are Office & Administration (180 | 9.1%), and Sales & Related (99 | 5.0%).
Sales and Office Occupations by Sex
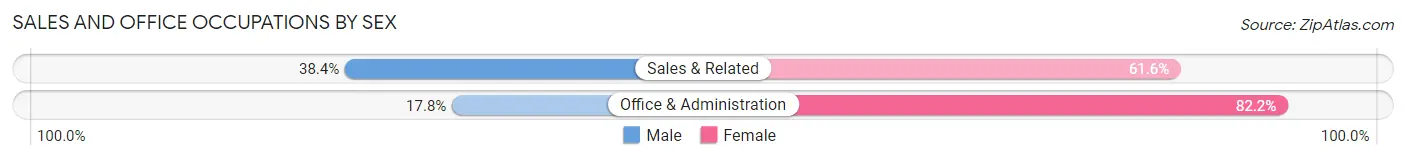
| Occupation | Male | Female |
| Sales & Related | 38 (38.4%) | 61 (61.6%) |
| Office & Administration | 32 (17.8%) | 148 (82.2%) |
| Total (Category) | 70 (25.1%) | 209 (74.9%) |
| Total (Overall) | 1,099 (55.8%) | 872 (44.2%) |
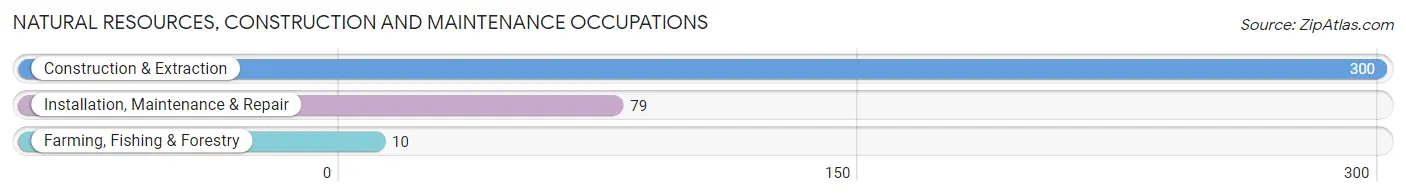
Natural Resources, Construction and Maintenance Occupations
The most common Natural Resources, Construction and Maintenance occupations in Loch Lomond are Construction & Extraction (300 | 15.2%), Installation, Maintenance & Repair (79 | 4.0%), and Farming, Fishing & Forestry (10 | 0.5%).
Natural Resources, Construction and Maintenance Occupations by Sex
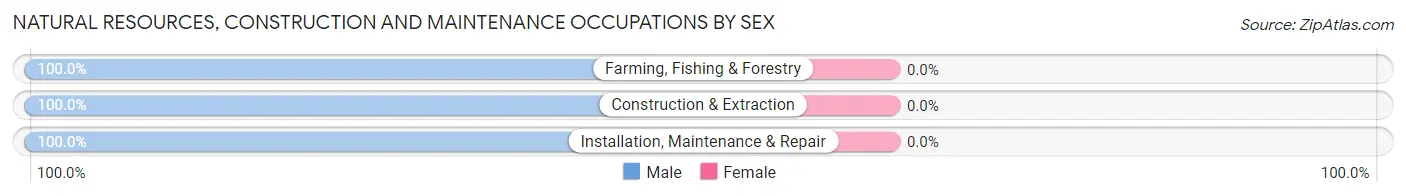
| Occupation | Male | Female |
| Farming, Fishing & Forestry | 10 (100.0%) | 0 (0.0%) |
| Construction & Extraction | 300 (100.0%) | 0 (0.0%) |
| Installation, Maintenance & Repair | 79 (100.0%) | 0 (0.0%) |
| Total (Category) | 389 (100.0%) | 0 (0.0%) |
| Total (Overall) | 1,099 (55.8%) | 872 (44.2%) |
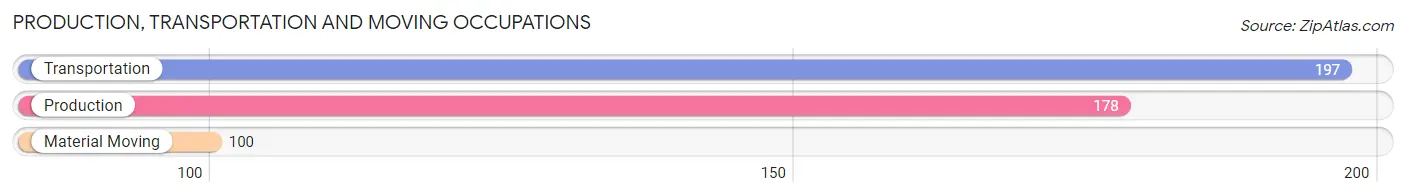
Production, Transportation and Moving Occupations
The most common Production, Transportation and Moving occupations in Loch Lomond are Transportation (197 | 10.0%), Production (178 | 9.0%), and Material Moving (100 | 5.1%).
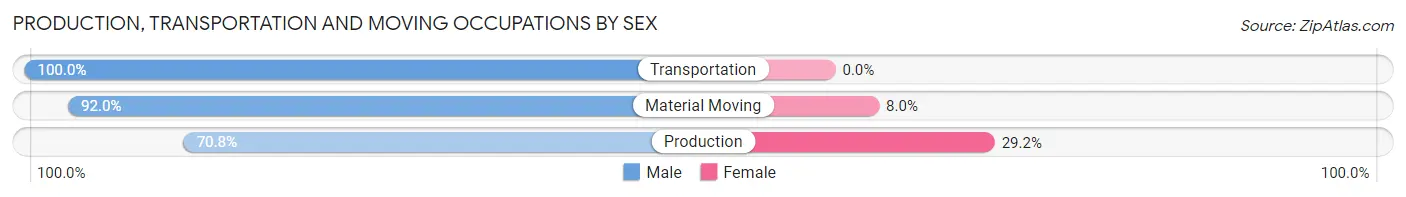
Production, Transportation and Moving Occupations by Sex
| Occupation | Male | Female |
| Production | 126 (70.8%) | 52 (29.2%) |
| Transportation | 197 (100.0%) | 0 (0.0%) |
| Material Moving | 92 (92.0%) | 8 (8.0%) |
| Total (Category) | 415 (87.4%) | 60 (12.6%) |
| Total (Overall) | 1,099 (55.8%) | 872 (44.2%) |
Employment Industries by Sex in Loch Lomond
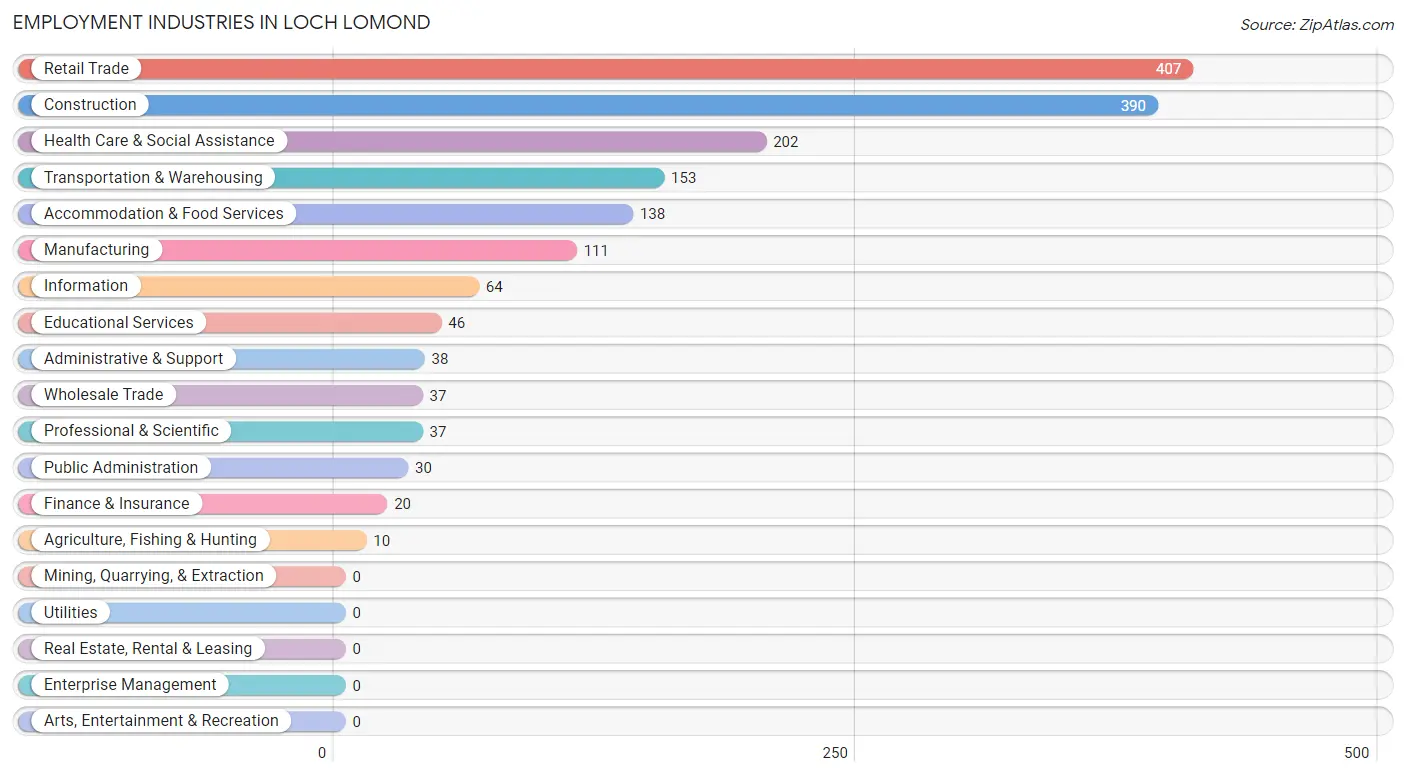
Employment Industries in Loch Lomond
The major employment industries in Loch Lomond include Retail Trade (407 | 20.6%), Construction (390 | 19.8%), Health Care & Social Assistance (202 | 10.2%), Transportation & Warehousing (153 | 7.8%), and Accommodation & Food Services (138 | 7.0%).
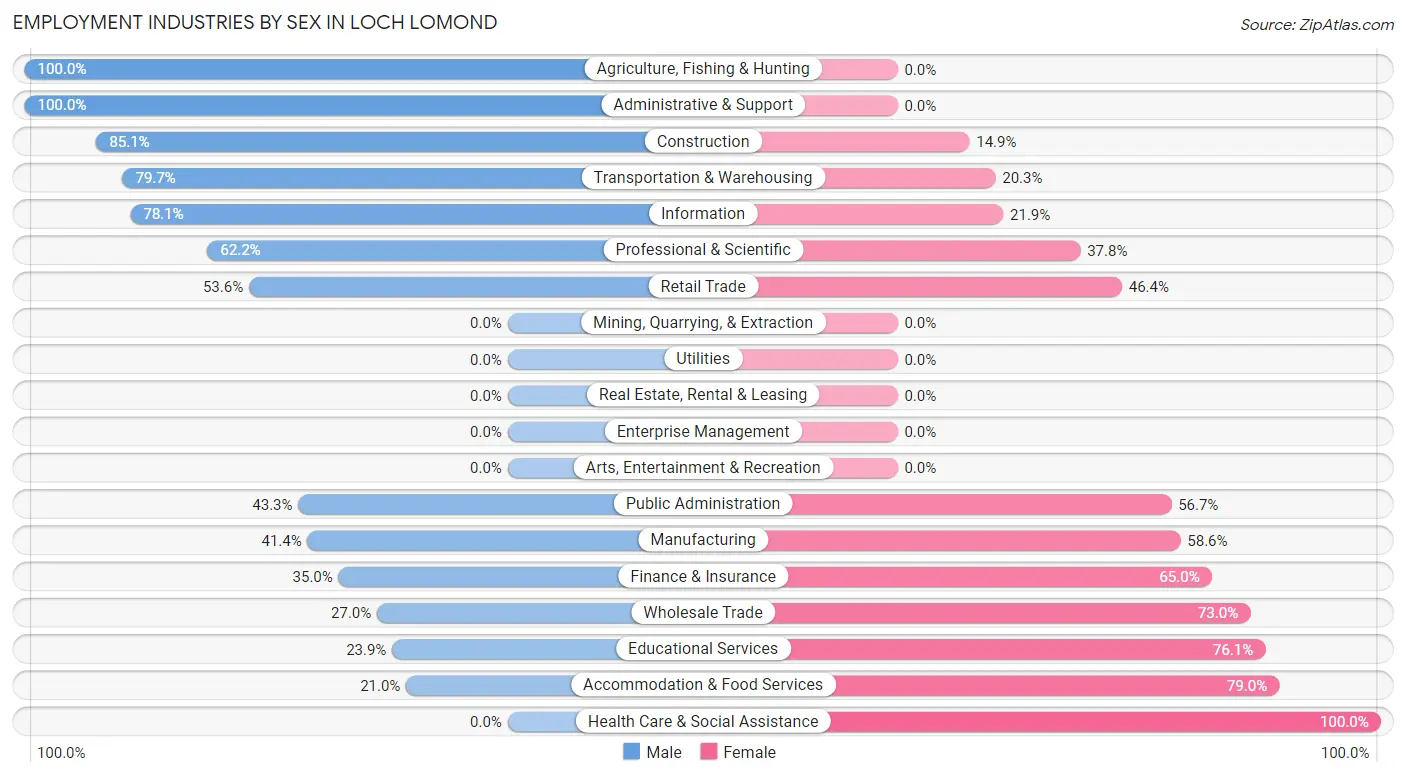
Employment Industries by Sex in Loch Lomond
The Loch Lomond industries that see more men than women are Agriculture, Fishing & Hunting (100.0%), Administrative & Support (100.0%), and Construction (85.1%), whereas the industries that tend to have a higher number of women are Health Care & Social Assistance (100.0%), Accommodation & Food Services (79.0%), and Educational Services (76.1%).
| Industry | Male | Female |
| Agriculture, Fishing & Hunting | 10 (100.0%) | 0 (0.0%) |
| Mining, Quarrying, & Extraction | 0 (0.0%) | 0 (0.0%) |
| Construction | 332 (85.1%) | 58 (14.9%) |
| Manufacturing | 46 (41.4%) | 65 (58.6%) |
| Wholesale Trade | 10 (27.0%) | 27 (73.0%) |
| Retail Trade | 218 (53.6%) | 189 (46.4%) |
| Transportation & Warehousing | 122 (79.7%) | 31 (20.3%) |
| Utilities | 0 (0.0%) | 0 (0.0%) |
| Information | 50 (78.1%) | 14 (21.9%) |
| Finance & Insurance | 7 (35.0%) | 13 (65.0%) |
| Real Estate, Rental & Leasing | 0 (0.0%) | 0 (0.0%) |
| Professional & Scientific | 23 (62.2%) | 14 (37.8%) |
| Enterprise Management | 0 (0.0%) | 0 (0.0%) |
| Administrative & Support | 38 (100.0%) | 0 (0.0%) |
| Educational Services | 11 (23.9%) | 35 (76.1%) |
| Health Care & Social Assistance | 0 (0.0%) | 202 (100.0%) |
| Arts, Entertainment & Recreation | 0 (0.0%) | 0 (0.0%) |
| Accommodation & Food Services | 29 (21.0%) | 109 (79.0%) |
| Public Administration | 13 (43.3%) | 17 (56.7%) |
| Total | 1,099 (55.8%) | 872 (44.2%) |
Education in Loch Lomond
School Enrollment in Loch Lomond
The most common levels of schooling among the 1,018 students in Loch Lomond are high school (339 | 33.3%), elementary school (242 | 23.8%), and college / undergraduate (219 | 21.5%).
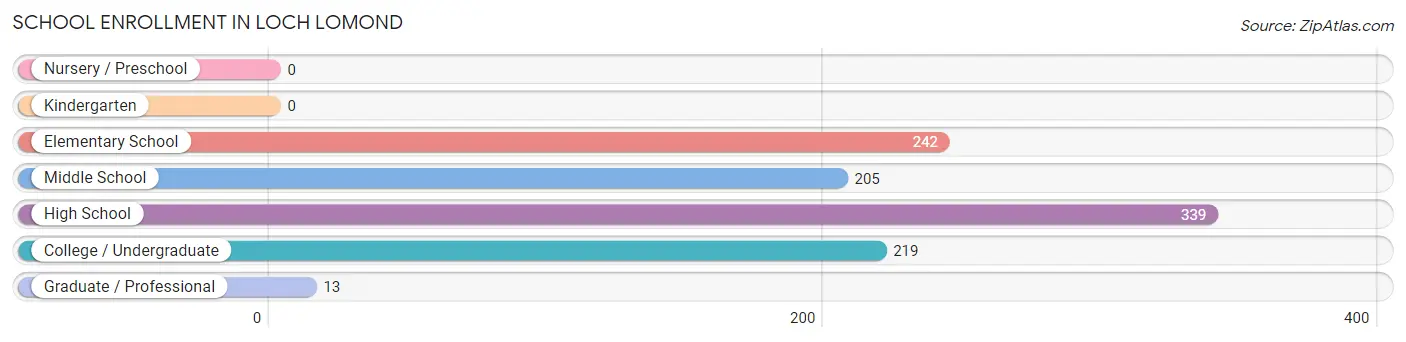
| School Level | # Students | % Students |
| Nursery / Preschool | 0 | 0.0% |
| Kindergarten | 0 | 0.0% |
| Elementary School | 242 | 23.8% |
| Middle School | 205 | 20.1% |
| High School | 339 | 33.3% |
| College / Undergraduate | 219 | 21.5% |
| Graduate / Professional | 13 | 1.3% |
| Total | 1,018 | 100.0% |
School Enrollment by Age by Funding Source in Loch Lomond
Out of a total of 1,018 students who are enrolled in schools in Loch Lomond, 71 (7.0%) attend a private institution, while the remaining 947 (93.0%) are enrolled in public schools. The age group of 35 years and over has the highest likelihood of being enrolled in private schools, with 38 (67.9% in the age bracket) enrolled. Conversely, the age group of 5 to 9 year old has the lowest likelihood of being enrolled in a private school, with 242 (100.0% in the age bracket) attending a public institution.
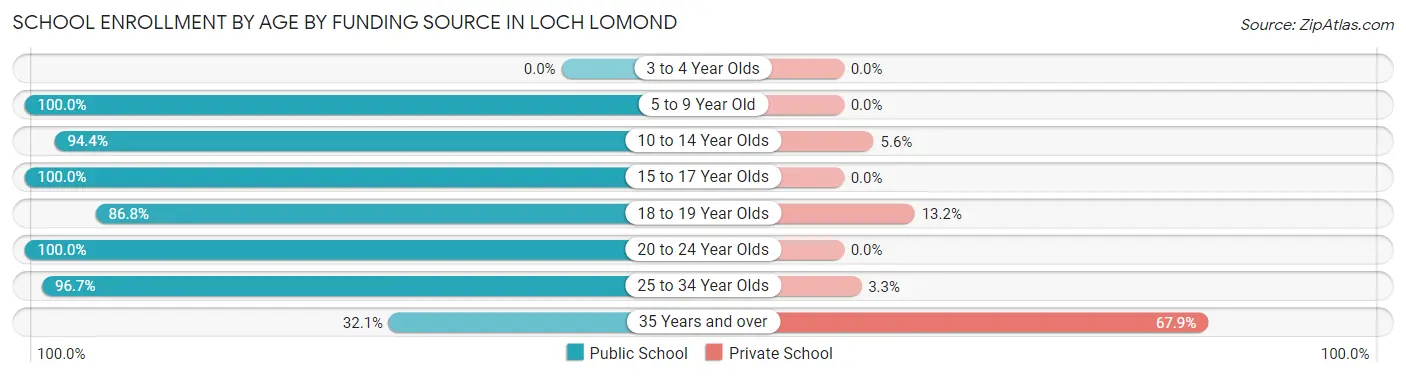
| Age Bracket | Public School | Private School |
| 3 to 4 Year Olds | 0 (0.0%) | 0 (0.0%) |
| 5 to 9 Year Old | 242 (100.0%) | 0 (0.0%) |
| 10 to 14 Year Olds | 203 (94.4%) | 12 (5.6%) |
| 15 to 17 Year Olds | 193 (100.0%) | 0 (0.0%) |
| 18 to 19 Year Olds | 118 (86.8%) | 18 (13.2%) |
| 20 to 24 Year Olds | 84 (100.0%) | 0 (0.0%) |
| 25 to 34 Year Olds | 89 (96.7%) | 3 (3.3%) |
| 35 Years and over | 18 (32.1%) | 38 (67.9%) |
| Total | 947 (93.0%) | 71 (7.0%) |
Educational Attainment by Field of Study in Loch Lomond
Science & technology (102 | 29.0%), business (71 | 20.2%), education (59 | 16.8%), physical & health sciences (24 | 6.8%), and computers & mathematics (23 | 6.5%) are the most common fields of study among 352 individuals in Loch Lomond who have obtained a bachelor's degree or higher.
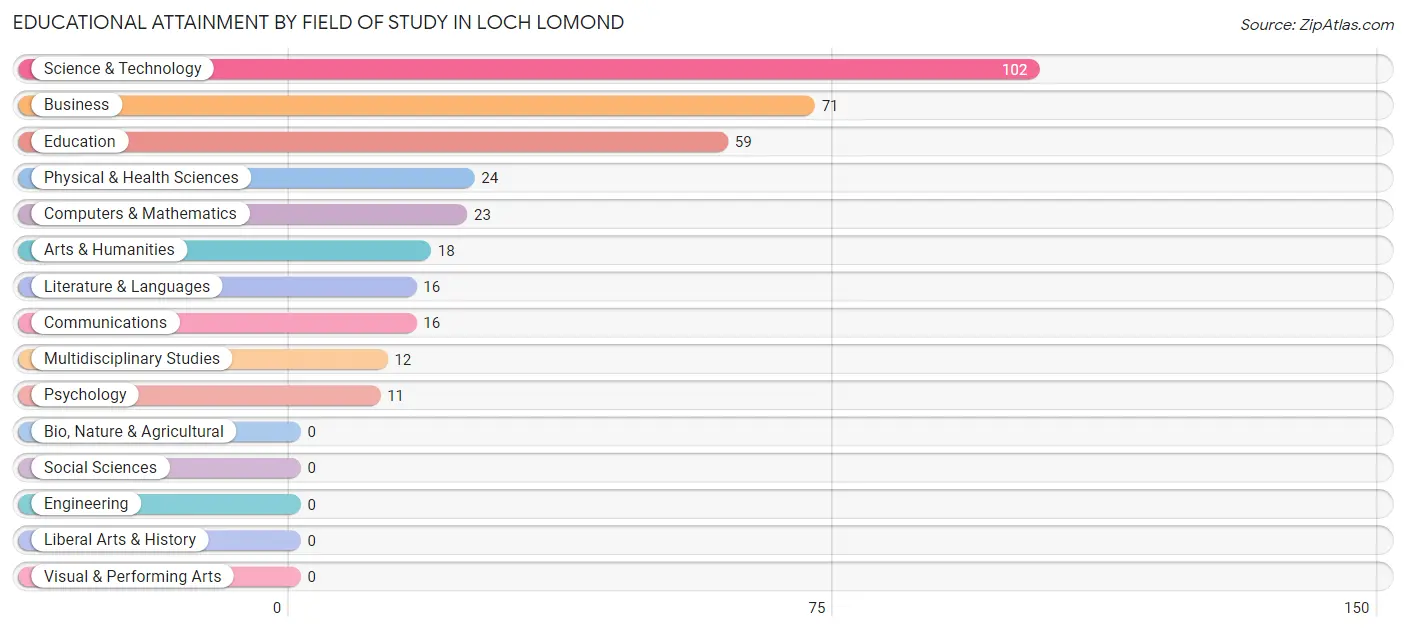
| Field of Study | # Graduates | % Graduates |
| Computers & Mathematics | 23 | 6.5% |
| Bio, Nature & Agricultural | 0 | 0.0% |
| Physical & Health Sciences | 24 | 6.8% |
| Psychology | 11 | 3.1% |
| Social Sciences | 0 | 0.0% |
| Engineering | 0 | 0.0% |
| Multidisciplinary Studies | 12 | 3.4% |
| Science & Technology | 102 | 29.0% |
| Business | 71 | 20.2% |
| Education | 59 | 16.8% |
| Literature & Languages | 16 | 4.5% |
| Liberal Arts & History | 0 | 0.0% |
| Visual & Performing Arts | 0 | 0.0% |
| Communications | 16 | 4.5% |
| Arts & Humanities | 18 | 5.1% |
| Total | 352 | 100.0% |
Transportation & Commute in Loch Lomond
Vehicle Availability by Sex in Loch Lomond
The most prevalent vehicle ownership categories in Loch Lomond are males with 3 vehicles (355, accounting for 32.8%) and females with 3 vehicles (250, making up 40.7%).
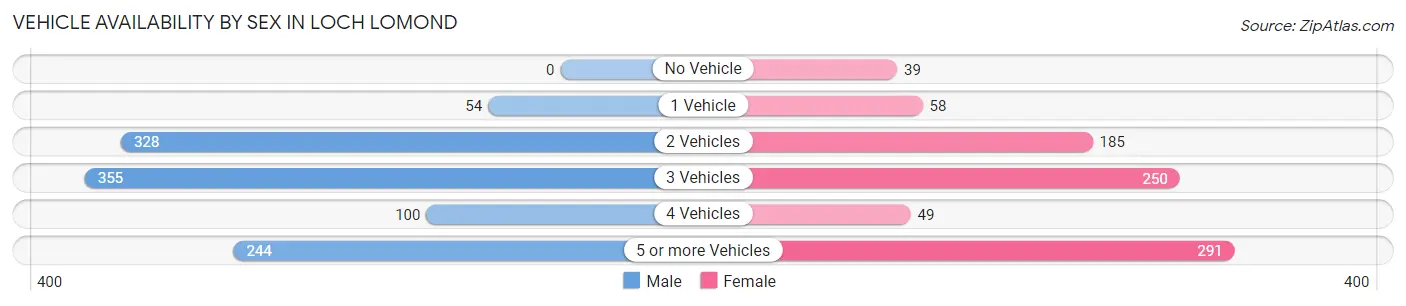
| Vehicles Available | Male | Female |
| No Vehicle | 0 (0.0%) | 39 (4.5%) |
| 1 Vehicle | 54 (5.0%) | 58 (6.7%) |
| 2 Vehicles | 328 (30.3%) | 185 (21.2%) |
| 3 Vehicles | 355 (32.8%) | 250 (28.7%) |
| 4 Vehicles | 100 (9.2%) | 49 (5.6%) |
| 5 or more Vehicles | 244 (22.6%) | 291 (33.4%) |
| Total | 1,081 (100.0%) | 872 (100.0%) |
Commute Time in Loch Lomond
The most frequently occuring commute durations in Loch Lomond are 15 to 19 minutes (239 commuters, 12.6%), 45 to 59 minutes (229 commuters, 12.1%), and 20 to 24 minutes (222 commuters, 11.7%).

| Commute Time | # Commuters | % Commuters |
| Less than 5 Minutes | 52 | 2.8% |
| 5 to 9 Minutes | 218 | 11.5% |
| 10 to 14 Minutes | 130 | 6.9% |
| 15 to 19 Minutes | 239 | 12.6% |
| 20 to 24 Minutes | 222 | 11.7% |
| 25 to 29 Minutes | 104 | 5.5% |
| 30 to 34 Minutes | 198 | 10.5% |
| 35 to 39 Minutes | 117 | 6.2% |
| 40 to 44 Minutes | 77 | 4.1% |
| 45 to 59 Minutes | 229 | 12.1% |
| 60 to 89 Minutes | 209 | 11.1% |
| 90 or more Minutes | 96 | 5.1% |
Commute Time by Sex in Loch Lomond
The most common commute times in Loch Lomond are 60 to 89 minutes (187 commuters, 17.5%) for males and 5 to 9 minutes (178 commuters, 21.6%) for females.
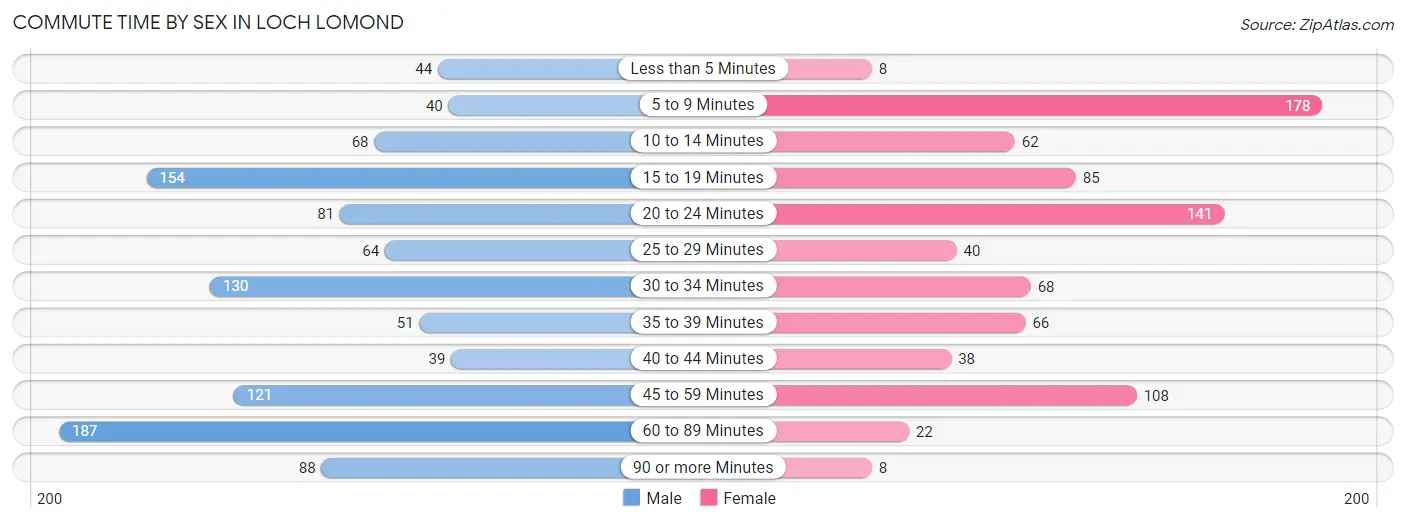
| Commute Time | Male | Female |
| Less than 5 Minutes | 44 (4.1%) | 8 (1.0%) |
| 5 to 9 Minutes | 40 (3.7%) | 178 (21.6%) |
| 10 to 14 Minutes | 68 (6.4%) | 62 (7.5%) |
| 15 to 19 Minutes | 154 (14.4%) | 85 (10.3%) |
| 20 to 24 Minutes | 81 (7.6%) | 141 (17.1%) |
| 25 to 29 Minutes | 64 (6.0%) | 40 (4.9%) |
| 30 to 34 Minutes | 130 (12.2%) | 68 (8.3%) |
| 35 to 39 Minutes | 51 (4.8%) | 66 (8.0%) |
| 40 to 44 Minutes | 39 (3.7%) | 38 (4.6%) |
| 45 to 59 Minutes | 121 (11.3%) | 108 (13.1%) |
| 60 to 89 Minutes | 187 (17.5%) | 22 (2.7%) |
| 90 or more Minutes | 88 (8.3%) | 8 (1.0%) |
Time of Departure to Work by Sex in Loch Lomond
The most frequent times of departure to work in Loch Lomond are 5:00 AM to 5:29 AM (244, 22.9%) for males and 7:30 AM to 7:59 AM (182, 22.1%) for females.
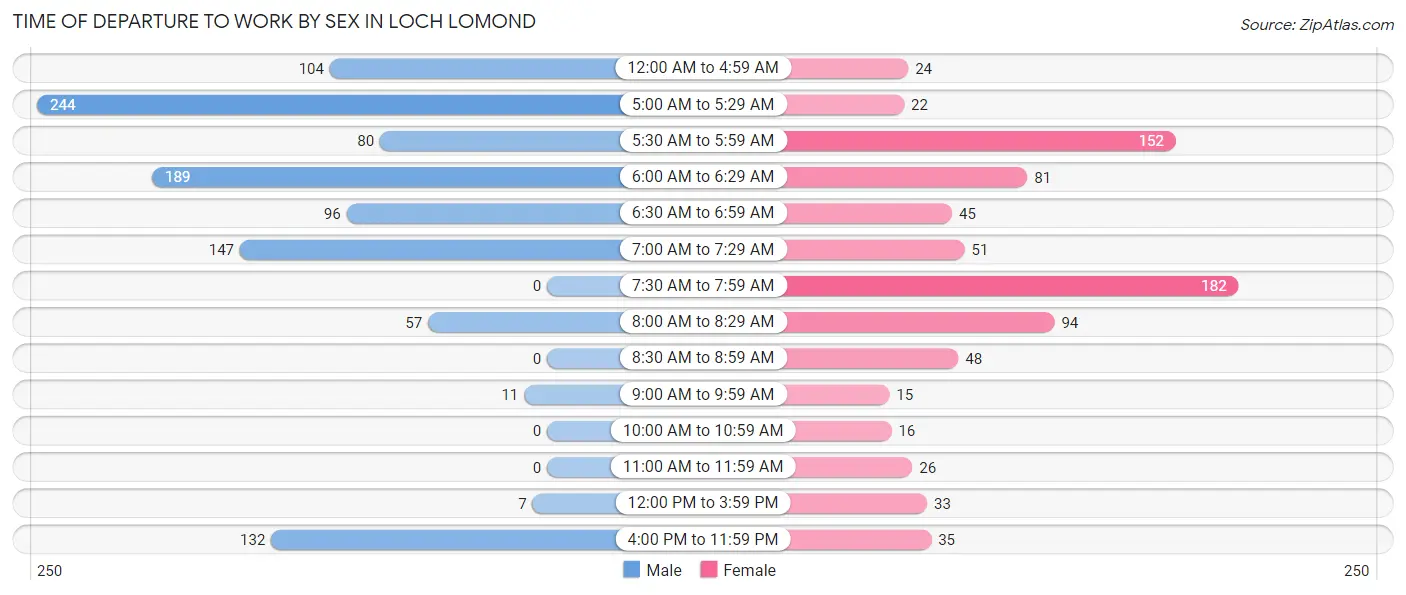
| Time of Departure | Male | Female |
| 12:00 AM to 4:59 AM | 104 (9.8%) | 24 (2.9%) |
| 5:00 AM to 5:29 AM | 244 (22.9%) | 22 (2.7%) |
| 5:30 AM to 5:59 AM | 80 (7.5%) | 152 (18.4%) |
| 6:00 AM to 6:29 AM | 189 (17.7%) | 81 (9.8%) |
| 6:30 AM to 6:59 AM | 96 (9.0%) | 45 (5.5%) |
| 7:00 AM to 7:29 AM | 147 (13.8%) | 51 (6.2%) |
| 7:30 AM to 7:59 AM | 0 (0.0%) | 182 (22.1%) |
| 8:00 AM to 8:29 AM | 57 (5.3%) | 94 (11.4%) |
| 8:30 AM to 8:59 AM | 0 (0.0%) | 48 (5.8%) |
| 9:00 AM to 9:59 AM | 11 (1.0%) | 15 (1.8%) |
| 10:00 AM to 10:59 AM | 0 (0.0%) | 16 (1.9%) |
| 11:00 AM to 11:59 AM | 0 (0.0%) | 26 (3.2%) |
| 12:00 PM to 3:59 PM | 7 (0.7%) | 33 (4.0%) |
| 4:00 PM to 11:59 PM | 132 (12.4%) | 35 (4.3%) |
| Total | 1,067 (100.0%) | 824 (100.0%) |
Housing Occupancy in Loch Lomond
Occupancy by Ownership in Loch Lomond
Of the total 1,075 dwellings in Loch Lomond, owner-occupied units account for 908 (84.5%), while renter-occupied units make up 167 (15.5%).
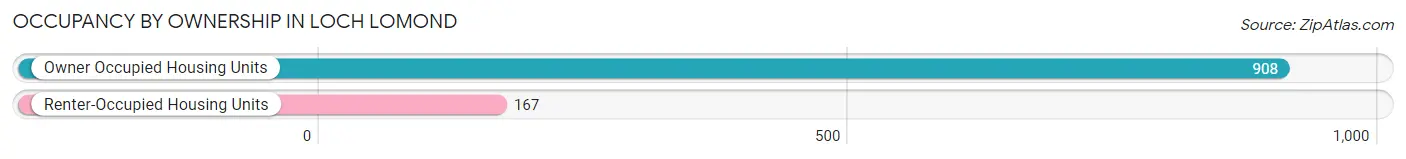
| Occupancy | # Housing Units | % Housing Units |
| Owner Occupied Housing Units | 908 | 84.5% |
| Renter-Occupied Housing Units | 167 | 15.5% |
| Total Occupied Housing Units | 1,075 | 100.0% |
Occupancy by Household Size in Loch Lomond
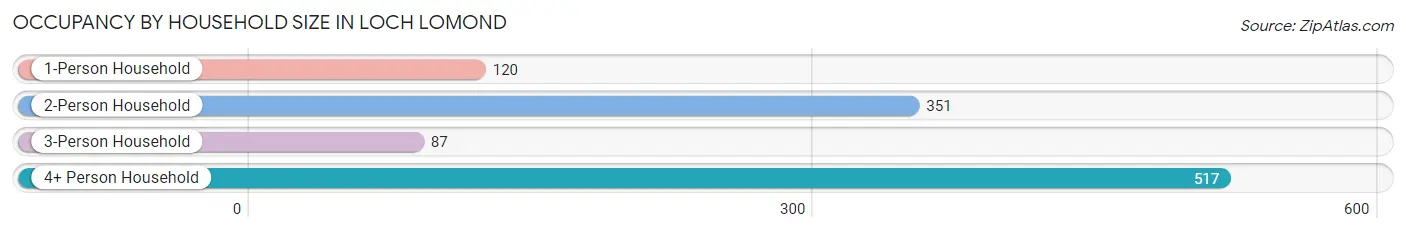
| Household Size | # Housing Units | % Housing Units |
| 1-Person Household | 120 | 11.2% |
| 2-Person Household | 351 | 32.7% |
| 3-Person Household | 87 | 8.1% |
| 4+ Person Household | 517 | 48.1% |
| Total Housing Units | 1,075 | 100.0% |
Occupancy by Ownership by Household Size in Loch Lomond
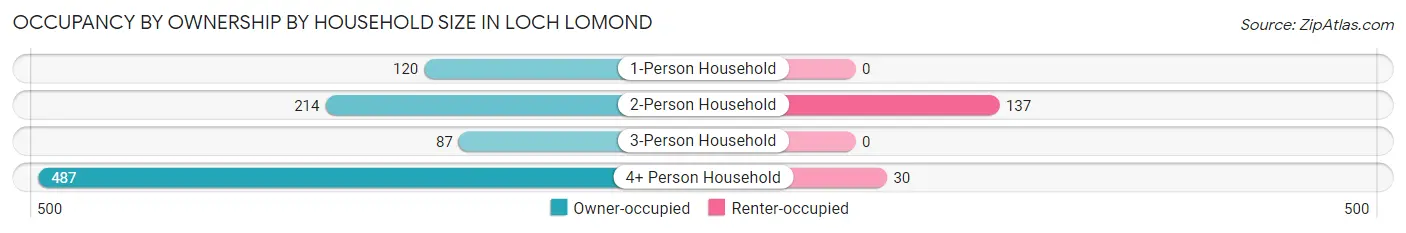
| Household Size | Owner-occupied | Renter-occupied |
| 1-Person Household | 120 (100.0%) | 0 (0.0%) |
| 2-Person Household | 214 (61.0%) | 137 (39.0%) |
| 3-Person Household | 87 (100.0%) | 0 (0.0%) |
| 4+ Person Household | 487 (94.2%) | 30 (5.8%) |
| Total Housing Units | 908 (84.5%) | 167 (15.5%) |
Occupancy by Educational Attainment in Loch Lomond
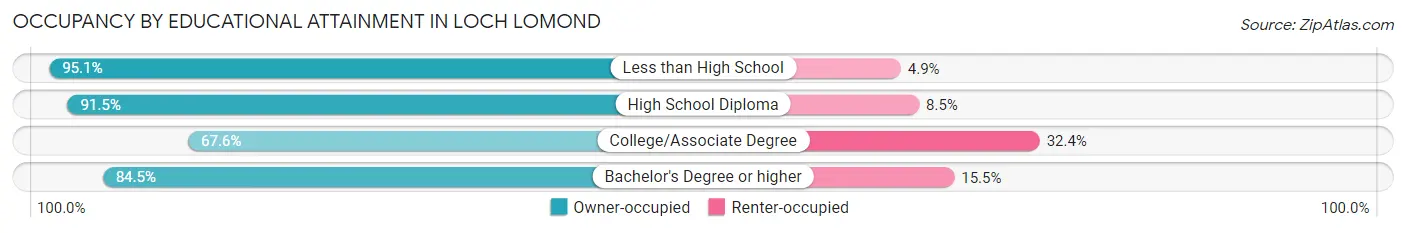
| Household Size | Owner-occupied | Renter-occupied |
| Less than High School | 350 (95.1%) | 18 (4.9%) |
| High School Diploma | 215 (91.5%) | 20 (8.5%) |
| College/Associate Degree | 223 (67.6%) | 107 (32.4%) |
| Bachelor's Degree or higher | 120 (84.5%) | 22 (15.5%) |
Occupancy by Age of Householder in Loch Lomond
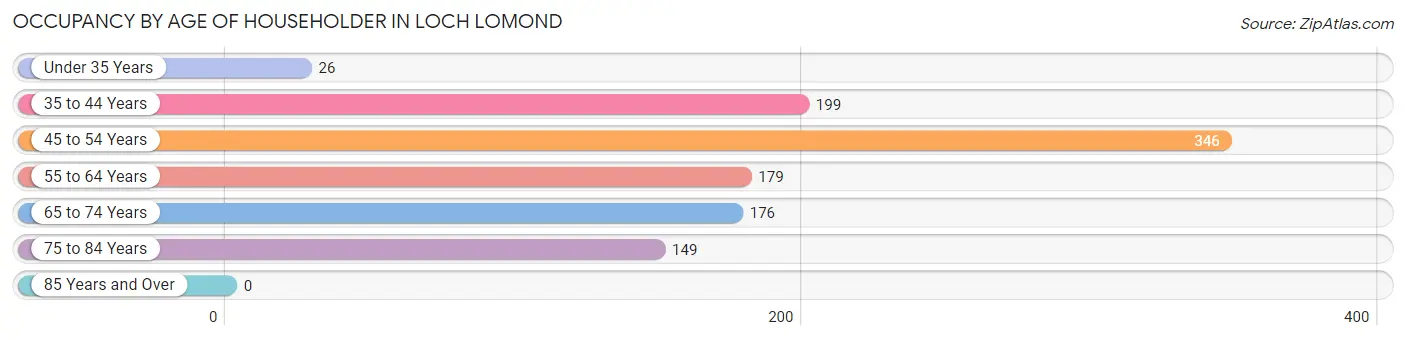
| Age Bracket | # Households | % Households |
| Under 35 Years | 26 | 2.4% |
| 35 to 44 Years | 199 | 18.5% |
| 45 to 54 Years | 346 | 32.2% |
| 55 to 64 Years | 179 | 16.7% |
| 65 to 74 Years | 176 | 16.4% |
| 75 to 84 Years | 149 | 13.9% |
| 85 Years and Over | 0 | 0.0% |
| Total | 1,075 | 100.0% |
Housing Finances in Loch Lomond
Median Income by Occupancy in Loch Lomond
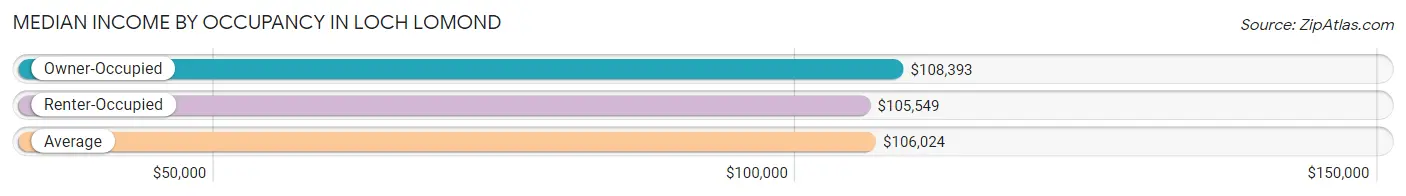
| Occupancy Type | # Households | Median Income |
| Owner-Occupied | 908 (84.5%) | $108,393 |
| Renter-Occupied | 167 (15.5%) | $105,549 |
| Average | 1,075 (100.0%) | $106,024 |
Occupancy by Householder Income Bracket in Loch Lomond
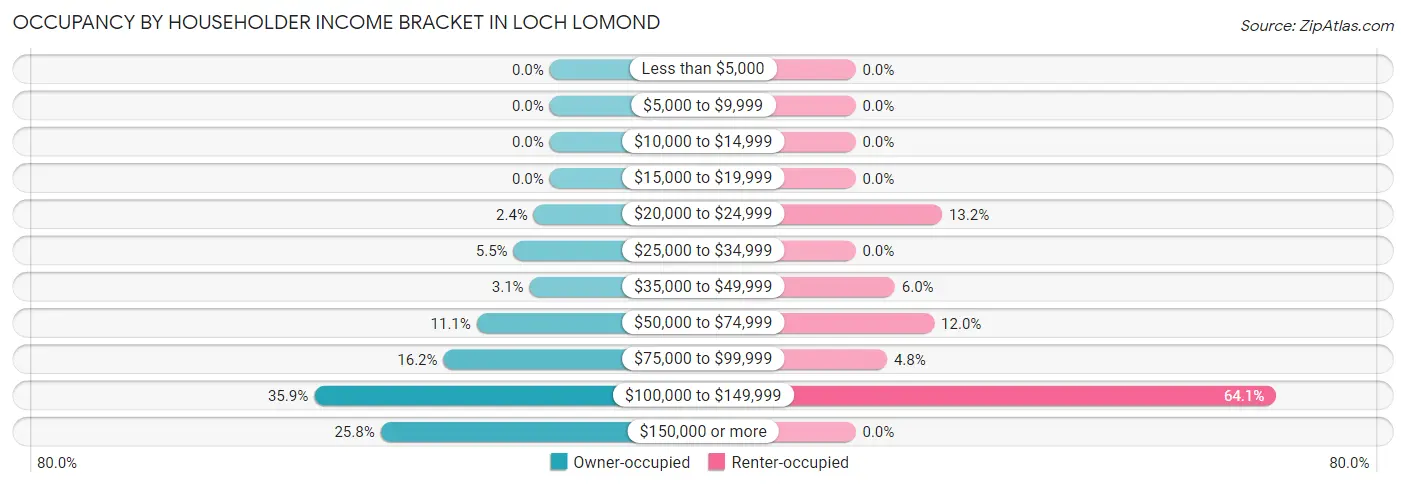
| Income Bracket | Owner-occupied | Renter-occupied |
| Less than $5,000 | 0 (0.0%) | 0 (0.0%) |
| $5,000 to $9,999 | 0 (0.0%) | 0 (0.0%) |
| $10,000 to $14,999 | 0 (0.0%) | 0 (0.0%) |
| $15,000 to $19,999 | 0 (0.0%) | 0 (0.0%) |
| $20,000 to $24,999 | 22 (2.4%) | 22 (13.2%) |
| $25,000 to $34,999 | 50 (5.5%) | 0 (0.0%) |
| $35,000 to $49,999 | 28 (3.1%) | 10 (6.0%) |
| $50,000 to $74,999 | 101 (11.1%) | 20 (12.0%) |
| $75,000 to $99,999 | 147 (16.2%) | 8 (4.8%) |
| $100,000 to $149,999 | 326 (35.9%) | 107 (64.1%) |
| $150,000 or more | 234 (25.8%) | 0 (0.0%) |
| Total | 908 (100.0%) | 167 (100.0%) |
Monthly Housing Cost Tiers in Loch Lomond
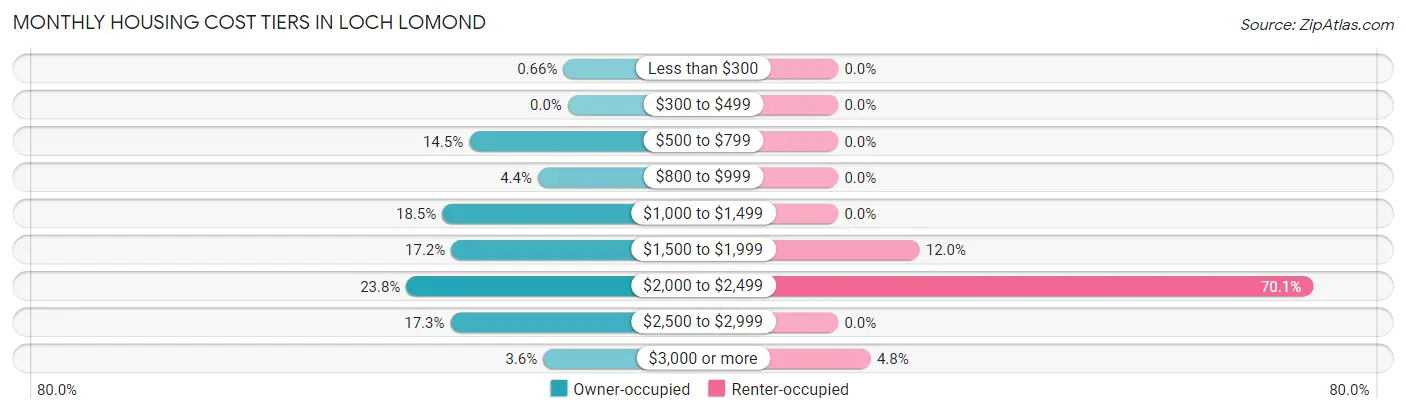
| Monthly Cost | Owner-occupied | Renter-occupied |
| Less than $300 | 6 (0.7%) | 0 (0.0%) |
| $300 to $499 | 0 (0.0%) | 0 (0.0%) |
| $500 to $799 | 132 (14.5%) | 0 (0.0%) |
| $800 to $999 | 40 (4.4%) | 0 (0.0%) |
| $1,000 to $1,499 | 168 (18.5%) | 0 (0.0%) |
| $1,500 to $1,999 | 156 (17.2%) | 20 (12.0%) |
| $2,000 to $2,499 | 216 (23.8%) | 117 (70.1%) |
| $2,500 to $2,999 | 157 (17.3%) | 0 (0.0%) |
| $3,000 or more | 33 (3.6%) | 8 (4.8%) |
| Total | 908 (100.0%) | 167 (100.0%) |
Physical Housing Characteristics in Loch Lomond
Housing Structures in Loch Lomond
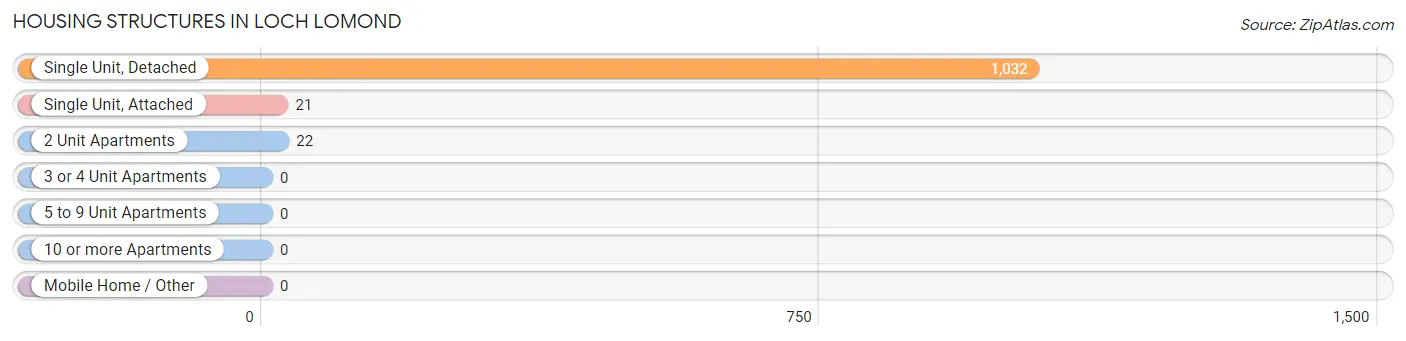
| Structure Type | # Housing Units | % Housing Units |
| Single Unit, Detached | 1,032 | 96.0% |
| Single Unit, Attached | 21 | 1.9% |
| 2 Unit Apartments | 22 | 2.1% |
| 3 or 4 Unit Apartments | 0 | 0.0% |
| 5 to 9 Unit Apartments | 0 | 0.0% |
| 10 or more Apartments | 0 | 0.0% |
| Mobile Home / Other | 0 | 0.0% |
| Total | 1,075 | 100.0% |
Housing Structures by Occupancy in Loch Lomond
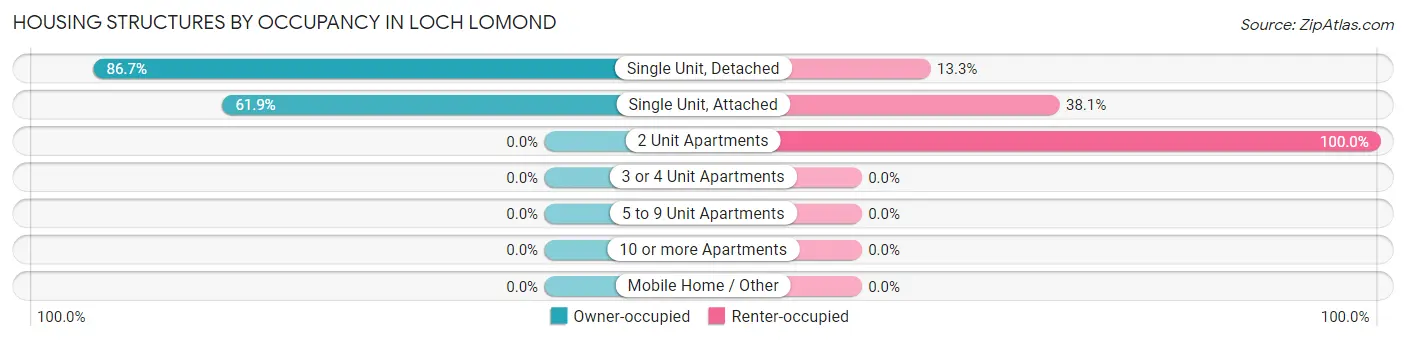
| Structure Type | Owner-occupied | Renter-occupied |
| Single Unit, Detached | 895 (86.7%) | 137 (13.3%) |
| Single Unit, Attached | 13 (61.9%) | 8 (38.1%) |
| 2 Unit Apartments | 0 (0.0%) | 22 (100.0%) |
| 3 or 4 Unit Apartments | 0 (0.0%) | 0 (0.0%) |
| 5 to 9 Unit Apartments | 0 (0.0%) | 0 (0.0%) |
| 10 or more Apartments | 0 (0.0%) | 0 (0.0%) |
| Mobile Home / Other | 0 (0.0%) | 0 (0.0%) |
| Total | 908 (84.5%) | 167 (15.5%) |
Housing Structures by Number of Rooms in Loch Lomond
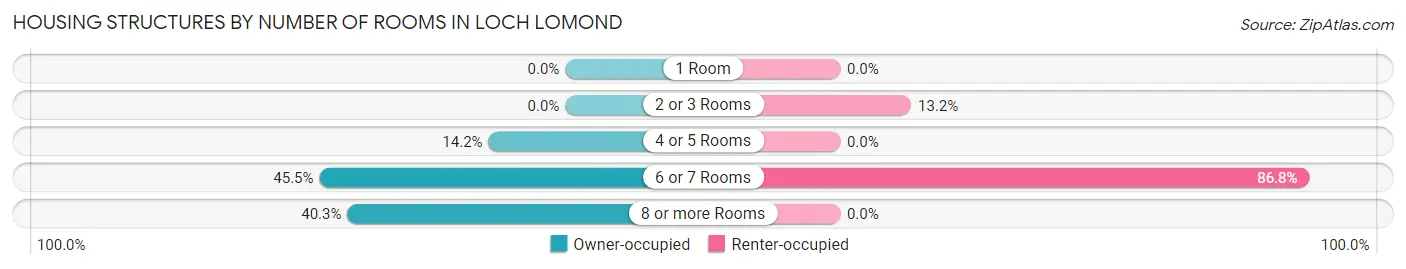
| Number of Rooms | Owner-occupied | Renter-occupied |
| 1 Room | 0 (0.0%) | 0 (0.0%) |
| 2 or 3 Rooms | 0 (0.0%) | 22 (13.2%) |
| 4 or 5 Rooms | 129 (14.2%) | 0 (0.0%) |
| 6 or 7 Rooms | 413 (45.5%) | 145 (86.8%) |
| 8 or more Rooms | 366 (40.3%) | 0 (0.0%) |
| Total | 908 (100.0%) | 167 (100.0%) |
Housing Structure by Heating Type in Loch Lomond
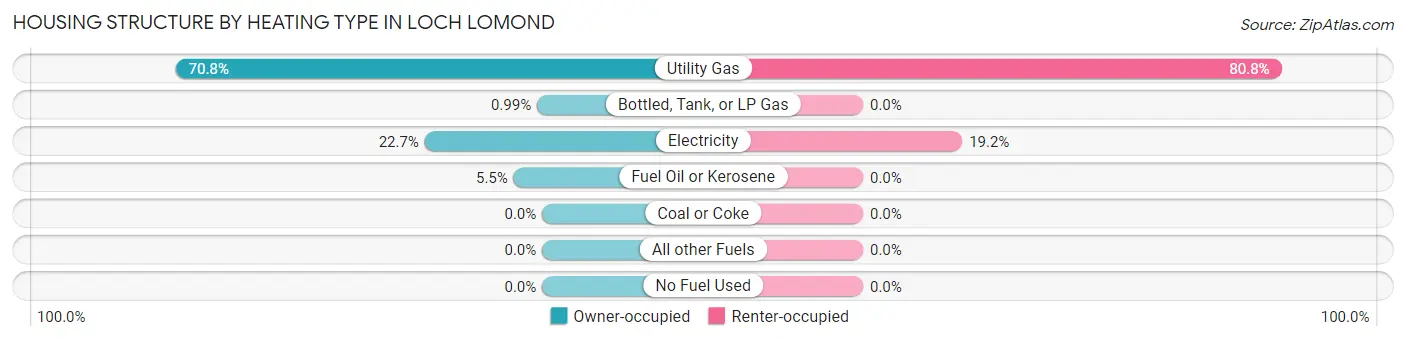
| Heating Type | Owner-occupied | Renter-occupied |
| Utility Gas | 643 (70.8%) | 135 (80.8%) |
| Bottled, Tank, or LP Gas | 9 (1.0%) | 0 (0.0%) |
| Electricity | 206 (22.7%) | 32 (19.2%) |
| Fuel Oil or Kerosene | 50 (5.5%) | 0 (0.0%) |
| Coal or Coke | 0 (0.0%) | 0 (0.0%) |
| All other Fuels | 0 (0.0%) | 0 (0.0%) |
| No Fuel Used | 0 (0.0%) | 0 (0.0%) |
| Total | 908 (100.0%) | 167 (100.0%) |
Household Vehicle Usage in Loch Lomond
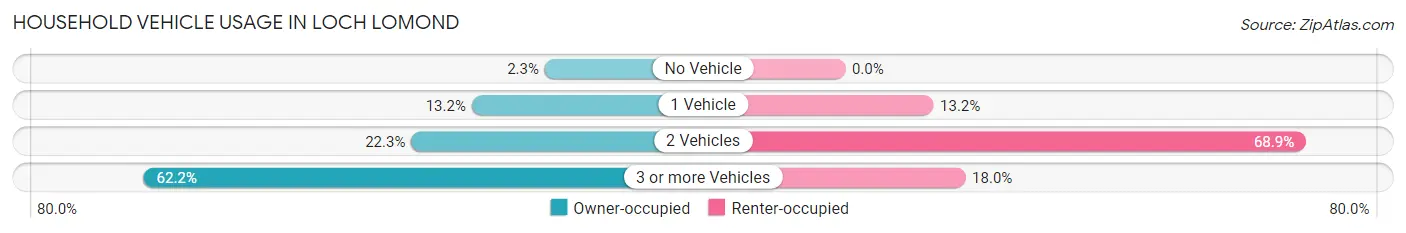
| Vehicles per Household | Owner-occupied | Renter-occupied |
| No Vehicle | 21 (2.3%) | 0 (0.0%) |
| 1 Vehicle | 120 (13.2%) | 22 (13.2%) |
| 2 Vehicles | 202 (22.3%) | 115 (68.9%) |
| 3 or more Vehicles | 565 (62.2%) | 30 (18.0%) |
| Total | 908 (100.0%) | 167 (100.0%) |
Real Estate & Mortgages in Loch Lomond
Real Estate and Mortgage Overview in Loch Lomond
| Characteristic | Without Mortgage | With Mortgage |
| Housing Units | 217 | 691 |
| Median Property Value | $390,800 | $376,600 |
| Median Household Income | $128,267 | $187 |
| Monthly Housing Costs | $677 | $33 |
| Real Estate Taxes | $4,373 | $31 |
Property Value by Mortgage Status in Loch Lomond
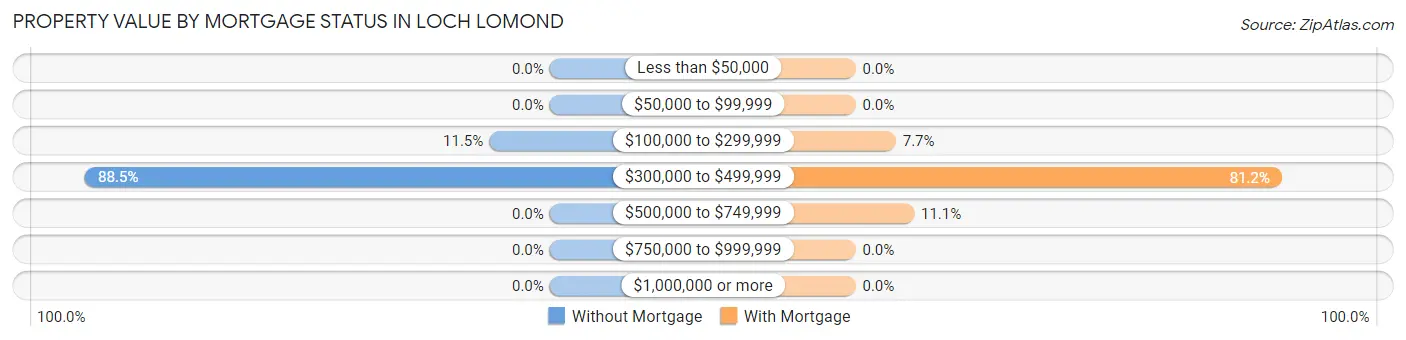
| Property Value | Without Mortgage | With Mortgage |
| Less than $50,000 | 0 (0.0%) | 0 (0.0%) |
| $50,000 to $99,999 | 0 (0.0%) | 0 (0.0%) |
| $100,000 to $299,999 | 25 (11.5%) | 53 (7.7%) |
| $300,000 to $499,999 | 192 (88.5%) | 561 (81.2%) |
| $500,000 to $749,999 | 0 (0.0%) | 77 (11.1%) |
| $750,000 to $999,999 | 0 (0.0%) | 0 (0.0%) |
| $1,000,000 or more | 0 (0.0%) | 0 (0.0%) |
| Total | 217 (100.0%) | 691 (100.0%) |
Household Income by Mortgage Status in Loch Lomond
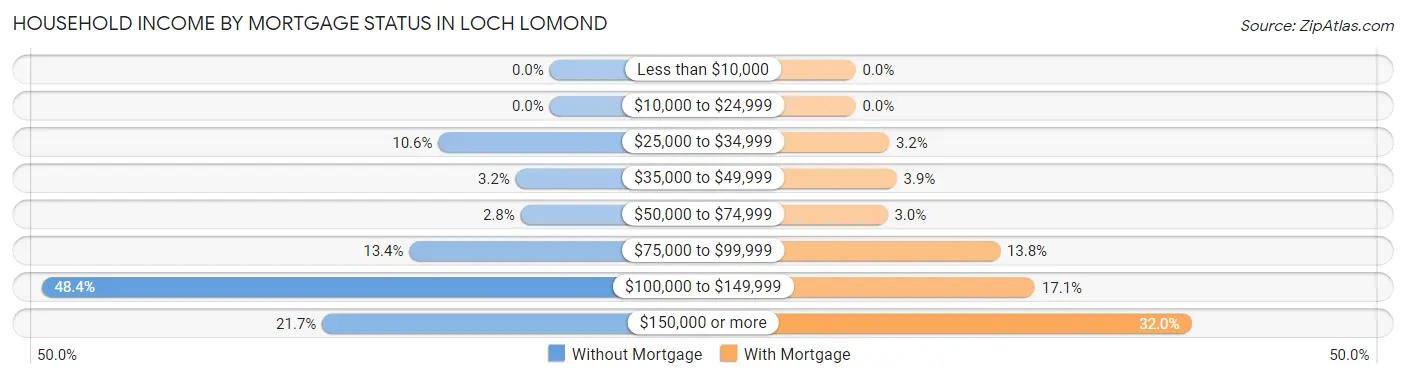
| Household Income | Without Mortgage | With Mortgage |
| Less than $10,000 | 0 (0.0%) | 0 (0.0%) |
| $10,000 to $24,999 | 0 (0.0%) | 0 (0.0%) |
| $25,000 to $34,999 | 23 (10.6%) | 22 (3.2%) |
| $35,000 to $49,999 | 7 (3.2%) | 27 (3.9%) |
| $50,000 to $74,999 | 6 (2.8%) | 21 (3.0%) |
| $75,000 to $99,999 | 29 (13.4%) | 95 (13.8%) |
| $100,000 to $149,999 | 105 (48.4%) | 118 (17.1%) |
| $150,000 or more | 47 (21.7%) | 221 (32.0%) |
| Total | 217 (100.0%) | 691 (100.0%) |
Property Value to Household Income Ratio in Loch Lomond
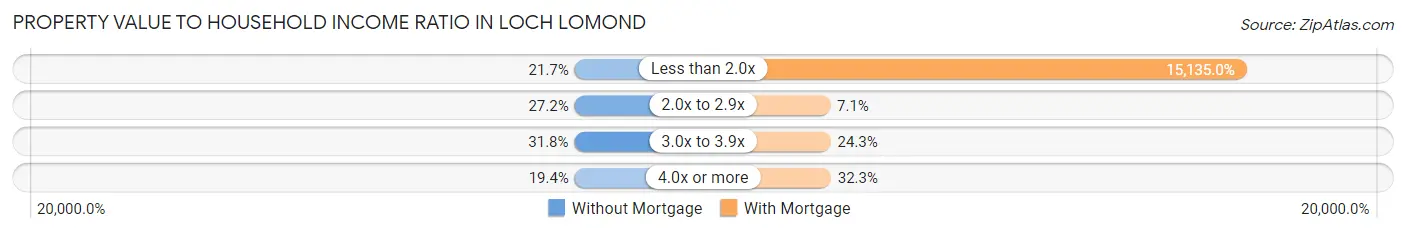
| Value-to-Income Ratio | Without Mortgage | With Mortgage |
| Less than 2.0x | 47 (21.7%) | 104,583 (15,135.0%) |
| 2.0x to 2.9x | 59 (27.2%) | 49 (7.1%) |
| 3.0x to 3.9x | 69 (31.8%) | 168 (24.3%) |
| 4.0x or more | 42 (19.4%) | 223 (32.3%) |
| Total | 217 (100.0%) | 691 (100.0%) |
Real Estate Taxes by Mortgage Status in Loch Lomond
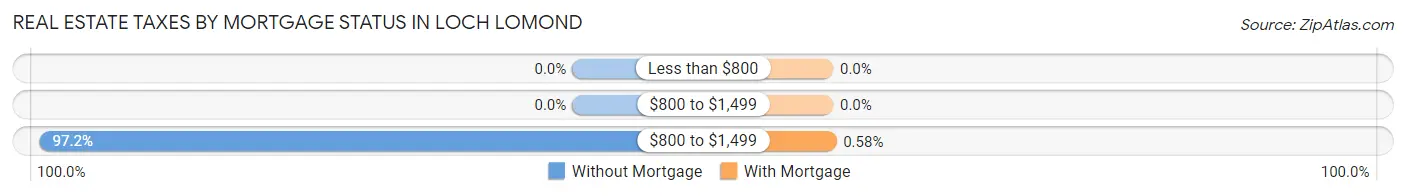
| Property Taxes | Without Mortgage | With Mortgage |
| Less than $800 | 0 (0.0%) | 0 (0.0%) |
| $800 to $1,499 | 0 (0.0%) | 0 (0.0%) |
| $800 to $1,499 | 211 (97.2%) | 4 (0.6%) |
| Total | 217 (100.0%) | 691 (100.0%) |
Health & Disability in Loch Lomond
Health Insurance Coverage by Age in Loch Lomond
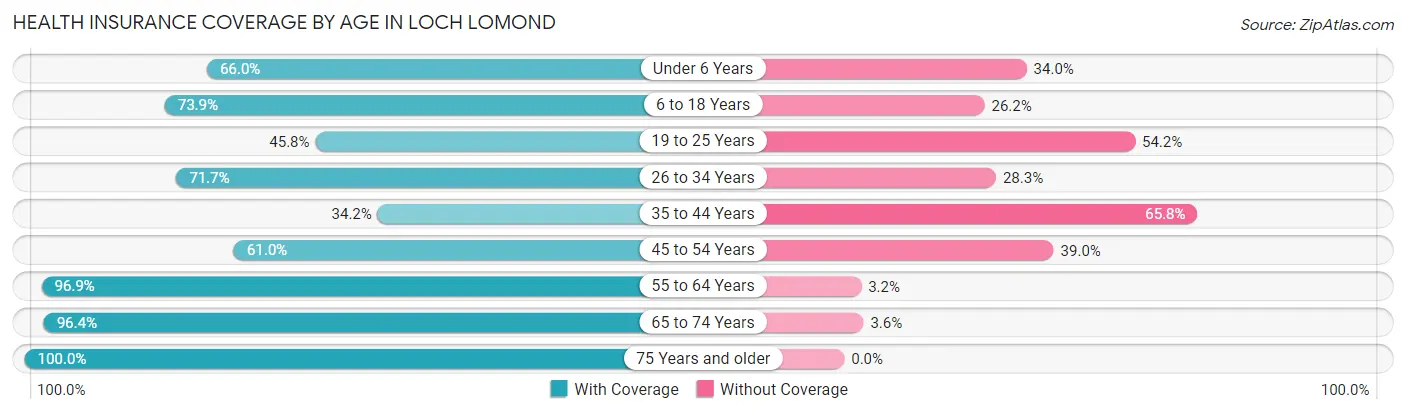
| Age Bracket | With Coverage | Without Coverage |
| Under 6 Years | 97 (66.0%) | 50 (34.0%) |
| 6 to 18 Years | 627 (73.9%) | 222 (26.2%) |
| 19 to 25 Years | 255 (45.8%) | 302 (54.2%) |
| 26 to 34 Years | 218 (71.7%) | 86 (28.3%) |
| 35 to 44 Years | 150 (34.2%) | 289 (65.8%) |
| 45 to 54 Years | 445 (61.0%) | 285 (39.0%) |
| 55 to 64 Years | 307 (96.9%) | 10 (3.2%) |
| 65 to 74 Years | 270 (96.4%) | 10 (3.6%) |
| 75 Years and older | 228 (100.0%) | 0 (0.0%) |
| Total | 2,597 (67.4%) | 1,254 (32.6%) |
Health Insurance Coverage by Citizenship Status in Loch Lomond
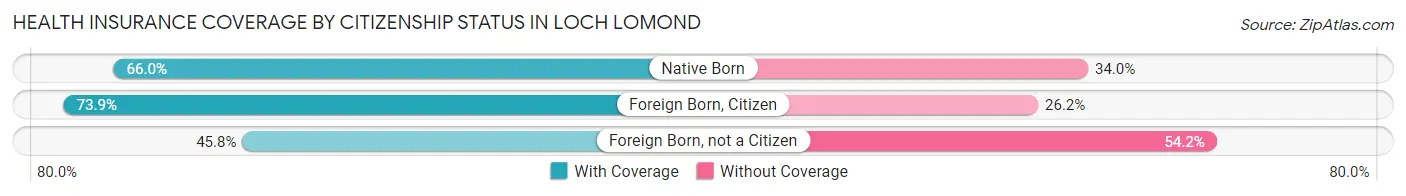
| Citizenship Status | With Coverage | Without Coverage |
| Native Born | 97 (66.0%) | 50 (34.0%) |
| Foreign Born, Citizen | 627 (73.9%) | 222 (26.2%) |
| Foreign Born, not a Citizen | 255 (45.8%) | 302 (54.2%) |
Health Insurance Coverage by Household Income in Loch Lomond
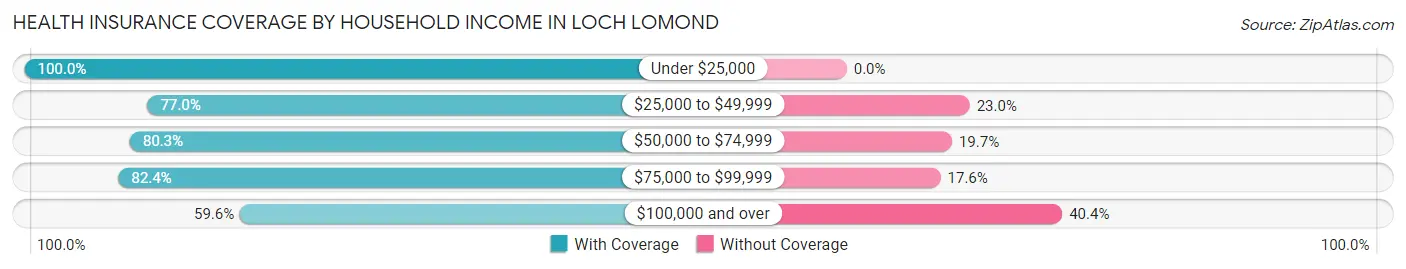
| Household Income | With Coverage | Without Coverage |
| Under $25,000 | 65 (100.0%) | 0 (0.0%) |
| $25,000 to $49,999 | 254 (77.0%) | 76 (23.0%) |
| $50,000 to $74,999 | 440 (80.3%) | 108 (19.7%) |
| $75,000 to $99,999 | 375 (82.4%) | 80 (17.6%) |
| $100,000 and over | 1,463 (59.6%) | 990 (40.4%) |
Public vs Private Health Insurance Coverage by Age in Loch Lomond
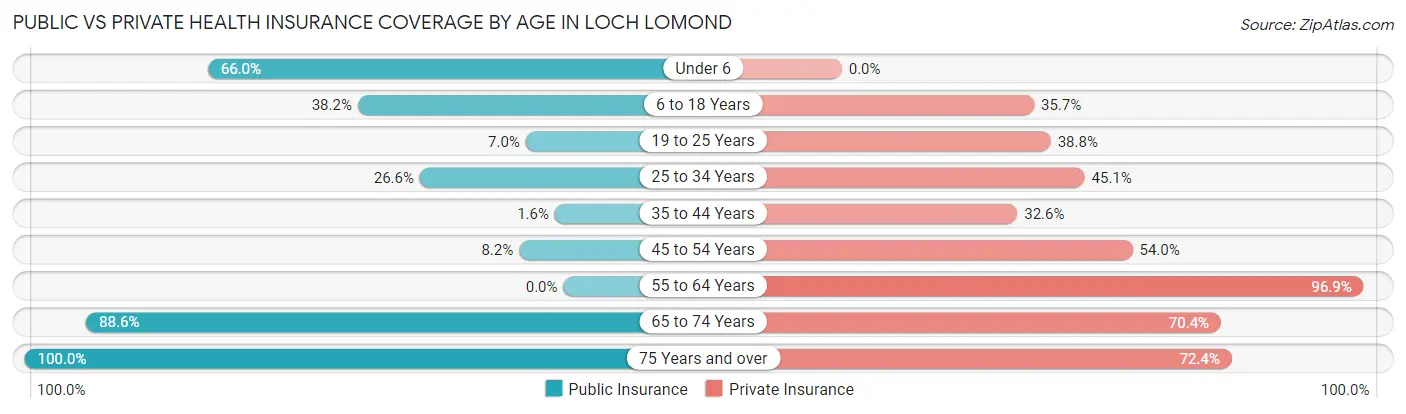
| Age Bracket | Public Insurance | Private Insurance |
| Under 6 | 97 (66.0%) | 0 (0.0%) |
| 6 to 18 Years | 324 (38.2%) | 303 (35.7%) |
| 19 to 25 Years | 39 (7.0%) | 216 (38.8%) |
| 25 to 34 Years | 81 (26.6%) | 137 (45.1%) |
| 35 to 44 Years | 7 (1.6%) | 143 (32.6%) |
| 45 to 54 Years | 60 (8.2%) | 394 (54.0%) |
| 55 to 64 Years | 0 (0.0%) | 307 (96.9%) |
| 65 to 74 Years | 248 (88.6%) | 197 (70.4%) |
| 75 Years and over | 228 (100.0%) | 165 (72.4%) |
| Total | 1,084 (28.1%) | 1,862 (48.3%) |
Disability Status by Sex by Age in Loch Lomond
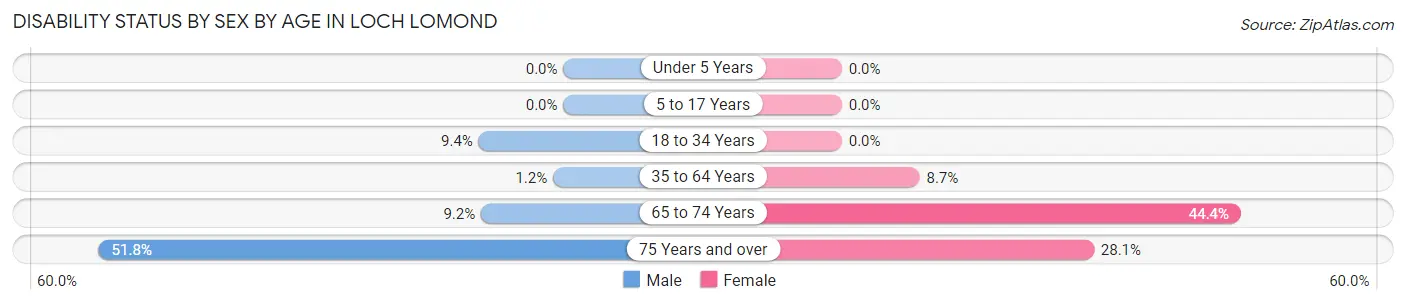
| Age Bracket | Male | Female |
| Under 5 Years | 0 (0.0%) | 0 (0.0%) |
| 5 to 17 Years | 0 (0.0%) | 0 (0.0%) |
| 18 to 34 Years | 56 (9.4%) | 0 (0.0%) |
| 35 to 64 Years | 9 (1.1%) | 61 (8.7%) |
| 65 to 74 Years | 10 (9.2%) | 76 (44.4%) |
| 75 Years and over | 59 (51.7%) | 32 (28.1%) |
Disability Class by Sex by Age in Loch Lomond
Disability Class: Hearing Difficulty
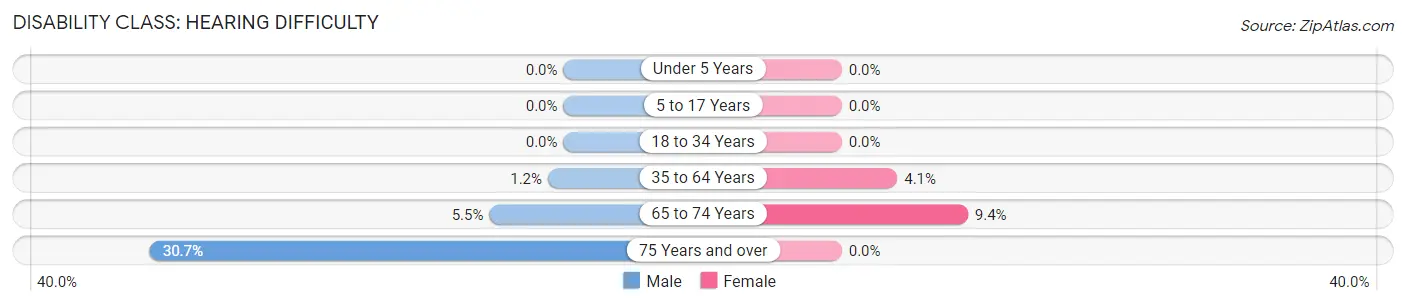
| Age Bracket | Male | Female |
| Under 5 Years | 0 (0.0%) | 0 (0.0%) |
| 5 to 17 Years | 0 (0.0%) | 0 (0.0%) |
| 18 to 34 Years | 0 (0.0%) | 0 (0.0%) |
| 35 to 64 Years | 9 (1.1%) | 29 (4.1%) |
| 65 to 74 Years | 6 (5.5%) | 16 (9.4%) |
| 75 Years and over | 35 (30.7%) | 0 (0.0%) |
Disability Class: Vision Difficulty
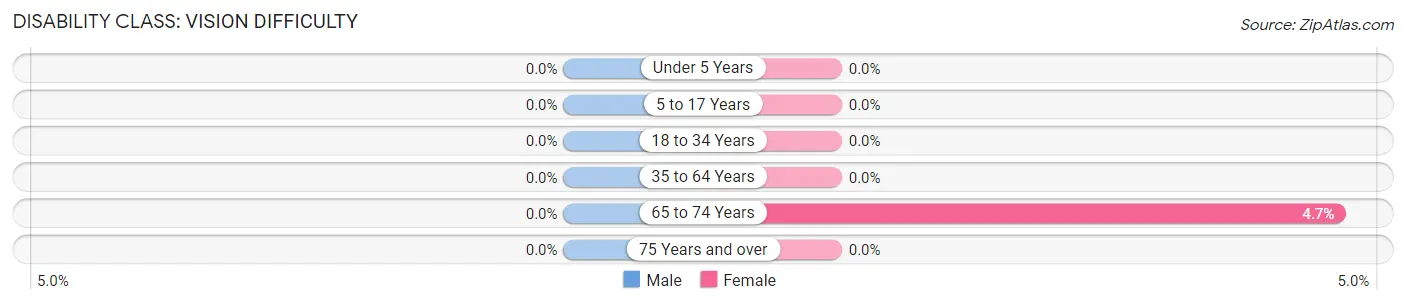
| Age Bracket | Male | Female |
| Under 5 Years | 0 (0.0%) | 0 (0.0%) |
| 5 to 17 Years | 0 (0.0%) | 0 (0.0%) |
| 18 to 34 Years | 0 (0.0%) | 0 (0.0%) |
| 35 to 64 Years | 0 (0.0%) | 0 (0.0%) |
| 65 to 74 Years | 0 (0.0%) | 8 (4.7%) |
| 75 Years and over | 0 (0.0%) | 0 (0.0%) |
Disability Class: Cognitive Difficulty
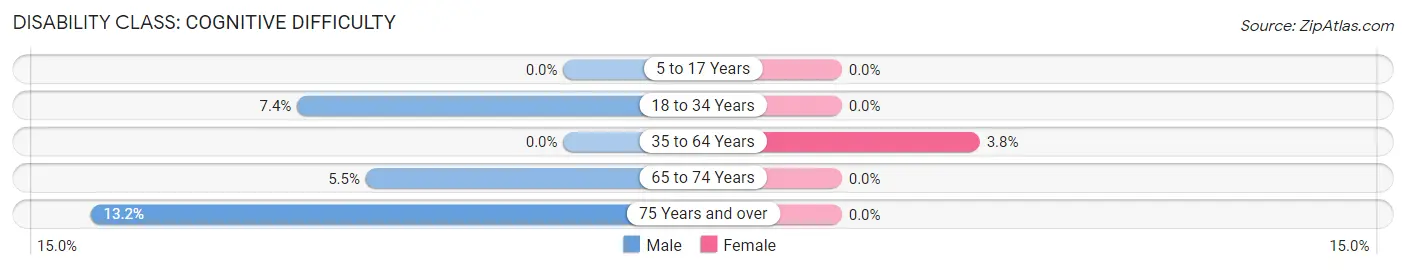
| Age Bracket | Male | Female |
| 5 to 17 Years | 0 (0.0%) | 0 (0.0%) |
| 18 to 34 Years | 44 (7.4%) | 0 (0.0%) |
| 35 to 64 Years | 0 (0.0%) | 27 (3.8%) |
| 65 to 74 Years | 6 (5.5%) | 0 (0.0%) |
| 75 Years and over | 15 (13.2%) | 0 (0.0%) |
Disability Class: Ambulatory Difficulty
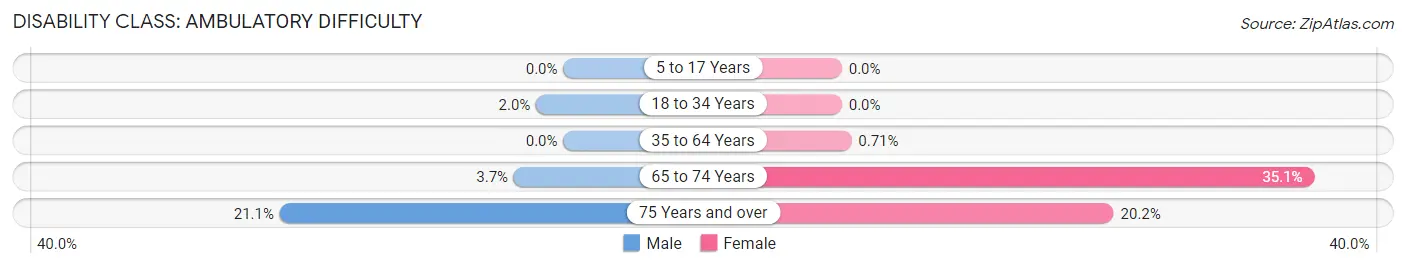
| Age Bracket | Male | Female |
| 5 to 17 Years | 0 (0.0%) | 0 (0.0%) |
| 18 to 34 Years | 12 (2.0%) | 0 (0.0%) |
| 35 to 64 Years | 0 (0.0%) | 5 (0.7%) |
| 65 to 74 Years | 4 (3.7%) | 60 (35.1%) |
| 75 Years and over | 24 (21.0%) | 23 (20.2%) |
Disability Class: Self-Care Difficulty
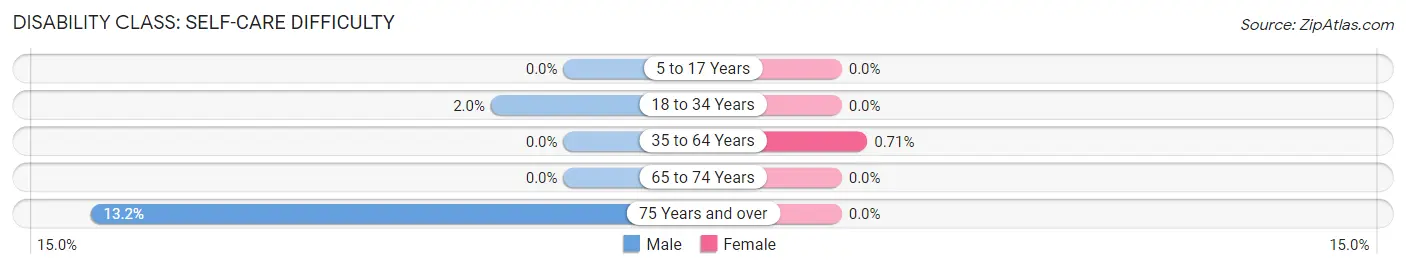
| Age Bracket | Male | Female |
| 5 to 17 Years | 0 (0.0%) | 0 (0.0%) |
| 18 to 34 Years | 12 (2.0%) | 0 (0.0%) |
| 35 to 64 Years | 0 (0.0%) | 5 (0.7%) |
| 65 to 74 Years | 0 (0.0%) | 0 (0.0%) |
| 75 Years and over | 15 (13.2%) | 0 (0.0%) |
Technology Access in Loch Lomond
Computing Device Access in Loch Lomond
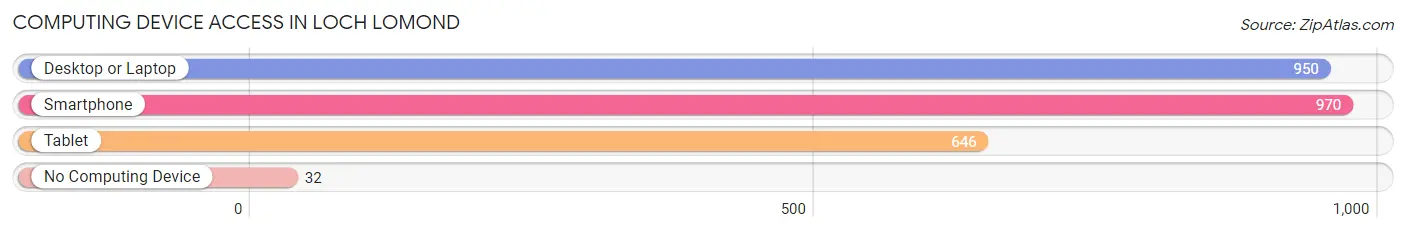
| Device Type | # Households | % Households |
| Desktop or Laptop | 950 | 88.4% |
| Smartphone | 970 | 90.2% |
| Tablet | 646 | 60.1% |
| No Computing Device | 32 | 3.0% |
| Total | 1,075 | 100.0% |
Internet Access in Loch Lomond
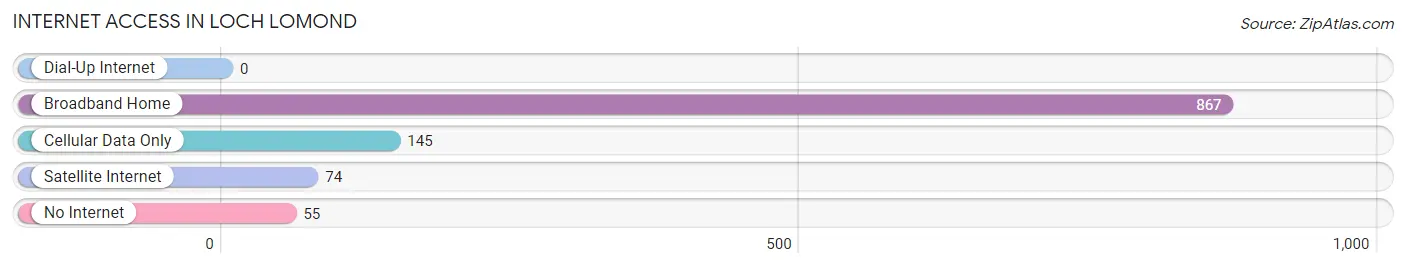
| Internet Type | # Households | % Households |
| Dial-Up Internet | 0 | 0.0% |
| Broadband Home | 867 | 80.6% |
| Cellular Data Only | 145 | 13.5% |
| Satellite Internet | 74 | 6.9% |
| No Internet | 55 | 5.1% |
| Total | 1,075 | 100.0% |
Loch Lomond Summary
Loch Lomond is a small unincorporated community located in Fauquier County, Virginia. It is situated in the foothills of the Blue Ridge Mountains, approximately 25 miles west of Washington, D.C. The community is named after the nearby Loch Lomond, a lake located in the nearby Bull Run Mountains.
History
The area around Loch Lomond has been inhabited since the late 1700s. The first settlers were primarily of English and German descent. The area was originally known as “Loch Lomond” after the nearby lake. The community was officially established in 1820 when the first post office was opened.
In the late 1800s, the area around Loch Lomond was a popular destination for wealthy Washingtonians looking to escape the city. The area was known for its beautiful scenery and outdoor activities such as hunting and fishing.
In the early 1900s, the area around Loch Lomond began to develop. The first school was built in 1912 and the first church was built in 1915. The community also had a general store, a blacksmith shop, and a grist mill.
In the 1950s, the area around Loch Lomond began to experience rapid growth. The population increased from around 200 in 1950 to over 1,000 in 1960. This growth was due to the increasing popularity of the area as a rural retreat for Washingtonians.
Geography
Loch Lomond is located in the foothills of the Blue Ridge Mountains in Fauquier County, Virginia. The community is situated on the banks of the Bull Run River, approximately 25 miles west of Washington, D.C. The area is characterized by rolling hills, forests, and streams.
The climate in Loch Lomond is temperate and humid. Summers are hot and humid, with temperatures reaching into the 90s. Winters are cold and wet, with temperatures dropping into the 20s.
Economy
The economy of Loch Lomond is primarily based on agriculture and tourism. The area is known for its beautiful scenery and outdoor activities such as hunting and fishing.
Agriculture is the main source of income for many of the residents of Loch Lomond. The area is known for its production of hay, corn, and soybeans.
Tourism is also an important part of the economy. The area is a popular destination for Washingtonians looking to escape the city. The area is known for its beautiful scenery and outdoor activities such as hunting and fishing.
Demographics
As of the 2010 census, the population of Loch Lomond was 1,093. The population is primarily white (94.3%) and the median age is 44. The median household income is $68,750 and the median home value is $310,000.
Conclusion
Loch Lomond is a small unincorporated community located in Fauquier County, Virginia. It is situated in the foothills of the Blue Ridge Mountains, approximately 25 miles west of Washington, D.C. The area has a long history of settlement and has been a popular destination for Washingtonians looking to escape the city. The economy of Loch Lomond is primarily based on agriculture and tourism. The population is primarily white and the median age is 44.
Common Questions
What is Per Capita Income in Loch Lomond?
Per Capita income in Loch Lomond is $33,767.
What is the Median Family Income in Loch Lomond?
Median Family Income in Loch Lomond is $106,447.
What is the Median Household income in Loch Lomond?
Median Household Income in Loch Lomond is $106,024.
What is Income or Wage Gap in Loch Lomond?
Income or Wage Gap in Loch Lomond is 25.8%.
Women in Loch Lomond earn 74.2 cents for every dollar earned by a man.
What is Inequality or Gini Index in Loch Lomond?
Inequality or Gini Index in Loch Lomond is 0.29.
What is the Total Population of Loch Lomond?
Total Population of Loch Lomond is 3,851.
What is the Total Male Population of Loch Lomond?
Total Male Population of Loch Lomond is 1,926.
What is the Total Female Population of Loch Lomond?
Total Female Population of Loch Lomond is 1,925.
What is the Ratio of Males per 100 Females in Loch Lomond?
There are 100.05 Males per 100 Females in Loch Lomond.
What is the Ratio of Females per 100 Males in Loch Lomond?
There are 99.95 Females per 100 Males in Loch Lomond.
What is the Median Population Age in Loch Lomond?
Median Population Age in Loch Lomond is 37.0 Years.
What is the Average Family Size in Loch Lomond
Average Family Size in Loch Lomond is 3.7 People.
What is the Average Household Size in Loch Lomond
Average Household Size in Loch Lomond is 3.6 People.
How Large is the Labor Force in Loch Lomond?
There are 2,190 People in the Labor Forcein in Loch Lomond.
What is the Percentage of People in the Labor Force in Loch Lomond?
69.6% of People are in the Labor Force in Loch Lomond.
What is the Unemployment Rate in Loch Lomond?
Unemployment Rate in Loch Lomond is 10.0%.