Boswell s Corner, VA Map & Demographics
Boswell s Corner Map
Boswell s Corner Overview
$26,948
PER CAPITA INCOME
$69,978
AVG FAMILY INCOME
50.1%
WAGE / INCOME GAP [ % ]
49.9¢/ $1
WAGE / INCOME GAP [ $ ]
$8,553
FAMILY INCOME DEFICIT
0.41
INEQUALITY / GINI INDEX
1,215
TOTAL POPULATION
586
MALE POPULATION
629
FEMALE POPULATION
93.16
MALES / 100 FEMALES
107.34
FEMALES / 100 MALES
28.9
MEDIAN AGE
3.5
AVG FAMILY SIZE
2.8
AVG HOUSEHOLD SIZE
727
LABOR FORCE [ PEOPLE ]
74.5%
PERCENT IN LABOR FORCE
2.2%
UNEMPLOYMENT RATE
Income in Boswell s Corner
Income Overview in Boswell s Corner
| Characteristic | Number | Measure |
| Per Capita Income | 1,215 | $26,948 |
| Median Family Income | 263 | $69,978 |
| Mean Family Income | 263 | $79,729 |
| Median Household Income | 442 | $0 |
| Mean Household Income | 442 | $69,006 |
| Income Deficit | 263 | $8,553 |
| Wage / Income Gap (%) | 1,215 | 50.06% |
| Wage / Income Gap ($) | 1,215 | 49.94¢ per $1 |
| Gini / Inequality Index | 1,215 | 0.41 |
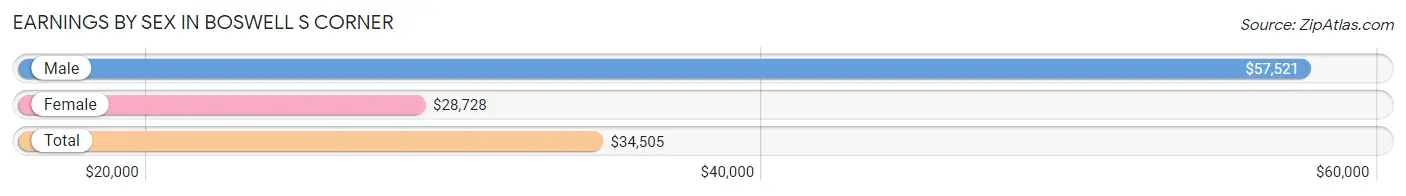
Earnings by Sex in Boswell s Corner
Average Earnings in Boswell s Corner are $34,505, $57,521 for men and $28,728 for women, a difference of 50.1%.
| Sex | Number | Average Earnings |
| Male | 324 (44.6%) | $57,521 |
| Female | 402 (55.4%) | $28,728 |
| Total | 726 (100.0%) | $34,505 |
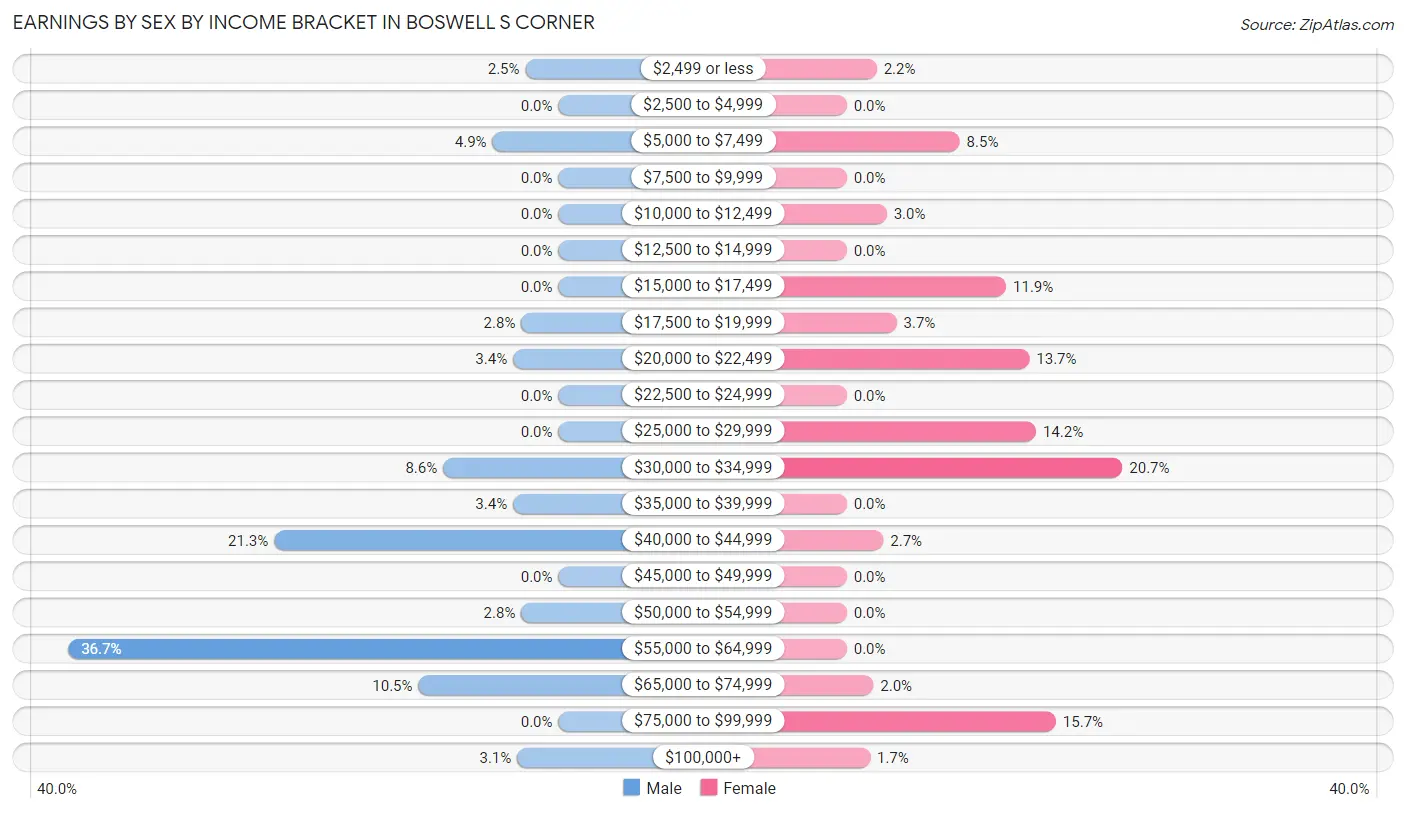
Earnings by Sex by Income Bracket in Boswell s Corner
The most common earnings brackets in Boswell s Corner are $55,000 to $64,999 for men (119 | 36.7%) and $30,000 to $34,999 for women (83 | 20.6%).
| Income | Male | Female |
| $2,499 or less | 8 (2.5%) | 9 (2.2%) |
| $2,500 to $4,999 | 0 (0.0%) | 0 (0.0%) |
| $5,000 to $7,499 | 16 (4.9%) | 34 (8.5%) |
| $7,500 to $9,999 | 0 (0.0%) | 0 (0.0%) |
| $10,000 to $12,499 | 0 (0.0%) | 12 (3.0%) |
| $12,500 to $14,999 | 0 (0.0%) | 0 (0.0%) |
| $15,000 to $17,499 | 0 (0.0%) | 48 (11.9%) |
| $17,500 to $19,999 | 9 (2.8%) | 15 (3.7%) |
| $20,000 to $22,499 | 11 (3.4%) | 55 (13.7%) |
| $22,500 to $24,999 | 0 (0.0%) | 0 (0.0%) |
| $25,000 to $29,999 | 0 (0.0%) | 57 (14.2%) |
| $30,000 to $34,999 | 28 (8.6%) | 83 (20.6%) |
| $35,000 to $39,999 | 11 (3.4%) | 0 (0.0%) |
| $40,000 to $44,999 | 69 (21.3%) | 11 (2.7%) |
| $45,000 to $49,999 | 0 (0.0%) | 0 (0.0%) |
| $50,000 to $54,999 | 9 (2.8%) | 0 (0.0%) |
| $55,000 to $64,999 | 119 (36.7%) | 0 (0.0%) |
| $65,000 to $74,999 | 34 (10.5%) | 8 (2.0%) |
| $75,000 to $99,999 | 0 (0.0%) | 63 (15.7%) |
| $100,000+ | 10 (3.1%) | 7 (1.7%) |
| Total | 324 (100.0%) | 402 (100.0%) |
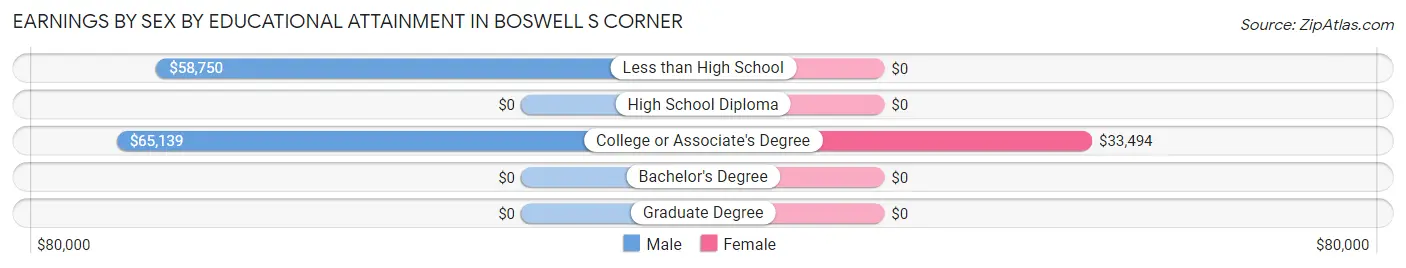
Earnings by Sex by Educational Attainment in Boswell s Corner
Average earnings in Boswell s Corner are $58,571 for men and $29,715 for women, a difference of 49.3%. Men with an educational attainment of college or associate's degree enjoy the highest average annual earnings of $65,139, while those with less than high school education earn the least with $58,750. Women with an educational attainment of college or associate's degree earn the most with the average annual earnings of $33,494, while those with college or associate's degree education have the smallest earnings of $33,494.
| Educational Attainment | Male Income | Female Income |
| Less than High School | $58,750 | $0 |
| High School Diploma | - | - |
| College or Associate's Degree | $65,139 | $33,494 |
| Bachelor's Degree | - | - |
| Graduate Degree | - | - |
| Total | $58,571 | $29,715 |
Family Income in Boswell s Corner
Family Income Brackets in Boswell s Corner
According to the Boswell s Corner family income data, there are 98 families falling into the $100,000 to $149,999 income range, which is the most common income bracket and makes up 37.3% of all families.
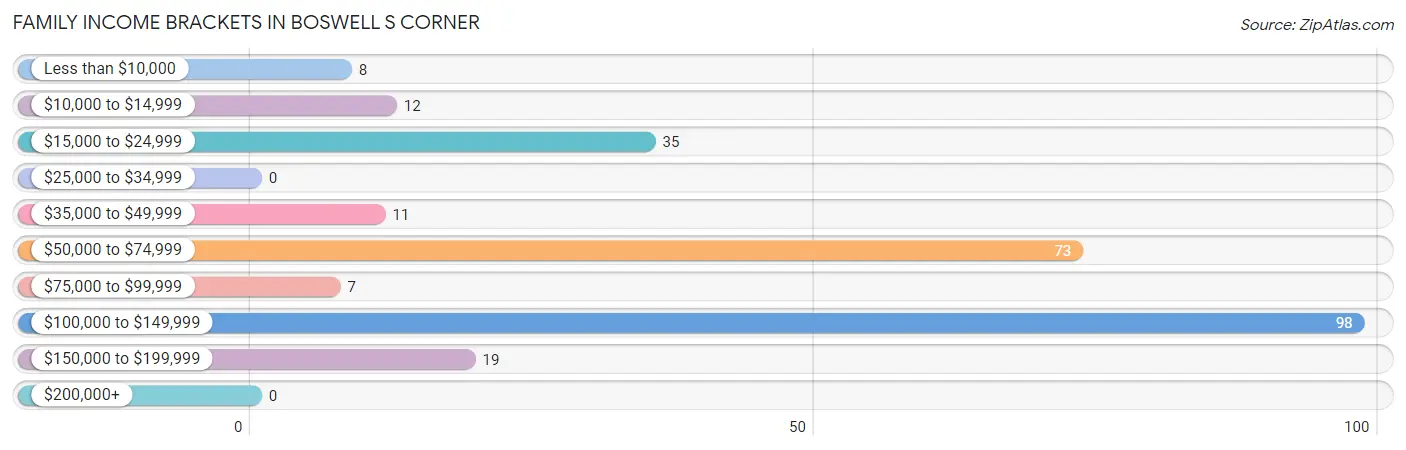
| Income Bracket | # Families | % Families |
| Less than $10,000 | 8 | 3.0% |
| $10,000 to $14,999 | 12 | 4.6% |
| $15,000 to $24,999 | 35 | 13.3% |
| $25,000 to $34,999 | 0 | 0.0% |
| $35,000 to $49,999 | 11 | 4.2% |
| $50,000 to $74,999 | 73 | 27.8% |
| $75,000 to $99,999 | 7 | 2.7% |
| $100,000 to $149,999 | 98 | 37.3% |
| $150,000 to $199,999 | 19 | 7.2% |
| $200,000+ | 0 | 0.0% |
Family Income by Famaliy Size in Boswell s Corner
4-person families (101 | 38.4%) account for the highest median family income in Boswell s Corner with $103,872 per family, while 4-person families (101 | 38.4%) have the highest median income of $25,968 per family member.
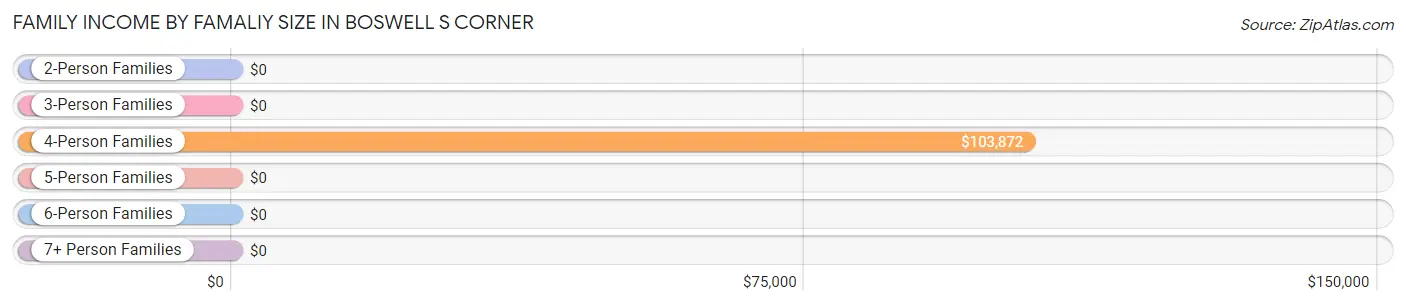
| Income Bracket | # Families | Median Income |
| 2-Person Families | 37 (14.1%) | $0 |
| 3-Person Families | 51 (19.4%) | $0 |
| 4-Person Families | 101 (38.4%) | $103,872 |
| 5-Person Families | 65 (24.7%) | $0 |
| 6-Person Families | 9 (3.4%) | $0 |
| 7+ Person Families | 0 (0.0%) | $0 |
| Total | 263 (100.0%) | $69,978 |
Family Income by Number of Earners in Boswell s Corner
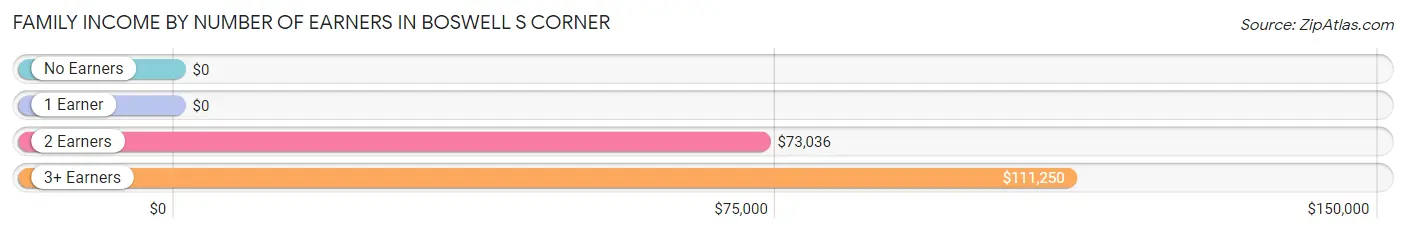
| Number of Earners | # Families | Median Income |
| No Earners | 0 (0.0%) | $0 |
| 1 Earner | 81 (30.8%) | $0 |
| 2 Earners | 155 (58.9%) | $73,036 |
| 3+ Earners | 27 (10.3%) | $111,250 |
| Total | 263 (100.0%) | $69,978 |
Household Income in Boswell s Corner
Household Income Brackets in Boswell s Corner
With 162 households falling in the category, the $100,000 to $149,999 income range is the most frequent in Boswell s Corner, accounting for 36.6% of all households.
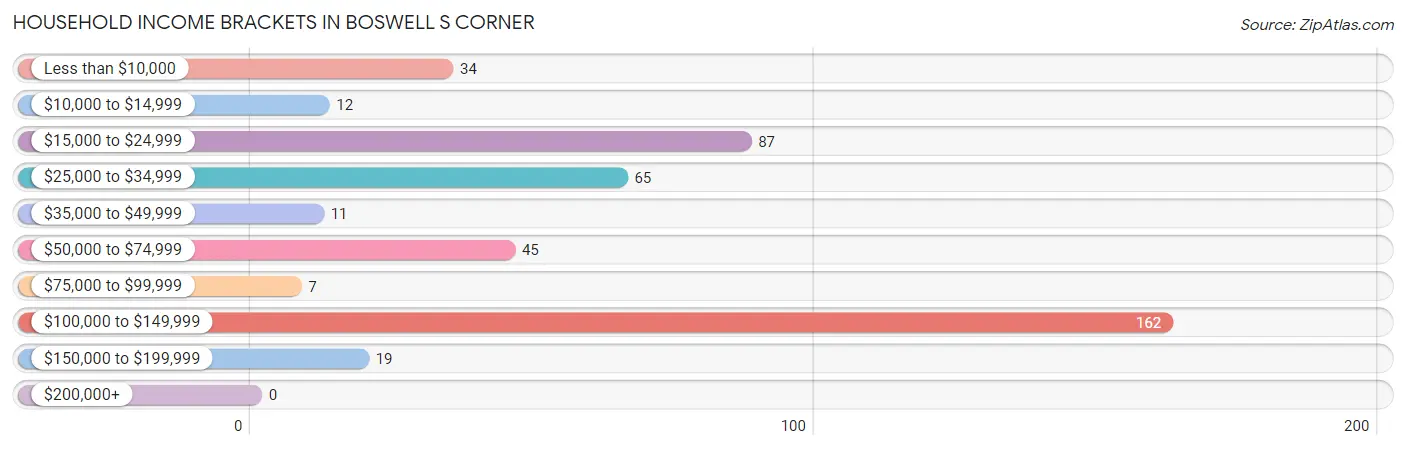
| Income Bracket | # Households | % Households |
| Less than $10,000 | 34 | 7.7% |
| $10,000 to $14,999 | 12 | 2.7% |
| $15,000 to $24,999 | 87 | 19.7% |
| $25,000 to $34,999 | 65 | 14.7% |
| $35,000 to $49,999 | 11 | 2.5% |
| $50,000 to $74,999 | 45 | 10.2% |
| $75,000 to $99,999 | 7 | 1.6% |
| $100,000 to $149,999 | 162 | 36.7% |
| $150,000 to $199,999 | 19 | 4.3% |
| $200,000+ | 0 | 0.0% |
Household Income by Householder Age in Boswell s Corner
The median household income in Boswell s Corner is $0, with the highest median household income of $77,857 found in the 45 to 64 years age bracket for the primary householder. A total of 226 households (51.1%) fall into this category. Meanwhile, the 25 to 44 years age bracket for the primary householder has the lowest median household income of $0, with 92 households (20.8%) in this group.
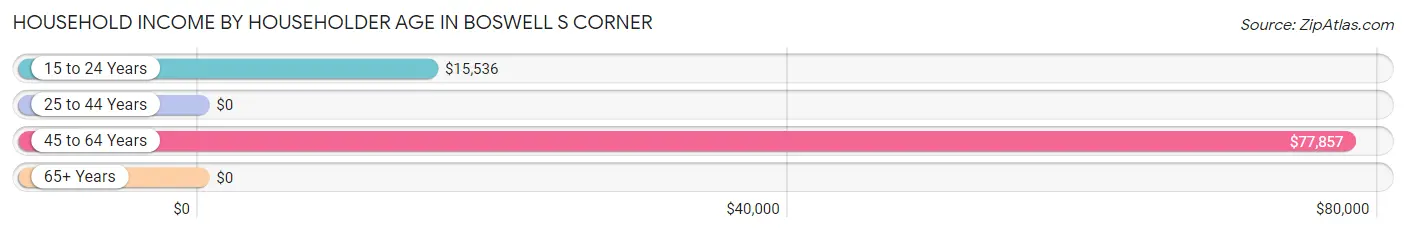
| Income Bracket | # Households | Median Income |
| 15 to 24 Years | 55 (12.4%) | $15,536 |
| 25 to 44 Years | 92 (20.8%) | $0 |
| 45 to 64 Years | 226 (51.1%) | $77,857 |
| 65+ Years | 69 (15.6%) | $0 |
| Total | 442 (100.0%) | $0 |
Poverty in Boswell s Corner
Income Below Poverty by Sex and Age in Boswell s Corner
With 4.6% poverty level for males and 18.1% for females among the residents of Boswell s Corner, under 5 year old males and under 5 year old females are the most vulnerable to poverty, with 19 males (28.4%) and 18 females (100.0%) in their respective age groups living below the poverty level.
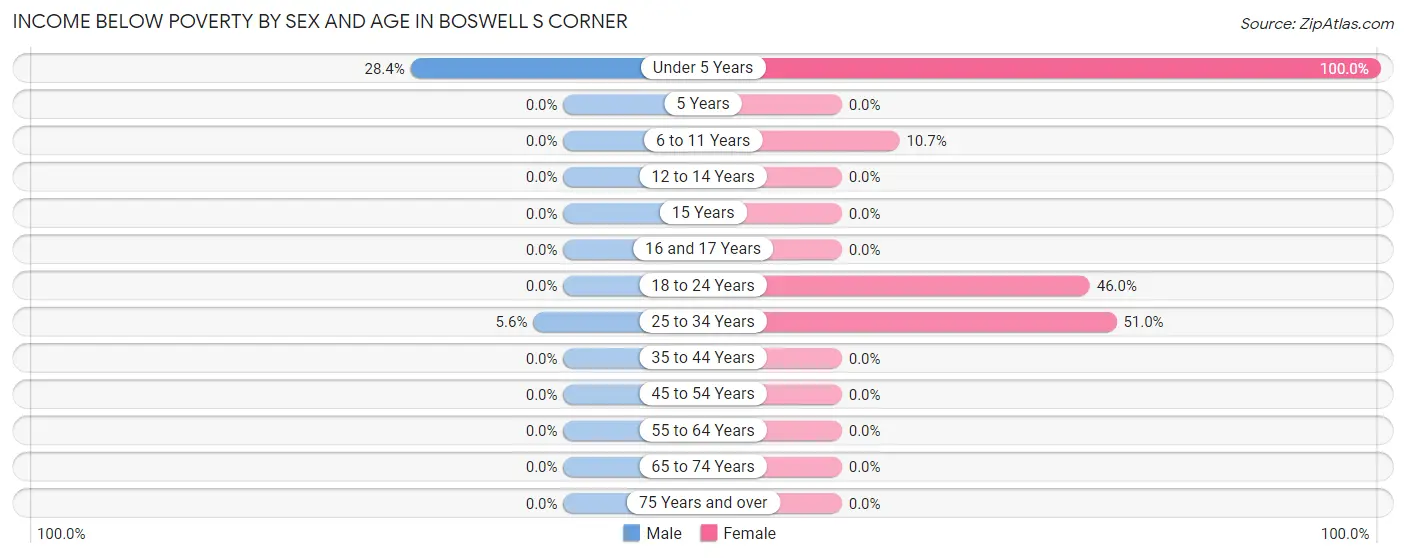
| Age Bracket | Male | Female |
| Under 5 Years | 19 (28.4%) | 18 (100.0%) |
| 5 Years | 0 (0.0%) | 0 (0.0%) |
| 6 to 11 Years | 0 (0.0%) | 6 (10.7%) |
| 12 to 14 Years | 0 (0.0%) | 0 (0.0%) |
| 15 Years | 0 (0.0%) | 0 (0.0%) |
| 16 and 17 Years | 0 (0.0%) | 0 (0.0%) |
| 18 to 24 Years | 0 (0.0%) | 64 (46.0%) |
| 25 to 34 Years | 8 (5.6%) | 26 (51.0%) |
| 35 to 44 Years | 0 (0.0%) | 0 (0.0%) |
| 45 to 54 Years | 0 (0.0%) | 0 (0.0%) |
| 55 to 64 Years | 0 (0.0%) | 0 (0.0%) |
| 65 to 74 Years | 0 (0.0%) | 0 (0.0%) |
| 75 Years and over | 0 (0.0%) | 0 (0.0%) |
| Total | 27 (4.6%) | 114 (18.1%) |
Income Above Poverty by Sex and Age in Boswell s Corner
According to the poverty statistics in Boswell s Corner, males aged 6 to 11 years and females aged 5 years are the age groups that are most secure financially, with 100.0% of males and 100.0% of females in these age groups living above the poverty line.
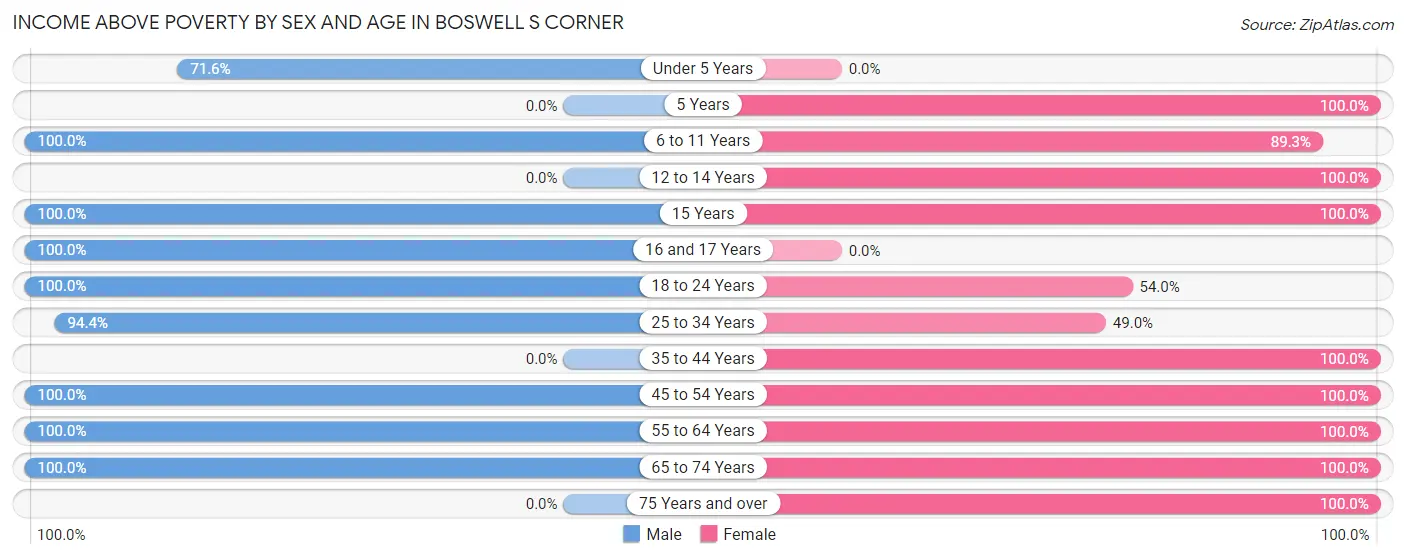
| Age Bracket | Male | Female |
| Under 5 Years | 48 (71.6%) | 0 (0.0%) |
| 5 Years | 0 (0.0%) | 8 (100.0%) |
| 6 to 11 Years | 62 (100.0%) | 50 (89.3%) |
| 12 to 14 Years | 0 (0.0%) | 16 (100.0%) |
| 15 Years | 4 (100.0%) | 8 (100.0%) |
| 16 and 17 Years | 72 (100.0%) | 0 (0.0%) |
| 18 to 24 Years | 108 (100.0%) | 75 (54.0%) |
| 25 to 34 Years | 135 (94.4%) | 25 (49.0%) |
| 35 to 44 Years | 0 (0.0%) | 66 (100.0%) |
| 45 to 54 Years | 65 (100.0%) | 156 (100.0%) |
| 55 to 64 Years | 51 (100.0%) | 42 (100.0%) |
| 65 to 74 Years | 14 (100.0%) | 17 (100.0%) |
| 75 Years and over | 0 (0.0%) | 52 (100.0%) |
| Total | 559 (95.4%) | 515 (81.9%) |
Income Below Poverty Among Married-Couple Families in Boswell s Corner
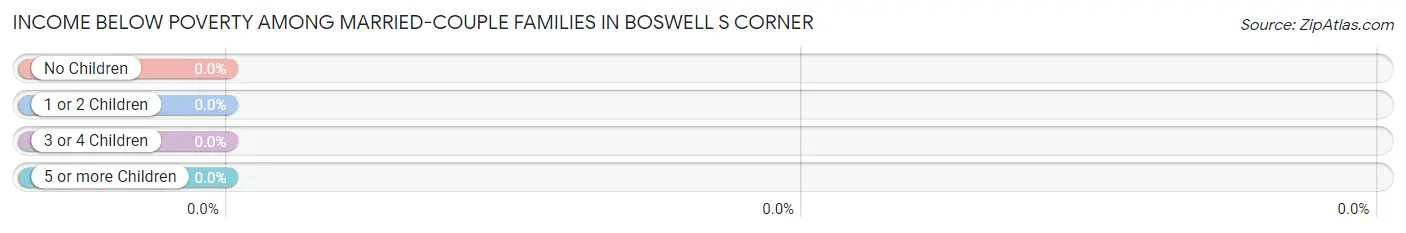
| Children | Above Poverty | Below Poverty |
| No Children | 44 (100.0%) | 0 (0.0%) |
| 1 or 2 Children | 80 (100.0%) | 0 (0.0%) |
| 3 or 4 Children | 0 (0.0%) | 0 (0.0%) |
| 5 or more Children | 0 (0.0%) | 0 (0.0%) |
| Total | 124 (100.0%) | 0 (0.0%) |
Income Below Poverty Among Single-Parent Households in Boswell s Corner
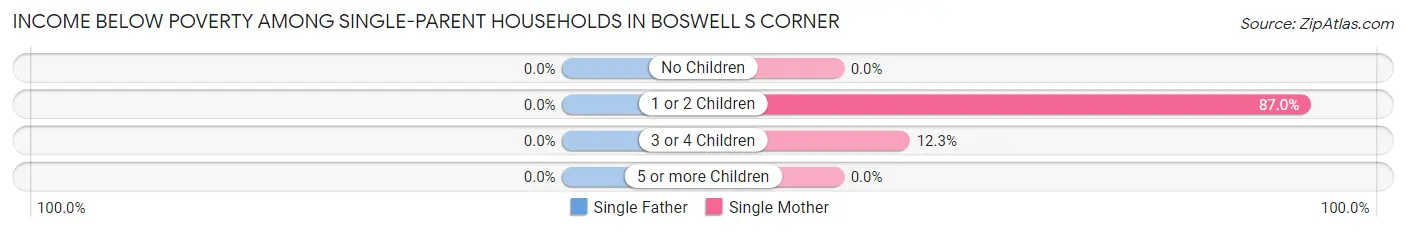
| Children | Single Father | Single Mother |
| No Children | 0 (0.0%) | 0 (0.0%) |
| 1 or 2 Children | 0 (0.0%) | 47 (87.0%) |
| 3 or 4 Children | 0 (0.0%) | 8 (12.3%) |
| 5 or more Children | 0 (0.0%) | 0 (0.0%) |
| Total | 0 (0.0%) | 55 (46.2%) |
Income Below Poverty Among Married-Couple vs Single-Parent Households in Boswell s Corner
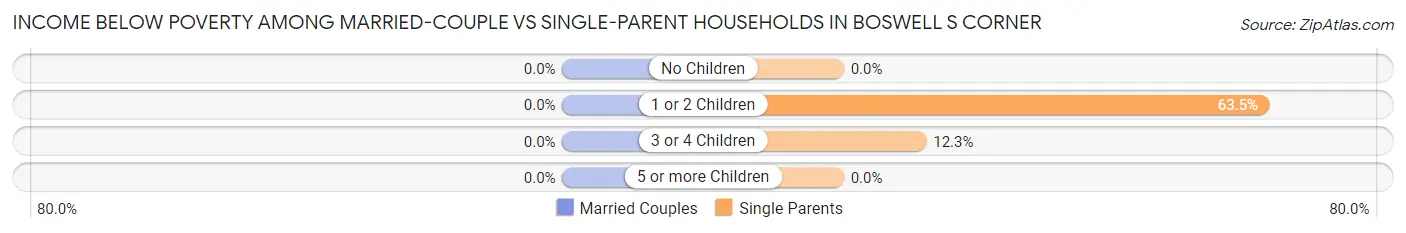
| Children | Married-Couple Families | Single-Parent Households |
| No Children | 0 (0.0%) | 0 (0.0%) |
| 1 or 2 Children | 0 (0.0%) | 47 (63.5%) |
| 3 or 4 Children | 0 (0.0%) | 8 (12.3%) |
| 5 or more Children | 0 (0.0%) | 0 (0.0%) |
| Total | 0 (0.0%) | 55 (39.6%) |
Race in Boswell s Corner
The most populous races in Boswell s Corner are Hispanic or Latino (681 | 56.0%), White / Caucasian (443 | 36.5%), and Some other Race (437 | 36.0%).
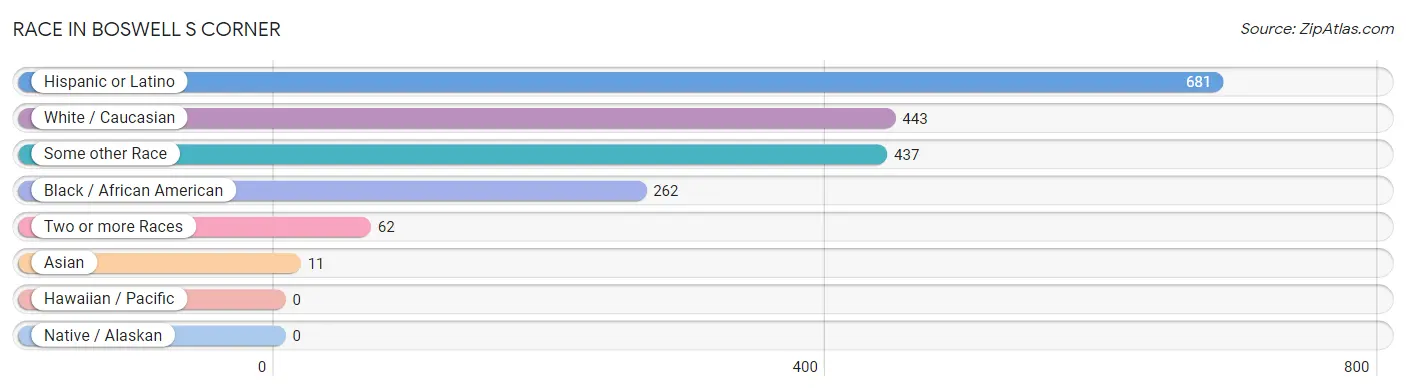
| Race | # Population | % Population |
| Asian | 11 | 0.9% |
| Black / African American | 262 | 21.6% |
| Hawaiian / Pacific | 0 | 0.0% |
| Hispanic or Latino | 681 | 56.0% |
| Native / Alaskan | 0 | 0.0% |
| White / Caucasian | 443 | 36.5% |
| Two or more Races | 62 | 5.1% |
| Some other Race | 437 | 36.0% |
| Total | 1,215 | 100.0% |
Ancestry in Boswell s Corner
The most populous ancestries reported in Boswell s Corner are Mexican (568 | 46.8%), American (104 | 8.6%), Central American (57 | 4.7%), Salvadoran (57 | 4.7%), and Puerto Rican (46 | 3.8%), together accounting for 68.5% of all Boswell s Corner residents.
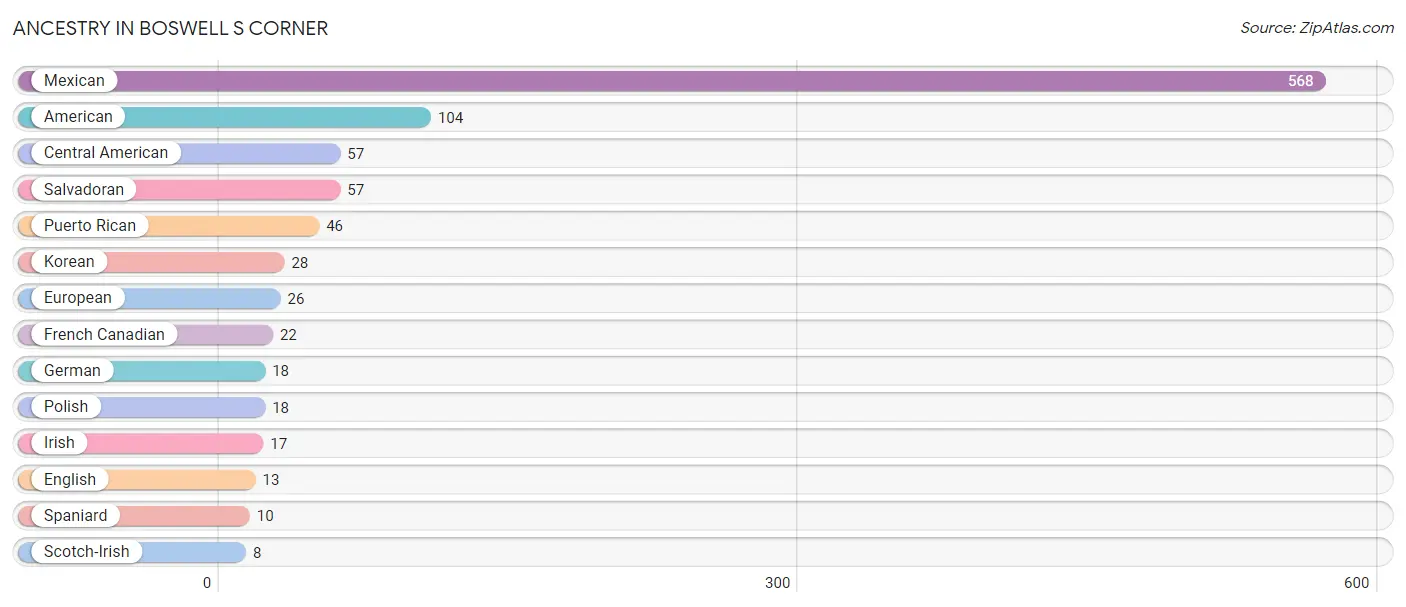
| Ancestry | # Population | % Population |
| American | 104 | 8.6% |
| Central American | 57 | 4.7% |
| English | 13 | 1.1% |
| European | 26 | 2.1% |
| French Canadian | 22 | 1.8% |
| German | 18 | 1.5% |
| Irish | 17 | 1.4% |
| Korean | 28 | 2.3% |
| Mexican | 568 | 46.8% |
| Polish | 18 | 1.5% |
| Puerto Rican | 46 | 3.8% |
| Salvadoran | 57 | 4.7% |
| Scotch-Irish | 8 | 0.7% |
| Spaniard | 10 | 0.8% | View All 14 Rows |
Immigrants in Boswell s Corner
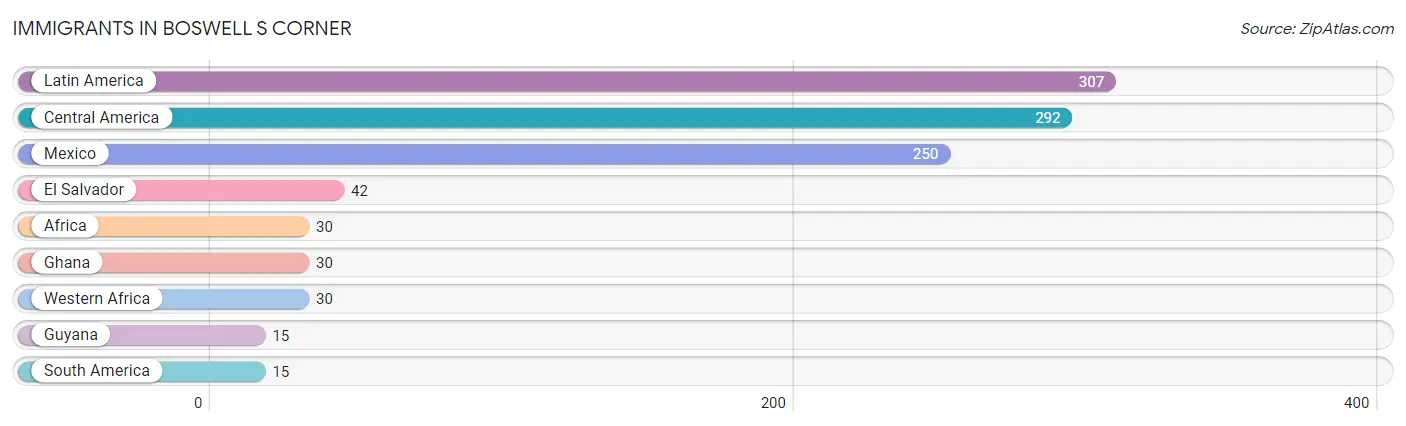
The most numerous immigrant groups reported in Boswell s Corner came from Latin America (307 | 25.3%), Central America (292 | 24.0%), Mexico (250 | 20.6%), El Salvador (42 | 3.5%), and Africa (30 | 2.5%), together accounting for 75.8% of all Boswell s Corner residents.
| Immigration Origin | # Population | % Population |
| Africa | 30 | 2.5% |
| Central America | 292 | 24.0% |
| El Salvador | 42 | 3.5% |
| Ghana | 30 | 2.5% |
| Guyana | 15 | 1.2% |
| Latin America | 307 | 25.3% |
| Mexico | 250 | 20.6% |
| South America | 15 | 1.2% |
| Western Africa | 30 | 2.5% | View All 9 Rows |
Sex and Age in Boswell s Corner
Sex and Age in Boswell s Corner
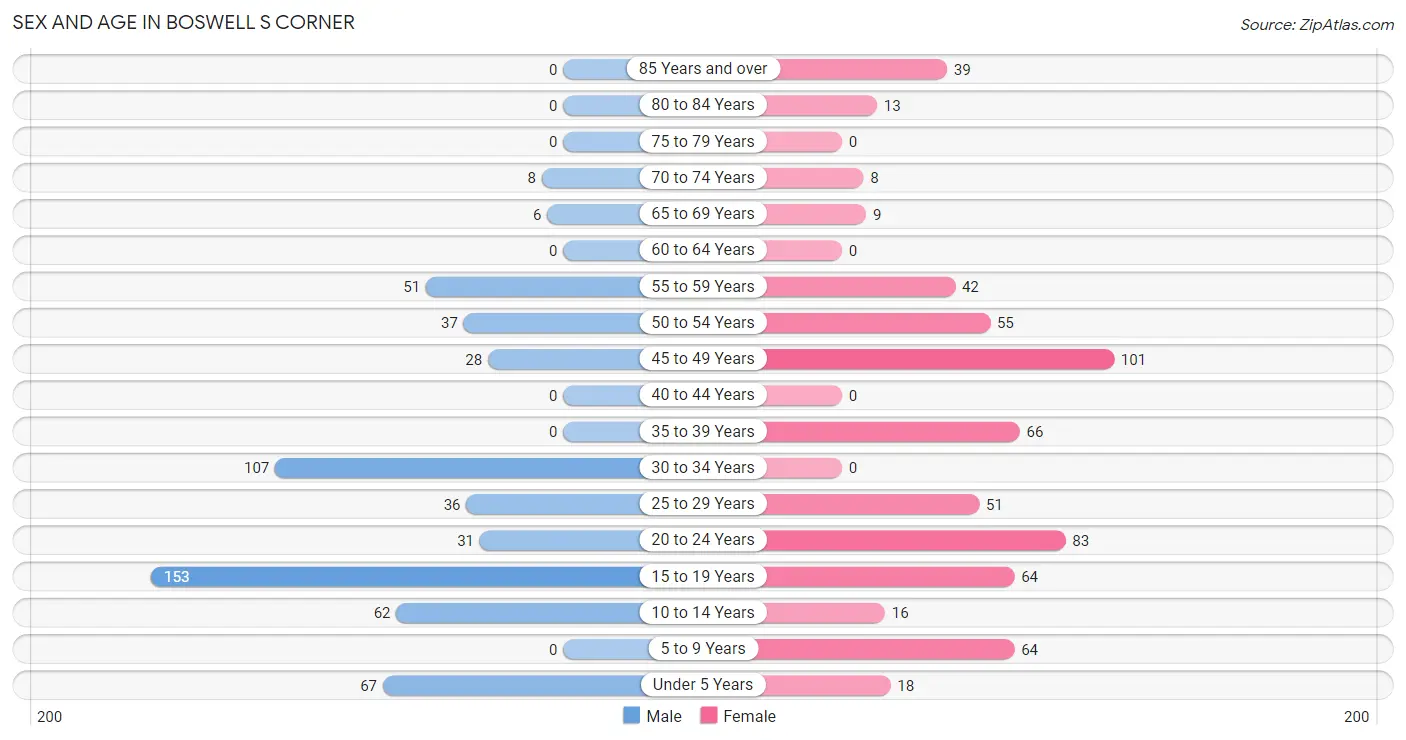
The most populous age groups in Boswell s Corner are 15 to 19 Years (153 | 26.1%) for men and 45 to 49 Years (101 | 16.1%) for women.
| Age Bracket | Male | Female |
| Under 5 Years | 67 (11.4%) | 18 (2.9%) |
| 5 to 9 Years | 0 (0.0%) | 64 (10.2%) |
| 10 to 14 Years | 62 (10.6%) | 16 (2.5%) |
| 15 to 19 Years | 153 (26.1%) | 64 (10.2%) |
| 20 to 24 Years | 31 (5.3%) | 83 (13.2%) |
| 25 to 29 Years | 36 (6.1%) | 51 (8.1%) |
| 30 to 34 Years | 107 (18.3%) | 0 (0.0%) |
| 35 to 39 Years | 0 (0.0%) | 66 (10.5%) |
| 40 to 44 Years | 0 (0.0%) | 0 (0.0%) |
| 45 to 49 Years | 28 (4.8%) | 101 (16.1%) |
| 50 to 54 Years | 37 (6.3%) | 55 (8.7%) |
| 55 to 59 Years | 51 (8.7%) | 42 (6.7%) |
| 60 to 64 Years | 0 (0.0%) | 0 (0.0%) |
| 65 to 69 Years | 6 (1.0%) | 9 (1.4%) |
| 70 to 74 Years | 8 (1.4%) | 8 (1.3%) |
| 75 to 79 Years | 0 (0.0%) | 0 (0.0%) |
| 80 to 84 Years | 0 (0.0%) | 13 (2.1%) |
| 85 Years and over | 0 (0.0%) | 39 (6.2%) |
| Total | 586 (100.0%) | 629 (100.0%) |
Families and Households in Boswell s Corner
Median Family Size in Boswell s Corner
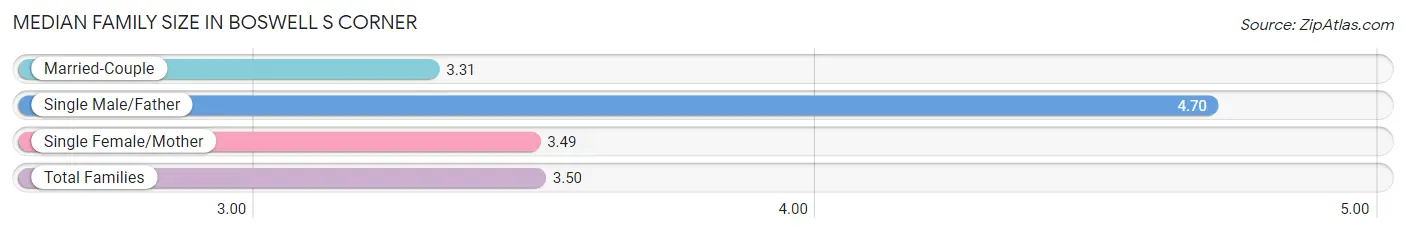
The median family size in Boswell s Corner is 3.50 persons per family, with single male/father families (20 | 7.6%) accounting for the largest median family size of 4.7 persons per family. On the other hand, married-couple families (124 | 47.1%) represent the smallest median family size with 3.31 persons per family.
| Family Type | # Families | Family Size |
| Married-Couple | 124 (47.1%) | 3.31 |
| Single Male/Father | 20 (7.6%) | 4.70 |
| Single Female/Mother | 119 (45.3%) | 3.49 |
| Total Families | 263 (100.0%) | 3.50 |
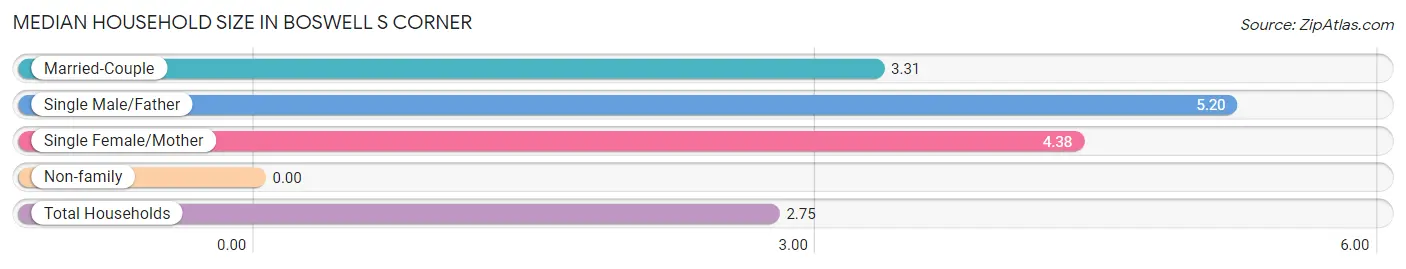
Median Household Size in Boswell s Corner
| Household Type | # Households | Household Size |
| Married-Couple | 124 (28.1%) | 3.31 |
| Single Male/Father | 20 (4.5%) | 5.20 |
| Single Female/Mother | 119 (26.9%) | 4.38 |
| Non-family | 179 (40.5%) | - |
| Total Households | 442 (100.0%) | 2.75 |
Household Size by Marriage Status in Boswell s Corner
Out of a total of 442 households in Boswell s Corner, 263 (59.5%) are family households, while 179 (40.5%) are nonfamily households. The most numerous type of family households are 4-person households, comprising 101, and the most common type of nonfamily households are 1-person households, comprising 179.
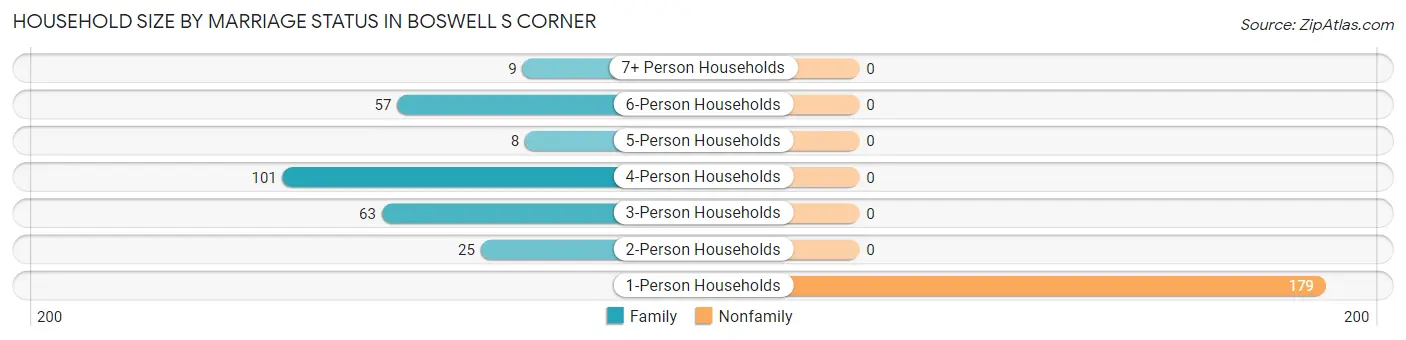
| Household Size | Family Households | Nonfamily Households |
| 1-Person Households | - | 179 (40.5%) |
| 2-Person Households | 25 (5.7%) | 0 (0.0%) |
| 3-Person Households | 63 (14.2%) | 0 (0.0%) |
| 4-Person Households | 101 (22.9%) | 0 (0.0%) |
| 5-Person Households | 8 (1.8%) | 0 (0.0%) |
| 6-Person Households | 57 (12.9%) | 0 (0.0%) |
| 7+ Person Households | 9 (2.0%) | 0 (0.0%) |
| Total | 263 (59.5%) | 179 (40.5%) |
Female Fertility in Boswell s Corner
Fertility by Age in Boswell s Corner
Average fertility rate in Boswell s Corner is 96.0 births per 1,000 women. Women in the age bracket of 20 to 34 years have the highest fertility rate with 261.0 births per 1,000 women. Women in the age bracket of 20 to 34 years acount for 100.0% of all women with births.
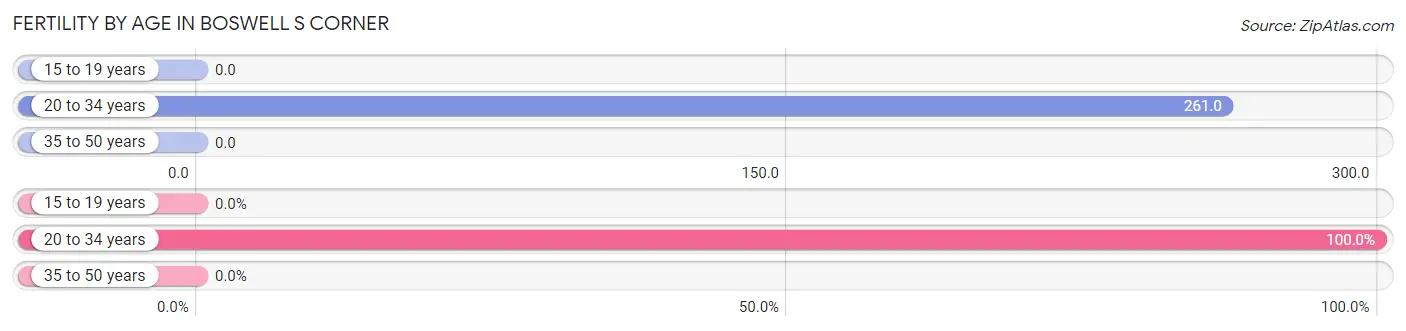
| Age Bracket | Women with Births | Births / 1,000 Women |
| 15 to 19 years | 0 (0.0%) | 0.0 |
| 20 to 34 years | 35 (100.0%) | 261.0 |
| 35 to 50 years | 0 (0.0%) | 0.0 |
| Total | 35 (100.0%) | 96.0 |
Fertility by Age by Marriage Status in Boswell s Corner
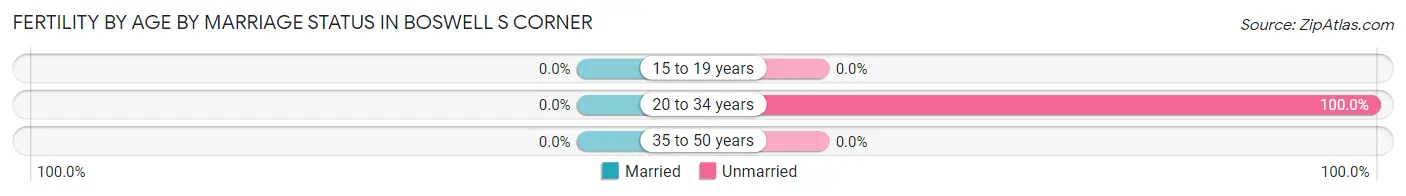
| Age Bracket | Married | Unmarried |
| 15 to 19 years | 0 (0.0%) | 0 (0.0%) |
| 20 to 34 years | 0 (0.0%) | 35 (100.0%) |
| 35 to 50 years | 0 (0.0%) | 0 (0.0%) |
| Total | 0 (0.0%) | 35 (100.0%) |
Fertility by Education in Boswell s Corner
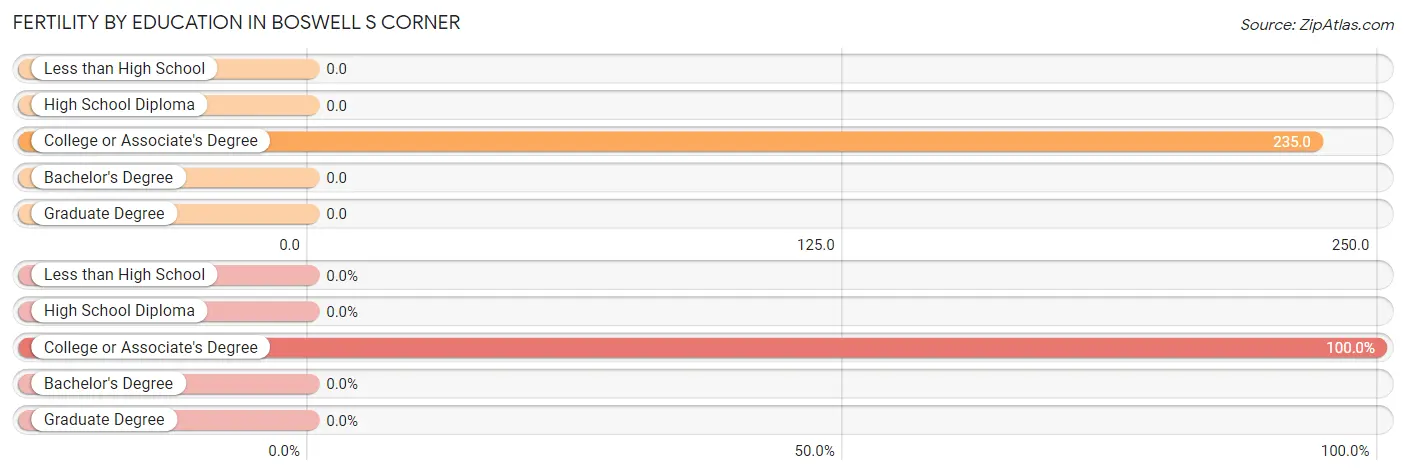
| Educational Attainment | Women with Births | Births / 1,000 Women |
| Less than High School | 0 (0.0%) | 0.0 |
| High School Diploma | 0 (0.0%) | 0.0 |
| College or Associate's Degree | 35 (100.0%) | 235.0 |
| Bachelor's Degree | 0 (0.0%) | 0.0 |
| Graduate Degree | 0 (0.0%) | 0.0 |
| Total | 35 (100.0%) | 96.0 |
Fertility by Education by Marriage Status in Boswell s Corner
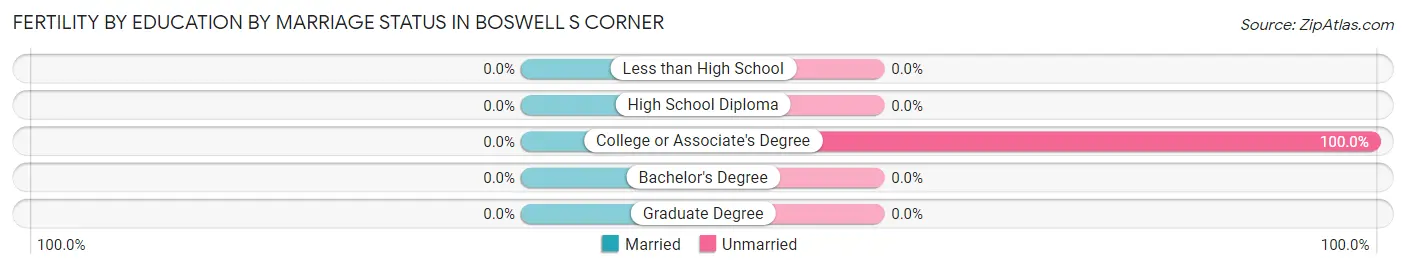
| Educational Attainment | Married | Unmarried |
| Less than High School | 0 (0.0%) | 0 (0.0%) |
| High School Diploma | 0 (0.0%) | 0 (0.0%) |
| College or Associate's Degree | 0 (0.0%) | 35 (100.0%) |
| Bachelor's Degree | 0 (0.0%) | 0 (0.0%) |
| Graduate Degree | 0 (0.0%) | 0 (0.0%) |
| Total | 0 (0.0%) | 35 (100.0%) |
Employment Characteristics in Boswell s Corner
Employment by Class of Employer in Boswell s Corner
Among the 656 employed individuals in Boswell s Corner, private company employees (454 | 69.2%), self-employed (not incorporated) (91 | 13.9%), and self-employed (incorporated) (47 | 7.2%) make up the most common classes of employment.
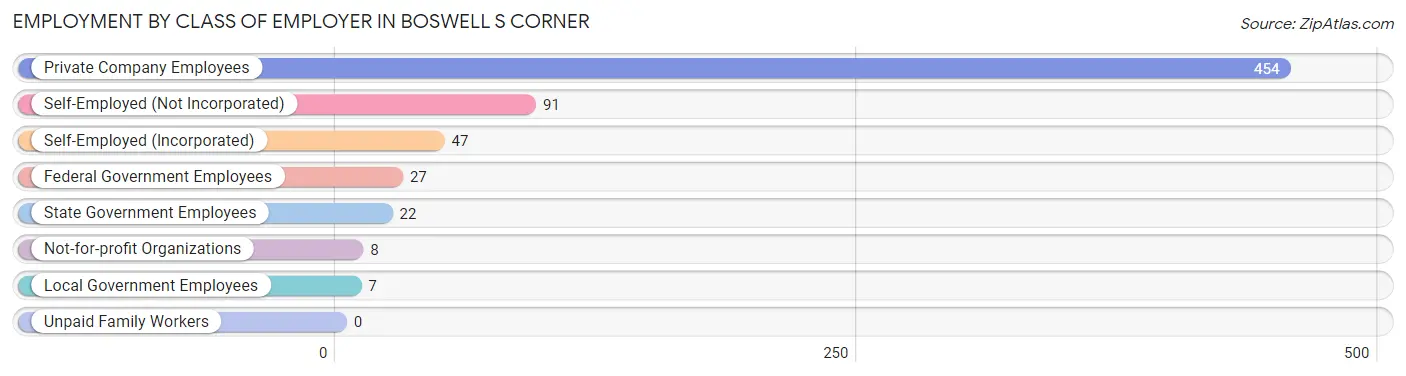
| Employer Class | # Employees | % Employees |
| Private Company Employees | 454 | 69.2% |
| Self-Employed (Incorporated) | 47 | 7.2% |
| Self-Employed (Not Incorporated) | 91 | 13.9% |
| Not-for-profit Organizations | 8 | 1.2% |
| Local Government Employees | 7 | 1.1% |
| State Government Employees | 22 | 3.4% |
| Federal Government Employees | 27 | 4.1% |
| Unpaid Family Workers | 0 | 0.0% |
| Total | 656 | 100.0% |
Employment Status by Age in Boswell s Corner
According to the labor force statistics for Boswell s Corner, out of the total population over 16 years of age (976), 74.5% or 727 individuals are in the labor force, with 2.2% or 16 of them unemployed. The age group with the highest labor force participation rate is 20 to 24 years, with 100.0% or 114 individuals in the labor force. Within the labor force, the 35 to 44 years age range has the highest percentage of unemployed individuals, with 13.6% or 9 of them being unemployed.
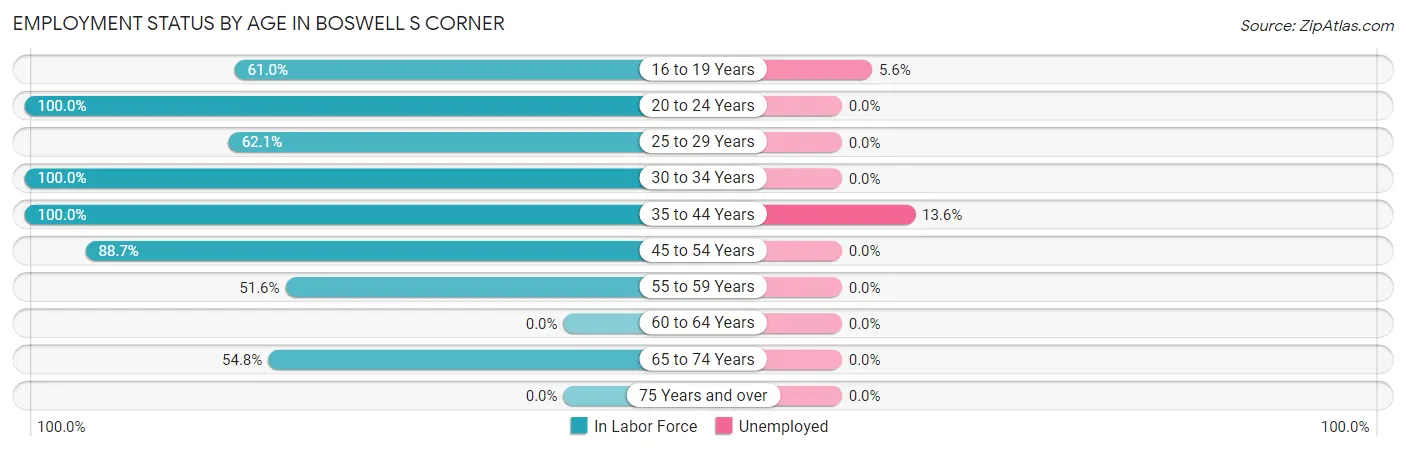
| Age Bracket | In Labor Force | Unemployed |
| 16 to 19 Years | 125 (61.0%) | 7 (5.6%) |
| 20 to 24 Years | 114 (100.0%) | 0 (0.0%) |
| 25 to 29 Years | 54 (62.1%) | 0 (0.0%) |
| 30 to 34 Years | 107 (100.0%) | 0 (0.0%) |
| 35 to 44 Years | 66 (100.0%) | 9 (13.6%) |
| 45 to 54 Years | 196 (88.7%) | 0 (0.0%) |
| 55 to 59 Years | 48 (51.6%) | 0 (0.0%) |
| 60 to 64 Years | 0 (0.0%) | 0 (0.0%) |
| 65 to 74 Years | 17 (54.8%) | 0 (0.0%) |
| 75 Years and over | 0 (0.0%) | 0 (0.0%) |
| Total | 727 (74.5%) | 16 (2.2%) |
Employment Status by Educational Attainment in Boswell s Corner
According to labor force statistics for Boswell s Corner, 82.1% of individuals (471) out of the total population between 25 and 64 years of age (574) are in the labor force, with 1.9% or 9 of them being unemployed. The group with the highest labor force participation rate are those with the educational attainment of college / associate degree, with 92.4% or 134 individuals in the labor force. Within the labor force, individuals with bachelor's degree or higher education have the highest percentage of unemployment, with 27.3% or 9 of them being unemployed.
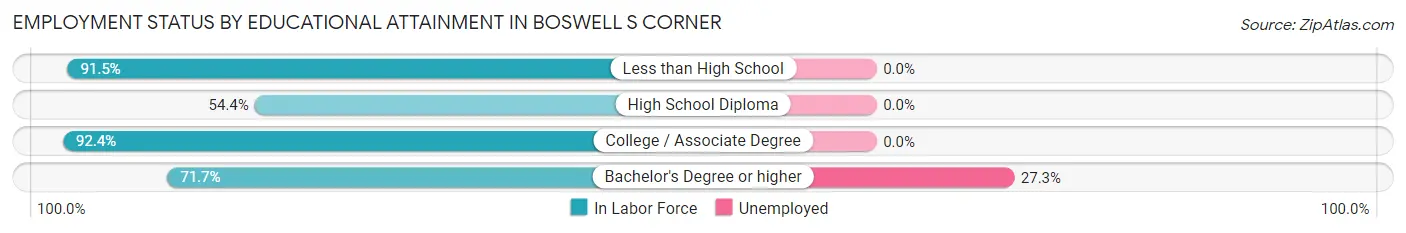
| Educational Attainment | In Labor Force | Unemployed |
| Less than High School | 236 (91.5%) | 0 (0.0%) |
| High School Diploma | 68 (54.4%) | 0 (0.0%) |
| College / Associate Degree | 134 (92.4%) | 0 (0.0%) |
| Bachelor's Degree or higher | 33 (71.7%) | 13 (27.3%) |
| Total | 471 (82.1%) | 11 (1.9%) |
Employment Occupations by Sex in Boswell s Corner
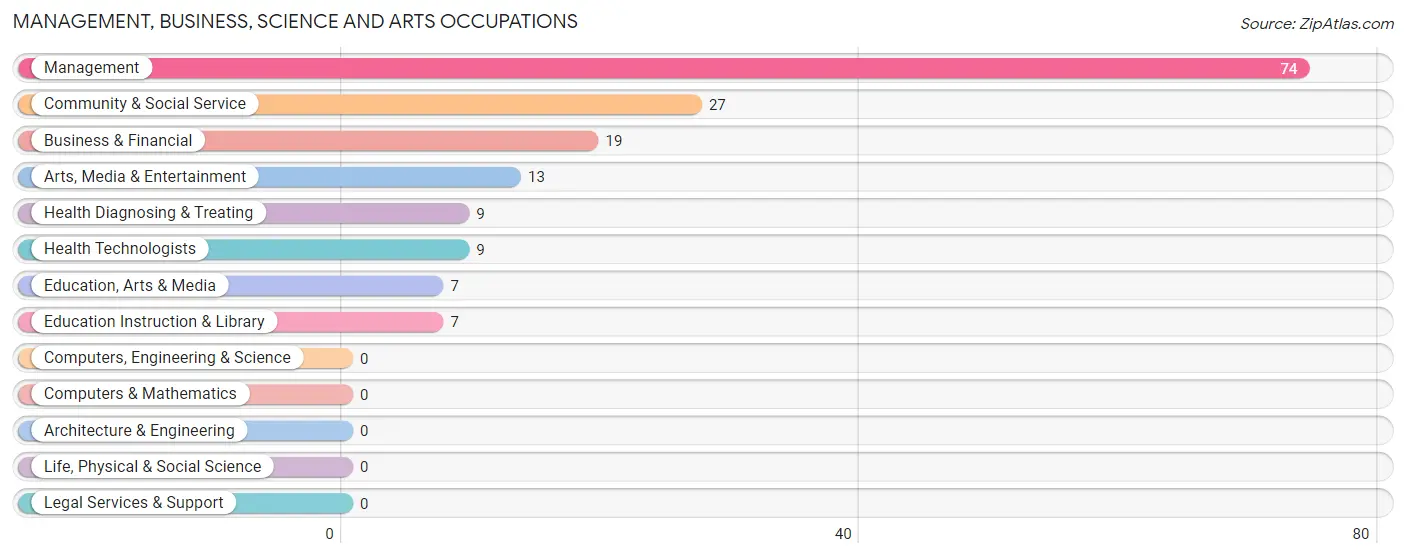
Management, Business, Science and Arts Occupations
The most common Management, Business, Science and Arts occupations in Boswell s Corner are Management (74 | 10.4%), Community & Social Service (27 | 3.8%), Business & Financial (19 | 2.7%), Arts, Media & Entertainment (13 | 1.8%), and Health Diagnosing & Treating (9 | 1.3%).
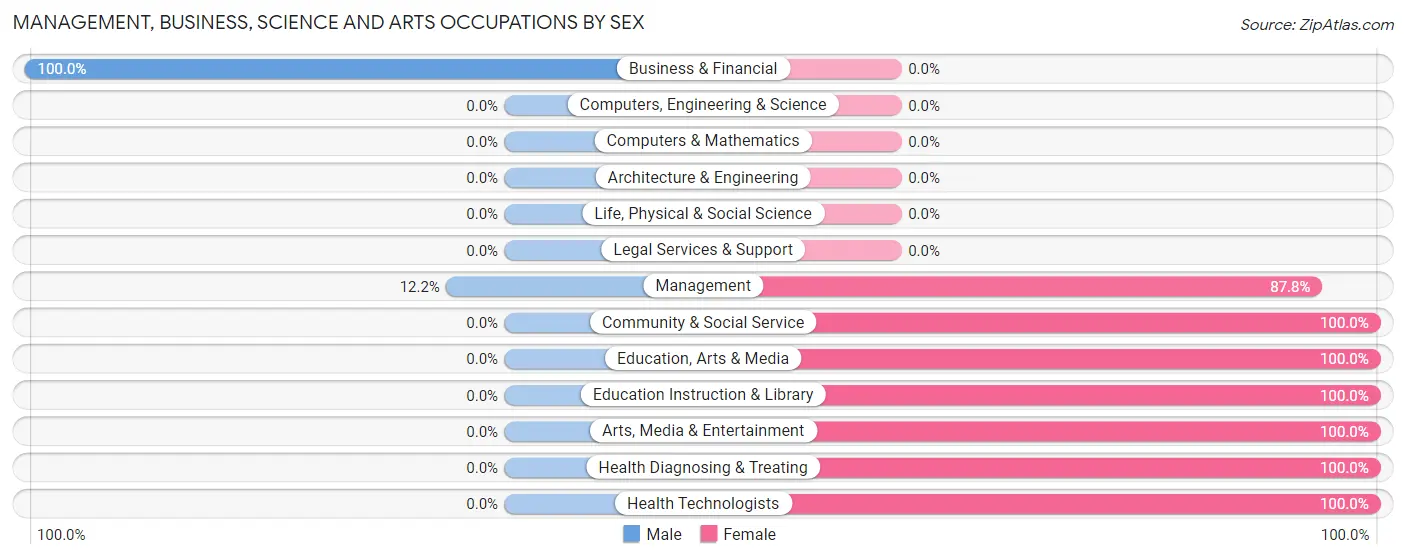
Management, Business, Science and Arts Occupations by Sex
Within the Management, Business, Science and Arts occupations in Boswell s Corner, the most male-oriented occupations are Business & Financial (100.0%), and Management (12.2%), while the most female-oriented occupations are Community & Social Service (100.0%), Education, Arts & Media (100.0%), and Education Instruction & Library (100.0%).
| Occupation | Male | Female |
| Management | 9 (12.2%) | 65 (87.8%) |
| Business & Financial | 19 (100.0%) | 0 (0.0%) |
| Computers, Engineering & Science | 0 (0.0%) | 0 (0.0%) |
| Computers & Mathematics | 0 (0.0%) | 0 (0.0%) |
| Architecture & Engineering | 0 (0.0%) | 0 (0.0%) |
| Life, Physical & Social Science | 0 (0.0%) | 0 (0.0%) |
| Community & Social Service | 0 (0.0%) | 27 (100.0%) |
| Education, Arts & Media | 0 (0.0%) | 7 (100.0%) |
| Legal Services & Support | 0 (0.0%) | 0 (0.0%) |
| Education Instruction & Library | 0 (0.0%) | 7 (100.0%) |
| Arts, Media & Entertainment | 0 (0.0%) | 13 (100.0%) |
| Health Diagnosing & Treating | 0 (0.0%) | 9 (100.0%) |
| Health Technologists | 0 (0.0%) | 9 (100.0%) |
| Total (Category) | 28 (21.7%) | 101 (78.3%) |
| Total (Overall) | 309 (43.5%) | 402 (56.5%) |
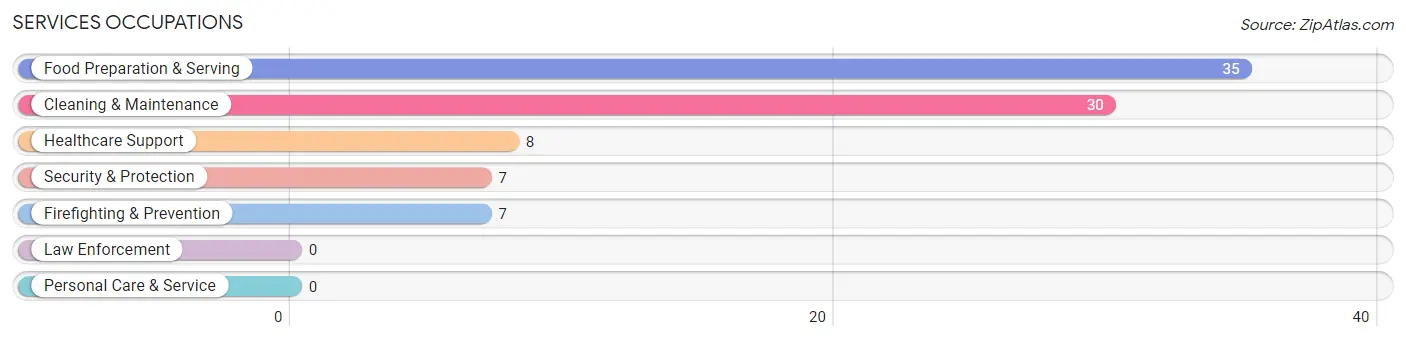
Services Occupations
The most common Services occupations in Boswell s Corner are Food Preparation & Serving (35 | 4.9%), Cleaning & Maintenance (30 | 4.2%), Healthcare Support (8 | 1.1%), Security & Protection (7 | 1.0%), and Firefighting & Prevention (7 | 1.0%).
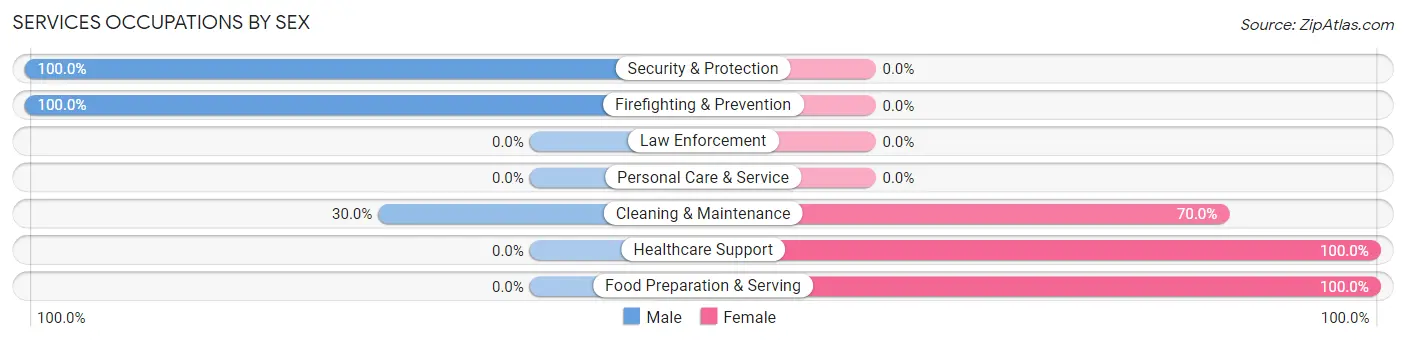
Services Occupations by Sex
Within the Services occupations in Boswell s Corner, the most male-oriented occupations are Security & Protection (100.0%), Firefighting & Prevention (100.0%), and Cleaning & Maintenance (30.0%), while the most female-oriented occupations are Healthcare Support (100.0%), Food Preparation & Serving (100.0%), and Cleaning & Maintenance (70.0%).
| Occupation | Male | Female |
| Healthcare Support | 0 (0.0%) | 8 (100.0%) |
| Security & Protection | 7 (100.0%) | 0 (0.0%) |
| Firefighting & Prevention | 7 (100.0%) | 0 (0.0%) |
| Law Enforcement | 0 (0.0%) | 0 (0.0%) |
| Food Preparation & Serving | 0 (0.0%) | 35 (100.0%) |
| Cleaning & Maintenance | 9 (30.0%) | 21 (70.0%) |
| Personal Care & Service | 0 (0.0%) | 0 (0.0%) |
| Total (Category) | 16 (20.0%) | 64 (80.0%) |
| Total (Overall) | 309 (43.5%) | 402 (56.5%) |
Sales and Office Occupations
The most common Sales and Office occupations in Boswell s Corner are Sales & Related (35 | 4.9%), and Office & Administration (17 | 2.4%).
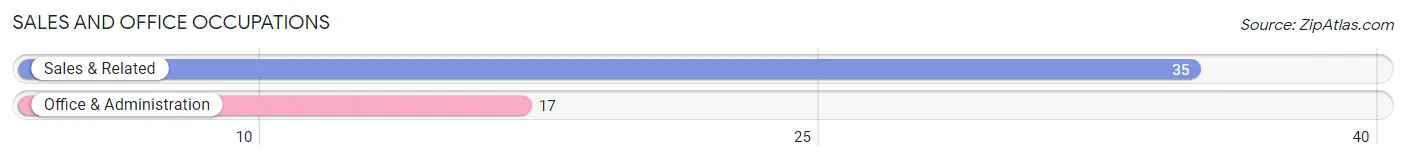
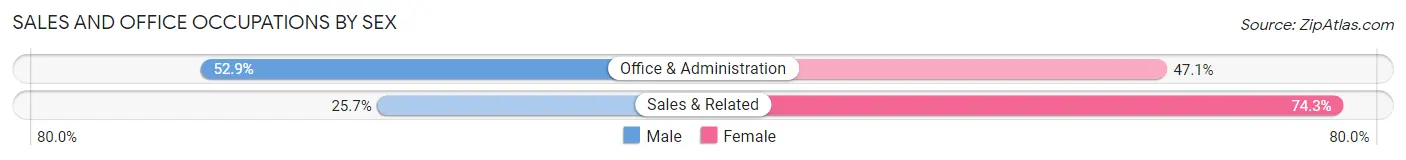
Sales and Office Occupations by Sex
| Occupation | Male | Female |
| Sales & Related | 9 (25.7%) | 26 (74.3%) |
| Office & Administration | 9 (52.9%) | 8 (47.1%) |
| Total (Category) | 18 (34.6%) | 34 (65.4%) |
| Total (Overall) | 309 (43.5%) | 402 (56.5%) |
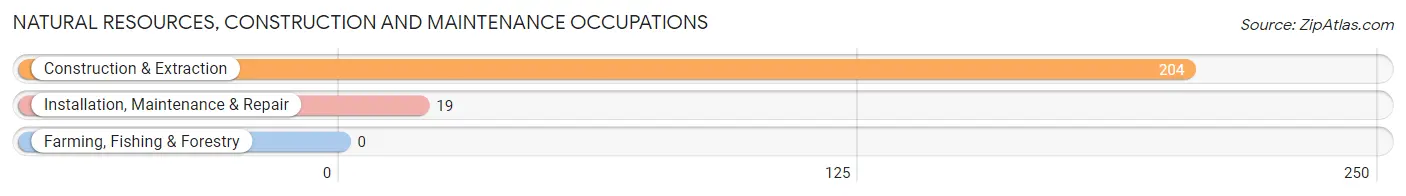
Natural Resources, Construction and Maintenance Occupations
The most common Natural Resources, Construction and Maintenance occupations in Boswell s Corner are Construction & Extraction (204 | 28.7%), and Installation, Maintenance & Repair (19 | 2.7%).
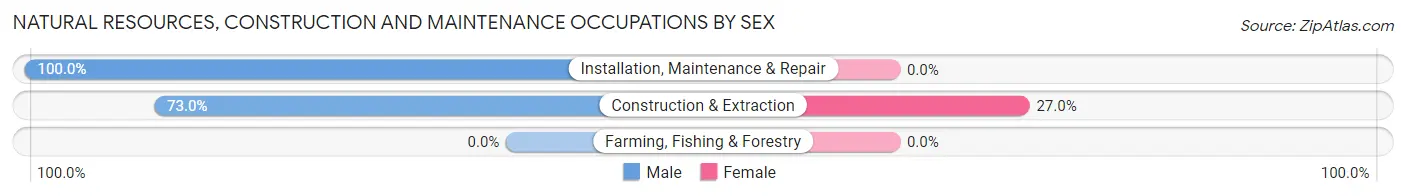
Natural Resources, Construction and Maintenance Occupations by Sex
| Occupation | Male | Female |
| Farming, Fishing & Forestry | 0 (0.0%) | 0 (0.0%) |
| Construction & Extraction | 149 (73.0%) | 55 (27.0%) |
| Installation, Maintenance & Repair | 19 (100.0%) | 0 (0.0%) |
| Total (Category) | 168 (75.3%) | 55 (24.7%) |
| Total (Overall) | 309 (43.5%) | 402 (56.5%) |
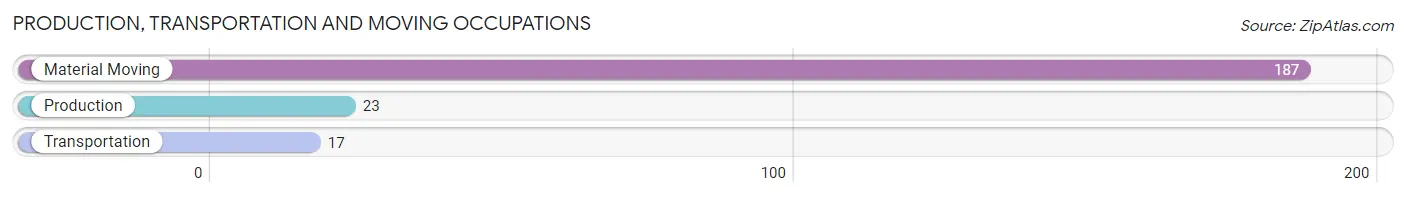
Production, Transportation and Moving Occupations
The most common Production, Transportation and Moving occupations in Boswell s Corner are Material Moving (187 | 26.3%), Production (23 | 3.2%), and Transportation (17 | 2.4%).
Production, Transportation and Moving Occupations by Sex
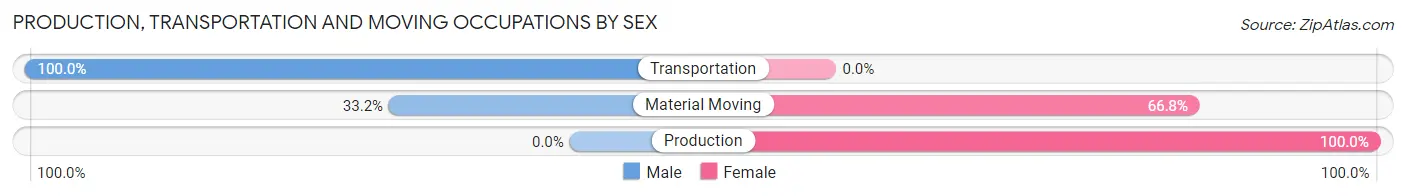
| Occupation | Male | Female |
| Production | 0 (0.0%) | 23 (100.0%) |
| Transportation | 17 (100.0%) | 0 (0.0%) |
| Material Moving | 62 (33.2%) | 125 (66.8%) |
| Total (Category) | 79 (34.8%) | 148 (65.2%) |
| Total (Overall) | 309 (43.5%) | 402 (56.5%) |
Employment Industries by Sex in Boswell s Corner
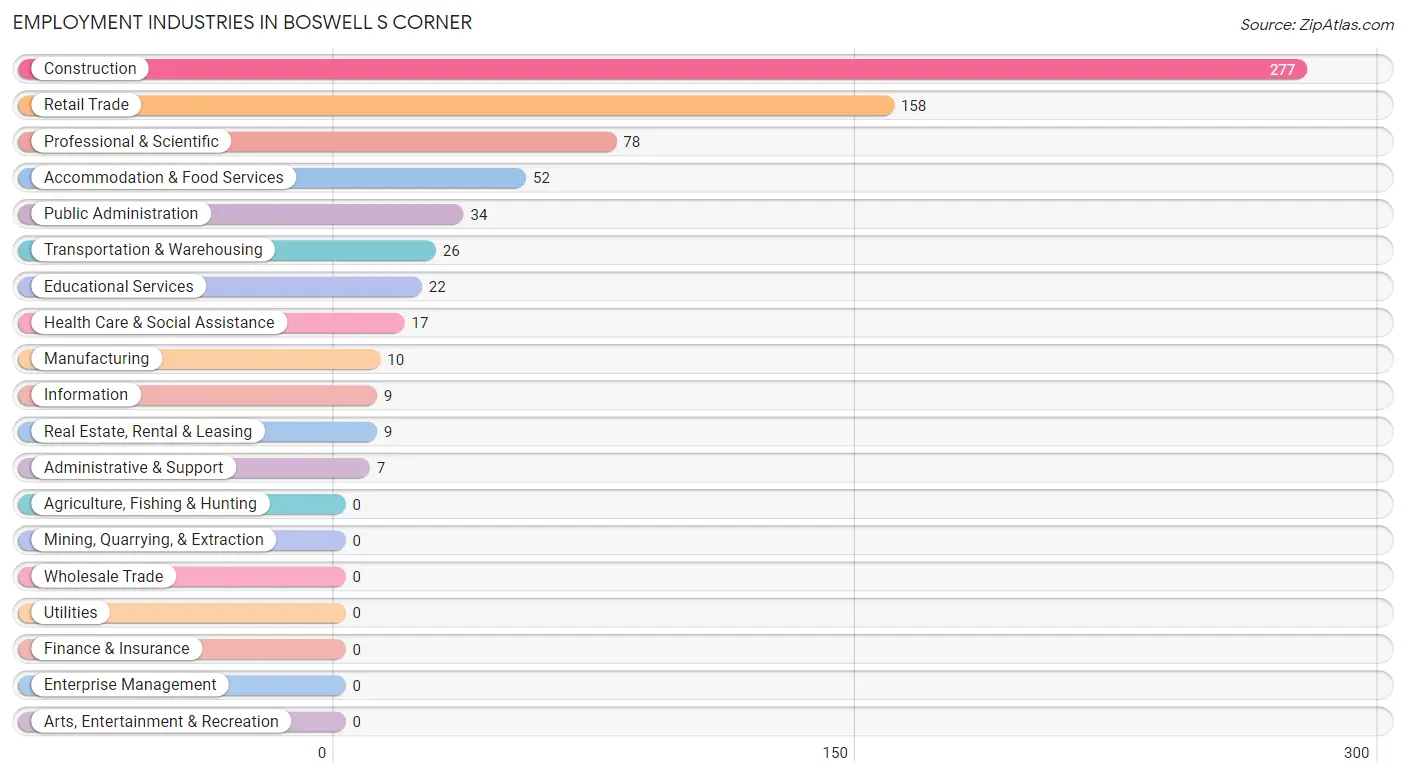
Employment Industries in Boswell s Corner
The major employment industries in Boswell s Corner include Construction (277 | 39.0%), Retail Trade (158 | 22.2%), Professional & Scientific (78 | 11.0%), Accommodation & Food Services (52 | 7.3%), and Public Administration (34 | 4.8%).
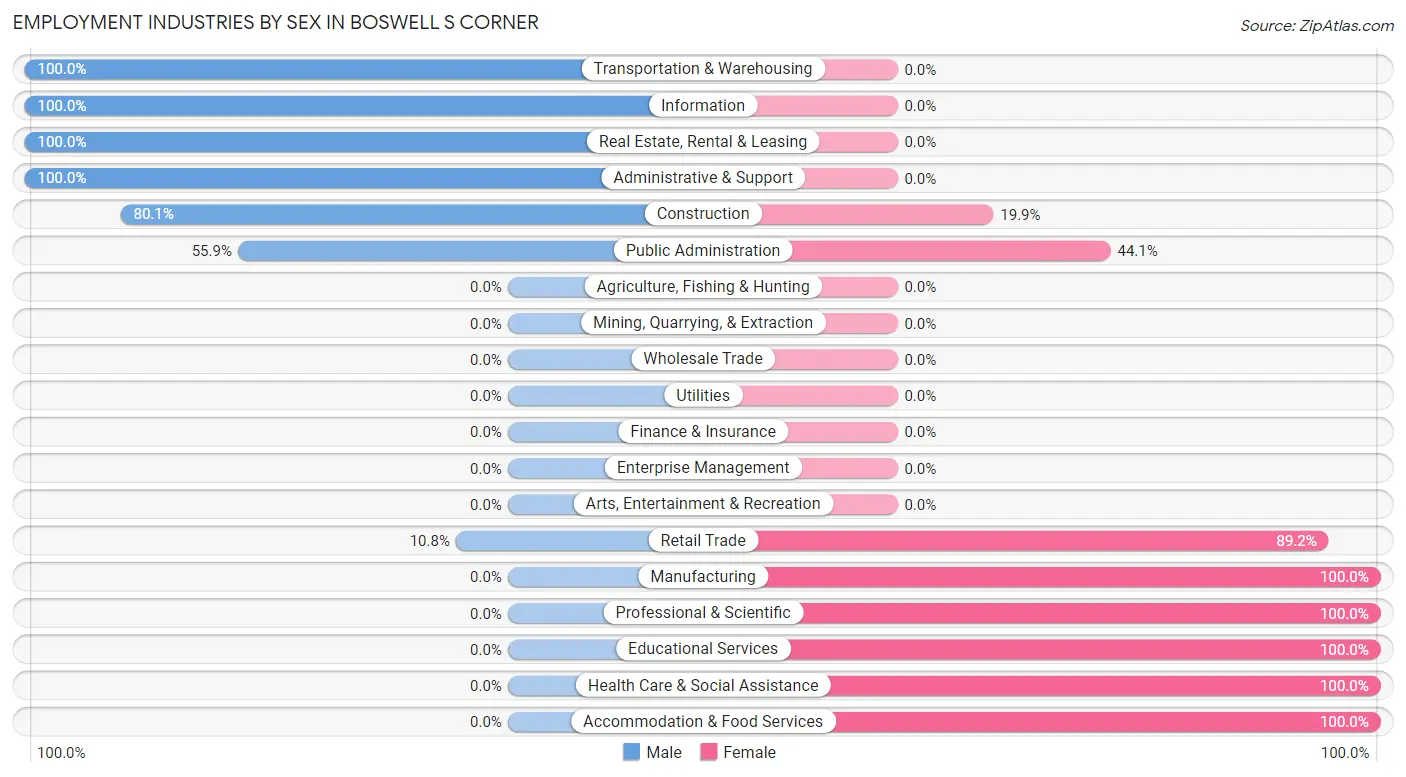
Employment Industries by Sex in Boswell s Corner
The Boswell s Corner industries that see more men than women are Transportation & Warehousing (100.0%), Information (100.0%), and Real Estate, Rental & Leasing (100.0%), whereas the industries that tend to have a higher number of women are Manufacturing (100.0%), Professional & Scientific (100.0%), and Educational Services (100.0%).
| Industry | Male | Female |
| Agriculture, Fishing & Hunting | 0 (0.0%) | 0 (0.0%) |
| Mining, Quarrying, & Extraction | 0 (0.0%) | 0 (0.0%) |
| Construction | 222 (80.1%) | 55 (19.9%) |
| Manufacturing | 0 (0.0%) | 10 (100.0%) |
| Wholesale Trade | 0 (0.0%) | 0 (0.0%) |
| Retail Trade | 17 (10.8%) | 141 (89.2%) |
| Transportation & Warehousing | 26 (100.0%) | 0 (0.0%) |
| Utilities | 0 (0.0%) | 0 (0.0%) |
| Information | 9 (100.0%) | 0 (0.0%) |
| Finance & Insurance | 0 (0.0%) | 0 (0.0%) |
| Real Estate, Rental & Leasing | 9 (100.0%) | 0 (0.0%) |
| Professional & Scientific | 0 (0.0%) | 78 (100.0%) |
| Enterprise Management | 0 (0.0%) | 0 (0.0%) |
| Administrative & Support | 7 (100.0%) | 0 (0.0%) |
| Educational Services | 0 (0.0%) | 22 (100.0%) |
| Health Care & Social Assistance | 0 (0.0%) | 17 (100.0%) |
| Arts, Entertainment & Recreation | 0 (0.0%) | 0 (0.0%) |
| Accommodation & Food Services | 0 (0.0%) | 52 (100.0%) |
| Public Administration | 19 (55.9%) | 15 (44.1%) |
| Total | 309 (43.5%) | 402 (56.5%) |
Education in Boswell s Corner
School Enrollment in Boswell s Corner
The most common levels of schooling among the 290 students in Boswell s Corner are high school (96 | 33.1%), middle school (70 | 24.1%), and college / undergraduate (60 | 20.7%).
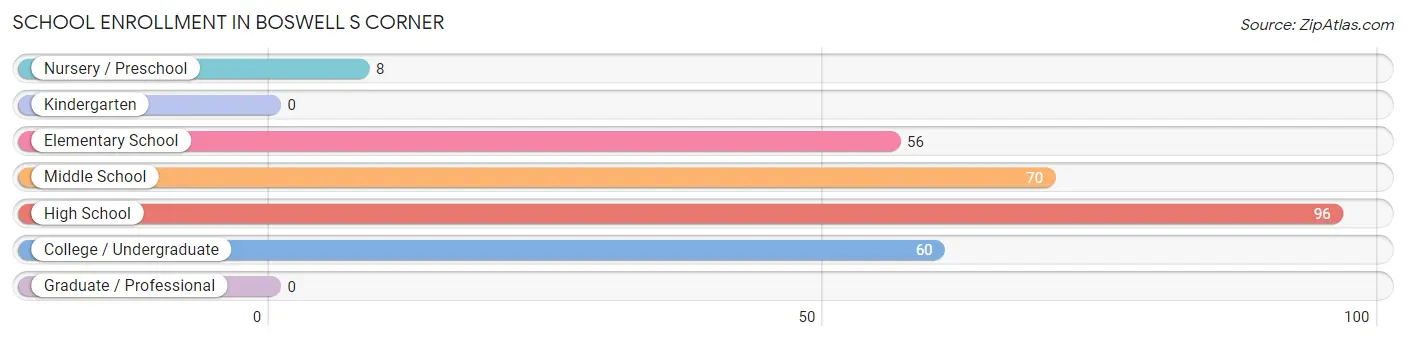
| School Level | # Students | % Students |
| Nursery / Preschool | 8 | 2.8% |
| Kindergarten | 0 | 0.0% |
| Elementary School | 56 | 19.3% |
| Middle School | 70 | 24.1% |
| High School | 96 | 33.1% |
| College / Undergraduate | 60 | 20.7% |
| Graduate / Professional | 0 | 0.0% |
| Total | 290 | 100.0% |
School Enrollment by Age by Funding Source in Boswell s Corner
Out of a total of 290 students who are enrolled in schools in Boswell s Corner, 36 (12.4%) attend a private institution, while the remaining 254 (87.6%) are enrolled in public schools. The age group of 20 to 24 year olds has the highest likelihood of being enrolled in private schools, with 27 (75.0% in the age bracket) enrolled. Conversely, the age group of 5 to 9 year old has the lowest likelihood of being enrolled in a private school, with 64 (100.0% in the age bracket) attending a public institution.
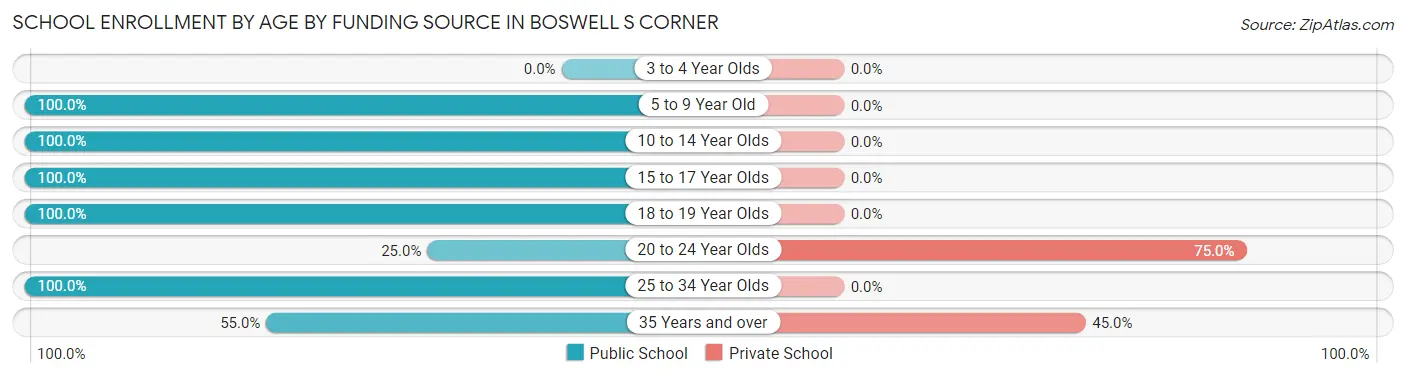
| Age Bracket | Public School | Private School |
| 3 to 4 Year Olds | 0 (0.0%) | 0 (0.0%) |
| 5 to 9 Year Old | 64 (100.0%) | 0 (0.0%) |
| 10 to 14 Year Olds | 70 (100.0%) | 0 (0.0%) |
| 15 to 17 Year Olds | 84 (100.0%) | 0 (0.0%) |
| 18 to 19 Year Olds | 7 (100.0%) | 0 (0.0%) |
| 20 to 24 Year Olds | 9 (25.0%) | 27 (75.0%) |
| 25 to 34 Year Olds | 9 (100.0%) | 0 (0.0%) |
| 35 Years and over | 11 (55.0%) | 9 (45.0%) |
| Total | 254 (87.6%) | 36 (12.4%) |
Educational Attainment by Field of Study in Boswell s Corner
Literature & languages (21 | 38.9%), business (10 | 18.5%), visual & performing arts (9 | 16.7%), social sciences (7 | 13.0%), and education (7 | 13.0%) are the most common fields of study among 54 individuals in Boswell s Corner who have obtained a bachelor's degree or higher.
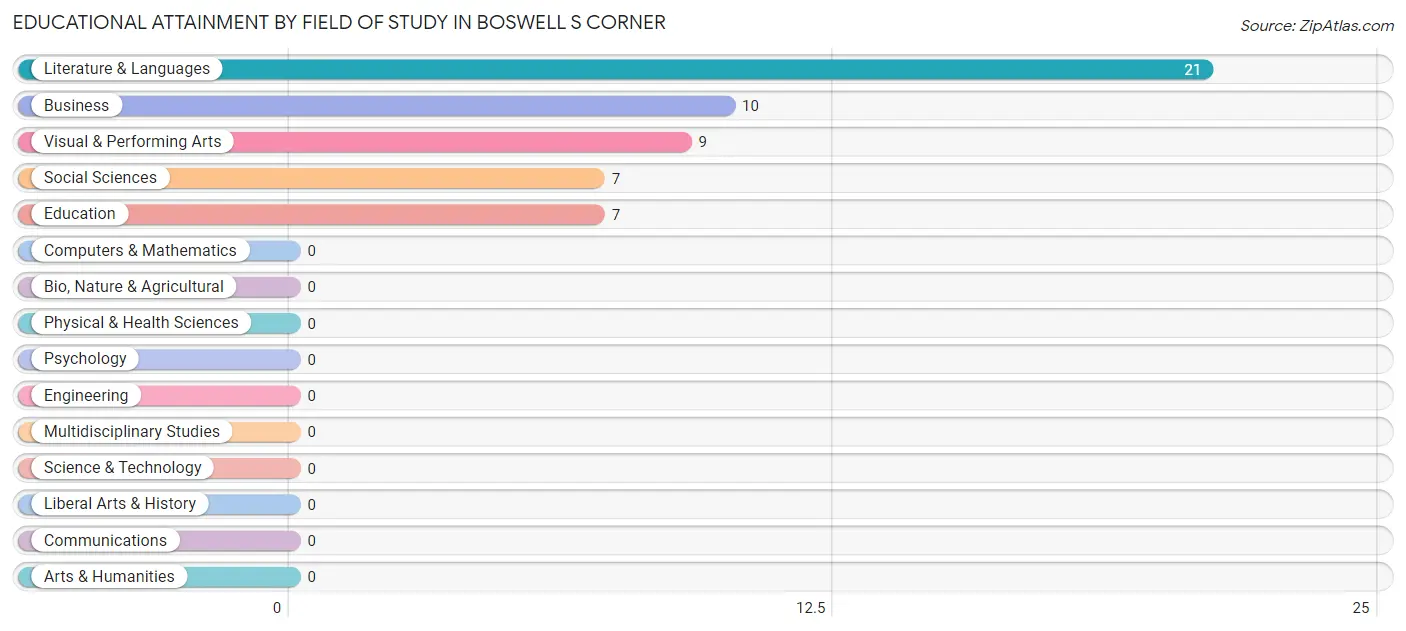
| Field of Study | # Graduates | % Graduates |
| Computers & Mathematics | 0 | 0.0% |
| Bio, Nature & Agricultural | 0 | 0.0% |
| Physical & Health Sciences | 0 | 0.0% |
| Psychology | 0 | 0.0% |
| Social Sciences | 7 | 13.0% |
| Engineering | 0 | 0.0% |
| Multidisciplinary Studies | 0 | 0.0% |
| Science & Technology | 0 | 0.0% |
| Business | 10 | 18.5% |
| Education | 7 | 13.0% |
| Literature & Languages | 21 | 38.9% |
| Liberal Arts & History | 0 | 0.0% |
| Visual & Performing Arts | 9 | 16.7% |
| Communications | 0 | 0.0% |
| Arts & Humanities | 0 | 0.0% |
| Total | 54 | 100.0% |
Transportation & Commute in Boswell s Corner
Vehicle Availability by Sex in Boswell s Corner
The most prevalent vehicle ownership categories in Boswell s Corner are males with 3 vehicles (248, accounting for 80.3%) and females with 3 vehicles (67, making up 71.5%).
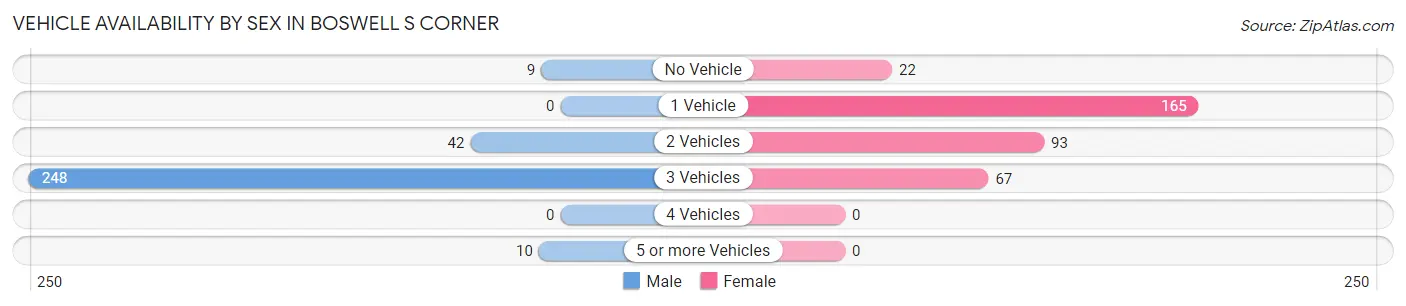
| Vehicles Available | Male | Female |
| No Vehicle | 9 (2.9%) | 22 (6.3%) |
| 1 Vehicle | 0 (0.0%) | 165 (47.5%) |
| 2 Vehicles | 42 (13.6%) | 93 (26.8%) |
| 3 Vehicles | 248 (80.3%) | 67 (19.3%) |
| 4 Vehicles | 0 (0.0%) | 0 (0.0%) |
| 5 or more Vehicles | 10 (3.2%) | 0 (0.0%) |
| Total | 309 (100.0%) | 347 (100.0%) |
Commute Time in Boswell s Corner
The most frequently occuring commute durations in Boswell s Corner are 60 to 89 minutes (207 commuters, 37.0%), 40 to 44 minutes (70 commuters, 12.5%), and 15 to 19 minutes (66 commuters, 11.8%).
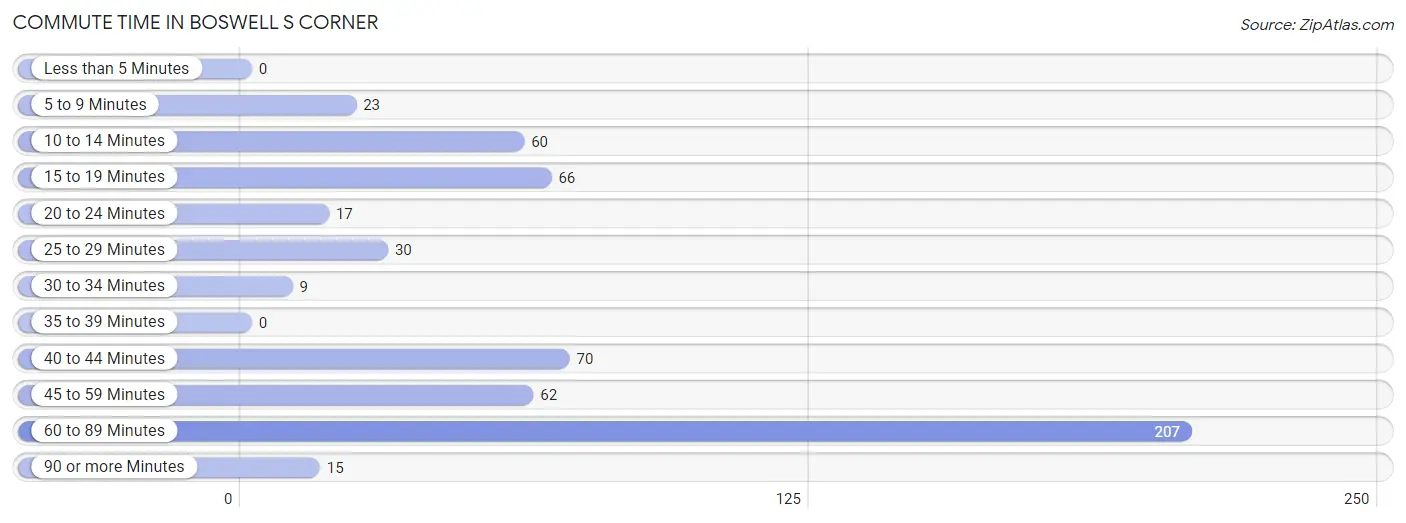
| Commute Time | # Commuters | % Commuters |
| Less than 5 Minutes | 0 | 0.0% |
| 5 to 9 Minutes | 23 | 4.1% |
| 10 to 14 Minutes | 60 | 10.7% |
| 15 to 19 Minutes | 66 | 11.8% |
| 20 to 24 Minutes | 17 | 3.0% |
| 25 to 29 Minutes | 30 | 5.4% |
| 30 to 34 Minutes | 9 | 1.6% |
| 35 to 39 Minutes | 0 | 0.0% |
| 40 to 44 Minutes | 70 | 12.5% |
| 45 to 59 Minutes | 62 | 11.1% |
| 60 to 89 Minutes | 207 | 37.0% |
| 90 or more Minutes | 15 | 2.7% |
Commute Time by Sex in Boswell s Corner
The most common commute times in Boswell s Corner are 60 to 89 minutes (150 commuters, 48.5%) for males and 60 to 89 minutes (57 commuters, 22.8%) for females.
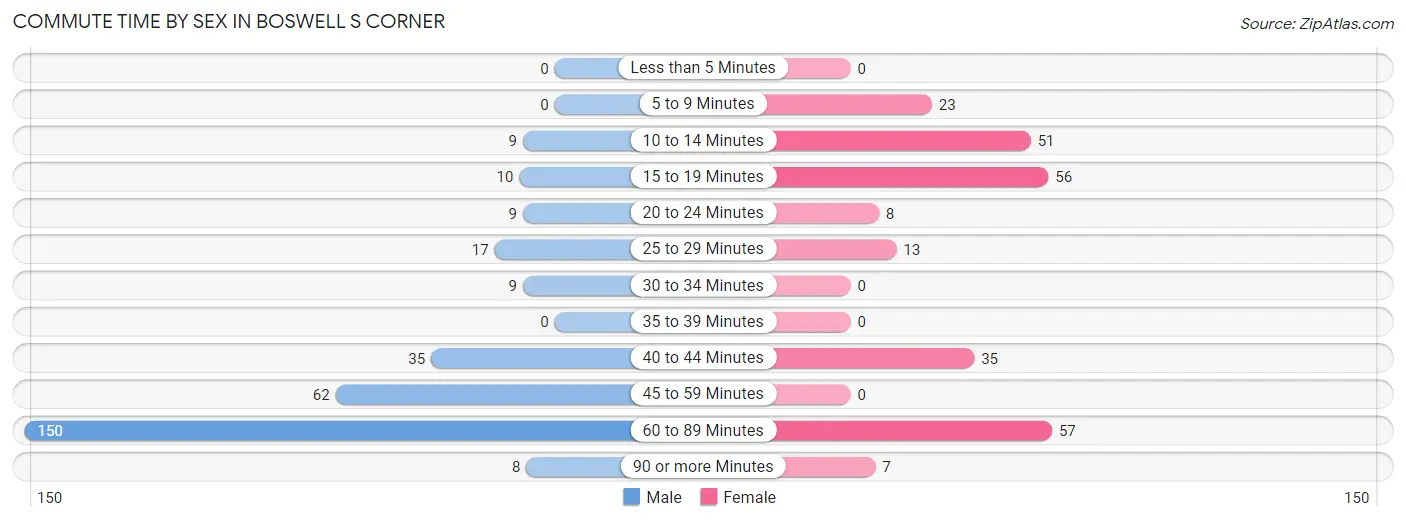
| Commute Time | Male | Female |
| Less than 5 Minutes | 0 (0.0%) | 0 (0.0%) |
| 5 to 9 Minutes | 0 (0.0%) | 23 (9.2%) |
| 10 to 14 Minutes | 9 (2.9%) | 51 (20.4%) |
| 15 to 19 Minutes | 10 (3.2%) | 56 (22.4%) |
| 20 to 24 Minutes | 9 (2.9%) | 8 (3.2%) |
| 25 to 29 Minutes | 17 (5.5%) | 13 (5.2%) |
| 30 to 34 Minutes | 9 (2.9%) | 0 (0.0%) |
| 35 to 39 Minutes | 0 (0.0%) | 0 (0.0%) |
| 40 to 44 Minutes | 35 (11.3%) | 35 (14.0%) |
| 45 to 59 Minutes | 62 (20.1%) | 0 (0.0%) |
| 60 to 89 Minutes | 150 (48.5%) | 57 (22.8%) |
| 90 or more Minutes | 8 (2.6%) | 7 (2.8%) |
Time of Departure to Work by Sex in Boswell s Corner
The most frequent times of departure to work in Boswell s Corner are 12:00 AM to 4:59 AM (104, 33.7%) for males and 8:00 AM to 8:29 AM (90, 36.0%) for females.
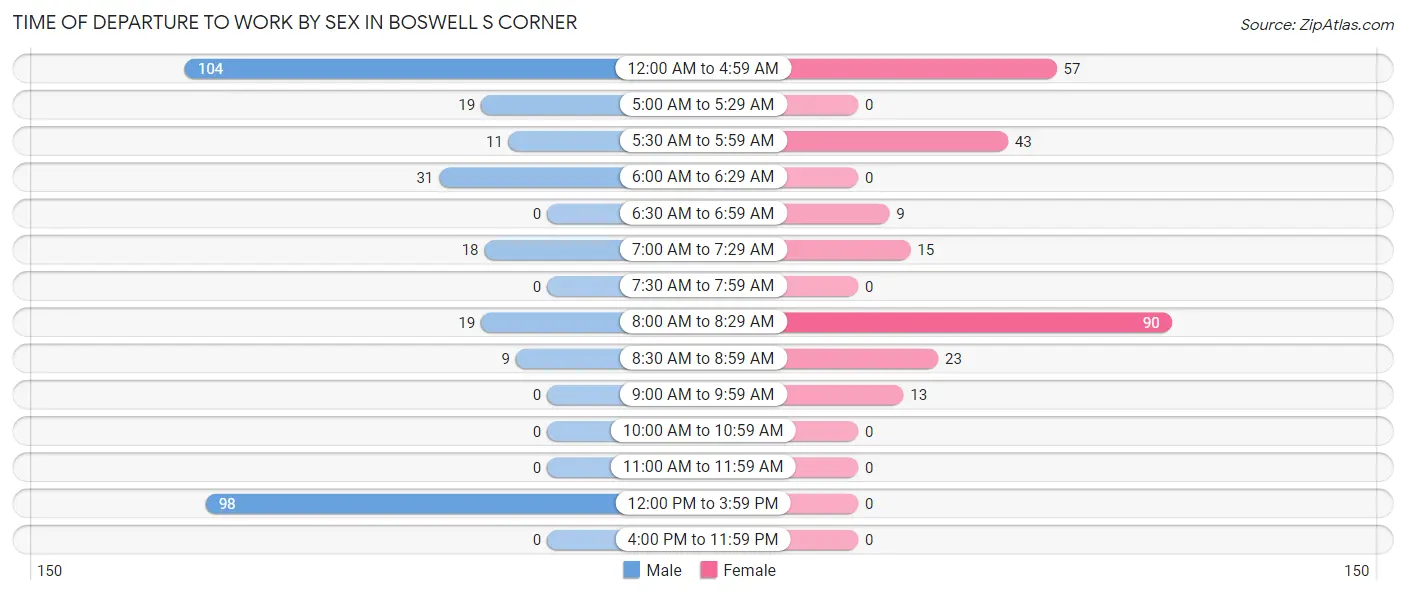
| Time of Departure | Male | Female |
| 12:00 AM to 4:59 AM | 104 (33.7%) | 57 (22.8%) |
| 5:00 AM to 5:29 AM | 19 (6.1%) | 0 (0.0%) |
| 5:30 AM to 5:59 AM | 11 (3.6%) | 43 (17.2%) |
| 6:00 AM to 6:29 AM | 31 (10.0%) | 0 (0.0%) |
| 6:30 AM to 6:59 AM | 0 (0.0%) | 9 (3.6%) |
| 7:00 AM to 7:29 AM | 18 (5.8%) | 15 (6.0%) |
| 7:30 AM to 7:59 AM | 0 (0.0%) | 0 (0.0%) |
| 8:00 AM to 8:29 AM | 19 (6.1%) | 90 (36.0%) |
| 8:30 AM to 8:59 AM | 9 (2.9%) | 23 (9.2%) |
| 9:00 AM to 9:59 AM | 0 (0.0%) | 13 (5.2%) |
| 10:00 AM to 10:59 AM | 0 (0.0%) | 0 (0.0%) |
| 11:00 AM to 11:59 AM | 0 (0.0%) | 0 (0.0%) |
| 12:00 PM to 3:59 PM | 98 (31.7%) | 0 (0.0%) |
| 4:00 PM to 11:59 PM | 0 (0.0%) | 0 (0.0%) |
| Total | 309 (100.0%) | 250 (100.0%) |
Housing Occupancy in Boswell s Corner
Occupancy by Ownership in Boswell s Corner
Of the total 442 dwellings in Boswell s Corner, owner-occupied units account for 287 (64.9%), while renter-occupied units make up 155 (35.1%).
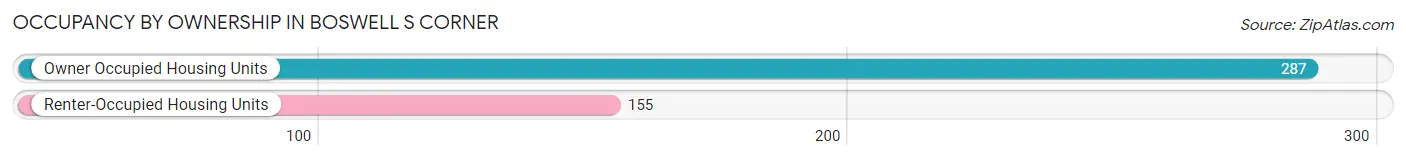
| Occupancy | # Housing Units | % Housing Units |
| Owner Occupied Housing Units | 287 | 64.9% |
| Renter-Occupied Housing Units | 155 | 35.1% |
| Total Occupied Housing Units | 442 | 100.0% |
Occupancy by Household Size in Boswell s Corner
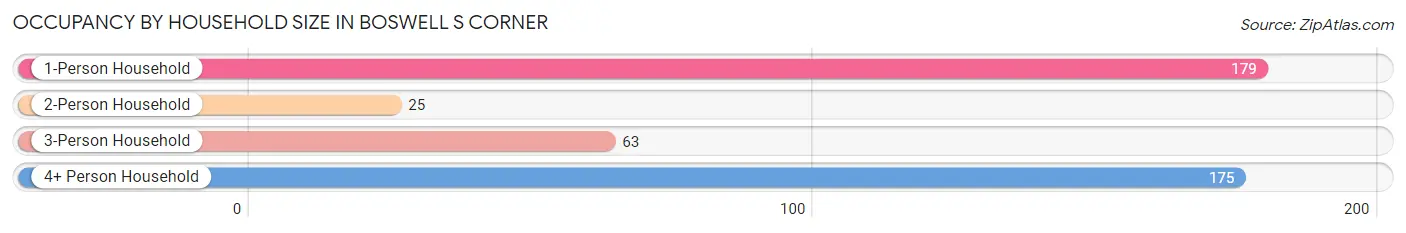
| Household Size | # Housing Units | % Housing Units |
| 1-Person Household | 179 | 40.5% |
| 2-Person Household | 25 | 5.7% |
| 3-Person Household | 63 | 14.2% |
| 4+ Person Household | 175 | 39.6% |
| Total Housing Units | 442 | 100.0% |
Occupancy by Ownership by Household Size in Boswell s Corner
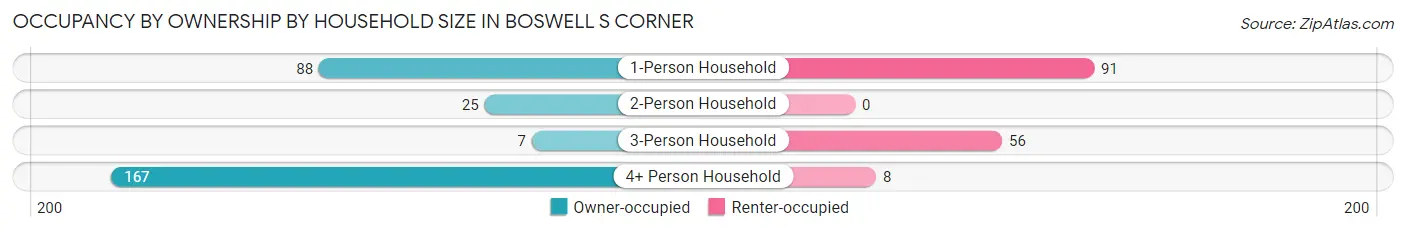
| Household Size | Owner-occupied | Renter-occupied |
| 1-Person Household | 88 (49.2%) | 91 (50.8%) |
| 2-Person Household | 25 (100.0%) | 0 (0.0%) |
| 3-Person Household | 7 (11.1%) | 56 (88.9%) |
| 4+ Person Household | 167 (95.4%) | 8 (4.6%) |
| Total Housing Units | 287 (64.9%) | 155 (35.1%) |
Occupancy by Educational Attainment in Boswell s Corner
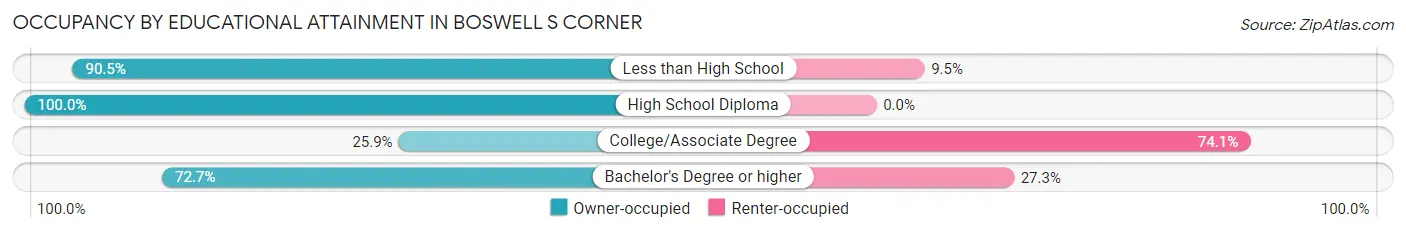
| Household Size | Owner-occupied | Renter-occupied |
| Less than High School | 190 (90.5%) | 20 (9.5%) |
| High School Diploma | 29 (100.0%) | 0 (0.0%) |
| College/Associate Degree | 44 (25.9%) | 126 (74.1%) |
| Bachelor's Degree or higher | 24 (72.7%) | 9 (27.3%) |
Occupancy by Age of Householder in Boswell s Corner
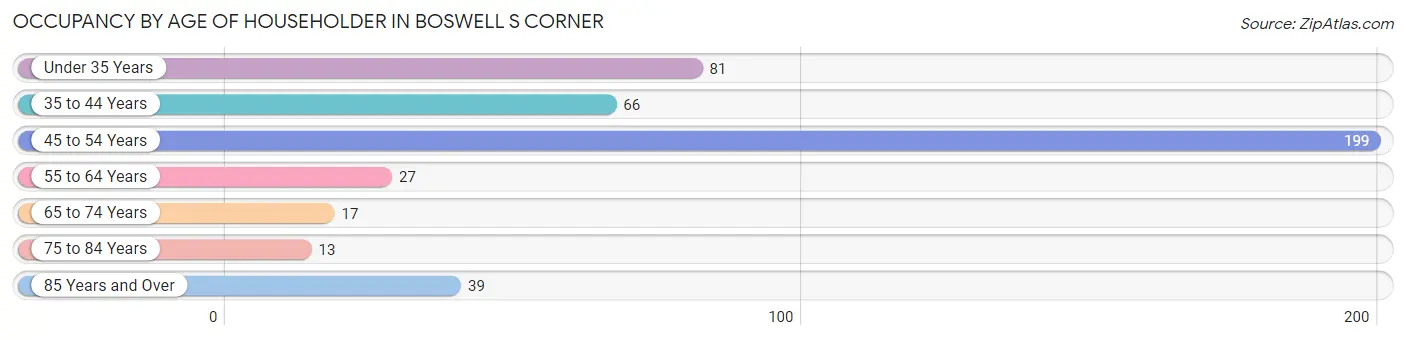
| Age Bracket | # Households | % Households |
| Under 35 Years | 81 | 18.3% |
| 35 to 44 Years | 66 | 14.9% |
| 45 to 54 Years | 199 | 45.0% |
| 55 to 64 Years | 27 | 6.1% |
| 65 to 74 Years | 17 | 3.8% |
| 75 to 84 Years | 13 | 2.9% |
| 85 Years and Over | 39 | 8.8% |
| Total | 442 | 100.0% |
Housing Finances in Boswell s Corner
Median Income by Occupancy in Boswell s Corner
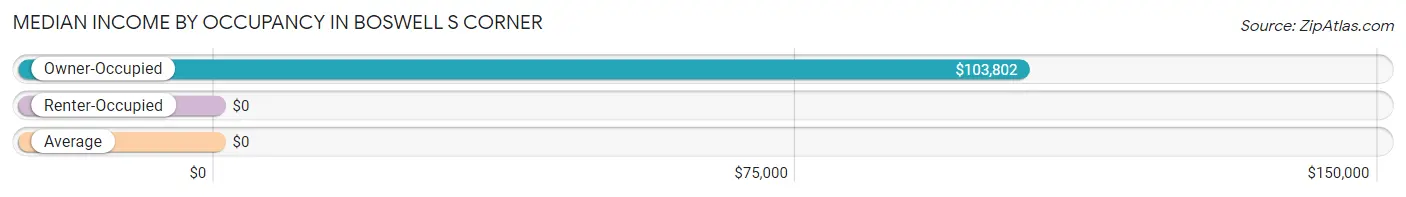
| Occupancy Type | # Households | Median Income |
| Owner-Occupied | 287 (64.9%) | $103,802 |
| Renter-Occupied | 155 (35.1%) | $0 |
| Average | 442 (100.0%) | $0 |
Occupancy by Householder Income Bracket in Boswell s Corner
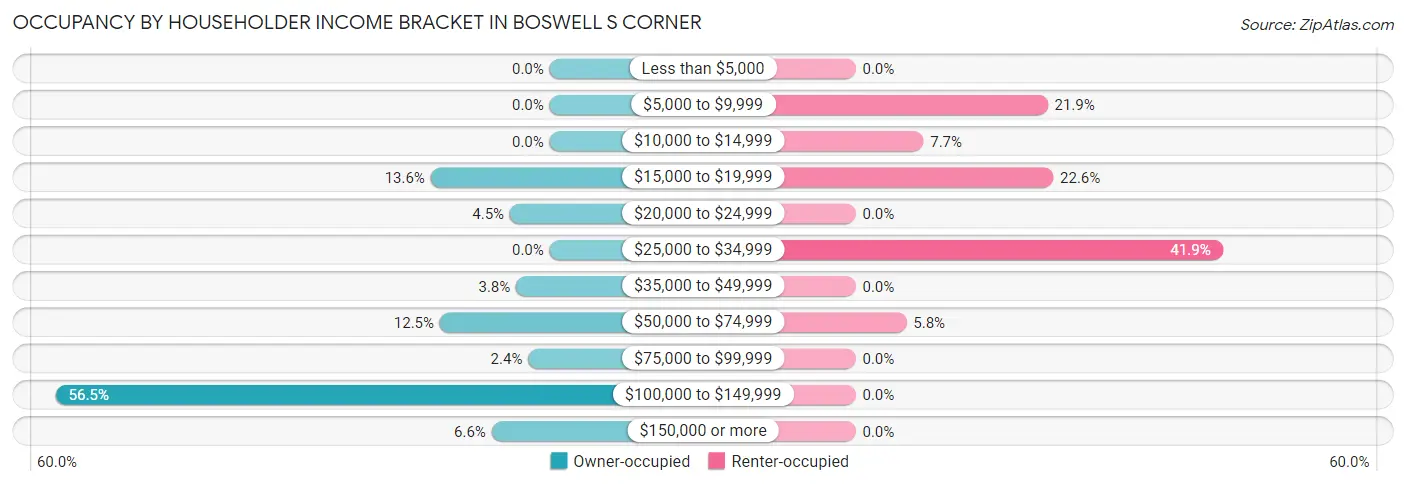
| Income Bracket | Owner-occupied | Renter-occupied |
| Less than $5,000 | 0 (0.0%) | 0 (0.0%) |
| $5,000 to $9,999 | 0 (0.0%) | 34 (21.9%) |
| $10,000 to $14,999 | 0 (0.0%) | 12 (7.7%) |
| $15,000 to $19,999 | 39 (13.6%) | 35 (22.6%) |
| $20,000 to $24,999 | 13 (4.5%) | 0 (0.0%) |
| $25,000 to $34,999 | 0 (0.0%) | 65 (41.9%) |
| $35,000 to $49,999 | 11 (3.8%) | 0 (0.0%) |
| $50,000 to $74,999 | 36 (12.5%) | 9 (5.8%) |
| $75,000 to $99,999 | 7 (2.4%) | 0 (0.0%) |
| $100,000 to $149,999 | 162 (56.5%) | 0 (0.0%) |
| $150,000 or more | 19 (6.6%) | 0 (0.0%) |
| Total | 287 (100.0%) | 155 (100.0%) |
Monthly Housing Cost Tiers in Boswell s Corner
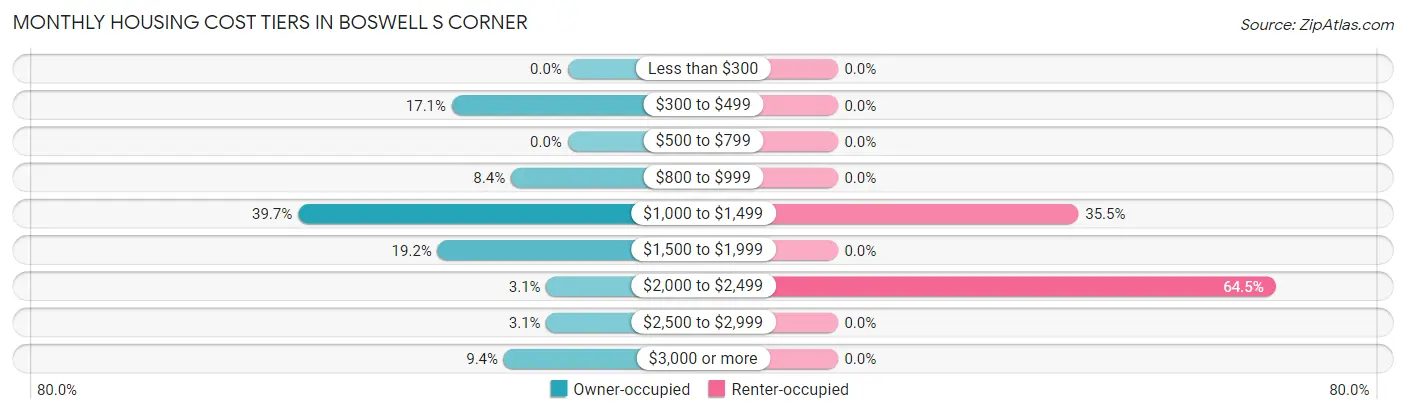
| Monthly Cost | Owner-occupied | Renter-occupied |
| Less than $300 | 0 (0.0%) | 0 (0.0%) |
| $300 to $499 | 49 (17.1%) | 0 (0.0%) |
| $500 to $799 | 0 (0.0%) | 0 (0.0%) |
| $800 to $999 | 24 (8.4%) | 0 (0.0%) |
| $1,000 to $1,499 | 114 (39.7%) | 55 (35.5%) |
| $1,500 to $1,999 | 55 (19.2%) | 0 (0.0%) |
| $2,000 to $2,499 | 9 (3.1%) | 100 (64.5%) |
| $2,500 to $2,999 | 9 (3.1%) | 0 (0.0%) |
| $3,000 or more | 27 (9.4%) | 0 (0.0%) |
| Total | 287 (100.0%) | 155 (100.0%) |
Physical Housing Characteristics in Boswell s Corner
Housing Structures in Boswell s Corner
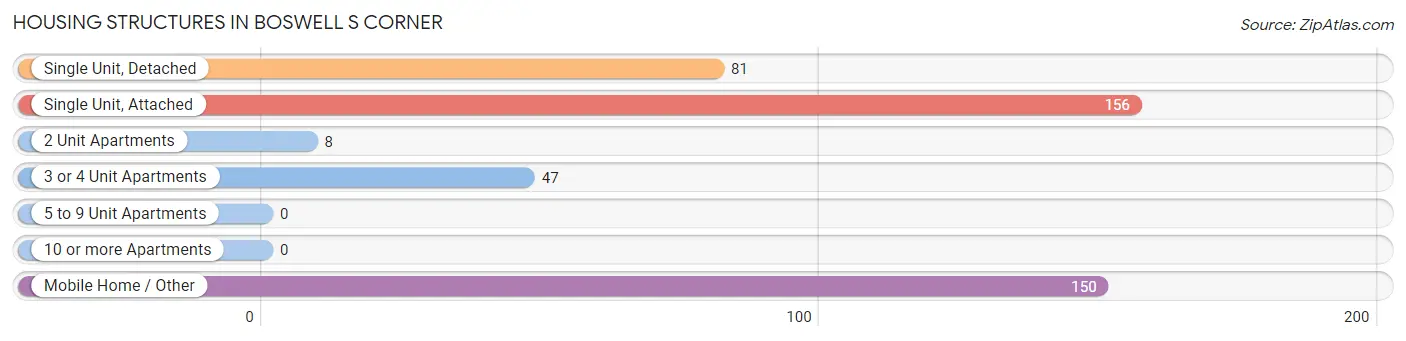
| Structure Type | # Housing Units | % Housing Units |
| Single Unit, Detached | 81 | 18.3% |
| Single Unit, Attached | 156 | 35.3% |
| 2 Unit Apartments | 8 | 1.8% |
| 3 or 4 Unit Apartments | 47 | 10.6% |
| 5 to 9 Unit Apartments | 0 | 0.0% |
| 10 or more Apartments | 0 | 0.0% |
| Mobile Home / Other | 150 | 33.9% |
| Total | 442 | 100.0% |
Housing Structures by Occupancy in Boswell s Corner
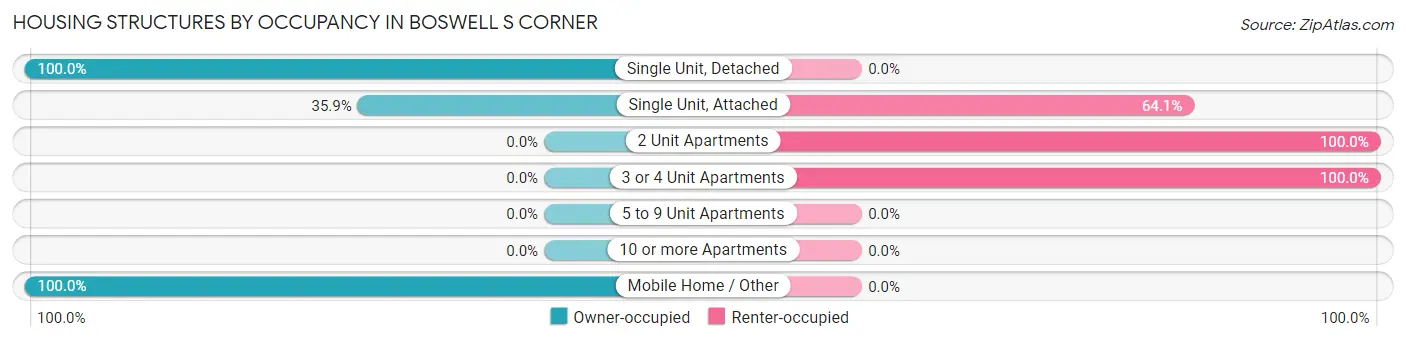
| Structure Type | Owner-occupied | Renter-occupied |
| Single Unit, Detached | 81 (100.0%) | 0 (0.0%) |
| Single Unit, Attached | 56 (35.9%) | 100 (64.1%) |
| 2 Unit Apartments | 0 (0.0%) | 8 (100.0%) |
| 3 or 4 Unit Apartments | 0 (0.0%) | 47 (100.0%) |
| 5 to 9 Unit Apartments | 0 (0.0%) | 0 (0.0%) |
| 10 or more Apartments | 0 (0.0%) | 0 (0.0%) |
| Mobile Home / Other | 150 (100.0%) | 0 (0.0%) |
| Total | 287 (64.9%) | 155 (35.1%) |
Housing Structures by Number of Rooms in Boswell s Corner
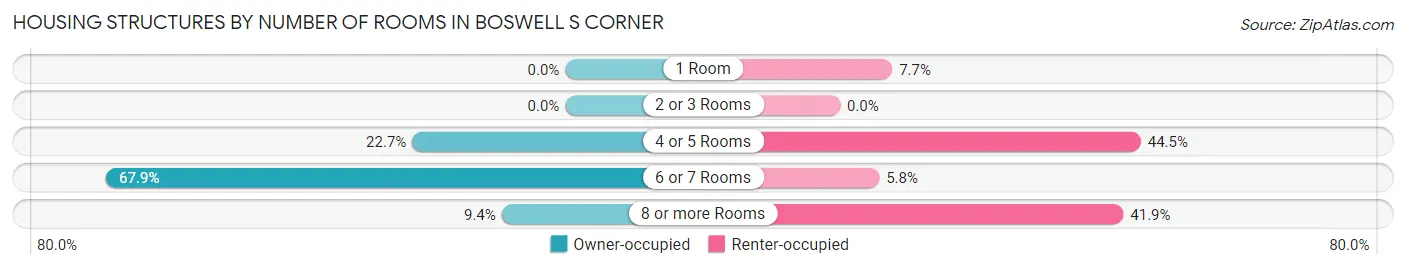
| Number of Rooms | Owner-occupied | Renter-occupied |
| 1 Room | 0 (0.0%) | 12 (7.7%) |
| 2 or 3 Rooms | 0 (0.0%) | 0 (0.0%) |
| 4 or 5 Rooms | 65 (22.7%) | 69 (44.5%) |
| 6 or 7 Rooms | 195 (67.9%) | 9 (5.8%) |
| 8 or more Rooms | 27 (9.4%) | 65 (41.9%) |
| Total | 287 (100.0%) | 155 (100.0%) |
Housing Structure by Heating Type in Boswell s Corner
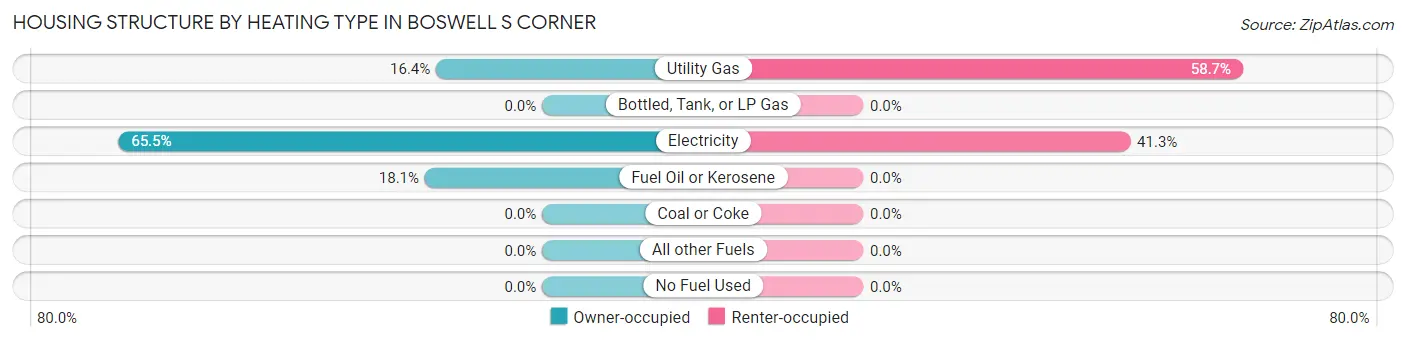
| Heating Type | Owner-occupied | Renter-occupied |
| Utility Gas | 47 (16.4%) | 91 (58.7%) |
| Bottled, Tank, or LP Gas | 0 (0.0%) | 0 (0.0%) |
| Electricity | 188 (65.5%) | 64 (41.3%) |
| Fuel Oil or Kerosene | 52 (18.1%) | 0 (0.0%) |
| Coal or Coke | 0 (0.0%) | 0 (0.0%) |
| All other Fuels | 0 (0.0%) | 0 (0.0%) |
| No Fuel Used | 0 (0.0%) | 0 (0.0%) |
| Total | 287 (100.0%) | 155 (100.0%) |
Household Vehicle Usage in Boswell s Corner
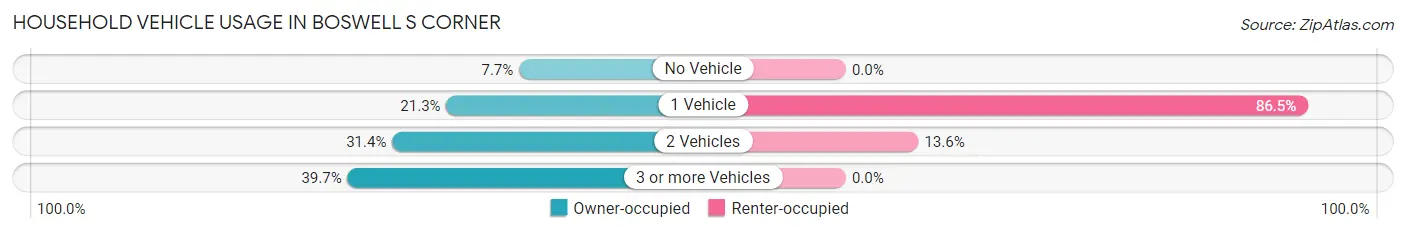
| Vehicles per Household | Owner-occupied | Renter-occupied |
| No Vehicle | 22 (7.7%) | 0 (0.0%) |
| 1 Vehicle | 61 (21.2%) | 134 (86.5%) |
| 2 Vehicles | 90 (31.4%) | 21 (13.6%) |
| 3 or more Vehicles | 114 (39.7%) | 0 (0.0%) |
| Total | 287 (100.0%) | 155 (100.0%) |
Real Estate & Mortgages in Boswell s Corner
Real Estate and Mortgage Overview in Boswell s Corner
| Characteristic | Without Mortgage | With Mortgage |
| Housing Units | 138 | 149 |
| Median Property Value | - | - |
| Median Household Income | $119,375 | $9 |
| Monthly Housing Costs | $983 | $27 |
| Real Estate Taxes | $363 | $0 |
Property Value by Mortgage Status in Boswell s Corner
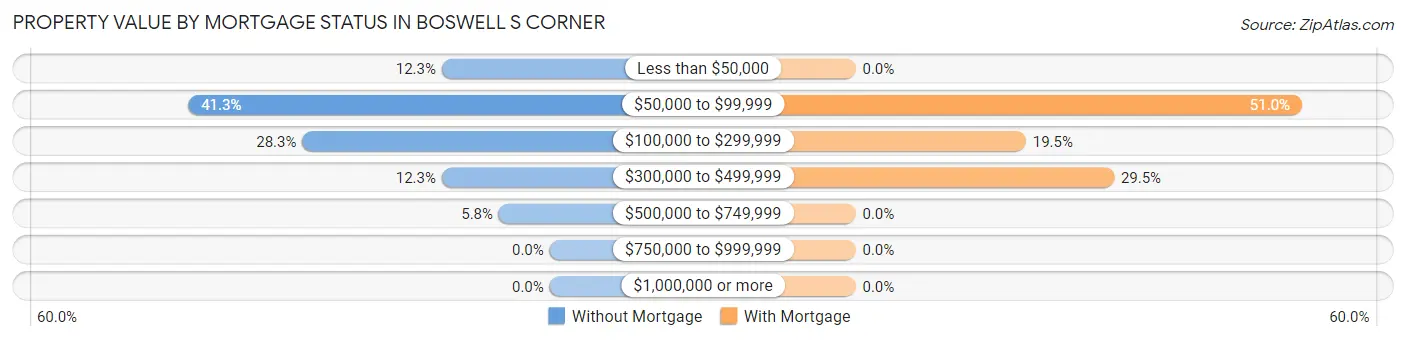
| Property Value | Without Mortgage | With Mortgage |
| Less than $50,000 | 17 (12.3%) | 0 (0.0%) |
| $50,000 to $99,999 | 57 (41.3%) | 76 (51.0%) |
| $100,000 to $299,999 | 39 (28.3%) | 29 (19.5%) |
| $300,000 to $499,999 | 17 (12.3%) | 44 (29.5%) |
| $500,000 to $749,999 | 8 (5.8%) | 0 (0.0%) |
| $750,000 to $999,999 | 0 (0.0%) | 0 (0.0%) |
| $1,000,000 or more | 0 (0.0%) | 0 (0.0%) |
| Total | 138 (100.0%) | 149 (100.0%) |
Household Income by Mortgage Status in Boswell s Corner
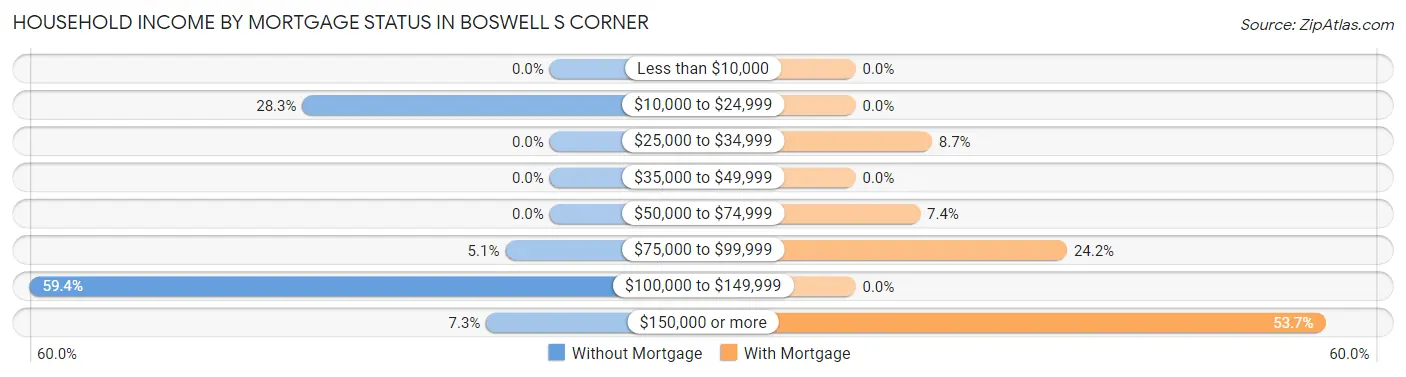
| Household Income | Without Mortgage | With Mortgage |
| Less than $10,000 | 0 (0.0%) | 0 (0.0%) |
| $10,000 to $24,999 | 39 (28.3%) | 0 (0.0%) |
| $25,000 to $34,999 | 0 (0.0%) | 13 (8.7%) |
| $35,000 to $49,999 | 0 (0.0%) | 0 (0.0%) |
| $50,000 to $74,999 | 0 (0.0%) | 11 (7.4%) |
| $75,000 to $99,999 | 7 (5.1%) | 36 (24.2%) |
| $100,000 to $149,999 | 82 (59.4%) | 0 (0.0%) |
| $150,000 or more | 10 (7.2%) | 80 (53.7%) |
| Total | 138 (100.0%) | 149 (100.0%) |
Property Value to Household Income Ratio in Boswell s Corner
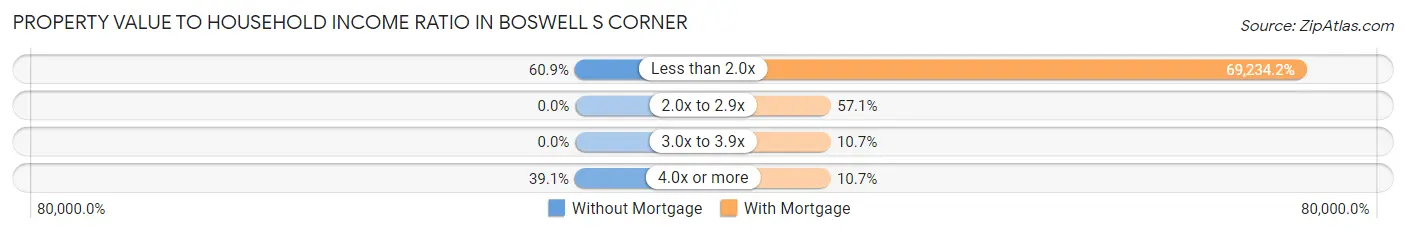
| Value-to-Income Ratio | Without Mortgage | With Mortgage |
| Less than 2.0x | 84 (60.9%) | 103,159 (69,234.2%) |
| 2.0x to 2.9x | 0 (0.0%) | 85 (57.1%) |
| 3.0x to 3.9x | 0 (0.0%) | 16 (10.7%) |
| 4.0x or more | 54 (39.1%) | 16 (10.7%) |
| Total | 138 (100.0%) | 149 (100.0%) |
Real Estate Taxes by Mortgage Status in Boswell s Corner
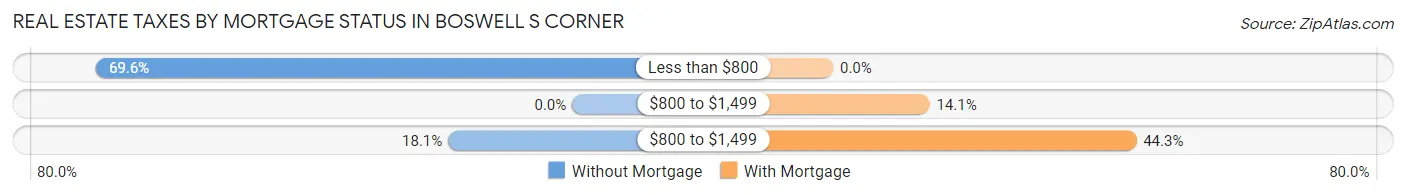
| Property Taxes | Without Mortgage | With Mortgage |
| Less than $800 | 96 (69.6%) | 0 (0.0%) |
| $800 to $1,499 | 0 (0.0%) | 21 (14.1%) |
| $800 to $1,499 | 25 (18.1%) | 66 (44.3%) |
| Total | 138 (100.0%) | 149 (100.0%) |
Health & Disability in Boswell s Corner
Health Insurance Coverage by Age in Boswell s Corner
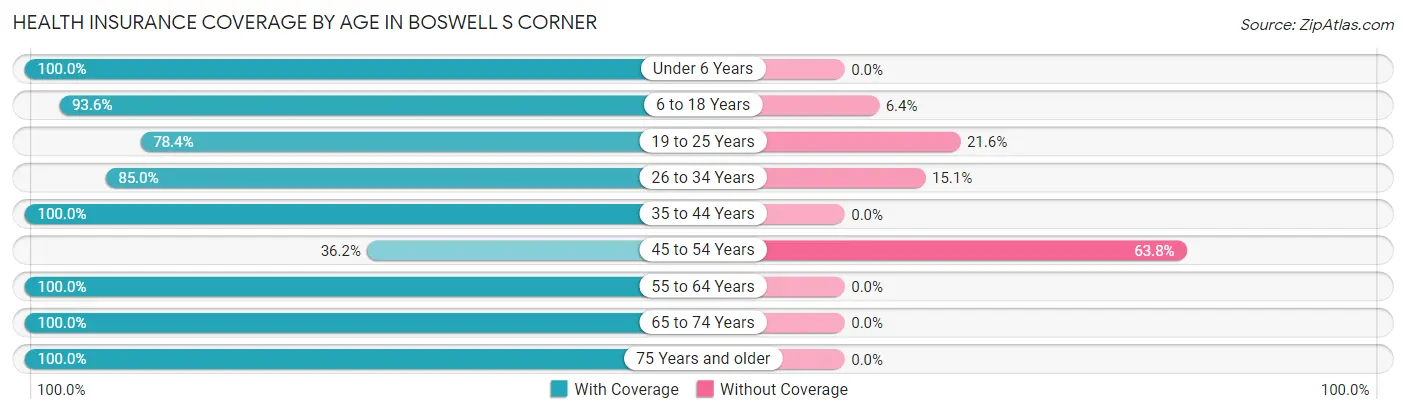
| Age Bracket | With Coverage | Without Coverage |
| Under 6 Years | 93 (100.0%) | 0 (0.0%) |
| 6 to 18 Years | 204 (93.6%) | 14 (6.4%) |
| 19 to 25 Years | 200 (78.4%) | 55 (21.6%) |
| 26 to 34 Years | 158 (85.0%) | 28 (15.0%) |
| 35 to 44 Years | 66 (100.0%) | 0 (0.0%) |
| 45 to 54 Years | 80 (36.2%) | 141 (63.8%) |
| 55 to 64 Years | 93 (100.0%) | 0 (0.0%) |
| 65 to 74 Years | 31 (100.0%) | 0 (0.0%) |
| 75 Years and older | 52 (100.0%) | 0 (0.0%) |
| Total | 977 (80.4%) | 238 (19.6%) |
Health Insurance Coverage by Citizenship Status in Boswell s Corner
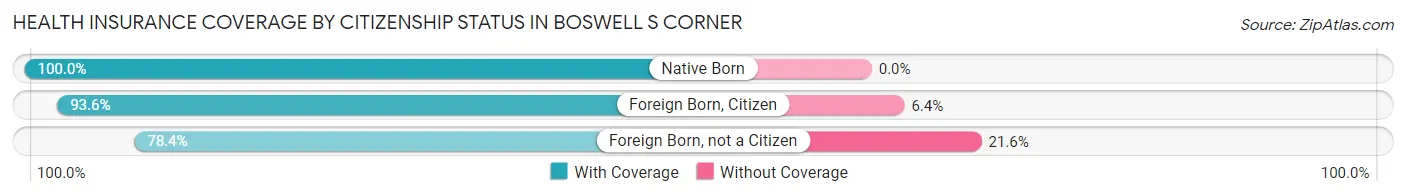
| Citizenship Status | With Coverage | Without Coverage |
| Native Born | 93 (100.0%) | 0 (0.0%) |
| Foreign Born, Citizen | 204 (93.6%) | 14 (6.4%) |
| Foreign Born, not a Citizen | 200 (78.4%) | 55 (21.6%) |
Health Insurance Coverage by Household Income in Boswell s Corner
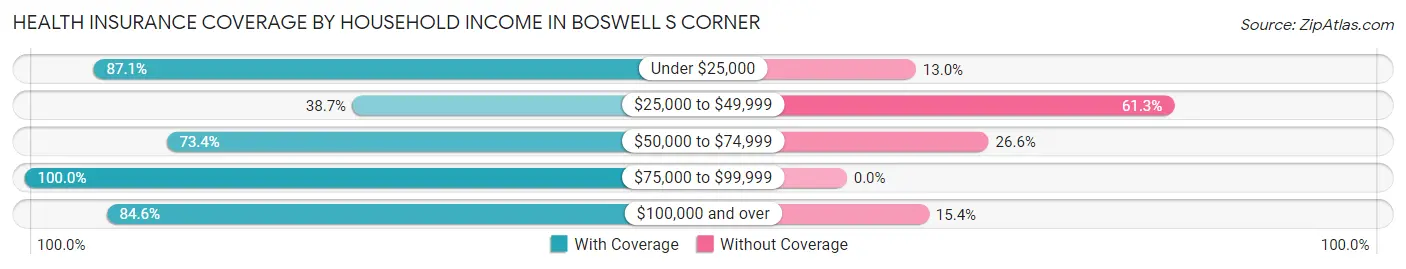
| Household Income | With Coverage | Without Coverage |
| Under $25,000 | 168 (87.1%) | 25 (13.0%) |
| $25,000 to $49,999 | 41 (38.7%) | 65 (61.3%) |
| $50,000 to $74,999 | 58 (73.4%) | 21 (26.6%) |
| $75,000 to $99,999 | 11 (100.0%) | 0 (0.0%) |
| $100,000 and over | 699 (84.6%) | 127 (15.4%) |
Public vs Private Health Insurance Coverage by Age in Boswell s Corner
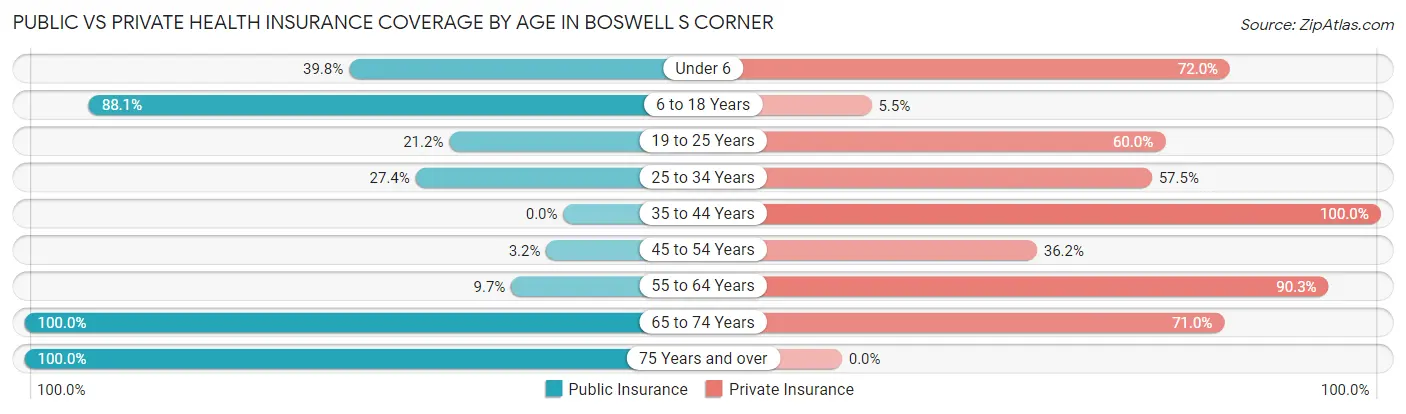
| Age Bracket | Public Insurance | Private Insurance |
| Under 6 | 37 (39.8%) | 67 (72.0%) |
| 6 to 18 Years | 192 (88.1%) | 12 (5.5%) |
| 19 to 25 Years | 54 (21.2%) | 153 (60.0%) |
| 25 to 34 Years | 51 (27.4%) | 107 (57.5%) |
| 35 to 44 Years | 0 (0.0%) | 66 (100.0%) |
| 45 to 54 Years | 7 (3.2%) | 80 (36.2%) |
| 55 to 64 Years | 9 (9.7%) | 84 (90.3%) |
| 65 to 74 Years | 31 (100.0%) | 22 (71.0%) |
| 75 Years and over | 52 (100.0%) | 0 (0.0%) |
| Total | 433 (35.6%) | 591 (48.6%) |
Disability Status by Sex by Age in Boswell s Corner
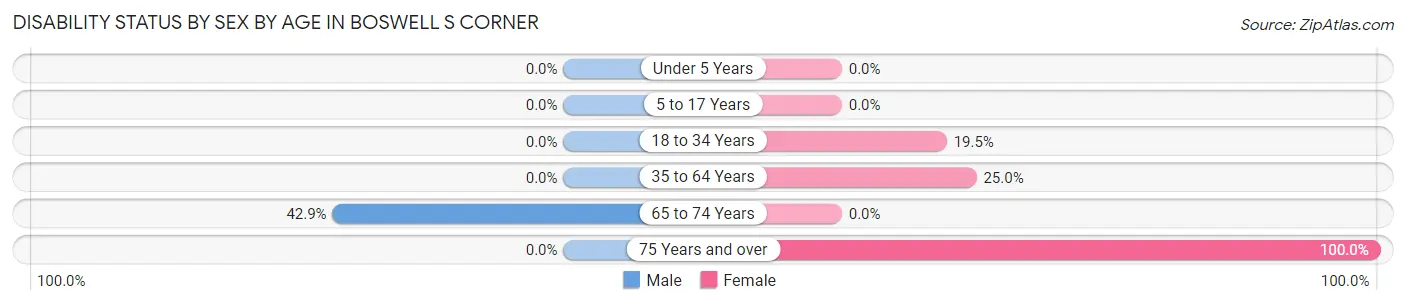
| Age Bracket | Male | Female |
| Under 5 Years | 0 (0.0%) | 0 (0.0%) |
| 5 to 17 Years | 0 (0.0%) | 0 (0.0%) |
| 18 to 34 Years | 0 (0.0%) | 37 (19.5%) |
| 35 to 64 Years | 0 (0.0%) | 66 (25.0%) |
| 65 to 74 Years | 6 (42.9%) | 0 (0.0%) |
| 75 Years and over | 0 (0.0%) | 52 (100.0%) |
Disability Class by Sex by Age in Boswell s Corner
Disability Class: Hearing Difficulty
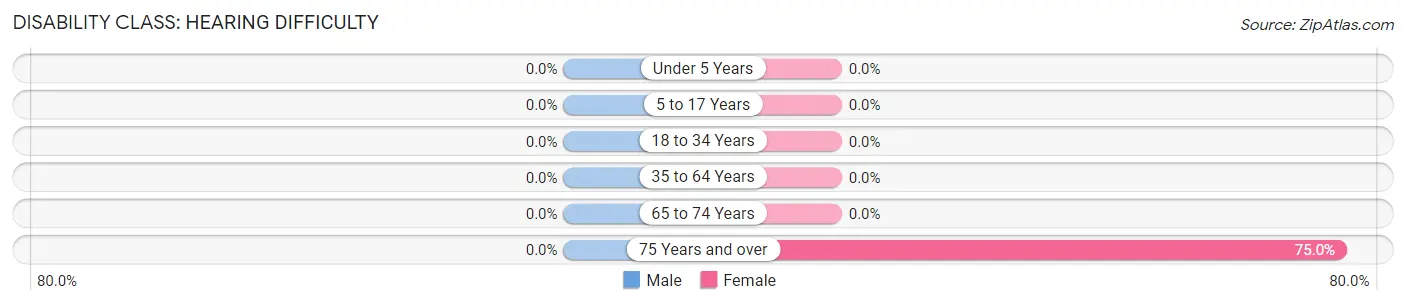
| Age Bracket | Male | Female |
| Under 5 Years | 0 (0.0%) | 0 (0.0%) |
| 5 to 17 Years | 0 (0.0%) | 0 (0.0%) |
| 18 to 34 Years | 0 (0.0%) | 0 (0.0%) |
| 35 to 64 Years | 0 (0.0%) | 0 (0.0%) |
| 65 to 74 Years | 0 (0.0%) | 0 (0.0%) |
| 75 Years and over | 0 (0.0%) | 39 (75.0%) |
Disability Class: Vision Difficulty
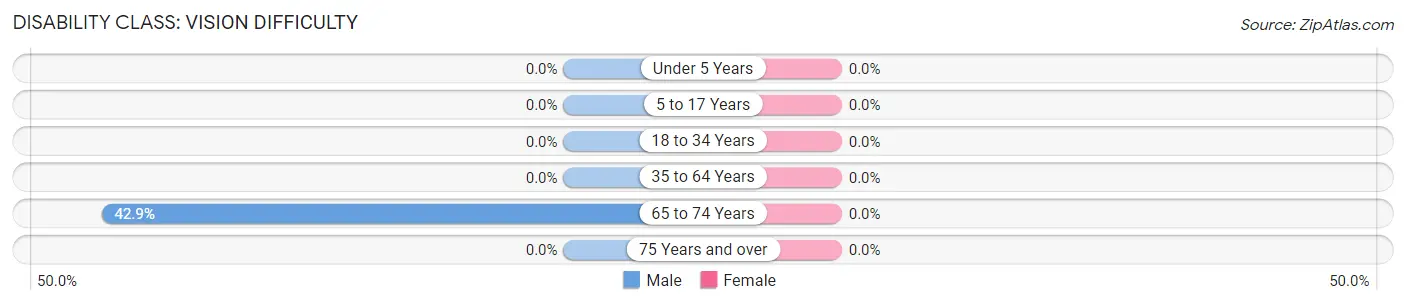
| Age Bracket | Male | Female |
| Under 5 Years | 0 (0.0%) | 0 (0.0%) |
| 5 to 17 Years | 0 (0.0%) | 0 (0.0%) |
| 18 to 34 Years | 0 (0.0%) | 0 (0.0%) |
| 35 to 64 Years | 0 (0.0%) | 0 (0.0%) |
| 65 to 74 Years | 6 (42.9%) | 0 (0.0%) |
| 75 Years and over | 0 (0.0%) | 0 (0.0%) |
Disability Class: Cognitive Difficulty
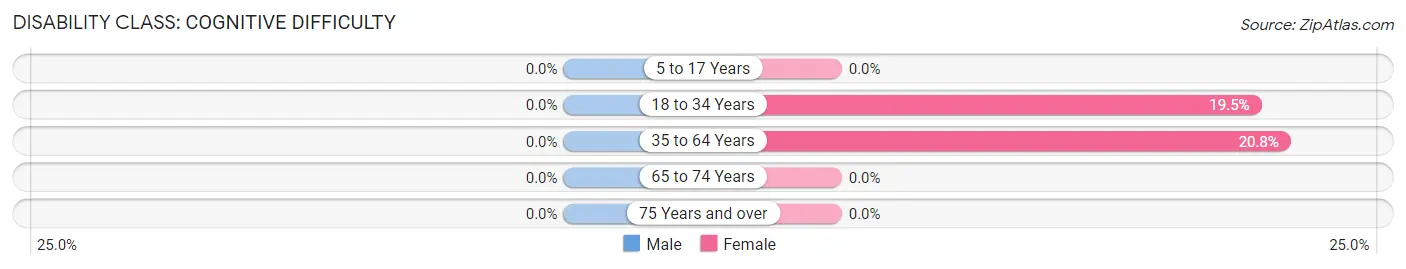
| Age Bracket | Male | Female |
| 5 to 17 Years | 0 (0.0%) | 0 (0.0%) |
| 18 to 34 Years | 0 (0.0%) | 37 (19.5%) |
| 35 to 64 Years | 0 (0.0%) | 55 (20.8%) |
| 65 to 74 Years | 0 (0.0%) | 0 (0.0%) |
| 75 Years and over | 0 (0.0%) | 0 (0.0%) |
Disability Class: Ambulatory Difficulty
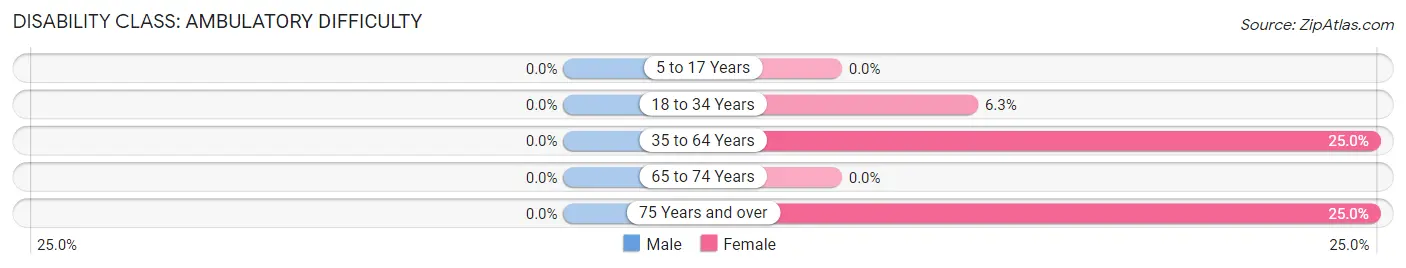
| Age Bracket | Male | Female |
| 5 to 17 Years | 0 (0.0%) | 0 (0.0%) |
| 18 to 34 Years | 0 (0.0%) | 12 (6.3%) |
| 35 to 64 Years | 0 (0.0%) | 66 (25.0%) |
| 65 to 74 Years | 0 (0.0%) | 0 (0.0%) |
| 75 Years and over | 0 (0.0%) | 13 (25.0%) |
Disability Class: Self-Care Difficulty
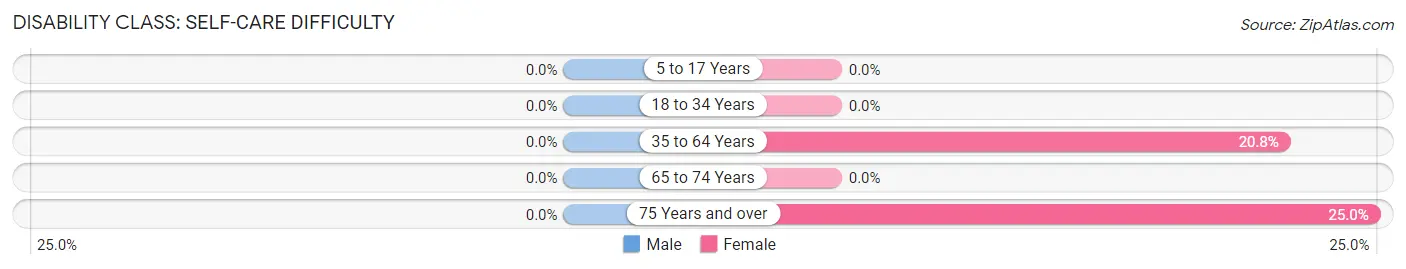
| Age Bracket | Male | Female |
| 5 to 17 Years | 0 (0.0%) | 0 (0.0%) |
| 18 to 34 Years | 0 (0.0%) | 0 (0.0%) |
| 35 to 64 Years | 0 (0.0%) | 55 (20.8%) |
| 65 to 74 Years | 0 (0.0%) | 0 (0.0%) |
| 75 Years and over | 0 (0.0%) | 13 (25.0%) |
Technology Access in Boswell s Corner
Computing Device Access in Boswell s Corner
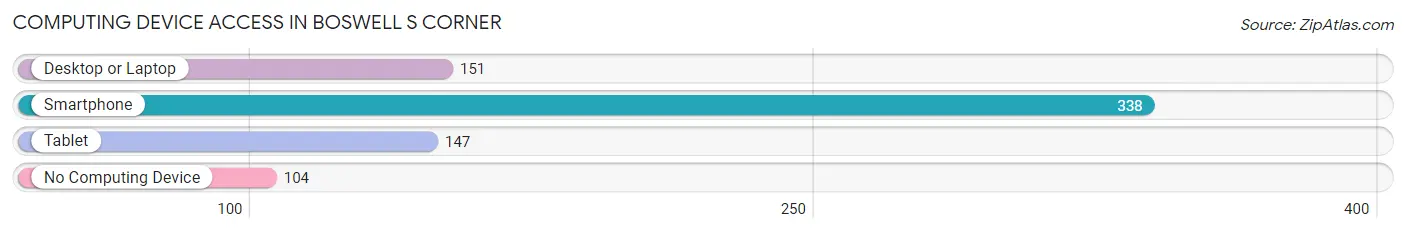
| Device Type | # Households | % Households |
| Desktop or Laptop | 151 | 34.2% |
| Smartphone | 338 | 76.5% |
| Tablet | 147 | 33.3% |
| No Computing Device | 104 | 23.5% |
| Total | 442 | 100.0% |
Internet Access in Boswell s Corner
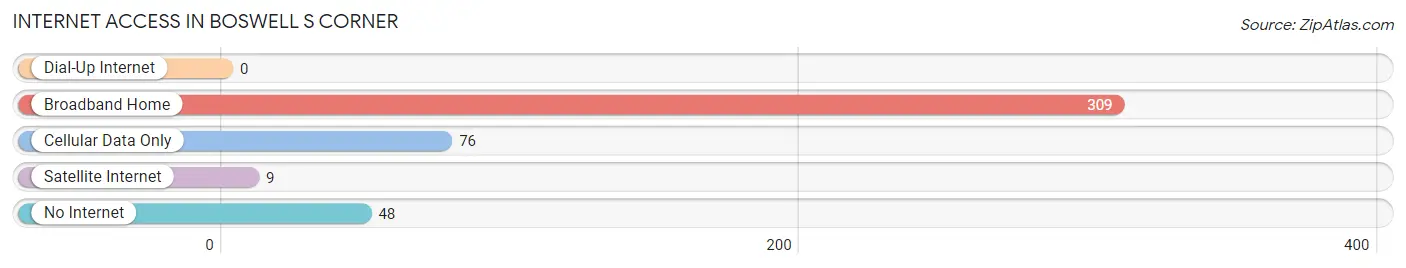
| Internet Type | # Households | % Households |
| Dial-Up Internet | 0 | 0.0% |
| Broadband Home | 309 | 69.9% |
| Cellular Data Only | 76 | 17.2% |
| Satellite Internet | 9 | 2.0% |
| No Internet | 48 | 10.9% |
| Total | 442 | 100.0% |
Boswell s Corner Summary
Boswell's Corner is an unincorporated community located in the southeastern corner of Virginia, in the United States. It is situated in the rural, agricultural area of Southampton County, and is bordered by the cities of Franklin and Suffolk. The community is named after the Boswell family, who were among the first settlers in the area.
History
The area that is now Boswell's Corner was first settled in the early 1700s by the Boswell family, who were among the first settlers in the area. The family established a plantation in the area, and the community grew up around it. The plantation was eventually sold to the Smith family, who owned it until the early 1900s.
In the late 1800s, the area began to develop as a rural community, with a post office, a general store, and a school. The community was also home to a number of churches, including the Boswell's Corner Baptist Church, which was established in 1891.
In the early 1900s, the community began to decline as the population shifted to larger cities. By the mid-1900s, the population had dwindled to just a few hundred people. However, in recent years, the population has begun to grow again, as people have moved back to the area to take advantage of the rural lifestyle and the proximity to larger cities.
Geography
Boswell's Corner is located in the southeastern corner of Virginia, in the United States. It is situated in the rural, agricultural area of Southampton County, and is bordered by the cities of Franklin and Suffolk. The community is located on the banks of the Nottoway River, and is surrounded by farmland and forests.
The climate in Boswell's Corner is humid subtropical, with hot, humid summers and mild winters. The average annual temperature is around 70 degrees Fahrenheit, and the average annual precipitation is around 45 inches.
Economy
The economy of Boswell's Corner is largely based on agriculture. The area is home to a number of farms, which produce a variety of crops, including corn, soybeans, wheat, and hay. The area is also home to a number of small businesses, including a general store, a post office, and a few restaurants.
Demographics
As of the 2010 census, the population of Boswell's Corner was 1,093. The racial makeup of the community was 79.3% White, 17.2% African American, 0.7% Native American, 0.3% Asian, and 2.5% from other races. The median household income was $37,917, and the median family income was $45,625.
Conclusion
Boswell's Corner is a small, rural community located in the southeastern corner of Virginia. The area has a long history, and was once home to a thriving agricultural community. Today, the area is still largely agricultural, and is home to a number of small businesses. The population of the community is diverse, and the median household income is slightly below the national average.
Common Questions
What is Per Capita Income in Boswell s Corner?
Per Capita income in Boswell s Corner is $26,948.
What is the Median Family Income in Boswell s Corner?
Median Family Income in Boswell s Corner is $69,978.
What is Income or Wage Gap in Boswell s Corner?
Income or Wage Gap in Boswell s Corner is 50.1%.
Women in Boswell s Corner earn 49.9 cents for every dollar earned by a man.
What is Family Income Deficit in Boswell s Corner?
Family Income Deficit in Boswell s Corner is $8,553.
Families that are below poverty line in Boswell s Corner earn $8,553 less on average than the poverty threshold level.
What is Inequality or Gini Index in Boswell s Corner?
Inequality or Gini Index in Boswell s Corner is 0.41.
What is the Total Population of Boswell s Corner?
Total Population of Boswell s Corner is 1,215.
What is the Total Male Population of Boswell s Corner?
Total Male Population of Boswell s Corner is 586.
What is the Total Female Population of Boswell s Corner?
Total Female Population of Boswell s Corner is 629.
What is the Ratio of Males per 100 Females in Boswell s Corner?
There are 93.16 Males per 100 Females in Boswell s Corner.
What is the Ratio of Females per 100 Males in Boswell s Corner?
There are 107.34 Females per 100 Males in Boswell s Corner.
What is the Median Population Age in Boswell s Corner?
Median Population Age in Boswell s Corner is 28.9 Years.
What is the Average Family Size in Boswell s Corner
Average Family Size in Boswell s Corner is 3.5 People.
What is the Average Household Size in Boswell s Corner
Average Household Size in Boswell s Corner is 2.8 People.
How Large is the Labor Force in Boswell s Corner?
There are 727 People in the Labor Forcein in Boswell s Corner.
What is the Percentage of People in the Labor Force in Boswell s Corner?
74.5% of People are in the Labor Force in Boswell s Corner.
What is the Unemployment Rate in Boswell s Corner?
Unemployment Rate in Boswell s Corner is 2.2%.