Exmore, VA Map & Demographics
Exmore Map
Exmore Overview
$22,191
PER CAPITA INCOME
$54,926
AVG FAMILY INCOME
$39,293
AVG HOUSEHOLD INCOME
39.3%
WAGE / INCOME GAP [ % ]
60.7¢/ $1
WAGE / INCOME GAP [ $ ]
$10,536
FAMILY INCOME DEFICIT
0.49
INEQUALITY / GINI INDEX
1,744
TOTAL POPULATION
866
MALE POPULATION
878
FEMALE POPULATION
98.63
MALES / 100 FEMALES
101.39
FEMALES / 100 MALES
36.2
MEDIAN AGE
3.4
AVG FAMILY SIZE
2.4
AVG HOUSEHOLD SIZE
777
LABOR FORCE [ PEOPLE ]
56.2%
PERCENT IN LABOR FORCE
6.7%
UNEMPLOYMENT RATE
Exmore Zip Codes
Exmore Area Codes
Income in Exmore
Income Overview in Exmore
Per Capita Income in Exmore is $22,191, while median incomes of families and households are $54,926 and $39,293 respectively.
| Characteristic | Number | Measure |
| Per Capita Income | 1,744 | $22,191 |
| Median Family Income | 400 | $54,926 |
| Mean Family Income | 400 | $66,549 |
| Median Household Income | 707 | $39,293 |
| Mean Household Income | 707 | $52,036 |
| Income Deficit | 400 | $10,536 |
| Wage / Income Gap (%) | 1,744 | 39.29% |
| Wage / Income Gap ($) | 1,744 | 60.71¢ per $1 |
| Gini / Inequality Index | 1,744 | 0.49 |
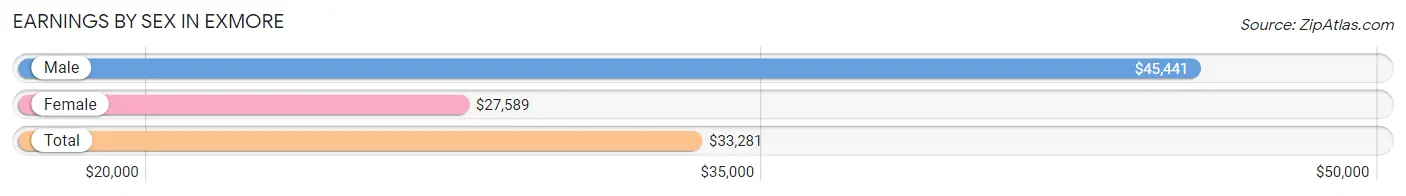
Earnings by Sex in Exmore
Average Earnings in Exmore are $33,281, $45,441 for men and $27,589 for women, a difference of 39.3%.
| Sex | Number | Average Earnings |
| Male | 384 (49.5%) | $45,441 |
| Female | 392 (50.5%) | $27,589 |
| Total | 776 (100.0%) | $33,281 |
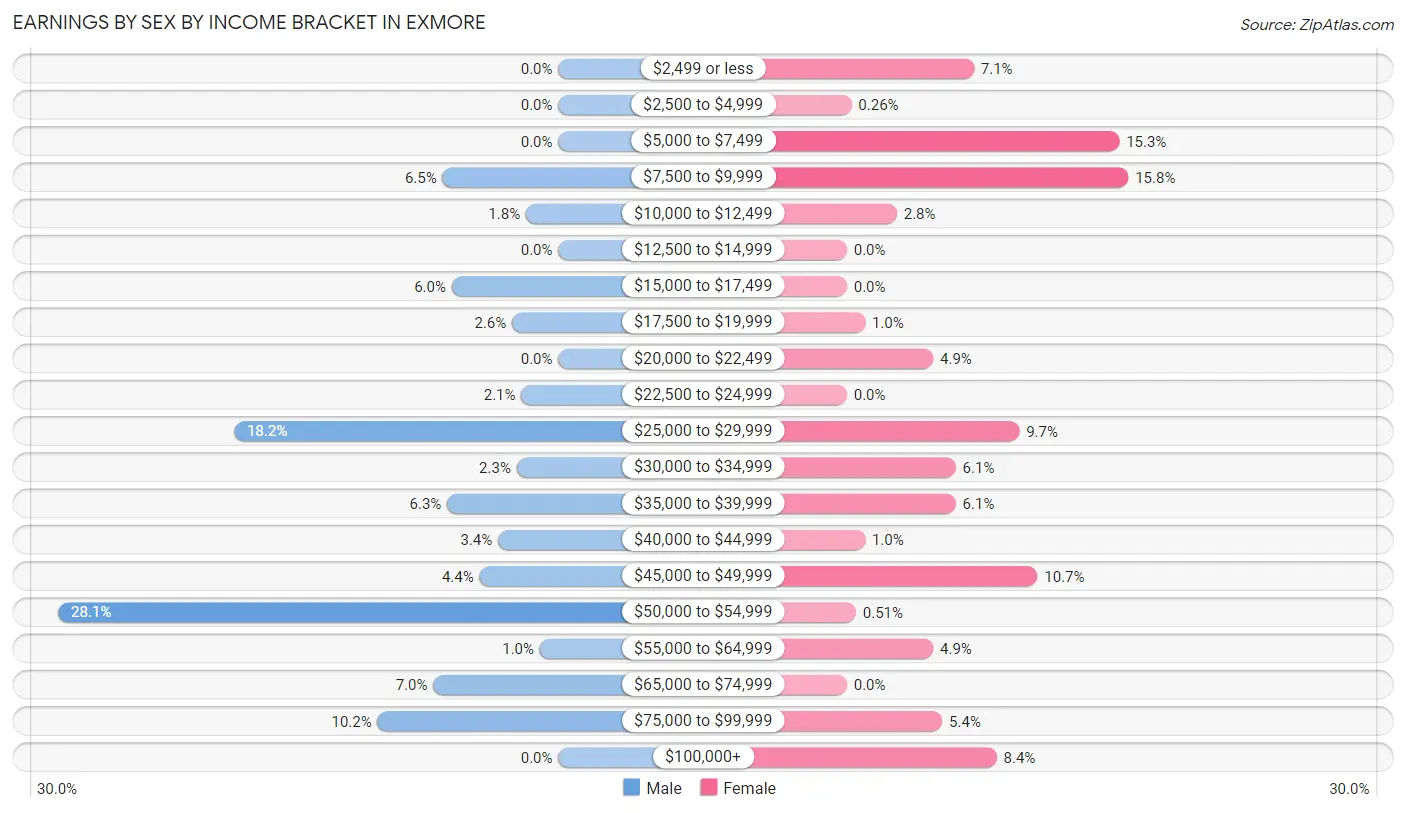
Earnings by Sex by Income Bracket in Exmore
The most common earnings brackets in Exmore are $50,000 to $54,999 for men (108 | 28.1%) and $7,500 to $9,999 for women (62 | 15.8%).
| Income | Male | Female |
| $2,499 or less | 0 (0.0%) | 28 (7.1%) |
| $2,500 to $4,999 | 0 (0.0%) | 1 (0.3%) |
| $5,000 to $7,499 | 0 (0.0%) | 60 (15.3%) |
| $7,500 to $9,999 | 25 (6.5%) | 62 (15.8%) |
| $10,000 to $12,499 | 7 (1.8%) | 11 (2.8%) |
| $12,500 to $14,999 | 0 (0.0%) | 0 (0.0%) |
| $15,000 to $17,499 | 23 (6.0%) | 0 (0.0%) |
| $17,500 to $19,999 | 10 (2.6%) | 4 (1.0%) |
| $20,000 to $22,499 | 0 (0.0%) | 19 (4.9%) |
| $22,500 to $24,999 | 8 (2.1%) | 0 (0.0%) |
| $25,000 to $29,999 | 70 (18.2%) | 38 (9.7%) |
| $30,000 to $34,999 | 9 (2.3%) | 24 (6.1%) |
| $35,000 to $39,999 | 24 (6.2%) | 24 (6.1%) |
| $40,000 to $44,999 | 13 (3.4%) | 4 (1.0%) |
| $45,000 to $49,999 | 17 (4.4%) | 42 (10.7%) |
| $50,000 to $54,999 | 108 (28.1%) | 2 (0.5%) |
| $55,000 to $64,999 | 4 (1.0%) | 19 (4.9%) |
| $65,000 to $74,999 | 27 (7.0%) | 0 (0.0%) |
| $75,000 to $99,999 | 39 (10.2%) | 21 (5.4%) |
| $100,000+ | 0 (0.0%) | 33 (8.4%) |
| Total | 384 (100.0%) | 392 (100.0%) |
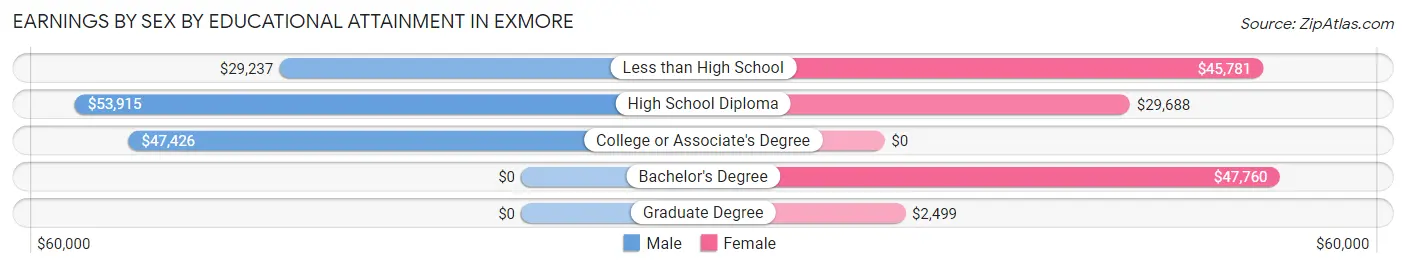
Earnings by Sex by Educational Attainment in Exmore
Average earnings in Exmore are $51,625 for men and $32,031 for women, a difference of 38.0%. Men with an educational attainment of high school diploma enjoy the highest average annual earnings of $53,915, while those with less than high school education earn the least with $29,237. Women with an educational attainment of bachelor's degree earn the most with the average annual earnings of $47,760, while those with graduate degree education have the smallest earnings of $2,499.
| Educational Attainment | Male Income | Female Income |
| Less than High School | $29,237 | $45,781 |
| High School Diploma | $53,915 | $29,688 |
| College or Associate's Degree | $47,426 | $0 |
| Bachelor's Degree | - | - |
| Graduate Degree | - | - |
| Total | $51,625 | $32,031 |
Family Income in Exmore
Family Income Brackets in Exmore
According to the Exmore family income data, there are 120 families falling into the $50,000 to $74,999 income range, which is the most common income bracket and makes up 30.0% of all families.
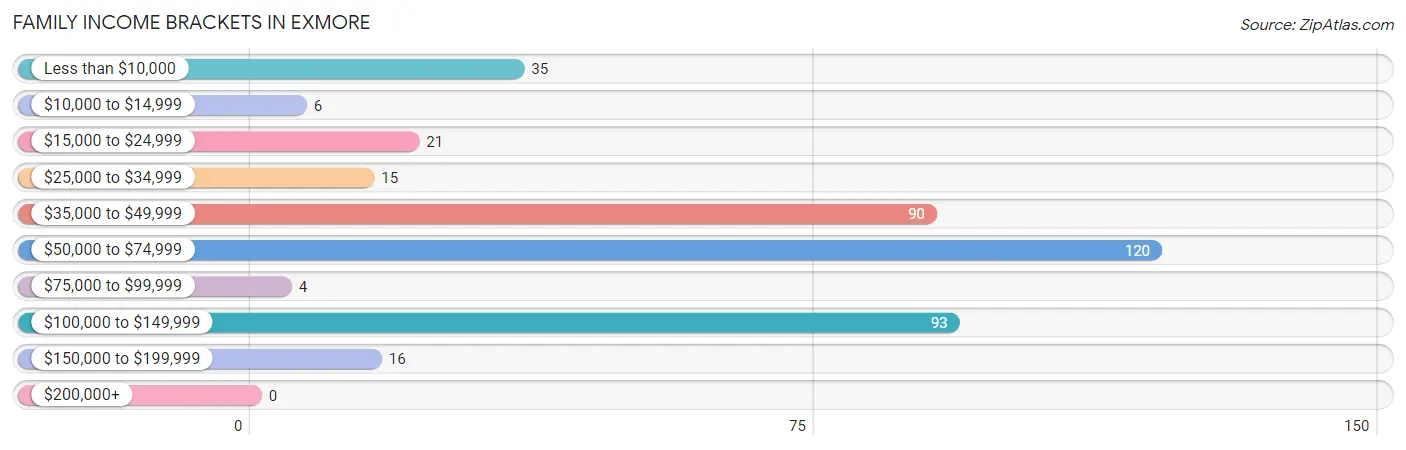
| Income Bracket | # Families | % Families |
| Less than $10,000 | 35 | 8.8% |
| $10,000 to $14,999 | 6 | 1.5% |
| $15,000 to $24,999 | 21 | 5.3% |
| $25,000 to $34,999 | 15 | 3.8% |
| $35,000 to $49,999 | 90 | 22.5% |
| $50,000 to $74,999 | 120 | 30.0% |
| $75,000 to $99,999 | 4 | 1.0% |
| $100,000 to $149,999 | 93 | 23.3% |
| $150,000 to $199,999 | 16 | 4.0% |
| $200,000+ | 0 | 0.0% |
Family Income by Famaliy Size in Exmore
4-person families (111 | 27.8%) account for the highest median family income in Exmore with $100,260 per family, while 2-person families (134 | 33.5%) have the highest median income of $25,625 per family member.
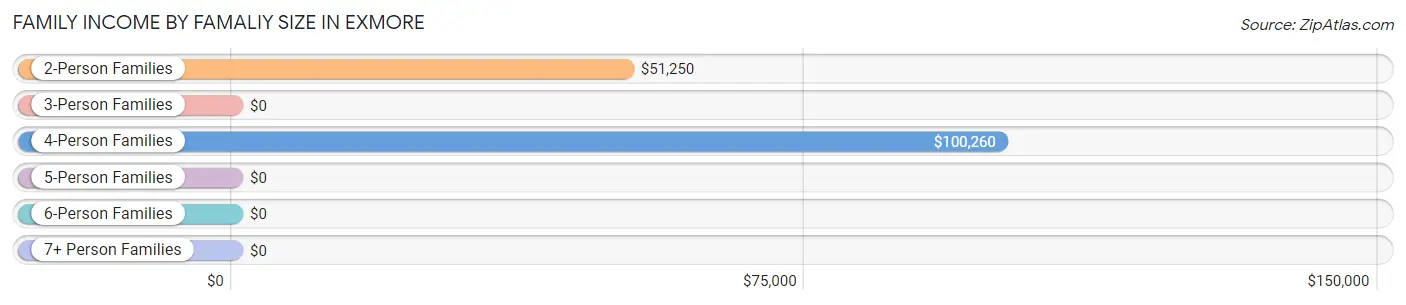
| Income Bracket | # Families | Median Income |
| 2-Person Families | 134 (33.5%) | $51,250 |
| 3-Person Families | 88 (22.0%) | $0 |
| 4-Person Families | 111 (27.8%) | $100,260 |
| 5-Person Families | 59 (14.7%) | $0 |
| 6-Person Families | 8 (2.0%) | $0 |
| 7+ Person Families | 0 (0.0%) | $0 |
| Total | 400 (100.0%) | $54,926 |
Family Income by Number of Earners in Exmore
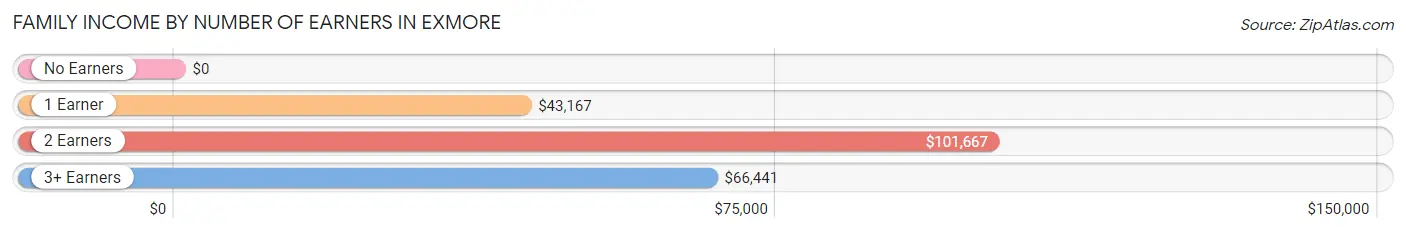
| Number of Earners | # Families | Median Income |
| No Earners | 54 (13.5%) | $0 |
| 1 Earner | 174 (43.5%) | $43,167 |
| 2 Earners | 104 (26.0%) | $101,667 |
| 3+ Earners | 68 (17.0%) | $66,441 |
| Total | 400 (100.0%) | $54,926 |
Household Income in Exmore
Household Income Brackets in Exmore
With 141 households falling in the category, the $50,000 to $74,999 income range is the most frequent in Exmore, accounting for 19.9% of all households.
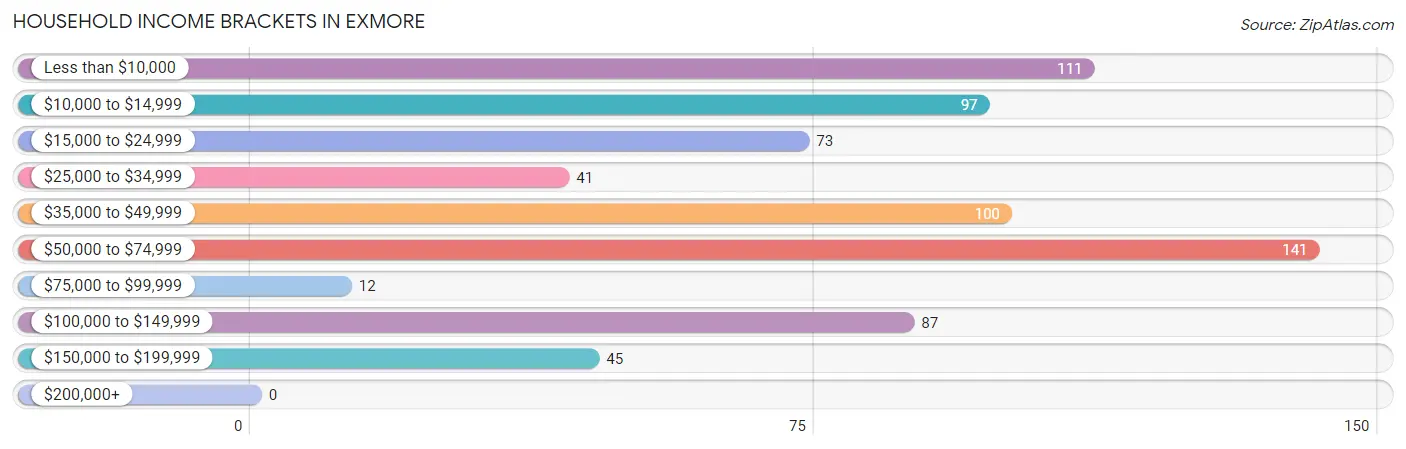
| Income Bracket | # Households | % Households |
| Less than $10,000 | 111 | 15.7% |
| $10,000 to $14,999 | 97 | 13.7% |
| $15,000 to $24,999 | 73 | 10.3% |
| $25,000 to $34,999 | 41 | 5.8% |
| $35,000 to $49,999 | 100 | 14.1% |
| $50,000 to $74,999 | 141 | 19.9% |
| $75,000 to $99,999 | 12 | 1.7% |
| $100,000 to $149,999 | 87 | 12.3% |
| $150,000 to $199,999 | 45 | 6.4% |
| $200,000+ | 0 | 0.0% |
Household Income by Householder Age in Exmore
The median household income in Exmore is $39,293, with the highest median household income of $53,681 found in the 45 to 64 years age bracket for the primary householder. A total of 262 households (37.1%) fall into this category. Meanwhile, the 15 to 24 years age bracket for the primary householder has the lowest median household income of $0, with 7 households (1.0%) in this group.
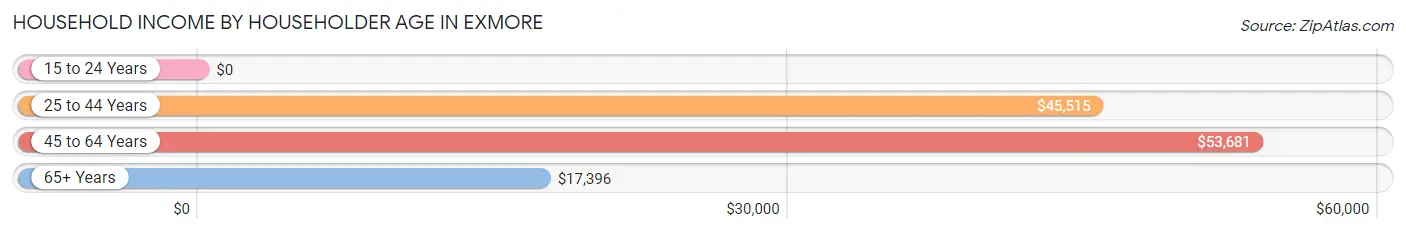
| Income Bracket | # Households | Median Income |
| 15 to 24 Years | 7 (1.0%) | $0 |
| 25 to 44 Years | 257 (36.3%) | $45,515 |
| 45 to 64 Years | 262 (37.1%) | $53,681 |
| 65+ Years | 181 (25.6%) | $17,396 |
| Total | 707 (100.0%) | $39,293 |
Poverty in Exmore
Income Below Poverty by Sex and Age in Exmore
With 24.1% poverty level for males and 28.1% for females among the residents of Exmore, under 5 year old males and 5 year old females are the most vulnerable to poverty, with 38 males (97.4%) and 36 females (87.8%) in their respective age groups living below the poverty level.
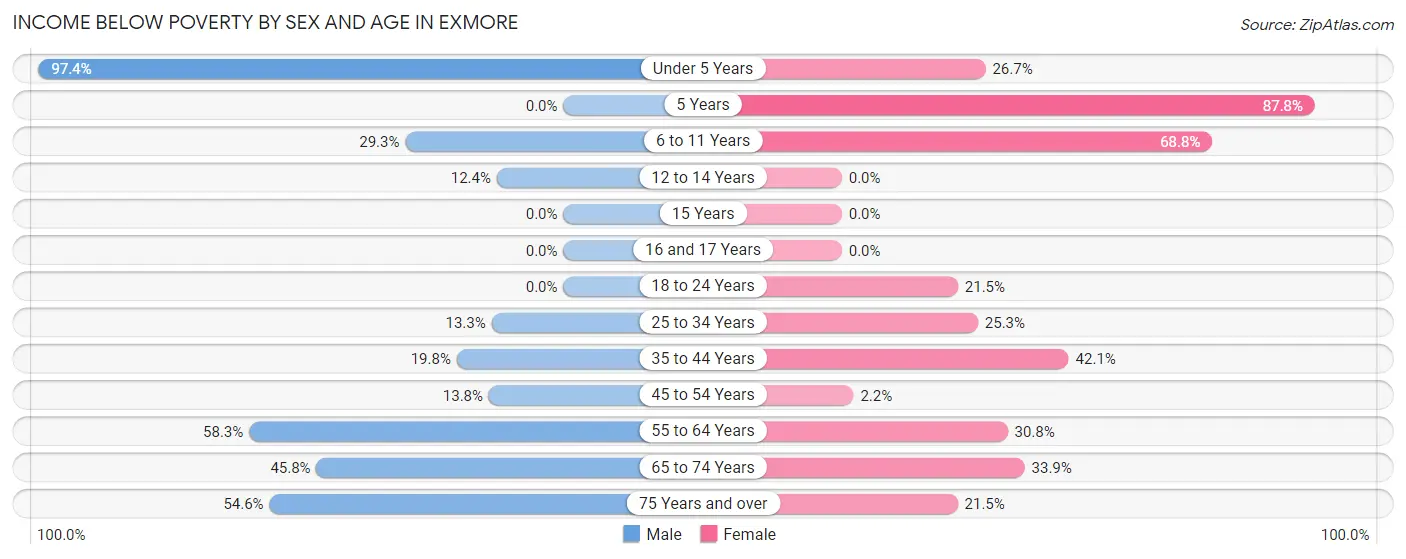
| Age Bracket | Male | Female |
| Under 5 Years | 38 (97.4%) | 24 (26.7%) |
| 5 Years | 0 (0.0%) | 36 (87.8%) |
| 6 to 11 Years | 22 (29.3%) | 11 (68.8%) |
| 12 to 14 Years | 10 (12.3%) | 0 (0.0%) |
| 15 Years | 0 (0.0%) | 0 (0.0%) |
| 16 and 17 Years | 0 (0.0%) | 0 (0.0%) |
| 18 to 24 Years | 0 (0.0%) | 28 (21.5%) |
| 25 to 34 Years | 14 (13.3%) | 24 (25.3%) |
| 35 to 44 Years | 19 (19.8%) | 56 (42.1%) |
| 45 to 54 Years | 26 (13.8%) | 2 (2.2%) |
| 55 to 64 Years | 35 (58.3%) | 24 (30.8%) |
| 65 to 74 Years | 33 (45.8%) | 19 (33.9%) |
| 75 Years and over | 12 (54.5%) | 23 (21.5%) |
| Total | 209 (24.1%) | 247 (28.1%) |
Income Above Poverty by Sex and Age in Exmore
According to the poverty statistics in Exmore, males aged 5 years and females aged 12 to 14 years are the age groups that are most secure financially, with 100.0% of males and 100.0% of females in these age groups living above the poverty line.
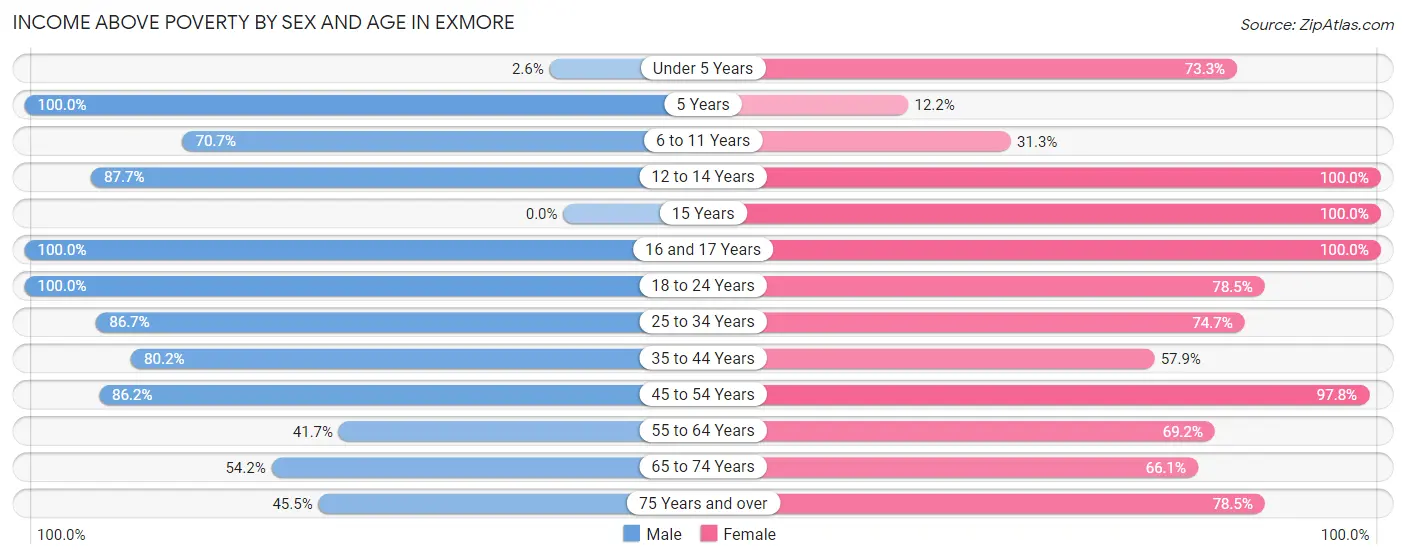
| Age Bracket | Male | Female |
| Under 5 Years | 1 (2.6%) | 66 (73.3%) |
| 5 Years | 8 (100.0%) | 5 (12.2%) |
| 6 to 11 Years | 53 (70.7%) | 5 (31.2%) |
| 12 to 14 Years | 71 (87.6%) | 5 (100.0%) |
| 15 Years | 0 (0.0%) | 7 (100.0%) |
| 16 and 17 Years | 81 (100.0%) | 28 (100.0%) |
| 18 to 24 Years | 39 (100.0%) | 102 (78.5%) |
| 25 to 34 Years | 91 (86.7%) | 71 (74.7%) |
| 35 to 44 Years | 77 (80.2%) | 77 (57.9%) |
| 45 to 54 Years | 162 (86.2%) | 90 (97.8%) |
| 55 to 64 Years | 25 (41.7%) | 54 (69.2%) |
| 65 to 74 Years | 39 (54.2%) | 37 (66.1%) |
| 75 Years and over | 10 (45.5%) | 84 (78.5%) |
| Total | 657 (75.9%) | 631 (71.9%) |
Income Below Poverty Among Married-Couple Families in Exmore
The poverty statistics for married-couple families in Exmore show that 10.4% or 22 of the total 212 families live below the poverty line. Families with no children have the highest poverty rate of 17.1%, comprising of 12 families. On the other hand, families with 1 or 2 children have the lowest poverty rate of 7.0%, which includes 10 families.
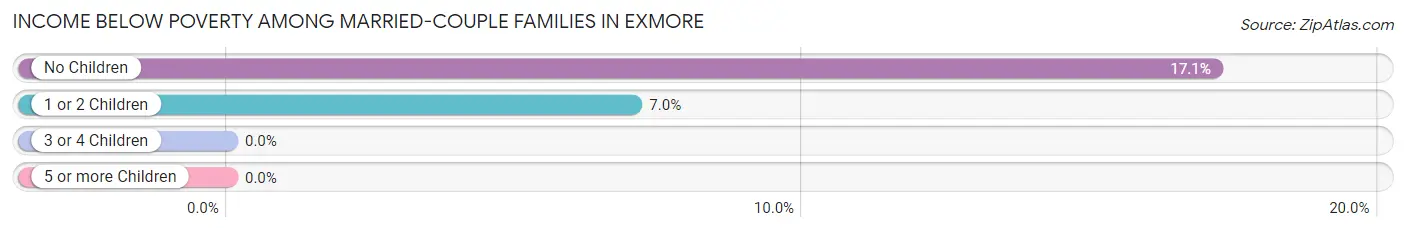
| Children | Above Poverty | Below Poverty |
| No Children | 58 (82.9%) | 12 (17.1%) |
| 1 or 2 Children | 132 (93.0%) | 10 (7.0%) |
| 3 or 4 Children | 0 (0.0%) | 0 (0.0%) |
| 5 or more Children | 0 (0.0%) | 0 (0.0%) |
| Total | 190 (89.6%) | 22 (10.4%) |
Income Below Poverty Among Single-Parent Households in Exmore
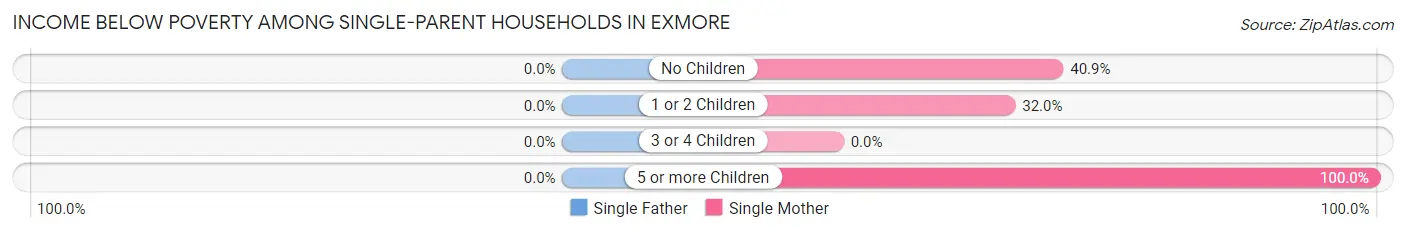
| Children | Single Father | Single Mother |
| No Children | 0 (0.0%) | 9 (40.9%) |
| 1 or 2 Children | 0 (0.0%) | 31 (32.0%) |
| 3 or 4 Children | 0 (0.0%) | 0 (0.0%) |
| 5 or more Children | 0 (0.0%) | 8 (100.0%) |
| Total | 0 (0.0%) | 48 (37.8%) |
Income Below Poverty Among Married-Couple vs Single-Parent Households in Exmore
The poverty data for Exmore shows that 22 of the married-couple family households (10.4%) and 48 of the single-parent households (25.5%) are living below the poverty level. Within the married-couple family households, those with no children have the highest poverty rate, with 12 households (17.1%) falling below the poverty line. Among the single-parent households, those with 5 or more children have the highest poverty rate, with 8 household (100.0%) living below poverty.
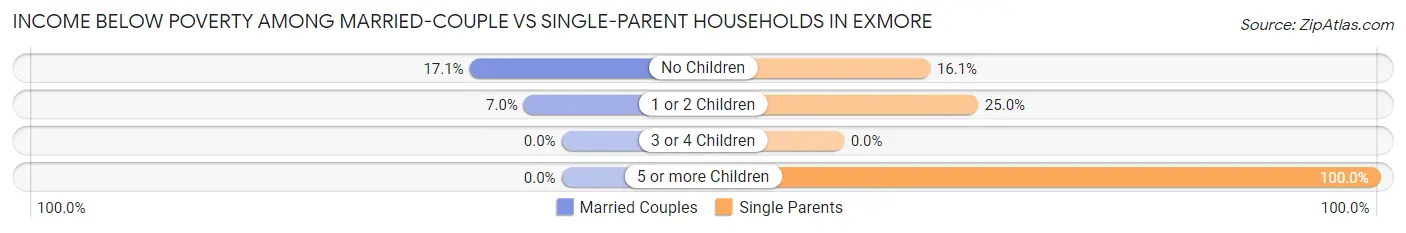
| Children | Married-Couple Families | Single-Parent Households |
| No Children | 12 (17.1%) | 9 (16.1%) |
| 1 or 2 Children | 10 (7.0%) | 31 (25.0%) |
| 3 or 4 Children | 0 (0.0%) | 0 (0.0%) |
| 5 or more Children | 0 (0.0%) | 8 (100.0%) |
| Total | 22 (10.4%) | 48 (25.5%) |
Race in Exmore
The most populous races in Exmore are White / Caucasian (730 | 41.9%), Black / African American (713 | 40.9%), and Hispanic or Latino (291 | 16.7%).
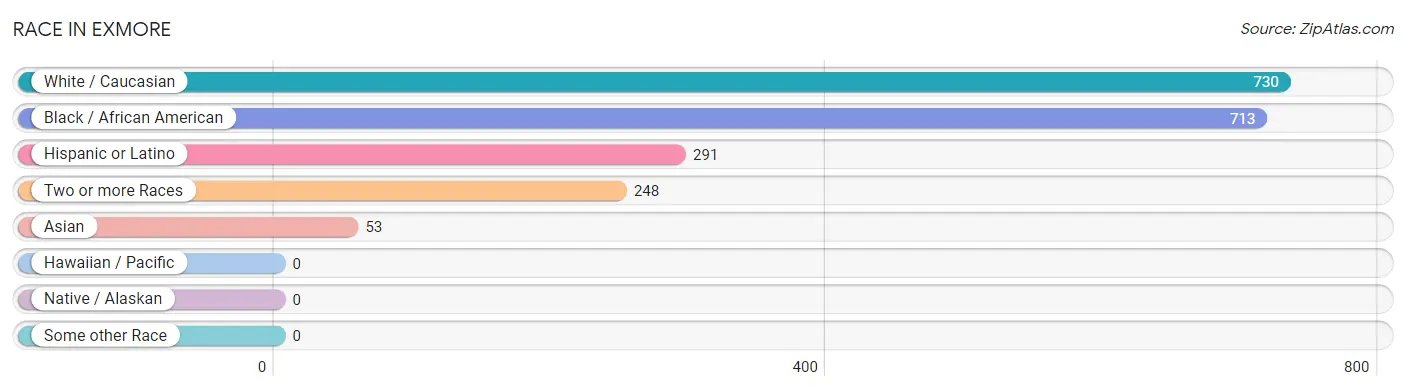
| Race | # Population | % Population |
| Asian | 53 | 3.0% |
| Black / African American | 713 | 40.9% |
| Hawaiian / Pacific | 0 | 0.0% |
| Hispanic or Latino | 291 | 16.7% |
| Native / Alaskan | 0 | 0.0% |
| White / Caucasian | 730 | 41.9% |
| Two or more Races | 248 | 14.2% |
| Some other Race | 0 | 0.0% |
| Total | 1,744 | 100.0% |
Ancestry in Exmore
The most populous ancestries reported in Exmore are American (1,114 | 63.9%), Central American (186 | 10.7%), Guatemalan (186 | 10.7%), Mexican (100 | 5.7%), and Japanese (53 | 3.0%), together accounting for 94.0% of all Exmore residents.
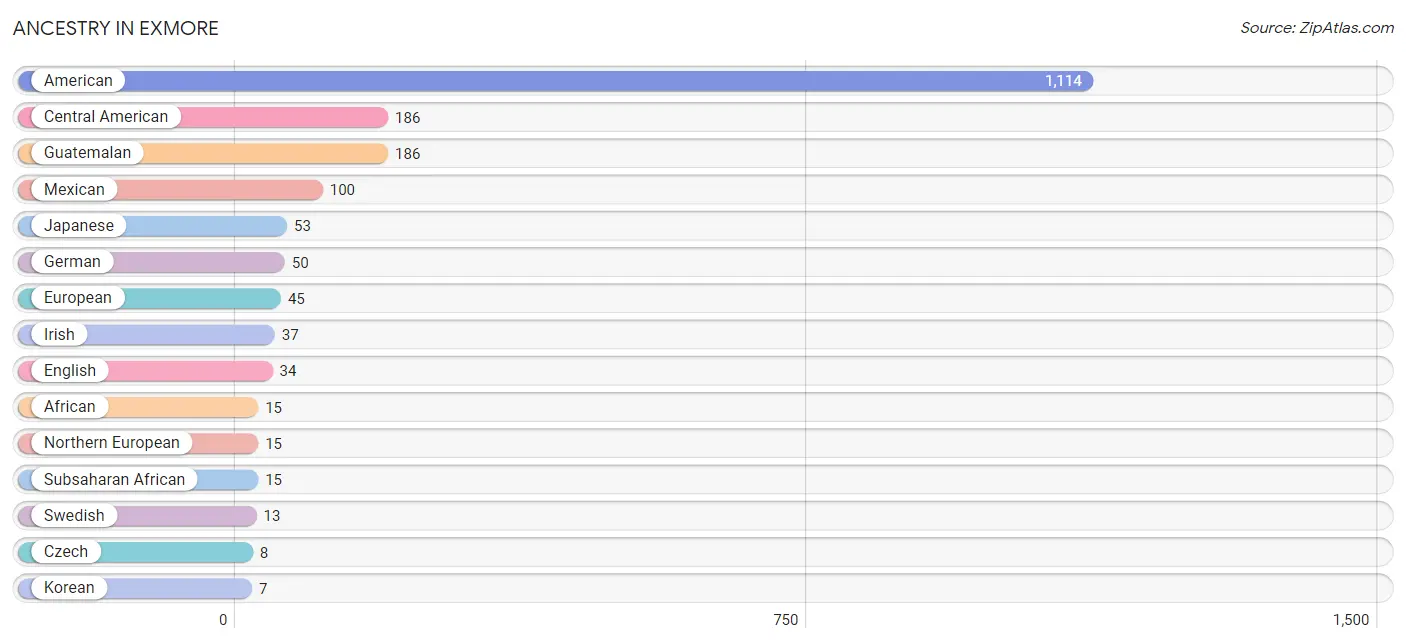
| Ancestry | # Population | % Population |
| African | 15 | 0.9% |
| American | 1,114 | 63.9% |
| Central American | 186 | 10.7% |
| Czech | 8 | 0.5% |
| Danish | 3 | 0.2% |
| Dominican | 5 | 0.3% |
| English | 34 | 1.9% |
| European | 45 | 2.6% |
| French | 5 | 0.3% |
| German | 50 | 2.9% |
| Guatemalan | 186 | 10.7% |
| Irish | 37 | 2.1% |
| Italian | 6 | 0.3% |
| Jamaican | 5 | 0.3% |
| Japanese | 53 | 3.0% |
| Korean | 7 | 0.4% |
| Mexican | 100 | 5.7% |
| Northern European | 15 | 0.9% |
| Polish | 3 | 0.2% |
| Scotch-Irish | 3 | 0.2% |
| Subsaharan African | 15 | 0.9% |
| Swedish | 13 | 0.7% | View All 22 Rows |
Immigrants in Exmore
The most numerous immigrant groups reported in Exmore came from Latin America (159 | 9.1%), Central America (149 | 8.5%), Guatemala (140 | 8.0%), Asia (60 | 3.4%), and South Eastern Asia (41 | 2.4%), together accounting for 31.5% of all Exmore residents.
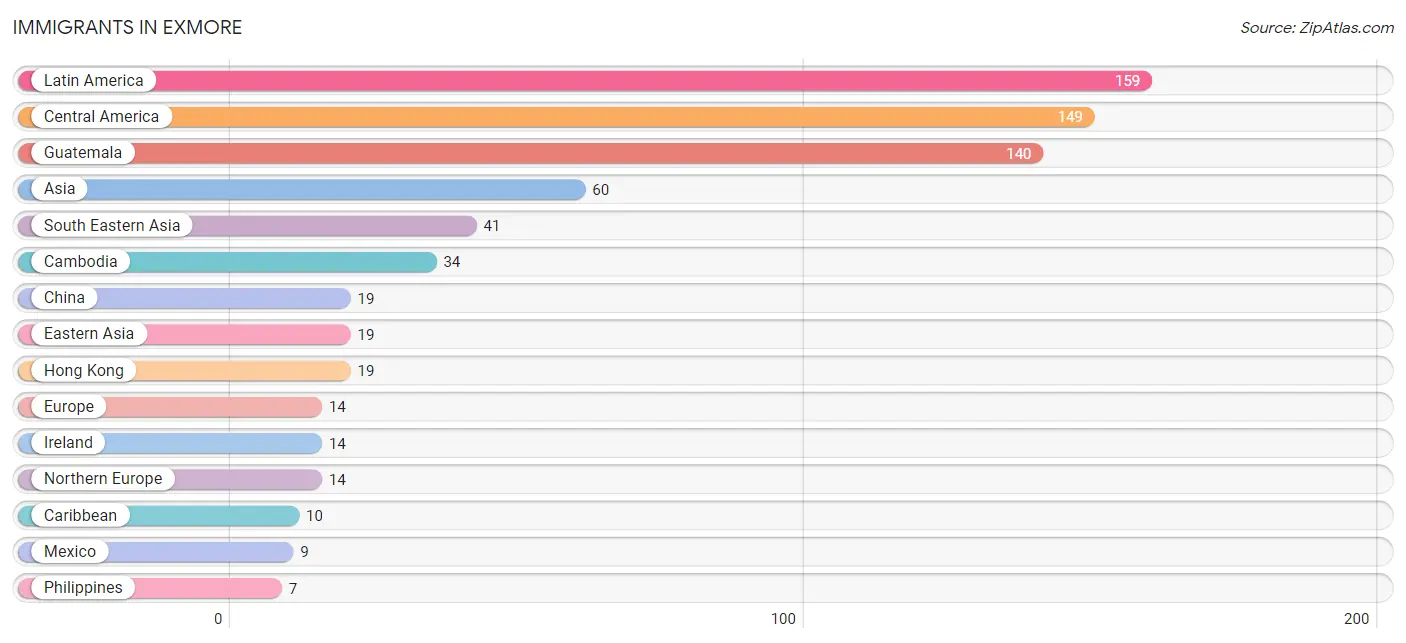
| Immigration Origin | # Population | % Population |
| Asia | 60 | 3.4% |
| Cambodia | 34 | 1.9% |
| Caribbean | 10 | 0.6% |
| Central America | 149 | 8.5% |
| China | 19 | 1.1% |
| Dominican Republic | 5 | 0.3% |
| Eastern Asia | 19 | 1.1% |
| Europe | 14 | 0.8% |
| Guatemala | 140 | 8.0% |
| Hong Kong | 19 | 1.1% |
| Ireland | 14 | 0.8% |
| Jamaica | 5 | 0.3% |
| Latin America | 159 | 9.1% |
| Mexico | 9 | 0.5% |
| Northern Europe | 14 | 0.8% |
| Philippines | 7 | 0.4% |
| South Eastern Asia | 41 | 2.4% | View All 17 Rows |
Sex and Age in Exmore
Sex and Age in Exmore
The most populous age groups in Exmore are 10 to 14 Years (107 | 12.4%) for men and 15 to 19 Years (136 | 15.5%) for women.
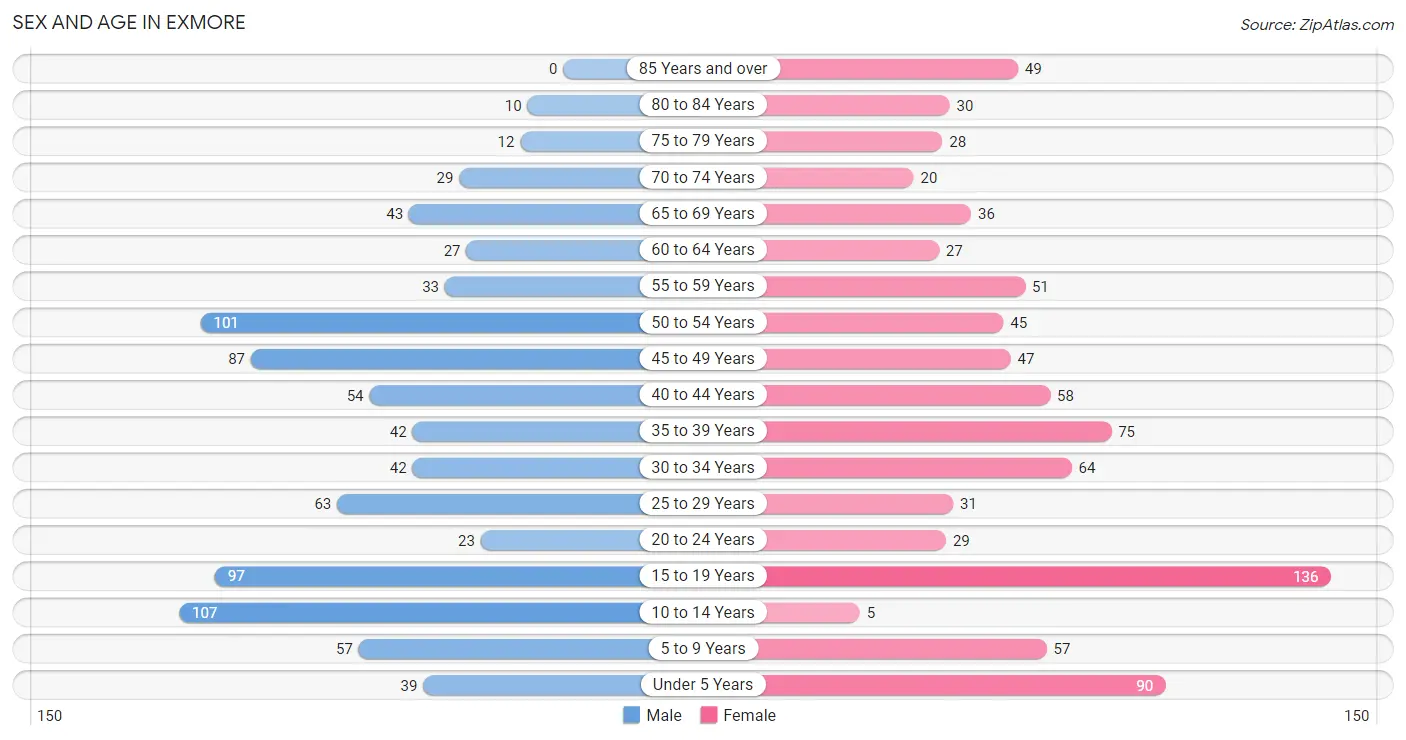
| Age Bracket | Male | Female |
| Under 5 Years | 39 (4.5%) | 90 (10.2%) |
| 5 to 9 Years | 57 (6.6%) | 57 (6.5%) |
| 10 to 14 Years | 107 (12.4%) | 5 (0.6%) |
| 15 to 19 Years | 97 (11.2%) | 136 (15.5%) |
| 20 to 24 Years | 23 (2.7%) | 29 (3.3%) |
| 25 to 29 Years | 63 (7.3%) | 31 (3.5%) |
| 30 to 34 Years | 42 (4.9%) | 64 (7.3%) |
| 35 to 39 Years | 42 (4.9%) | 75 (8.5%) |
| 40 to 44 Years | 54 (6.2%) | 58 (6.6%) |
| 45 to 49 Years | 87 (10.1%) | 47 (5.3%) |
| 50 to 54 Years | 101 (11.7%) | 45 (5.1%) |
| 55 to 59 Years | 33 (3.8%) | 51 (5.8%) |
| 60 to 64 Years | 27 (3.1%) | 27 (3.1%) |
| 65 to 69 Years | 43 (5.0%) | 36 (4.1%) |
| 70 to 74 Years | 29 (3.4%) | 20 (2.3%) |
| 75 to 79 Years | 12 (1.4%) | 28 (3.2%) |
| 80 to 84 Years | 10 (1.1%) | 30 (3.4%) |
| 85 Years and over | 0 (0.0%) | 49 (5.6%) |
| Total | 866 (100.0%) | 878 (100.0%) |
Families and Households in Exmore
Median Family Size in Exmore
The median family size in Exmore is 3.40 persons per family, with single female/mother families (127 | 31.8%) accounting for the largest median family size of 3.83 persons per family. On the other hand, single male/father families (61 | 15.2%) represent the smallest median family size with 2.21 persons per family.
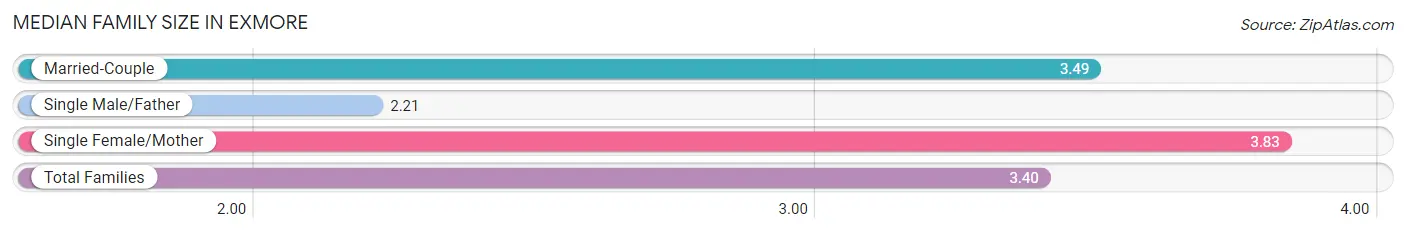
| Family Type | # Families | Family Size |
| Married-Couple | 212 (53.0%) | 3.49 |
| Single Male/Father | 61 (15.2%) | 2.21 |
| Single Female/Mother | 127 (31.8%) | 3.83 |
| Total Families | 400 (100.0%) | 3.40 |
Median Household Size in Exmore
The median household size in Exmore is 2.43 persons per household, with single female/mother households (127 | 18.0%) accounting for the largest median household size of 4 persons per household. non-family households (307 | 43.4%) represent the smallest median household size with 1.06 persons per household.
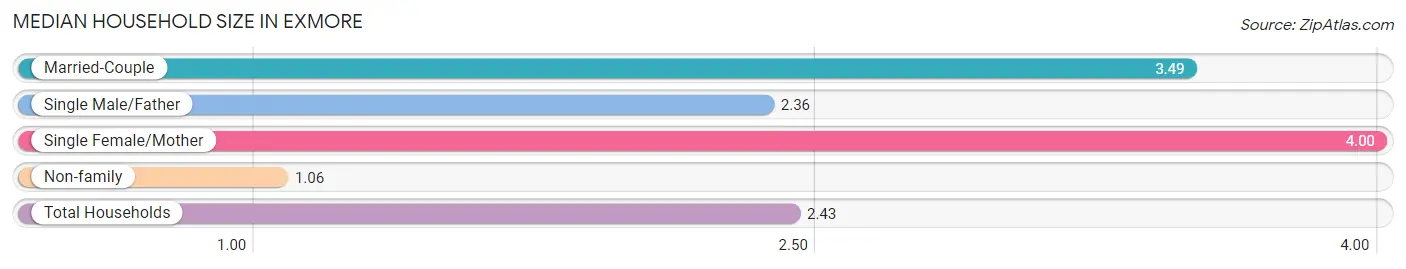
| Household Type | # Households | Household Size |
| Married-Couple | 212 (30.0%) | 3.49 |
| Single Male/Father | 61 (8.6%) | 2.36 |
| Single Female/Mother | 127 (18.0%) | 4.00 |
| Non-family | 307 (43.4%) | 1.06 |
| Total Households | 707 (100.0%) | 2.43 |
Household Size by Marriage Status in Exmore
Out of a total of 707 households in Exmore, 400 (56.6%) are family households, while 307 (43.4%) are nonfamily households. The most numerous type of family households are 2-person households, comprising 134, and the most common type of nonfamily households are 1-person households, comprising 288.
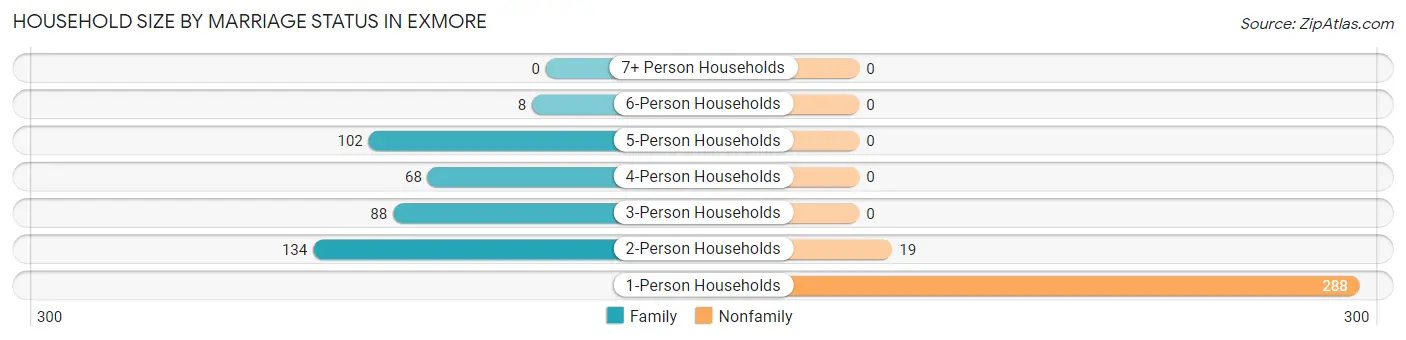
| Household Size | Family Households | Nonfamily Households |
| 1-Person Households | - | 288 (40.7%) |
| 2-Person Households | 134 (19.0%) | 19 (2.7%) |
| 3-Person Households | 88 (12.4%) | 0 (0.0%) |
| 4-Person Households | 68 (9.6%) | 0 (0.0%) |
| 5-Person Households | 102 (14.4%) | 0 (0.0%) |
| 6-Person Households | 8 (1.1%) | 0 (0.0%) |
| 7+ Person Households | 0 (0.0%) | 0 (0.0%) |
| Total | 400 (56.6%) | 307 (43.4%) |
Female Fertility in Exmore
Fertility by Age in Exmore
Average fertility rate in Exmore is 54.0 births per 1,000 women. Women in the age bracket of 20 to 34 years have the highest fertility rate with 129.0 births per 1,000 women. Women in the age bracket of 20 to 34 years acount for 66.7% of all women with births.
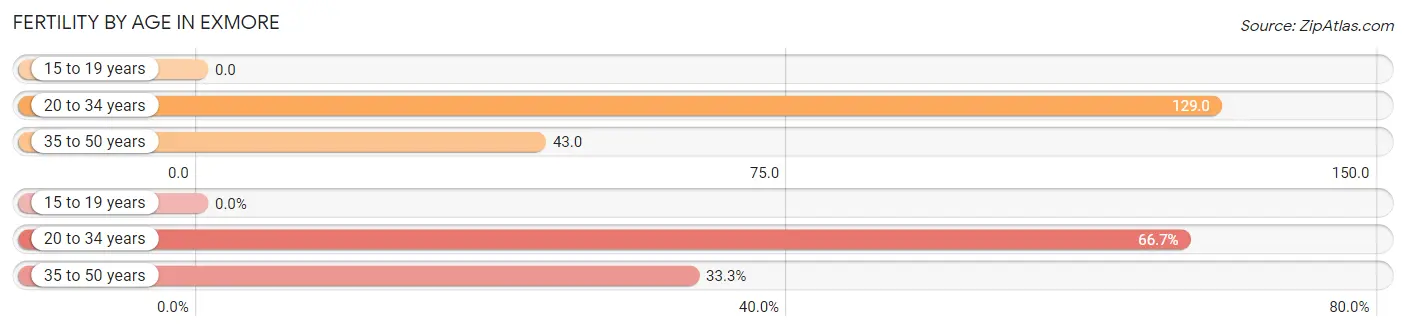
| Age Bracket | Women with Births | Births / 1,000 Women |
| 15 to 19 years | 0 (0.0%) | 0.0 |
| 20 to 34 years | 16 (66.7%) | 129.0 |
| 35 to 50 years | 8 (33.3%) | 43.0 |
| Total | 24 (100.0%) | 54.0 |
Fertility by Age by Marriage Status in Exmore
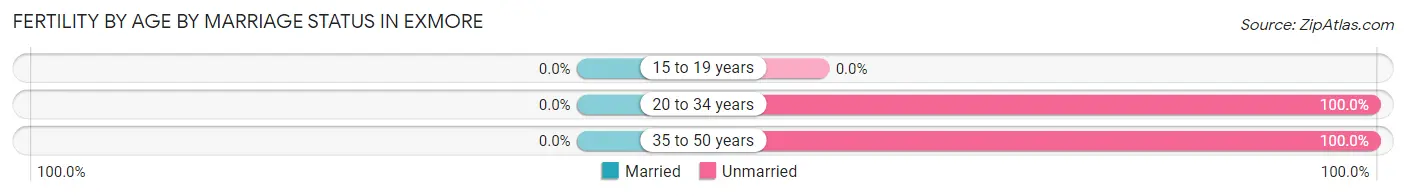
| Age Bracket | Married | Unmarried |
| 15 to 19 years | 0 (0.0%) | 0 (0.0%) |
| 20 to 34 years | 0 (0.0%) | 16 (100.0%) |
| 35 to 50 years | 0 (0.0%) | 8 (100.0%) |
| Total | 0 (0.0%) | 24 (100.0%) |
Fertility by Education in Exmore
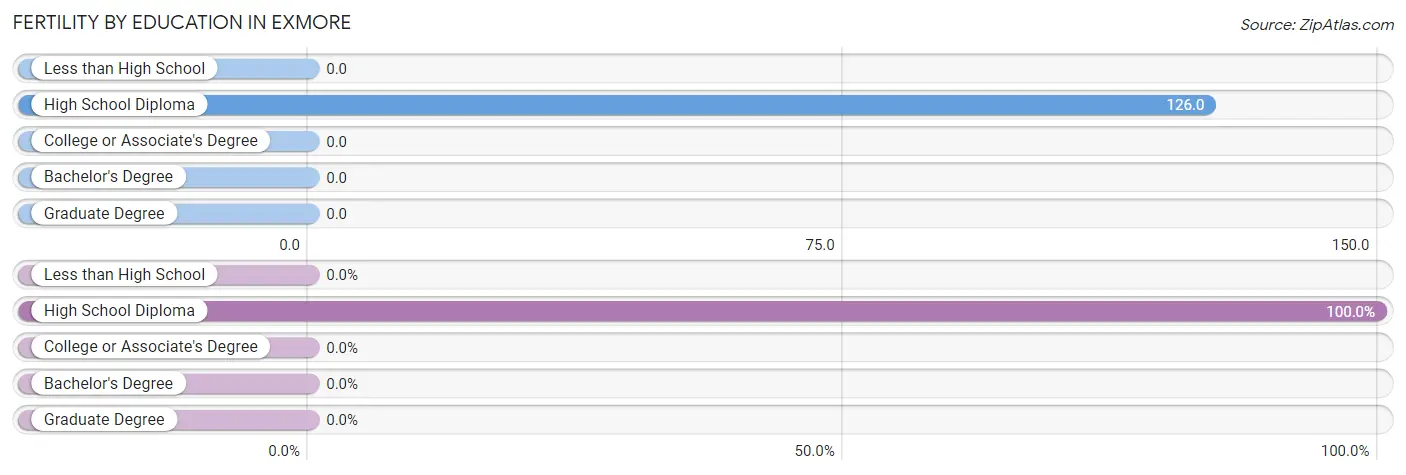
| Educational Attainment | Women with Births | Births / 1,000 Women |
| Less than High School | 0 (0.0%) | 0.0 |
| High School Diploma | 24 (100.0%) | 126.0 |
| College or Associate's Degree | 0 (0.0%) | 0.0 |
| Bachelor's Degree | 0 (0.0%) | 0.0 |
| Graduate Degree | 0 (0.0%) | 0.0 |
| Total | 24 (100.0%) | 54.0 |
Fertility by Education by Marriage Status in Exmore
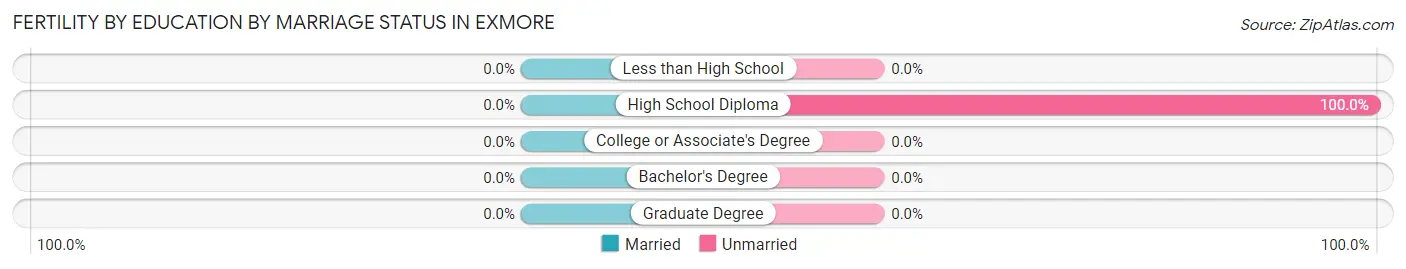
| Educational Attainment | Married | Unmarried |
| Less than High School | 0 (0.0%) | 0 (0.0%) |
| High School Diploma | 0 (0.0%) | 24 (100.0%) |
| College or Associate's Degree | 0 (0.0%) | 0 (0.0%) |
| Bachelor's Degree | 0 (0.0%) | 0 (0.0%) |
| Graduate Degree | 0 (0.0%) | 0 (0.0%) |
| Total | 0 (0.0%) | 24 (100.0%) |
Employment Characteristics in Exmore
Employment by Class of Employer in Exmore
Among the 709 employed individuals in Exmore, private company employees (555 | 78.3%), local government employees (68 | 9.6%), and self-employed (incorporated) (37 | 5.2%) make up the most common classes of employment.
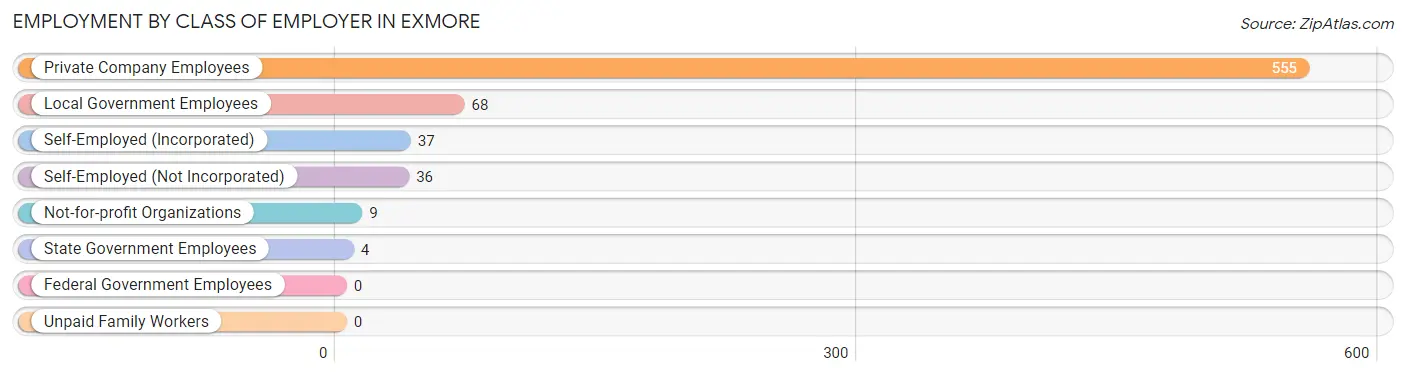
| Employer Class | # Employees | % Employees |
| Private Company Employees | 555 | 78.3% |
| Self-Employed (Incorporated) | 37 | 5.2% |
| Self-Employed (Not Incorporated) | 36 | 5.1% |
| Not-for-profit Organizations | 9 | 1.3% |
| Local Government Employees | 68 | 9.6% |
| State Government Employees | 4 | 0.6% |
| Federal Government Employees | 0 | 0.0% |
| Unpaid Family Workers | 0 | 0.0% |
| Total | 709 | 100.0% |
Employment Status by Age in Exmore
According to the labor force statistics for Exmore, out of the total population over 16 years of age (1,382), 56.2% or 777 individuals are in the labor force, with 6.7% or 52 of them unemployed. The age group with the highest labor force participation rate is 20 to 24 years, with 86.5% or 45 individuals in the labor force. Within the labor force, the 65 to 74 years age range has the highest percentage of unemployed individuals, with 91.7% or 11 of them being unemployed.
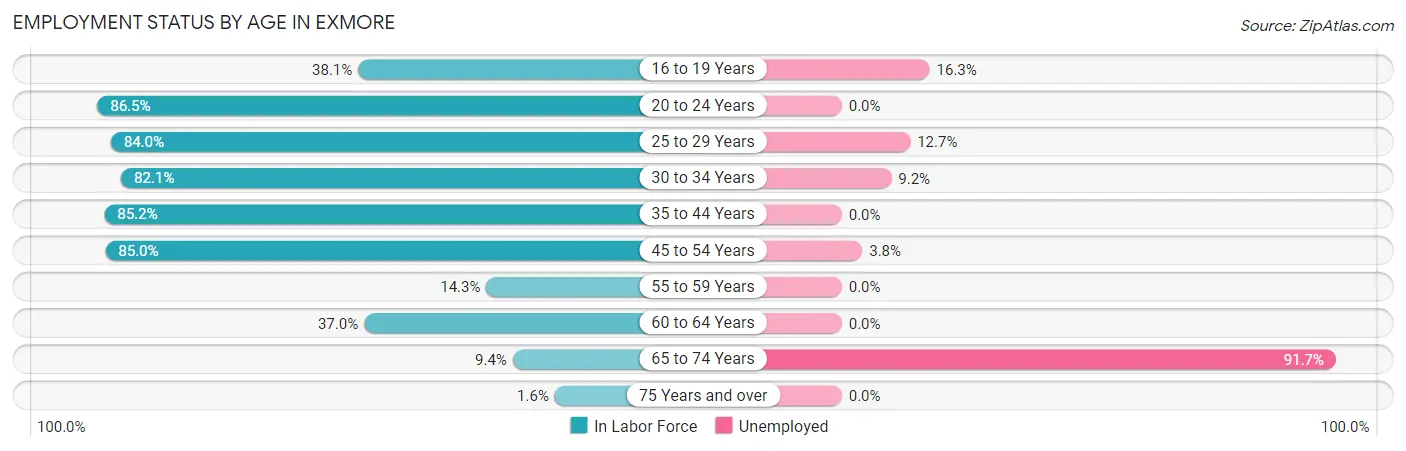
| Age Bracket | In Labor Force | Unemployed |
| 16 to 19 Years | 86 (38.1%) | 14 (16.3%) |
| 20 to 24 Years | 45 (86.5%) | 0 (0.0%) |
| 25 to 29 Years | 79 (84.0%) | 10 (12.7%) |
| 30 to 34 Years | 87 (82.1%) | 8 (9.2%) |
| 35 to 44 Years | 195 (85.2%) | 0 (0.0%) |
| 45 to 54 Years | 238 (85.0%) | 9 (3.8%) |
| 55 to 59 Years | 12 (14.3%) | 0 (0.0%) |
| 60 to 64 Years | 20 (37.0%) | 0 (0.0%) |
| 65 to 74 Years | 12 (9.4%) | 11 (91.7%) |
| 75 Years and over | 2 (1.6%) | 0 (0.0%) |
| Total | 777 (56.2%) | 52 (6.7%) |
Employment Status by Educational Attainment in Exmore
According to labor force statistics for Exmore, 74.5% of individuals (631) out of the total population between 25 and 64 years of age (847) are in the labor force, with 4.3% or 27 of them being unemployed. The group with the highest labor force participation rate are those with the educational attainment of bachelor's degree or higher, with 95.2% or 99 individuals in the labor force. Within the labor force, individuals with college / associate degree education have the highest percentage of unemployment, with 13.5% or 10 of them being unemployed.
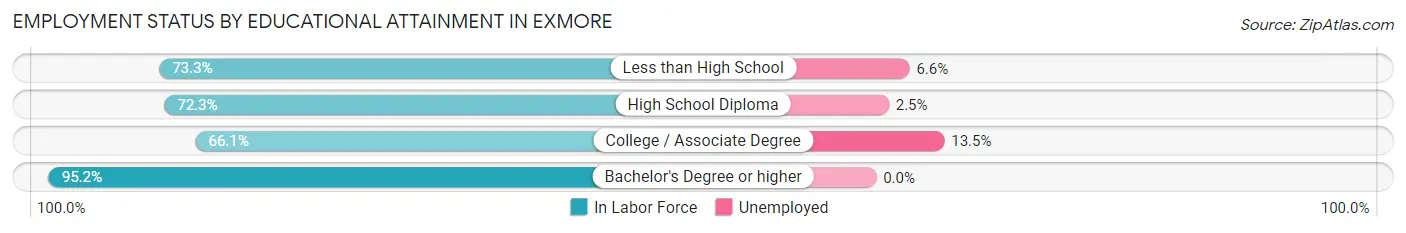
| Educational Attainment | In Labor Force | Unemployed |
| Less than High School | 137 (73.3%) | 12 (6.6%) |
| High School Diploma | 321 (72.3%) | 11 (2.5%) |
| College / Associate Degree | 74 (66.1%) | 15 (13.5%) |
| Bachelor's Degree or higher | 99 (95.2%) | 0 (0.0%) |
| Total | 631 (74.5%) | 36 (4.3%) |
Employment Occupations by Sex in Exmore
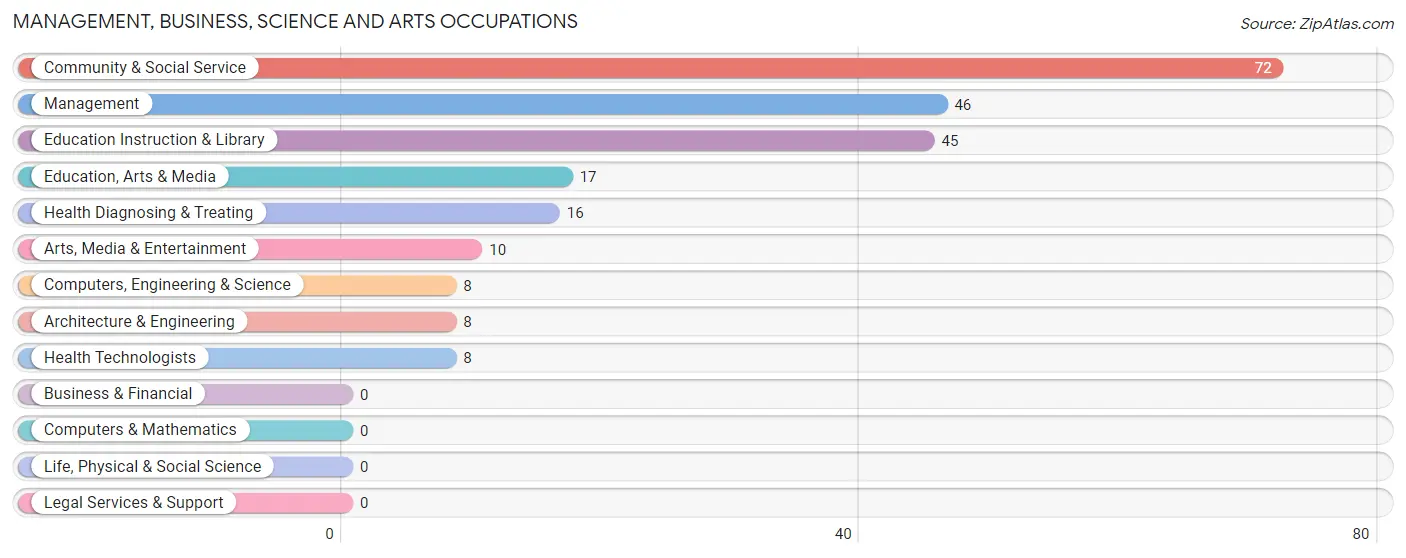
Management, Business, Science and Arts Occupations
The most common Management, Business, Science and Arts occupations in Exmore are Community & Social Service (72 | 9.9%), Management (46 | 6.4%), Education Instruction & Library (45 | 6.2%), Education, Arts & Media (17 | 2.4%), and Health Diagnosing & Treating (16 | 2.2%).
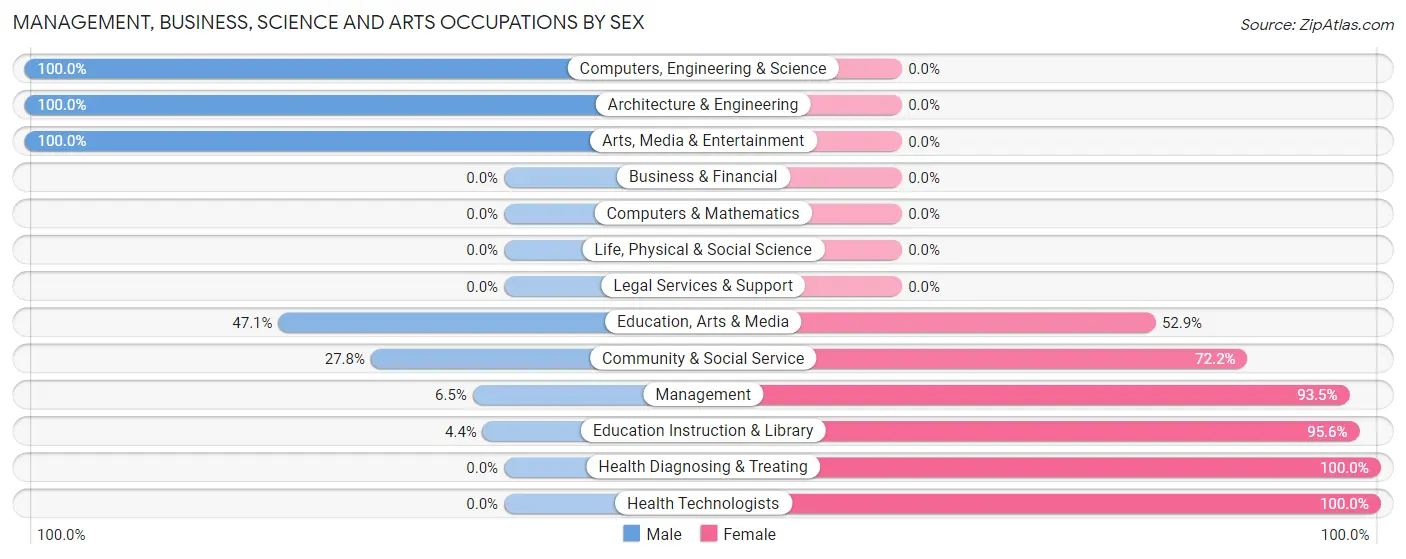
Management, Business, Science and Arts Occupations by Sex
Within the Management, Business, Science and Arts occupations in Exmore, the most male-oriented occupations are Computers, Engineering & Science (100.0%), Architecture & Engineering (100.0%), and Arts, Media & Entertainment (100.0%), while the most female-oriented occupations are Health Diagnosing & Treating (100.0%), Health Technologists (100.0%), and Education Instruction & Library (95.6%).
| Occupation | Male | Female |
| Management | 3 (6.5%) | 43 (93.5%) |
| Business & Financial | 0 (0.0%) | 0 (0.0%) |
| Computers, Engineering & Science | 8 (100.0%) | 0 (0.0%) |
| Computers & Mathematics | 0 (0.0%) | 0 (0.0%) |
| Architecture & Engineering | 8 (100.0%) | 0 (0.0%) |
| Life, Physical & Social Science | 0 (0.0%) | 0 (0.0%) |
| Community & Social Service | 20 (27.8%) | 52 (72.2%) |
| Education, Arts & Media | 8 (47.1%) | 9 (52.9%) |
| Legal Services & Support | 0 (0.0%) | 0 (0.0%) |
| Education Instruction & Library | 2 (4.4%) | 43 (95.6%) |
| Arts, Media & Entertainment | 10 (100.0%) | 0 (0.0%) |
| Health Diagnosing & Treating | 0 (0.0%) | 16 (100.0%) |
| Health Technologists | 0 (0.0%) | 8 (100.0%) |
| Total (Category) | 31 (21.8%) | 111 (78.2%) |
| Total (Overall) | 351 (48.5%) | 373 (51.5%) |
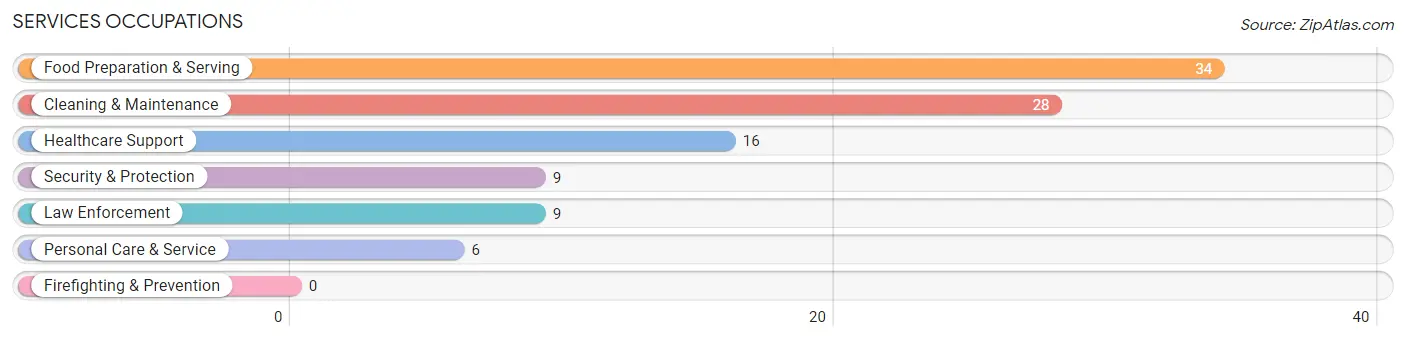
Services Occupations
The most common Services occupations in Exmore are Food Preparation & Serving (34 | 4.7%), Cleaning & Maintenance (28 | 3.9%), Healthcare Support (16 | 2.2%), Security & Protection (9 | 1.2%), and Law Enforcement (9 | 1.2%).
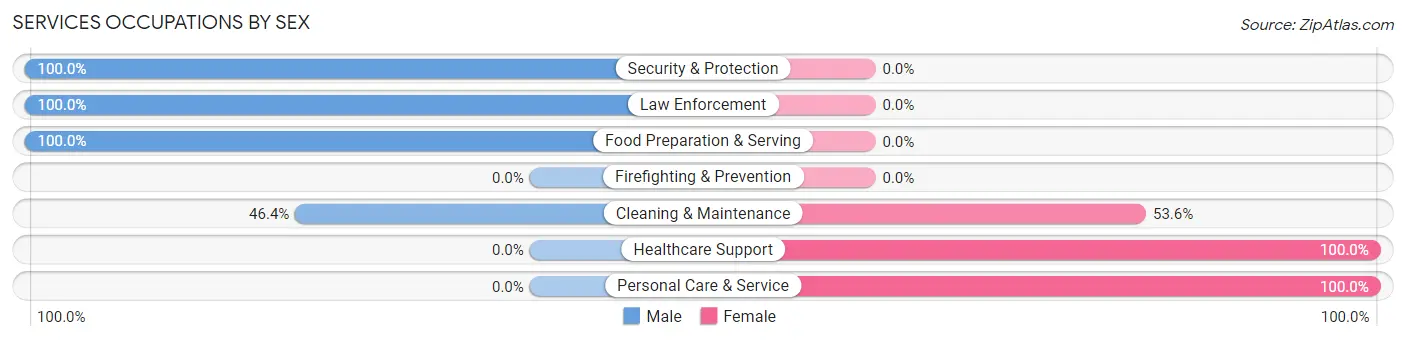
Services Occupations by Sex
Within the Services occupations in Exmore, the most male-oriented occupations are Security & Protection (100.0%), Law Enforcement (100.0%), and Food Preparation & Serving (100.0%), while the most female-oriented occupations are Healthcare Support (100.0%), Personal Care & Service (100.0%), and Cleaning & Maintenance (53.6%).
| Occupation | Male | Female |
| Healthcare Support | 0 (0.0%) | 16 (100.0%) |
| Security & Protection | 9 (100.0%) | 0 (0.0%) |
| Firefighting & Prevention | 0 (0.0%) | 0 (0.0%) |
| Law Enforcement | 9 (100.0%) | 0 (0.0%) |
| Food Preparation & Serving | 34 (100.0%) | 0 (0.0%) |
| Cleaning & Maintenance | 13 (46.4%) | 15 (53.6%) |
| Personal Care & Service | 0 (0.0%) | 6 (100.0%) |
| Total (Category) | 56 (60.2%) | 37 (39.8%) |
| Total (Overall) | 351 (48.5%) | 373 (51.5%) |
Sales and Office Occupations
The most common Sales and Office occupations in Exmore are Sales & Related (93 | 12.9%), and Office & Administration (22 | 3.0%).
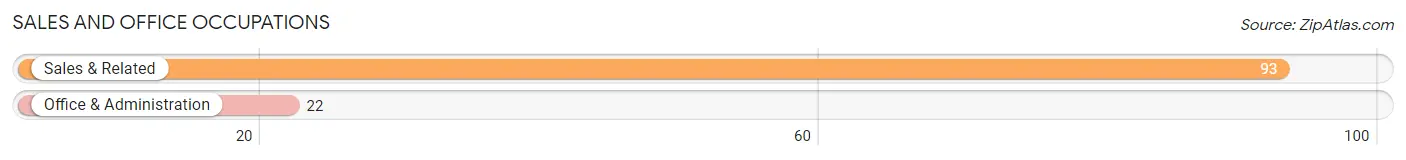
Sales and Office Occupations by Sex
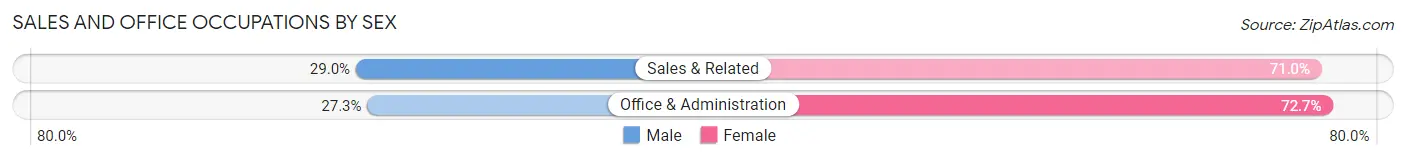
| Occupation | Male | Female |
| Sales & Related | 27 (29.0%) | 66 (71.0%) |
| Office & Administration | 6 (27.3%) | 16 (72.7%) |
| Total (Category) | 33 (28.7%) | 82 (71.3%) |
| Total (Overall) | 351 (48.5%) | 373 (51.5%) |
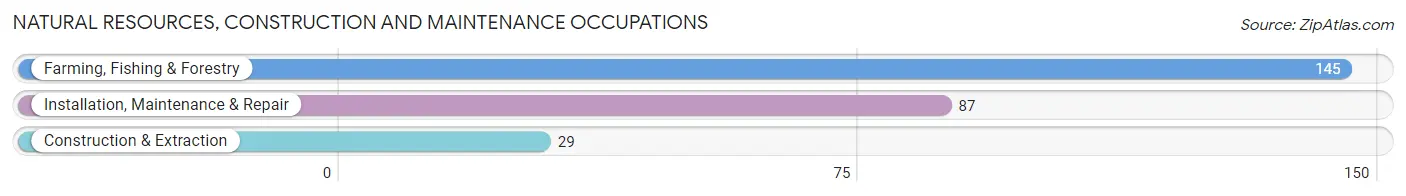
Natural Resources, Construction and Maintenance Occupations
The most common Natural Resources, Construction and Maintenance occupations in Exmore are Farming, Fishing & Forestry (145 | 20.0%), Installation, Maintenance & Repair (87 | 12.0%), and Construction & Extraction (29 | 4.0%).
Natural Resources, Construction and Maintenance Occupations by Sex
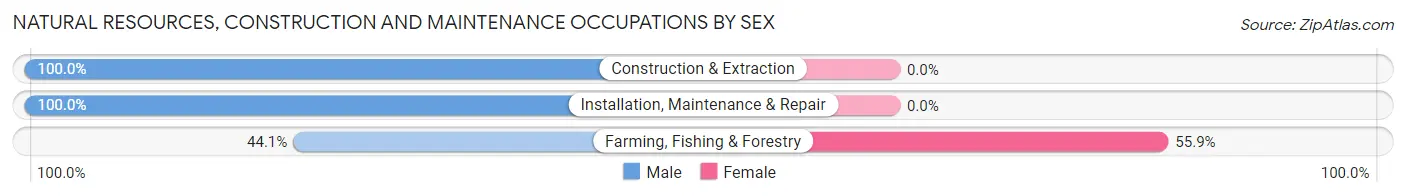
| Occupation | Male | Female |
| Farming, Fishing & Forestry | 64 (44.1%) | 81 (55.9%) |
| Construction & Extraction | 29 (100.0%) | 0 (0.0%) |
| Installation, Maintenance & Repair | 87 (100.0%) | 0 (0.0%) |
| Total (Category) | 180 (69.0%) | 81 (31.0%) |
| Total (Overall) | 351 (48.5%) | 373 (51.5%) |
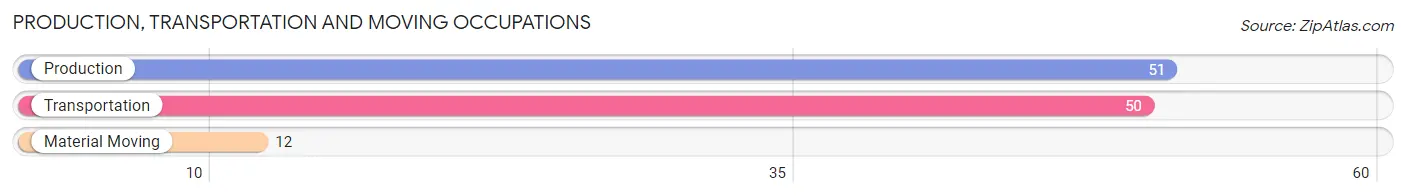
Production, Transportation and Moving Occupations
The most common Production, Transportation and Moving occupations in Exmore are Production (51 | 7.0%), Transportation (50 | 6.9%), and Material Moving (12 | 1.7%).
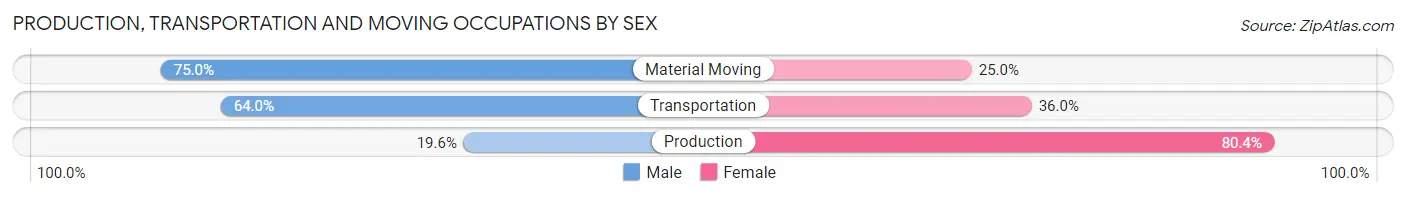
Production, Transportation and Moving Occupations by Sex
| Occupation | Male | Female |
| Production | 10 (19.6%) | 41 (80.4%) |
| Transportation | 32 (64.0%) | 18 (36.0%) |
| Material Moving | 9 (75.0%) | 3 (25.0%) |
| Total (Category) | 51 (45.1%) | 62 (54.9%) |
| Total (Overall) | 351 (48.5%) | 373 (51.5%) |
Employment Industries by Sex in Exmore
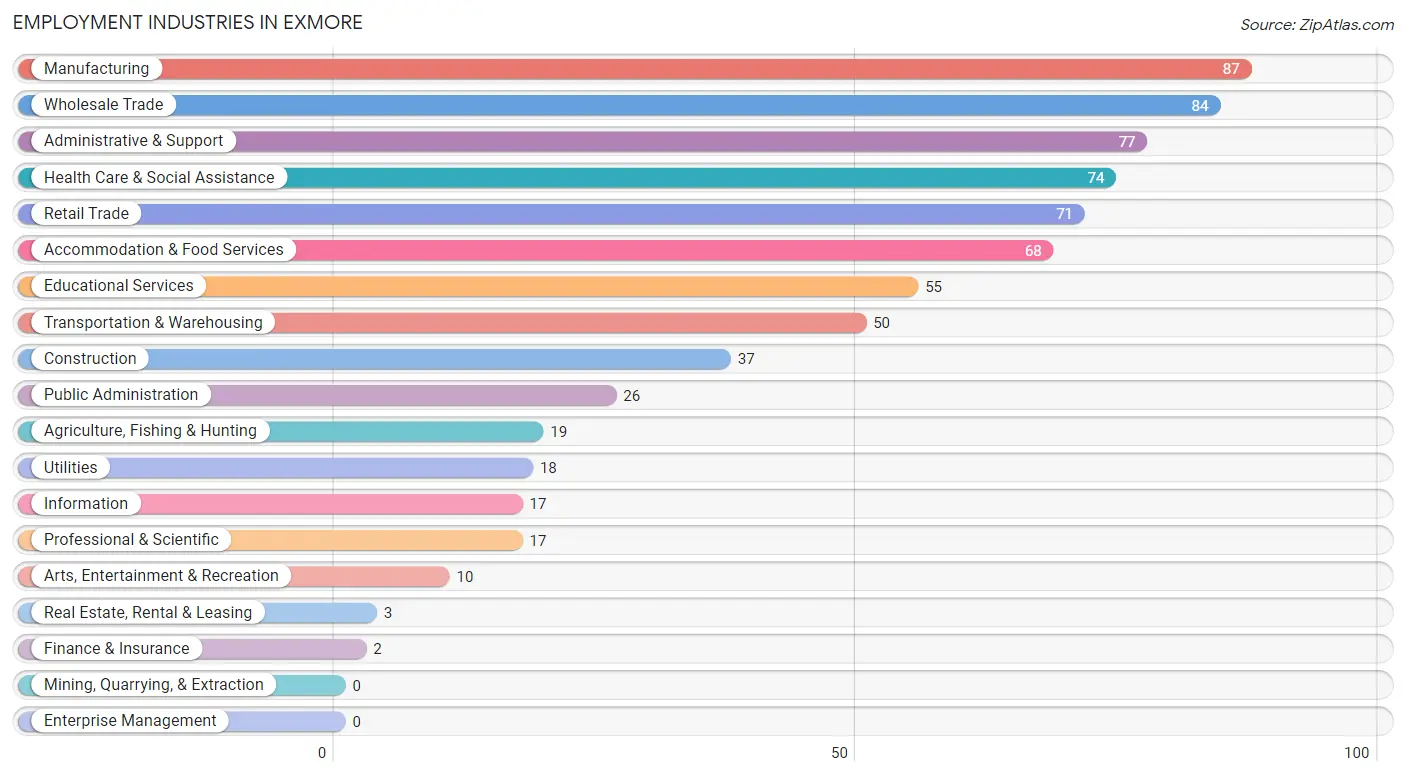
Employment Industries in Exmore
The major employment industries in Exmore include Manufacturing (87 | 12.0%), Wholesale Trade (84 | 11.6%), Administrative & Support (77 | 10.6%), Health Care & Social Assistance (74 | 10.2%), and Retail Trade (71 | 9.8%).
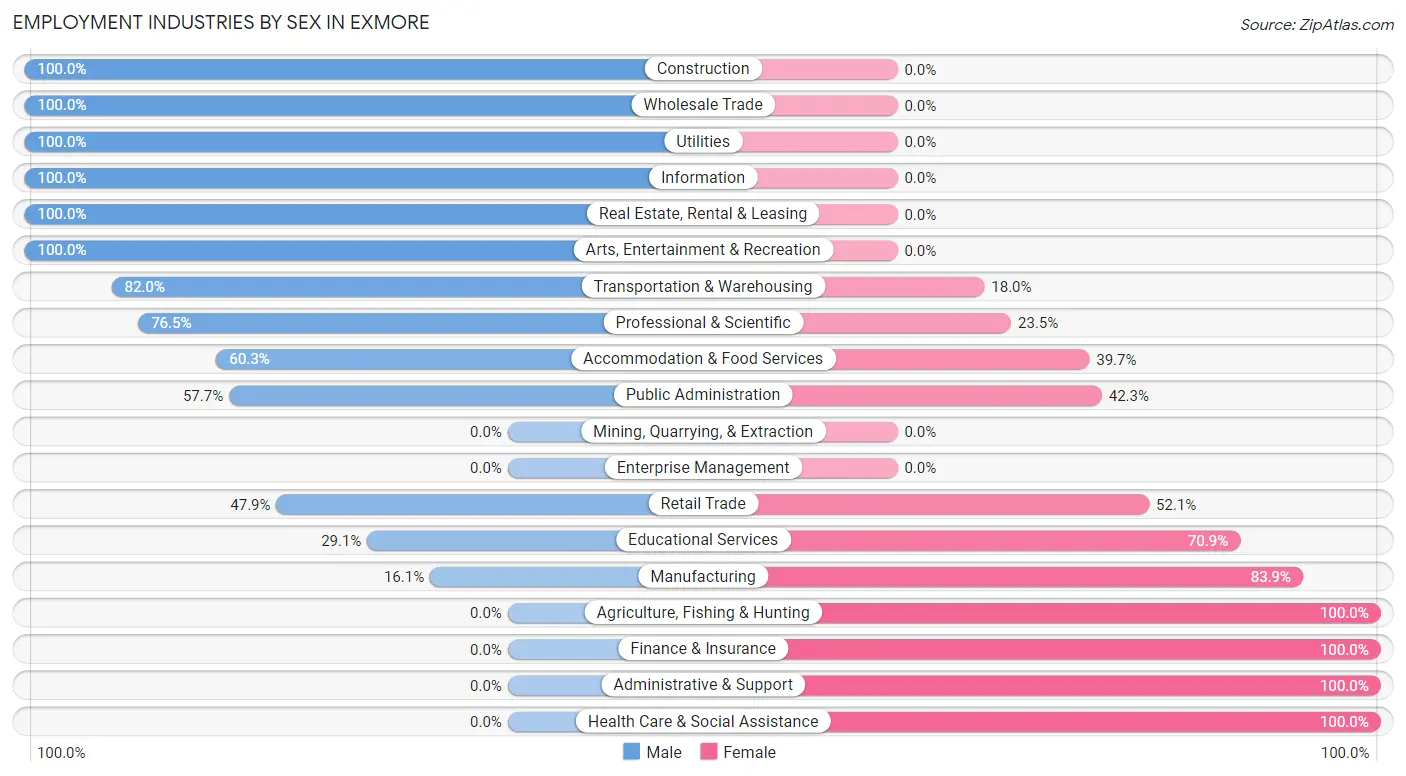
Employment Industries by Sex in Exmore
The Exmore industries that see more men than women are Construction (100.0%), Wholesale Trade (100.0%), and Utilities (100.0%), whereas the industries that tend to have a higher number of women are Agriculture, Fishing & Hunting (100.0%), Finance & Insurance (100.0%), and Administrative & Support (100.0%).
| Industry | Male | Female |
| Agriculture, Fishing & Hunting | 0 (0.0%) | 19 (100.0%) |
| Mining, Quarrying, & Extraction | 0 (0.0%) | 0 (0.0%) |
| Construction | 37 (100.0%) | 0 (0.0%) |
| Manufacturing | 14 (16.1%) | 73 (83.9%) |
| Wholesale Trade | 84 (100.0%) | 0 (0.0%) |
| Retail Trade | 34 (47.9%) | 37 (52.1%) |
| Transportation & Warehousing | 41 (82.0%) | 9 (18.0%) |
| Utilities | 18 (100.0%) | 0 (0.0%) |
| Information | 17 (100.0%) | 0 (0.0%) |
| Finance & Insurance | 0 (0.0%) | 2 (100.0%) |
| Real Estate, Rental & Leasing | 3 (100.0%) | 0 (0.0%) |
| Professional & Scientific | 13 (76.5%) | 4 (23.5%) |
| Enterprise Management | 0 (0.0%) | 0 (0.0%) |
| Administrative & Support | 0 (0.0%) | 77 (100.0%) |
| Educational Services | 16 (29.1%) | 39 (70.9%) |
| Health Care & Social Assistance | 0 (0.0%) | 74 (100.0%) |
| Arts, Entertainment & Recreation | 10 (100.0%) | 0 (0.0%) |
| Accommodation & Food Services | 41 (60.3%) | 27 (39.7%) |
| Public Administration | 15 (57.7%) | 11 (42.3%) |
| Total | 351 (48.5%) | 373 (51.5%) |
Education in Exmore
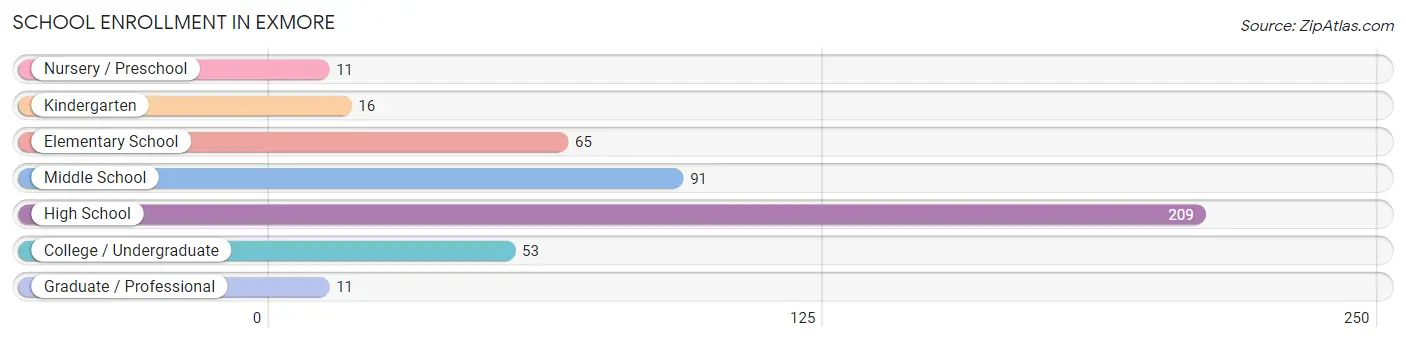
School Enrollment in Exmore
The most common levels of schooling among the 456 students in Exmore are high school (209 | 45.8%), middle school (91 | 20.0%), and elementary school (65 | 14.2%).
| School Level | # Students | % Students |
| Nursery / Preschool | 11 | 2.4% |
| Kindergarten | 16 | 3.5% |
| Elementary School | 65 | 14.2% |
| Middle School | 91 | 20.0% |
| High School | 209 | 45.8% |
| College / Undergraduate | 53 | 11.6% |
| Graduate / Professional | 11 | 2.4% |
| Total | 456 | 100.0% |
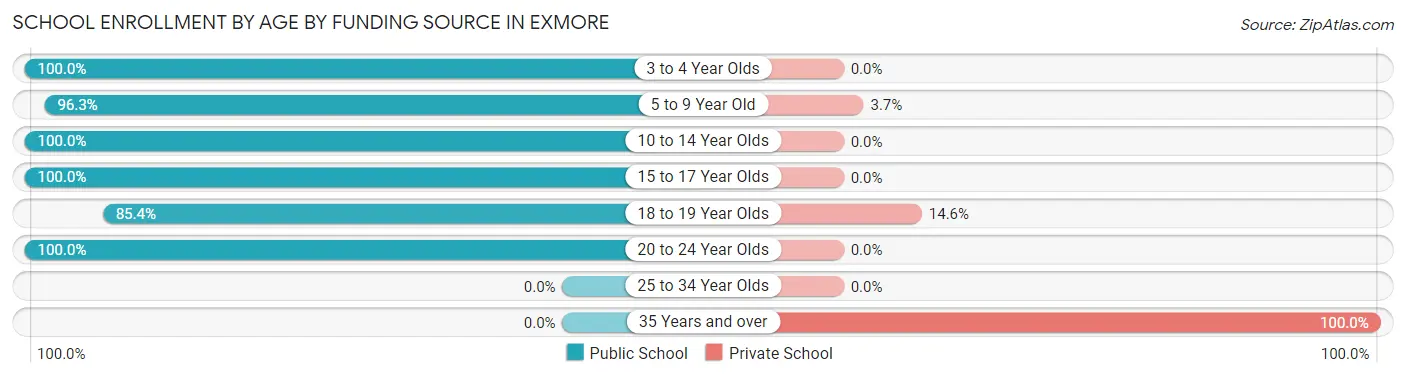
School Enrollment by Age by Funding Source in Exmore
Out of a total of 456 students who are enrolled in schools in Exmore, 29 (6.4%) attend a private institution, while the remaining 427 (93.6%) are enrolled in public schools. The age group of 35 years and over has the highest likelihood of being enrolled in private schools, with 11 (100.0% in the age bracket) enrolled. Conversely, the age group of 3 to 4 year olds has the lowest likelihood of being enrolled in a private school, with 11 (100.0% in the age bracket) attending a public institution.
| Age Bracket | Public School | Private School |
| 3 to 4 Year Olds | 11 (100.0%) | 0 (0.0%) |
| 5 to 9 Year Old | 78 (96.3%) | 3 (3.7%) |
| 10 to 14 Year Olds | 112 (100.0%) | 0 (0.0%) |
| 15 to 17 Year Olds | 116 (100.0%) | 0 (0.0%) |
| 18 to 19 Year Olds | 88 (85.4%) | 15 (14.6%) |
| 20 to 24 Year Olds | 22 (100.0%) | 0 (0.0%) |
| 25 to 34 Year Olds | 0 (0.0%) | 0 (0.0%) |
| 35 Years and over | 0 (0.0%) | 11 (100.0%) |
| Total | 427 (93.6%) | 29 (6.4%) |
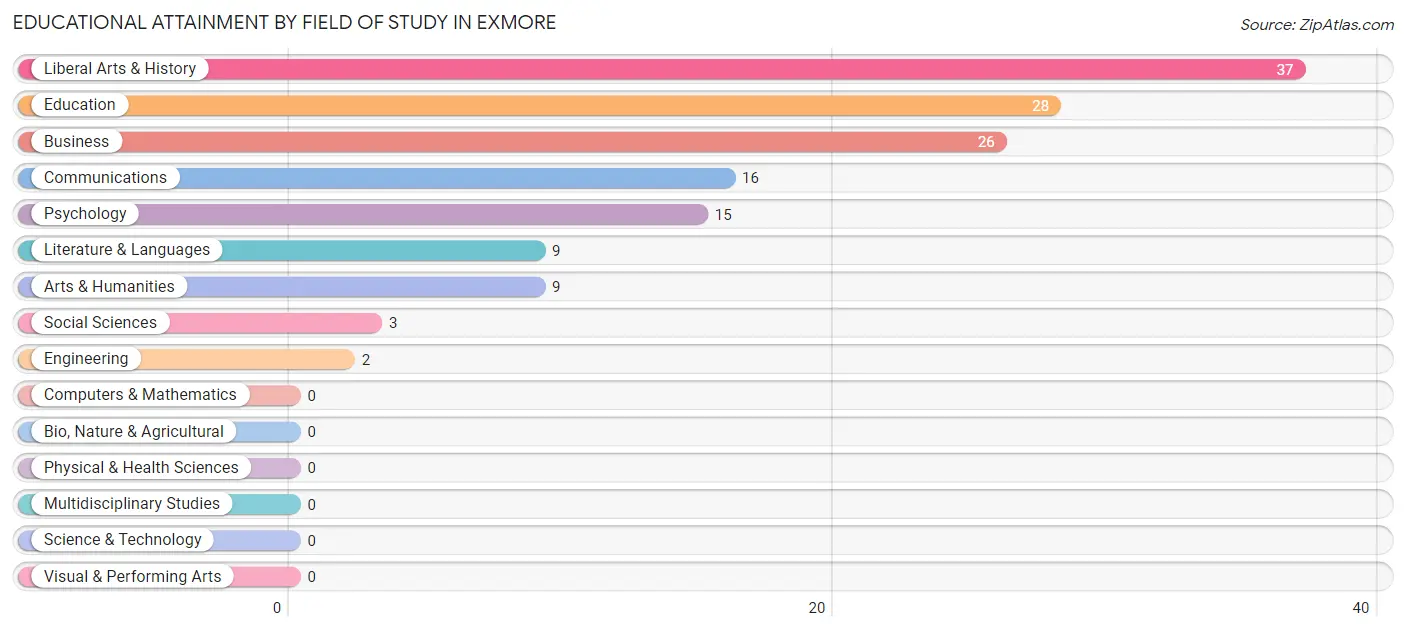
Educational Attainment by Field of Study in Exmore
Liberal arts & history (37 | 25.5%), education (28 | 19.3%), business (26 | 17.9%), communications (16 | 11.0%), and psychology (15 | 10.3%) are the most common fields of study among 145 individuals in Exmore who have obtained a bachelor's degree or higher.
| Field of Study | # Graduates | % Graduates |
| Computers & Mathematics | 0 | 0.0% |
| Bio, Nature & Agricultural | 0 | 0.0% |
| Physical & Health Sciences | 0 | 0.0% |
| Psychology | 15 | 10.3% |
| Social Sciences | 3 | 2.1% |
| Engineering | 2 | 1.4% |
| Multidisciplinary Studies | 0 | 0.0% |
| Science & Technology | 0 | 0.0% |
| Business | 26 | 17.9% |
| Education | 28 | 19.3% |
| Literature & Languages | 9 | 6.2% |
| Liberal Arts & History | 37 | 25.5% |
| Visual & Performing Arts | 0 | 0.0% |
| Communications | 16 | 11.0% |
| Arts & Humanities | 9 | 6.2% |
| Total | 145 | 100.0% |
Transportation & Commute in Exmore
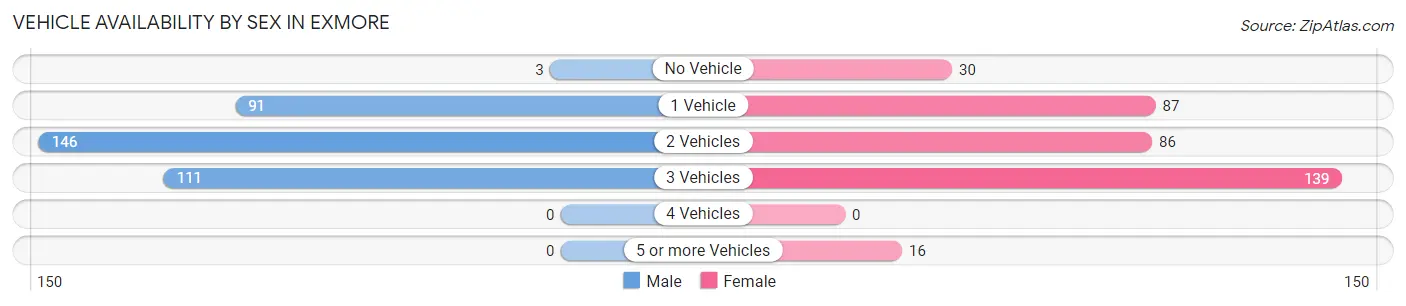
Vehicle Availability by Sex in Exmore
The most prevalent vehicle ownership categories in Exmore are males with 2 vehicles (146, accounting for 41.6%) and females with 2 vehicles (86, making up 40.8%).
| Vehicles Available | Male | Female |
| No Vehicle | 3 (0.9%) | 30 (8.4%) |
| 1 Vehicle | 91 (25.9%) | 87 (24.3%) |
| 2 Vehicles | 146 (41.6%) | 86 (24.0%) |
| 3 Vehicles | 111 (31.6%) | 139 (38.8%) |
| 4 Vehicles | 0 (0.0%) | 0 (0.0%) |
| 5 or more Vehicles | 0 (0.0%) | 16 (4.5%) |
| Total | 351 (100.0%) | 358 (100.0%) |
Commute Time in Exmore
The most frequently occuring commute durations in Exmore are 5 to 9 minutes (306 commuters, 43.8%), 25 to 29 minutes (89 commuters, 12.8%), and 20 to 24 minutes (87 commuters, 12.5%).
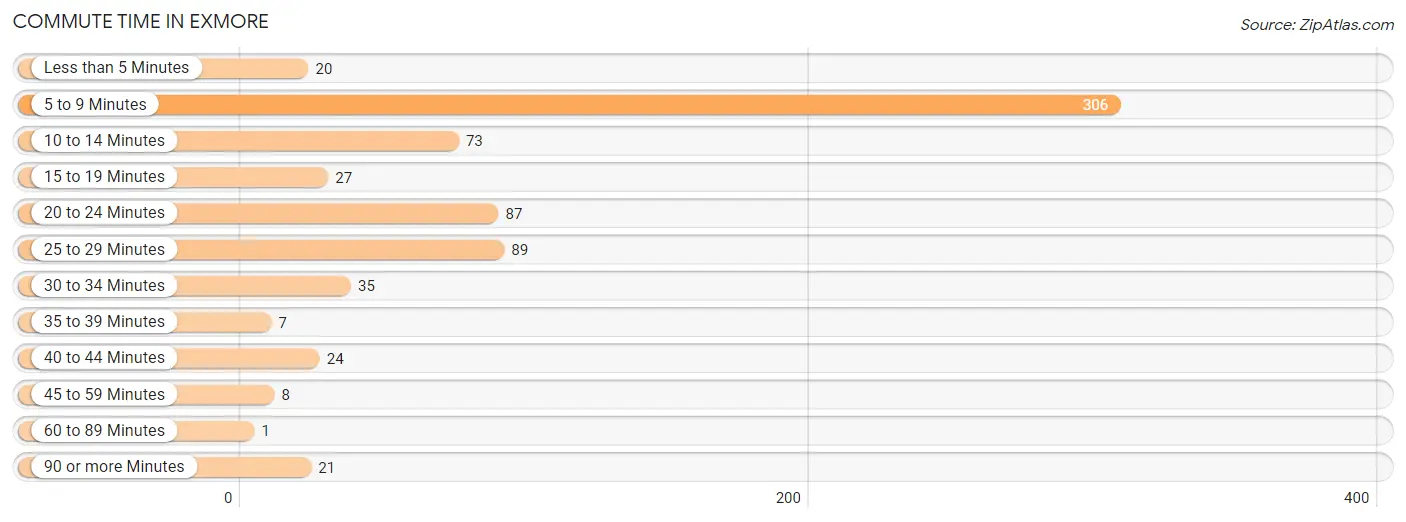
| Commute Time | # Commuters | % Commuters |
| Less than 5 Minutes | 20 | 2.9% |
| 5 to 9 Minutes | 306 | 43.8% |
| 10 to 14 Minutes | 73 | 10.5% |
| 15 to 19 Minutes | 27 | 3.9% |
| 20 to 24 Minutes | 87 | 12.5% |
| 25 to 29 Minutes | 89 | 12.8% |
| 30 to 34 Minutes | 35 | 5.0% |
| 35 to 39 Minutes | 7 | 1.0% |
| 40 to 44 Minutes | 24 | 3.4% |
| 45 to 59 Minutes | 8 | 1.1% |
| 60 to 89 Minutes | 1 | 0.1% |
| 90 or more Minutes | 21 | 3.0% |
Commute Time by Sex in Exmore
The most common commute times in Exmore are 5 to 9 minutes (150 commuters, 43.0%) for males and 5 to 9 minutes (156 commuters, 44.7%) for females.
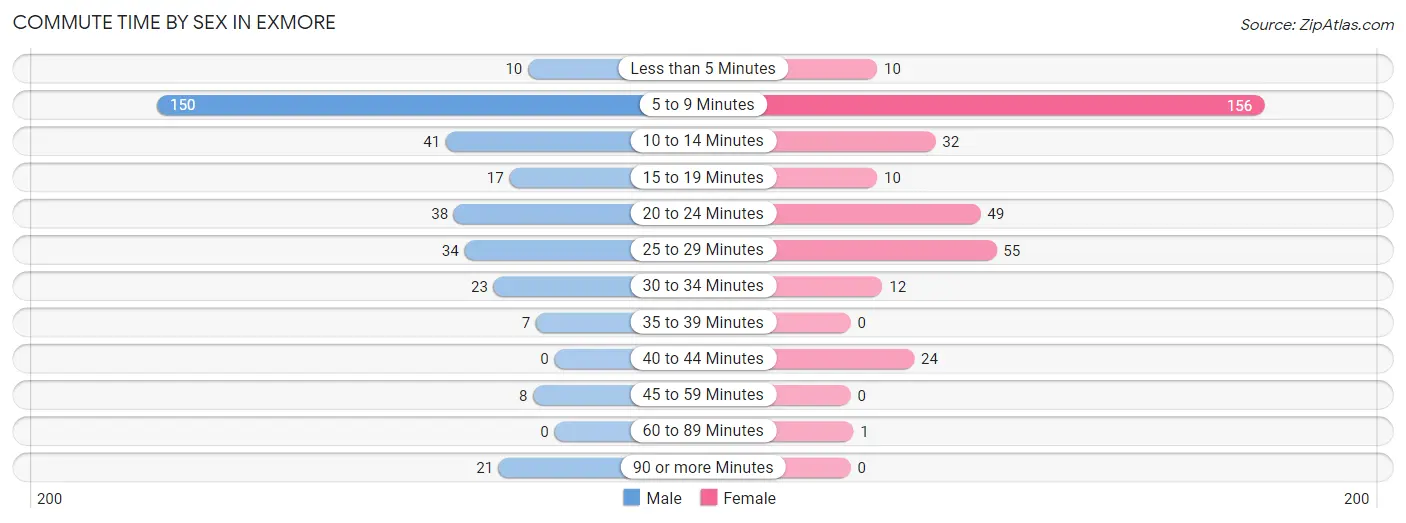
| Commute Time | Male | Female |
| Less than 5 Minutes | 10 (2.9%) | 10 (2.9%) |
| 5 to 9 Minutes | 150 (43.0%) | 156 (44.7%) |
| 10 to 14 Minutes | 41 (11.7%) | 32 (9.2%) |
| 15 to 19 Minutes | 17 (4.9%) | 10 (2.9%) |
| 20 to 24 Minutes | 38 (10.9%) | 49 (14.0%) |
| 25 to 29 Minutes | 34 (9.7%) | 55 (15.8%) |
| 30 to 34 Minutes | 23 (6.6%) | 12 (3.4%) |
| 35 to 39 Minutes | 7 (2.0%) | 0 (0.0%) |
| 40 to 44 Minutes | 0 (0.0%) | 24 (6.9%) |
| 45 to 59 Minutes | 8 (2.3%) | 0 (0.0%) |
| 60 to 89 Minutes | 0 (0.0%) | 1 (0.3%) |
| 90 or more Minutes | 21 (6.0%) | 0 (0.0%) |
Time of Departure to Work by Sex in Exmore
The most frequent times of departure to work in Exmore are 5:30 AM to 5:59 AM (113, 32.4%) for males and 5:30 AM to 5:59 AM (81, 23.2%) for females.
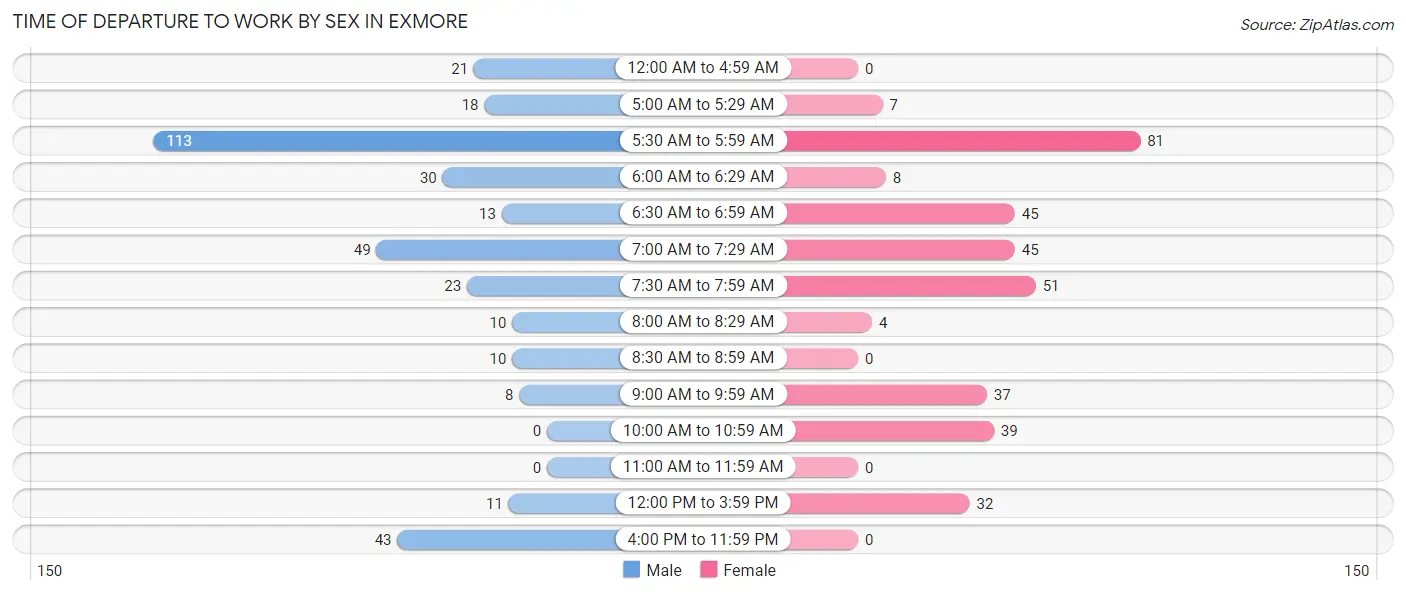
| Time of Departure | Male | Female |
| 12:00 AM to 4:59 AM | 21 (6.0%) | 0 (0.0%) |
| 5:00 AM to 5:29 AM | 18 (5.2%) | 7 (2.0%) |
| 5:30 AM to 5:59 AM | 113 (32.4%) | 81 (23.2%) |
| 6:00 AM to 6:29 AM | 30 (8.6%) | 8 (2.3%) |
| 6:30 AM to 6:59 AM | 13 (3.7%) | 45 (12.9%) |
| 7:00 AM to 7:29 AM | 49 (14.0%) | 45 (12.9%) |
| 7:30 AM to 7:59 AM | 23 (6.6%) | 51 (14.6%) |
| 8:00 AM to 8:29 AM | 10 (2.9%) | 4 (1.1%) |
| 8:30 AM to 8:59 AM | 10 (2.9%) | 0 (0.0%) |
| 9:00 AM to 9:59 AM | 8 (2.3%) | 37 (10.6%) |
| 10:00 AM to 10:59 AM | 0 (0.0%) | 39 (11.2%) |
| 11:00 AM to 11:59 AM | 0 (0.0%) | 0 (0.0%) |
| 12:00 PM to 3:59 PM | 11 (3.2%) | 32 (9.2%) |
| 4:00 PM to 11:59 PM | 43 (12.3%) | 0 (0.0%) |
| Total | 349 (100.0%) | 349 (100.0%) |
Housing Occupancy in Exmore
Occupancy by Ownership in Exmore
Of the total 707 dwellings in Exmore, owner-occupied units account for 291 (41.2%), while renter-occupied units make up 416 (58.8%).
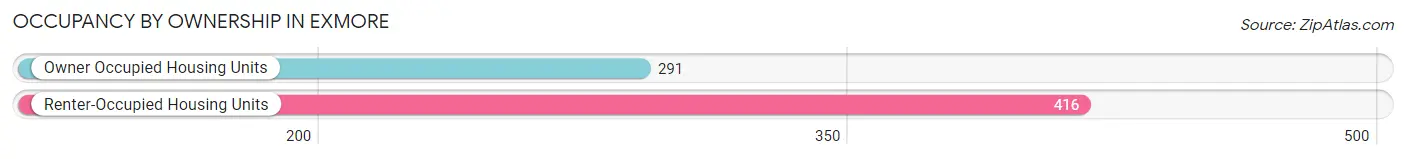
| Occupancy | # Housing Units | % Housing Units |
| Owner Occupied Housing Units | 291 | 41.2% |
| Renter-Occupied Housing Units | 416 | 58.8% |
| Total Occupied Housing Units | 707 | 100.0% |
Occupancy by Household Size in Exmore
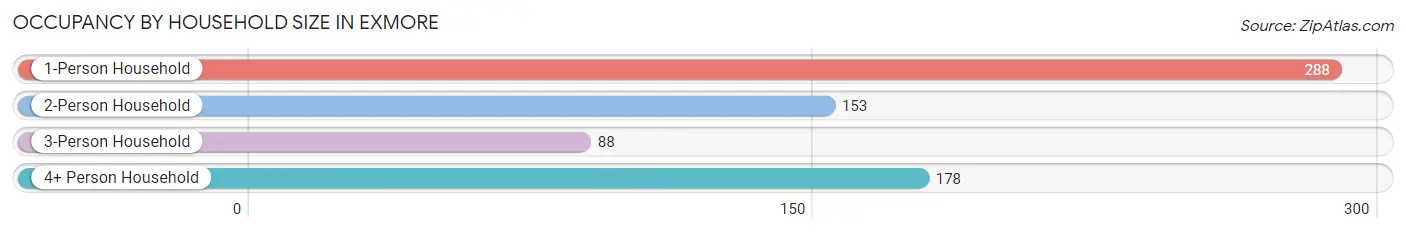
| Household Size | # Housing Units | % Housing Units |
| 1-Person Household | 288 | 40.7% |
| 2-Person Household | 153 | 21.6% |
| 3-Person Household | 88 | 12.4% |
| 4+ Person Household | 178 | 25.2% |
| Total Housing Units | 707 | 100.0% |
Occupancy by Ownership by Household Size in Exmore
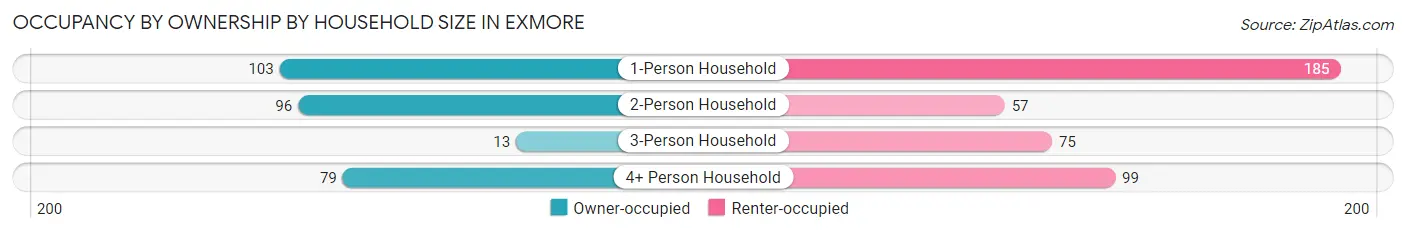
| Household Size | Owner-occupied | Renter-occupied |
| 1-Person Household | 103 (35.8%) | 185 (64.2%) |
| 2-Person Household | 96 (62.7%) | 57 (37.2%) |
| 3-Person Household | 13 (14.8%) | 75 (85.2%) |
| 4+ Person Household | 79 (44.4%) | 99 (55.6%) |
| Total Housing Units | 291 (41.2%) | 416 (58.8%) |
Occupancy by Educational Attainment in Exmore
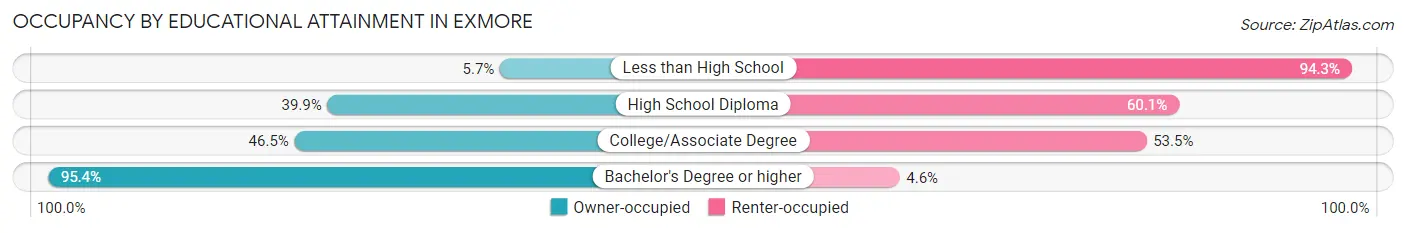
| Household Size | Owner-occupied | Renter-occupied |
| Less than High School | 8 (5.7%) | 132 (94.3%) |
| High School Diploma | 141 (39.9%) | 212 (60.1%) |
| College/Associate Degree | 59 (46.5%) | 68 (53.5%) |
| Bachelor's Degree or higher | 83 (95.4%) | 4 (4.6%) |
Occupancy by Age of Householder in Exmore
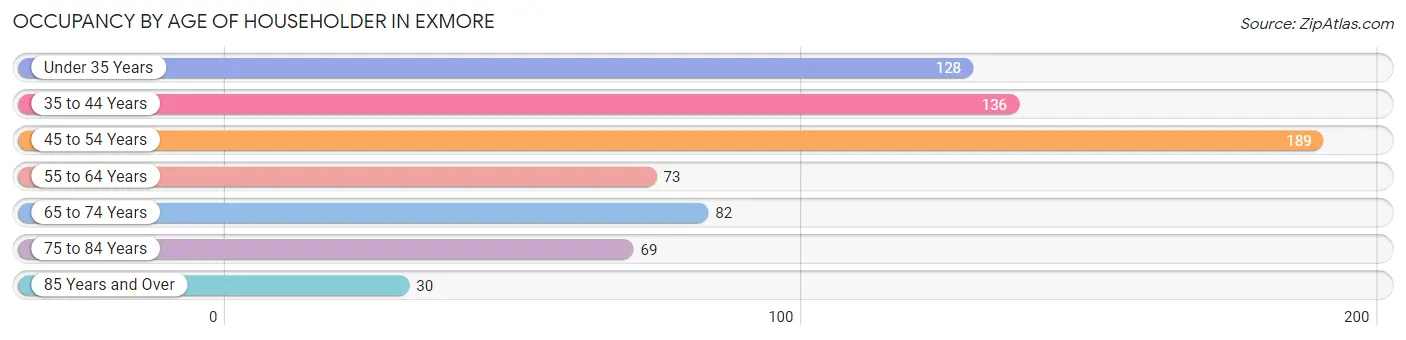
| Age Bracket | # Households | % Households |
| Under 35 Years | 128 | 18.1% |
| 35 to 44 Years | 136 | 19.2% |
| 45 to 54 Years | 189 | 26.7% |
| 55 to 64 Years | 73 | 10.3% |
| 65 to 74 Years | 82 | 11.6% |
| 75 to 84 Years | 69 | 9.8% |
| 85 Years and Over | 30 | 4.2% |
| Total | 707 | 100.0% |
Housing Finances in Exmore
Median Income by Occupancy in Exmore
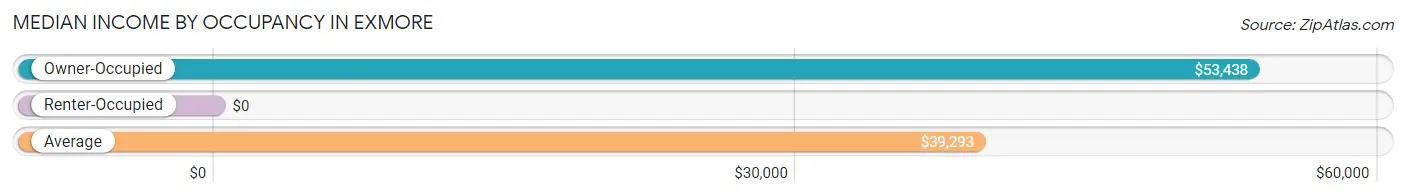
| Occupancy Type | # Households | Median Income |
| Owner-Occupied | 291 (41.2%) | $53,438 |
| Renter-Occupied | 416 (58.8%) | $0 |
| Average | 707 (100.0%) | $39,293 |
Occupancy by Householder Income Bracket in Exmore
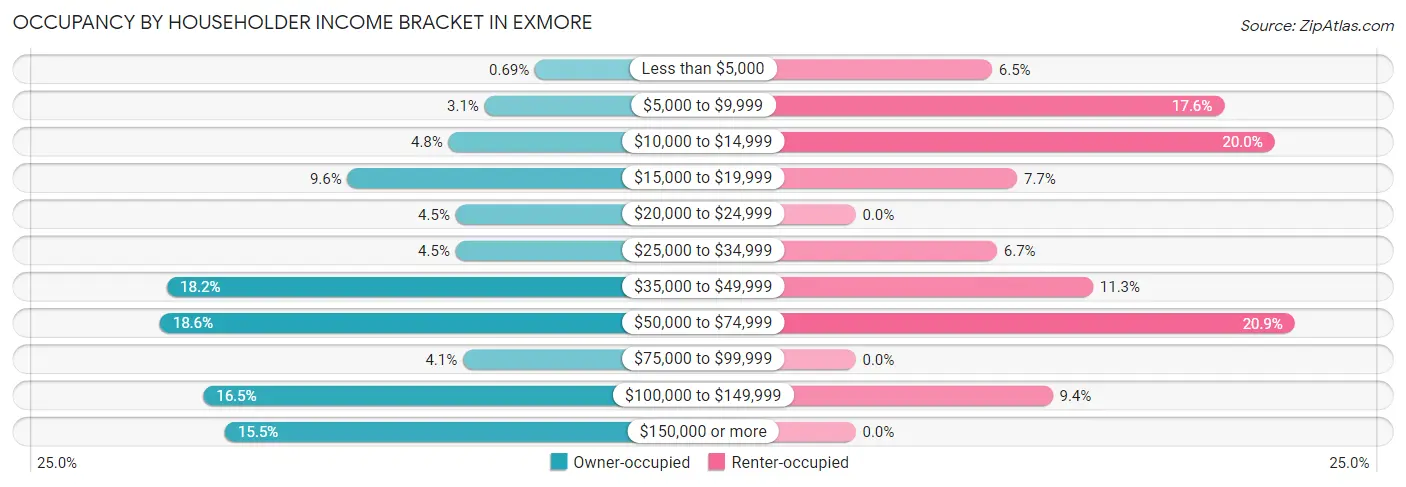
| Income Bracket | Owner-occupied | Renter-occupied |
| Less than $5,000 | 2 (0.7%) | 27 (6.5%) |
| $5,000 to $9,999 | 9 (3.1%) | 73 (17.5%) |
| $10,000 to $14,999 | 14 (4.8%) | 83 (20.0%) |
| $15,000 to $19,999 | 28 (9.6%) | 32 (7.7%) |
| $20,000 to $24,999 | 13 (4.5%) | 0 (0.0%) |
| $25,000 to $34,999 | 13 (4.5%) | 28 (6.7%) |
| $35,000 to $49,999 | 53 (18.2%) | 47 (11.3%) |
| $50,000 to $74,999 | 54 (18.6%) | 87 (20.9%) |
| $75,000 to $99,999 | 12 (4.1%) | 0 (0.0%) |
| $100,000 to $149,999 | 48 (16.5%) | 39 (9.4%) |
| $150,000 or more | 45 (15.5%) | 0 (0.0%) |
| Total | 291 (100.0%) | 416 (100.0%) |
Monthly Housing Cost Tiers in Exmore
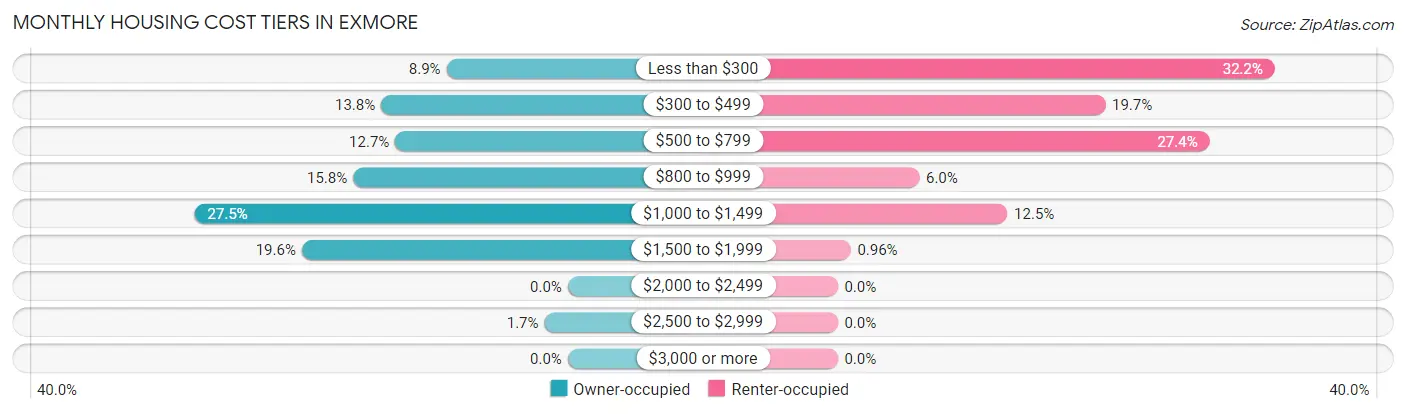
| Monthly Cost | Owner-occupied | Renter-occupied |
| Less than $300 | 26 (8.9%) | 134 (32.2%) |
| $300 to $499 | 40 (13.8%) | 82 (19.7%) |
| $500 to $799 | 37 (12.7%) | 114 (27.4%) |
| $800 to $999 | 46 (15.8%) | 25 (6.0%) |
| $1,000 to $1,499 | 80 (27.5%) | 52 (12.5%) |
| $1,500 to $1,999 | 57 (19.6%) | 4 (1.0%) |
| $2,000 to $2,499 | 0 (0.0%) | 0 (0.0%) |
| $2,500 to $2,999 | 5 (1.7%) | 0 (0.0%) |
| $3,000 or more | 0 (0.0%) | 0 (0.0%) |
| Total | 291 (100.0%) | 416 (100.0%) |
Physical Housing Characteristics in Exmore
Housing Structures in Exmore
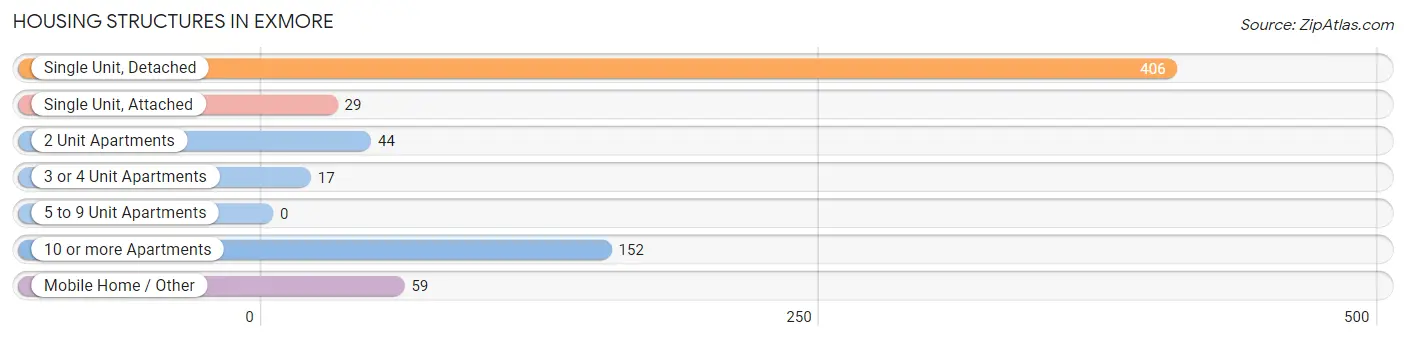
| Structure Type | # Housing Units | % Housing Units |
| Single Unit, Detached | 406 | 57.4% |
| Single Unit, Attached | 29 | 4.1% |
| 2 Unit Apartments | 44 | 6.2% |
| 3 or 4 Unit Apartments | 17 | 2.4% |
| 5 to 9 Unit Apartments | 0 | 0.0% |
| 10 or more Apartments | 152 | 21.5% |
| Mobile Home / Other | 59 | 8.4% |
| Total | 707 | 100.0% |
Housing Structures by Occupancy in Exmore
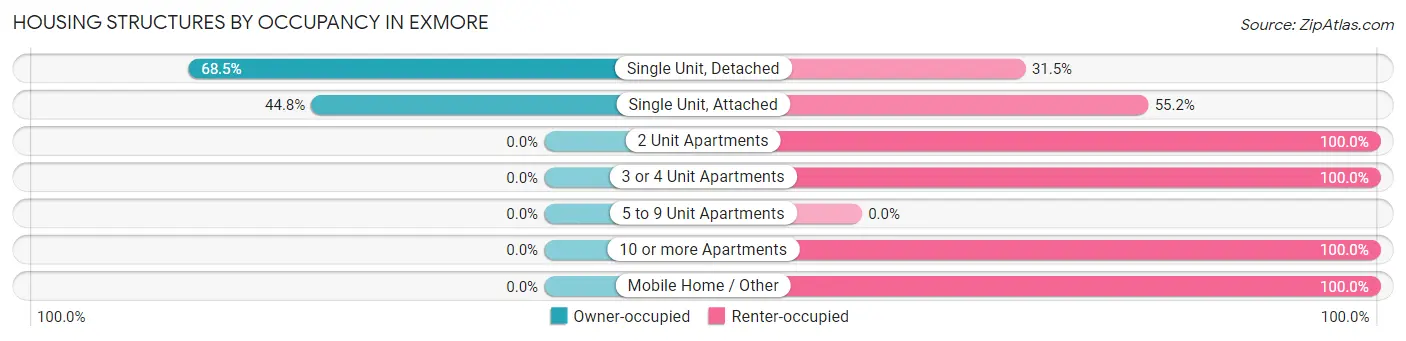
| Structure Type | Owner-occupied | Renter-occupied |
| Single Unit, Detached | 278 (68.5%) | 128 (31.5%) |
| Single Unit, Attached | 13 (44.8%) | 16 (55.2%) |
| 2 Unit Apartments | 0 (0.0%) | 44 (100.0%) |
| 3 or 4 Unit Apartments | 0 (0.0%) | 17 (100.0%) |
| 5 to 9 Unit Apartments | 0 (0.0%) | 0 (0.0%) |
| 10 or more Apartments | 0 (0.0%) | 152 (100.0%) |
| Mobile Home / Other | 0 (0.0%) | 59 (100.0%) |
| Total | 291 (41.2%) | 416 (58.8%) |
Housing Structures by Number of Rooms in Exmore
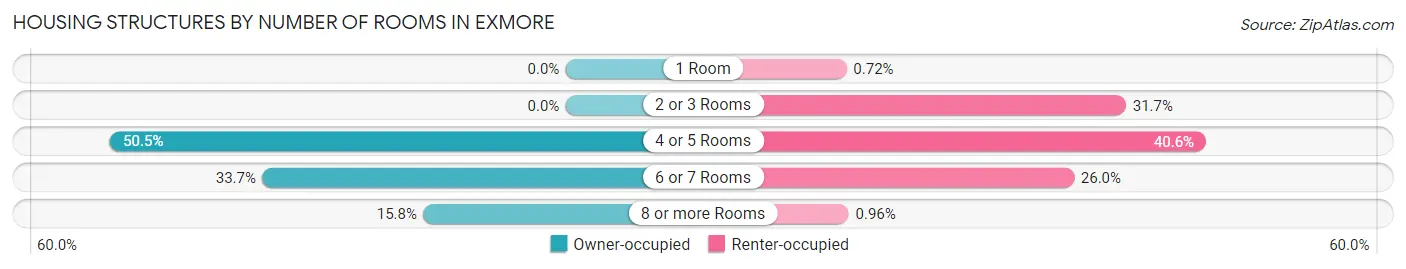
| Number of Rooms | Owner-occupied | Renter-occupied |
| 1 Room | 0 (0.0%) | 3 (0.7%) |
| 2 or 3 Rooms | 0 (0.0%) | 132 (31.7%) |
| 4 or 5 Rooms | 147 (50.5%) | 169 (40.6%) |
| 6 or 7 Rooms | 98 (33.7%) | 108 (26.0%) |
| 8 or more Rooms | 46 (15.8%) | 4 (1.0%) |
| Total | 291 (100.0%) | 416 (100.0%) |
Housing Structure by Heating Type in Exmore
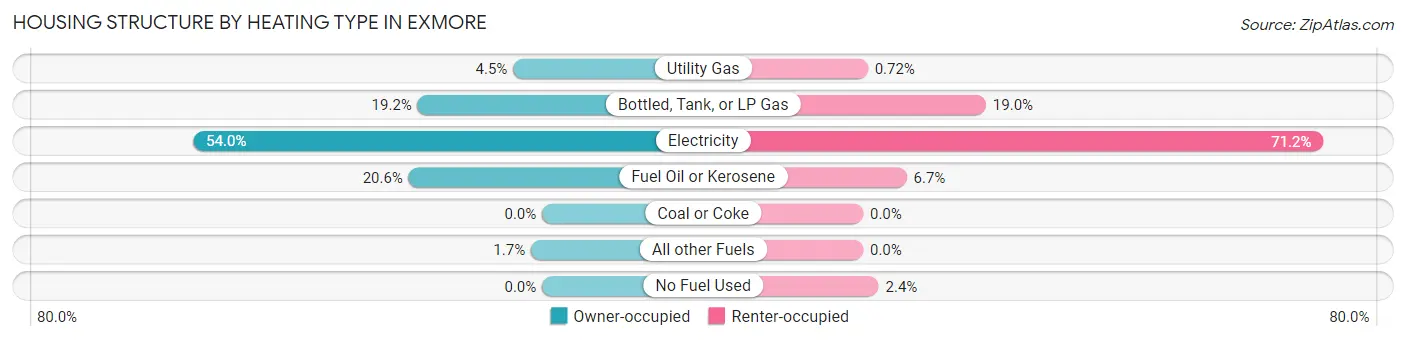
| Heating Type | Owner-occupied | Renter-occupied |
| Utility Gas | 13 (4.5%) | 3 (0.7%) |
| Bottled, Tank, or LP Gas | 56 (19.2%) | 79 (19.0%) |
| Electricity | 157 (53.9%) | 296 (71.2%) |
| Fuel Oil or Kerosene | 60 (20.6%) | 28 (6.7%) |
| Coal or Coke | 0 (0.0%) | 0 (0.0%) |
| All other Fuels | 5 (1.7%) | 0 (0.0%) |
| No Fuel Used | 0 (0.0%) | 10 (2.4%) |
| Total | 291 (100.0%) | 416 (100.0%) |
Household Vehicle Usage in Exmore
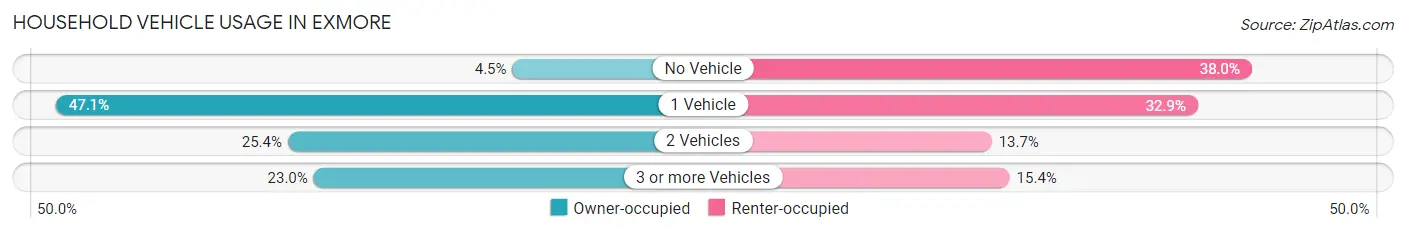
| Vehicles per Household | Owner-occupied | Renter-occupied |
| No Vehicle | 13 (4.5%) | 158 (38.0%) |
| 1 Vehicle | 137 (47.1%) | 137 (32.9%) |
| 2 Vehicles | 74 (25.4%) | 57 (13.7%) |
| 3 or more Vehicles | 67 (23.0%) | 64 (15.4%) |
| Total | 291 (100.0%) | 416 (100.0%) |
Real Estate & Mortgages in Exmore
Real Estate and Mortgage Overview in Exmore
| Characteristic | Without Mortgage | With Mortgage |
| Housing Units | 96 | 195 |
| Median Property Value | $202,000 | $157,600 |
| Median Household Income | $37,778 | $45 |
| Monthly Housing Costs | $442 | $0 |
| Real Estate Taxes | $1,236 | $0 |
Property Value by Mortgage Status in Exmore
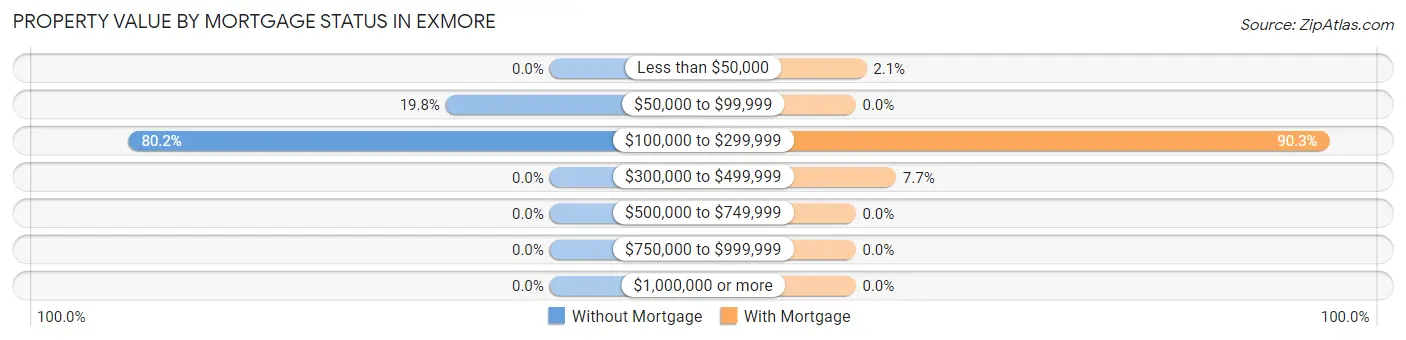
| Property Value | Without Mortgage | With Mortgage |
| Less than $50,000 | 0 (0.0%) | 4 (2.1%) |
| $50,000 to $99,999 | 19 (19.8%) | 0 (0.0%) |
| $100,000 to $299,999 | 77 (80.2%) | 176 (90.3%) |
| $300,000 to $499,999 | 0 (0.0%) | 15 (7.7%) |
| $500,000 to $749,999 | 0 (0.0%) | 0 (0.0%) |
| $750,000 to $999,999 | 0 (0.0%) | 0 (0.0%) |
| $1,000,000 or more | 0 (0.0%) | 0 (0.0%) |
| Total | 96 (100.0%) | 195 (100.0%) |
Household Income by Mortgage Status in Exmore
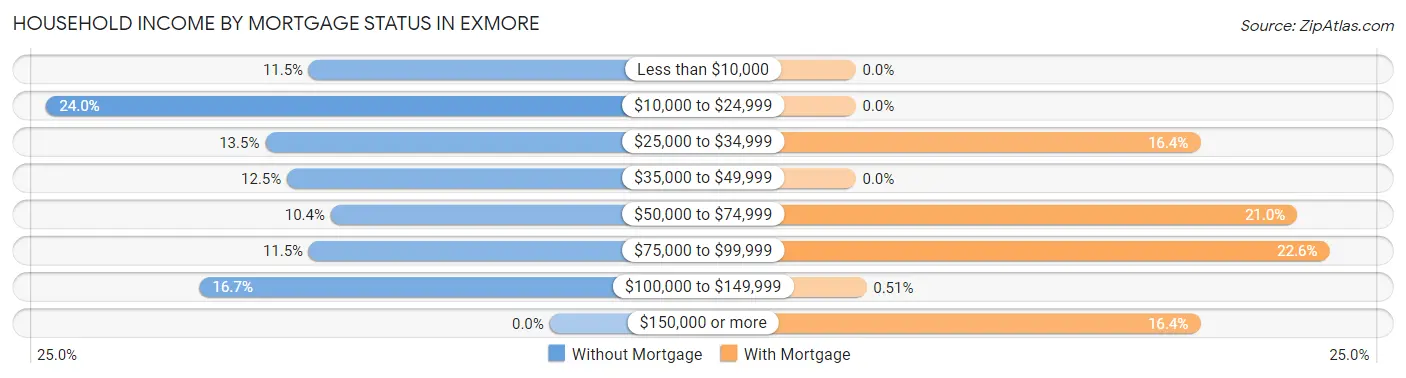
| Household Income | Without Mortgage | With Mortgage |
| Less than $10,000 | 11 (11.5%) | 0 (0.0%) |
| $10,000 to $24,999 | 23 (24.0%) | 0 (0.0%) |
| $25,000 to $34,999 | 13 (13.5%) | 32 (16.4%) |
| $35,000 to $49,999 | 12 (12.5%) | 0 (0.0%) |
| $50,000 to $74,999 | 10 (10.4%) | 41 (21.0%) |
| $75,000 to $99,999 | 11 (11.5%) | 44 (22.6%) |
| $100,000 to $149,999 | 16 (16.7%) | 1 (0.5%) |
| $150,000 or more | 0 (0.0%) | 32 (16.4%) |
| Total | 96 (100.0%) | 195 (100.0%) |
Property Value to Household Income Ratio in Exmore
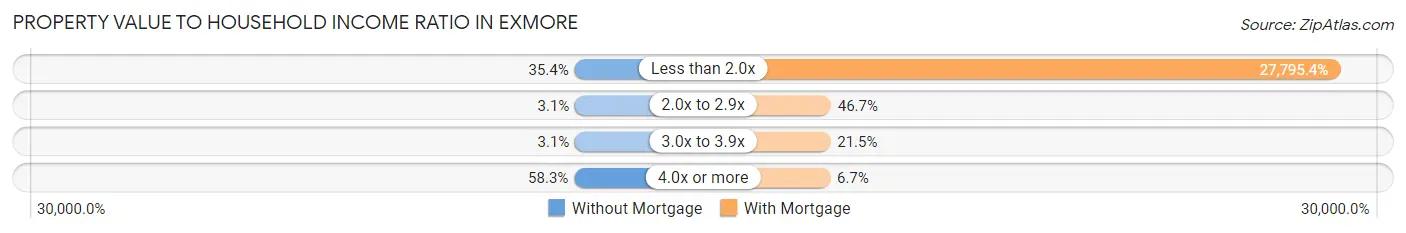
| Value-to-Income Ratio | Without Mortgage | With Mortgage |
| Less than 2.0x | 34 (35.4%) | 54,201 (27,795.4%) |
| 2.0x to 2.9x | 3 (3.1%) | 91 (46.7%) |
| 3.0x to 3.9x | 3 (3.1%) | 42 (21.5%) |
| 4.0x or more | 56 (58.3%) | 13 (6.7%) |
| Total | 96 (100.0%) | 195 (100.0%) |
Real Estate Taxes by Mortgage Status in Exmore
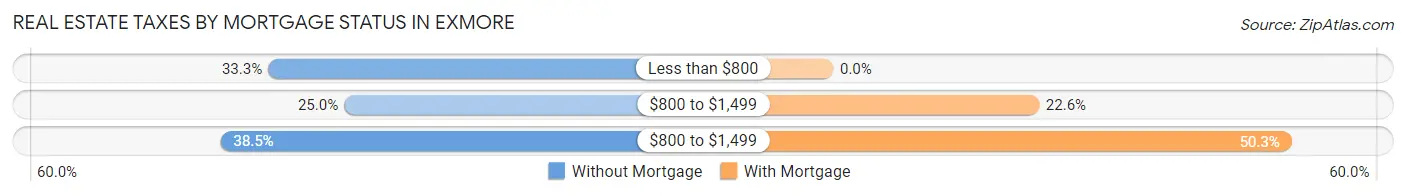
| Property Taxes | Without Mortgage | With Mortgage |
| Less than $800 | 32 (33.3%) | 0 (0.0%) |
| $800 to $1,499 | 24 (25.0%) | 44 (22.6%) |
| $800 to $1,499 | 37 (38.5%) | 98 (50.3%) |
| Total | 96 (100.0%) | 195 (100.0%) |
Health & Disability in Exmore
Health Insurance Coverage by Age in Exmore
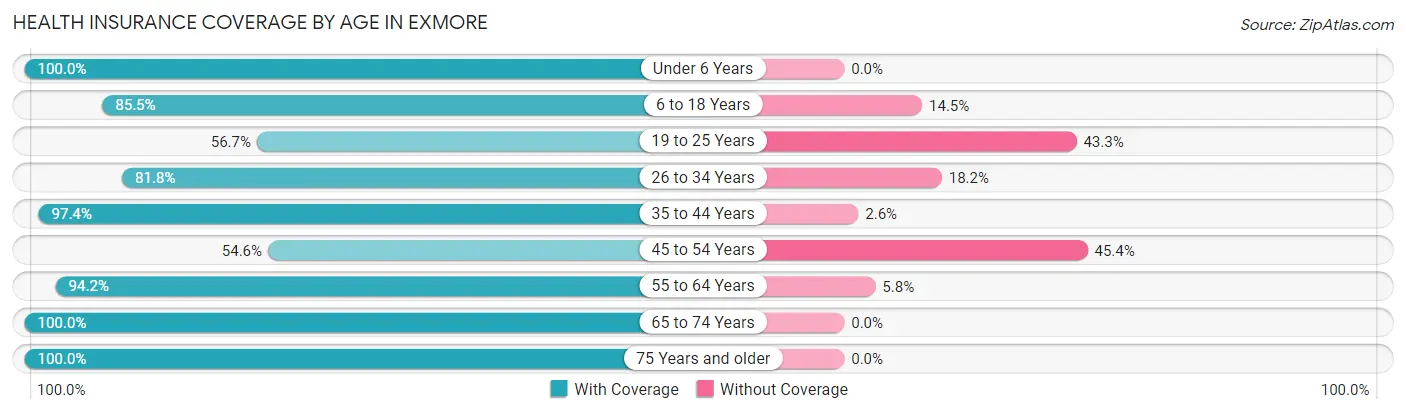
| Age Bracket | With Coverage | Without Coverage |
| Under 6 Years | 178 (100.0%) | 0 (0.0%) |
| 6 to 18 Years | 271 (85.5%) | 46 (14.5%) |
| 19 to 25 Years | 127 (56.7%) | 97 (43.3%) |
| 26 to 34 Years | 99 (81.8%) | 22 (18.2%) |
| 35 to 44 Years | 223 (97.4%) | 6 (2.6%) |
| 45 to 54 Years | 153 (54.6%) | 127 (45.4%) |
| 55 to 64 Years | 130 (94.2%) | 8 (5.8%) |
| 65 to 74 Years | 128 (100.0%) | 0 (0.0%) |
| 75 Years and older | 129 (100.0%) | 0 (0.0%) |
| Total | 1,438 (82.5%) | 306 (17.5%) |
Health Insurance Coverage by Citizenship Status in Exmore
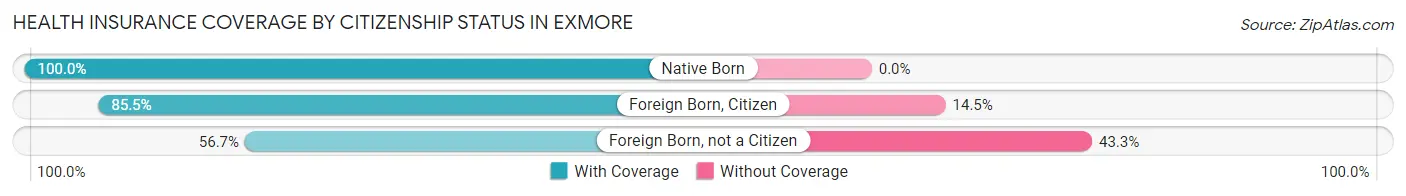
| Citizenship Status | With Coverage | Without Coverage |
| Native Born | 178 (100.0%) | 0 (0.0%) |
| Foreign Born, Citizen | 271 (85.5%) | 46 (14.5%) |
| Foreign Born, not a Citizen | 127 (56.7%) | 97 (43.3%) |
Health Insurance Coverage by Household Income in Exmore
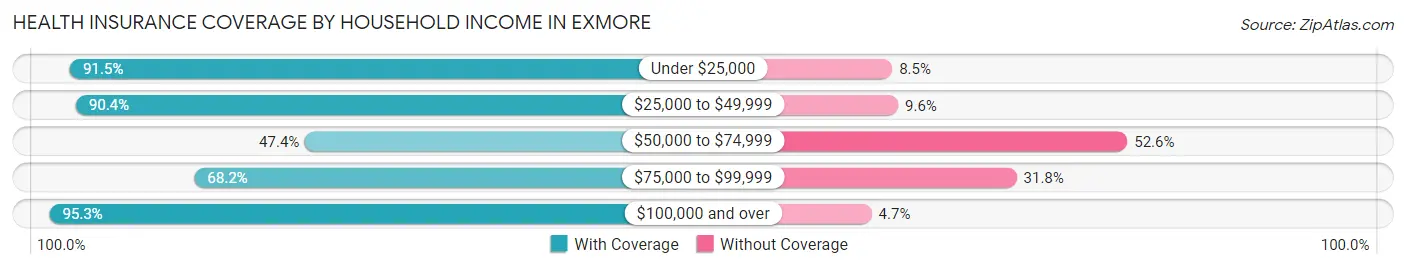
| Household Income | With Coverage | Without Coverage |
| Under $25,000 | 387 (91.5%) | 36 (8.5%) |
| $25,000 to $49,999 | 367 (90.4%) | 39 (9.6%) |
| $50,000 to $74,999 | 176 (47.4%) | 195 (52.6%) |
| $75,000 to $99,999 | 30 (68.2%) | 14 (31.8%) |
| $100,000 and over | 450 (95.3%) | 22 (4.7%) |
Public vs Private Health Insurance Coverage by Age in Exmore
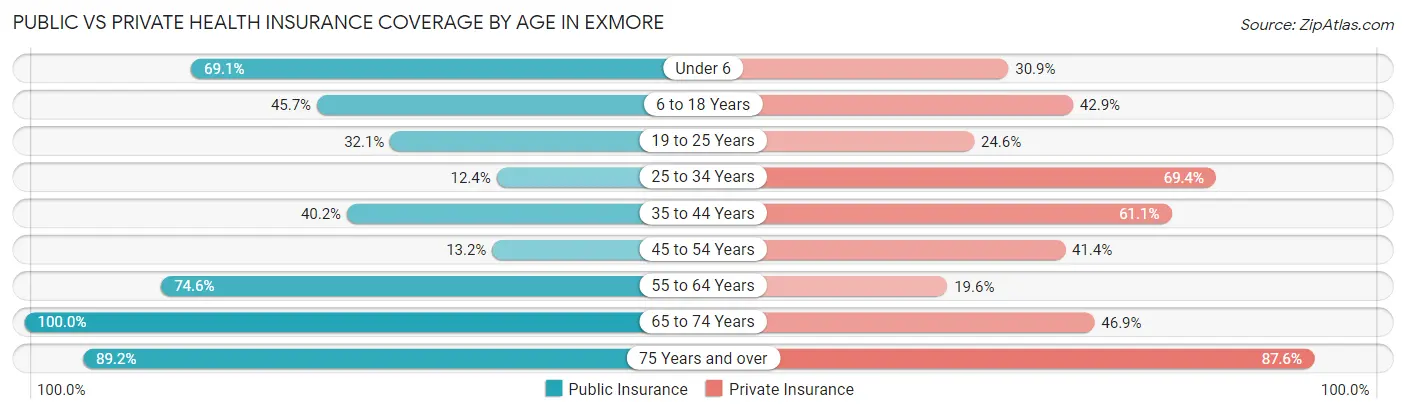
| Age Bracket | Public Insurance | Private Insurance |
| Under 6 | 123 (69.1%) | 55 (30.9%) |
| 6 to 18 Years | 145 (45.7%) | 136 (42.9%) |
| 19 to 25 Years | 72 (32.1%) | 55 (24.5%) |
| 25 to 34 Years | 15 (12.4%) | 84 (69.4%) |
| 35 to 44 Years | 92 (40.2%) | 140 (61.1%) |
| 45 to 54 Years | 37 (13.2%) | 116 (41.4%) |
| 55 to 64 Years | 103 (74.6%) | 27 (19.6%) |
| 65 to 74 Years | 128 (100.0%) | 60 (46.9%) |
| 75 Years and over | 115 (89.1%) | 113 (87.6%) |
| Total | 830 (47.6%) | 786 (45.1%) |
Disability Status by Sex by Age in Exmore
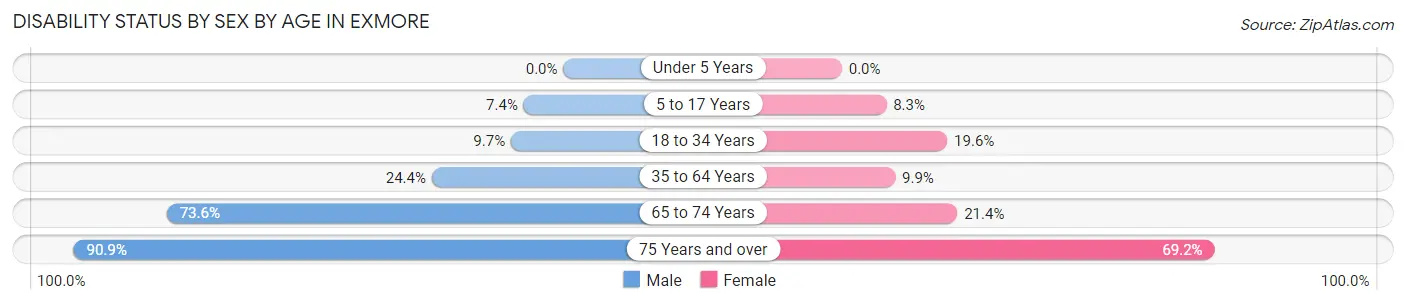
| Age Bracket | Male | Female |
| Under 5 Years | 0 (0.0%) | 0 (0.0%) |
| 5 to 17 Years | 18 (7.3%) | 8 (8.3%) |
| 18 to 34 Years | 14 (9.7%) | 44 (19.6%) |
| 35 to 64 Years | 84 (24.4%) | 30 (9.9%) |
| 65 to 74 Years | 53 (73.6%) | 12 (21.4%) |
| 75 Years and over | 20 (90.9%) | 74 (69.2%) |
Disability Class by Sex by Age in Exmore
Disability Class: Hearing Difficulty
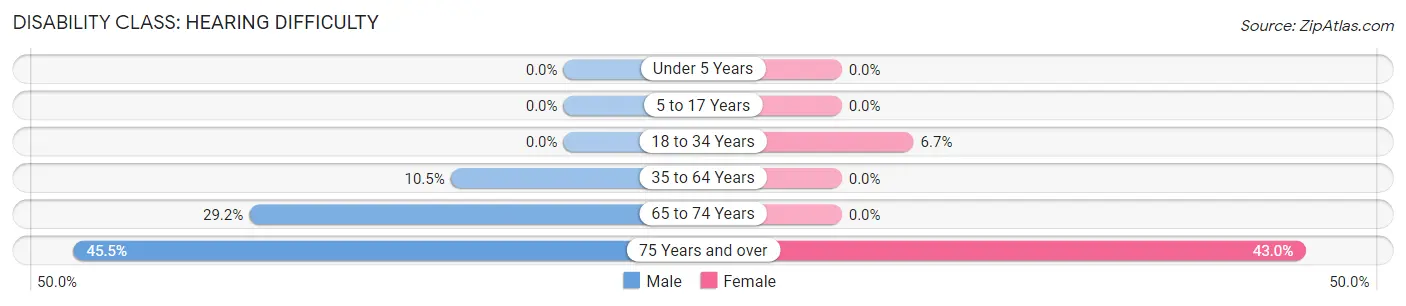
| Age Bracket | Male | Female |
| Under 5 Years | 0 (0.0%) | 0 (0.0%) |
| 5 to 17 Years | 0 (0.0%) | 0 (0.0%) |
| 18 to 34 Years | 0 (0.0%) | 15 (6.7%) |
| 35 to 64 Years | 36 (10.5%) | 0 (0.0%) |
| 65 to 74 Years | 21 (29.2%) | 0 (0.0%) |
| 75 Years and over | 10 (45.5%) | 46 (43.0%) |
Disability Class: Vision Difficulty
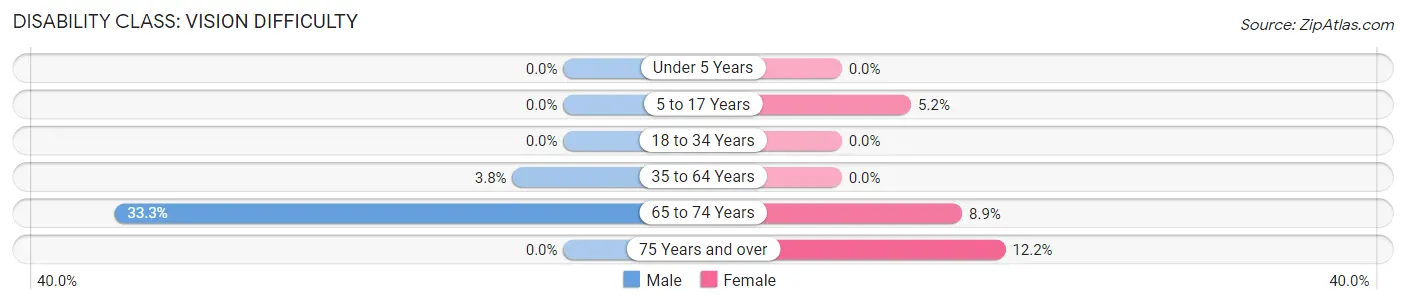
| Age Bracket | Male | Female |
| Under 5 Years | 0 (0.0%) | 0 (0.0%) |
| 5 to 17 Years | 0 (0.0%) | 5 (5.1%) |
| 18 to 34 Years | 0 (0.0%) | 0 (0.0%) |
| 35 to 64 Years | 13 (3.8%) | 0 (0.0%) |
| 65 to 74 Years | 24 (33.3%) | 5 (8.9%) |
| 75 Years and over | 0 (0.0%) | 13 (12.1%) |
Disability Class: Cognitive Difficulty
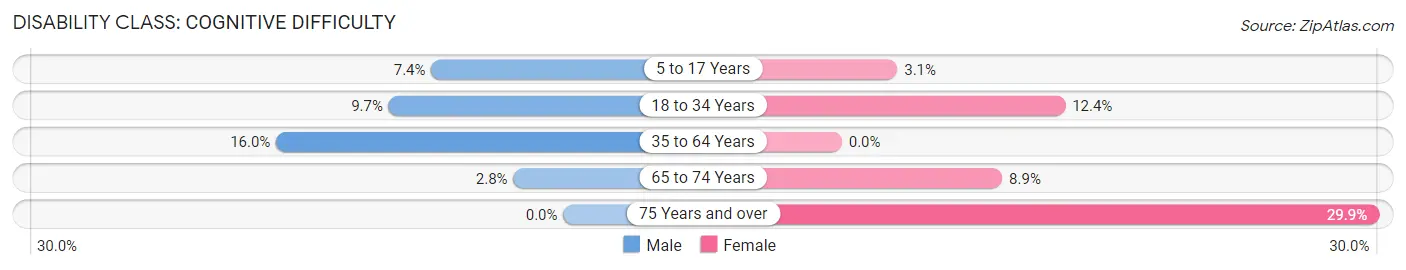
| Age Bracket | Male | Female |
| 5 to 17 Years | 18 (7.3%) | 3 (3.1%) |
| 18 to 34 Years | 14 (9.7%) | 28 (12.4%) |
| 35 to 64 Years | 55 (16.0%) | 0 (0.0%) |
| 65 to 74 Years | 2 (2.8%) | 5 (8.9%) |
| 75 Years and over | 0 (0.0%) | 32 (29.9%) |
Disability Class: Ambulatory Difficulty
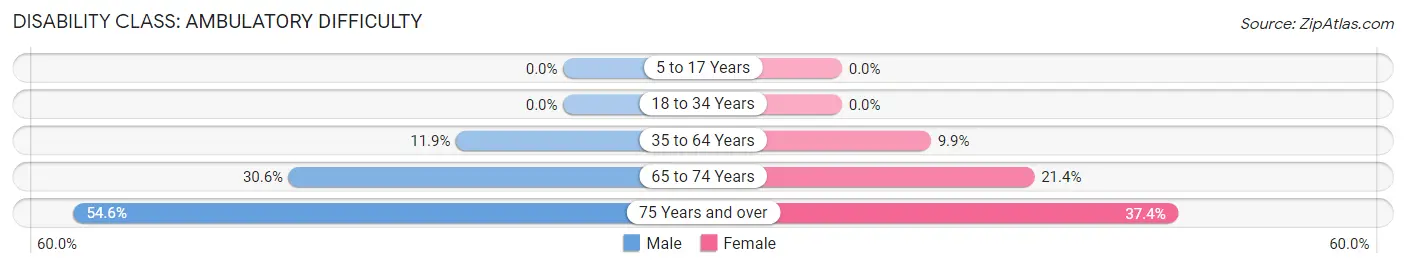
| Age Bracket | Male | Female |
| 5 to 17 Years | 0 (0.0%) | 0 (0.0%) |
| 18 to 34 Years | 0 (0.0%) | 0 (0.0%) |
| 35 to 64 Years | 41 (11.9%) | 30 (9.9%) |
| 65 to 74 Years | 22 (30.6%) | 12 (21.4%) |
| 75 Years and over | 12 (54.5%) | 40 (37.4%) |
Disability Class: Self-Care Difficulty
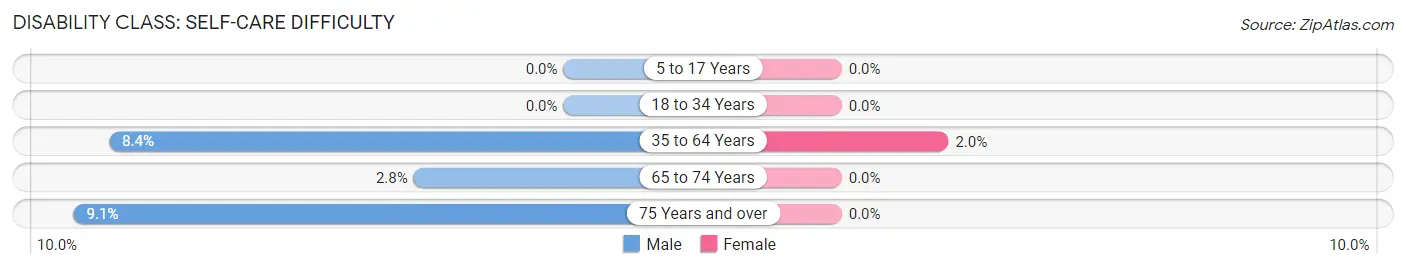
| Age Bracket | Male | Female |
| 5 to 17 Years | 0 (0.0%) | 0 (0.0%) |
| 18 to 34 Years | 0 (0.0%) | 0 (0.0%) |
| 35 to 64 Years | 29 (8.4%) | 6 (2.0%) |
| 65 to 74 Years | 2 (2.8%) | 0 (0.0%) |
| 75 Years and over | 2 (9.1%) | 0 (0.0%) |
Technology Access in Exmore
Computing Device Access in Exmore
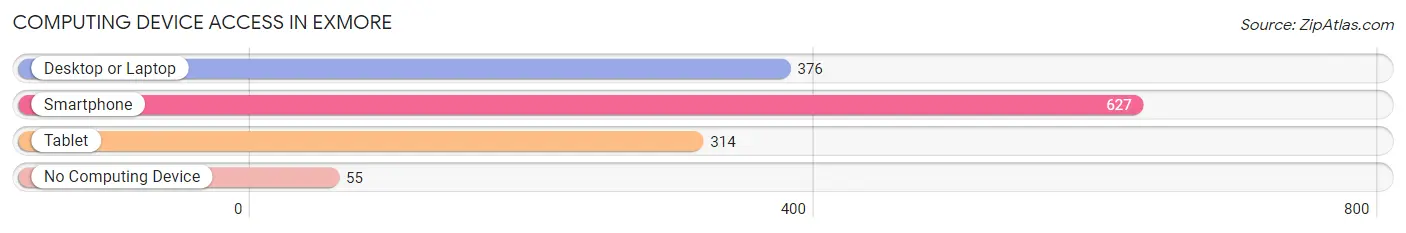
| Device Type | # Households | % Households |
| Desktop or Laptop | 376 | 53.2% |
| Smartphone | 627 | 88.7% |
| Tablet | 314 | 44.4% |
| No Computing Device | 55 | 7.8% |
| Total | 707 | 100.0% |
Internet Access in Exmore
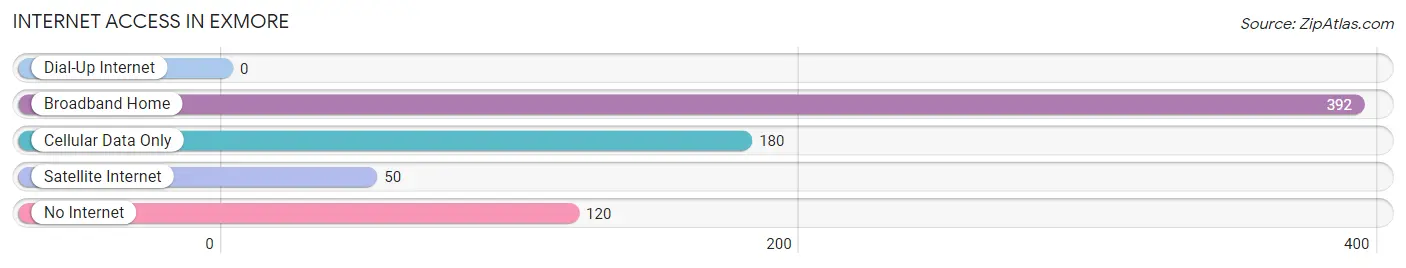
| Internet Type | # Households | % Households |
| Dial-Up Internet | 0 | 0.0% |
| Broadband Home | 392 | 55.4% |
| Cellular Data Only | 180 | 25.5% |
| Satellite Internet | 50 | 7.1% |
| No Internet | 120 | 17.0% |
| Total | 707 | 100.0% |
Exmore Summary
Exmore, Virginia is a small town located in Northampton County on the Eastern Shore of Virginia. It is situated on the banks of the Chesapeake Bay, and is part of the Hampton Roads metropolitan area. The town has a population of 1,845 as of the 2010 census, and is the largest town in Northampton County.
History
Exmore was founded in 1884 by the Norfolk and Southern Railroad. The town was named after the Exmore family, who were prominent landowners in the area. The town was incorporated in 1887, and the first mayor was William H. Exmore.
In the early 1900s, Exmore was a thriving agricultural and commercial center. The town was home to several large farms, as well as a number of businesses, including a cannery, a sawmill, and a brickyard. The town also had a thriving oyster industry, and was home to several seafood processing plants.
In the mid-1900s, Exmore began to decline as the railroad industry declined and the town's economy shifted to tourism. The town was home to several resorts, including the Exmore Beach Hotel, which was built in the 1920s. The hotel was a popular destination for tourists from the Hampton Roads area.
Geography
Exmore is located in Northampton County, Virginia, on the Eastern Shore of the Chesapeake Bay. The town is situated on the banks of the Chesapeake Bay, and is part of the Hampton Roads metropolitan area. The town has a total area of 1.3 square miles, all of which is land.
The town is located near the Chesapeake Bay Bridge-Tunnel, which connects the Eastern Shore of Virginia to the mainland. The town is also located near the Chesapeake Bay Bridge, which connects the Eastern Shore of Virginia to the mainland.
Economy
Exmore's economy is largely based on tourism and agriculture. The town is home to several resorts, including the Exmore Beach Hotel, which is a popular destination for tourists from the Hampton Roads area. The town is also home to several farms, which produce a variety of crops, including corn, soybeans, and wheat.
The town is also home to several seafood processing plants, which process oysters, clams, and other seafood. The town is also home to several boatyards, which build and repair boats.
Demographics
As of the 2010 census, Exmore had a population of 1,845. The racial makeup of the town was 79.3% White, 17.2% African American, 0.7% Native American, 0.3% Asian, 0.1% Pacific Islander, 0.7% from other races, and 1.9% from two or more races. Hispanic or Latino of any race were 2.2% of the population.
The median income for a household in Exmore was $37,917, and the median income for a family was $45,625. The per capita income for the town was $19,945. About 11.2% of families and 14.2% of the population were below the poverty line, including 19.2% of those under age 18 and 8.3% of those age 65 or over.
Common Questions
What is Per Capita Income in Exmore?
Per Capita income in Exmore is $22,191.
What is the Median Family Income in Exmore?
Median Family Income in Exmore is $54,926.
What is the Median Household income in Exmore?
Median Household Income in Exmore is $39,293.
What is Income or Wage Gap in Exmore?
Income or Wage Gap in Exmore is 39.3%.
Women in Exmore earn 60.7 cents for every dollar earned by a man.
What is Family Income Deficit in Exmore?
Family Income Deficit in Exmore is $10,536.
Families that are below poverty line in Exmore earn $10,536 less on average than the poverty threshold level.
What is Inequality or Gini Index in Exmore?
Inequality or Gini Index in Exmore is 0.49.
What is the Total Population of Exmore?
Total Population of Exmore is 1,744.
What is the Total Male Population of Exmore?
Total Male Population of Exmore is 866.
What is the Total Female Population of Exmore?
Total Female Population of Exmore is 878.
What is the Ratio of Males per 100 Females in Exmore?
There are 98.63 Males per 100 Females in Exmore.
What is the Ratio of Females per 100 Males in Exmore?
There are 101.39 Females per 100 Males in Exmore.
What is the Median Population Age in Exmore?
Median Population Age in Exmore is 36.2 Years.
What is the Average Family Size in Exmore
Average Family Size in Exmore is 3.4 People.
What is the Average Household Size in Exmore
Average Household Size in Exmore is 2.4 People.
How Large is the Labor Force in Exmore?
There are 777 People in the Labor Forcein in Exmore.
What is the Percentage of People in the Labor Force in Exmore?
56.2% of People are in the Labor Force in Exmore.
What is the Unemployment Rate in Exmore?
Unemployment Rate in Exmore is 6.7%.