Woodstock, VA Map & Demographics
Woodstock Map
Woodstock Overview
$33,999
PER CAPITA INCOME
$75,565
AVG FAMILY INCOME
$64,470
AVG HOUSEHOLD INCOME
20.4%
WAGE / INCOME GAP [ % ]
79.6¢/ $1
WAGE / INCOME GAP [ $ ]
0.51
INEQUALITY / GINI INDEX
5,798
TOTAL POPULATION
2,617
MALE POPULATION
3,181
FEMALE POPULATION
82.27
MALES / 100 FEMALES
121.55
FEMALES / 100 MALES
38.4
MEDIAN AGE
3.4
AVG FAMILY SIZE
2.6
AVG HOUSEHOLD SIZE
2,569
LABOR FORCE [ PEOPLE ]
59.6%
PERCENT IN LABOR FORCE
5.2%
UNEMPLOYMENT RATE
Woodstock Zip Codes
Woodstock Area Codes
Income in Woodstock
Income Overview in Woodstock
Per Capita Income in Woodstock is $33,999, while median incomes of families and households are $75,565 and $64,470 respectively.
| Characteristic | Number | Measure |
| Per Capita Income | 5,798 | $33,999 |
| Median Family Income | 1,305 | $75,565 |
| Mean Family Income | 1,305 | $80,725 |
| Median Household Income | 2,150 | $64,470 |
| Mean Household Income | 2,150 | $89,165 |
| Income Deficit | 1,305 | $0 |
| Wage / Income Gap (%) | 5,798 | 20.39% |
| Wage / Income Gap ($) | 5,798 | 79.61¢ per $1 |
| Gini / Inequality Index | 5,798 | 0.51 |
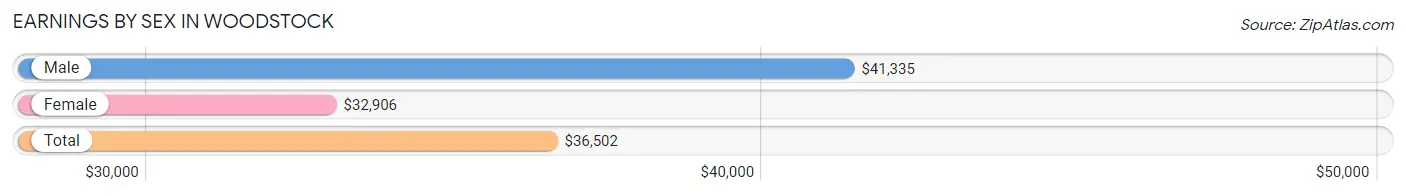
Earnings by Sex in Woodstock
Average Earnings in Woodstock are $36,502, $41,335 for men and $32,906 for women, a difference of 20.4%.
| Sex | Number | Average Earnings |
| Male | 1,447 (54.9%) | $41,335 |
| Female | 1,187 (45.1%) | $32,906 |
| Total | 2,634 (100.0%) | $36,502 |
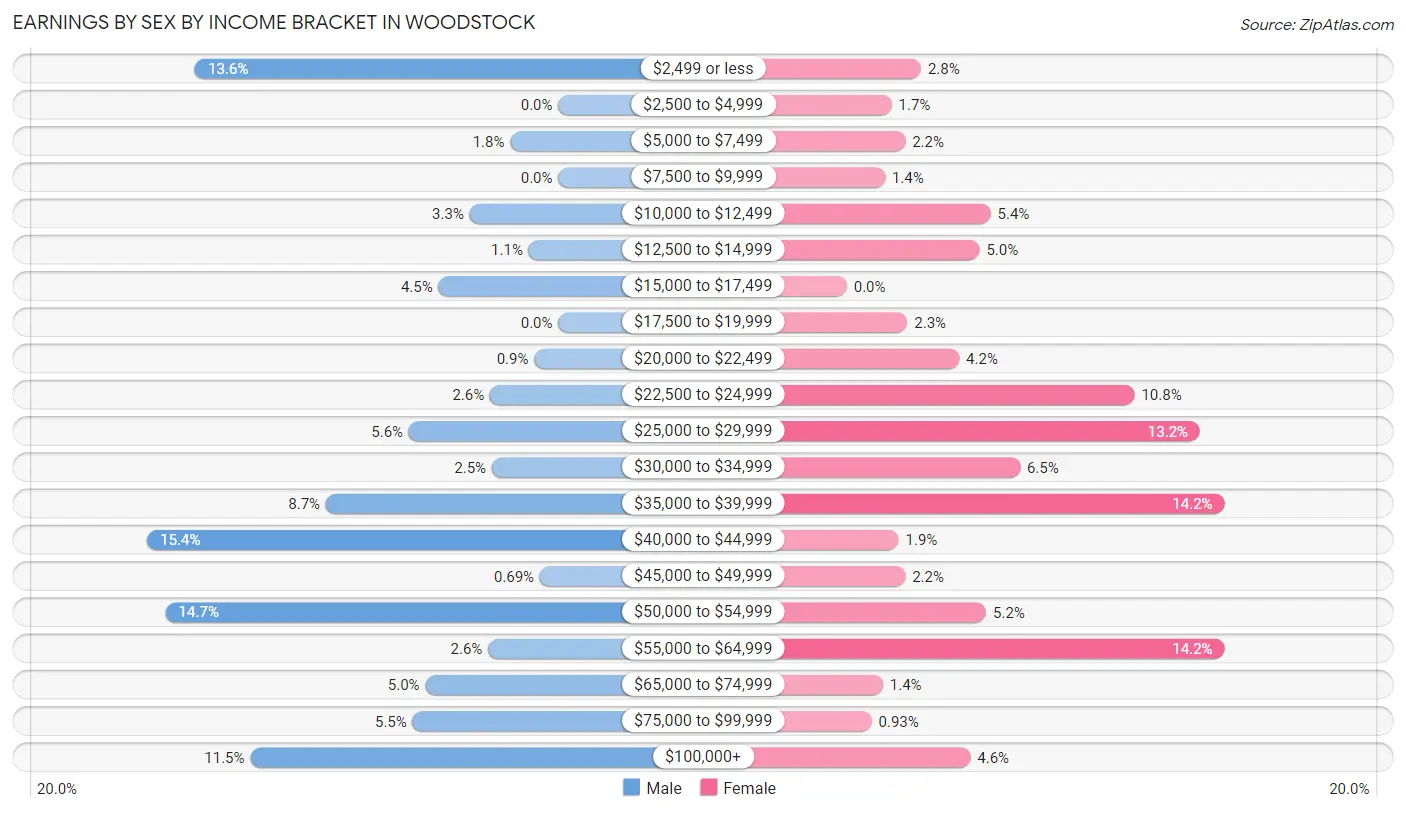
Earnings by Sex by Income Bracket in Woodstock
The most common earnings brackets in Woodstock are $40,000 to $44,999 for men (223 | 15.4%) and $35,000 to $39,999 for women (168 | 14.1%).
| Income | Male | Female |
| $2,499 or less | 197 (13.6%) | 33 (2.8%) |
| $2,500 to $4,999 | 0 (0.0%) | 20 (1.7%) |
| $5,000 to $7,499 | 26 (1.8%) | 26 (2.2%) |
| $7,500 to $9,999 | 0 (0.0%) | 17 (1.4%) |
| $10,000 to $12,499 | 48 (3.3%) | 64 (5.4%) |
| $12,500 to $14,999 | 16 (1.1%) | 59 (5.0%) |
| $15,000 to $17,499 | 65 (4.5%) | 0 (0.0%) |
| $17,500 to $19,999 | 0 (0.0%) | 27 (2.3%) |
| $20,000 to $22,499 | 13 (0.9%) | 50 (4.2%) |
| $22,500 to $24,999 | 37 (2.6%) | 128 (10.8%) |
| $25,000 to $29,999 | 81 (5.6%) | 157 (13.2%) |
| $30,000 to $34,999 | 36 (2.5%) | 77 (6.5%) |
| $35,000 to $39,999 | 126 (8.7%) | 168 (14.1%) |
| $40,000 to $44,999 | 223 (15.4%) | 23 (1.9%) |
| $45,000 to $49,999 | 10 (0.7%) | 26 (2.2%) |
| $50,000 to $54,999 | 213 (14.7%) | 62 (5.2%) |
| $55,000 to $64,999 | 38 (2.6%) | 168 (14.1%) |
| $65,000 to $74,999 | 72 (5.0%) | 16 (1.3%) |
| $75,000 to $99,999 | 79 (5.5%) | 11 (0.9%) |
| $100,000+ | 167 (11.5%) | 55 (4.6%) |
| Total | 1,447 (100.0%) | 1,187 (100.0%) |
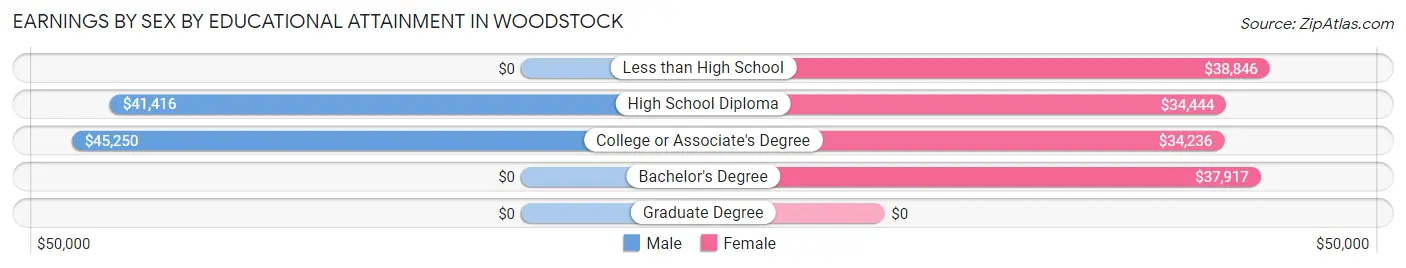
Earnings by Sex by Educational Attainment in Woodstock
Average earnings in Woodstock are $42,878 for men and $35,067 for women, a difference of 18.2%. Men with an educational attainment of college or associate's degree enjoy the highest average annual earnings of $45,250, while those with high school diploma education earn the least with $41,416. Women with an educational attainment of less than high school earn the most with the average annual earnings of $38,846, while those with college or associate's degree education have the smallest earnings of $34,236.
| Educational Attainment | Male Income | Female Income |
| Less than High School | - | - |
| High School Diploma | $41,416 | $34,444 |
| College or Associate's Degree | $45,250 | $34,236 |
| Bachelor's Degree | - | - |
| Graduate Degree | - | - |
| Total | $42,878 | $35,067 |
Family Income in Woodstock
Family Income Brackets in Woodstock
According to the Woodstock family income data, there are 360 families falling into the $75,000 to $99,999 income range, which is the most common income bracket and makes up 27.6% of all families. Conversely, the $25,000 to $34,999 income bracket is the least frequent group with only 39 families (3.0%) belonging to this category.
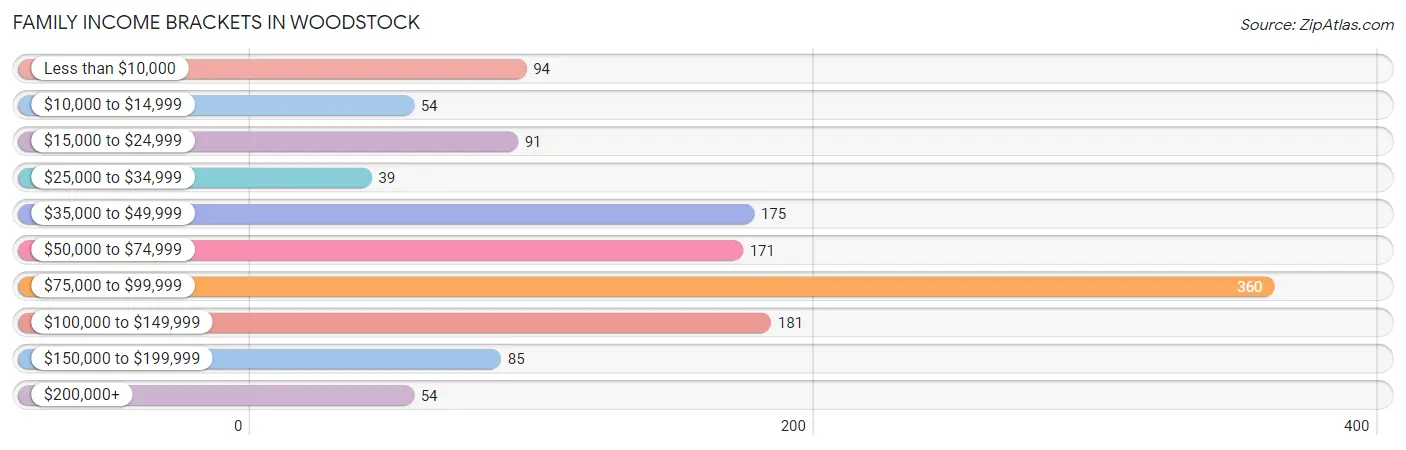
| Income Bracket | # Families | % Families |
| Less than $10,000 | 94 | 7.2% |
| $10,000 to $14,999 | 54 | 4.1% |
| $15,000 to $24,999 | 91 | 7.0% |
| $25,000 to $34,999 | 39 | 3.0% |
| $35,000 to $49,999 | 175 | 13.4% |
| $50,000 to $74,999 | 171 | 13.1% |
| $75,000 to $99,999 | 360 | 27.6% |
| $100,000 to $149,999 | 181 | 13.9% |
| $150,000 to $199,999 | 85 | 6.5% |
| $200,000+ | 54 | 4.1% |
Family Income by Famaliy Size in Woodstock
4-person families (353 | 27.1%) account for the highest median family income in Woodstock with $98,257 per family, while 2-person families (578 | 44.3%) have the highest median income of $36,916 per family member.
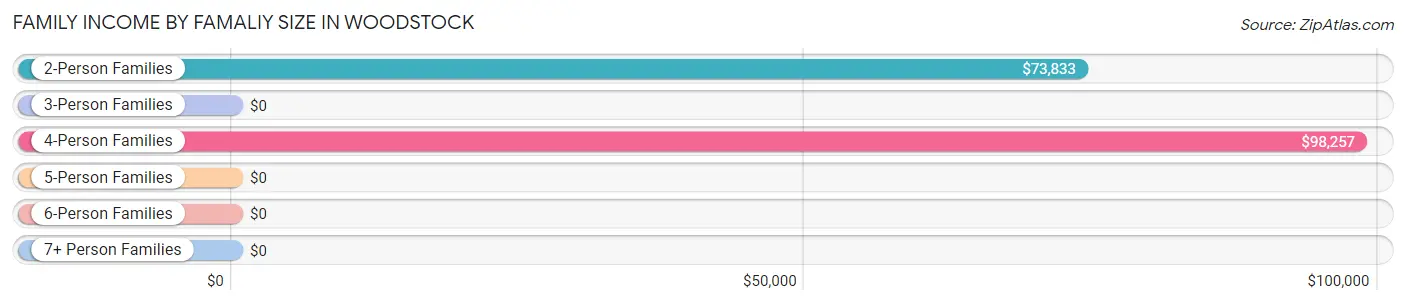
| Income Bracket | # Families | Median Income |
| 2-Person Families | 578 (44.3%) | $73,833 |
| 3-Person Families | 180 (13.8%) | $0 |
| 4-Person Families | 353 (27.1%) | $98,257 |
| 5-Person Families | 122 (9.3%) | $0 |
| 6-Person Families | 54 (4.1%) | $0 |
| 7+ Person Families | 18 (1.4%) | $0 |
| Total | 1,305 (100.0%) | $75,565 |
Family Income by Number of Earners in Woodstock
The median family income in Woodstock is $75,565, with families comprising 3+ earners (100) having the highest median family income of $98,697, while families with no earners (227) have the lowest median family income of $32,813, accounting for 7.7% and 17.4% of families, respectively.
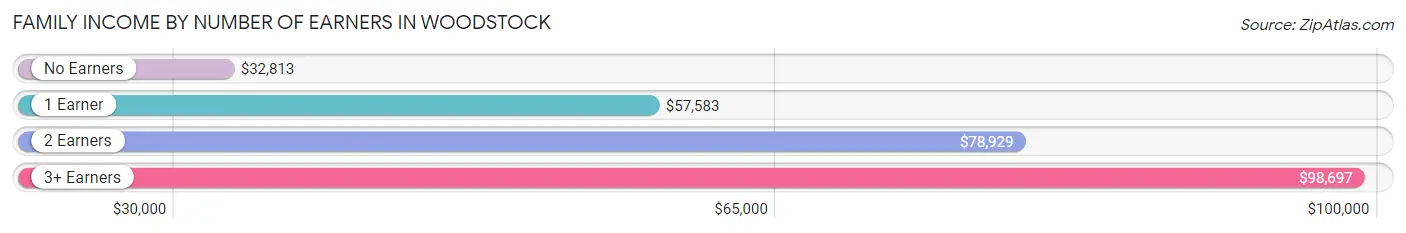
| Number of Earners | # Families | Median Income |
| No Earners | 227 (17.4%) | $32,813 |
| 1 Earner | 364 (27.9%) | $57,583 |
| 2 Earners | 614 (47.0%) | $78,929 |
| 3+ Earners | 100 (7.7%) | $98,697 |
| Total | 1,305 (100.0%) | $75,565 |
Household Income in Woodstock
Household Income Brackets in Woodstock
With 516 households falling in the category, the $75,000 to $99,999 income range is the most frequent in Woodstock, accounting for 24.0% of all households. In contrast, only 71 households (3.3%) fall into the $200,000+ income bracket, making it the least populous group.
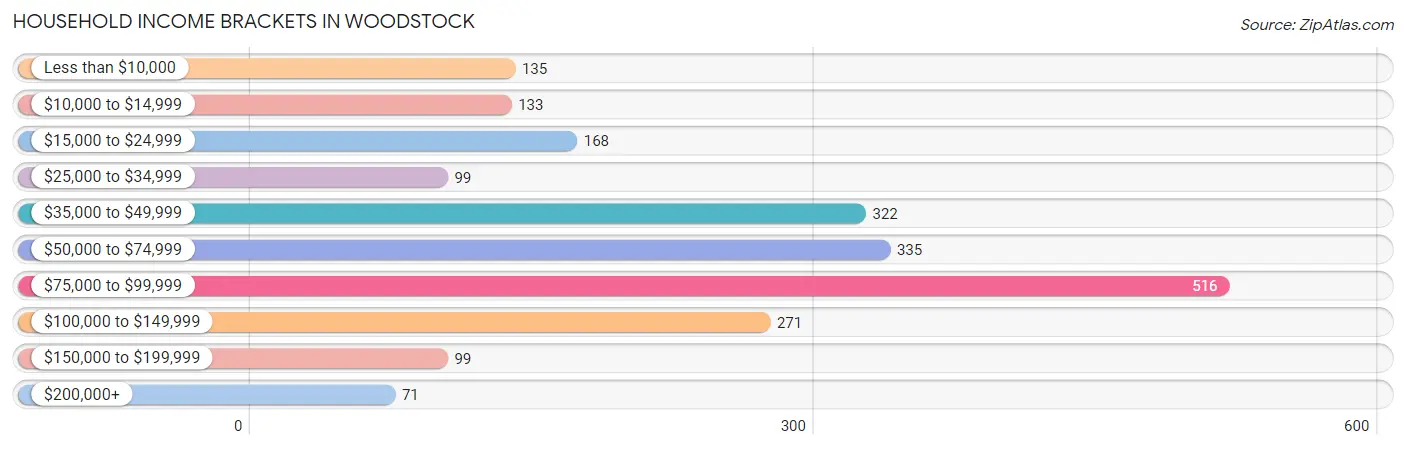
| Income Bracket | # Households | % Households |
| Less than $10,000 | 135 | 6.3% |
| $10,000 to $14,999 | 133 | 6.2% |
| $15,000 to $24,999 | 168 | 7.8% |
| $25,000 to $34,999 | 99 | 4.6% |
| $35,000 to $49,999 | 322 | 15.0% |
| $50,000 to $74,999 | 335 | 15.6% |
| $75,000 to $99,999 | 516 | 24.0% |
| $100,000 to $149,999 | 271 | 12.6% |
| $150,000 to $199,999 | 99 | 4.6% |
| $200,000+ | 71 | 3.3% |
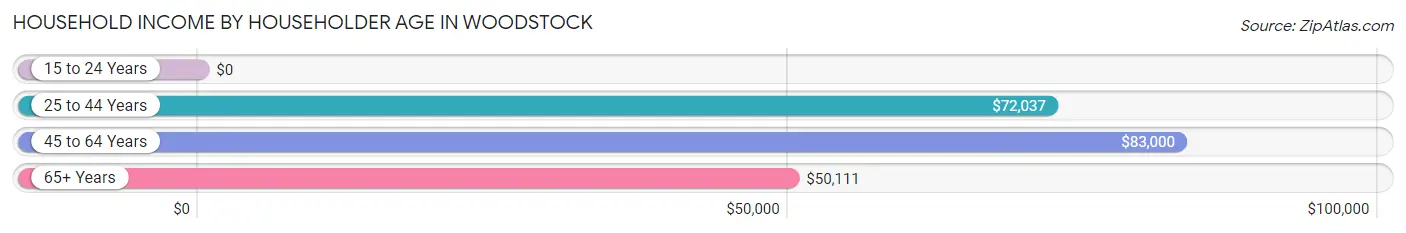
Household Income by Householder Age in Woodstock
The median household income in Woodstock is $64,470, with the highest median household income of $83,000 found in the 45 to 64 years age bracket for the primary householder. A total of 634 households (29.5%) fall into this category. Meanwhile, the 15 to 24 years age bracket for the primary householder has the lowest median household income of $0, with 154 households (7.2%) in this group.
| Income Bracket | # Households | Median Income |
| 15 to 24 Years | 154 (7.2%) | $0 |
| 25 to 44 Years | 814 (37.9%) | $72,037 |
| 45 to 64 Years | 634 (29.5%) | $83,000 |
| 65+ Years | 548 (25.5%) | $50,111 |
| Total | 2,150 (100.0%) | $64,470 |
Poverty in Woodstock
Income Below Poverty by Sex and Age in Woodstock
With 14.8% poverty level for males and 31.1% for females among the residents of Woodstock, 6 to 11 year old males and 16 and 17 year old females are the most vulnerable to poverty, with 172 males (59.9%) and 42 females (100.0%) in their respective age groups living below the poverty level.
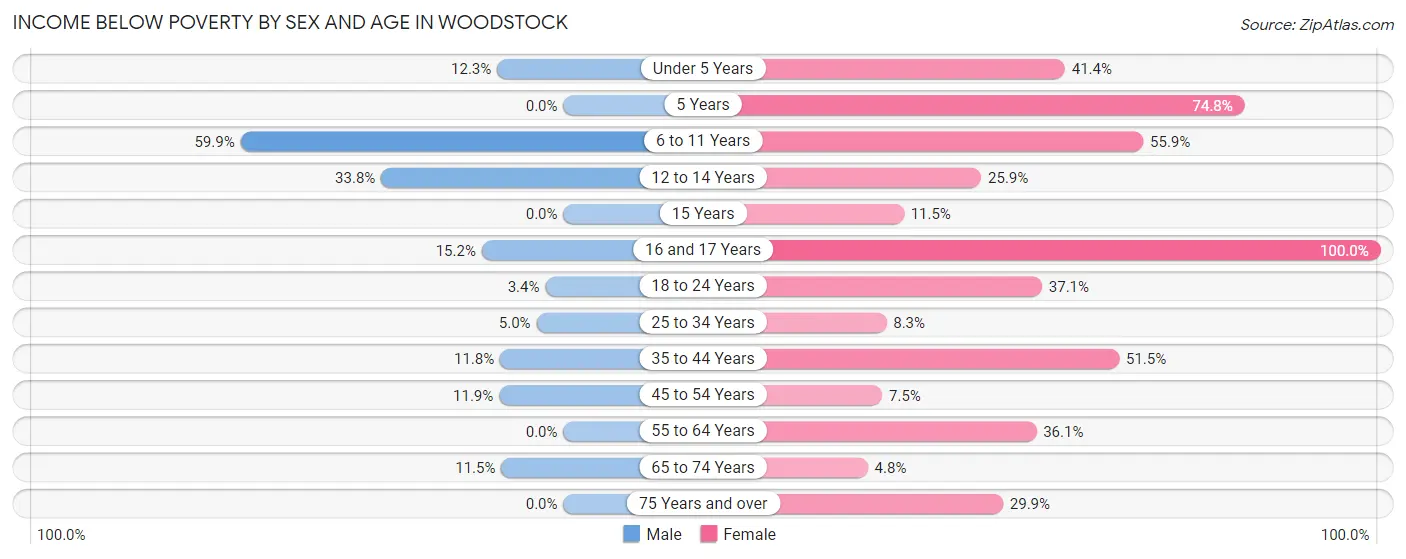
| Age Bracket | Male | Female |
| Under 5 Years | 22 (12.3%) | 125 (41.4%) |
| 5 Years | 0 (0.0%) | 77 (74.8%) |
| 6 to 11 Years | 172 (59.9%) | 151 (55.9%) |
| 12 to 14 Years | 46 (33.8%) | 15 (25.9%) |
| 15 Years | 0 (0.0%) | 10 (11.5%) |
| 16 and 17 Years | 10 (15.1%) | 42 (100.0%) |
| 18 to 24 Years | 7 (3.4%) | 78 (37.1%) |
| 25 to 34 Years | 19 (5.0%) | 29 (8.3%) |
| 35 to 44 Years | 55 (11.7%) | 159 (51.5%) |
| 45 to 54 Years | 31 (11.9%) | 30 (7.5%) |
| 55 to 64 Years | 0 (0.0%) | 118 (36.1%) |
| 65 to 74 Years | 19 (11.5%) | 12 (4.8%) |
| 75 Years and over | 0 (0.0%) | 87 (29.9%) |
| Total | 381 (14.8%) | 933 (31.1%) |
Income Above Poverty by Sex and Age in Woodstock
According to the poverty statistics in Woodstock, males aged 5 years and females aged 65 to 74 years are the age groups that are most secure financially, with 100.0% of males and 95.2% of females in these age groups living above the poverty line.
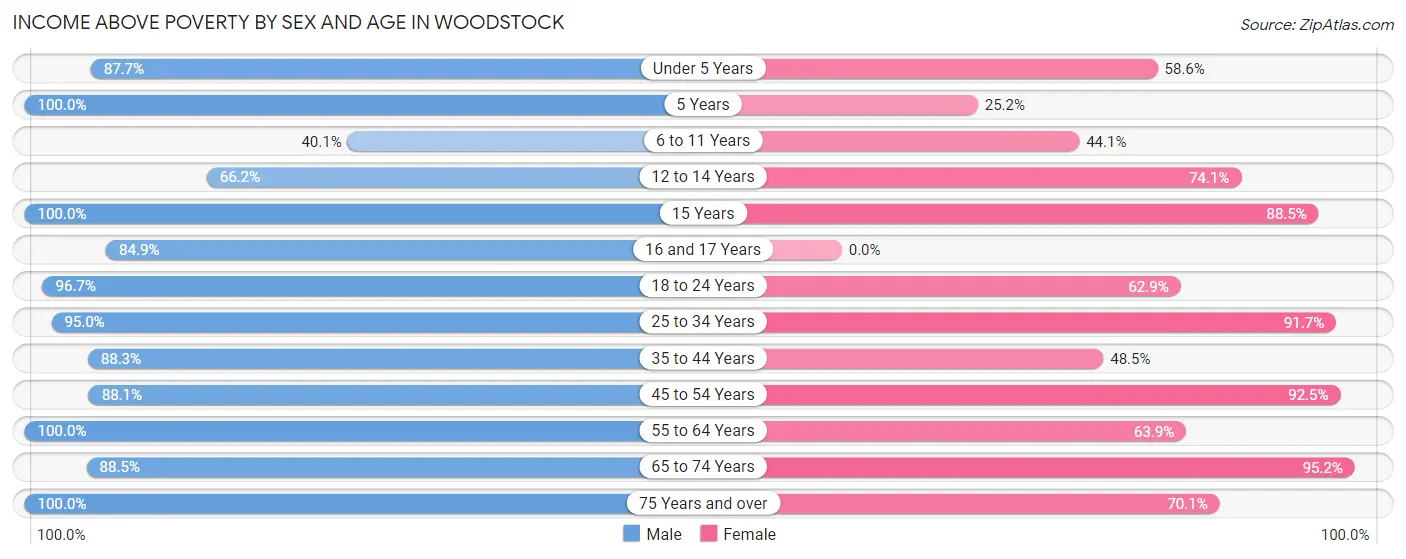
| Age Bracket | Male | Female |
| Under 5 Years | 157 (87.7%) | 177 (58.6%) |
| 5 Years | 34 (100.0%) | 26 (25.2%) |
| 6 to 11 Years | 115 (40.1%) | 119 (44.1%) |
| 12 to 14 Years | 90 (66.2%) | 43 (74.1%) |
| 15 Years | 18 (100.0%) | 77 (88.5%) |
| 16 and 17 Years | 56 (84.9%) | 0 (0.0%) |
| 18 to 24 Years | 202 (96.7%) | 132 (62.9%) |
| 25 to 34 Years | 362 (95.0%) | 322 (91.7%) |
| 35 to 44 Years | 413 (88.2%) | 150 (48.5%) |
| 45 to 54 Years | 229 (88.1%) | 371 (92.5%) |
| 55 to 64 Years | 214 (100.0%) | 209 (63.9%) |
| 65 to 74 Years | 146 (88.5%) | 238 (95.2%) |
| 75 Years and over | 165 (100.0%) | 204 (70.1%) |
| Total | 2,201 (85.2%) | 2,068 (68.9%) |
Income Below Poverty Among Married-Couple Families in Woodstock
The poverty statistics for married-couple families in Woodstock show that 6.8% or 54 of the total 798 families live below the poverty line. Families with 3 or 4 children have the highest poverty rate of 49.5%, comprising of 54 families. On the other hand, families with no children have the lowest poverty rate of 0.0%, which includes 0 families.
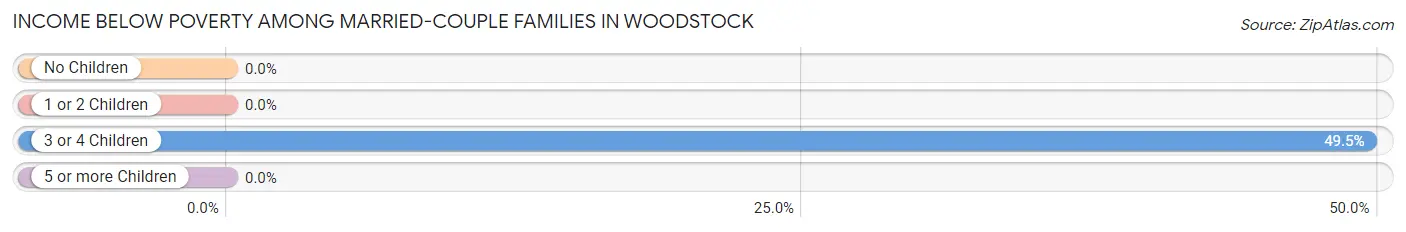
| Children | Above Poverty | Below Poverty |
| No Children | 362 (100.0%) | 0 (0.0%) |
| 1 or 2 Children | 309 (100.0%) | 0 (0.0%) |
| 3 or 4 Children | 55 (50.5%) | 54 (49.5%) |
| 5 or more Children | 18 (100.0%) | 0 (0.0%) |
| Total | 744 (93.2%) | 54 (6.8%) |
Income Below Poverty Among Single-Parent Households in Woodstock
According to the poverty data in Woodstock, 5.0% or 6 single-father households and 53.1% or 206 single-mother households are living below the poverty line. Among single-father households, those with no children have the highest poverty rate, with 6 households (5.0%) experiencing poverty. Likewise, among single-mother households, those with 3 or 4 children have the highest poverty rate, with 108 households (100.0%) falling below the poverty line.
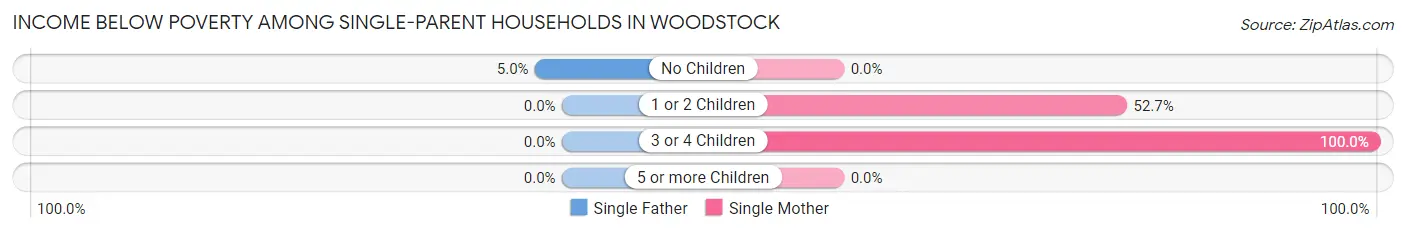
| Children | Single Father | Single Mother |
| No Children | 6 (5.0%) | 0 (0.0%) |
| 1 or 2 Children | 0 (0.0%) | 98 (52.7%) |
| 3 or 4 Children | 0 (0.0%) | 108 (100.0%) |
| 5 or more Children | 0 (0.0%) | 0 (0.0%) |
| Total | 6 (5.0%) | 206 (53.1%) |
Income Below Poverty Among Married-Couple vs Single-Parent Households in Woodstock
The poverty data for Woodstock shows that 54 of the married-couple family households (6.8%) and 212 of the single-parent households (41.8%) are living below the poverty level. Within the married-couple family households, those with 3 or 4 children have the highest poverty rate, with 54 households (49.5%) falling below the poverty line. Among the single-parent households, those with 3 or 4 children have the highest poverty rate, with 108 household (100.0%) living below poverty.
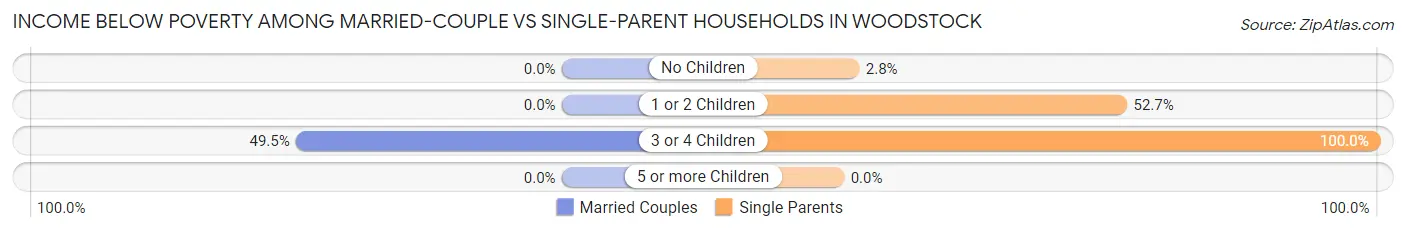
| Children | Married-Couple Families | Single-Parent Households |
| No Children | 0 (0.0%) | 6 (2.8%) |
| 1 or 2 Children | 0 (0.0%) | 98 (52.7%) |
| 3 or 4 Children | 54 (49.5%) | 108 (100.0%) |
| 5 or more Children | 0 (0.0%) | 0 (0.0%) |
| Total | 54 (6.8%) | 212 (41.8%) |
Race in Woodstock
The most populous races in Woodstock are White / Caucasian (4,361 | 75.2%), Hispanic or Latino (1,093 | 18.9%), and Two or more Races (625 | 10.8%).
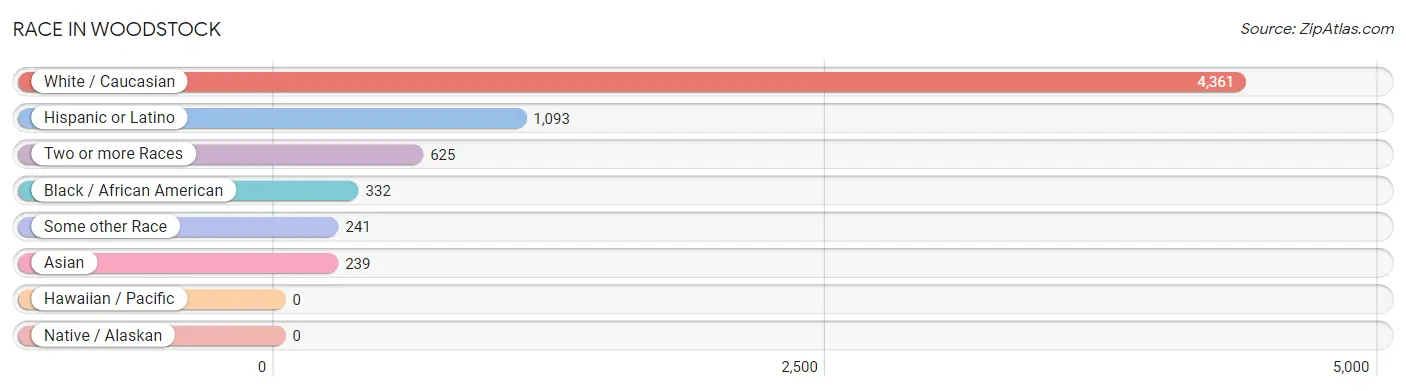
| Race | # Population | % Population |
| Asian | 239 | 4.1% |
| Black / African American | 332 | 5.7% |
| Hawaiian / Pacific | 0 | 0.0% |
| Hispanic or Latino | 1,093 | 18.9% |
| Native / Alaskan | 0 | 0.0% |
| White / Caucasian | 4,361 | 75.2% |
| Two or more Races | 625 | 10.8% |
| Some other Race | 241 | 4.2% |
| Total | 5,798 | 100.0% |
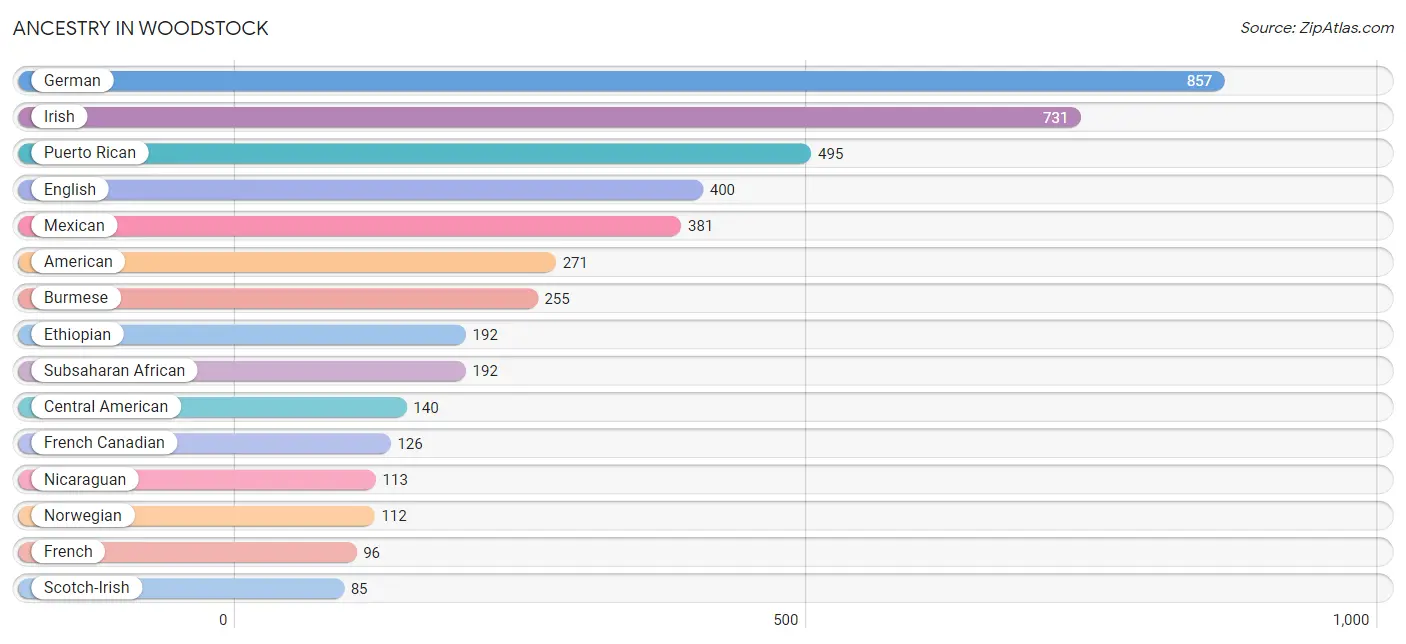
Ancestry in Woodstock
The most populous ancestries reported in Woodstock are German (857 | 14.8%), Irish (731 | 12.6%), Puerto Rican (495 | 8.5%), English (400 | 6.9%), and Mexican (381 | 6.6%), together accounting for 49.4% of all Woodstock residents.
| Ancestry | # Population | % Population |
| American | 271 | 4.7% |
| Belgian | 11 | 0.2% |
| Burmese | 255 | 4.4% |
| Central American | 140 | 2.4% |
| Costa Rican | 27 | 0.5% |
| Cuban | 57 | 1.0% |
| Dutch | 19 | 0.3% |
| English | 400 | 6.9% |
| Ethiopian | 192 | 3.3% |
| European | 12 | 0.2% |
| French | 96 | 1.7% |
| French Canadian | 126 | 2.2% |
| German | 857 | 14.8% |
| Greek | 15 | 0.3% |
| Irish | 731 | 12.6% |
| Italian | 68 | 1.2% |
| Mexican | 381 | 6.6% |
| Nicaraguan | 113 | 1.9% |
| Norwegian | 112 | 1.9% |
| Peruvian | 20 | 0.3% |
| Polish | 71 | 1.2% |
| Puerto Rican | 495 | 8.5% |
| Scotch-Irish | 85 | 1.5% |
| Scottish | 28 | 0.5% |
| Slovene | 13 | 0.2% |
| South American | 20 | 0.3% |
| Subsaharan African | 192 | 3.3% |
| Swedish | 77 | 1.3% |
| Swiss | 23 | 0.4% |
| Welsh | 55 | 0.9% | View All 30 Rows |
Immigrants in Woodstock
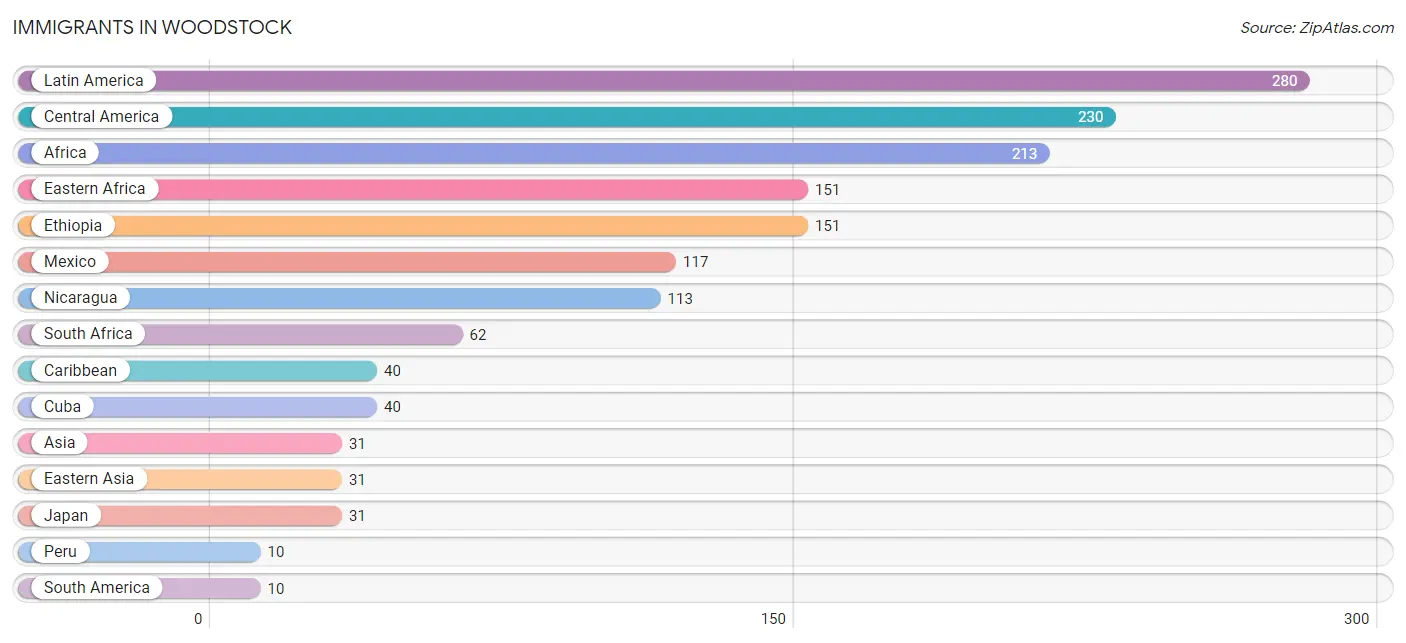
The most numerous immigrant groups reported in Woodstock came from Latin America (280 | 4.8%), Central America (230 | 4.0%), Africa (213 | 3.7%), Eastern Africa (151 | 2.6%), and Ethiopia (151 | 2.6%), together accounting for 17.7% of all Woodstock residents.
| Immigration Origin | # Population | % Population |
| Africa | 213 | 3.7% |
| Asia | 31 | 0.5% |
| Caribbean | 40 | 0.7% |
| Central America | 230 | 4.0% |
| Cuba | 40 | 0.7% |
| Eastern Africa | 151 | 2.6% |
| Eastern Asia | 31 | 0.5% |
| Ethiopia | 151 | 2.6% |
| Japan | 31 | 0.5% |
| Latin America | 280 | 4.8% |
| Mexico | 117 | 2.0% |
| Nicaragua | 113 | 1.9% |
| Peru | 10 | 0.2% |
| South Africa | 62 | 1.1% |
| South America | 10 | 0.2% | View All 15 Rows |
Sex and Age in Woodstock
Sex and Age in Woodstock
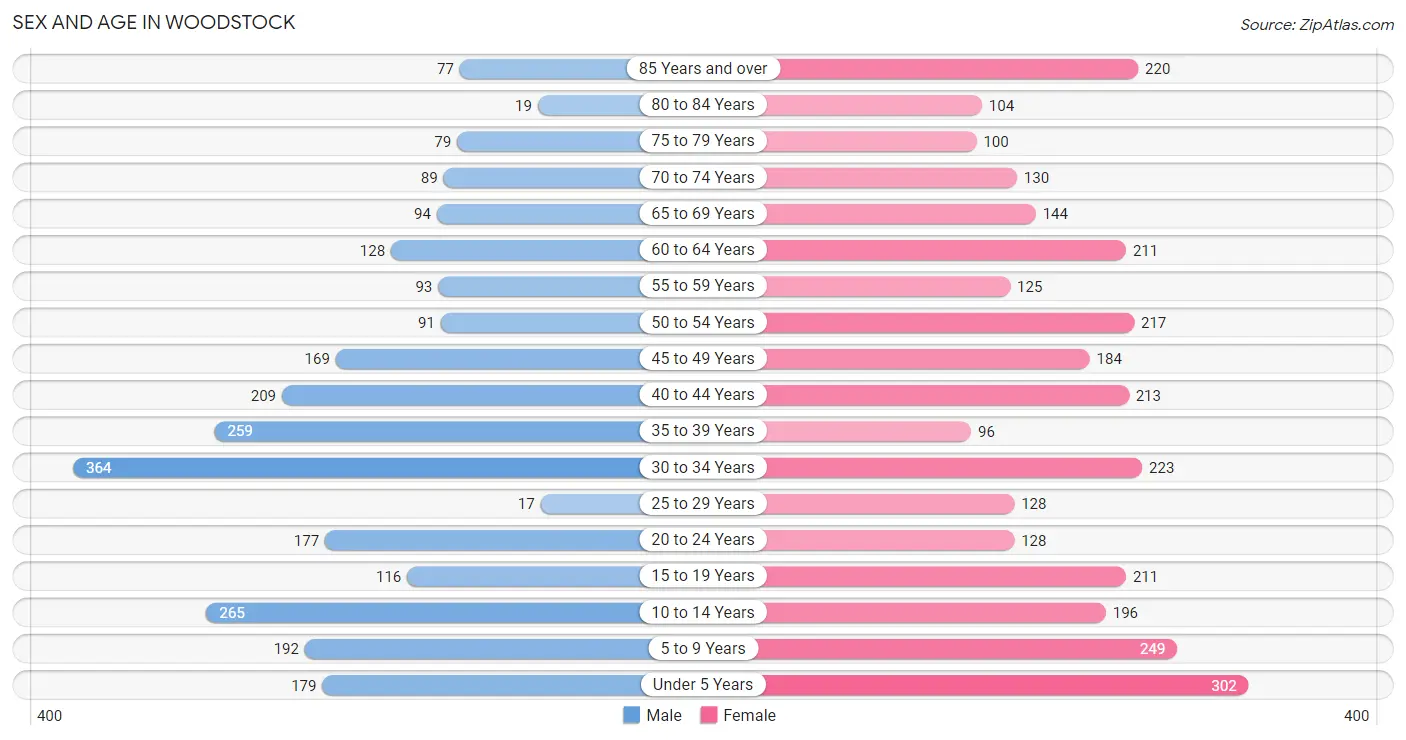
The most populous age groups in Woodstock are 30 to 34 Years (364 | 13.9%) for men and Under 5 Years (302 | 9.5%) for women.
| Age Bracket | Male | Female |
| Under 5 Years | 179 (6.8%) | 302 (9.5%) |
| 5 to 9 Years | 192 (7.3%) | 249 (7.8%) |
| 10 to 14 Years | 265 (10.1%) | 196 (6.2%) |
| 15 to 19 Years | 116 (4.4%) | 211 (6.6%) |
| 20 to 24 Years | 177 (6.8%) | 128 (4.0%) |
| 25 to 29 Years | 17 (0.6%) | 128 (4.0%) |
| 30 to 34 Years | 364 (13.9%) | 223 (7.0%) |
| 35 to 39 Years | 259 (9.9%) | 96 (3.0%) |
| 40 to 44 Years | 209 (8.0%) | 213 (6.7%) |
| 45 to 49 Years | 169 (6.5%) | 184 (5.8%) |
| 50 to 54 Years | 91 (3.5%) | 217 (6.8%) |
| 55 to 59 Years | 93 (3.5%) | 125 (3.9%) |
| 60 to 64 Years | 128 (4.9%) | 211 (6.6%) |
| 65 to 69 Years | 94 (3.6%) | 144 (4.5%) |
| 70 to 74 Years | 89 (3.4%) | 130 (4.1%) |
| 75 to 79 Years | 79 (3.0%) | 100 (3.1%) |
| 80 to 84 Years | 19 (0.7%) | 104 (3.3%) |
| 85 Years and over | 77 (2.9%) | 220 (6.9%) |
| Total | 2,617 (100.0%) | 3,181 (100.0%) |
Families and Households in Woodstock
Median Family Size in Woodstock
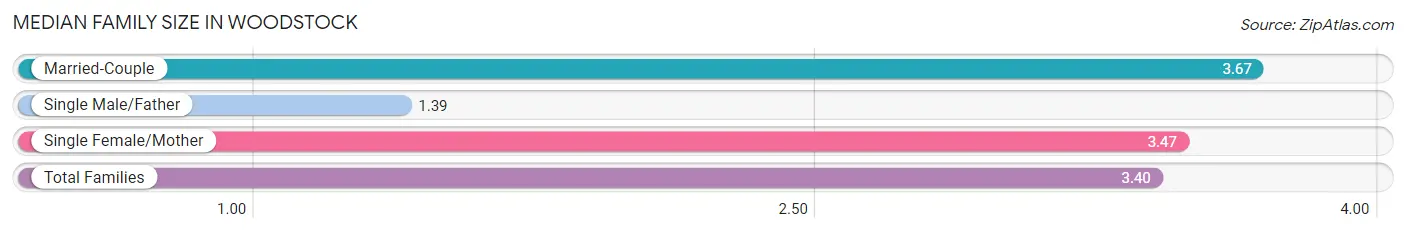
The median family size in Woodstock is 3.40 persons per family, with married-couple families (798 | 61.2%) accounting for the largest median family size of 3.67 persons per family. On the other hand, single male/father families (119 | 9.1%) represent the smallest median family size with 1.39 persons per family.
| Family Type | # Families | Family Size |
| Married-Couple | 798 (61.2%) | 3.67 |
| Single Male/Father | 119 (9.1%) | 1.39 |
| Single Female/Mother | 388 (29.7%) | 3.47 |
| Total Families | 1,305 (100.0%) | 3.40 |
Median Household Size in Woodstock
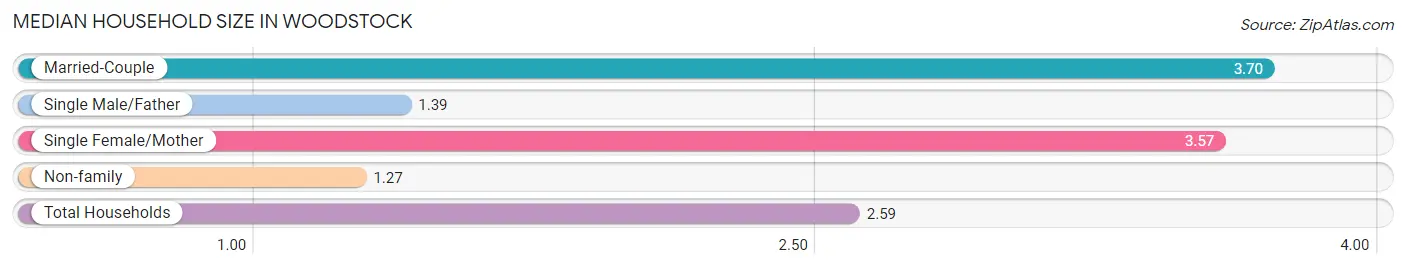
The median household size in Woodstock is 2.59 persons per household, with married-couple households (798 | 37.1%) accounting for the largest median household size of 3.7 persons per household. non-family households (845 | 39.3%) represent the smallest median household size with 1.27 persons per household.
| Household Type | # Households | Household Size |
| Married-Couple | 798 (37.1%) | 3.70 |
| Single Male/Father | 119 (5.5%) | 1.39 |
| Single Female/Mother | 388 (18.0%) | 3.57 |
| Non-family | 845 (39.3%) | 1.27 |
| Total Households | 2,150 (100.0%) | 2.59 |
Household Size by Marriage Status in Woodstock
Out of a total of 2,150 households in Woodstock, 1,305 (60.7%) are family households, while 845 (39.3%) are nonfamily households. The most numerous type of family households are 2-person households, comprising 569, and the most common type of nonfamily households are 1-person households, comprising 727.
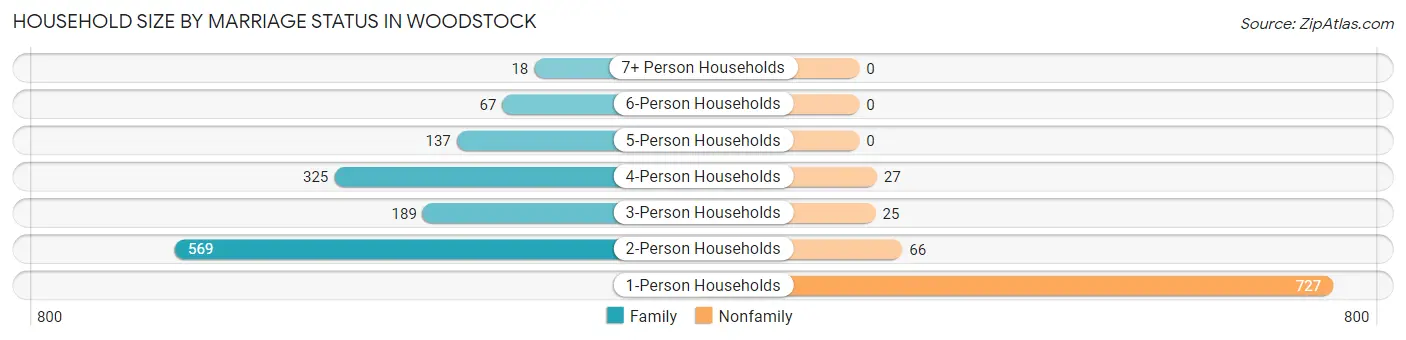
| Household Size | Family Households | Nonfamily Households |
| 1-Person Households | - | 727 (33.8%) |
| 2-Person Households | 569 (26.5%) | 66 (3.1%) |
| 3-Person Households | 189 (8.8%) | 25 (1.2%) |
| 4-Person Households | 325 (15.1%) | 27 (1.3%) |
| 5-Person Households | 137 (6.4%) | 0 (0.0%) |
| 6-Person Households | 67 (3.1%) | 0 (0.0%) |
| 7+ Person Households | 18 (0.8%) | 0 (0.0%) |
| Total | 1,305 (60.7%) | 845 (39.3%) |
Female Fertility in Woodstock
Fertility by Age in Woodstock
Average fertility rate in Woodstock is 42.0 births per 1,000 women. Women in the age bracket of 35 to 50 years have the highest fertility rate with 80.0 births per 1,000 women. Women in the age bracket of 35 to 50 years acount for 82.0% of all women with births.
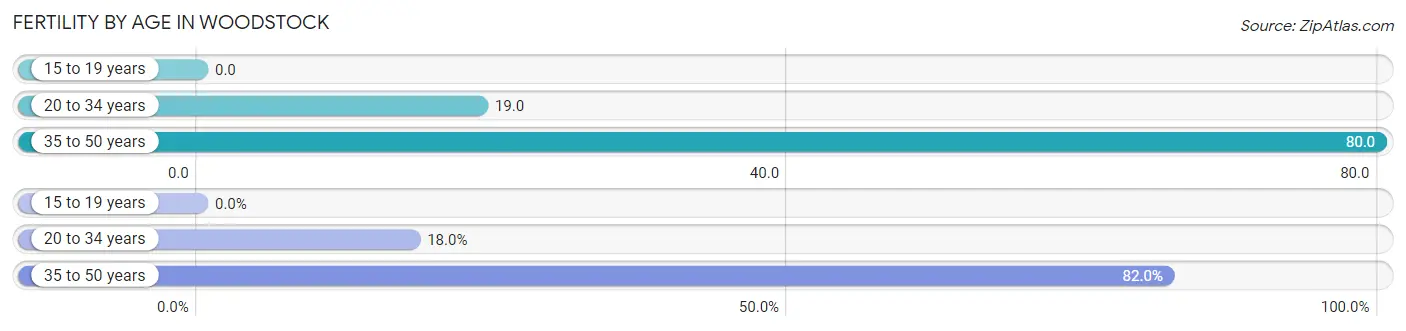
| Age Bracket | Women with Births | Births / 1,000 Women |
| 15 to 19 years | 0 (0.0%) | 0.0 |
| 20 to 34 years | 9 (18.0%) | 19.0 |
| 35 to 50 years | 41 (82.0%) | 80.0 |
| Total | 50 (100.0%) | 42.0 |
Fertility by Age by Marriage Status in Woodstock
82.0% of women with births (50) in Woodstock are married. The highest percentage of unmarried women with births falls into 20 to 34 years age bracket with 100.0% of them unmarried at the time of birth, while the lowest percentage of unmarried women with births belong to 35 to 50 years age bracket with 0.0% of them unmarried.
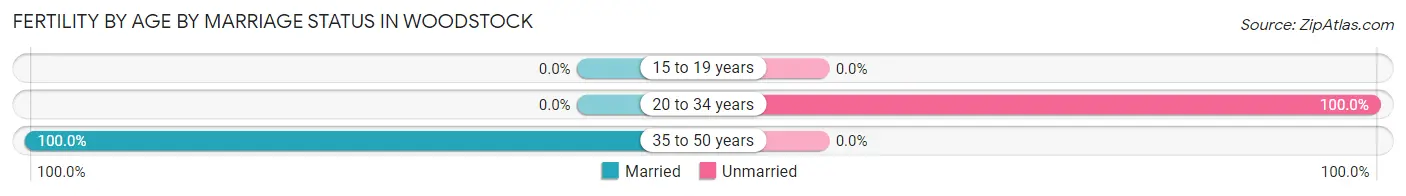
| Age Bracket | Married | Unmarried |
| 15 to 19 years | 0 (0.0%) | 0 (0.0%) |
| 20 to 34 years | 0 (0.0%) | 9 (100.0%) |
| 35 to 50 years | 41 (100.0%) | 0 (0.0%) |
| Total | 41 (82.0%) | 9 (18.0%) |
Fertility by Education in Woodstock
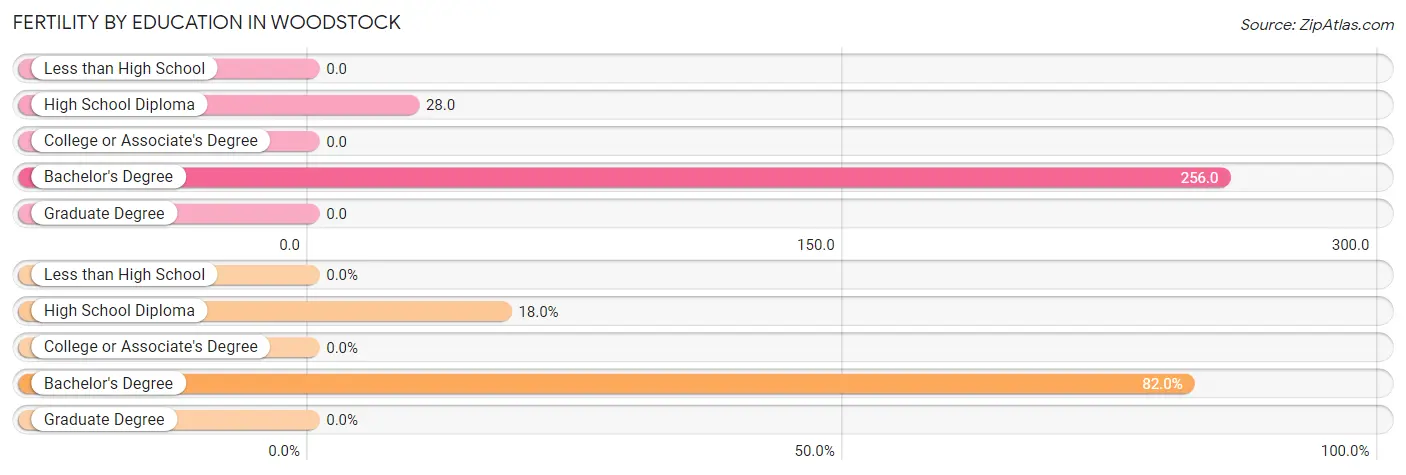
| Educational Attainment | Women with Births | Births / 1,000 Women |
| Less than High School | 0 (0.0%) | 0.0 |
| High School Diploma | 9 (18.0%) | 28.0 |
| College or Associate's Degree | 0 (0.0%) | 0.0 |
| Bachelor's Degree | 41 (82.0%) | 256.0 |
| Graduate Degree | 0 (0.0%) | 0.0 |
| Total | 50 (100.0%) | 42.0 |
Fertility by Education by Marriage Status in Woodstock
18.0% of women with births in Woodstock are unmarried. Women with the educational attainment of bachelor's degree are most likely to be married with 100.0% of them married at childbirth, while women with the educational attainment of high school diploma are least likely to be married with 100.0% of them unmarried at childbirth.
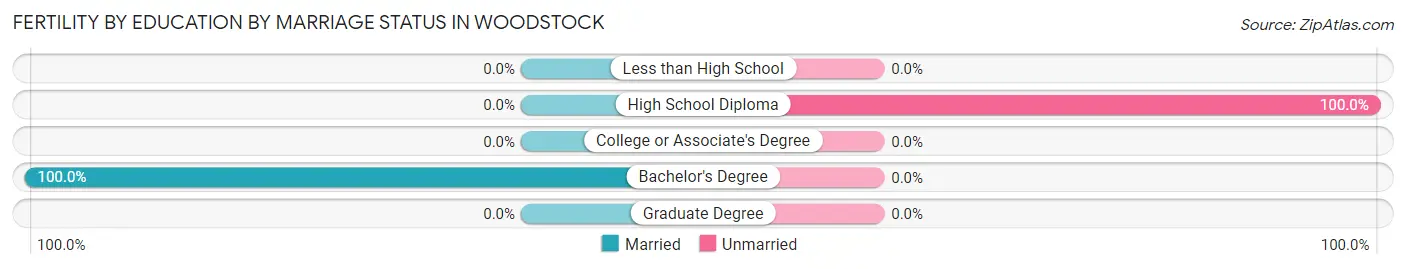
| Educational Attainment | Married | Unmarried |
| Less than High School | 0 (0.0%) | 0 (0.0%) |
| High School Diploma | 0 (0.0%) | 9 (100.0%) |
| College or Associate's Degree | 0 (0.0%) | 0 (0.0%) |
| Bachelor's Degree | 41 (100.0%) | 0 (0.0%) |
| Graduate Degree | 0 (0.0%) | 0 (0.0%) |
| Total | 41 (82.0%) | 9 (18.0%) |
Employment Characteristics in Woodstock
Employment by Class of Employer in Woodstock
Among the 2,407 employed individuals in Woodstock, private company employees (1,725 | 71.7%), local government employees (331 | 13.8%), and not-for-profit organizations (149 | 6.2%) make up the most common classes of employment.
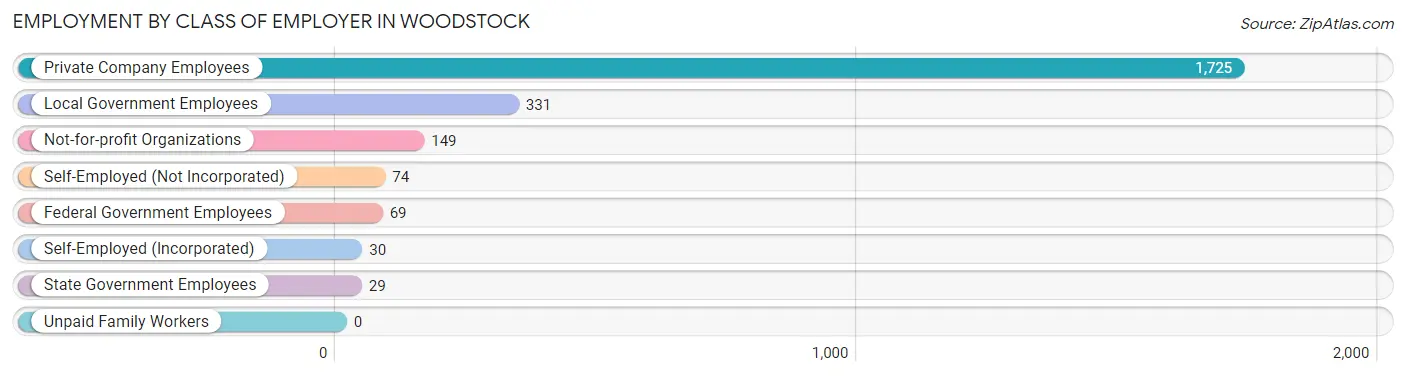
| Employer Class | # Employees | % Employees |
| Private Company Employees | 1,725 | 71.7% |
| Self-Employed (Incorporated) | 30 | 1.3% |
| Self-Employed (Not Incorporated) | 74 | 3.1% |
| Not-for-profit Organizations | 149 | 6.2% |
| Local Government Employees | 331 | 13.8% |
| State Government Employees | 29 | 1.2% |
| Federal Government Employees | 69 | 2.9% |
| Unpaid Family Workers | 0 | 0.0% |
| Total | 2,407 | 100.0% |
Employment Status by Age in Woodstock
According to the labor force statistics for Woodstock, out of the total population over 16 years of age (4,310), 59.6% or 2,569 individuals are in the labor force, with 5.2% or 134 of them unemployed. The age group with the highest labor force participation rate is 30 to 34 years, with 93.5% or 549 individuals in the labor force. Within the labor force, the 20 to 24 years age range has the highest percentage of unemployed individuals, with 29.7% or 63 of them being unemployed.
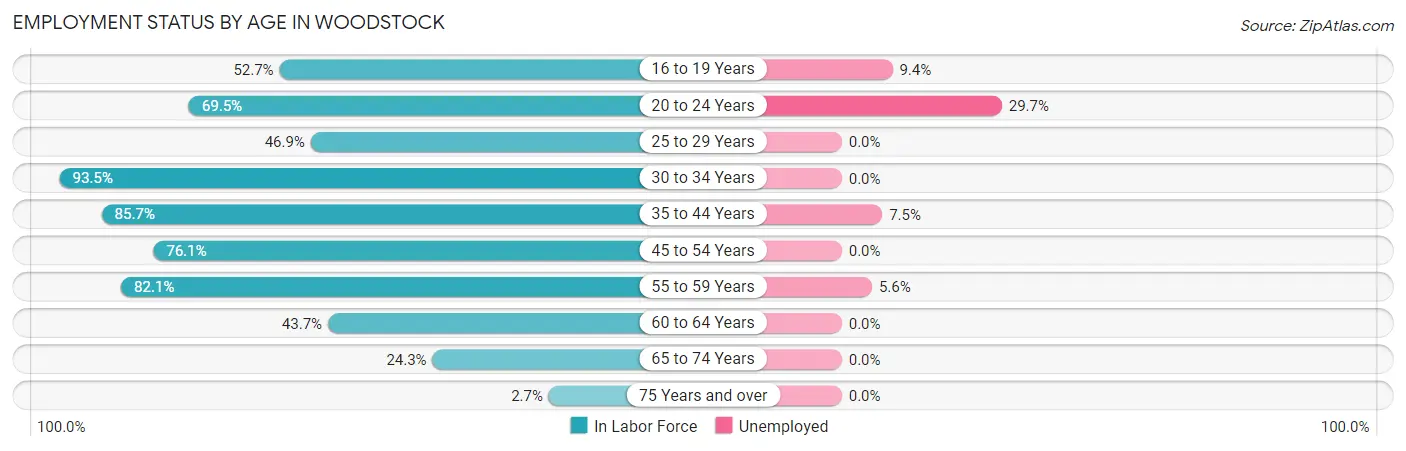
| Age Bracket | In Labor Force | Unemployed |
| 16 to 19 Years | 117 (52.7%) | 11 (9.4%) |
| 20 to 24 Years | 212 (69.5%) | 63 (29.7%) |
| 25 to 29 Years | 68 (46.9%) | 0 (0.0%) |
| 30 to 34 Years | 549 (93.5%) | 0 (0.0%) |
| 35 to 44 Years | 666 (85.7%) | 50 (7.5%) |
| 45 to 54 Years | 503 (76.1%) | 0 (0.0%) |
| 55 to 59 Years | 179 (82.1%) | 10 (5.6%) |
| 60 to 64 Years | 148 (43.7%) | 0 (0.0%) |
| 65 to 74 Years | 111 (24.3%) | 0 (0.0%) |
| 75 Years and over | 16 (2.7%) | 0 (0.0%) |
| Total | 2,569 (59.6%) | 134 (5.2%) |
Employment Status by Educational Attainment in Woodstock
According to labor force statistics for Woodstock, 77.5% of individuals (2,113) out of the total population between 25 and 64 years of age (2,727) are in the labor force, with 2.8% or 59 of them being unemployed. The group with the highest labor force participation rate are those with the educational attainment of high school diploma, with 88.1% or 848 individuals in the labor force. Within the labor force, individuals with bachelor's degree or higher education have the highest percentage of unemployment, with 5.0% or 34 of them being unemployed.
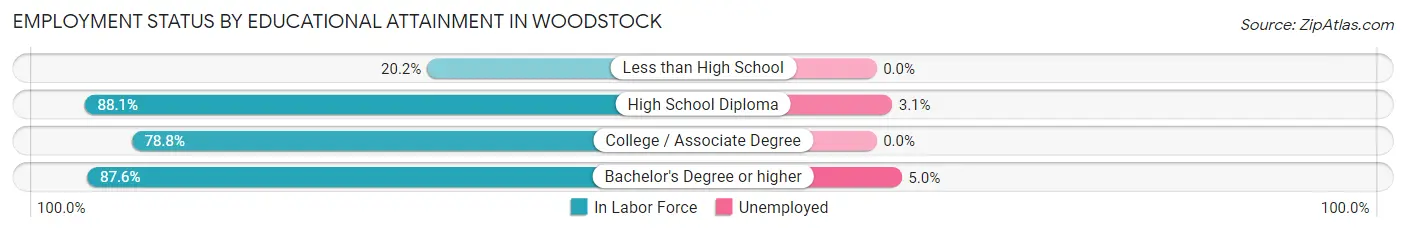
| Educational Attainment | In Labor Force | Unemployed |
| Less than High School | 67 (20.2%) | 0 (0.0%) |
| High School Diploma | 848 (88.1%) | 30 (3.1%) |
| College / Associate Degree | 524 (78.8%) | 0 (0.0%) |
| Bachelor's Degree or higher | 674 (87.6%) | 38 (5.0%) |
| Total | 2,113 (77.5%) | 76 (2.8%) |
Employment Occupations by Sex in Woodstock
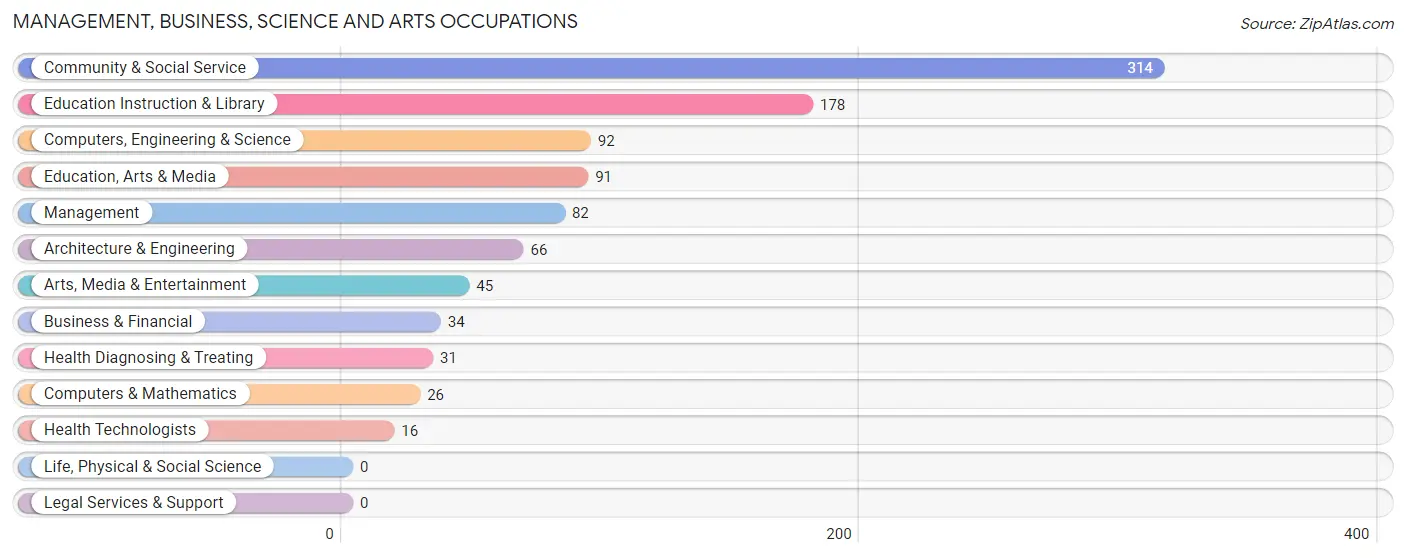
Management, Business, Science and Arts Occupations
The most common Management, Business, Science and Arts occupations in Woodstock are Community & Social Service (314 | 12.9%), Education Instruction & Library (178 | 7.3%), Computers, Engineering & Science (92 | 3.8%), Education, Arts & Media (91 | 3.7%), and Management (82 | 3.4%).
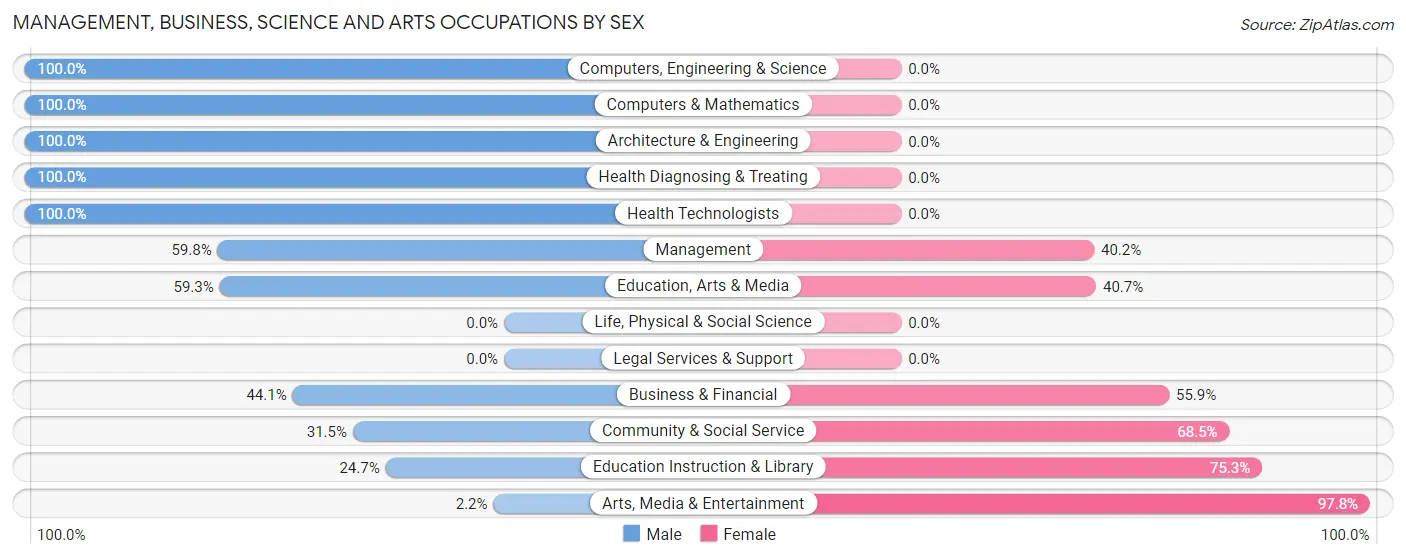
Management, Business, Science and Arts Occupations by Sex
Within the Management, Business, Science and Arts occupations in Woodstock, the most male-oriented occupations are Computers, Engineering & Science (100.0%), Computers & Mathematics (100.0%), and Architecture & Engineering (100.0%), while the most female-oriented occupations are Arts, Media & Entertainment (97.8%), Education Instruction & Library (75.3%), and Community & Social Service (68.5%).
| Occupation | Male | Female |
| Management | 49 (59.8%) | 33 (40.2%) |
| Business & Financial | 15 (44.1%) | 19 (55.9%) |
| Computers, Engineering & Science | 92 (100.0%) | 0 (0.0%) |
| Computers & Mathematics | 26 (100.0%) | 0 (0.0%) |
| Architecture & Engineering | 66 (100.0%) | 0 (0.0%) |
| Life, Physical & Social Science | 0 (0.0%) | 0 (0.0%) |
| Community & Social Service | 99 (31.5%) | 215 (68.5%) |
| Education, Arts & Media | 54 (59.3%) | 37 (40.7%) |
| Legal Services & Support | 0 (0.0%) | 0 (0.0%) |
| Education Instruction & Library | 44 (24.7%) | 134 (75.3%) |
| Arts, Media & Entertainment | 1 (2.2%) | 44 (97.8%) |
| Health Diagnosing & Treating | 31 (100.0%) | 0 (0.0%) |
| Health Technologists | 16 (100.0%) | 0 (0.0%) |
| Total (Category) | 286 (51.7%) | 267 (48.3%) |
| Total (Overall) | 1,285 (52.8%) | 1,150 (47.2%) |
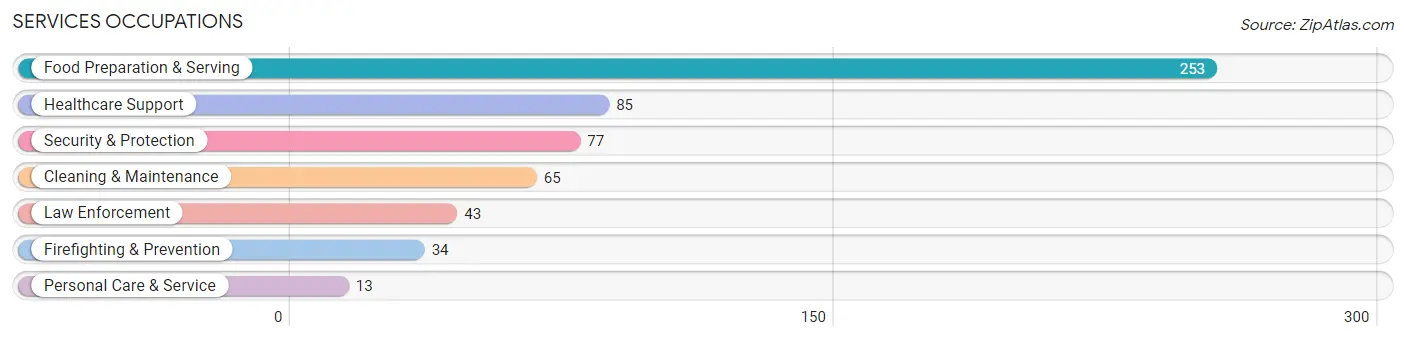
Services Occupations
The most common Services occupations in Woodstock are Food Preparation & Serving (253 | 10.4%), Healthcare Support (85 | 3.5%), Security & Protection (77 | 3.2%), Cleaning & Maintenance (65 | 2.7%), and Law Enforcement (43 | 1.8%).
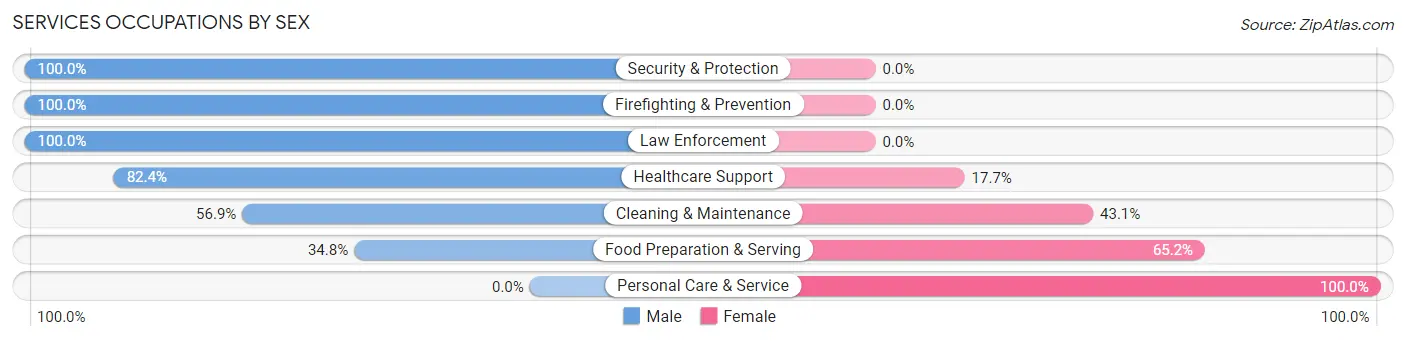
Services Occupations by Sex
Within the Services occupations in Woodstock, the most male-oriented occupations are Security & Protection (100.0%), Firefighting & Prevention (100.0%), and Law Enforcement (100.0%), while the most female-oriented occupations are Personal Care & Service (100.0%), Food Preparation & Serving (65.2%), and Cleaning & Maintenance (43.1%).
| Occupation | Male | Female |
| Healthcare Support | 70 (82.4%) | 15 (17.6%) |
| Security & Protection | 77 (100.0%) | 0 (0.0%) |
| Firefighting & Prevention | 34 (100.0%) | 0 (0.0%) |
| Law Enforcement | 43 (100.0%) | 0 (0.0%) |
| Food Preparation & Serving | 88 (34.8%) | 165 (65.2%) |
| Cleaning & Maintenance | 37 (56.9%) | 28 (43.1%) |
| Personal Care & Service | 0 (0.0%) | 13 (100.0%) |
| Total (Category) | 272 (55.2%) | 221 (44.8%) |
| Total (Overall) | 1,285 (52.8%) | 1,150 (47.2%) |
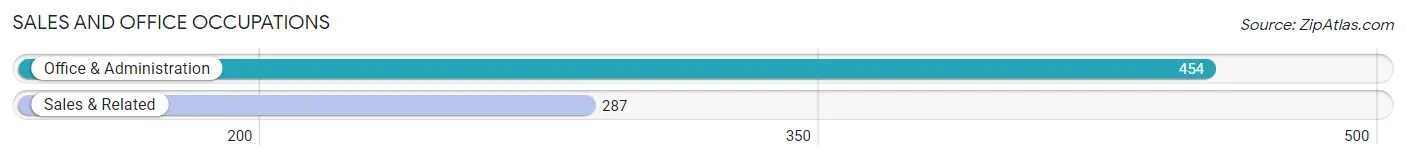
Sales and Office Occupations
The most common Sales and Office occupations in Woodstock are Office & Administration (454 | 18.6%), and Sales & Related (287 | 11.8%).
Sales and Office Occupations by Sex
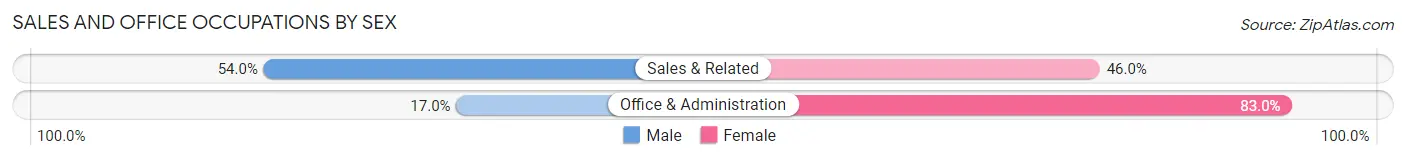
| Occupation | Male | Female |
| Sales & Related | 155 (54.0%) | 132 (46.0%) |
| Office & Administration | 77 (17.0%) | 377 (83.0%) |
| Total (Category) | 232 (31.3%) | 509 (68.7%) |
| Total (Overall) | 1,285 (52.8%) | 1,150 (47.2%) |
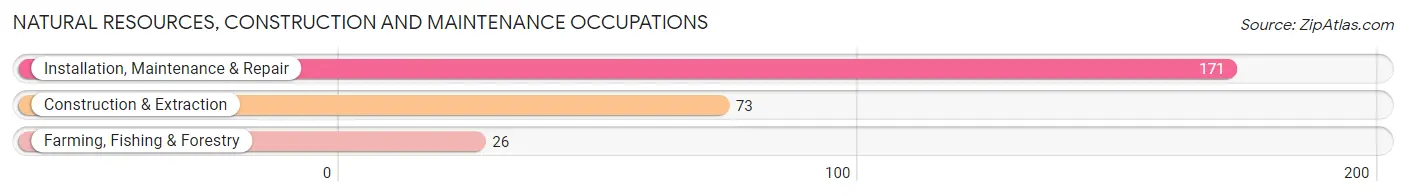
Natural Resources, Construction and Maintenance Occupations
The most common Natural Resources, Construction and Maintenance occupations in Woodstock are Installation, Maintenance & Repair (171 | 7.0%), Construction & Extraction (73 | 3.0%), and Farming, Fishing & Forestry (26 | 1.1%).
Natural Resources, Construction and Maintenance Occupations by Sex
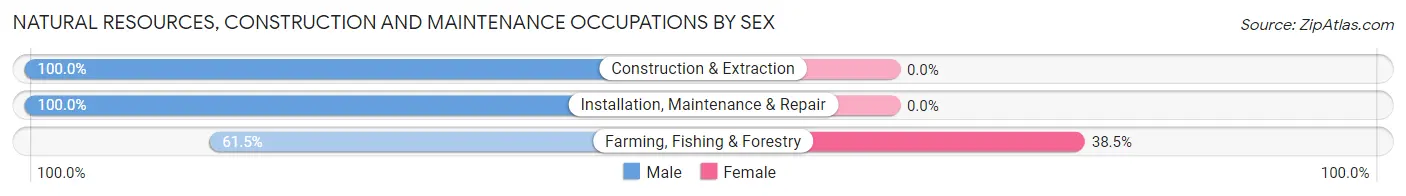
| Occupation | Male | Female |
| Farming, Fishing & Forestry | 16 (61.5%) | 10 (38.5%) |
| Construction & Extraction | 73 (100.0%) | 0 (0.0%) |
| Installation, Maintenance & Repair | 171 (100.0%) | 0 (0.0%) |
| Total (Category) | 260 (96.3%) | 10 (3.7%) |
| Total (Overall) | 1,285 (52.8%) | 1,150 (47.2%) |
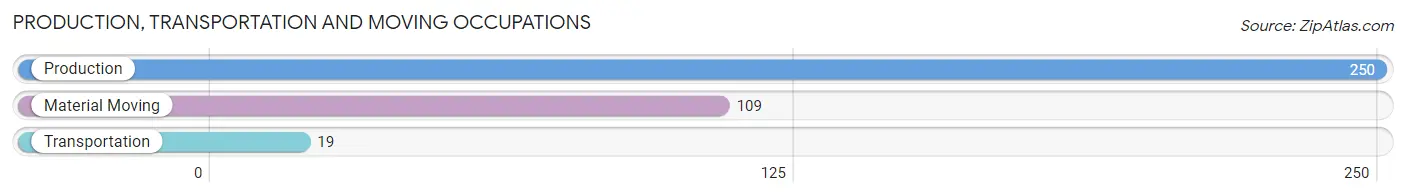
Production, Transportation and Moving Occupations
The most common Production, Transportation and Moving occupations in Woodstock are Production (250 | 10.3%), Material Moving (109 | 4.5%), and Transportation (19 | 0.8%).
Production, Transportation and Moving Occupations by Sex
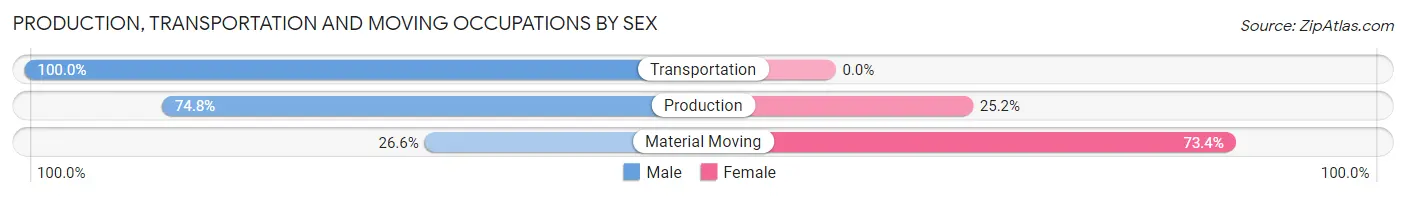
| Occupation | Male | Female |
| Production | 187 (74.8%) | 63 (25.2%) |
| Transportation | 19 (100.0%) | 0 (0.0%) |
| Material Moving | 29 (26.6%) | 80 (73.4%) |
| Total (Category) | 235 (62.2%) | 143 (37.8%) |
| Total (Overall) | 1,285 (52.8%) | 1,150 (47.2%) |
Employment Industries by Sex in Woodstock
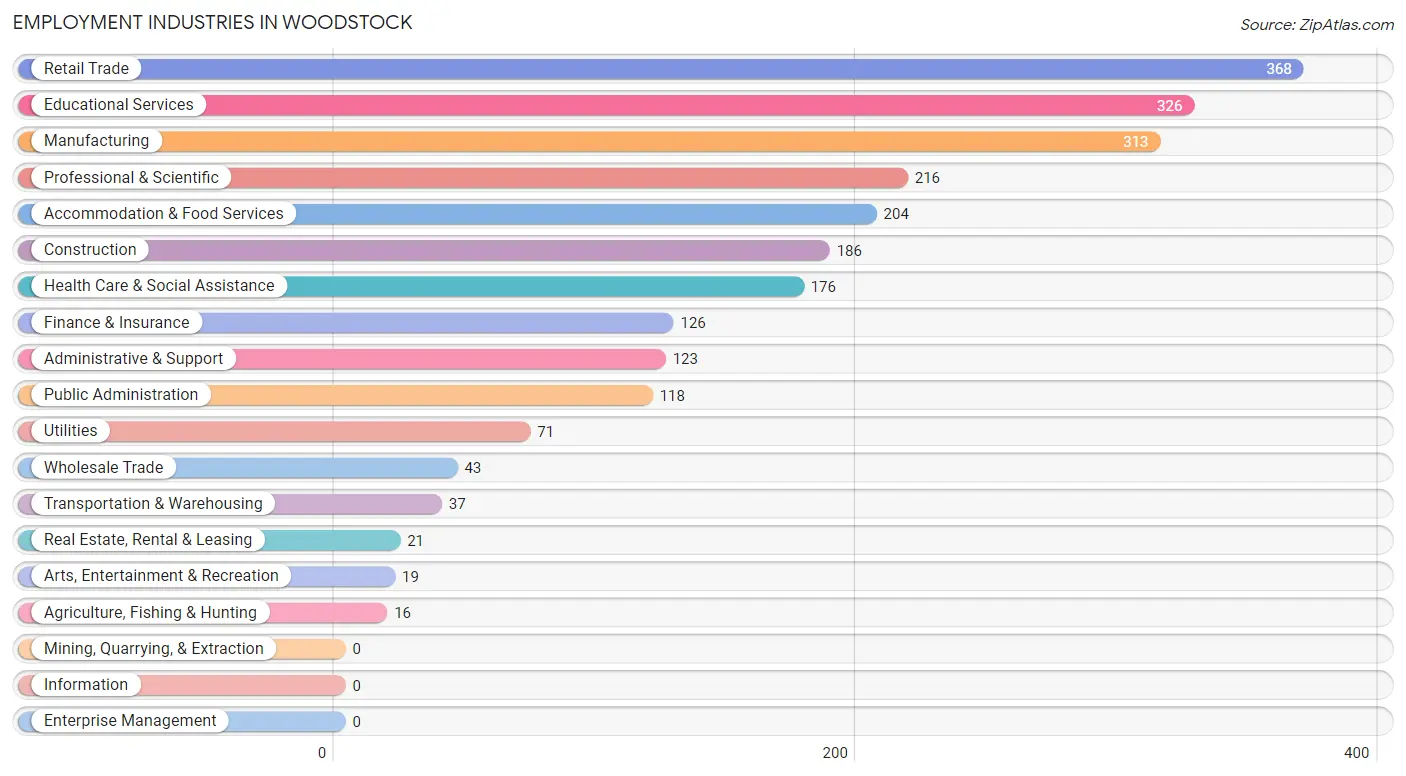
Employment Industries in Woodstock
The major employment industries in Woodstock include Retail Trade (368 | 15.1%), Educational Services (326 | 13.4%), Manufacturing (313 | 12.9%), Professional & Scientific (216 | 8.9%), and Accommodation & Food Services (204 | 8.4%).
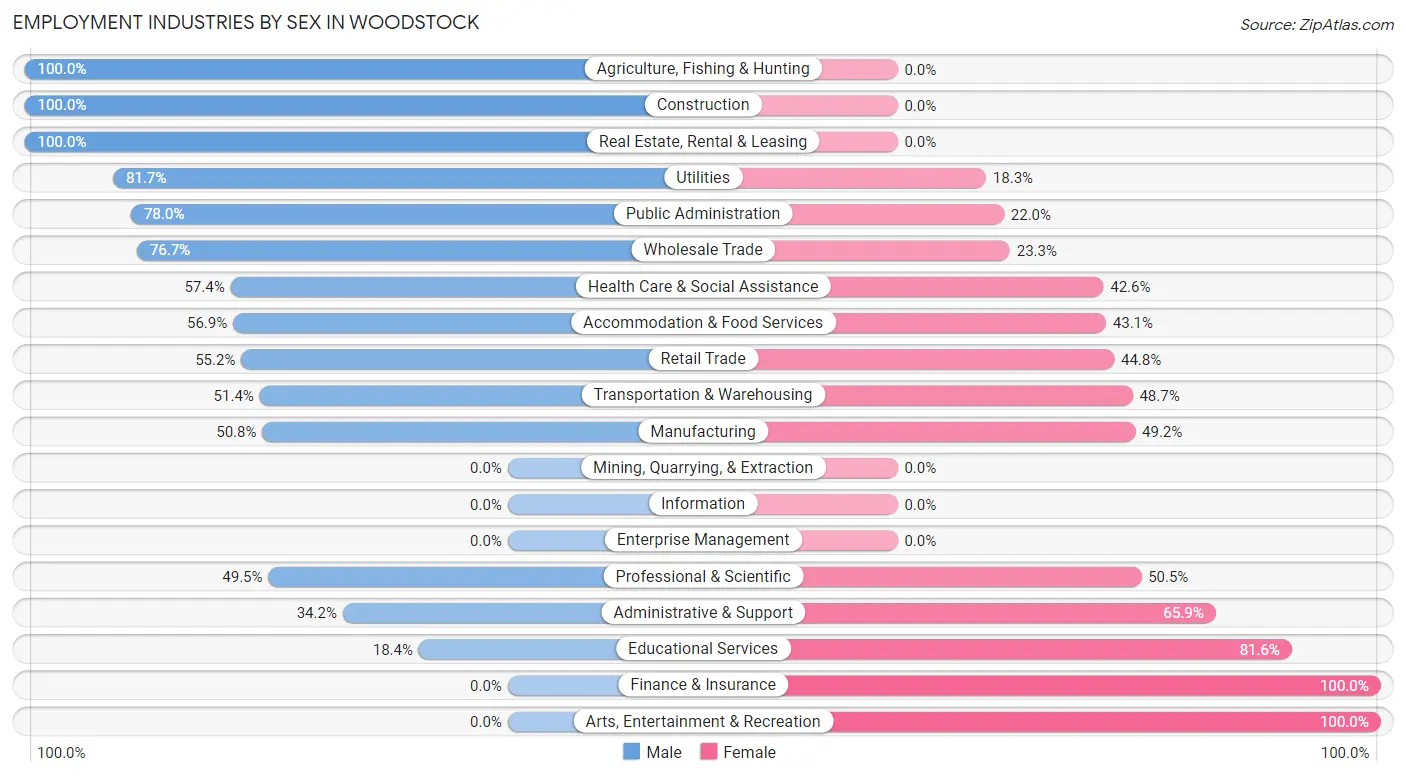
Employment Industries by Sex in Woodstock
The Woodstock industries that see more men than women are Agriculture, Fishing & Hunting (100.0%), Construction (100.0%), and Real Estate, Rental & Leasing (100.0%), whereas the industries that tend to have a higher number of women are Finance & Insurance (100.0%), Arts, Entertainment & Recreation (100.0%), and Educational Services (81.6%).
| Industry | Male | Female |
| Agriculture, Fishing & Hunting | 16 (100.0%) | 0 (0.0%) |
| Mining, Quarrying, & Extraction | 0 (0.0%) | 0 (0.0%) |
| Construction | 186 (100.0%) | 0 (0.0%) |
| Manufacturing | 159 (50.8%) | 154 (49.2%) |
| Wholesale Trade | 33 (76.7%) | 10 (23.3%) |
| Retail Trade | 203 (55.2%) | 165 (44.8%) |
| Transportation & Warehousing | 19 (51.3%) | 18 (48.6%) |
| Utilities | 58 (81.7%) | 13 (18.3%) |
| Information | 0 (0.0%) | 0 (0.0%) |
| Finance & Insurance | 0 (0.0%) | 126 (100.0%) |
| Real Estate, Rental & Leasing | 21 (100.0%) | 0 (0.0%) |
| Professional & Scientific | 107 (49.5%) | 109 (50.5%) |
| Enterprise Management | 0 (0.0%) | 0 (0.0%) |
| Administrative & Support | 42 (34.2%) | 81 (65.8%) |
| Educational Services | 60 (18.4%) | 266 (81.6%) |
| Health Care & Social Assistance | 101 (57.4%) | 75 (42.6%) |
| Arts, Entertainment & Recreation | 0 (0.0%) | 19 (100.0%) |
| Accommodation & Food Services | 116 (56.9%) | 88 (43.1%) |
| Public Administration | 92 (78.0%) | 26 (22.0%) |
| Total | 1,285 (52.8%) | 1,150 (47.2%) |
Education in Woodstock
School Enrollment in Woodstock
The most common levels of schooling among the 1,230 students in Woodstock are elementary school (380 | 30.9%), middle school (336 | 27.3%), and high school (239 | 19.4%).
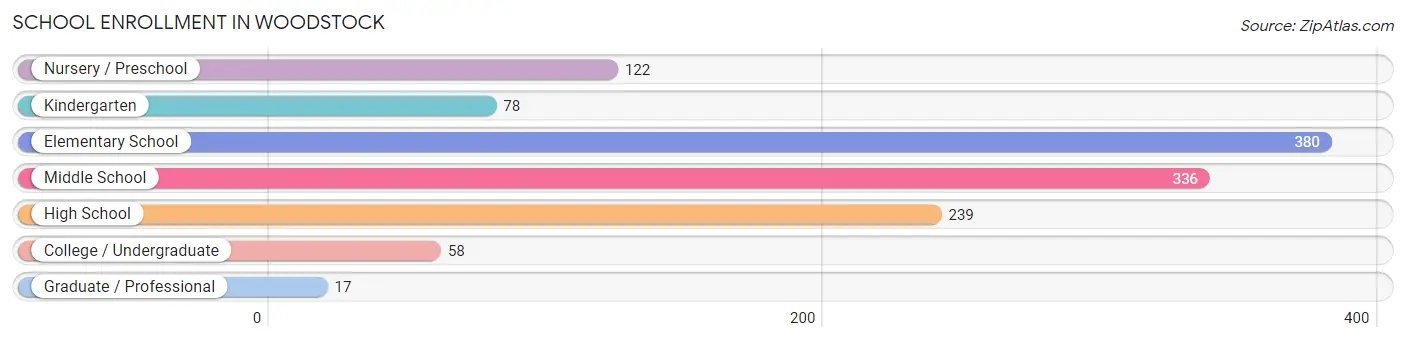
| School Level | # Students | % Students |
| Nursery / Preschool | 122 | 9.9% |
| Kindergarten | 78 | 6.3% |
| Elementary School | 380 | 30.9% |
| Middle School | 336 | 27.3% |
| High School | 239 | 19.4% |
| College / Undergraduate | 58 | 4.7% |
| Graduate / Professional | 17 | 1.4% |
| Total | 1,230 | 100.0% |
School Enrollment by Age by Funding Source in Woodstock
Out of a total of 1,230 students who are enrolled in schools in Woodstock, 155 (12.6%) attend a private institution, while the remaining 1,075 (87.4%) are enrolled in public schools. The age group of 3 to 4 year olds has the highest likelihood of being enrolled in private schools, with 48 (100.0% in the age bracket) enrolled. Conversely, the age group of 18 to 19 year olds has the lowest likelihood of being enrolled in a private school, with 10 (100.0% in the age bracket) attending a public institution.
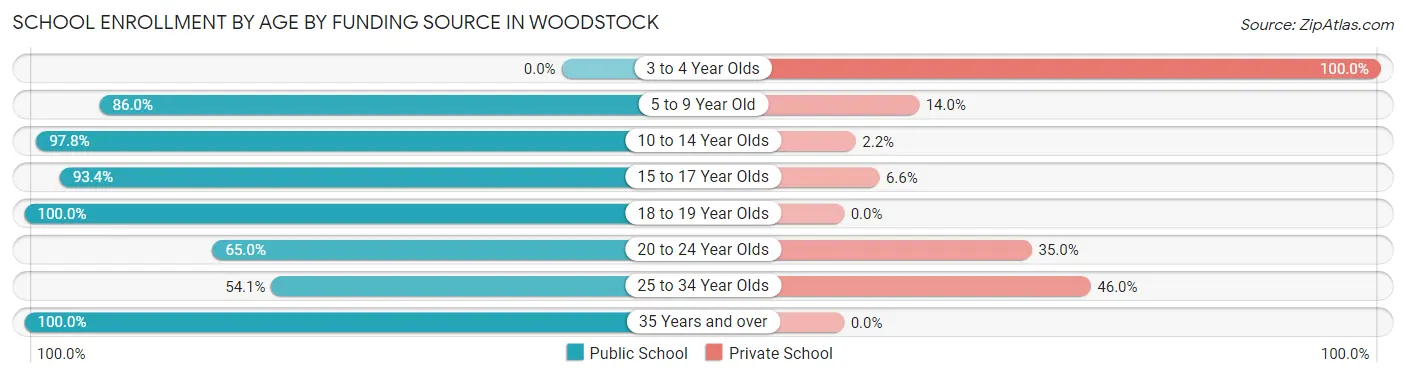
| Age Bracket | Public School | Private School |
| 3 to 4 Year Olds | 0 (0.0%) | 48 (100.0%) |
| 5 to 9 Year Old | 363 (86.0%) | 59 (14.0%) |
| 10 to 14 Year Olds | 451 (97.8%) | 10 (2.2%) |
| 15 to 17 Year Olds | 199 (93.4%) | 14 (6.6%) |
| 18 to 19 Year Olds | 10 (100.0%) | 0 (0.0%) |
| 20 to 24 Year Olds | 13 (65.0%) | 7 (35.0%) |
| 25 to 34 Year Olds | 20 (54.0%) | 17 (46.0%) |
| 35 Years and over | 19 (100.0%) | 0 (0.0%) |
| Total | 1,075 (87.4%) | 155 (12.6%) |
Educational Attainment by Field of Study in Woodstock
Education (198 | 19.2%), business (150 | 14.5%), liberal arts & history (106 | 10.3%), arts & humanities (102 | 9.9%), and science & technology (100 | 9.7%) are the most common fields of study among 1,032 individuals in Woodstock who have obtained a bachelor's degree or higher.
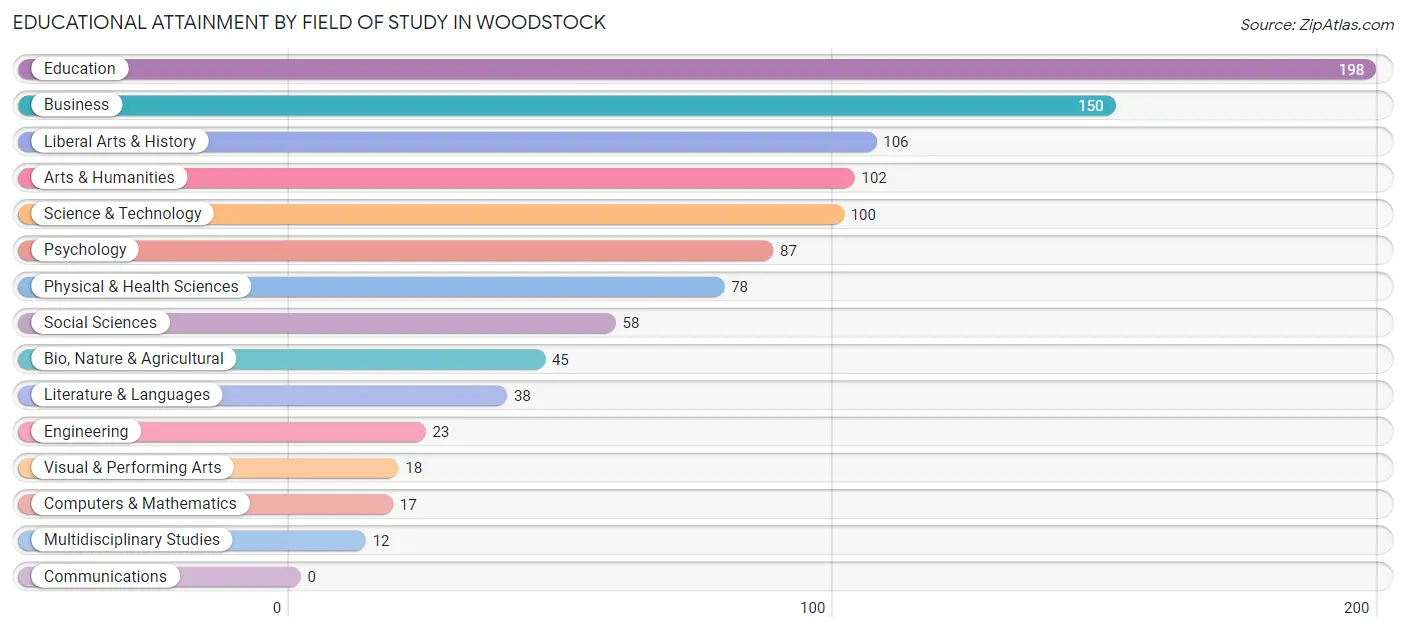
| Field of Study | # Graduates | % Graduates |
| Computers & Mathematics | 17 | 1.7% |
| Bio, Nature & Agricultural | 45 | 4.4% |
| Physical & Health Sciences | 78 | 7.6% |
| Psychology | 87 | 8.4% |
| Social Sciences | 58 | 5.6% |
| Engineering | 23 | 2.2% |
| Multidisciplinary Studies | 12 | 1.2% |
| Science & Technology | 100 | 9.7% |
| Business | 150 | 14.5% |
| Education | 198 | 19.2% |
| Literature & Languages | 38 | 3.7% |
| Liberal Arts & History | 106 | 10.3% |
| Visual & Performing Arts | 18 | 1.7% |
| Communications | 0 | 0.0% |
| Arts & Humanities | 102 | 9.9% |
| Total | 1,032 | 100.0% |
Transportation & Commute in Woodstock
Vehicle Availability by Sex in Woodstock
The most prevalent vehicle ownership categories in Woodstock are males with 2 vehicles (607, accounting for 48.1%) and females with 2 vehicles (401, making up 53.2%).
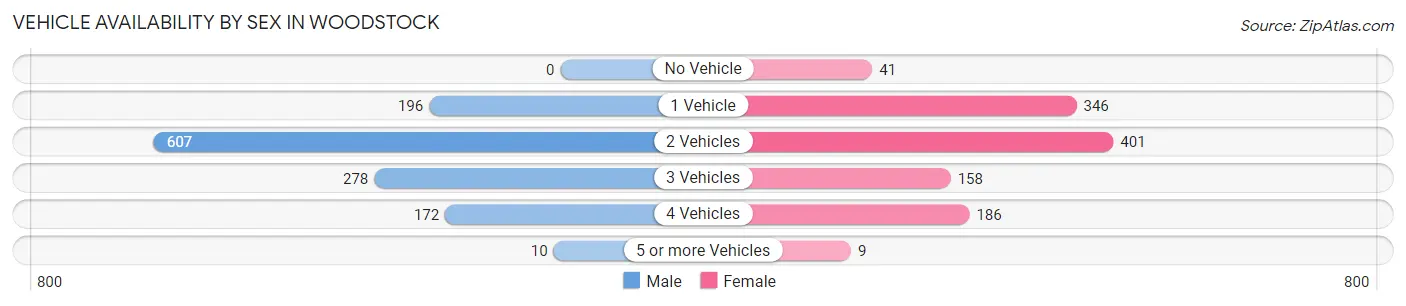
| Vehicles Available | Male | Female |
| No Vehicle | 0 (0.0%) | 41 (3.6%) |
| 1 Vehicle | 196 (15.5%) | 346 (30.3%) |
| 2 Vehicles | 607 (48.1%) | 401 (35.1%) |
| 3 Vehicles | 278 (22.0%) | 158 (13.9%) |
| 4 Vehicles | 172 (13.6%) | 186 (16.3%) |
| 5 or more Vehicles | 10 (0.8%) | 9 (0.8%) |
| Total | 1,263 (100.0%) | 1,141 (100.0%) |
Commute Time in Woodstock
The most frequently occuring commute durations in Woodstock are 5 to 9 minutes (422 commuters, 19.2%), 45 to 59 minutes (349 commuters, 15.9%), and 15 to 19 minutes (337 commuters, 15.3%).
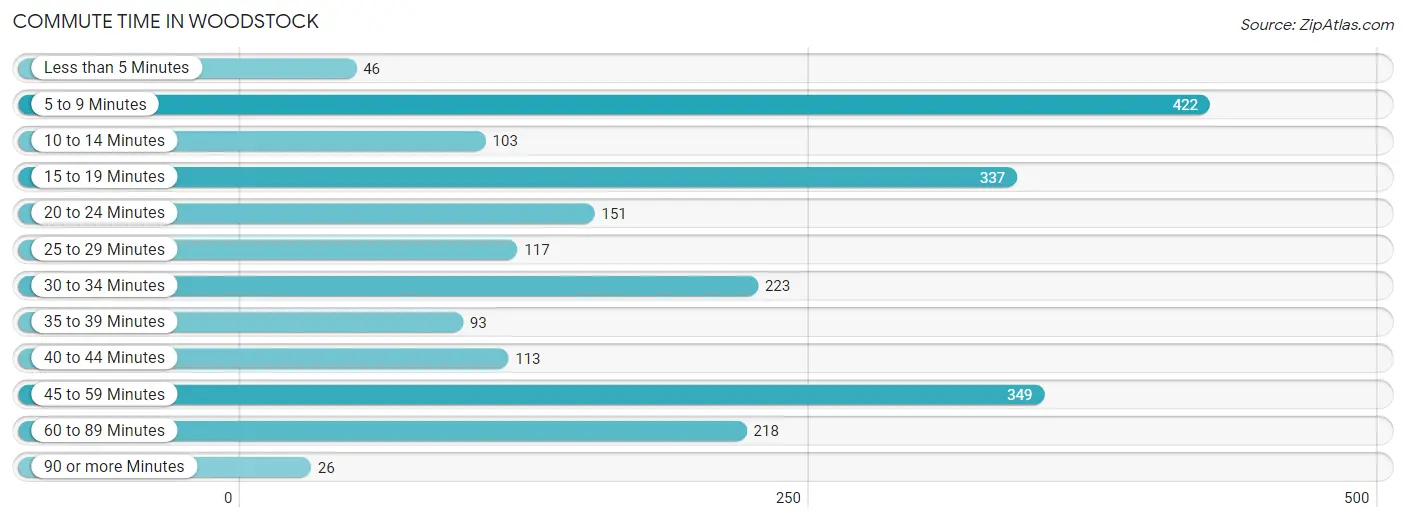
| Commute Time | # Commuters | % Commuters |
| Less than 5 Minutes | 46 | 2.1% |
| 5 to 9 Minutes | 422 | 19.2% |
| 10 to 14 Minutes | 103 | 4.7% |
| 15 to 19 Minutes | 337 | 15.3% |
| 20 to 24 Minutes | 151 | 6.9% |
| 25 to 29 Minutes | 117 | 5.3% |
| 30 to 34 Minutes | 223 | 10.2% |
| 35 to 39 Minutes | 93 | 4.2% |
| 40 to 44 Minutes | 113 | 5.1% |
| 45 to 59 Minutes | 349 | 15.9% |
| 60 to 89 Minutes | 218 | 9.9% |
| 90 or more Minutes | 26 | 1.2% |
Commute Time by Sex in Woodstock
The most common commute times in Woodstock are 5 to 9 minutes (294 commuters, 23.7%) for males and 15 to 19 minutes (186 commuters, 19.4%) for females.
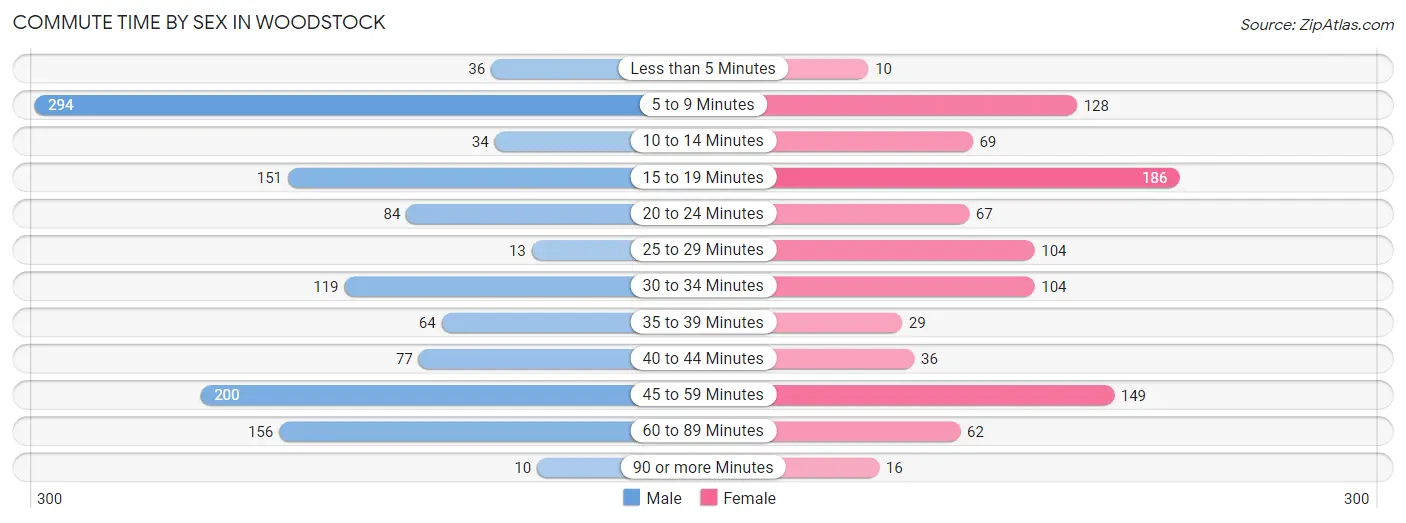
| Commute Time | Male | Female |
| Less than 5 Minutes | 36 (2.9%) | 10 (1.0%) |
| 5 to 9 Minutes | 294 (23.7%) | 128 (13.3%) |
| 10 to 14 Minutes | 34 (2.8%) | 69 (7.2%) |
| 15 to 19 Minutes | 151 (12.2%) | 186 (19.4%) |
| 20 to 24 Minutes | 84 (6.8%) | 67 (7.0%) |
| 25 to 29 Minutes | 13 (1.1%) | 104 (10.8%) |
| 30 to 34 Minutes | 119 (9.6%) | 104 (10.8%) |
| 35 to 39 Minutes | 64 (5.2%) | 29 (3.0%) |
| 40 to 44 Minutes | 77 (6.2%) | 36 (3.7%) |
| 45 to 59 Minutes | 200 (16.2%) | 149 (15.5%) |
| 60 to 89 Minutes | 156 (12.6%) | 62 (6.5%) |
| 90 or more Minutes | 10 (0.8%) | 16 (1.7%) |
Time of Departure to Work by Sex in Woodstock
The most frequent times of departure to work in Woodstock are 12:00 AM to 4:59 AM (289, 23.3%) for males and 7:30 AM to 7:59 AM (204, 21.2%) for females.
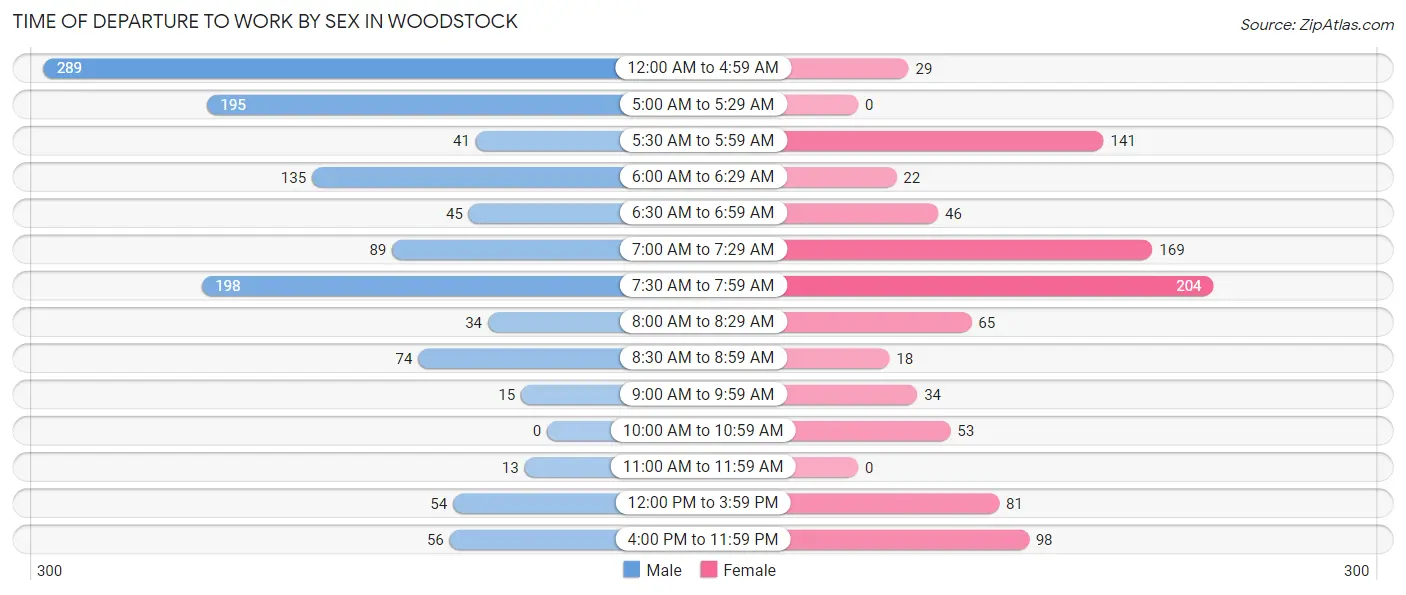
| Time of Departure | Male | Female |
| 12:00 AM to 4:59 AM | 289 (23.3%) | 29 (3.0%) |
| 5:00 AM to 5:29 AM | 195 (15.8%) | 0 (0.0%) |
| 5:30 AM to 5:59 AM | 41 (3.3%) | 141 (14.7%) |
| 6:00 AM to 6:29 AM | 135 (10.9%) | 22 (2.3%) |
| 6:30 AM to 6:59 AM | 45 (3.6%) | 46 (4.8%) |
| 7:00 AM to 7:29 AM | 89 (7.2%) | 169 (17.6%) |
| 7:30 AM to 7:59 AM | 198 (16.0%) | 204 (21.2%) |
| 8:00 AM to 8:29 AM | 34 (2.8%) | 65 (6.8%) |
| 8:30 AM to 8:59 AM | 74 (6.0%) | 18 (1.9%) |
| 9:00 AM to 9:59 AM | 15 (1.2%) | 34 (3.5%) |
| 10:00 AM to 10:59 AM | 0 (0.0%) | 53 (5.5%) |
| 11:00 AM to 11:59 AM | 13 (1.1%) | 0 (0.0%) |
| 12:00 PM to 3:59 PM | 54 (4.4%) | 81 (8.4%) |
| 4:00 PM to 11:59 PM | 56 (4.5%) | 98 (10.2%) |
| Total | 1,238 (100.0%) | 960 (100.0%) |
Housing Occupancy in Woodstock
Occupancy by Ownership in Woodstock
Of the total 2,150 dwellings in Woodstock, owner-occupied units account for 1,132 (52.6%), while renter-occupied units make up 1,018 (47.3%).
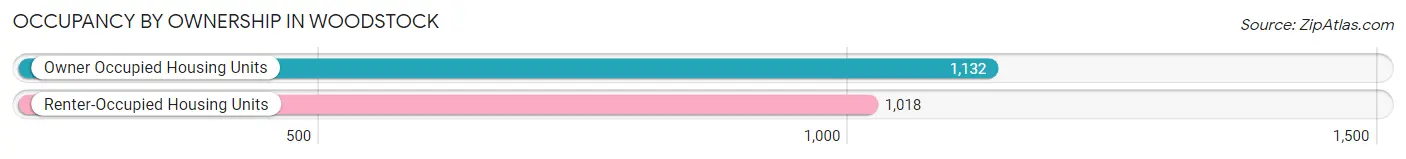
| Occupancy | # Housing Units | % Housing Units |
| Owner Occupied Housing Units | 1,132 | 52.6% |
| Renter-Occupied Housing Units | 1,018 | 47.3% |
| Total Occupied Housing Units | 2,150 | 100.0% |
Occupancy by Household Size in Woodstock
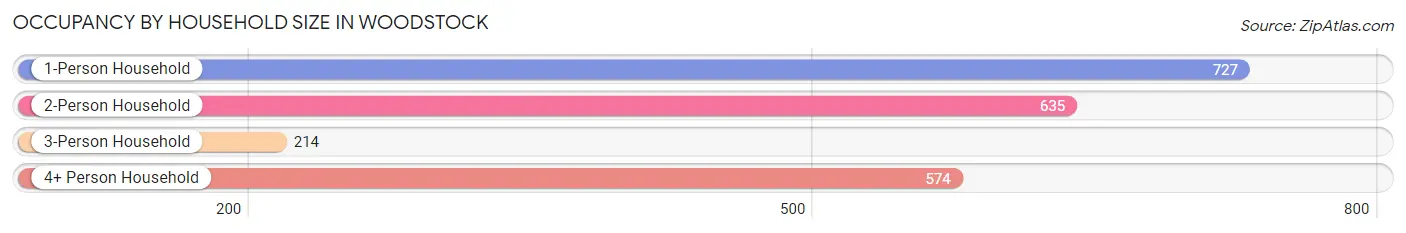
| Household Size | # Housing Units | % Housing Units |
| 1-Person Household | 727 | 33.8% |
| 2-Person Household | 635 | 29.5% |
| 3-Person Household | 214 | 10.0% |
| 4+ Person Household | 574 | 26.7% |
| Total Housing Units | 2,150 | 100.0% |
Occupancy by Ownership by Household Size in Woodstock
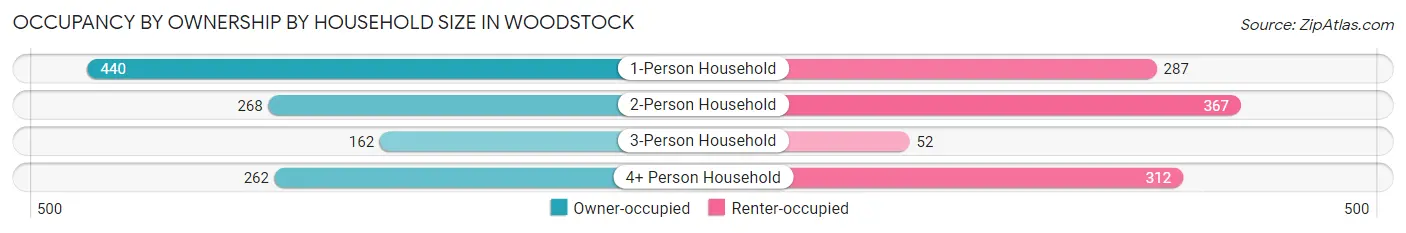
| Household Size | Owner-occupied | Renter-occupied |
| 1-Person Household | 440 (60.5%) | 287 (39.5%) |
| 2-Person Household | 268 (42.2%) | 367 (57.8%) |
| 3-Person Household | 162 (75.7%) | 52 (24.3%) |
| 4+ Person Household | 262 (45.6%) | 312 (54.4%) |
| Total Housing Units | 1,132 (52.6%) | 1,018 (47.3%) |
Occupancy by Educational Attainment in Woodstock
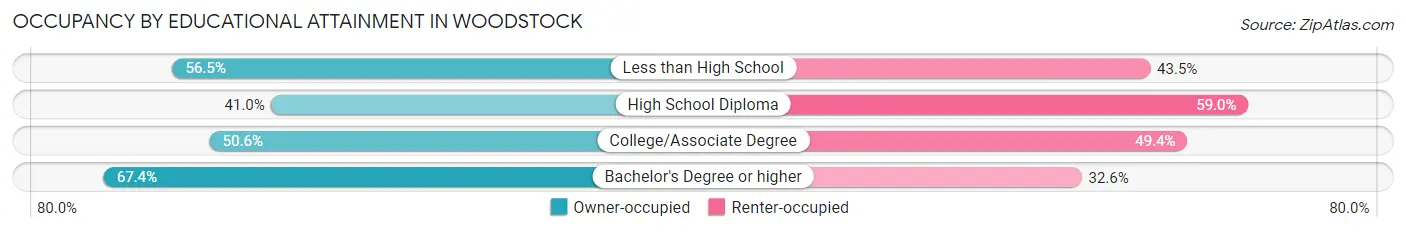
| Household Size | Owner-occupied | Renter-occupied |
| Less than High School | 134 (56.5%) | 103 (43.5%) |
| High School Diploma | 309 (41.0%) | 445 (59.0%) |
| College/Associate Degree | 279 (50.6%) | 272 (49.4%) |
| Bachelor's Degree or higher | 410 (67.4%) | 198 (32.6%) |
Occupancy by Age of Householder in Woodstock
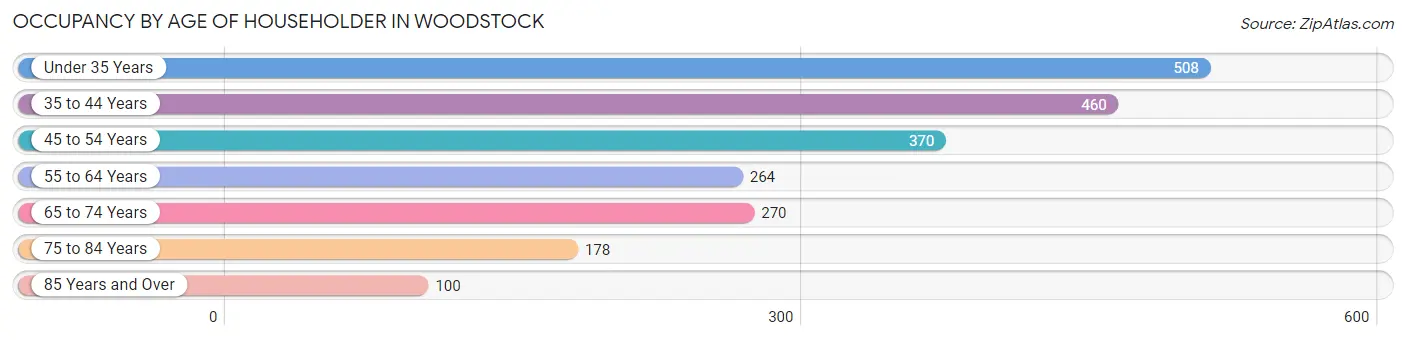
| Age Bracket | # Households | % Households |
| Under 35 Years | 508 | 23.6% |
| 35 to 44 Years | 460 | 21.4% |
| 45 to 54 Years | 370 | 17.2% |
| 55 to 64 Years | 264 | 12.3% |
| 65 to 74 Years | 270 | 12.6% |
| 75 to 84 Years | 178 | 8.3% |
| 85 Years and Over | 100 | 4.6% |
| Total | 2,150 | 100.0% |
Housing Finances in Woodstock
Median Income by Occupancy in Woodstock
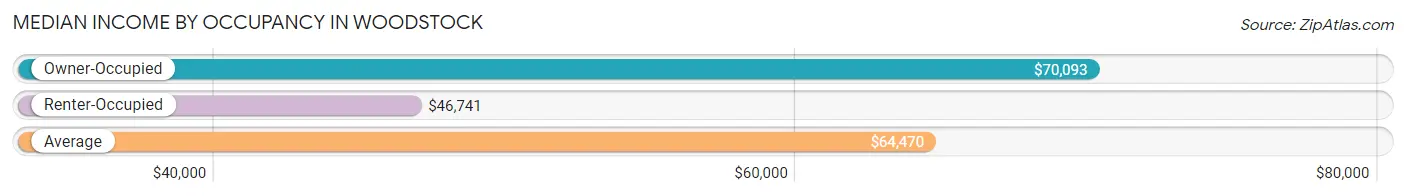
| Occupancy Type | # Households | Median Income |
| Owner-Occupied | 1,132 (52.6%) | $70,093 |
| Renter-Occupied | 1,018 (47.3%) | $46,741 |
| Average | 2,150 (100.0%) | $64,470 |
Occupancy by Householder Income Bracket in Woodstock
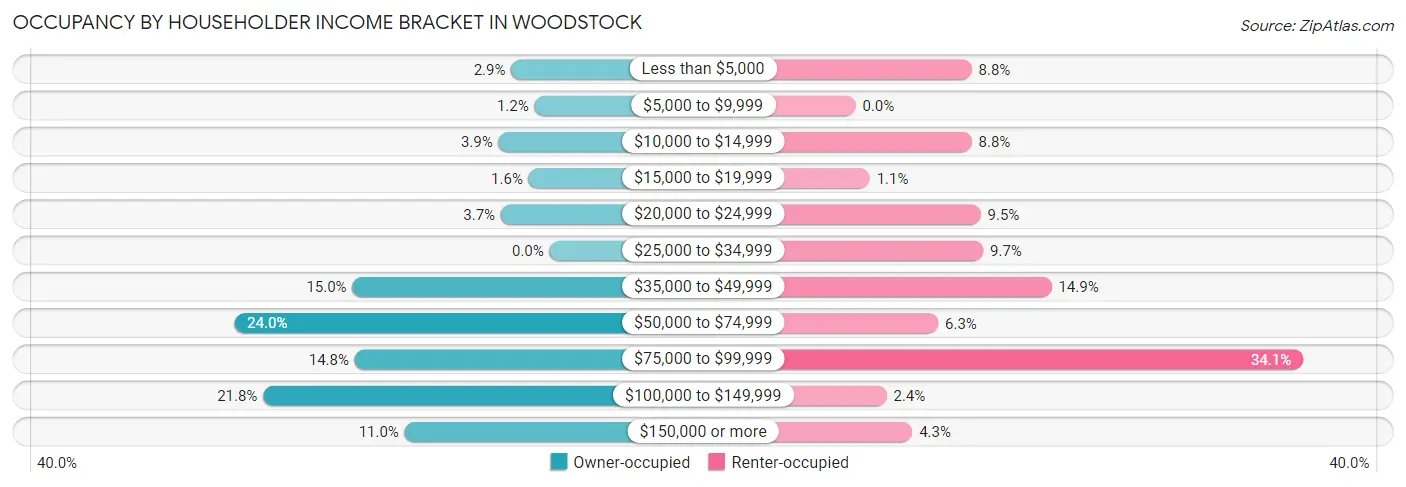
| Income Bracket | Owner-occupied | Renter-occupied |
| Less than $5,000 | 33 (2.9%) | 90 (8.8%) |
| $5,000 to $9,999 | 13 (1.1%) | 0 (0.0%) |
| $10,000 to $14,999 | 44 (3.9%) | 90 (8.8%) |
| $15,000 to $19,999 | 18 (1.6%) | 11 (1.1%) |
| $20,000 to $24,999 | 42 (3.7%) | 97 (9.5%) |
| $25,000 to $34,999 | 0 (0.0%) | 99 (9.7%) |
| $35,000 to $49,999 | 170 (15.0%) | 152 (14.9%) |
| $50,000 to $74,999 | 272 (24.0%) | 64 (6.3%) |
| $75,000 to $99,999 | 168 (14.8%) | 347 (34.1%) |
| $100,000 to $149,999 | 247 (21.8%) | 24 (2.4%) |
| $150,000 or more | 125 (11.0%) | 44 (4.3%) |
| Total | 1,132 (100.0%) | 1,018 (100.0%) |
Monthly Housing Cost Tiers in Woodstock
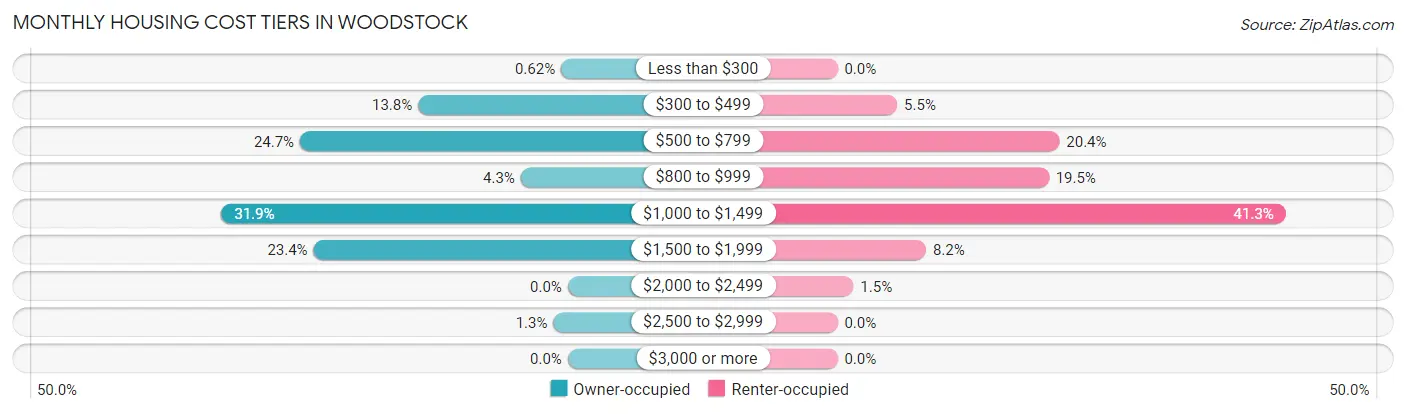
| Monthly Cost | Owner-occupied | Renter-occupied |
| Less than $300 | 7 (0.6%) | 0 (0.0%) |
| $300 to $499 | 156 (13.8%) | 56 (5.5%) |
| $500 to $799 | 279 (24.6%) | 208 (20.4%) |
| $800 to $999 | 49 (4.3%) | 198 (19.5%) |
| $1,000 to $1,499 | 361 (31.9%) | 420 (41.3%) |
| $1,500 to $1,999 | 265 (23.4%) | 83 (8.2%) |
| $2,000 to $2,499 | 0 (0.0%) | 15 (1.5%) |
| $2,500 to $2,999 | 15 (1.3%) | 0 (0.0%) |
| $3,000 or more | 0 (0.0%) | 0 (0.0%) |
| Total | 1,132 (100.0%) | 1,018 (100.0%) |
Physical Housing Characteristics in Woodstock
Housing Structures in Woodstock
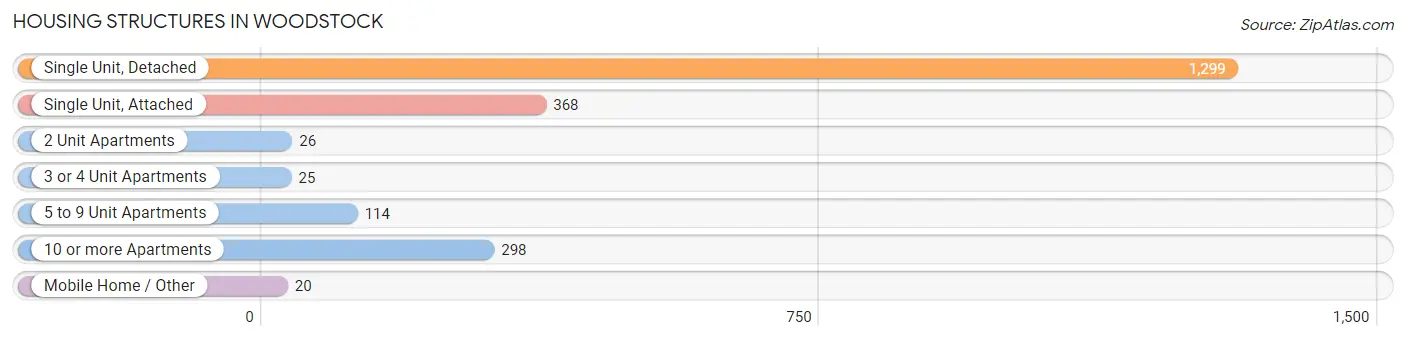
| Structure Type | # Housing Units | % Housing Units |
| Single Unit, Detached | 1,299 | 60.4% |
| Single Unit, Attached | 368 | 17.1% |
| 2 Unit Apartments | 26 | 1.2% |
| 3 or 4 Unit Apartments | 25 | 1.2% |
| 5 to 9 Unit Apartments | 114 | 5.3% |
| 10 or more Apartments | 298 | 13.9% |
| Mobile Home / Other | 20 | 0.9% |
| Total | 2,150 | 100.0% |
Housing Structures by Occupancy in Woodstock
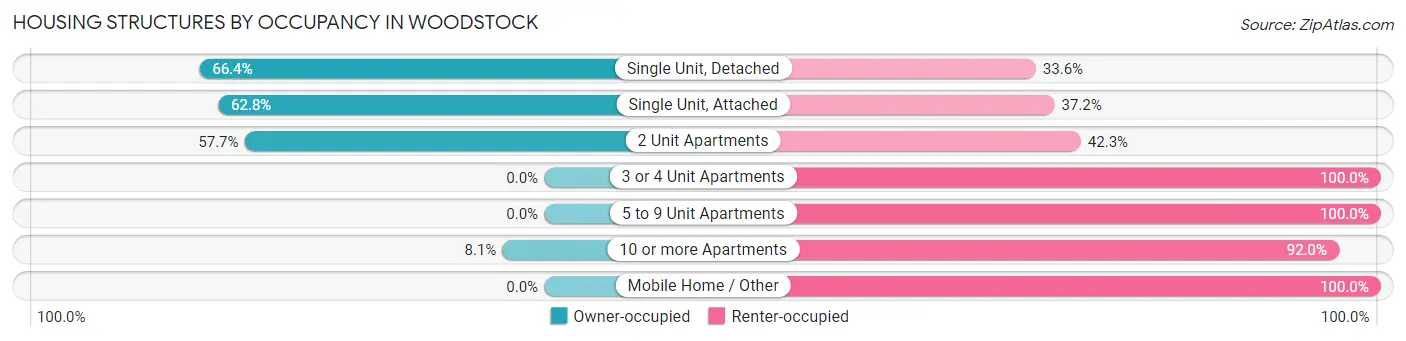
| Structure Type | Owner-occupied | Renter-occupied |
| Single Unit, Detached | 862 (66.4%) | 437 (33.6%) |
| Single Unit, Attached | 231 (62.8%) | 137 (37.2%) |
| 2 Unit Apartments | 15 (57.7%) | 11 (42.3%) |
| 3 or 4 Unit Apartments | 0 (0.0%) | 25 (100.0%) |
| 5 to 9 Unit Apartments | 0 (0.0%) | 114 (100.0%) |
| 10 or more Apartments | 24 (8.1%) | 274 (91.9%) |
| Mobile Home / Other | 0 (0.0%) | 20 (100.0%) |
| Total | 1,132 (52.6%) | 1,018 (47.3%) |
Housing Structures by Number of Rooms in Woodstock
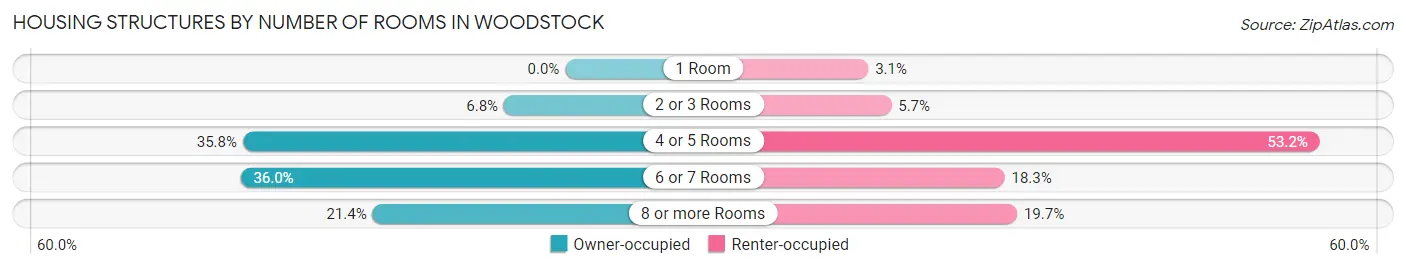
| Number of Rooms | Owner-occupied | Renter-occupied |
| 1 Room | 0 (0.0%) | 32 (3.1%) |
| 2 or 3 Rooms | 77 (6.8%) | 58 (5.7%) |
| 4 or 5 Rooms | 405 (35.8%) | 542 (53.2%) |
| 6 or 7 Rooms | 408 (36.0%) | 186 (18.3%) |
| 8 or more Rooms | 242 (21.4%) | 200 (19.7%) |
| Total | 1,132 (100.0%) | 1,018 (100.0%) |
Housing Structure by Heating Type in Woodstock
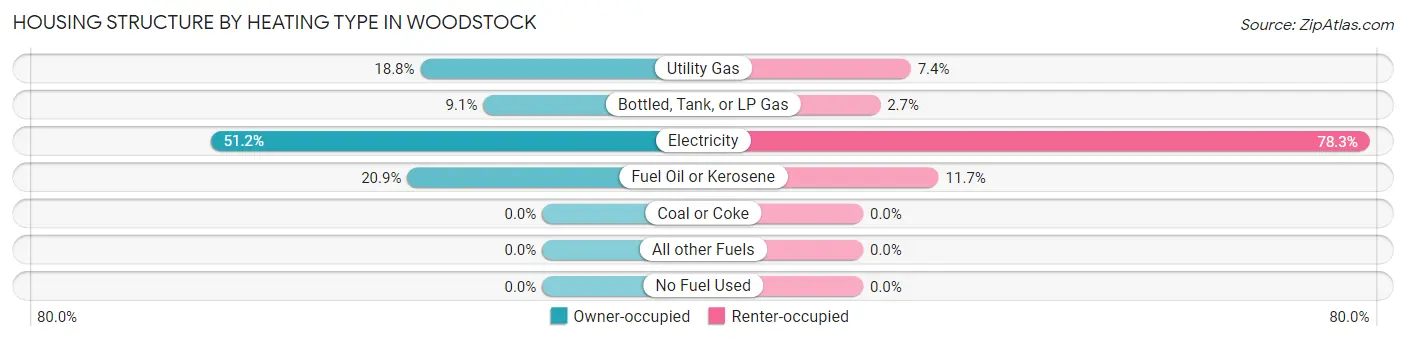
| Heating Type | Owner-occupied | Renter-occupied |
| Utility Gas | 213 (18.8%) | 75 (7.4%) |
| Bottled, Tank, or LP Gas | 103 (9.1%) | 27 (2.6%) |
| Electricity | 580 (51.2%) | 797 (78.3%) |
| Fuel Oil or Kerosene | 236 (20.8%) | 119 (11.7%) |
| Coal or Coke | 0 (0.0%) | 0 (0.0%) |
| All other Fuels | 0 (0.0%) | 0 (0.0%) |
| No Fuel Used | 0 (0.0%) | 0 (0.0%) |
| Total | 1,132 (100.0%) | 1,018 (100.0%) |
Household Vehicle Usage in Woodstock
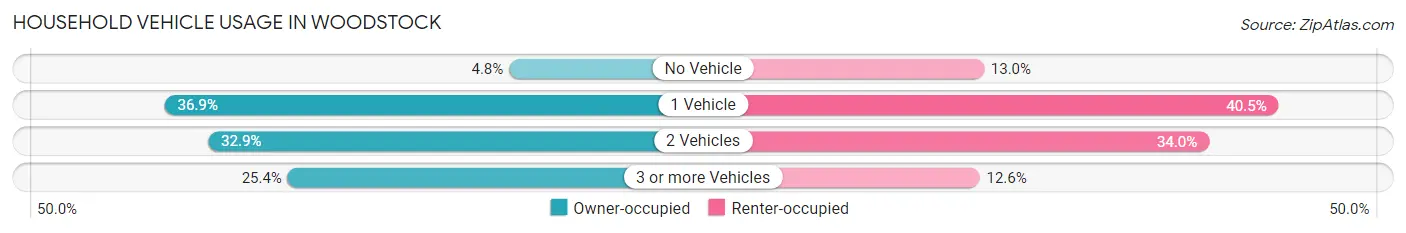
| Vehicles per Household | Owner-occupied | Renter-occupied |
| No Vehicle | 54 (4.8%) | 132 (13.0%) |
| 1 Vehicle | 418 (36.9%) | 412 (40.5%) |
| 2 Vehicles | 372 (32.9%) | 346 (34.0%) |
| 3 or more Vehicles | 288 (25.4%) | 128 (12.6%) |
| Total | 1,132 (100.0%) | 1,018 (100.0%) |
Real Estate & Mortgages in Woodstock
Real Estate and Mortgage Overview in Woodstock
| Characteristic | Without Mortgage | With Mortgage |
| Housing Units | 378 | 754 |
| Median Property Value | $248,600 | $239,800 |
| Median Household Income | $70,463 | $125 |
| Monthly Housing Costs | $518 | $0 |
| Real Estate Taxes | $1,714 | $27 |
Property Value by Mortgage Status in Woodstock
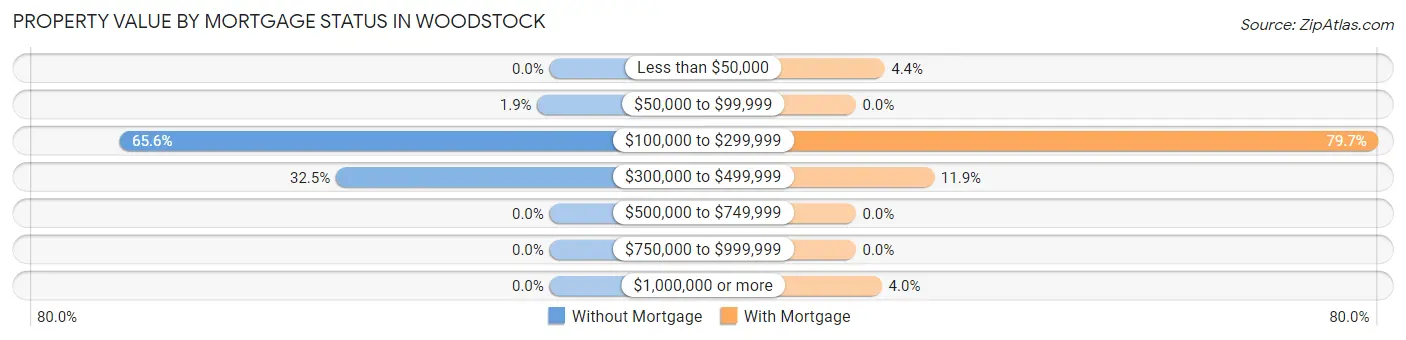
| Property Value | Without Mortgage | With Mortgage |
| Less than $50,000 | 0 (0.0%) | 33 (4.4%) |
| $50,000 to $99,999 | 7 (1.8%) | 0 (0.0%) |
| $100,000 to $299,999 | 248 (65.6%) | 601 (79.7%) |
| $300,000 to $499,999 | 123 (32.5%) | 90 (11.9%) |
| $500,000 to $749,999 | 0 (0.0%) | 0 (0.0%) |
| $750,000 to $999,999 | 0 (0.0%) | 0 (0.0%) |
| $1,000,000 or more | 0 (0.0%) | 30 (4.0%) |
| Total | 378 (100.0%) | 754 (100.0%) |
Household Income by Mortgage Status in Woodstock
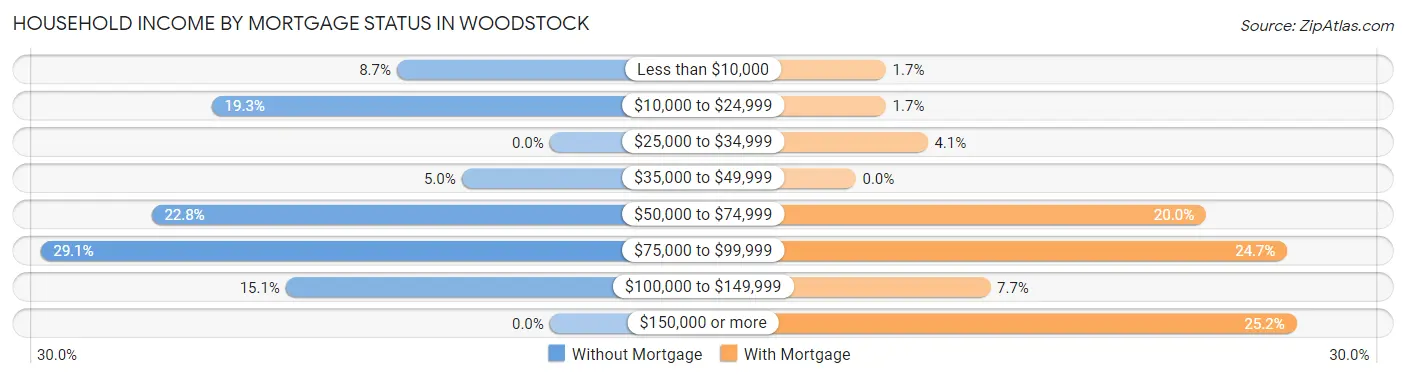
| Household Income | Without Mortgage | With Mortgage |
| Less than $10,000 | 33 (8.7%) | 13 (1.7%) |
| $10,000 to $24,999 | 73 (19.3%) | 13 (1.7%) |
| $25,000 to $34,999 | 0 (0.0%) | 31 (4.1%) |
| $35,000 to $49,999 | 19 (5.0%) | 0 (0.0%) |
| $50,000 to $74,999 | 86 (22.8%) | 151 (20.0%) |
| $75,000 to $99,999 | 110 (29.1%) | 186 (24.7%) |
| $100,000 to $149,999 | 57 (15.1%) | 58 (7.7%) |
| $150,000 or more | 0 (0.0%) | 190 (25.2%) |
| Total | 378 (100.0%) | 754 (100.0%) |
Property Value to Household Income Ratio in Woodstock
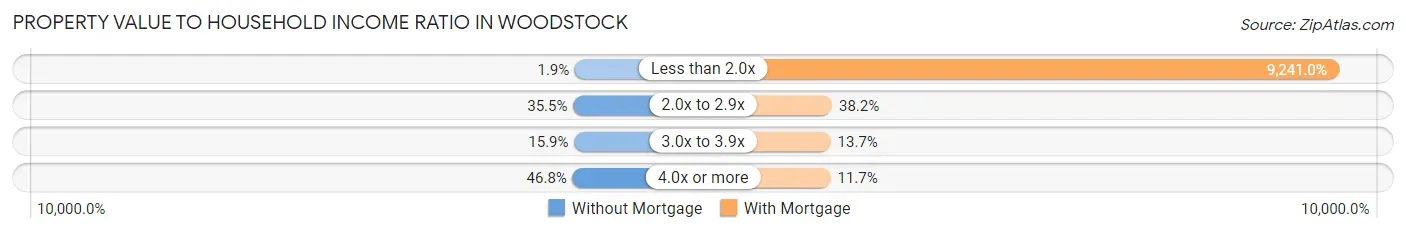
| Value-to-Income Ratio | Without Mortgage | With Mortgage |
| Less than 2.0x | 7 (1.8%) | 69,677 (9,241.0%) |
| 2.0x to 2.9x | 134 (35.4%) | 288 (38.2%) |
| 3.0x to 3.9x | 60 (15.9%) | 103 (13.7%) |
| 4.0x or more | 177 (46.8%) | 88 (11.7%) |
| Total | 378 (100.0%) | 754 (100.0%) |
Real Estate Taxes by Mortgage Status in Woodstock
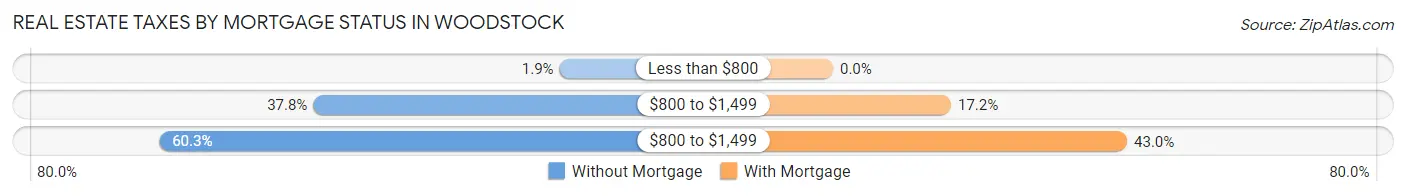
| Property Taxes | Without Mortgage | With Mortgage |
| Less than $800 | 7 (1.8%) | 0 (0.0%) |
| $800 to $1,499 | 143 (37.8%) | 130 (17.2%) |
| $800 to $1,499 | 228 (60.3%) | 324 (43.0%) |
| Total | 378 (100.0%) | 754 (100.0%) |
Health & Disability in Woodstock
Health Insurance Coverage by Age in Woodstock
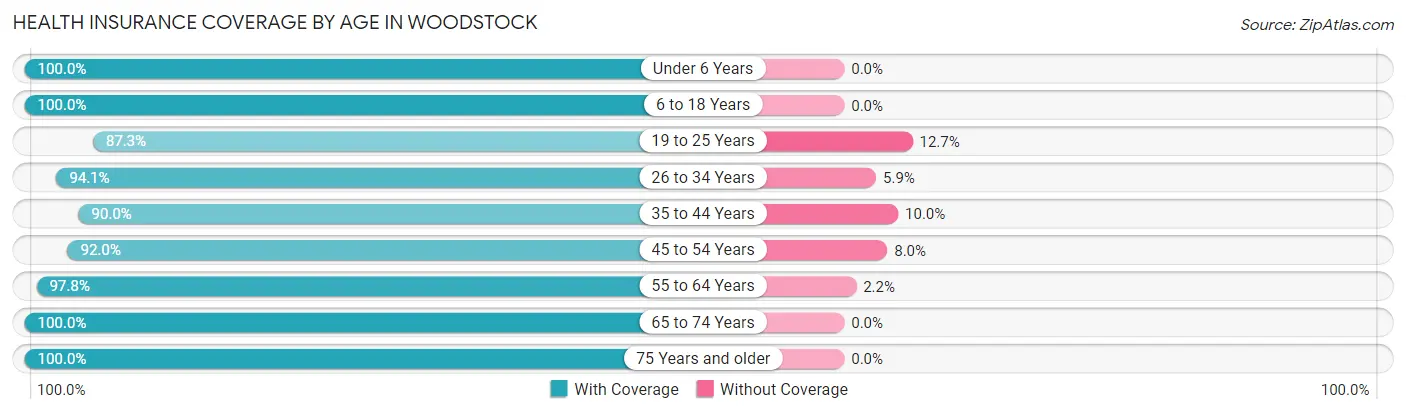
| Age Bracket | With Coverage | Without Coverage |
| Under 6 Years | 618 (100.0%) | 0 (0.0%) |
| 6 to 18 Years | 1,020 (100.0%) | 0 (0.0%) |
| 19 to 25 Years | 350 (87.3%) | 51 (12.7%) |
| 26 to 34 Years | 666 (94.1%) | 42 (5.9%) |
| 35 to 44 Years | 699 (90.0%) | 78 (10.0%) |
| 45 to 54 Years | 608 (92.0%) | 53 (8.0%) |
| 55 to 64 Years | 529 (97.8%) | 12 (2.2%) |
| 65 to 74 Years | 415 (100.0%) | 0 (0.0%) |
| 75 Years and older | 456 (100.0%) | 0 (0.0%) |
| Total | 5,361 (95.8%) | 236 (4.2%) |
Health Insurance Coverage by Citizenship Status in Woodstock
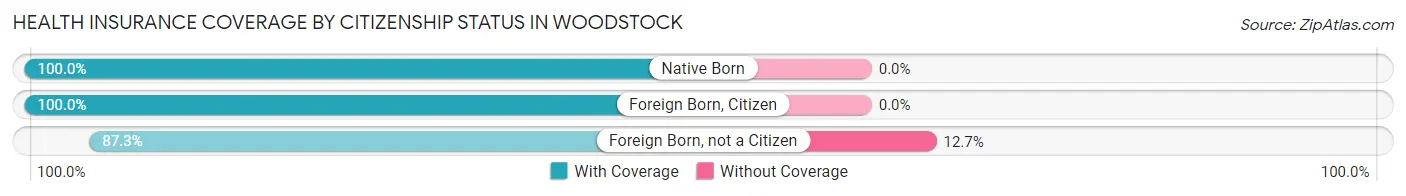
| Citizenship Status | With Coverage | Without Coverage |
| Native Born | 618 (100.0%) | 0 (0.0%) |
| Foreign Born, Citizen | 1,020 (100.0%) | 0 (0.0%) |
| Foreign Born, not a Citizen | 350 (87.3%) | 51 (12.7%) |
Health Insurance Coverage by Household Income in Woodstock
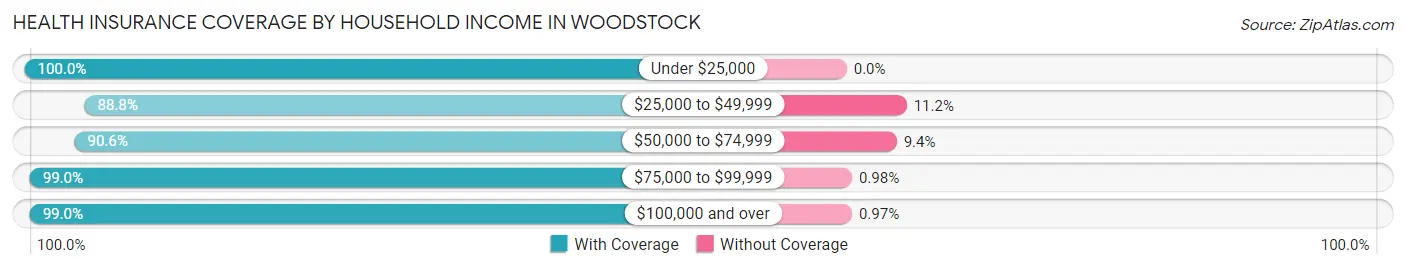
| Household Income | With Coverage | Without Coverage |
| Under $25,000 | 999 (100.0%) | 0 (0.0%) |
| $25,000 to $49,999 | 956 (88.8%) | 121 (11.2%) |
| $50,000 to $74,999 | 842 (90.6%) | 87 (9.4%) |
| $75,000 to $99,999 | 1,316 (99.0%) | 13 (1.0%) |
| $100,000 and over | 1,230 (99.0%) | 12 (1.0%) |
Public vs Private Health Insurance Coverage by Age in Woodstock
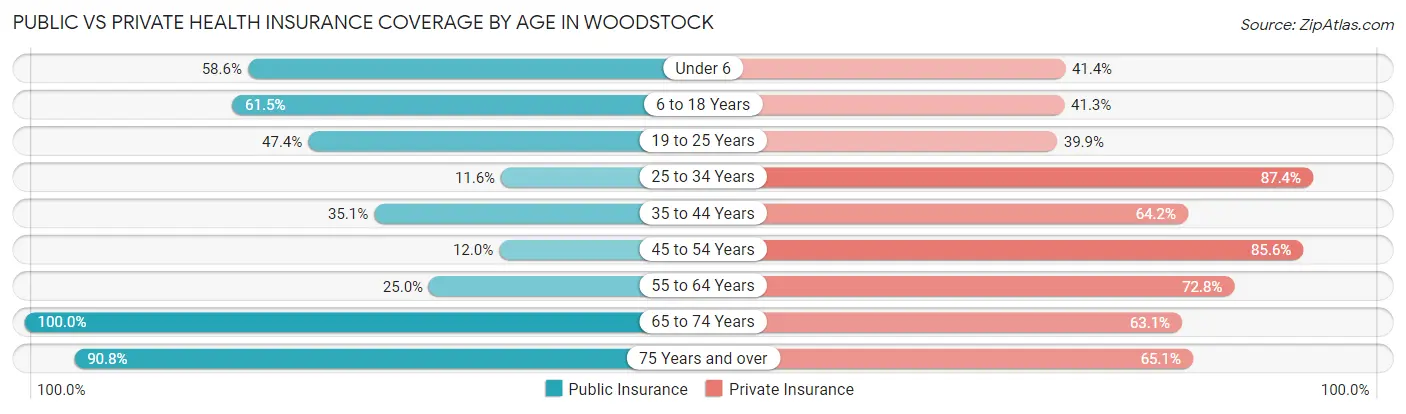
| Age Bracket | Public Insurance | Private Insurance |
| Under 6 | 362 (58.6%) | 256 (41.4%) |
| 6 to 18 Years | 627 (61.5%) | 421 (41.3%) |
| 19 to 25 Years | 190 (47.4%) | 160 (39.9%) |
| 25 to 34 Years | 82 (11.6%) | 619 (87.4%) |
| 35 to 44 Years | 273 (35.1%) | 499 (64.2%) |
| 45 to 54 Years | 79 (11.9%) | 566 (85.6%) |
| 55 to 64 Years | 135 (24.9%) | 394 (72.8%) |
| 65 to 74 Years | 415 (100.0%) | 262 (63.1%) |
| 75 Years and over | 414 (90.8%) | 297 (65.1%) |
| Total | 2,577 (46.0%) | 3,474 (62.1%) |
Disability Status by Sex by Age in Woodstock
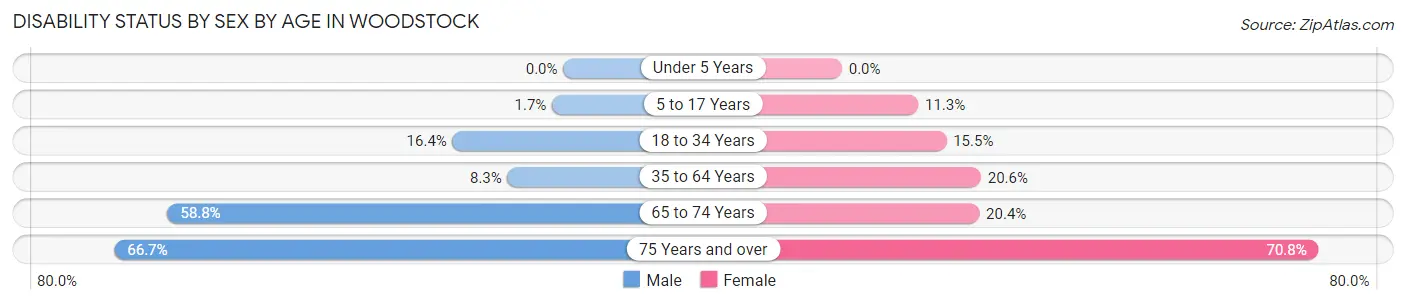
| Age Bracket | Male | Female |
| Under 5 Years | 0 (0.0%) | 0 (0.0%) |
| 5 to 17 Years | 9 (1.7%) | 65 (11.3%) |
| 18 to 34 Years | 97 (16.4%) | 87 (15.5%) |
| 35 to 64 Years | 78 (8.3%) | 214 (20.6%) |
| 65 to 74 Years | 97 (58.8%) | 51 (20.4%) |
| 75 Years and over | 110 (66.7%) | 206 (70.8%) |
Disability Class by Sex by Age in Woodstock
Disability Class: Hearing Difficulty
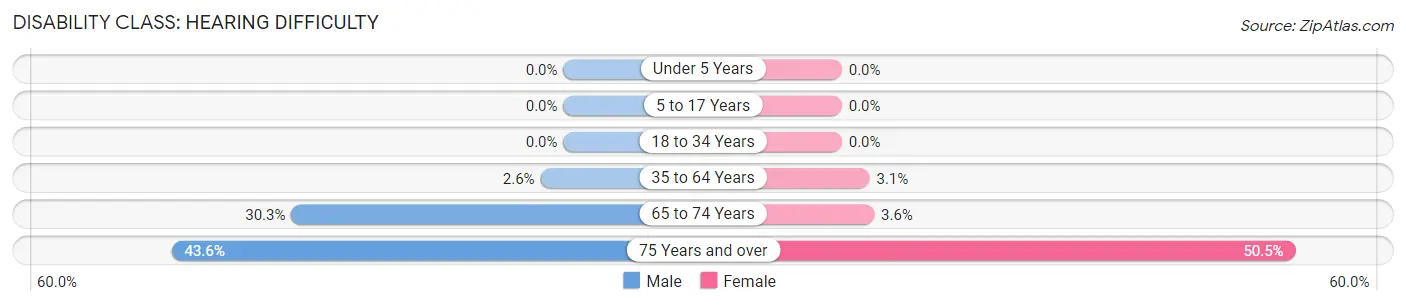
| Age Bracket | Male | Female |
| Under 5 Years | 0 (0.0%) | 0 (0.0%) |
| 5 to 17 Years | 0 (0.0%) | 0 (0.0%) |
| 18 to 34 Years | 0 (0.0%) | 0 (0.0%) |
| 35 to 64 Years | 24 (2.5%) | 32 (3.1%) |
| 65 to 74 Years | 50 (30.3%) | 9 (3.6%) |
| 75 Years and over | 72 (43.6%) | 147 (50.5%) |
Disability Class: Vision Difficulty
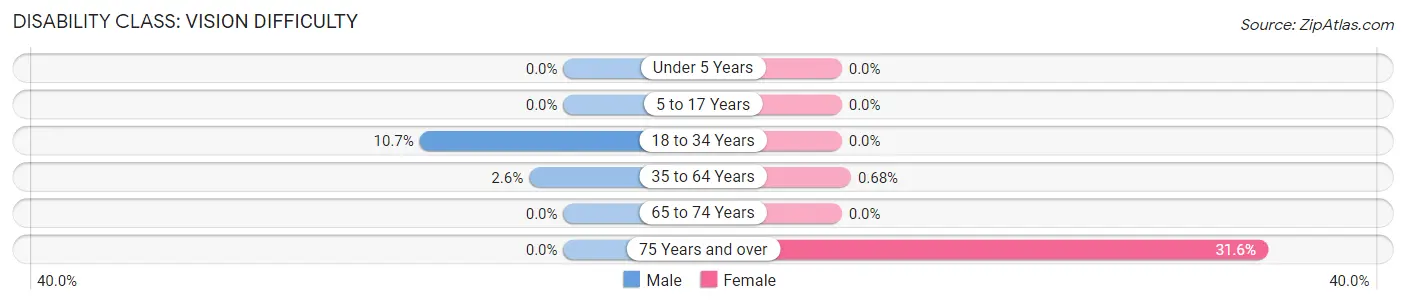
| Age Bracket | Male | Female |
| Under 5 Years | 0 (0.0%) | 0 (0.0%) |
| 5 to 17 Years | 0 (0.0%) | 0 (0.0%) |
| 18 to 34 Years | 63 (10.7%) | 0 (0.0%) |
| 35 to 64 Years | 24 (2.5%) | 7 (0.7%) |
| 65 to 74 Years | 0 (0.0%) | 0 (0.0%) |
| 75 Years and over | 0 (0.0%) | 92 (31.6%) |
Disability Class: Cognitive Difficulty
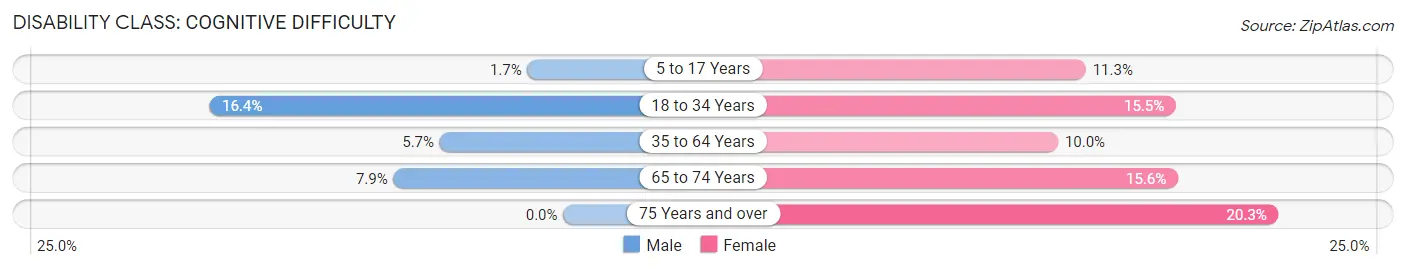
| Age Bracket | Male | Female |
| 5 to 17 Years | 9 (1.7%) | 65 (11.3%) |
| 18 to 34 Years | 97 (16.4%) | 87 (15.5%) |
| 35 to 64 Years | 54 (5.7%) | 104 (10.0%) |
| 65 to 74 Years | 13 (7.9%) | 39 (15.6%) |
| 75 Years and over | 0 (0.0%) | 59 (20.3%) |
Disability Class: Ambulatory Difficulty
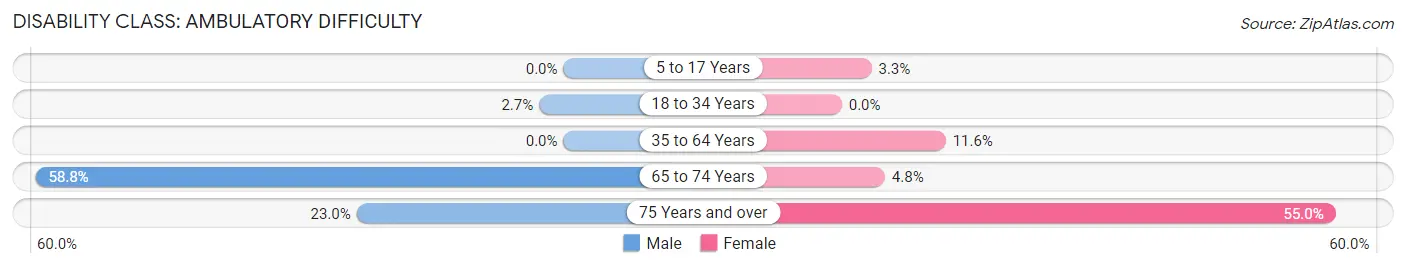
| Age Bracket | Male | Female |
| 5 to 17 Years | 0 (0.0%) | 19 (3.3%) |
| 18 to 34 Years | 16 (2.7%) | 0 (0.0%) |
| 35 to 64 Years | 0 (0.0%) | 120 (11.6%) |
| 65 to 74 Years | 97 (58.8%) | 12 (4.8%) |
| 75 Years and over | 38 (23.0%) | 160 (55.0%) |
Disability Class: Self-Care Difficulty
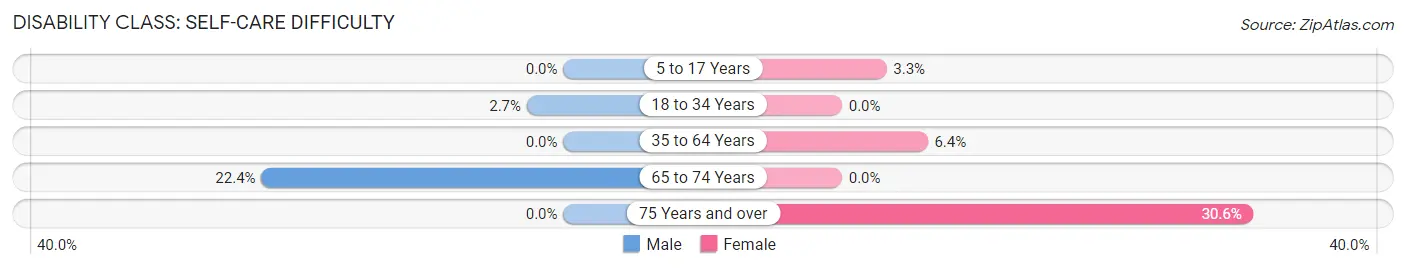
| Age Bracket | Male | Female |
| 5 to 17 Years | 0 (0.0%) | 19 (3.3%) |
| 18 to 34 Years | 16 (2.7%) | 0 (0.0%) |
| 35 to 64 Years | 0 (0.0%) | 66 (6.4%) |
| 65 to 74 Years | 37 (22.4%) | 0 (0.0%) |
| 75 Years and over | 0 (0.0%) | 89 (30.6%) |
Technology Access in Woodstock
Computing Device Access in Woodstock
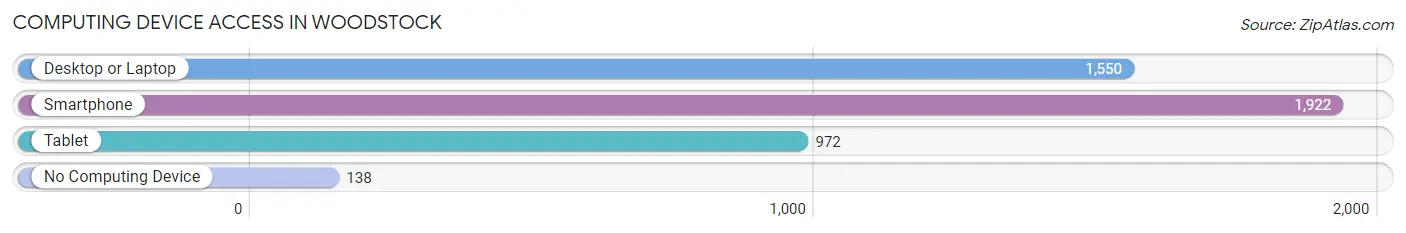
| Device Type | # Households | % Households |
| Desktop or Laptop | 1,550 | 72.1% |
| Smartphone | 1,922 | 89.4% |
| Tablet | 972 | 45.2% |
| No Computing Device | 138 | 6.4% |
| Total | 2,150 | 100.0% |
Internet Access in Woodstock
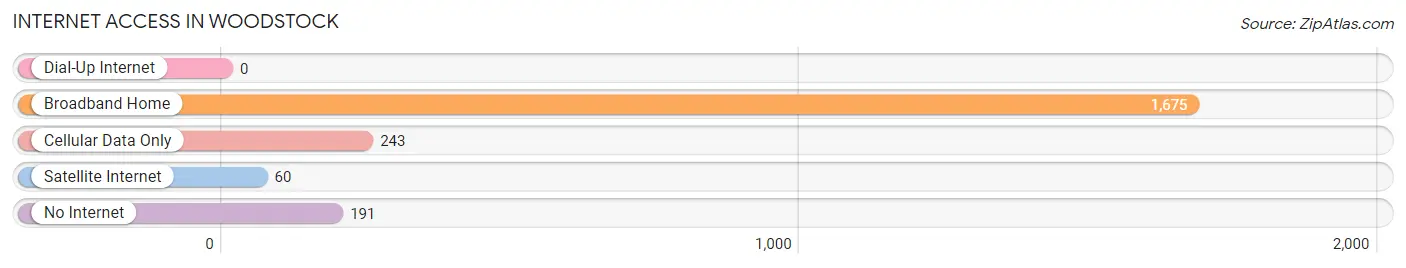
| Internet Type | # Households | % Households |
| Dial-Up Internet | 0 | 0.0% |
| Broadband Home | 1,675 | 77.9% |
| Cellular Data Only | 243 | 11.3% |
| Satellite Internet | 60 | 2.8% |
| No Internet | 191 | 8.9% |
| Total | 2,150 | 100.0% |
Woodstock Summary
Woodstock, Virginia is a small town located in the Shenandoah Valley of Virginia, about 80 miles west of Washington, D.C. It is the county seat of Shenandoah County and is part of the Winchester, VA-WV Metropolitan Statistical Area. The town has a population of 5,097 as of the 2010 census.
History
Woodstock was founded in 1761 by Peter Stover, a German immigrant. The town was named after the English town of Woodstock, Oxfordshire. The town was originally known as Stoverstown, but the name was changed to Woodstock in 1790.
The town was an important stop on the Valley Turnpike, which connected Winchester to Staunton. The turnpike was an important route for settlers heading west and for goods and services heading east.
During the Civil War, Woodstock was the site of several battles, including the Battle of Woodstock in 1864. The town was also the site of a Confederate prison camp.
Geography
Woodstock is located in the Shenandoah Valley of Virginia, about 80 miles west of Washington, D.C. The town is situated at the confluence of the North and South Forks of the Shenandoah River. The town is surrounded by the George Washington National Forest and the Shenandoah National Park.
The town has a total area of 1.3 square miles, all of which is land. The town is located at an elevation of 1,068 feet.
Economy
Woodstock’s economy is largely based on agriculture and tourism. The town is home to several wineries, including the Woodstock Vineyards and the Shenandoah Vineyards. The town is also home to several antique shops and art galleries.
The town is also home to several manufacturing companies, including the Woodstock Furniture Company and the Woodstock Manufacturing Company.
Demographics
As of the 2010 census, Woodstock had a population of 5,097. The racial makeup of the town was 94.3% White, 2.2% African American, 0.3% Native American, 0.7% Asian, 0.1% Pacific Islander, 0.7% from other races, and 1.7% from two or more races. Hispanic or Latino of any race were 2.2% of the population.
The median income for a household in the town was $41,944, and the median income for a family was $50,944. The per capita income for the town was $20,944. About 8.3% of families and 10.2% of the population were below the poverty line, including 14.2% of those under age 18 and 8.2% of those age 65 or over.
Common Questions
What is Per Capita Income in Woodstock?
Per Capita income in Woodstock is $33,999.
What is the Median Family Income in Woodstock?
Median Family Income in Woodstock is $75,565.
What is the Median Household income in Woodstock?
Median Household Income in Woodstock is $64,470.
What is Income or Wage Gap in Woodstock?
Income or Wage Gap in Woodstock is 20.4%.
Women in Woodstock earn 79.6 cents for every dollar earned by a man.
What is Inequality or Gini Index in Woodstock?
Inequality or Gini Index in Woodstock is 0.51.
What is the Total Population of Woodstock?
Total Population of Woodstock is 5,798.
What is the Total Male Population of Woodstock?
Total Male Population of Woodstock is 2,617.
What is the Total Female Population of Woodstock?
Total Female Population of Woodstock is 3,181.
What is the Ratio of Males per 100 Females in Woodstock?
There are 82.27 Males per 100 Females in Woodstock.
What is the Ratio of Females per 100 Males in Woodstock?
There are 121.55 Females per 100 Males in Woodstock.
What is the Median Population Age in Woodstock?
Median Population Age in Woodstock is 38.4 Years.
What is the Average Family Size in Woodstock
Average Family Size in Woodstock is 3.4 People.
What is the Average Household Size in Woodstock
Average Household Size in Woodstock is 2.6 People.
How Large is the Labor Force in Woodstock?
There are 2,569 People in the Labor Forcein in Woodstock.
What is the Percentage of People in the Labor Force in Woodstock?
59.6% of People are in the Labor Force in Woodstock.
What is the Unemployment Rate in Woodstock?
Unemployment Rate in Woodstock is 5.2%.