Pastoria, VA Map & Demographics
Pastoria Map
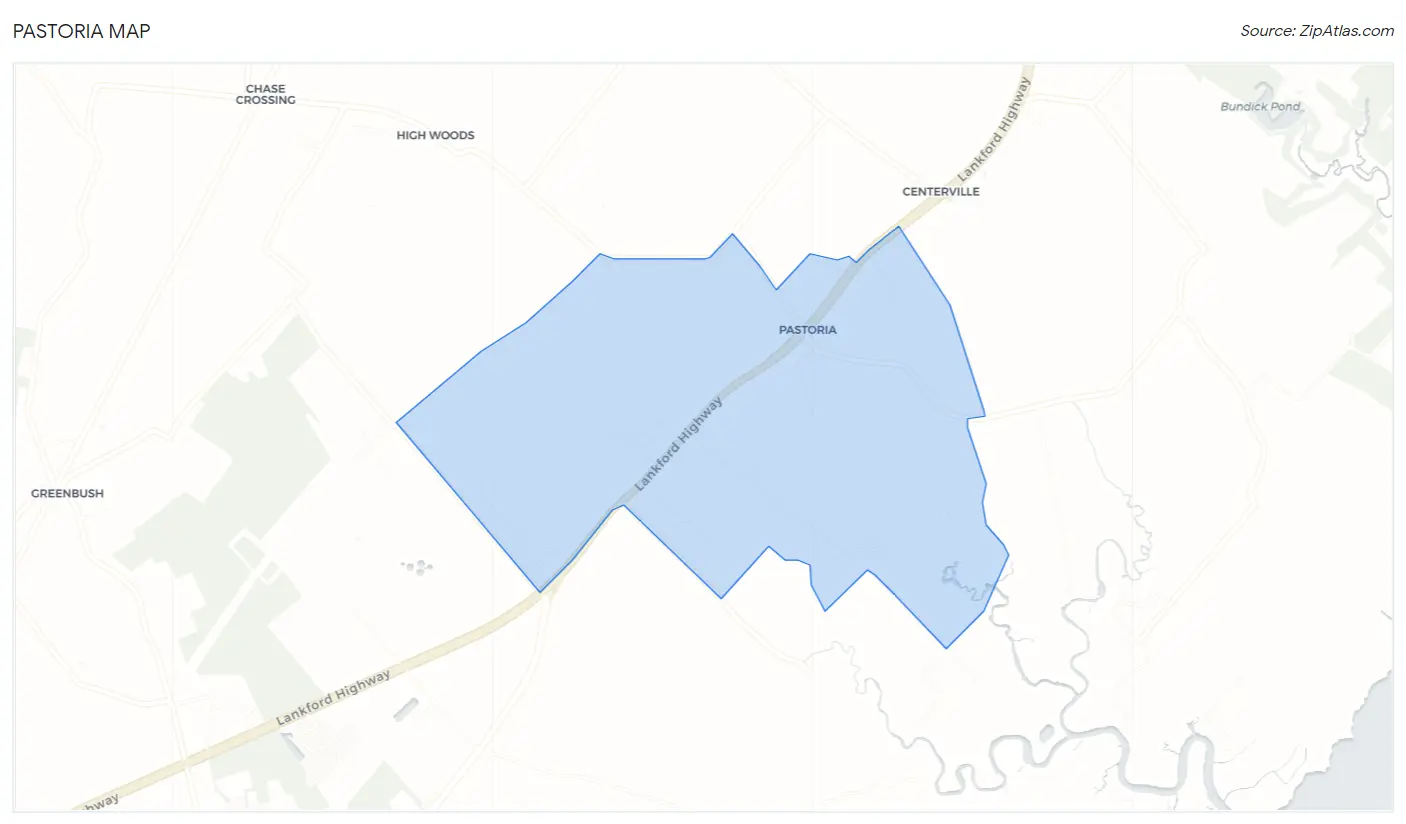
Pastoria Overview
$27,674
PER CAPITA INCOME
$71,875
AVG FAMILY INCOME
39.1%
WAGE / INCOME GAP [ % ]
60.9¢/ $1
WAGE / INCOME GAP [ $ ]
0.38
INEQUALITY / GINI INDEX
761
TOTAL POPULATION
440
MALE POPULATION
321
FEMALE POPULATION
137.07
MALES / 100 FEMALES
72.95
FEMALES / 100 MALES
54.3
MEDIAN AGE
2.7
AVG FAMILY SIZE
2.2
AVG HOUSEHOLD SIZE
405
LABOR FORCE [ PEOPLE ]
63.9%
PERCENT IN LABOR FORCE
Income in Pastoria
Income Overview in Pastoria
| Characteristic | Number | Measure |
| Per Capita Income | 761 | $27,674 |
| Median Family Income | 245 | $71,875 |
| Mean Family Income | 245 | $68,845 |
| Median Household Income | 339 | $0 |
| Mean Household Income | 339 | $57,678 |
| Income Deficit | 245 | $0 |
| Wage / Income Gap (%) | 761 | 39.13% |
| Wage / Income Gap ($) | 761 | 60.87¢ per $1 |
| Gini / Inequality Index | 761 | 0.38 |
Earnings by Sex in Pastoria
Average Earnings in Pastoria are $29,867, $47,790 for men and $29,091 for women, a difference of 39.1%.
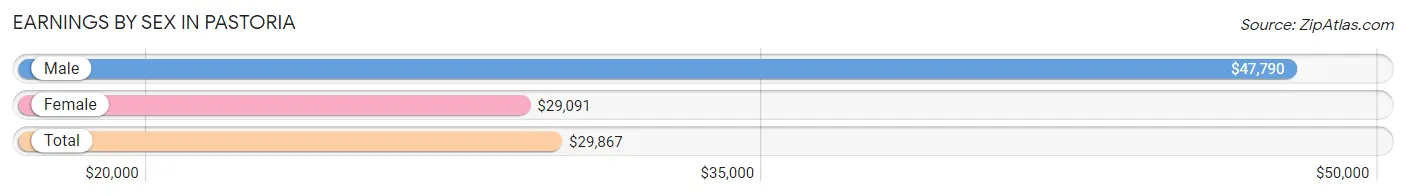
| Sex | Number | Average Earnings |
| Male | 285 (70.4%) | $47,790 |
| Female | 120 (29.6%) | $29,091 |
| Total | 405 (100.0%) | $29,867 |
Earnings by Sex by Income Bracket in Pastoria
The most common earnings brackets in Pastoria are $25,000 to $29,999 for men (101 | 35.4%) and $40,000 to $44,999 for women (48 | 40.0%).
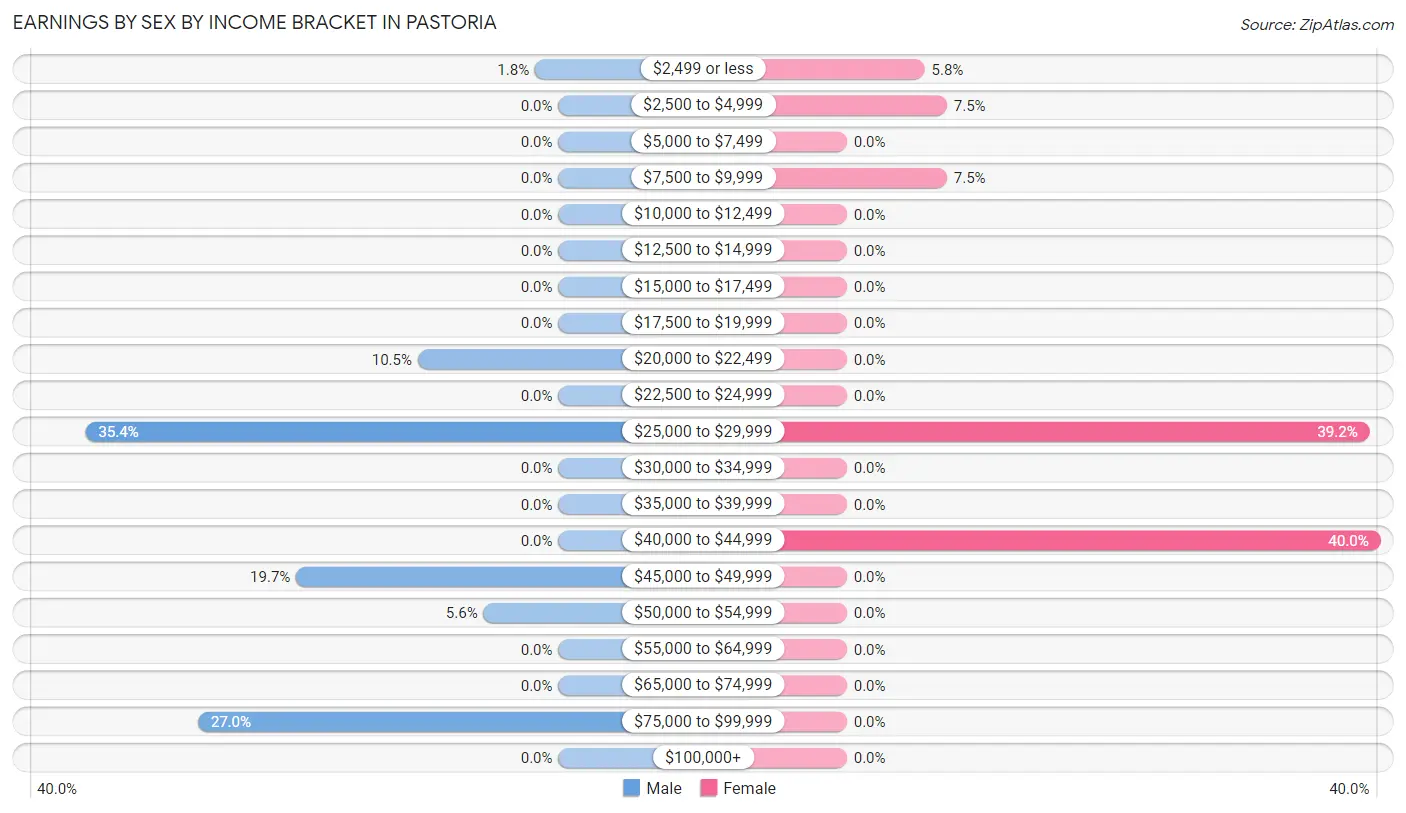
| Income | Male | Female |
| $2,499 or less | 5 (1.8%) | 7 (5.8%) |
| $2,500 to $4,999 | 0 (0.0%) | 9 (7.5%) |
| $5,000 to $7,499 | 0 (0.0%) | 0 (0.0%) |
| $7,500 to $9,999 | 0 (0.0%) | 9 (7.5%) |
| $10,000 to $12,499 | 0 (0.0%) | 0 (0.0%) |
| $12,500 to $14,999 | 0 (0.0%) | 0 (0.0%) |
| $15,000 to $17,499 | 0 (0.0%) | 0 (0.0%) |
| $17,500 to $19,999 | 0 (0.0%) | 0 (0.0%) |
| $20,000 to $22,499 | 30 (10.5%) | 0 (0.0%) |
| $22,500 to $24,999 | 0 (0.0%) | 0 (0.0%) |
| $25,000 to $29,999 | 101 (35.4%) | 47 (39.2%) |
| $30,000 to $34,999 | 0 (0.0%) | 0 (0.0%) |
| $35,000 to $39,999 | 0 (0.0%) | 0 (0.0%) |
| $40,000 to $44,999 | 0 (0.0%) | 48 (40.0%) |
| $45,000 to $49,999 | 56 (19.7%) | 0 (0.0%) |
| $50,000 to $54,999 | 16 (5.6%) | 0 (0.0%) |
| $55,000 to $64,999 | 0 (0.0%) | 0 (0.0%) |
| $65,000 to $74,999 | 0 (0.0%) | 0 (0.0%) |
| $75,000 to $99,999 | 77 (27.0%) | 0 (0.0%) |
| $100,000+ | 0 (0.0%) | 0 (0.0%) |
| Total | 285 (100.0%) | 120 (100.0%) |
Earnings by Sex by Educational Attainment in Pastoria
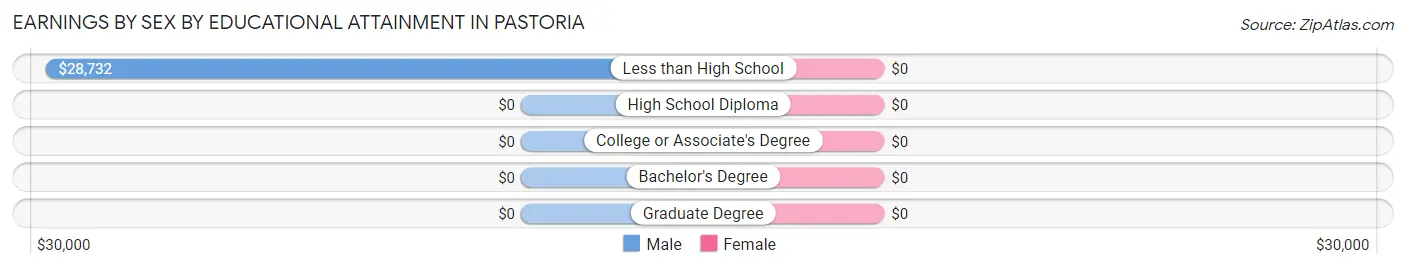
| Educational Attainment | Male Income | Female Income |
| Less than High School | $28,732 | $0 |
| High School Diploma | - | - |
| College or Associate's Degree | - | - |
| Bachelor's Degree | - | - |
| Graduate Degree | - | - |
| Total | $48,326 | $29,621 |
Family Income in Pastoria
Family Income Brackets in Pastoria
According to the Pastoria family income data, there are 79 families falling into the $25,000 to $34,999 income range, which is the most common income bracket and makes up 32.2% of all families.
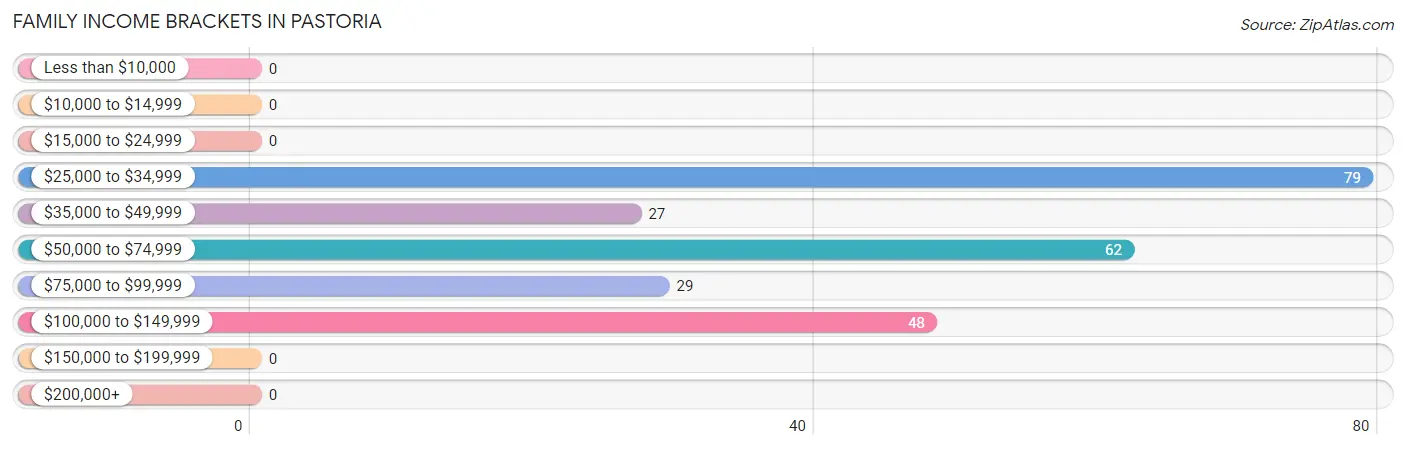
| Income Bracket | # Families | % Families |
| Less than $10,000 | 0 | 0.0% |
| $10,000 to $14,999 | 0 | 0.0% |
| $15,000 to $24,999 | 0 | 0.0% |
| $25,000 to $34,999 | 79 | 32.2% |
| $35,000 to $49,999 | 27 | 11.0% |
| $50,000 to $74,999 | 62 | 25.3% |
| $75,000 to $99,999 | 29 | 11.8% |
| $100,000 to $149,999 | 48 | 19.6% |
| $150,000 to $199,999 | 0 | 0.0% |
| $200,000+ | 0 | 0.0% |
Family Income by Famaliy Size in Pastoria
| Income Bracket | # Families | Median Income |
| 2-Person Families | 167 (68.2%) | $0 |
| 3-Person Families | 9 (3.7%) | $0 |
| 4-Person Families | 40 (16.3%) | $0 |
| 5-Person Families | 0 (0.0%) | $0 |
| 6-Person Families | 29 (11.8%) | $0 |
| 7+ Person Families | 0 (0.0%) | $0 |
| Total | 245 (100.0%) | $71,875 |
Family Income by Number of Earners in Pastoria
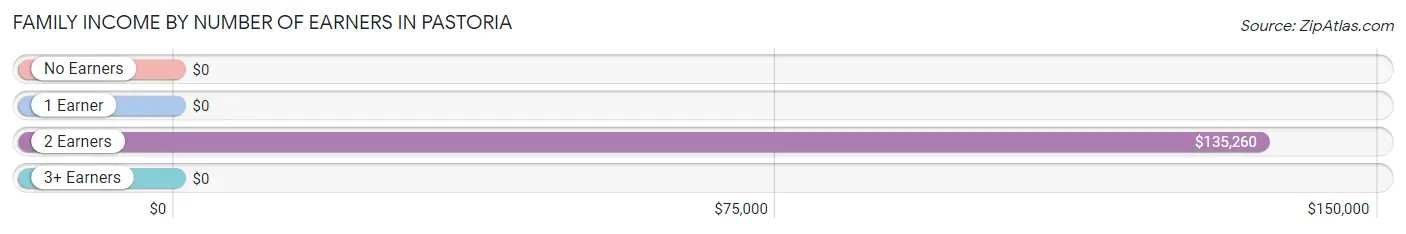
| Number of Earners | # Families | Median Income |
| No Earners | 22 (9.0%) | $0 |
| 1 Earner | 97 (39.6%) | $0 |
| 2 Earners | 86 (35.1%) | $135,260 |
| 3+ Earners | 40 (16.3%) | $0 |
| Total | 245 (100.0%) | $71,875 |
Household Income in Pastoria
Household Income Brackets in Pastoria
With 86 households falling in the category, the $25,000 to $34,999 income range is the most frequent in Pastoria, accounting for 25.4% of all households.
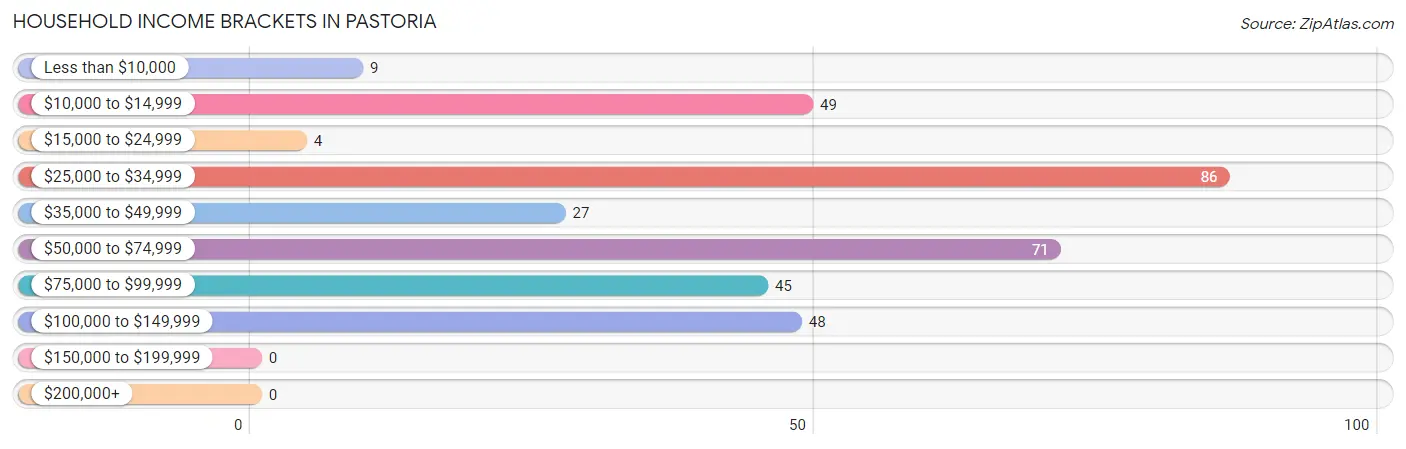
| Income Bracket | # Households | % Households |
| Less than $10,000 | 9 | 2.7% |
| $10,000 to $14,999 | 49 | 14.5% |
| $15,000 to $24,999 | 4 | 1.2% |
| $25,000 to $34,999 | 86 | 25.4% |
| $35,000 to $49,999 | 27 | 8.0% |
| $50,000 to $74,999 | 71 | 20.9% |
| $75,000 to $99,999 | 45 | 13.3% |
| $100,000 to $149,999 | 48 | 14.2% |
| $150,000 to $199,999 | 0 | 0.0% |
| $200,000+ | 0 | 0.0% |
Household Income by Householder Age in Pastoria
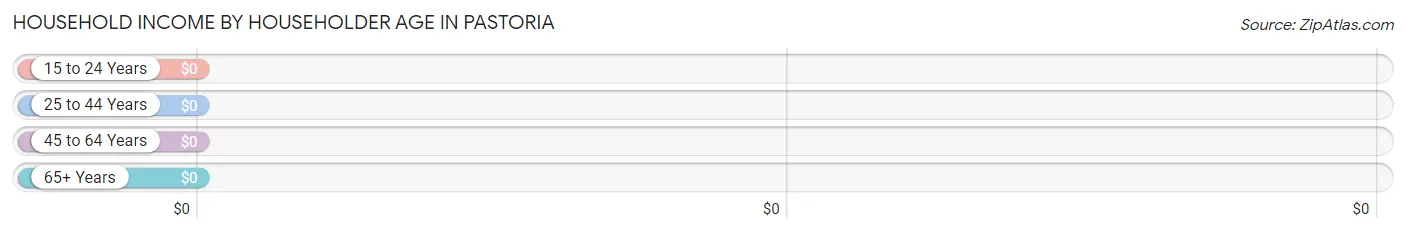
| Income Bracket | # Households | Median Income |
| 15 to 24 Years | 0 (0.0%) | $0 |
| 25 to 44 Years | 29 (8.6%) | $0 |
| 45 to 64 Years | 210 (62.0%) | $0 |
| 65+ Years | 100 (29.5%) | $0 |
| Total | 339 (100.0%) | $0 |
Poverty in Pastoria
Income Below Poverty by Sex and Age in Pastoria
| Age Bracket | Male | Female |
| Under 5 Years | 0 (0.0%) | 0 (0.0%) |
| 5 Years | 0 (0.0%) | 0 (0.0%) |
| 6 to 11 Years | 0 (0.0%) | 0 (0.0%) |
| 12 to 14 Years | 0 (0.0%) | 0 (0.0%) |
| 15 Years | 0 (0.0%) | 0 (0.0%) |
| 16 and 17 Years | 0 (0.0%) | 0 (0.0%) |
| 18 to 24 Years | 0 (0.0%) | 0 (0.0%) |
| 25 to 34 Years | 0 (0.0%) | 0 (0.0%) |
| 35 to 44 Years | 0 (0.0%) | 0 (0.0%) |
| 45 to 54 Years | 0 (0.0%) | 0 (0.0%) |
| 55 to 64 Years | 0 (0.0%) | 9 (12.2%) |
| 65 to 74 Years | 0 (0.0%) | 0 (0.0%) |
| 75 Years and over | 0 (0.0%) | 49 (79.0%) |
| Total | 0 (0.0%) | 58 (18.1%) |
Income Above Poverty by Sex and Age in Pastoria
According to the poverty statistics in Pastoria, males aged 6 to 11 years and females aged under 5 years are the age groups that are most secure financially, with 100.0% of males and 100.0% of females in these age groups living above the poverty line.
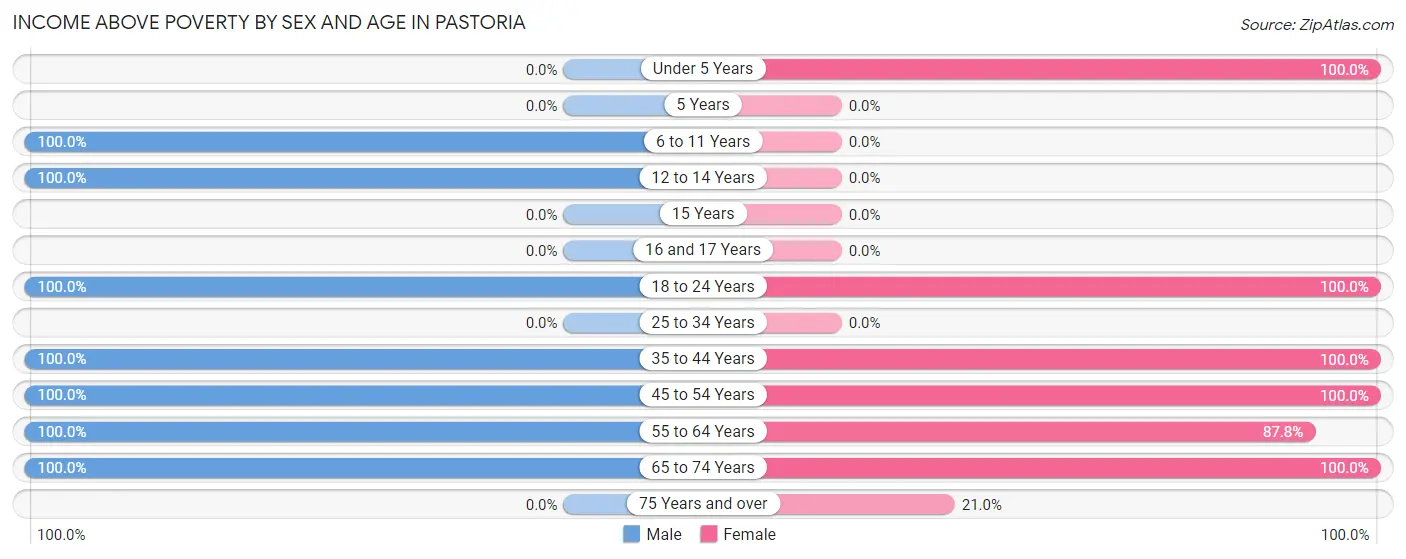
| Age Bracket | Male | Female |
| Under 5 Years | 0 (0.0%) | 40 (100.0%) |
| 5 Years | 0 (0.0%) | 0 (0.0%) |
| 6 to 11 Years | 58 (100.0%) | 0 (0.0%) |
| 12 to 14 Years | 29 (100.0%) | 0 (0.0%) |
| 15 Years | 0 (0.0%) | 0 (0.0%) |
| 16 and 17 Years | 0 (0.0%) | 0 (0.0%) |
| 18 to 24 Years | 30 (100.0%) | 14 (100.0%) |
| 25 to 34 Years | 0 (0.0%) | 0 (0.0%) |
| 35 to 44 Years | 29 (100.0%) | 33 (100.0%) |
| 45 to 54 Years | 98 (100.0%) | 82 (100.0%) |
| 55 to 64 Years | 174 (100.0%) | 65 (87.8%) |
| 65 to 74 Years | 22 (100.0%) | 16 (100.0%) |
| 75 Years and over | 0 (0.0%) | 13 (21.0%) |
| Total | 440 (100.0%) | 263 (81.9%) |
Income Below Poverty Among Married-Couple Families in Pastoria
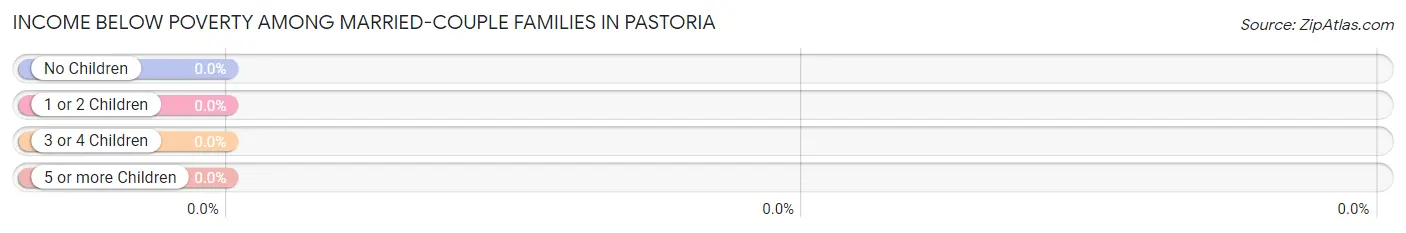
| Children | Above Poverty | Below Poverty |
| No Children | 145 (100.0%) | 0 (0.0%) |
| 1 or 2 Children | 0 (0.0%) | 0 (0.0%) |
| 3 or 4 Children | 29 (100.0%) | 0 (0.0%) |
| 5 or more Children | 0 (0.0%) | 0 (0.0%) |
| Total | 174 (100.0%) | 0 (0.0%) |
Income Below Poverty Among Single-Parent Households in Pastoria
| Children | Single Father | Single Mother |
| No Children | 0 (0.0%) | 0 (0.0%) |
| 1 or 2 Children | 0 (0.0%) | 0 (0.0%) |
| 3 or 4 Children | 0 (0.0%) | 0 (0.0%) |
| 5 or more Children | 0 (0.0%) | 0 (0.0%) |
| Total | 0 (0.0%) | 0 (0.0%) |
Income Below Poverty Among Married-Couple vs Single-Parent Households in Pastoria
| Children | Married-Couple Families | Single-Parent Households |
| No Children | 0 (0.0%) | 0 (0.0%) |
| 1 or 2 Children | 0 (0.0%) | 0 (0.0%) |
| 3 or 4 Children | 0 (0.0%) | 0 (0.0%) |
| 5 or more Children | 0 (0.0%) | 0 (0.0%) |
| Total | 0 (0.0%) | 0 (0.0%) |
Race in Pastoria
The most populous races in Pastoria are Black / African American (382 | 50.2%), Hispanic or Latino (271 | 35.6%), and Two or more Races (168 | 22.1%).
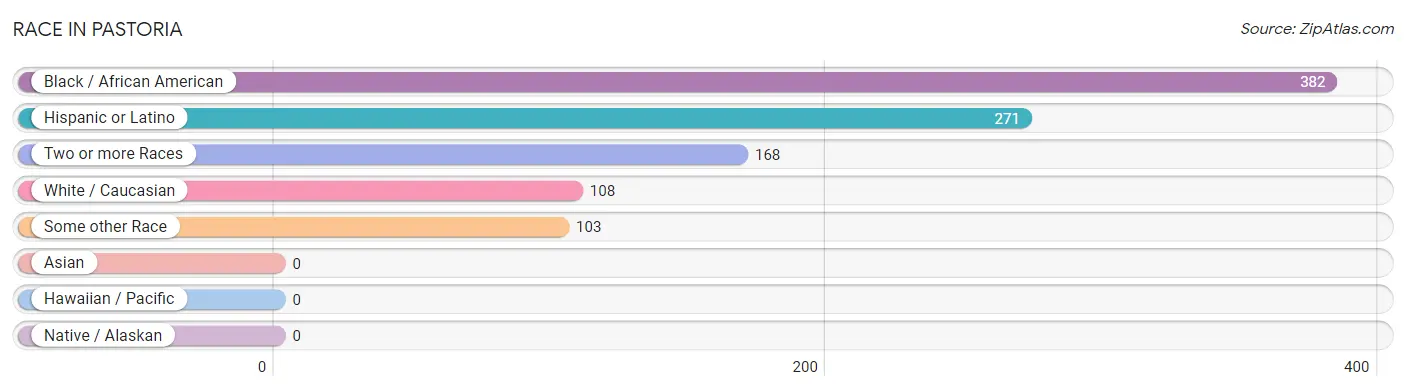
| Race | # Population | % Population |
| Asian | 0 | 0.0% |
| Black / African American | 382 | 50.2% |
| Hawaiian / Pacific | 0 | 0.0% |
| Hispanic or Latino | 271 | 35.6% |
| Native / Alaskan | 0 | 0.0% |
| White / Caucasian | 108 | 14.2% |
| Two or more Races | 168 | 22.1% |
| Some other Race | 103 | 13.5% |
| Total | 761 | 100.0% |
Ancestry in Pastoria
The most populous ancestries reported in Pastoria are American (229 | 30.1%), Mexican (168 | 22.1%), Central American (103 | 13.5%), Guatemalan (103 | 13.5%), and Haitian (62 | 8.2%), together accounting for 87.4% of all Pastoria residents.
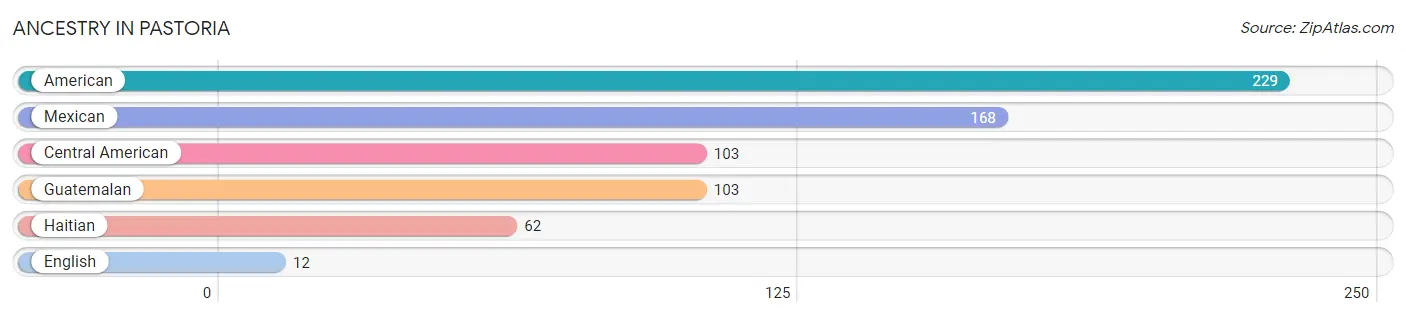
| Ancestry | # Population | % Population |
| American | 229 | 30.1% |
| Central American | 103 | 13.5% |
| English | 12 | 1.6% |
| Guatemalan | 103 | 13.5% |
| Haitian | 62 | 8.2% |
| Mexican | 168 | 22.1% | View All 6 Rows |
Immigrants in Pastoria
The most numerous immigrant groups reported in Pastoria came from Latin America (313 | 41.1%), Central America (222 | 29.2%), Mexico (119 | 15.6%), Guatemala (103 | 13.5%), and Caribbean (91 | 12.0%), together accounting for 111.4% of all Pastoria residents.
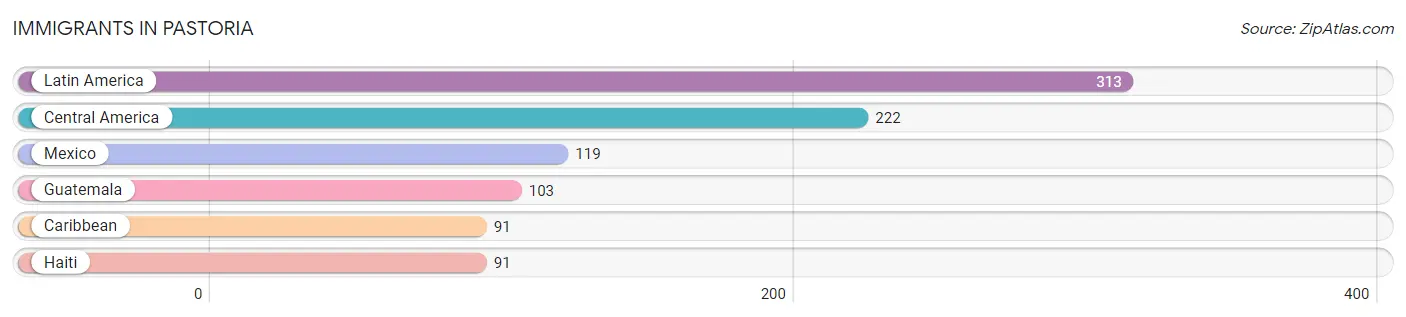
| Immigration Origin | # Population | % Population |
| Caribbean | 91 | 12.0% |
| Central America | 222 | 29.2% |
| Guatemala | 103 | 13.5% |
| Haiti | 91 | 12.0% |
| Latin America | 313 | 41.1% |
| Mexico | 119 | 15.6% | View All 6 Rows |
Sex and Age in Pastoria
Sex and Age in Pastoria
The most populous age groups in Pastoria are 55 to 59 Years (144 | 32.7%) for men and 55 to 59 Years (65 | 20.3%) for women.
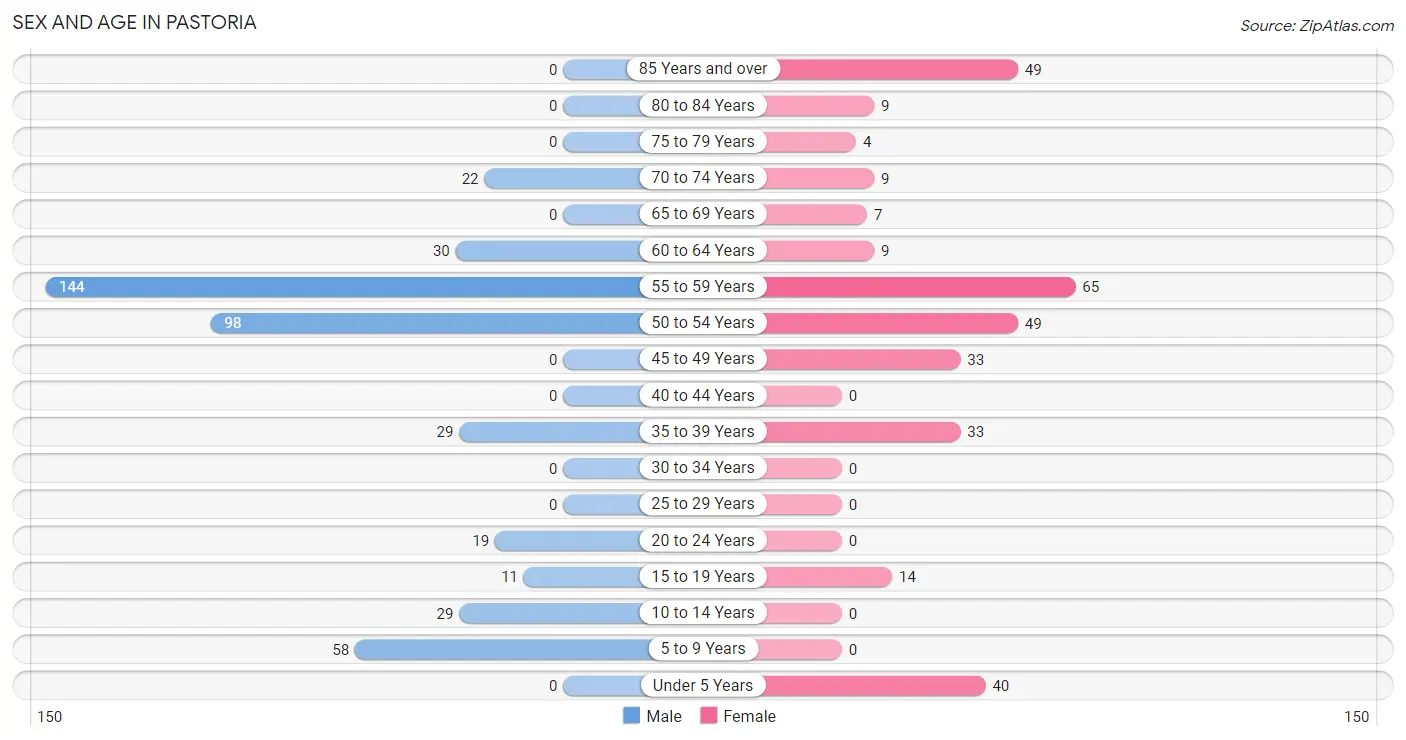
| Age Bracket | Male | Female |
| Under 5 Years | 0 (0.0%) | 40 (12.5%) |
| 5 to 9 Years | 58 (13.2%) | 0 (0.0%) |
| 10 to 14 Years | 29 (6.6%) | 0 (0.0%) |
| 15 to 19 Years | 11 (2.5%) | 14 (4.4%) |
| 20 to 24 Years | 19 (4.3%) | 0 (0.0%) |
| 25 to 29 Years | 0 (0.0%) | 0 (0.0%) |
| 30 to 34 Years | 0 (0.0%) | 0 (0.0%) |
| 35 to 39 Years | 29 (6.6%) | 33 (10.3%) |
| 40 to 44 Years | 0 (0.0%) | 0 (0.0%) |
| 45 to 49 Years | 0 (0.0%) | 33 (10.3%) |
| 50 to 54 Years | 98 (22.3%) | 49 (15.3%) |
| 55 to 59 Years | 144 (32.7%) | 65 (20.3%) |
| 60 to 64 Years | 30 (6.8%) | 9 (2.8%) |
| 65 to 69 Years | 0 (0.0%) | 7 (2.2%) |
| 70 to 74 Years | 22 (5.0%) | 9 (2.8%) |
| 75 to 79 Years | 0 (0.0%) | 4 (1.3%) |
| 80 to 84 Years | 0 (0.0%) | 9 (2.8%) |
| 85 Years and over | 0 (0.0%) | 49 (15.3%) |
| Total | 440 (100.0%) | 321 (100.0%) |
Families and Households in Pastoria
Median Family Size in Pastoria
The median family size in Pastoria is 2.67 persons per family, with married-couple families (174 | 71.0%) accounting for the largest median family size of 2.74 persons per family. On the other hand, single female/mother families (9 | 3.7%) represent the smallest median family size with 2.22 persons per family.
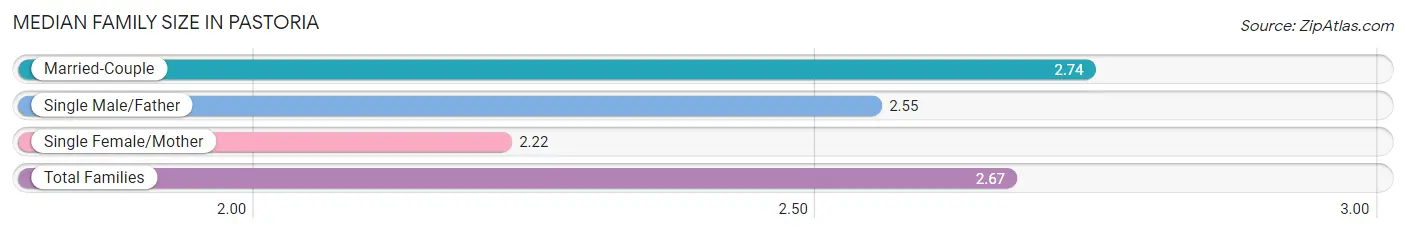
| Family Type | # Families | Family Size |
| Married-Couple | 174 (71.0%) | 2.74 |
| Single Male/Father | 62 (25.3%) | 2.55 |
| Single Female/Mother | 9 (3.7%) | 2.22 |
| Total Families | 245 (100.0%) | 2.67 |
Median Household Size in Pastoria
The median household size in Pastoria is 2.24 persons per household, with married-couple households (174 | 51.3%) accounting for the largest median household size of 2.74 persons per household. non-family households (94 | 27.7%) represent the smallest median household size with 1.13 persons per household.
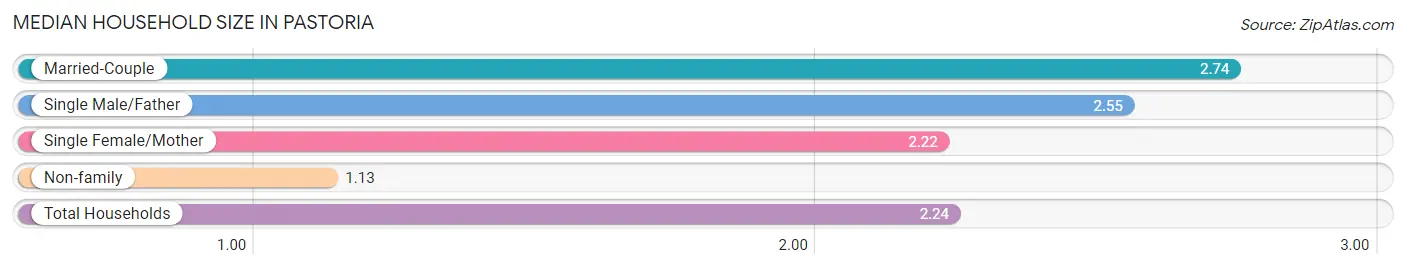
| Household Type | # Households | Household Size |
| Married-Couple | 174 (51.3%) | 2.74 |
| Single Male/Father | 62 (18.3%) | 2.55 |
| Single Female/Mother | 9 (2.6%) | 2.22 |
| Non-family | 94 (27.7%) | 1.13 |
| Total Households | 339 (100.0%) | 2.24 |
Household Size by Marriage Status in Pastoria
Out of a total of 339 households in Pastoria, 245 (72.3%) are family households, while 94 (27.7%) are nonfamily households. The most numerous type of family households are 2-person households, comprising 167, and the most common type of nonfamily households are 1-person households, comprising 78.
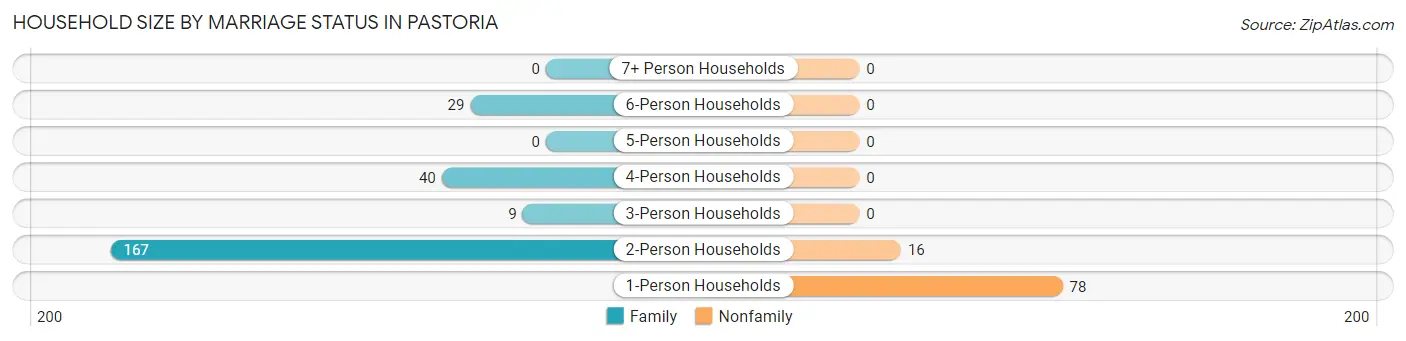
| Household Size | Family Households | Nonfamily Households |
| 1-Person Households | - | 78 (23.0%) |
| 2-Person Households | 167 (49.3%) | 16 (4.7%) |
| 3-Person Households | 9 (2.6%) | 0 (0.0%) |
| 4-Person Households | 40 (11.8%) | 0 (0.0%) |
| 5-Person Households | 0 (0.0%) | 0 (0.0%) |
| 6-Person Households | 29 (8.6%) | 0 (0.0%) |
| 7+ Person Households | 0 (0.0%) | 0 (0.0%) |
| Total | 245 (72.3%) | 94 (27.7%) |
Female Fertility in Pastoria
Fertility by Age in Pastoria
| Age Bracket | Women with Births | Births / 1,000 Women |
| 15 to 19 years | 0 (0.0%) | 0.0 |
| 20 to 34 years | 0 (0.0%) | 0.0 |
| 35 to 50 years | 0 (0.0%) | 0.0 |
| Total | 0 (0.0%) | 0.0 |
Fertility by Age by Marriage Status in Pastoria
| Age Bracket | Married | Unmarried |
| 15 to 19 years | 0 (0.0%) | 0 (0.0%) |
| 20 to 34 years | 0 (0.0%) | 0 (0.0%) |
| 35 to 50 years | 0 (0.0%) | 0 (0.0%) |
| Total | 0 (0.0%) | 0 (0.0%) |
Fertility by Education in Pastoria
| Educational Attainment | Women with Births | Births / 1,000 Women |
| Less than High School | 0 (0.0%) | 0.0 |
| High School Diploma | 0 (0.0%) | 0.0 |
| College or Associate's Degree | 0 (0.0%) | 0.0 |
| Bachelor's Degree | 0 (0.0%) | 0.0 |
| Graduate Degree | 0 (0.0%) | 0.0 |
| Total | 0 (0.0%) | 0.0 |
Fertility by Education by Marriage Status in Pastoria
| Educational Attainment | Married | Unmarried |
| Less than High School | 0 (0.0%) | 0 (0.0%) |
| High School Diploma | 0 (0.0%) | 0 (0.0%) |
| College or Associate's Degree | 0 (0.0%) | 0 (0.0%) |
| Bachelor's Degree | 0 (0.0%) | 0 (0.0%) |
| Graduate Degree | 0 (0.0%) | 0 (0.0%) |
| Total | 0 (0.0%) | 0 (0.0%) |
Employment Characteristics in Pastoria
Employment by Class of Employer in Pastoria
Among the 405 employed individuals in Pastoria, private company employees (350 | 86.4%), state government employees (48 | 11.8%), and self-employed (not incorporated) (7 | 1.7%) make up the most common classes of employment.
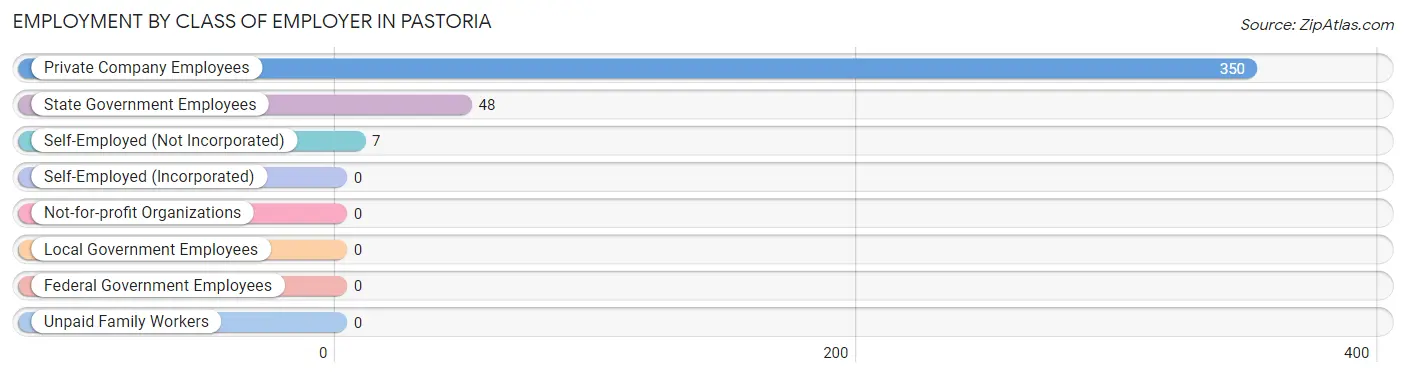
| Employer Class | # Employees | % Employees |
| Private Company Employees | 350 | 86.4% |
| Self-Employed (Incorporated) | 0 | 0.0% |
| Self-Employed (Not Incorporated) | 7 | 1.7% |
| Not-for-profit Organizations | 0 | 0.0% |
| Local Government Employees | 0 | 0.0% |
| State Government Employees | 48 | 11.8% |
| Federal Government Employees | 0 | 0.0% |
| Unpaid Family Workers | 0 | 0.0% |
| Total | 405 | 100.0% |
Employment Status by Age in Pastoria
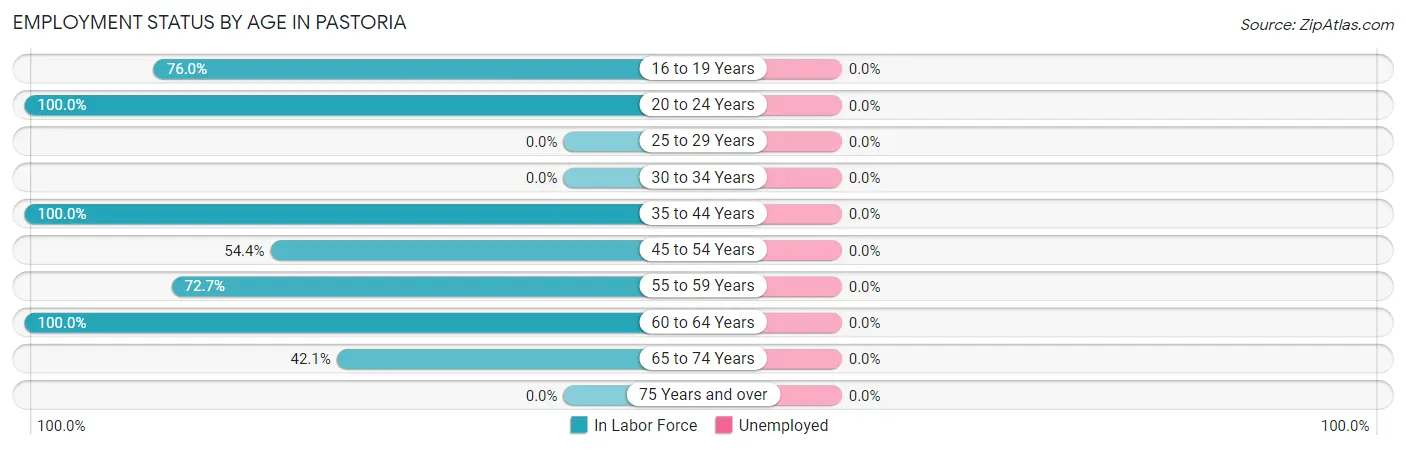
| Age Bracket | In Labor Force | Unemployed |
| 16 to 19 Years | 19 (76.0%) | 0 (0.0%) |
| 20 to 24 Years | 19 (100.0%) | 0 (0.0%) |
| 25 to 29 Years | 0 (0.0%) | 0 (0.0%) |
| 30 to 34 Years | 0 (0.0%) | 0 (0.0%) |
| 35 to 44 Years | 62 (100.0%) | 0 (0.0%) |
| 45 to 54 Years | 98 (54.4%) | 0 (0.0%) |
| 55 to 59 Years | 152 (72.7%) | 0 (0.0%) |
| 60 to 64 Years | 39 (100.0%) | 0 (0.0%) |
| 65 to 74 Years | 16 (42.1%) | 0 (0.0%) |
| 75 Years and over | 0 (0.0%) | 0 (0.0%) |
| Total | 405 (63.9%) | 0 (0.0%) |
Employment Status by Educational Attainment in Pastoria
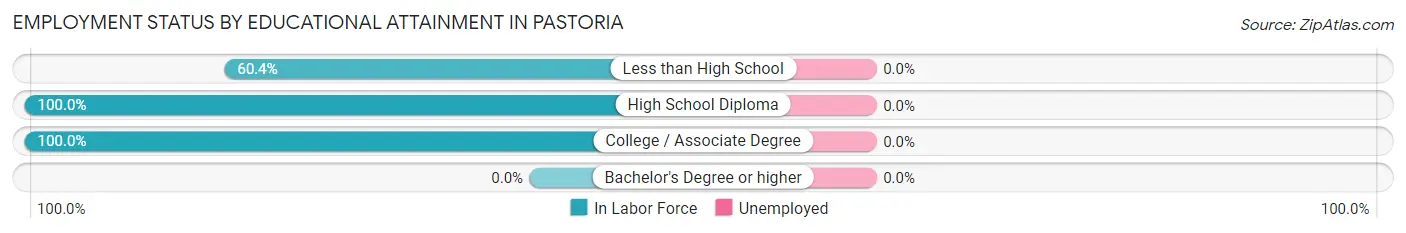
| Educational Attainment | In Labor Force | Unemployed |
| Less than High School | 162 (60.4%) | 0 (0.0%) |
| High School Diploma | 52 (100.0%) | 0 (0.0%) |
| College / Associate Degree | 137 (100.0%) | 0 (0.0%) |
| Bachelor's Degree or higher | 0 (0.0%) | 0 (0.0%) |
| Total | 351 (71.6%) | 0 (0.0%) |
Employment Occupations by Sex in Pastoria
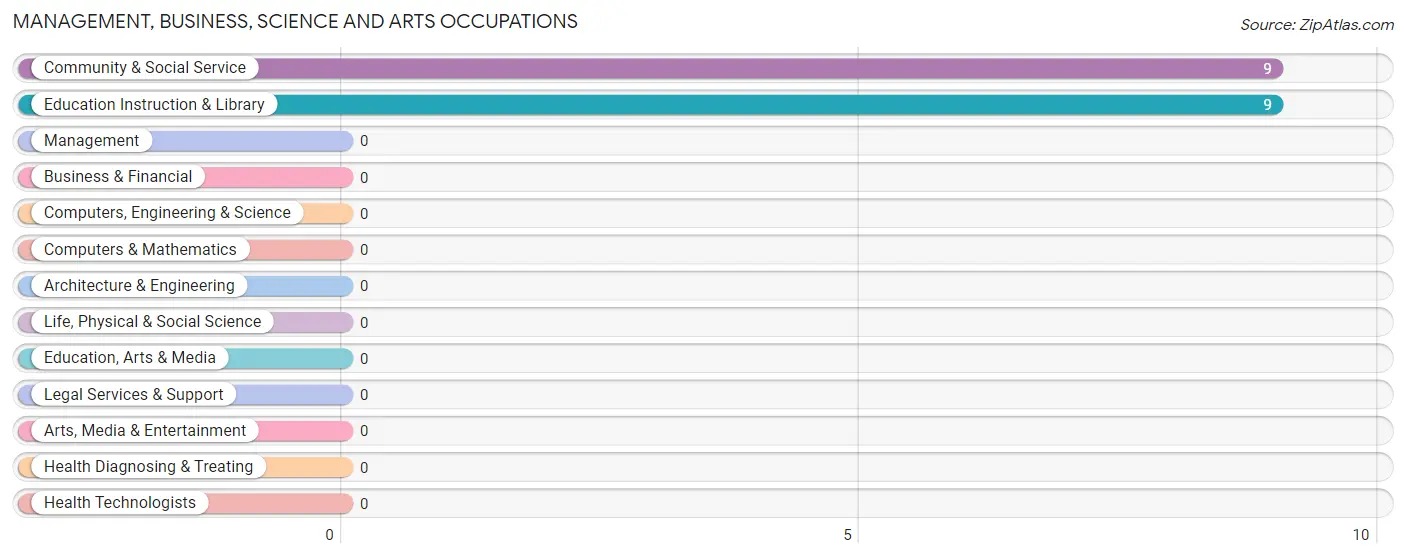
Management, Business, Science and Arts Occupations
The most common Management, Business, Science and Arts occupations in Pastoria are Community & Social Service (9 | 2.2%), and Education Instruction & Library (9 | 2.2%).
Management, Business, Science and Arts Occupations by Sex
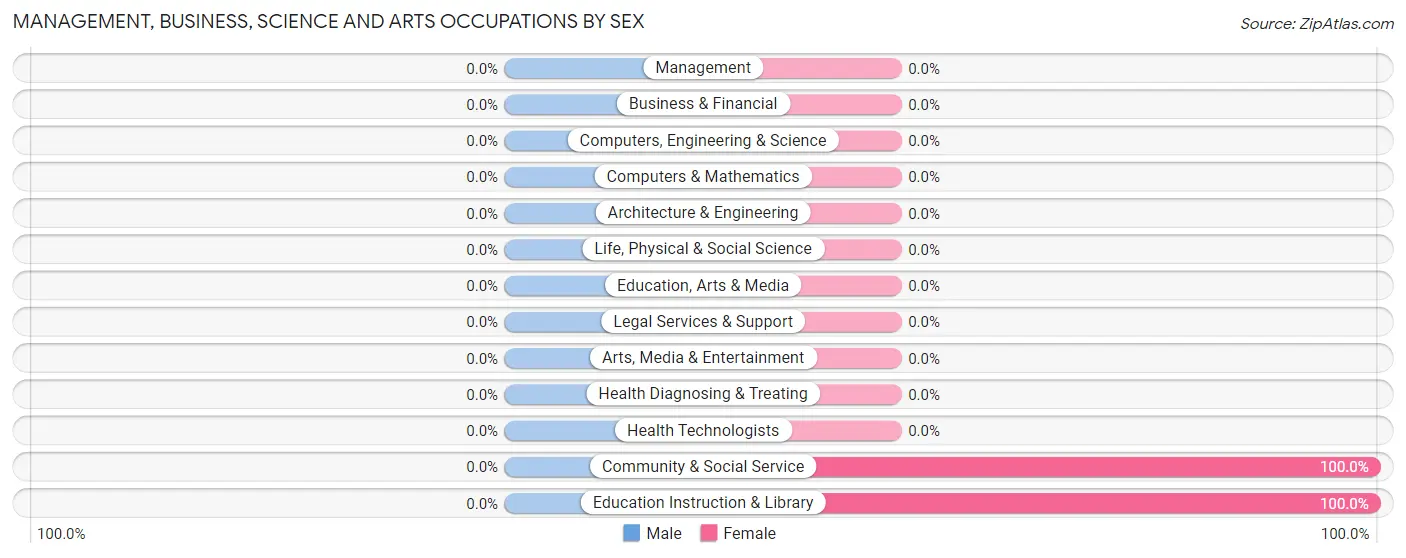
| Occupation | Male | Female |
| Management | 0 (0.0%) | 0 (0.0%) |
| Business & Financial | 0 (0.0%) | 0 (0.0%) |
| Computers, Engineering & Science | 0 (0.0%) | 0 (0.0%) |
| Computers & Mathematics | 0 (0.0%) | 0 (0.0%) |
| Architecture & Engineering | 0 (0.0%) | 0 (0.0%) |
| Life, Physical & Social Science | 0 (0.0%) | 0 (0.0%) |
| Community & Social Service | 0 (0.0%) | 9 (100.0%) |
| Education, Arts & Media | 0 (0.0%) | 0 (0.0%) |
| Legal Services & Support | 0 (0.0%) | 0 (0.0%) |
| Education Instruction & Library | 0 (0.0%) | 9 (100.0%) |
| Arts, Media & Entertainment | 0 (0.0%) | 0 (0.0%) |
| Health Diagnosing & Treating | 0 (0.0%) | 0 (0.0%) |
| Health Technologists | 0 (0.0%) | 0 (0.0%) |
| Total (Category) | 0 (0.0%) | 9 (100.0%) |
| Total (Overall) | 285 (70.4%) | 120 (29.6%) |
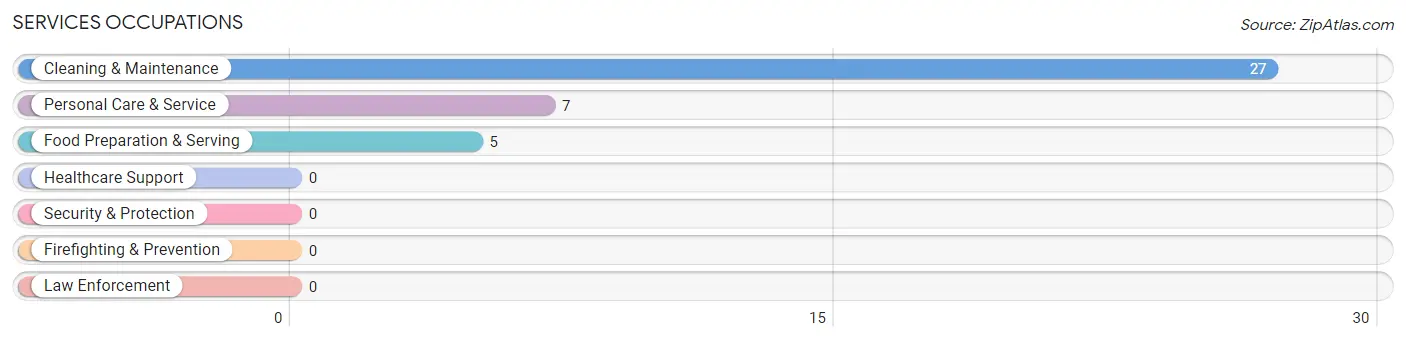
Services Occupations
The most common Services occupations in Pastoria are Cleaning & Maintenance (27 | 6.7%), Personal Care & Service (7 | 1.7%), and Food Preparation & Serving (5 | 1.2%).
Services Occupations by Sex
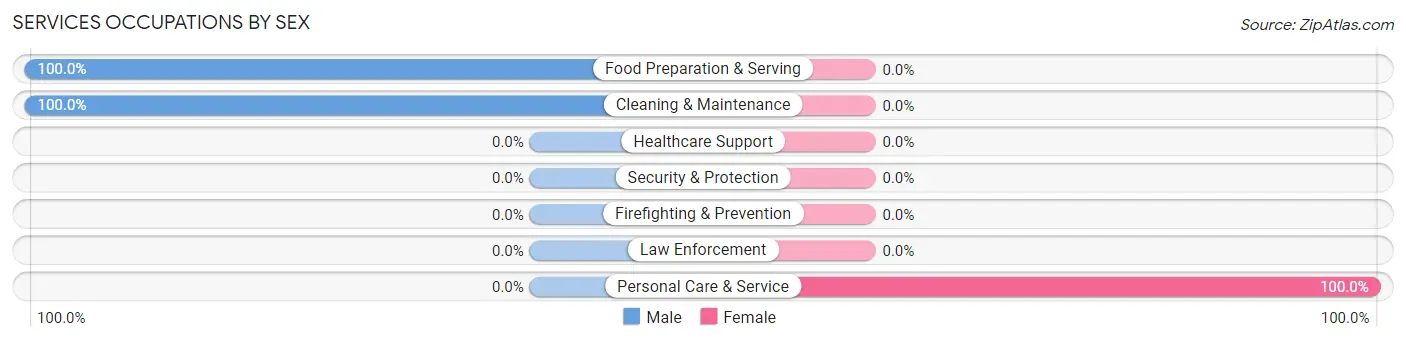
| Occupation | Male | Female |
| Healthcare Support | 0 (0.0%) | 0 (0.0%) |
| Security & Protection | 0 (0.0%) | 0 (0.0%) |
| Firefighting & Prevention | 0 (0.0%) | 0 (0.0%) |
| Law Enforcement | 0 (0.0%) | 0 (0.0%) |
| Food Preparation & Serving | 5 (100.0%) | 0 (0.0%) |
| Cleaning & Maintenance | 27 (100.0%) | 0 (0.0%) |
| Personal Care & Service | 0 (0.0%) | 7 (100.0%) |
| Total (Category) | 32 (82.1%) | 7 (17.9%) |
| Total (Overall) | 285 (70.4%) | 120 (29.6%) |
Sales and Office Occupations
The most common Sales and Office occupations in Pastoria are Office & Administration (48 | 11.8%), and Sales & Related (9 | 2.2%).

Sales and Office Occupations by Sex

| Occupation | Male | Female |
| Sales & Related | 0 (0.0%) | 9 (100.0%) |
| Office & Administration | 0 (0.0%) | 48 (100.0%) |
| Total (Category) | 0 (0.0%) | 57 (100.0%) |
| Total (Overall) | 285 (70.4%) | 120 (29.6%) |
Natural Resources, Construction and Maintenance Occupations
The most common Natural Resources, Construction and Maintenance occupations in Pastoria are Farming, Fishing & Forestry (114 | 28.1%), Construction & Extraction (31 | 7.6%), and Installation, Maintenance & Repair (16 | 4.0%).

Natural Resources, Construction and Maintenance Occupations by Sex
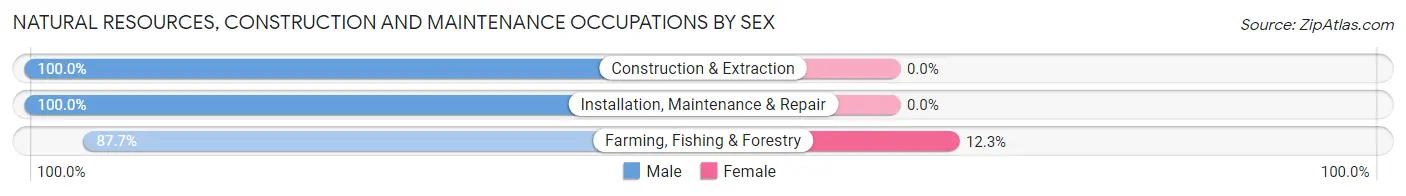
| Occupation | Male | Female |
| Farming, Fishing & Forestry | 100 (87.7%) | 14 (12.3%) |
| Construction & Extraction | 31 (100.0%) | 0 (0.0%) |
| Installation, Maintenance & Repair | 16 (100.0%) | 0 (0.0%) |
| Total (Category) | 147 (91.3%) | 14 (8.7%) |
| Total (Overall) | 285 (70.4%) | 120 (29.6%) |
Production, Transportation and Moving Occupations
The most common Production, Transportation and Moving occupations in Pastoria are Transportation (77 | 19.0%), and Production (62 | 15.3%).
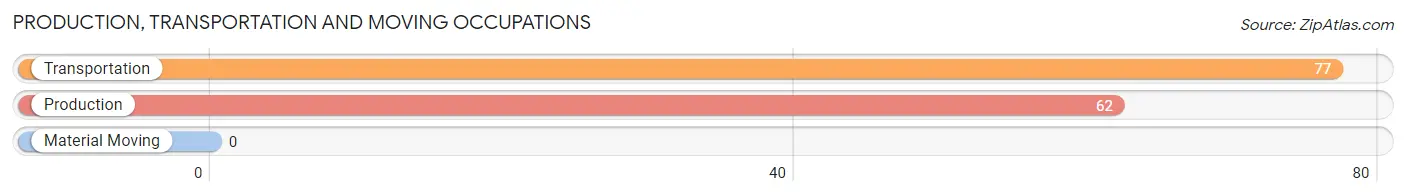
Production, Transportation and Moving Occupations by Sex
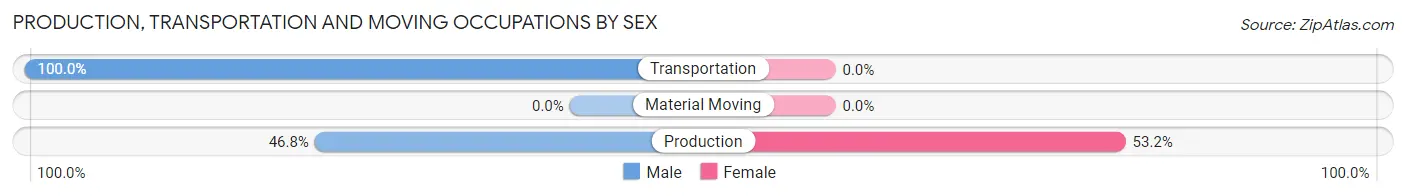
| Occupation | Male | Female |
| Production | 29 (46.8%) | 33 (53.2%) |
| Transportation | 77 (100.0%) | 0 (0.0%) |
| Material Moving | 0 (0.0%) | 0 (0.0%) |
| Total (Category) | 106 (76.3%) | 33 (23.7%) |
| Total (Overall) | 285 (70.4%) | 120 (29.6%) |
Employment Industries by Sex in Pastoria
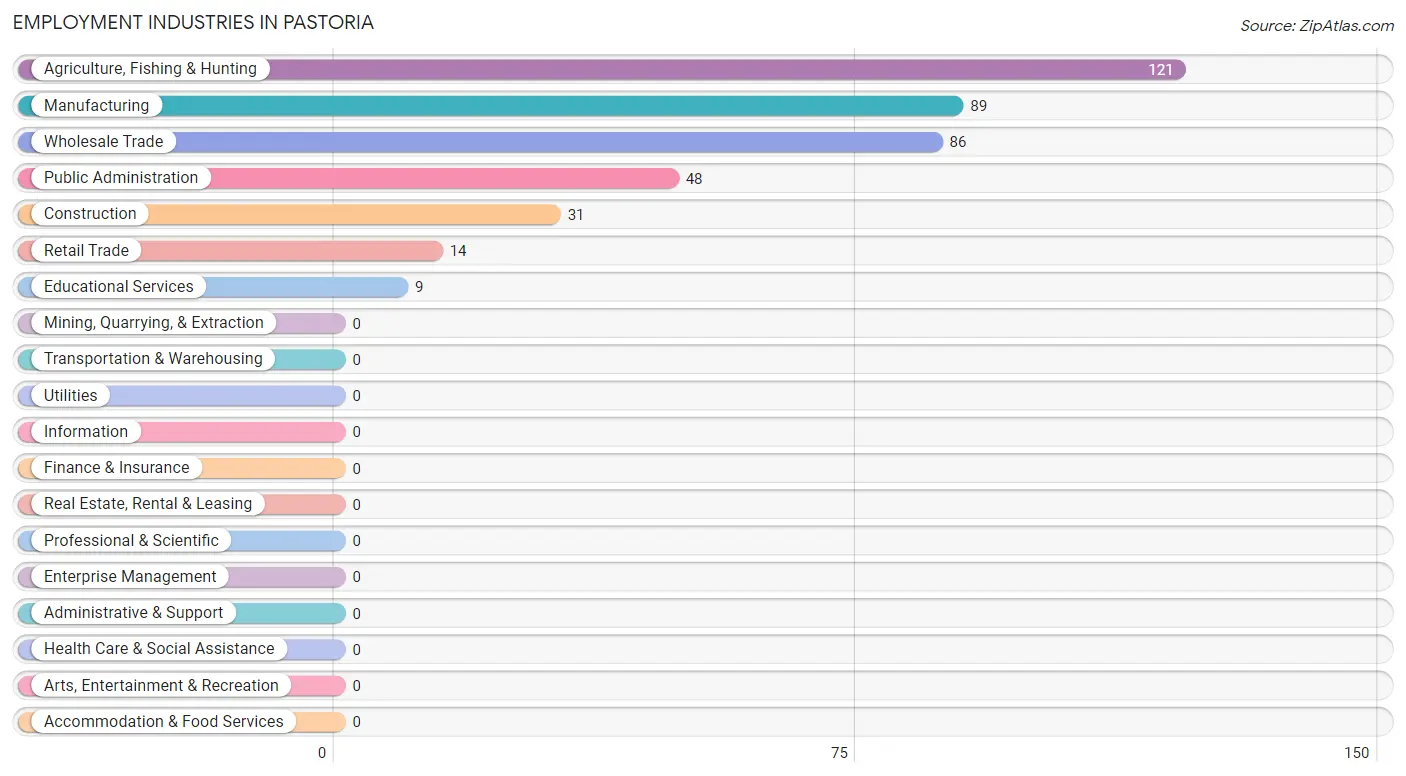
Employment Industries in Pastoria
The major employment industries in Pastoria include Agriculture, Fishing & Hunting (121 | 29.9%), Manufacturing (89 | 22.0%), Wholesale Trade (86 | 21.2%), Public Administration (48 | 11.8%), and Construction (31 | 7.6%).
Employment Industries by Sex in Pastoria
The Pastoria industries that see more men than women are Construction (100.0%), Wholesale Trade (100.0%), and Agriculture, Fishing & Hunting (88.4%), whereas the industries that tend to have a higher number of women are Educational Services (100.0%), Public Administration (100.0%), and Retail Trade (64.3%).
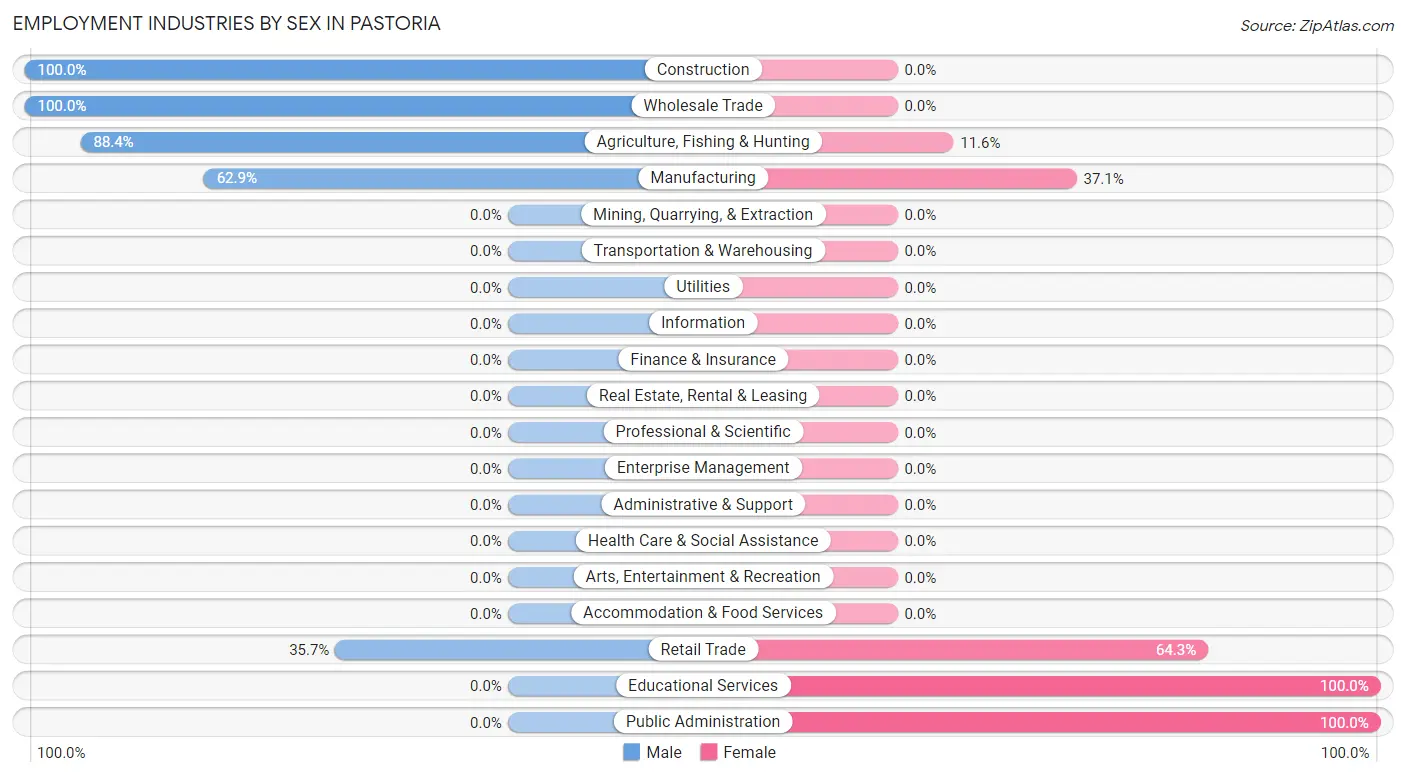
| Industry | Male | Female |
| Agriculture, Fishing & Hunting | 107 (88.4%) | 14 (11.6%) |
| Mining, Quarrying, & Extraction | 0 (0.0%) | 0 (0.0%) |
| Construction | 31 (100.0%) | 0 (0.0%) |
| Manufacturing | 56 (62.9%) | 33 (37.1%) |
| Wholesale Trade | 86 (100.0%) | 0 (0.0%) |
| Retail Trade | 5 (35.7%) | 9 (64.3%) |
| Transportation & Warehousing | 0 (0.0%) | 0 (0.0%) |
| Utilities | 0 (0.0%) | 0 (0.0%) |
| Information | 0 (0.0%) | 0 (0.0%) |
| Finance & Insurance | 0 (0.0%) | 0 (0.0%) |
| Real Estate, Rental & Leasing | 0 (0.0%) | 0 (0.0%) |
| Professional & Scientific | 0 (0.0%) | 0 (0.0%) |
| Enterprise Management | 0 (0.0%) | 0 (0.0%) |
| Administrative & Support | 0 (0.0%) | 0 (0.0%) |
| Educational Services | 0 (0.0%) | 9 (100.0%) |
| Health Care & Social Assistance | 0 (0.0%) | 0 (0.0%) |
| Arts, Entertainment & Recreation | 0 (0.0%) | 0 (0.0%) |
| Accommodation & Food Services | 0 (0.0%) | 0 (0.0%) |
| Public Administration | 0 (0.0%) | 48 (100.0%) |
| Total | 285 (70.4%) | 120 (29.6%) |
Education in Pastoria
School Enrollment in Pastoria
The most common levels of schooling among the 127 students in Pastoria are elementary school (58 | 45.7%), nursery / preschool (40 | 31.5%), and middle school (29 | 22.8%).
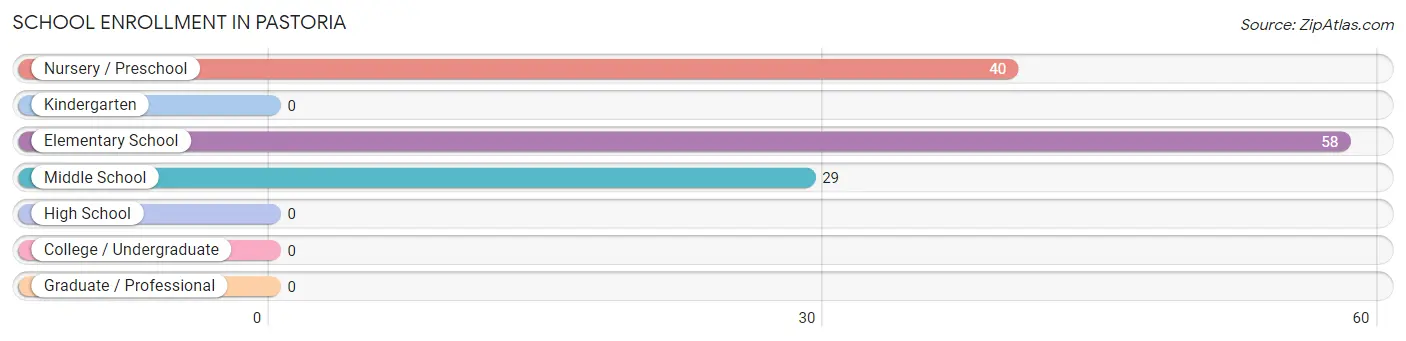
| School Level | # Students | % Students |
| Nursery / Preschool | 40 | 31.5% |
| Kindergarten | 0 | 0.0% |
| Elementary School | 58 | 45.7% |
| Middle School | 29 | 22.8% |
| High School | 0 | 0.0% |
| College / Undergraduate | 0 | 0.0% |
| Graduate / Professional | 0 | 0.0% |
| Total | 127 | 100.0% |
School Enrollment by Age by Funding Source in Pastoria
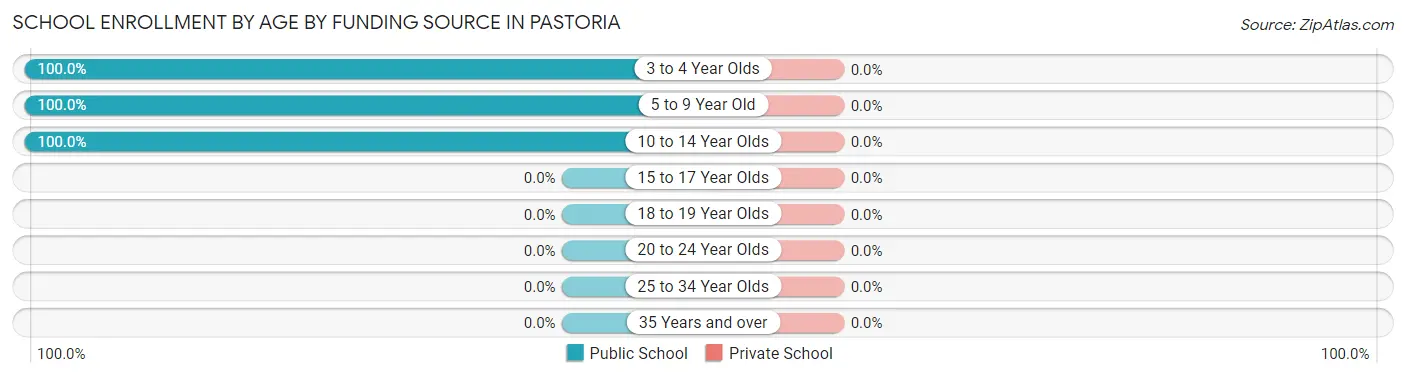
| Age Bracket | Public School | Private School |
| 3 to 4 Year Olds | 40 (100.0%) | 0 (0.0%) |
| 5 to 9 Year Old | 58 (100.0%) | 0 (0.0%) |
| 10 to 14 Year Olds | 29 (100.0%) | 0 (0.0%) |
| 15 to 17 Year Olds | 0 (0.0%) | 0 (0.0%) |
| 18 to 19 Year Olds | 0 (0.0%) | 0 (0.0%) |
| 20 to 24 Year Olds | 0 (0.0%) | 0 (0.0%) |
| 25 to 34 Year Olds | 0 (0.0%) | 0 (0.0%) |
| 35 Years and over | 0 (0.0%) | 0 (0.0%) |
| Total | 127 (100.0%) | 0 (0.0%) |
Educational Attainment by Field of Study in Pastoria
Bio, nature & agricultural (33 | 78.6%), and education (9 | 21.4%) are the most common fields of study among 42 individuals in Pastoria who have obtained a bachelor's degree or higher.
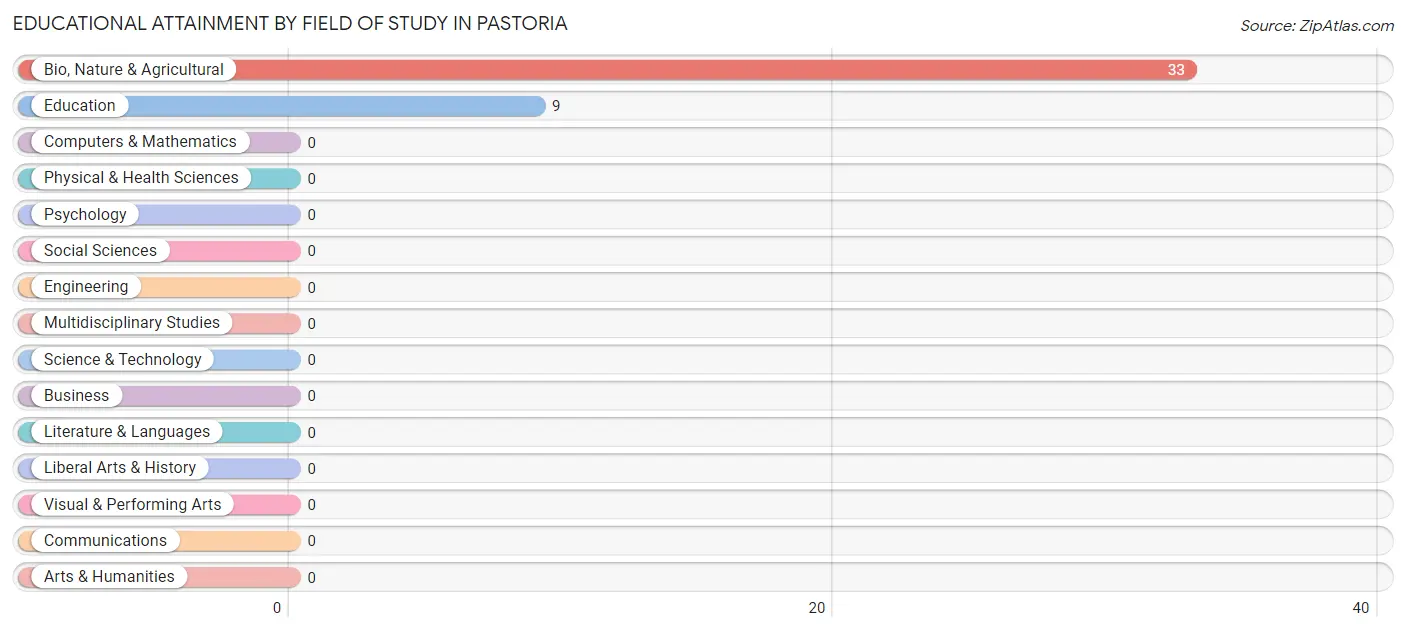
| Field of Study | # Graduates | % Graduates |
| Computers & Mathematics | 0 | 0.0% |
| Bio, Nature & Agricultural | 33 | 78.6% |
| Physical & Health Sciences | 0 | 0.0% |
| Psychology | 0 | 0.0% |
| Social Sciences | 0 | 0.0% |
| Engineering | 0 | 0.0% |
| Multidisciplinary Studies | 0 | 0.0% |
| Science & Technology | 0 | 0.0% |
| Business | 0 | 0.0% |
| Education | 9 | 21.4% |
| Literature & Languages | 0 | 0.0% |
| Liberal Arts & History | 0 | 0.0% |
| Visual & Performing Arts | 0 | 0.0% |
| Communications | 0 | 0.0% |
| Arts & Humanities | 0 | 0.0% |
| Total | 42 | 100.0% |
Transportation & Commute in Pastoria
Vehicle Availability by Sex in Pastoria
The most prevalent vehicle ownership categories in Pastoria are males with 3 vehicles (97, accounting for 34.0%) and females with 3 vehicles (0, making up 80.8%).
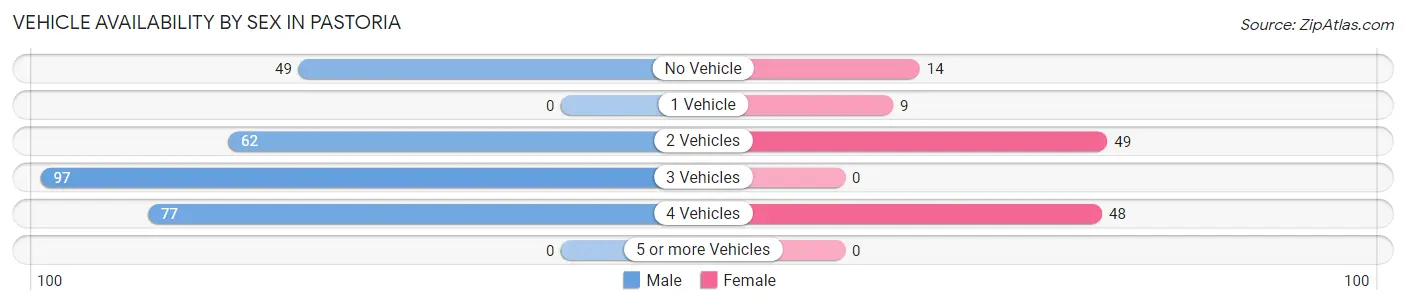
| Vehicles Available | Male | Female |
| No Vehicle | 49 (17.2%) | 14 (11.7%) |
| 1 Vehicle | 0 (0.0%) | 9 (7.5%) |
| 2 Vehicles | 62 (21.7%) | 49 (40.8%) |
| 3 Vehicles | 97 (34.0%) | 0 (0.0%) |
| 4 Vehicles | 77 (27.0%) | 48 (40.0%) |
| 5 or more Vehicles | 0 (0.0%) | 0 (0.0%) |
| Total | 285 (100.0%) | 120 (100.0%) |
Commute Time in Pastoria
The most frequently occuring commute durations in Pastoria are 35 to 39 minutes (147 commuters, 36.3%), 10 to 14 minutes (92 commuters, 22.7%), and 5 to 9 minutes (38 commuters, 9.4%).
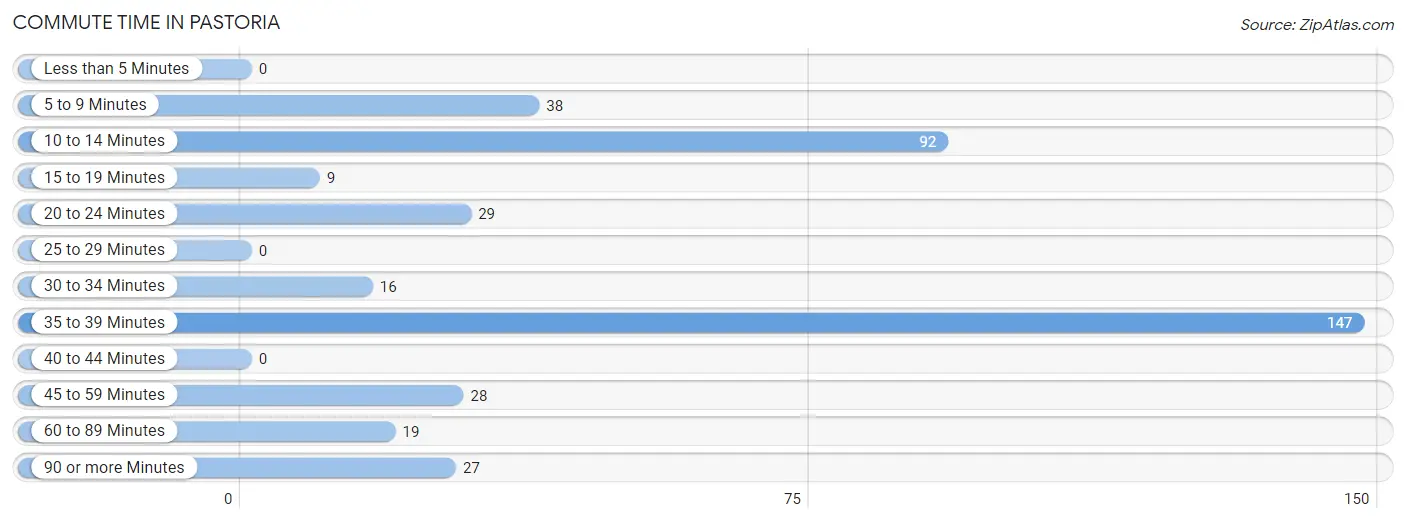
| Commute Time | # Commuters | % Commuters |
| Less than 5 Minutes | 0 | 0.0% |
| 5 to 9 Minutes | 38 | 9.4% |
| 10 to 14 Minutes | 92 | 22.7% |
| 15 to 19 Minutes | 9 | 2.2% |
| 20 to 24 Minutes | 29 | 7.2% |
| 25 to 29 Minutes | 0 | 0.0% |
| 30 to 34 Minutes | 16 | 4.0% |
| 35 to 39 Minutes | 147 | 36.3% |
| 40 to 44 Minutes | 0 | 0.0% |
| 45 to 59 Minutes | 28 | 6.9% |
| 60 to 89 Minutes | 19 | 4.7% |
| 90 or more Minutes | 27 | 6.7% |
Commute Time by Sex in Pastoria
The most common commute times in Pastoria are 35 to 39 minutes (147 commuters, 51.6%) for males and 10 to 14 minutes (62 commuters, 51.7%) for females.
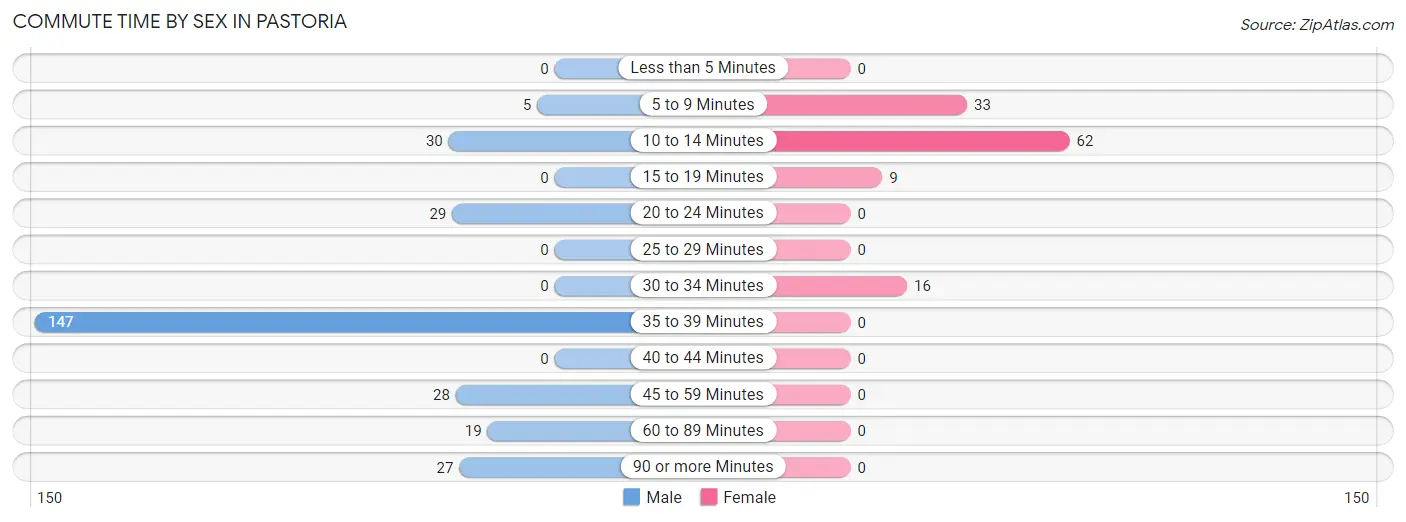
| Commute Time | Male | Female |
| Less than 5 Minutes | 0 (0.0%) | 0 (0.0%) |
| 5 to 9 Minutes | 5 (1.8%) | 33 (27.5%) |
| 10 to 14 Minutes | 30 (10.5%) | 62 (51.7%) |
| 15 to 19 Minutes | 0 (0.0%) | 9 (7.5%) |
| 20 to 24 Minutes | 29 (10.2%) | 0 (0.0%) |
| 25 to 29 Minutes | 0 (0.0%) | 0 (0.0%) |
| 30 to 34 Minutes | 0 (0.0%) | 16 (13.3%) |
| 35 to 39 Minutes | 147 (51.6%) | 0 (0.0%) |
| 40 to 44 Minutes | 0 (0.0%) | 0 (0.0%) |
| 45 to 59 Minutes | 28 (9.8%) | 0 (0.0%) |
| 60 to 89 Minutes | 19 (6.7%) | 0 (0.0%) |
| 90 or more Minutes | 27 (9.5%) | 0 (0.0%) |
Time of Departure to Work by Sex in Pastoria
The most frequent times of departure to work in Pastoria are 12:00 AM to 4:59 AM (77, 27.0%) for males and 8:00 AM to 8:29 AM (48, 40.0%) for females.
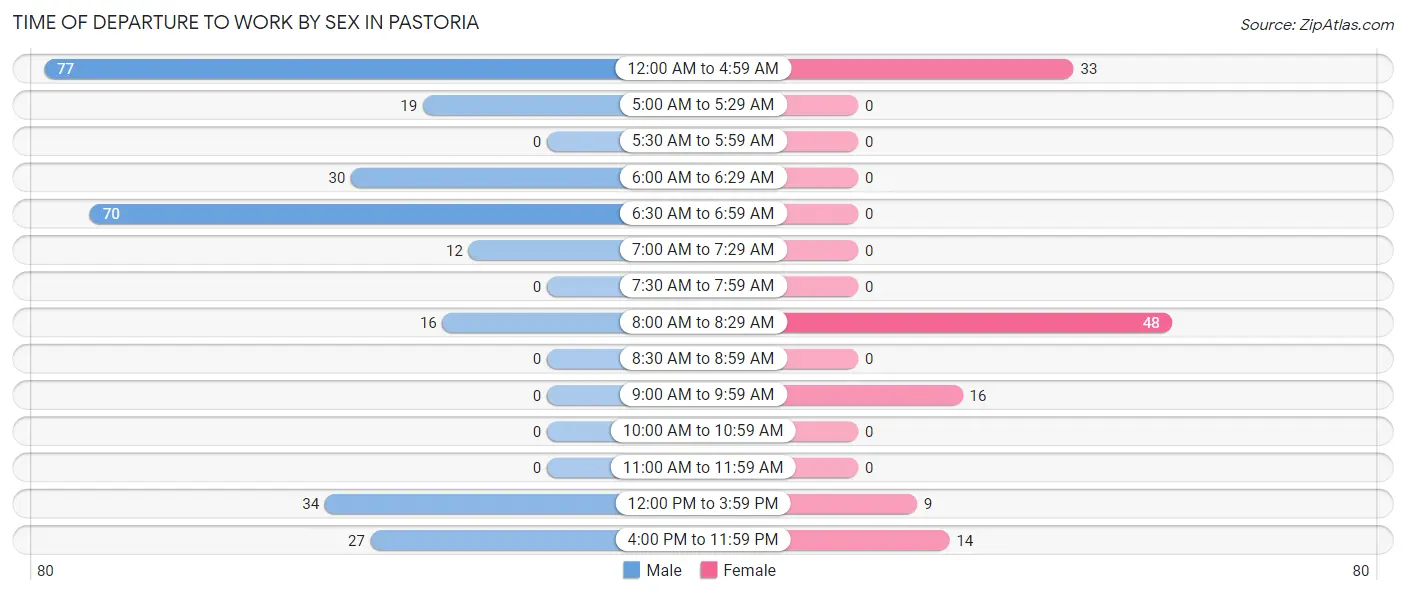
| Time of Departure | Male | Female |
| 12:00 AM to 4:59 AM | 77 (27.0%) | 33 (27.5%) |
| 5:00 AM to 5:29 AM | 19 (6.7%) | 0 (0.0%) |
| 5:30 AM to 5:59 AM | 0 (0.0%) | 0 (0.0%) |
| 6:00 AM to 6:29 AM | 30 (10.5%) | 0 (0.0%) |
| 6:30 AM to 6:59 AM | 70 (24.6%) | 0 (0.0%) |
| 7:00 AM to 7:29 AM | 12 (4.2%) | 0 (0.0%) |
| 7:30 AM to 7:59 AM | 0 (0.0%) | 0 (0.0%) |
| 8:00 AM to 8:29 AM | 16 (5.6%) | 48 (40.0%) |
| 8:30 AM to 8:59 AM | 0 (0.0%) | 0 (0.0%) |
| 9:00 AM to 9:59 AM | 0 (0.0%) | 16 (13.3%) |
| 10:00 AM to 10:59 AM | 0 (0.0%) | 0 (0.0%) |
| 11:00 AM to 11:59 AM | 0 (0.0%) | 0 (0.0%) |
| 12:00 PM to 3:59 PM | 34 (11.9%) | 9 (7.5%) |
| 4:00 PM to 11:59 PM | 27 (9.5%) | 14 (11.7%) |
| Total | 285 (100.0%) | 120 (100.0%) |
Housing Occupancy in Pastoria
Occupancy by Ownership in Pastoria
Of the total 339 dwellings in Pastoria, owner-occupied units account for 234 (69.0%), while renter-occupied units make up 105 (31.0%).
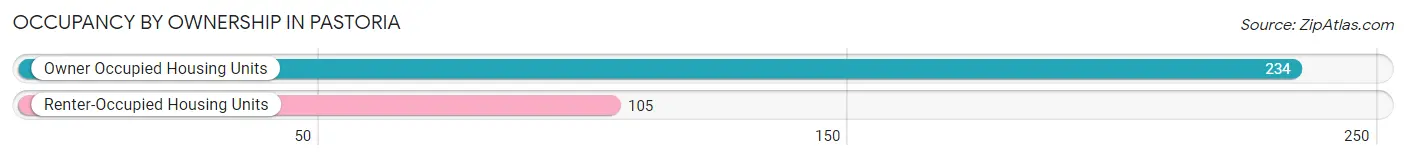
| Occupancy | # Housing Units | % Housing Units |
| Owner Occupied Housing Units | 234 | 69.0% |
| Renter-Occupied Housing Units | 105 | 31.0% |
| Total Occupied Housing Units | 339 | 100.0% |
Occupancy by Household Size in Pastoria
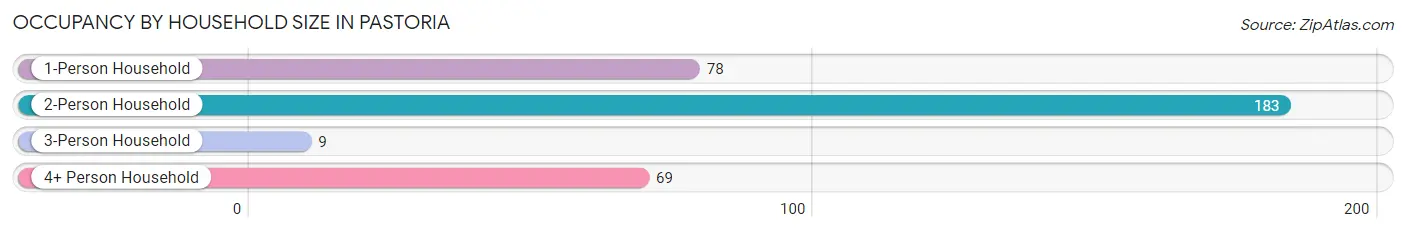
| Household Size | # Housing Units | % Housing Units |
| 1-Person Household | 78 | 23.0% |
| 2-Person Household | 183 | 54.0% |
| 3-Person Household | 9 | 2.6% |
| 4+ Person Household | 69 | 20.3% |
| Total Housing Units | 339 | 100.0% |
Occupancy by Ownership by Household Size in Pastoria
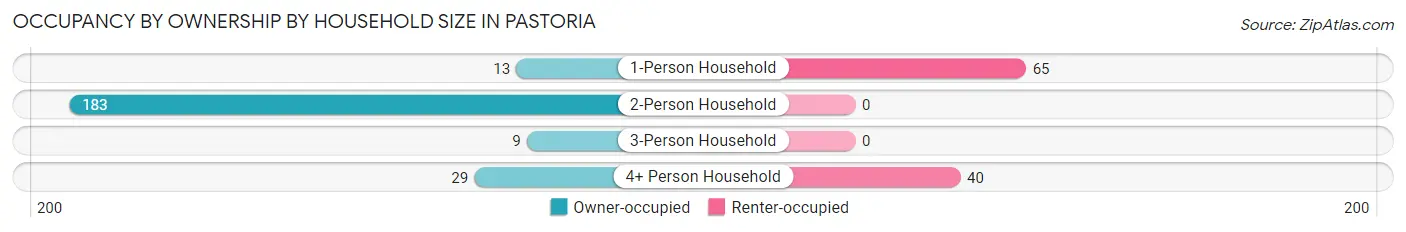
| Household Size | Owner-occupied | Renter-occupied |
| 1-Person Household | 13 (16.7%) | 65 (83.3%) |
| 2-Person Household | 183 (100.0%) | 0 (0.0%) |
| 3-Person Household | 9 (100.0%) | 0 (0.0%) |
| 4+ Person Household | 29 (42.0%) | 40 (58.0%) |
| Total Housing Units | 234 (69.0%) | 105 (31.0%) |
Occupancy by Educational Attainment in Pastoria
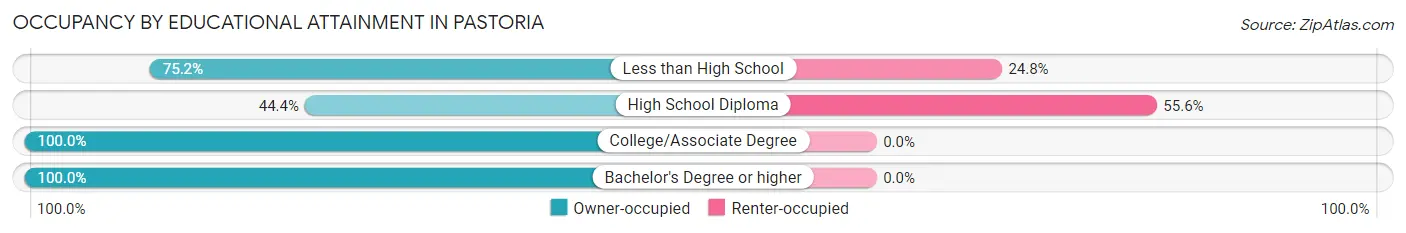
| Household Size | Owner-occupied | Renter-occupied |
| Less than High School | 121 (75.2%) | 40 (24.8%) |
| High School Diploma | 52 (44.4%) | 65 (55.6%) |
| College/Associate Degree | 52 (100.0%) | 0 (0.0%) |
| Bachelor's Degree or higher | 9 (100.0%) | 0 (0.0%) |
Occupancy by Age of Householder in Pastoria
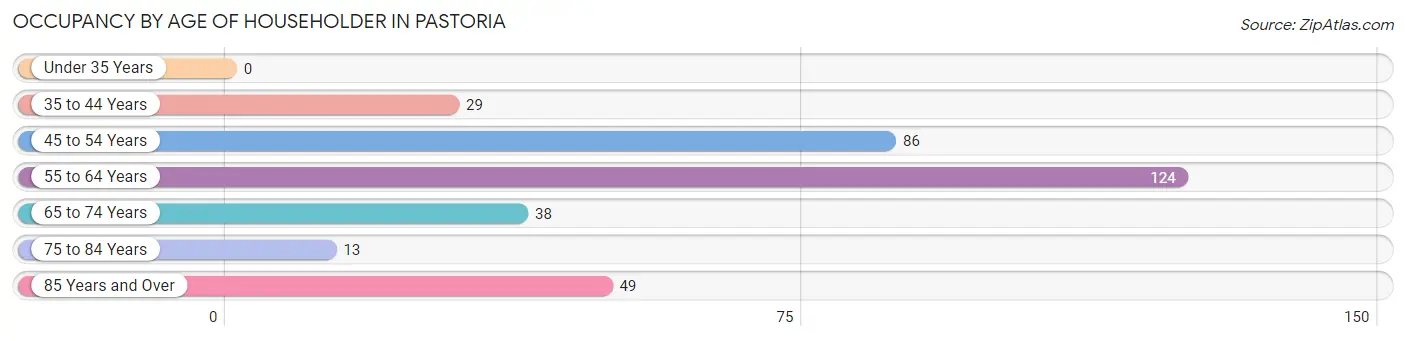
| Age Bracket | # Households | % Households |
| Under 35 Years | 0 | 0.0% |
| 35 to 44 Years | 29 | 8.6% |
| 45 to 54 Years | 86 | 25.4% |
| 55 to 64 Years | 124 | 36.6% |
| 65 to 74 Years | 38 | 11.2% |
| 75 to 84 Years | 13 | 3.8% |
| 85 Years and Over | 49 | 14.4% |
| Total | 339 | 100.0% |
Housing Finances in Pastoria
Median Income by Occupancy in Pastoria
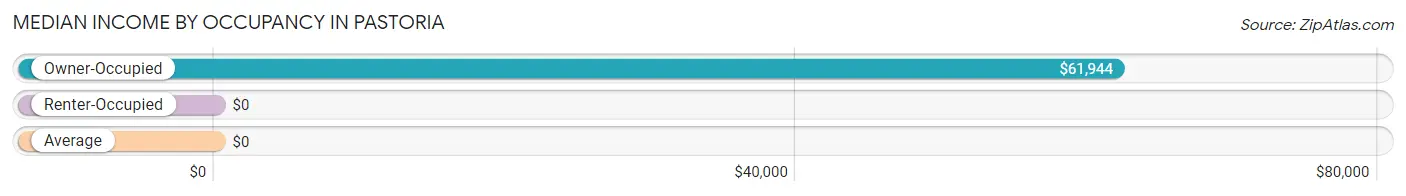
| Occupancy Type | # Households | Median Income |
| Owner-Occupied | 234 (69.0%) | $61,944 |
| Renter-Occupied | 105 (31.0%) | $0 |
| Average | 339 (100.0%) | $0 |
Occupancy by Householder Income Bracket in Pastoria
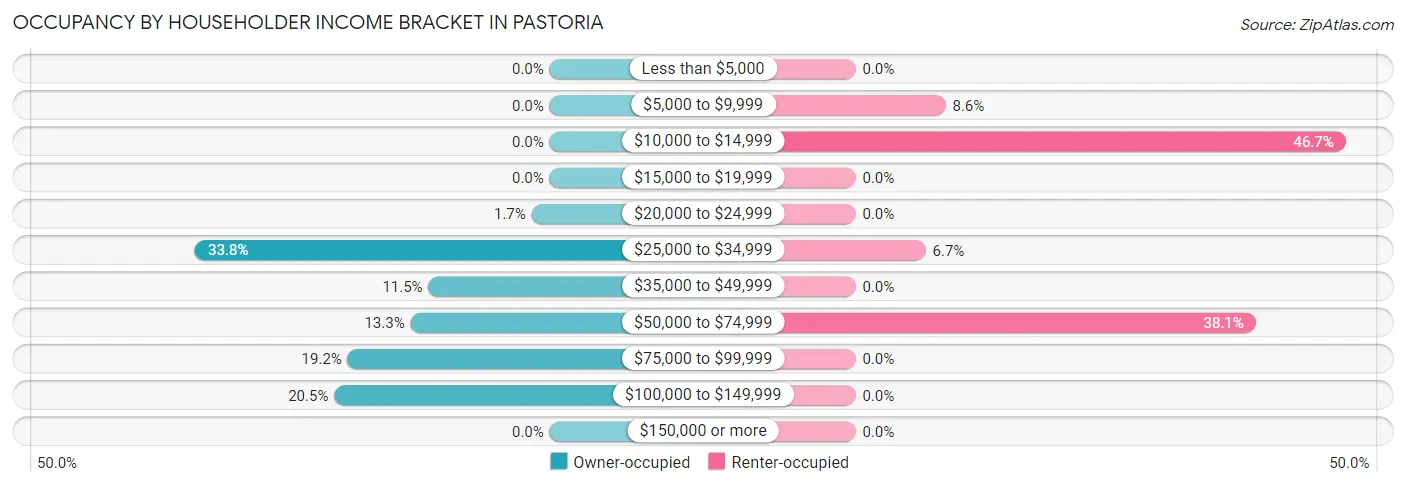
| Income Bracket | Owner-occupied | Renter-occupied |
| Less than $5,000 | 0 (0.0%) | 0 (0.0%) |
| $5,000 to $9,999 | 0 (0.0%) | 9 (8.6%) |
| $10,000 to $14,999 | 0 (0.0%) | 49 (46.7%) |
| $15,000 to $19,999 | 0 (0.0%) | 0 (0.0%) |
| $20,000 to $24,999 | 4 (1.7%) | 0 (0.0%) |
| $25,000 to $34,999 | 79 (33.8%) | 7 (6.7%) |
| $35,000 to $49,999 | 27 (11.5%) | 0 (0.0%) |
| $50,000 to $74,999 | 31 (13.3%) | 40 (38.1%) |
| $75,000 to $99,999 | 45 (19.2%) | 0 (0.0%) |
| $100,000 to $149,999 | 48 (20.5%) | 0 (0.0%) |
| $150,000 or more | 0 (0.0%) | 0 (0.0%) |
| Total | 234 (100.0%) | 105 (100.0%) |
Monthly Housing Cost Tiers in Pastoria
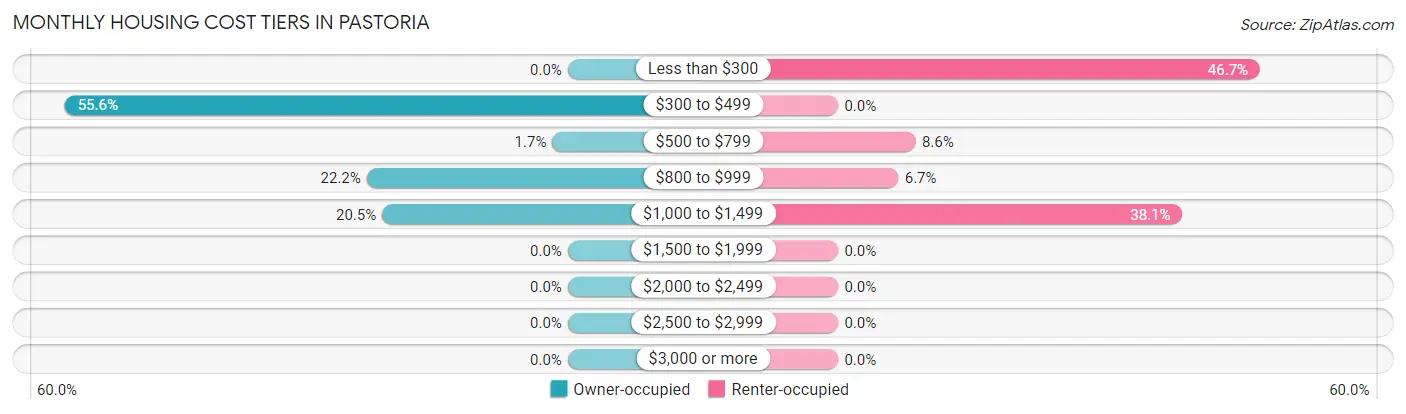
| Monthly Cost | Owner-occupied | Renter-occupied |
| Less than $300 | 0 (0.0%) | 49 (46.7%) |
| $300 to $499 | 130 (55.6%) | 0 (0.0%) |
| $500 to $799 | 4 (1.7%) | 9 (8.6%) |
| $800 to $999 | 52 (22.2%) | 7 (6.7%) |
| $1,000 to $1,499 | 48 (20.5%) | 40 (38.1%) |
| $1,500 to $1,999 | 0 (0.0%) | 0 (0.0%) |
| $2,000 to $2,499 | 0 (0.0%) | 0 (0.0%) |
| $2,500 to $2,999 | 0 (0.0%) | 0 (0.0%) |
| $3,000 or more | 0 (0.0%) | 0 (0.0%) |
| Total | 234 (100.0%) | 105 (100.0%) |
Physical Housing Characteristics in Pastoria
Housing Structures in Pastoria
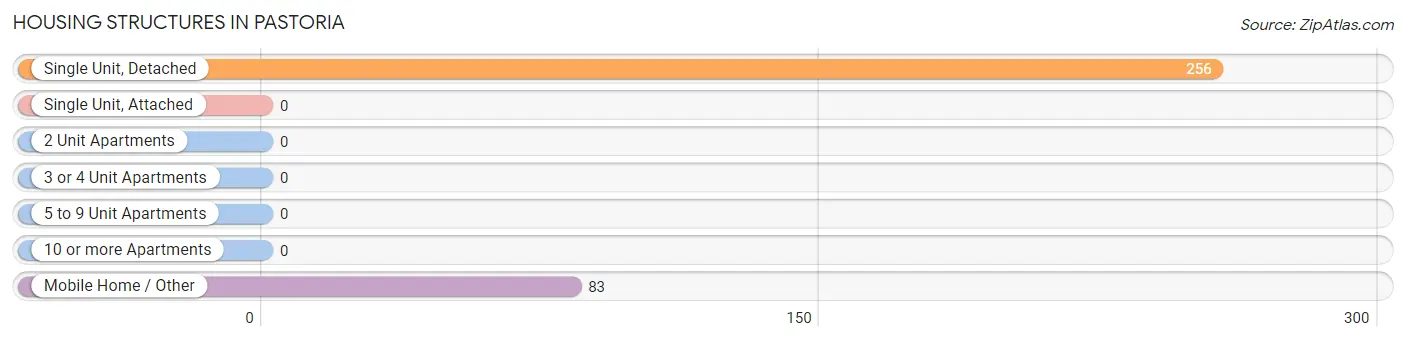
| Structure Type | # Housing Units | % Housing Units |
| Single Unit, Detached | 256 | 75.5% |
| Single Unit, Attached | 0 | 0.0% |
| 2 Unit Apartments | 0 | 0.0% |
| 3 or 4 Unit Apartments | 0 | 0.0% |
| 5 to 9 Unit Apartments | 0 | 0.0% |
| 10 or more Apartments | 0 | 0.0% |
| Mobile Home / Other | 83 | 24.5% |
| Total | 339 | 100.0% |
Housing Structures by Occupancy in Pastoria
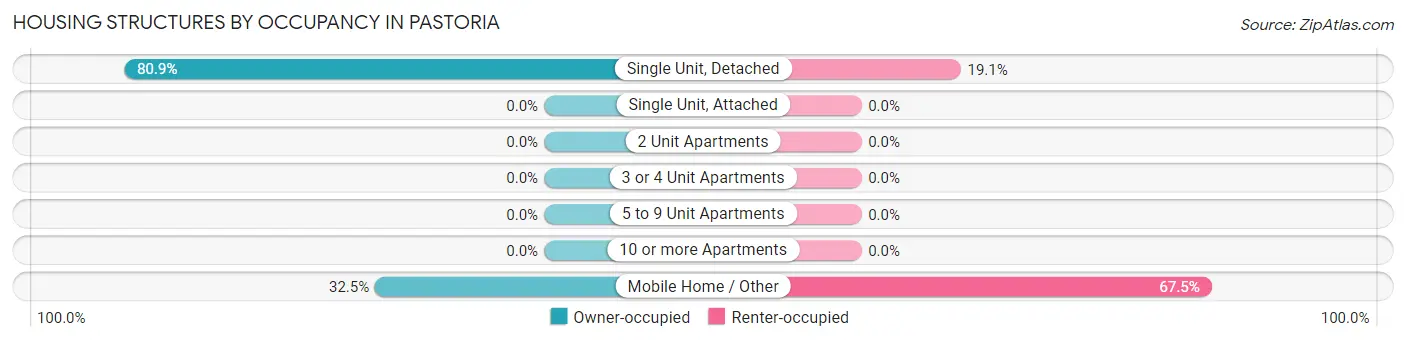
| Structure Type | Owner-occupied | Renter-occupied |
| Single Unit, Detached | 207 (80.9%) | 49 (19.1%) |
| Single Unit, Attached | 0 (0.0%) | 0 (0.0%) |
| 2 Unit Apartments | 0 (0.0%) | 0 (0.0%) |
| 3 or 4 Unit Apartments | 0 (0.0%) | 0 (0.0%) |
| 5 to 9 Unit Apartments | 0 (0.0%) | 0 (0.0%) |
| 10 or more Apartments | 0 (0.0%) | 0 (0.0%) |
| Mobile Home / Other | 27 (32.5%) | 56 (67.5%) |
| Total | 234 (69.0%) | 105 (31.0%) |
Housing Structures by Number of Rooms in Pastoria
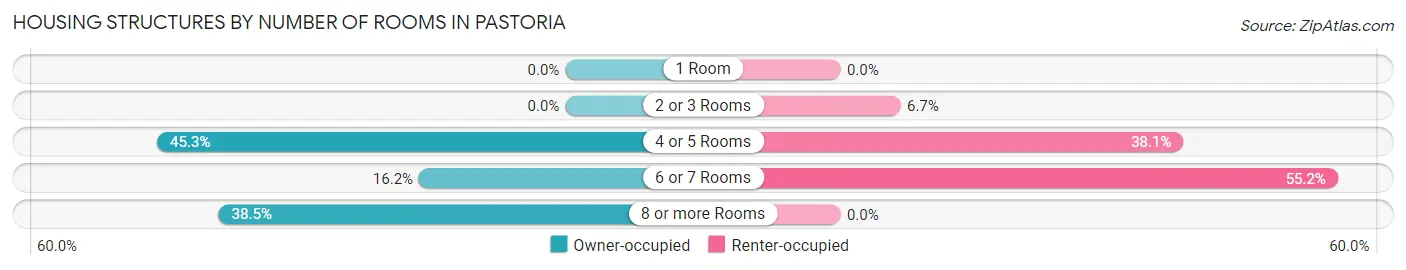
| Number of Rooms | Owner-occupied | Renter-occupied |
| 1 Room | 0 (0.0%) | 0 (0.0%) |
| 2 or 3 Rooms | 0 (0.0%) | 7 (6.7%) |
| 4 or 5 Rooms | 106 (45.3%) | 40 (38.1%) |
| 6 or 7 Rooms | 38 (16.2%) | 58 (55.2%) |
| 8 or more Rooms | 90 (38.5%) | 0 (0.0%) |
| Total | 234 (100.0%) | 105 (100.0%) |
Housing Structure by Heating Type in Pastoria

| Heating Type | Owner-occupied | Renter-occupied |
| Utility Gas | 0 (0.0%) | 0 (0.0%) |
| Bottled, Tank, or LP Gas | 62 (26.5%) | 0 (0.0%) |
| Electricity | 163 (69.7%) | 105 (100.0%) |
| Fuel Oil or Kerosene | 9 (3.8%) | 0 (0.0%) |
| Coal or Coke | 0 (0.0%) | 0 (0.0%) |
| All other Fuels | 0 (0.0%) | 0 (0.0%) |
| No Fuel Used | 0 (0.0%) | 0 (0.0%) |
| Total | 234 (100.0%) | 105 (100.0%) |
Household Vehicle Usage in Pastoria
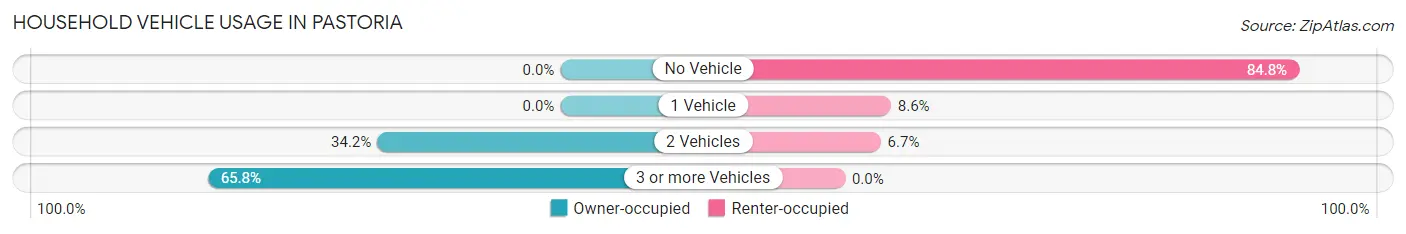
| Vehicles per Household | Owner-occupied | Renter-occupied |
| No Vehicle | 0 (0.0%) | 89 (84.8%) |
| 1 Vehicle | 0 (0.0%) | 9 (8.6%) |
| 2 Vehicles | 80 (34.2%) | 7 (6.7%) |
| 3 or more Vehicles | 154 (65.8%) | 0 (0.0%) |
| Total | 234 (100.0%) | 105 (100.0%) |
Real Estate & Mortgages in Pastoria
Real Estate and Mortgage Overview in Pastoria
| Characteristic | Without Mortgage | With Mortgage |
| Housing Units | 121 | 113 |
| Median Property Value | $98,600 | $0 |
| Median Household Income | - | - |
| Monthly Housing Costs | $452 | $0 |
| Real Estate Taxes | $573 | $0 |
Property Value by Mortgage Status in Pastoria
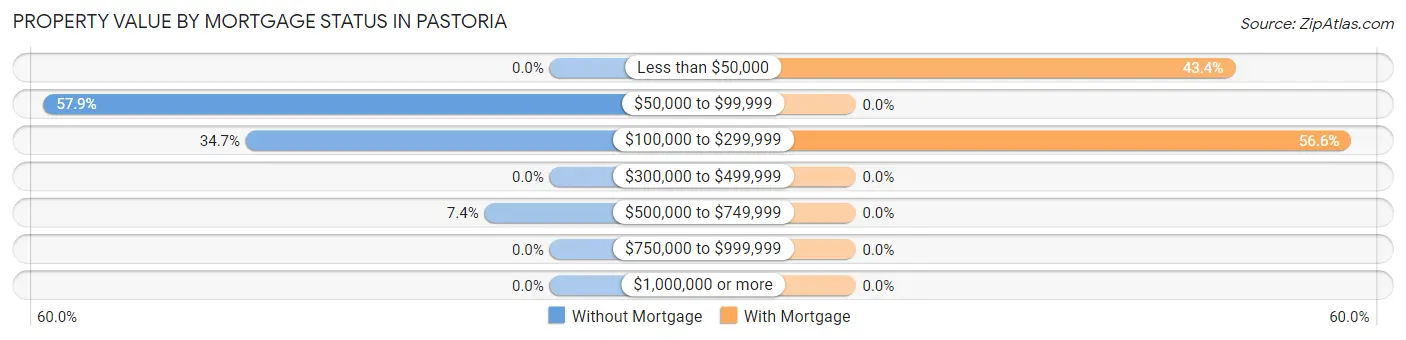
| Property Value | Without Mortgage | With Mortgage |
| Less than $50,000 | 0 (0.0%) | 49 (43.4%) |
| $50,000 to $99,999 | 70 (57.9%) | 0 (0.0%) |
| $100,000 to $299,999 | 42 (34.7%) | 64 (56.6%) |
| $300,000 to $499,999 | 0 (0.0%) | 0 (0.0%) |
| $500,000 to $749,999 | 9 (7.4%) | 0 (0.0%) |
| $750,000 to $999,999 | 0 (0.0%) | 0 (0.0%) |
| $1,000,000 or more | 0 (0.0%) | 0 (0.0%) |
| Total | 121 (100.0%) | 113 (100.0%) |
Household Income by Mortgage Status in Pastoria
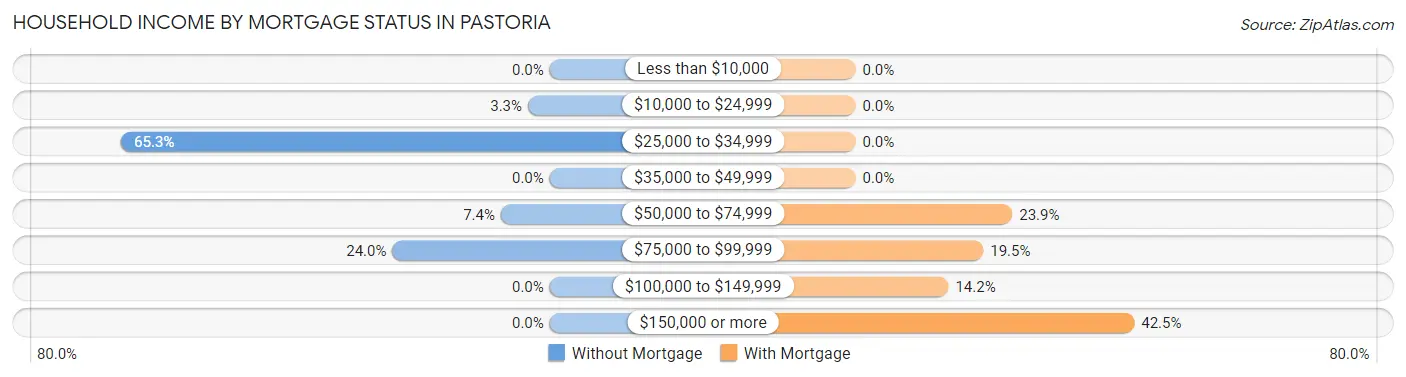
| Household Income | Without Mortgage | With Mortgage |
| Less than $10,000 | 0 (0.0%) | 0 (0.0%) |
| $10,000 to $24,999 | 4 (3.3%) | 0 (0.0%) |
| $25,000 to $34,999 | 79 (65.3%) | 0 (0.0%) |
| $35,000 to $49,999 | 0 (0.0%) | 0 (0.0%) |
| $50,000 to $74,999 | 9 (7.4%) | 27 (23.9%) |
| $75,000 to $99,999 | 29 (24.0%) | 22 (19.5%) |
| $100,000 to $149,999 | 0 (0.0%) | 16 (14.2%) |
| $150,000 or more | 0 (0.0%) | 48 (42.5%) |
| Total | 121 (100.0%) | 113 (100.0%) |
Property Value to Household Income Ratio in Pastoria
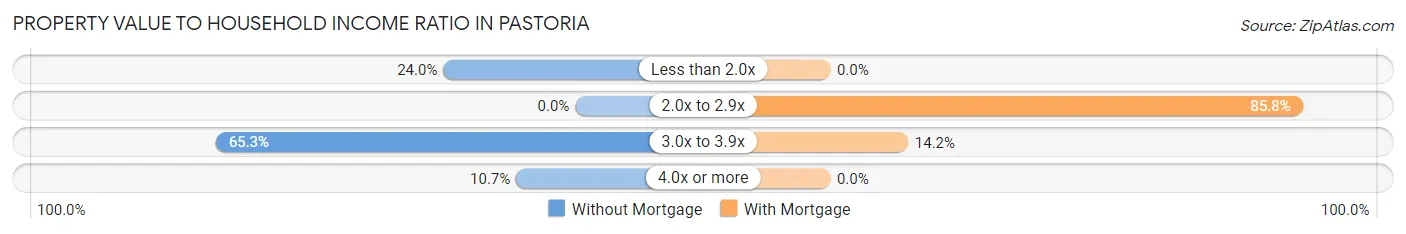
| Value-to-Income Ratio | Without Mortgage | With Mortgage |
| Less than 2.0x | 29 (24.0%) | 0 (0.0%) |
| 2.0x to 2.9x | 0 (0.0%) | 97 (85.8%) |
| 3.0x to 3.9x | 79 (65.3%) | 16 (14.2%) |
| 4.0x or more | 13 (10.7%) | 0 (0.0%) |
| Total | 121 (100.0%) | 113 (100.0%) |
Real Estate Taxes by Mortgage Status in Pastoria
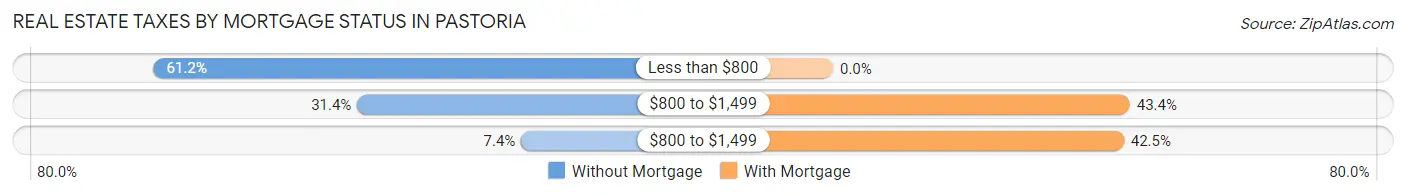
| Property Taxes | Without Mortgage | With Mortgage |
| Less than $800 | 74 (61.2%) | 0 (0.0%) |
| $800 to $1,499 | 38 (31.4%) | 49 (43.4%) |
| $800 to $1,499 | 9 (7.4%) | 48 (42.5%) |
| Total | 121 (100.0%) | 113 (100.0%) |
Health & Disability in Pastoria
Health Insurance Coverage by Age in Pastoria
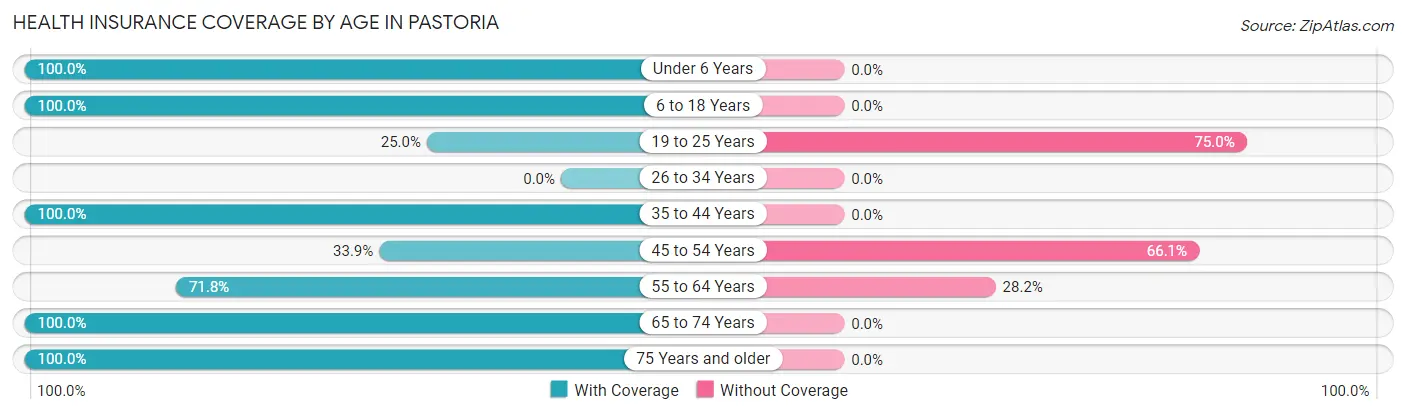
| Age Bracket | With Coverage | Without Coverage |
| Under 6 Years | 40 (100.0%) | 0 (0.0%) |
| 6 to 18 Years | 87 (100.0%) | 0 (0.0%) |
| 19 to 25 Years | 11 (25.0%) | 33 (75.0%) |
| 26 to 34 Years | 0 (0.0%) | 0 (0.0%) |
| 35 to 44 Years | 62 (100.0%) | 0 (0.0%) |
| 45 to 54 Years | 61 (33.9%) | 119 (66.1%) |
| 55 to 64 Years | 178 (71.8%) | 70 (28.2%) |
| 65 to 74 Years | 38 (100.0%) | 0 (0.0%) |
| 75 Years and older | 62 (100.0%) | 0 (0.0%) |
| Total | 539 (70.8%) | 222 (29.2%) |
Health Insurance Coverage by Citizenship Status in Pastoria

| Citizenship Status | With Coverage | Without Coverage |
| Native Born | 40 (100.0%) | 0 (0.0%) |
| Foreign Born, Citizen | 87 (100.0%) | 0 (0.0%) |
| Foreign Born, not a Citizen | 11 (25.0%) | 33 (75.0%) |
Health Insurance Coverage by Household Income in Pastoria
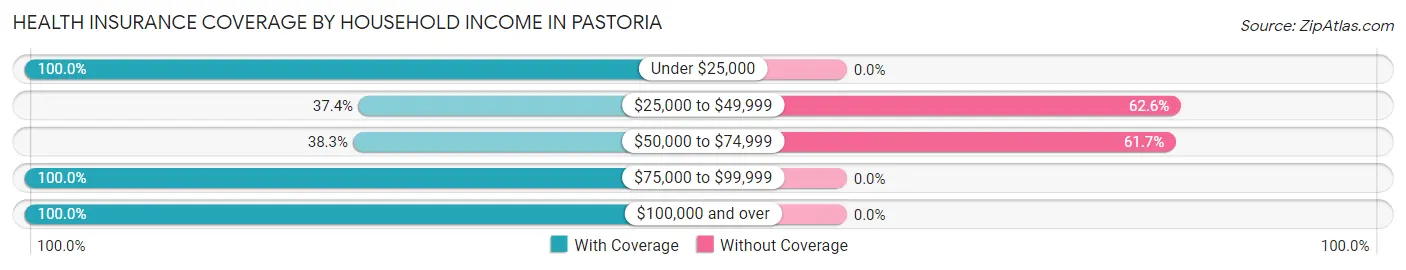
| Household Income | With Coverage | Without Coverage |
| Under $25,000 | 62 (100.0%) | 0 (0.0%) |
| $25,000 to $49,999 | 71 (37.4%) | 119 (62.6%) |
| $50,000 to $74,999 | 64 (38.3%) | 103 (61.7%) |
| $75,000 to $99,999 | 217 (100.0%) | 0 (0.0%) |
| $100,000 and over | 125 (100.0%) | 0 (0.0%) |
Public vs Private Health Insurance Coverage by Age in Pastoria
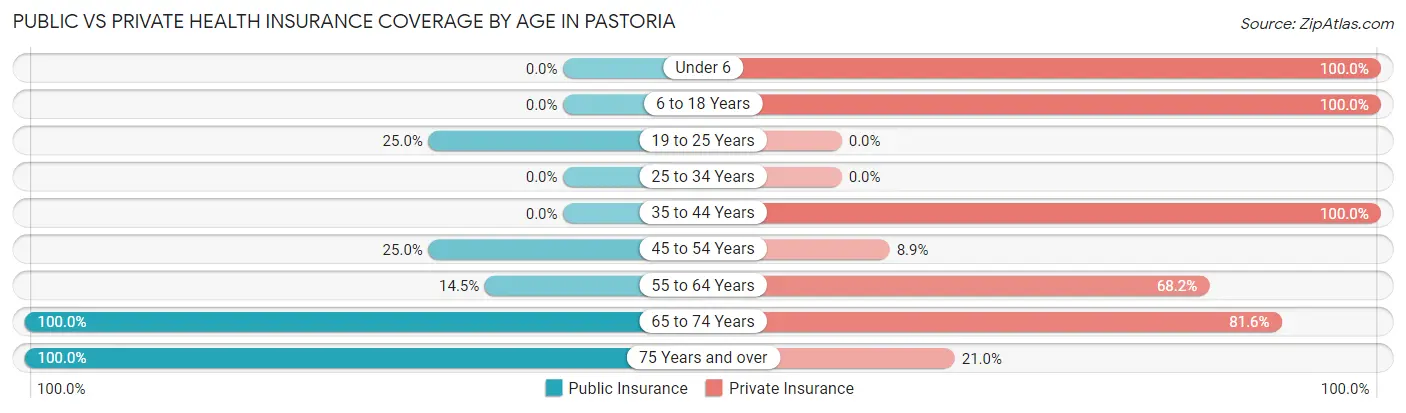
| Age Bracket | Public Insurance | Private Insurance |
| Under 6 | 0 (0.0%) | 40 (100.0%) |
| 6 to 18 Years | 0 (0.0%) | 87 (100.0%) |
| 19 to 25 Years | 11 (25.0%) | 0 (0.0%) |
| 25 to 34 Years | 0 (0.0%) | 0 (0.0%) |
| 35 to 44 Years | 0 (0.0%) | 62 (100.0%) |
| 45 to 54 Years | 45 (25.0%) | 16 (8.9%) |
| 55 to 64 Years | 36 (14.5%) | 169 (68.1%) |
| 65 to 74 Years | 38 (100.0%) | 31 (81.6%) |
| 75 Years and over | 62 (100.0%) | 13 (21.0%) |
| Total | 192 (25.2%) | 418 (54.9%) |
Disability Status by Sex by Age in Pastoria
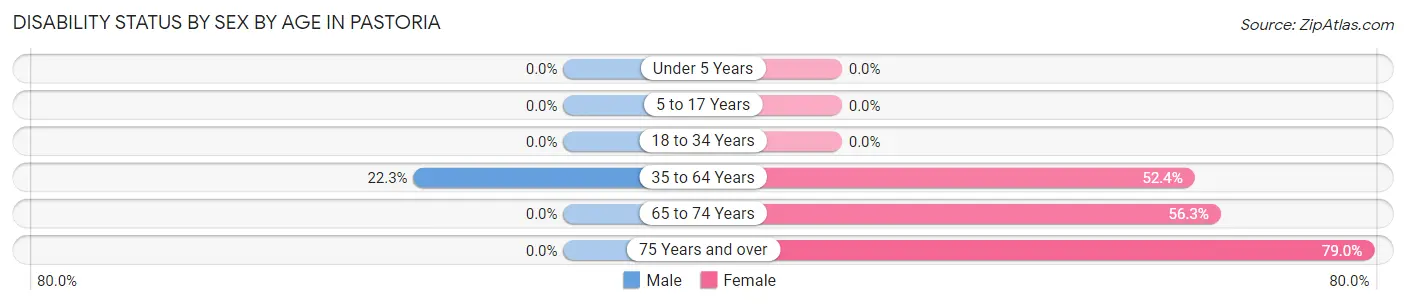
| Age Bracket | Male | Female |
| Under 5 Years | 0 (0.0%) | 0 (0.0%) |
| 5 to 17 Years | 0 (0.0%) | 0 (0.0%) |
| 18 to 34 Years | 0 (0.0%) | 0 (0.0%) |
| 35 to 64 Years | 67 (22.3%) | 99 (52.4%) |
| 65 to 74 Years | 0 (0.0%) | 9 (56.2%) |
| 75 Years and over | 0 (0.0%) | 49 (79.0%) |
Disability Class by Sex by Age in Pastoria
Disability Class: Hearing Difficulty
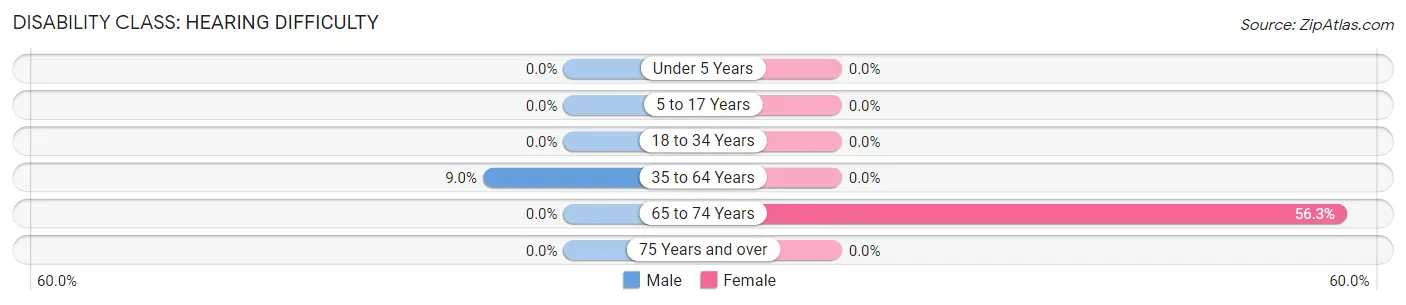
| Age Bracket | Male | Female |
| Under 5 Years | 0 (0.0%) | 0 (0.0%) |
| 5 to 17 Years | 0 (0.0%) | 0 (0.0%) |
| 18 to 34 Years | 0 (0.0%) | 0 (0.0%) |
| 35 to 64 Years | 27 (9.0%) | 0 (0.0%) |
| 65 to 74 Years | 0 (0.0%) | 9 (56.2%) |
| 75 Years and over | 0 (0.0%) | 0 (0.0%) |
Disability Class: Vision Difficulty
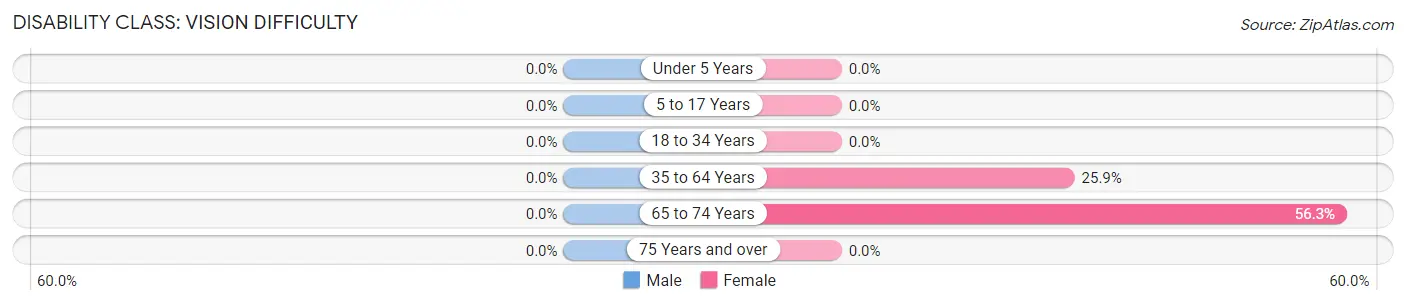
| Age Bracket | Male | Female |
| Under 5 Years | 0 (0.0%) | 0 (0.0%) |
| 5 to 17 Years | 0 (0.0%) | 0 (0.0%) |
| 18 to 34 Years | 0 (0.0%) | 0 (0.0%) |
| 35 to 64 Years | 0 (0.0%) | 49 (25.9%) |
| 65 to 74 Years | 0 (0.0%) | 9 (56.2%) |
| 75 Years and over | 0 (0.0%) | 0 (0.0%) |
Disability Class: Cognitive Difficulty
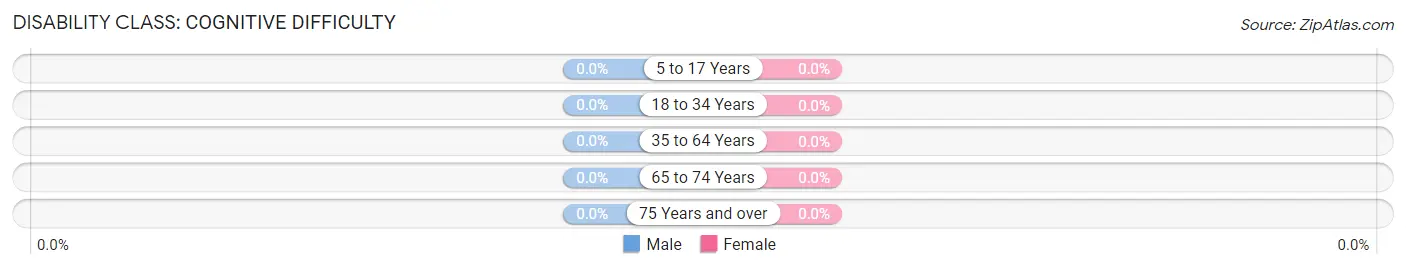
| Age Bracket | Male | Female |
| 5 to 17 Years | 0 (0.0%) | 0 (0.0%) |
| 18 to 34 Years | 0 (0.0%) | 0 (0.0%) |
| 35 to 64 Years | 0 (0.0%) | 0 (0.0%) |
| 65 to 74 Years | 0 (0.0%) | 0 (0.0%) |
| 75 Years and over | 0 (0.0%) | 0 (0.0%) |
Disability Class: Ambulatory Difficulty
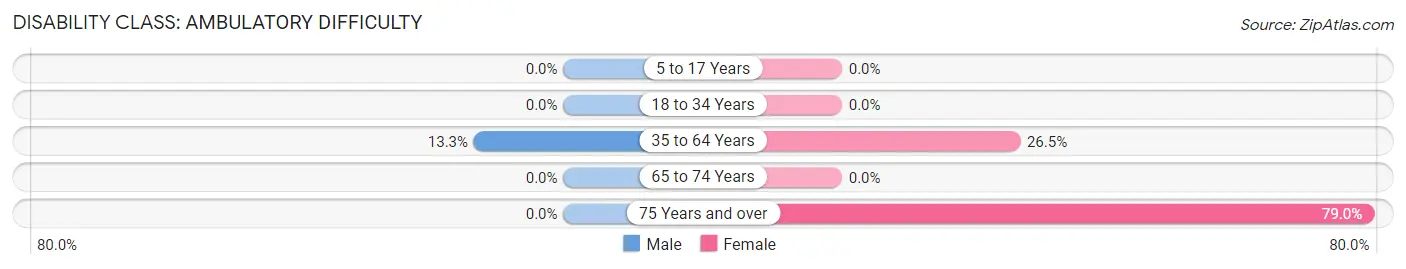
| Age Bracket | Male | Female |
| 5 to 17 Years | 0 (0.0%) | 0 (0.0%) |
| 18 to 34 Years | 0 (0.0%) | 0 (0.0%) |
| 35 to 64 Years | 40 (13.3%) | 50 (26.5%) |
| 65 to 74 Years | 0 (0.0%) | 0 (0.0%) |
| 75 Years and over | 0 (0.0%) | 49 (79.0%) |
Disability Class: Self-Care Difficulty
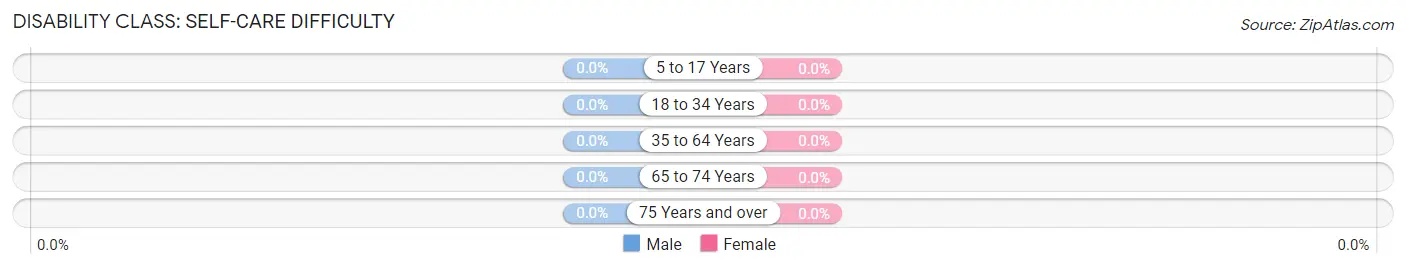
| Age Bracket | Male | Female |
| 5 to 17 Years | 0 (0.0%) | 0 (0.0%) |
| 18 to 34 Years | 0 (0.0%) | 0 (0.0%) |
| 35 to 64 Years | 0 (0.0%) | 0 (0.0%) |
| 65 to 74 Years | 0 (0.0%) | 0 (0.0%) |
| 75 Years and over | 0 (0.0%) | 0 (0.0%) |
Technology Access in Pastoria
Computing Device Access in Pastoria
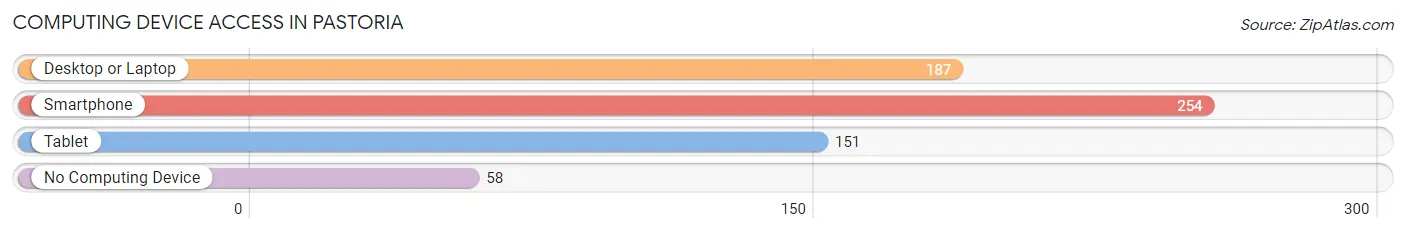
| Device Type | # Households | % Households |
| Desktop or Laptop | 187 | 55.2% |
| Smartphone | 254 | 74.9% |
| Tablet | 151 | 44.5% |
| No Computing Device | 58 | 17.1% |
| Total | 339 | 100.0% |
Internet Access in Pastoria
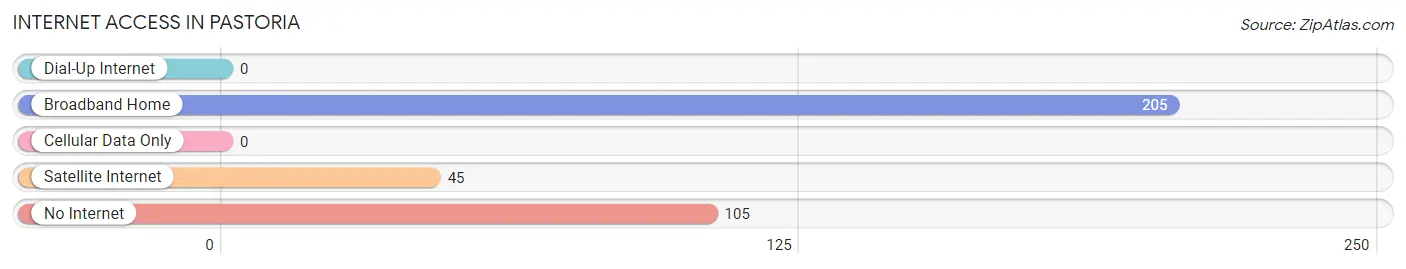
| Internet Type | # Households | % Households |
| Dial-Up Internet | 0 | 0.0% |
| Broadband Home | 205 | 60.5% |
| Cellular Data Only | 0 | 0.0% |
| Satellite Internet | 45 | 13.3% |
| No Internet | 105 | 31.0% |
| Total | 339 | 100.0% |
Pastoria Summary
Pastoria is a small town located in the state of Virginia, in the United States of America. It is situated in the northern part of the state, in the Shenandoah Valley region. The town is located in the county of Page, and is part of the Shenandoah Valley Regional Airport. The town has a population of approximately 1,000 people, and is a rural community.
History
Pastoria was founded in 1820 by a group of settlers from the Shenandoah Valley. The town was named after the nearby Pastoria Creek, which was named after a local Native American tribe. The town was originally a farming community, and the settlers grew corn, wheat, and other crops. The town was also known for its apple orchards, which were a major source of income for the town.
In the late 19th century, the town began to grow and develop. The railroad was built through the town, and the town became a stop on the line. This allowed the town to become a hub for trade and commerce. The town also became a popular tourist destination, as it was close to the Shenandoah National Park.
In the early 20th century, the town began to decline. The railroad was abandoned, and the town's economy suffered. The town was also hit hard by the Great Depression, and many of the town's businesses closed. In the 1950s, the town began to revive, and the economy began to improve.
Geography
Pastoria is located in the northern part of the state of Virginia, in the Shenandoah Valley region. The town is situated in the county of Page, and is part of the Shenandoah Valley Regional Airport. The town is located at an elevation of 1,000 feet above sea level. The town is surrounded by rolling hills and mountains, and is located near the Shenandoah National Park.
The climate in Pastoria is temperate, with hot summers and cold winters. The average temperature in the summer is around 80 degrees Fahrenheit, and the average temperature in the winter is around 40 degrees Fahrenheit. The town receives an average of 40 inches of rain per year.
Economy
The economy of Pastoria is largely based on agriculture and tourism. The town is home to several apple orchards, and the apples are a major source of income for the town. The town is also home to several wineries, and the wine industry is a major contributor to the local economy.
The town is also a popular tourist destination, as it is close to the Shenandoah National Park. The town is home to several bed and breakfasts, and the town is a popular destination for outdoor activities such as hiking, camping, and fishing.
Demographics
As of the 2010 census, the population of Pastoria was 1,000 people. The town is predominantly white, with a population that is 97.7% white. The town also has a small African American population, which makes up 1.2% of the population. The town also has a small Hispanic population, which makes up 0.7% of the population. The median household income in the town is $45,000, and the median home value is $150,000.
Common Questions
What is Per Capita Income in Pastoria?
Per Capita income in Pastoria is $27,674.
What is the Median Family Income in Pastoria?
Median Family Income in Pastoria is $71,875.
What is Income or Wage Gap in Pastoria?
Income or Wage Gap in Pastoria is 39.1%.
Women in Pastoria earn 60.9 cents for every dollar earned by a man.
What is Inequality or Gini Index in Pastoria?
Inequality or Gini Index in Pastoria is 0.38.
What is the Total Population of Pastoria?
Total Population of Pastoria is 761.
What is the Total Male Population of Pastoria?
Total Male Population of Pastoria is 440.
What is the Total Female Population of Pastoria?
Total Female Population of Pastoria is 321.
What is the Ratio of Males per 100 Females in Pastoria?
There are 137.07 Males per 100 Females in Pastoria.
What is the Ratio of Females per 100 Males in Pastoria?
There are 72.95 Females per 100 Males in Pastoria.
What is the Median Population Age in Pastoria?
Median Population Age in Pastoria is 54.3 Years.
What is the Average Family Size in Pastoria
Average Family Size in Pastoria is 2.7 People.
What is the Average Household Size in Pastoria
Average Household Size in Pastoria is 2.2 People.
How Large is the Labor Force in Pastoria?
There are 405 People in the Labor Forcein in Pastoria.
What is the Percentage of People in the Labor Force in Pastoria?
63.9% of People are in the Labor Force in Pastoria.