Bensley, VA Map & Demographics
Bensley Map
Bensley Overview
$23,542
PER CAPITA INCOME
$44,405
AVG FAMILY INCOME
$44,026
AVG HOUSEHOLD INCOME
14.8%
WAGE / INCOME GAP [ % ]
85.2¢/ $1
WAGE / INCOME GAP [ $ ]
0.42
INEQUALITY / GINI INDEX
6,032
TOTAL POPULATION
2,808
MALE POPULATION
3,224
FEMALE POPULATION
87.10
MALES / 100 FEMALES
114.81
FEMALES / 100 MALES
31.0
MEDIAN AGE
3.1
AVG FAMILY SIZE
2.7
AVG HOUSEHOLD SIZE
3,240
LABOR FORCE [ PEOPLE ]
67.0%
PERCENT IN LABOR FORCE
8.5%
UNEMPLOYMENT RATE
Income in Bensley
Income Overview in Bensley
Per Capita Income in Bensley is $23,542, while median incomes of families and households are $44,405 and $44,026 respectively.
| Characteristic | Number | Measure |
| Per Capita Income | 6,032 | $23,542 |
| Median Family Income | 1,478 | $44,405 |
| Mean Family Income | 1,478 | $65,541 |
| Median Household Income | 2,250 | $44,026 |
| Mean Household Income | 2,250 | $60,972 |
| Income Deficit | 1,478 | $0 |
| Wage / Income Gap (%) | 6,032 | 14.79% |
| Wage / Income Gap ($) | 6,032 | 85.21¢ per $1 |
| Gini / Inequality Index | 6,032 | 0.42 |
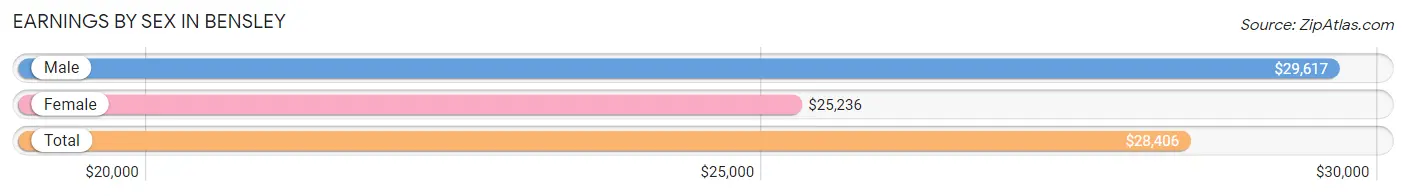
Earnings by Sex in Bensley
Average Earnings in Bensley are $28,406, $29,617 for men and $25,236 for women, a difference of 14.8%.
| Sex | Number | Average Earnings |
| Male | 1,871 (58.2%) | $29,617 |
| Female | 1,342 (41.8%) | $25,236 |
| Total | 3,213 (100.0%) | $28,406 |
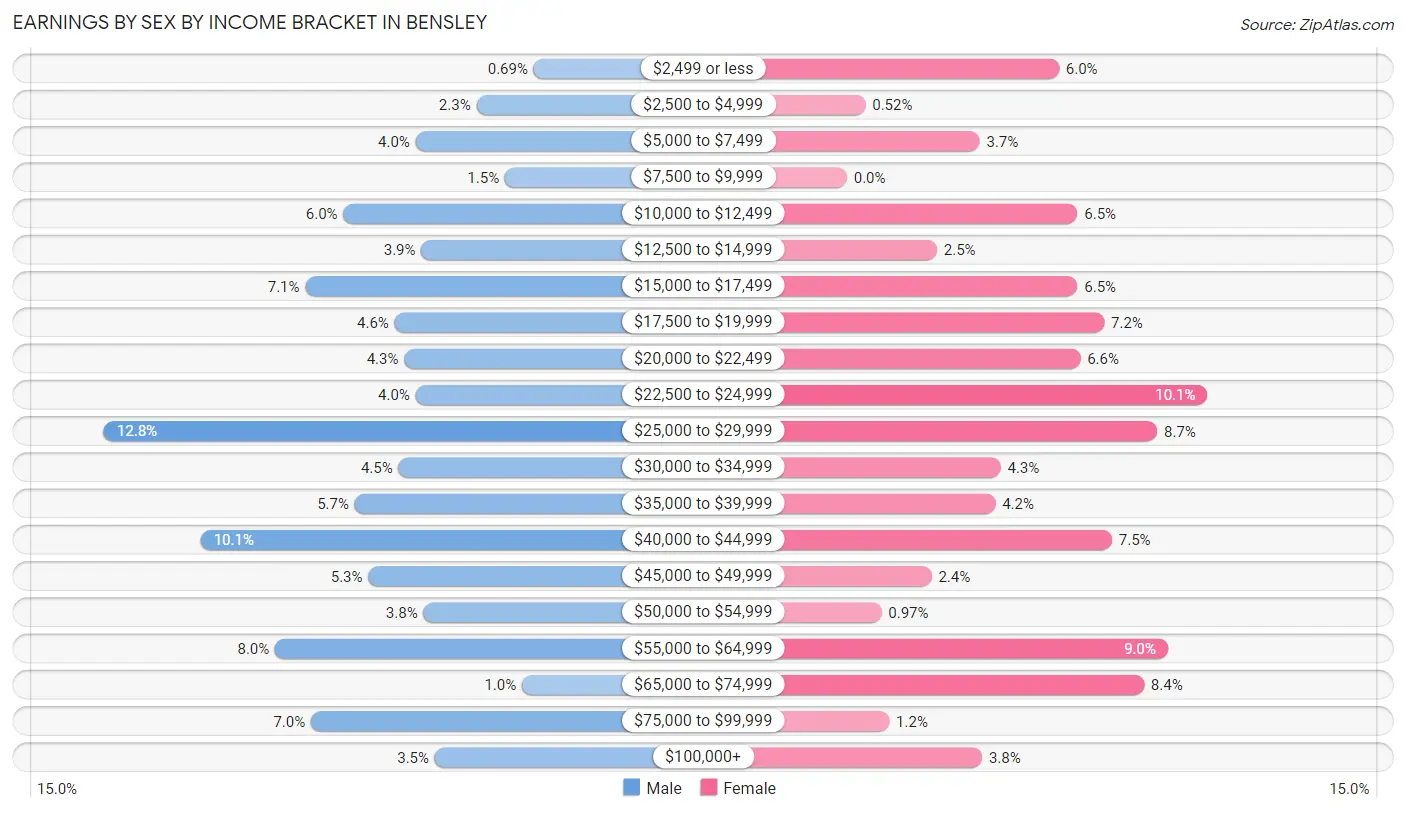
Earnings by Sex by Income Bracket in Bensley
The most common earnings brackets in Bensley are $25,000 to $29,999 for men (239 | 12.8%) and $22,500 to $24,999 for women (136 | 10.1%).
| Income | Male | Female |
| $2,499 or less | 13 (0.7%) | 80 (6.0%) |
| $2,500 to $4,999 | 43 (2.3%) | 7 (0.5%) |
| $5,000 to $7,499 | 75 (4.0%) | 50 (3.7%) |
| $7,500 to $9,999 | 28 (1.5%) | 0 (0.0%) |
| $10,000 to $12,499 | 113 (6.0%) | 87 (6.5%) |
| $12,500 to $14,999 | 72 (3.8%) | 34 (2.5%) |
| $15,000 to $17,499 | 133 (7.1%) | 87 (6.5%) |
| $17,500 to $19,999 | 86 (4.6%) | 97 (7.2%) |
| $20,000 to $22,499 | 81 (4.3%) | 88 (6.6%) |
| $22,500 to $24,999 | 75 (4.0%) | 136 (10.1%) |
| $25,000 to $29,999 | 239 (12.8%) | 117 (8.7%) |
| $30,000 to $34,999 | 84 (4.5%) | 58 (4.3%) |
| $35,000 to $39,999 | 107 (5.7%) | 56 (4.2%) |
| $40,000 to $44,999 | 188 (10.1%) | 100 (7.4%) |
| $45,000 to $49,999 | 100 (5.3%) | 32 (2.4%) |
| $50,000 to $54,999 | 71 (3.8%) | 13 (1.0%) |
| $55,000 to $64,999 | 149 (8.0%) | 121 (9.0%) |
| $65,000 to $74,999 | 19 (1.0%) | 112 (8.4%) |
| $75,000 to $99,999 | 130 (7.0%) | 16 (1.2%) |
| $100,000+ | 65 (3.5%) | 51 (3.8%) |
| Total | 1,871 (100.0%) | 1,342 (100.0%) |
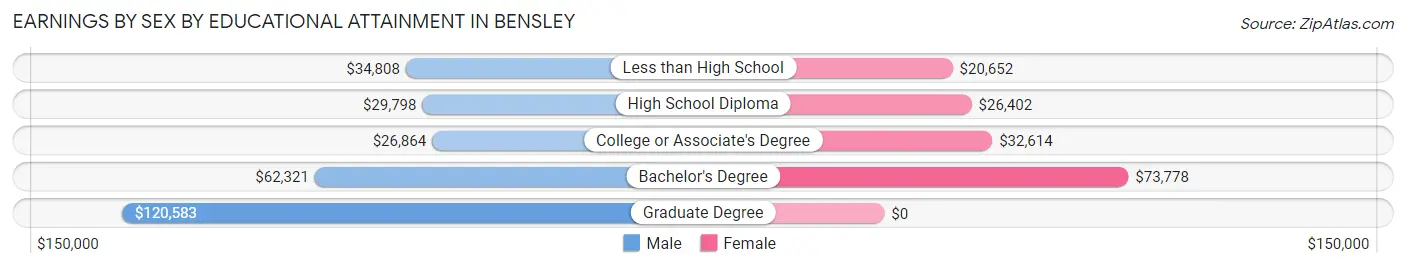
Earnings by Sex by Educational Attainment in Bensley
Average earnings in Bensley are $34,183 for men and $29,043 for women, a difference of 15.0%. Men with an educational attainment of graduate degree enjoy the highest average annual earnings of $120,583, while those with college or associate's degree education earn the least with $26,864. Women with an educational attainment of bachelor's degree earn the most with the average annual earnings of $73,778, while those with less than high school education have the smallest earnings of $20,652.
| Educational Attainment | Male Income | Female Income |
| Less than High School | $34,808 | $20,652 |
| High School Diploma | $29,798 | $26,402 |
| College or Associate's Degree | $26,864 | $32,614 |
| Bachelor's Degree | $62,321 | $73,778 |
| Graduate Degree | $120,583 | $0 |
| Total | $34,183 | $29,043 |
Family Income in Bensley
Family Income Brackets in Bensley
According to the Bensley family income data, there are 343 families falling into the $35,000 to $49,999 income range, which is the most common income bracket and makes up 23.2% of all families. Conversely, the $10,000 to $14,999 income bracket is the least frequent group with only 28 families (1.9%) belonging to this category.
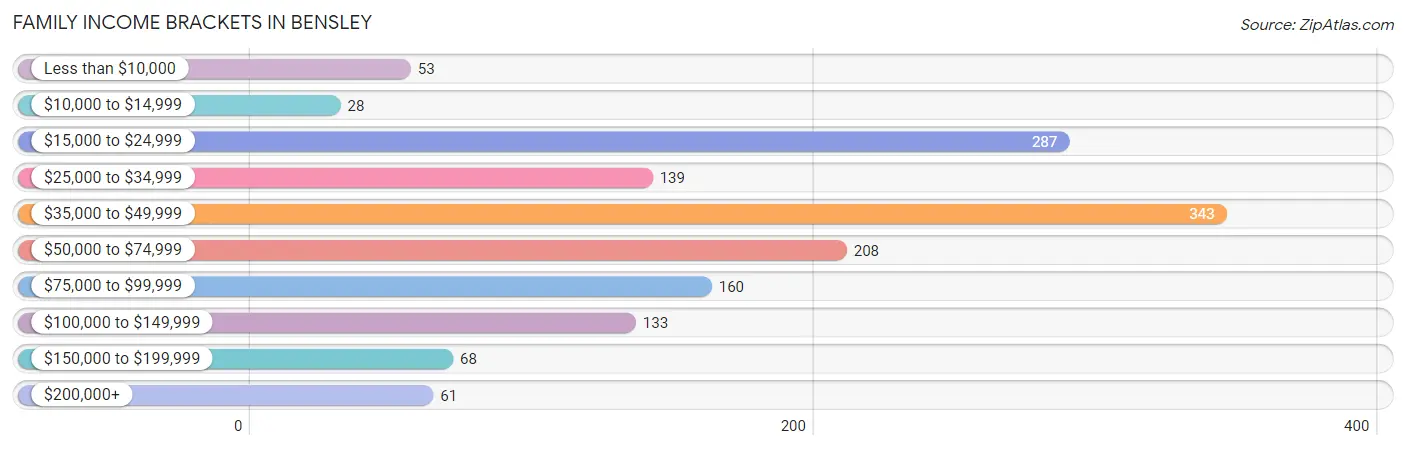
| Income Bracket | # Families | % Families |
| Less than $10,000 | 53 | 3.6% |
| $10,000 to $14,999 | 28 | 1.9% |
| $15,000 to $24,999 | 287 | 19.4% |
| $25,000 to $34,999 | 139 | 9.4% |
| $35,000 to $49,999 | 343 | 23.2% |
| $50,000 to $74,999 | 208 | 14.1% |
| $75,000 to $99,999 | 160 | 10.8% |
| $100,000 to $149,999 | 133 | 9.0% |
| $150,000 to $199,999 | 68 | 4.6% |
| $200,000+ | 61 | 4.1% |
Family Income by Famaliy Size in Bensley
5-person families (105 | 7.1%) account for the highest median family income in Bensley with $78,125 per family, while 2-person families (600 | 40.6%) have the highest median income of $22,500 per family member.
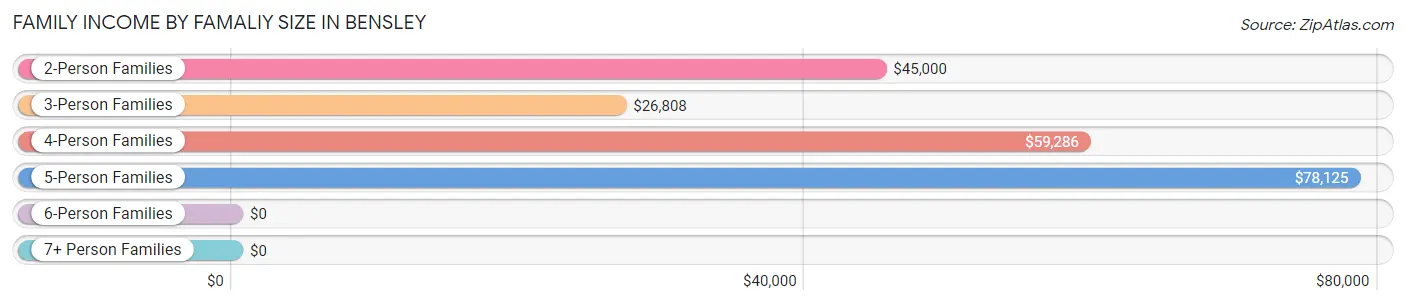
| Income Bracket | # Families | Median Income |
| 2-Person Families | 600 (40.6%) | $45,000 |
| 3-Person Families | 531 (35.9%) | $26,808 |
| 4-Person Families | 202 (13.7%) | $59,286 |
| 5-Person Families | 105 (7.1%) | $78,125 |
| 6-Person Families | 32 (2.2%) | $0 |
| 7+ Person Families | 8 (0.5%) | $0 |
| Total | 1,478 (100.0%) | $44,405 |
Family Income by Number of Earners in Bensley
The median family income in Bensley is $44,405, with families comprising 3+ earners (205) having the highest median family income of $121,033, while families with no earners (154) have the lowest median family income of $23,636, accounting for 13.9% and 10.4% of families, respectively.
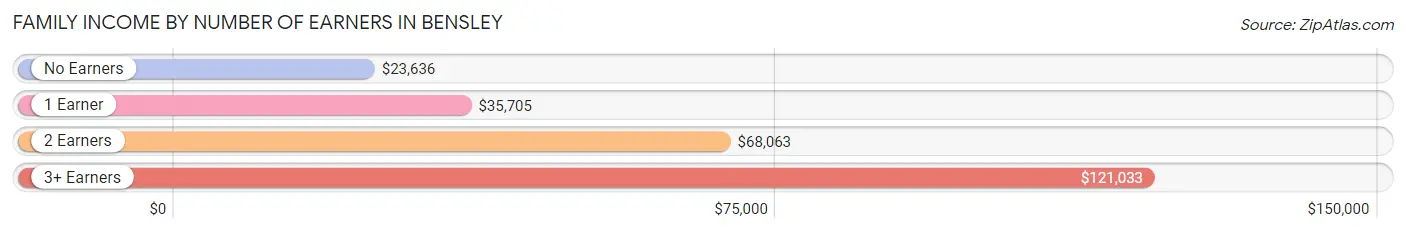
| Number of Earners | # Families | Median Income |
| No Earners | 154 (10.4%) | $23,636 |
| 1 Earner | 794 (53.7%) | $35,705 |
| 2 Earners | 325 (22.0%) | $68,063 |
| 3+ Earners | 205 (13.9%) | $121,033 |
| Total | 1,478 (100.0%) | $44,405 |
Household Income in Bensley
Household Income Brackets in Bensley
With 538 households falling in the category, the $35,000 to $49,999 income range is the most frequent in Bensley, accounting for 23.9% of all households. In contrast, only 47 households (2.1%) fall into the $10,000 to $14,999 income bracket, making it the least populous group.
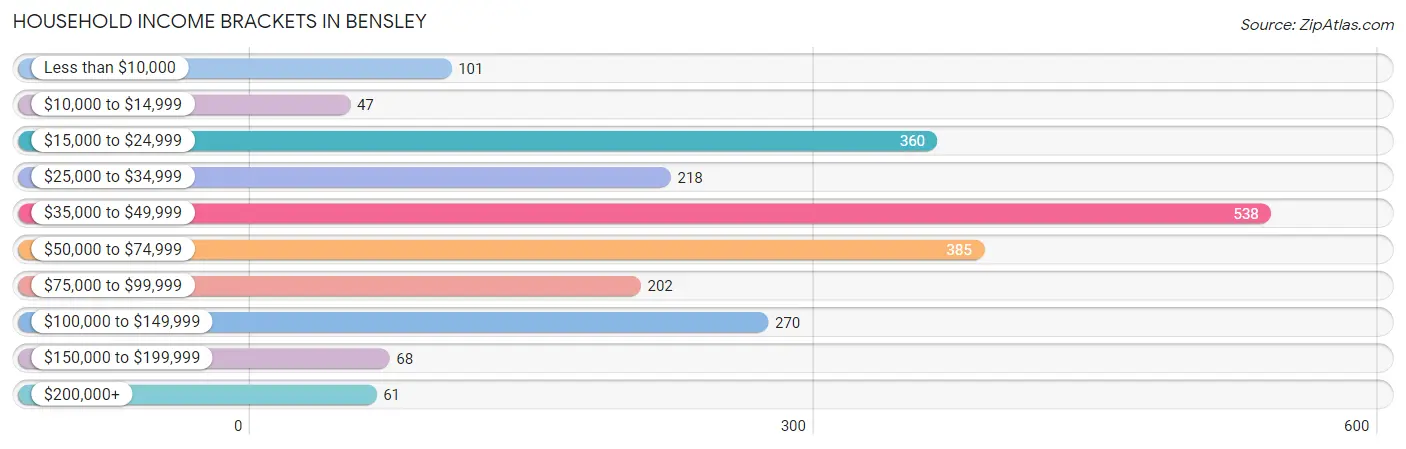
| Income Bracket | # Households | % Households |
| Less than $10,000 | 101 | 4.5% |
| $10,000 to $14,999 | 47 | 2.1% |
| $15,000 to $24,999 | 360 | 16.0% |
| $25,000 to $34,999 | 218 | 9.7% |
| $35,000 to $49,999 | 538 | 23.9% |
| $50,000 to $74,999 | 385 | 17.1% |
| $75,000 to $99,999 | 202 | 9.0% |
| $100,000 to $149,999 | 270 | 12.0% |
| $150,000 to $199,999 | 68 | 3.0% |
| $200,000+ | 61 | 2.7% |
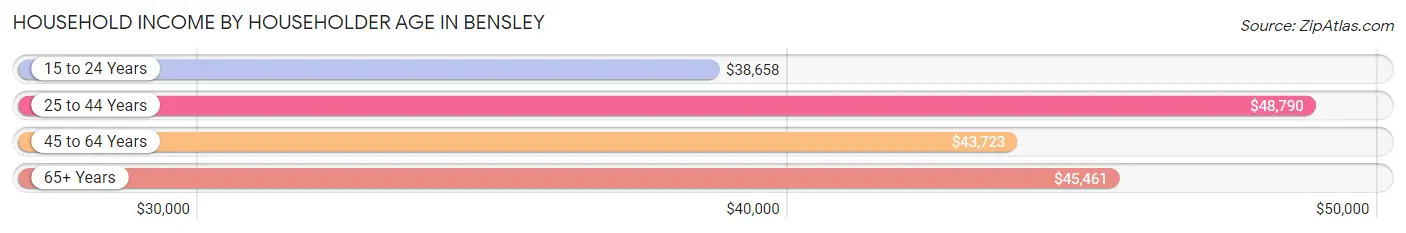
Household Income by Householder Age in Bensley
The median household income in Bensley is $44,026, with the highest median household income of $48,790 found in the 25 to 44 years age bracket for the primary householder. A total of 924 households (41.1%) fall into this category. Meanwhile, the 15 to 24 years age bracket for the primary householder has the lowest median household income of $38,658, with 155 households (6.9%) in this group.
| Income Bracket | # Households | Median Income |
| 15 to 24 Years | 155 (6.9%) | $38,658 |
| 25 to 44 Years | 924 (41.1%) | $48,790 |
| 45 to 64 Years | 768 (34.1%) | $43,723 |
| 65+ Years | 403 (17.9%) | $45,461 |
| Total | 2,250 (100.0%) | $44,026 |
Poverty in Bensley
Income Below Poverty by Sex and Age in Bensley
With 19.4% poverty level for males and 24.1% for females among the residents of Bensley, 15 year old males and 16 and 17 year old females are the most vulnerable to poverty, with 33 males (100.0%) and 49 females (44.1%) in their respective age groups living below the poverty level.
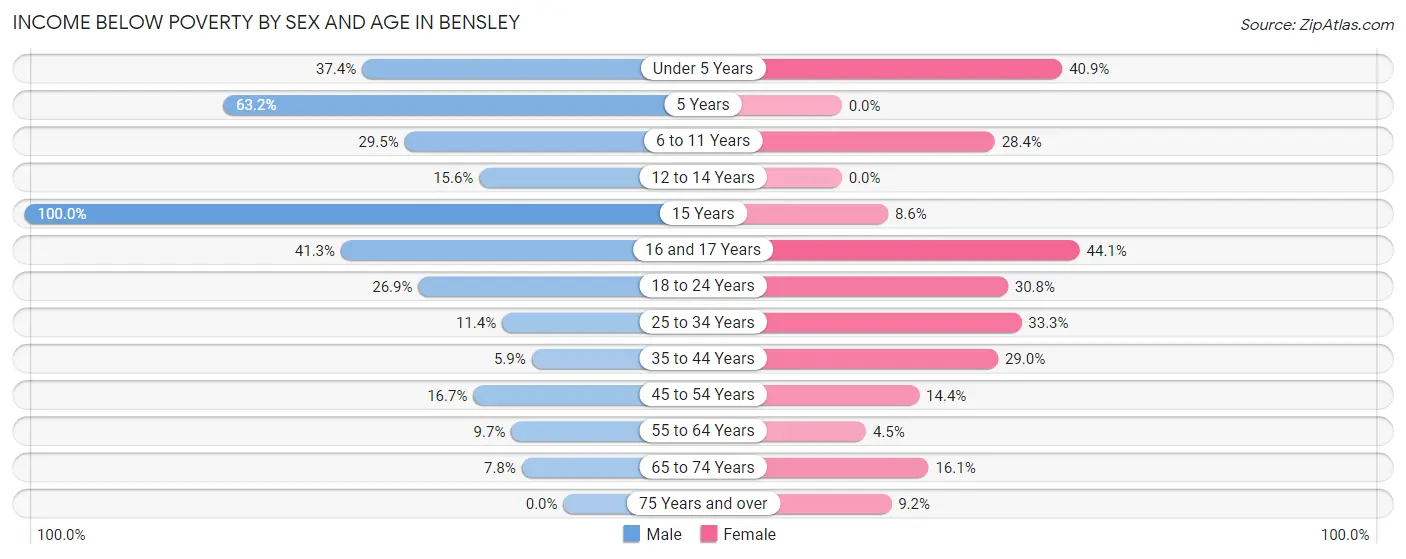
| Age Bracket | Male | Female |
| Under 5 Years | 71 (37.4%) | 108 (40.9%) |
| 5 Years | 48 (63.2%) | 0 (0.0%) |
| 6 to 11 Years | 46 (29.5%) | 63 (28.4%) |
| 12 to 14 Years | 5 (15.6%) | 0 (0.0%) |
| 15 Years | 33 (100.0%) | 3 (8.6%) |
| 16 and 17 Years | 57 (41.3%) | 49 (44.1%) |
| 18 to 24 Years | 101 (26.9%) | 106 (30.8%) |
| 25 to 34 Years | 74 (11.4%) | 236 (33.3%) |
| 35 to 44 Years | 22 (5.9%) | 80 (29.0%) |
| 45 to 54 Years | 46 (16.7%) | 54 (14.4%) |
| 55 to 64 Years | 29 (9.7%) | 15 (4.5%) |
| 65 to 74 Years | 11 (7.7%) | 42 (16.1%) |
| 75 Years and over | 0 (0.0%) | 11 (9.2%) |
| Total | 543 (19.4%) | 767 (24.1%) |
Income Above Poverty by Sex and Age in Bensley
According to the poverty statistics in Bensley, males aged 75 years and over and females aged 12 to 14 years are the age groups that are most secure financially, with 100.0% of males and 100.0% of females in these age groups living above the poverty line.
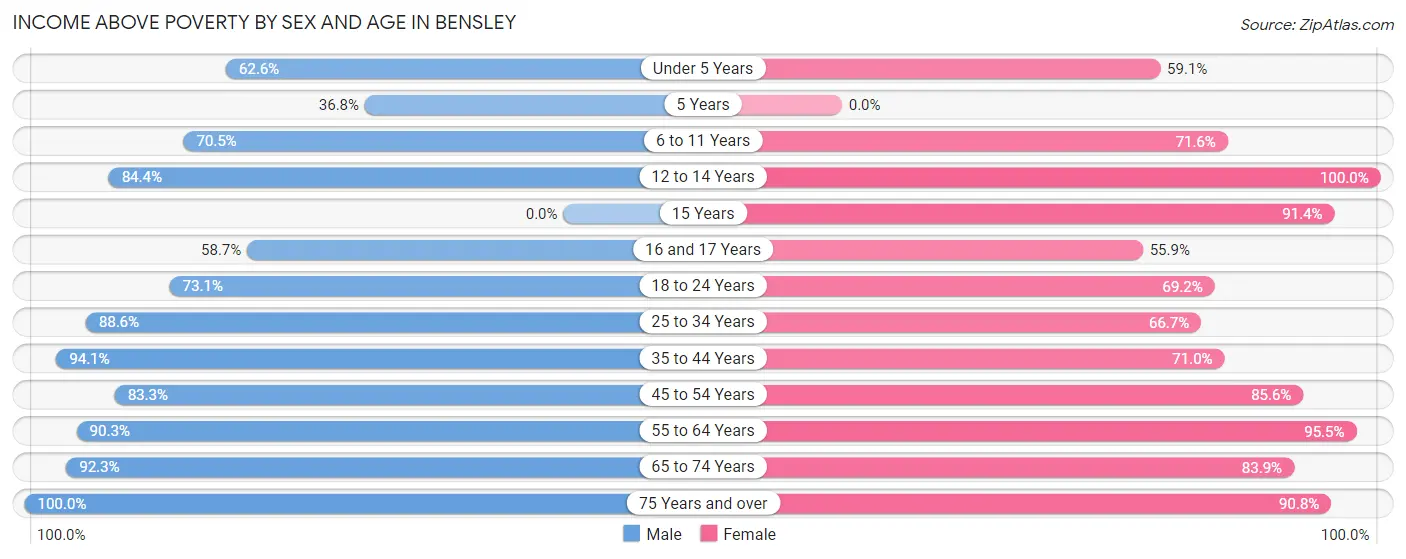
| Age Bracket | Male | Female |
| Under 5 Years | 119 (62.6%) | 156 (59.1%) |
| 5 Years | 28 (36.8%) | 0 (0.0%) |
| 6 to 11 Years | 110 (70.5%) | 159 (71.6%) |
| 12 to 14 Years | 27 (84.4%) | 134 (100.0%) |
| 15 Years | 0 (0.0%) | 32 (91.4%) |
| 16 and 17 Years | 81 (58.7%) | 62 (55.9%) |
| 18 to 24 Years | 274 (73.1%) | 238 (69.2%) |
| 25 to 34 Years | 576 (88.6%) | 472 (66.7%) |
| 35 to 44 Years | 351 (94.1%) | 196 (71.0%) |
| 45 to 54 Years | 229 (83.3%) | 322 (85.6%) |
| 55 to 64 Years | 271 (90.3%) | 318 (95.5%) |
| 65 to 74 Years | 131 (92.2%) | 219 (83.9%) |
| 75 Years and over | 54 (100.0%) | 109 (90.8%) |
| Total | 2,251 (80.6%) | 2,417 (75.9%) |
Income Below Poverty Among Married-Couple Families in Bensley
The poverty statistics for married-couple families in Bensley show that 7.4% or 42 of the total 564 families live below the poverty line. Families with 3 or 4 children have the highest poverty rate of 29.6%, comprising of 8 families. On the other hand, families with no children have the lowest poverty rate of 1.8%, which includes 6 families.
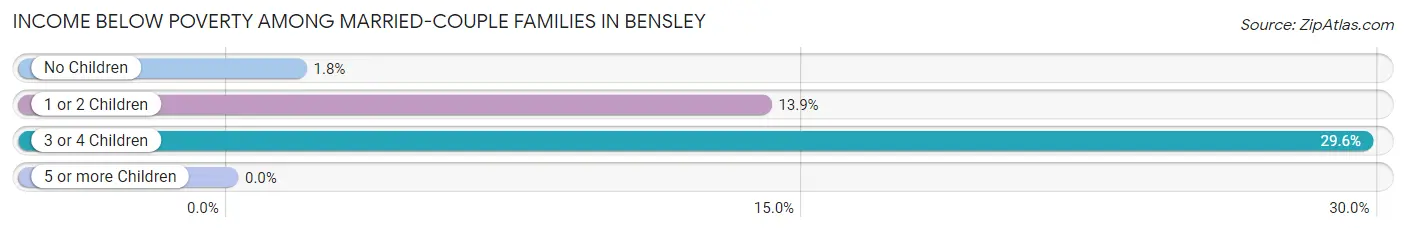
| Children | Above Poverty | Below Poverty |
| No Children | 330 (98.2%) | 6 (1.8%) |
| 1 or 2 Children | 173 (86.1%) | 28 (13.9%) |
| 3 or 4 Children | 19 (70.4%) | 8 (29.6%) |
| 5 or more Children | 0 (0.0%) | 0 (0.0%) |
| Total | 522 (92.5%) | 42 (7.4%) |
Income Below Poverty Among Single-Parent Households in Bensley
According to the poverty data in Bensley, 8.8% or 20 single-father households and 31.4% or 216 single-mother households are living below the poverty line. Among single-father households, those with 1 or 2 children have the highest poverty rate, with 20 households (13.3%) experiencing poverty. Likewise, among single-mother households, those with 1 or 2 children have the highest poverty rate, with 207 households (45.5%) falling below the poverty line.
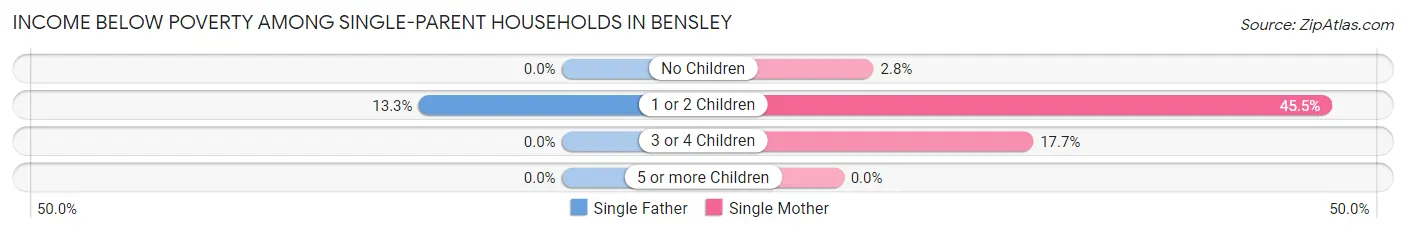
| Children | Single Father | Single Mother |
| No Children | 0 (0.0%) | 6 (2.8%) |
| 1 or 2 Children | 20 (13.3%) | 207 (45.5%) |
| 3 or 4 Children | 0 (0.0%) | 3 (17.6%) |
| 5 or more Children | 0 (0.0%) | 0 (0.0%) |
| Total | 20 (8.8%) | 216 (31.4%) |
Income Below Poverty Among Married-Couple vs Single-Parent Households in Bensley
The poverty data for Bensley shows that 42 of the married-couple family households (7.4%) and 236 of the single-parent households (25.8%) are living below the poverty level. Within the married-couple family households, those with 3 or 4 children have the highest poverty rate, with 8 households (29.6%) falling below the poverty line. Among the single-parent households, those with 1 or 2 children have the highest poverty rate, with 227 household (37.5%) living below poverty.
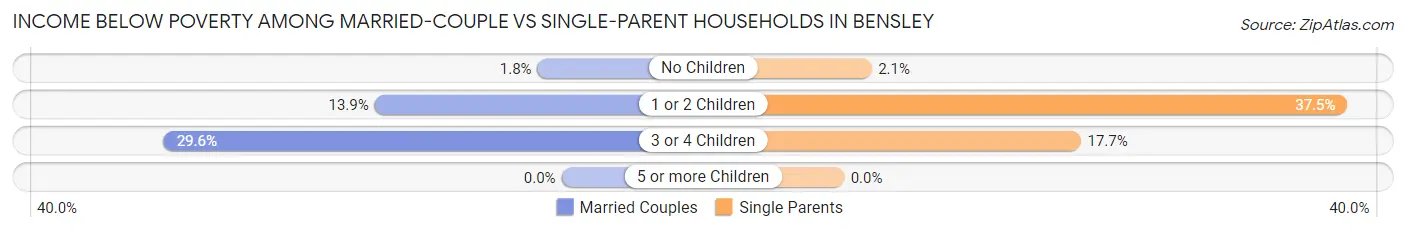
| Children | Married-Couple Families | Single-Parent Households |
| No Children | 6 (1.8%) | 6 (2.1%) |
| 1 or 2 Children | 28 (13.9%) | 227 (37.5%) |
| 3 or 4 Children | 8 (29.6%) | 3 (17.6%) |
| 5 or more Children | 0 (0.0%) | 0 (0.0%) |
| Total | 42 (7.4%) | 236 (25.8%) |
Race in Bensley
The most populous races in Bensley are Hispanic or Latino (2,585 | 42.8%), White / Caucasian (2,453 | 40.7%), and Some other Race (1,771 | 29.4%).
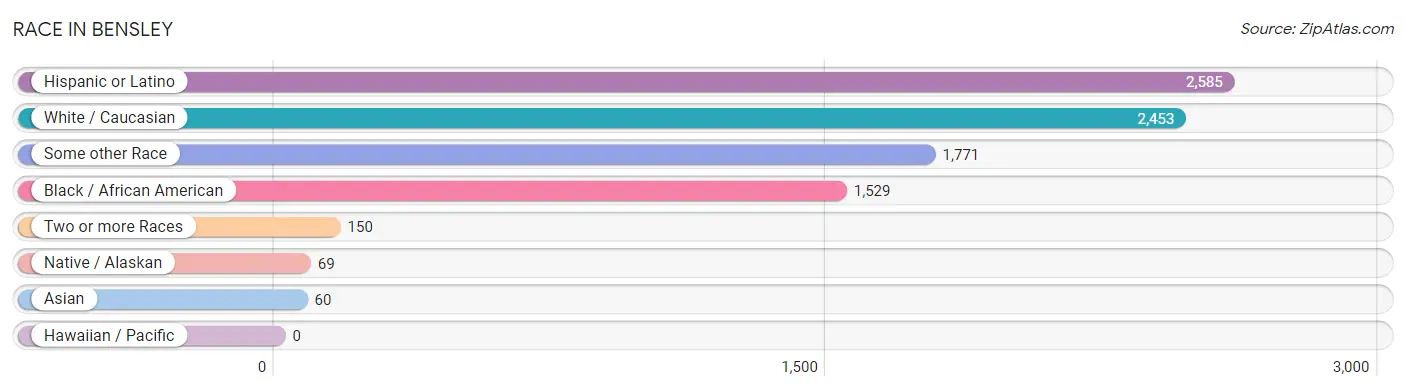
| Race | # Population | % Population |
| Asian | 60 | 1.0% |
| Black / African American | 1,529 | 25.4% |
| Hawaiian / Pacific | 0 | 0.0% |
| Hispanic or Latino | 2,585 | 42.8% |
| Native / Alaskan | 69 | 1.1% |
| White / Caucasian | 2,453 | 40.7% |
| Two or more Races | 150 | 2.5% |
| Some other Race | 1,771 | 29.4% |
| Total | 6,032 | 100.0% |
Ancestry in Bensley
The most populous ancestries reported in Bensley are Central American (1,610 | 26.7%), Salvadoran (956 | 15.9%), Mexican (543 | 9.0%), Guatemalan (402 | 6.7%), and American (275 | 4.6%), together accounting for 62.8% of all Bensley residents.
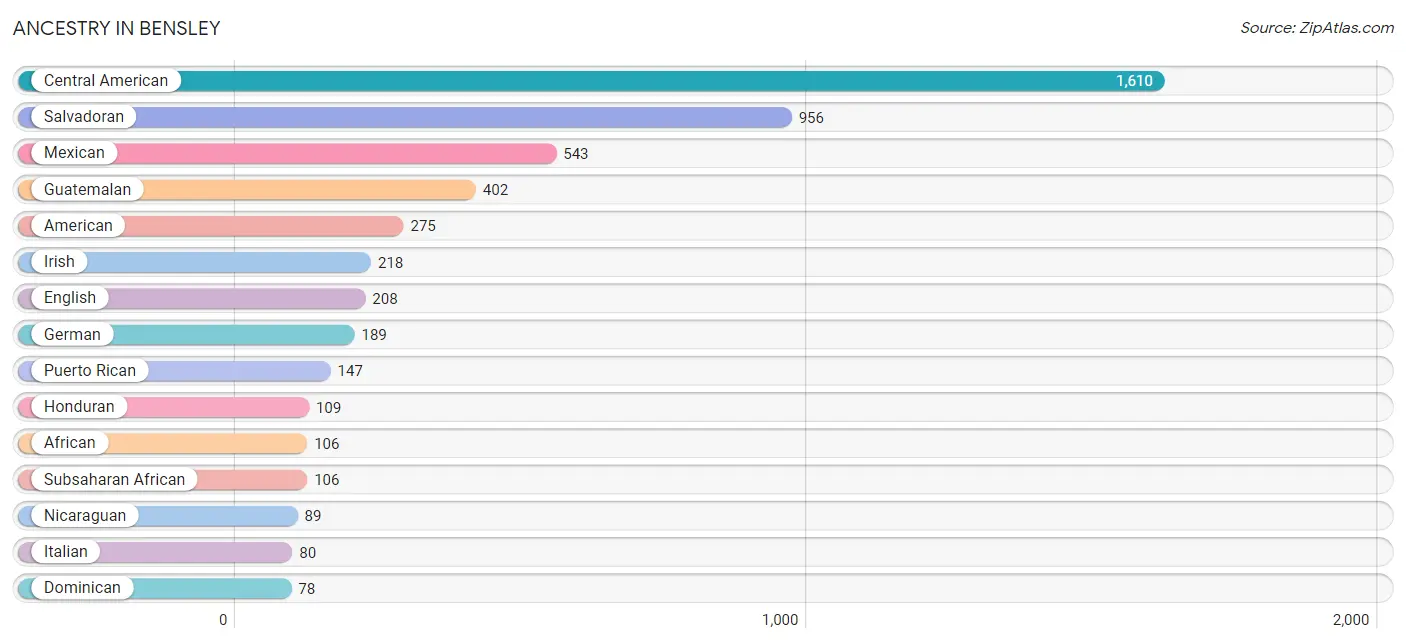
| Ancestry | # Population | % Population |
| African | 106 | 1.8% |
| American | 275 | 4.6% |
| Arab | 21 | 0.4% |
| British | 69 | 1.1% |
| Burmese | 16 | 0.3% |
| Central American | 1,610 | 26.7% |
| Central American Indian | 63 | 1.0% |
| Cherokee | 8 | 0.1% |
| Danish | 13 | 0.2% |
| Dominican | 78 | 1.3% |
| Dutch | 7 | 0.1% |
| English | 208 | 3.5% |
| European | 37 | 0.6% |
| French | 18 | 0.3% |
| German | 189 | 3.1% |
| Greek | 6 | 0.1% |
| Guatemalan | 402 | 6.7% |
| Honduran | 109 | 1.8% |
| Indian (Asian) | 7 | 0.1% |
| Irish | 218 | 3.6% |
| Italian | 80 | 1.3% |
| Japanese | 37 | 0.6% |
| Korean | 6 | 0.1% |
| Lebanese | 21 | 0.4% |
| Lithuanian | 19 | 0.3% |
| Mexican | 543 | 9.0% |
| Nicaraguan | 89 | 1.5% |
| Norwegian | 10 | 0.2% |
| Panamanian | 12 | 0.2% |
| Polish | 5 | 0.1% |
| Portuguese | 7 | 0.1% |
| Puerto Rican | 147 | 2.4% |
| Salvadoran | 956 | 15.9% |
| Scottish | 9 | 0.2% |
| Spaniard | 28 | 0.5% |
| Spanish | 31 | 0.5% |
| Sri Lankan | 14 | 0.2% |
| Subsaharan African | 106 | 1.8% |
| Swedish | 7 | 0.1% |
| Swiss | 5 | 0.1% |
| Ukrainian | 19 | 0.3% |
| Welsh | 13 | 0.2% |
| West Indian | 11 | 0.2% | View All 43 Rows |
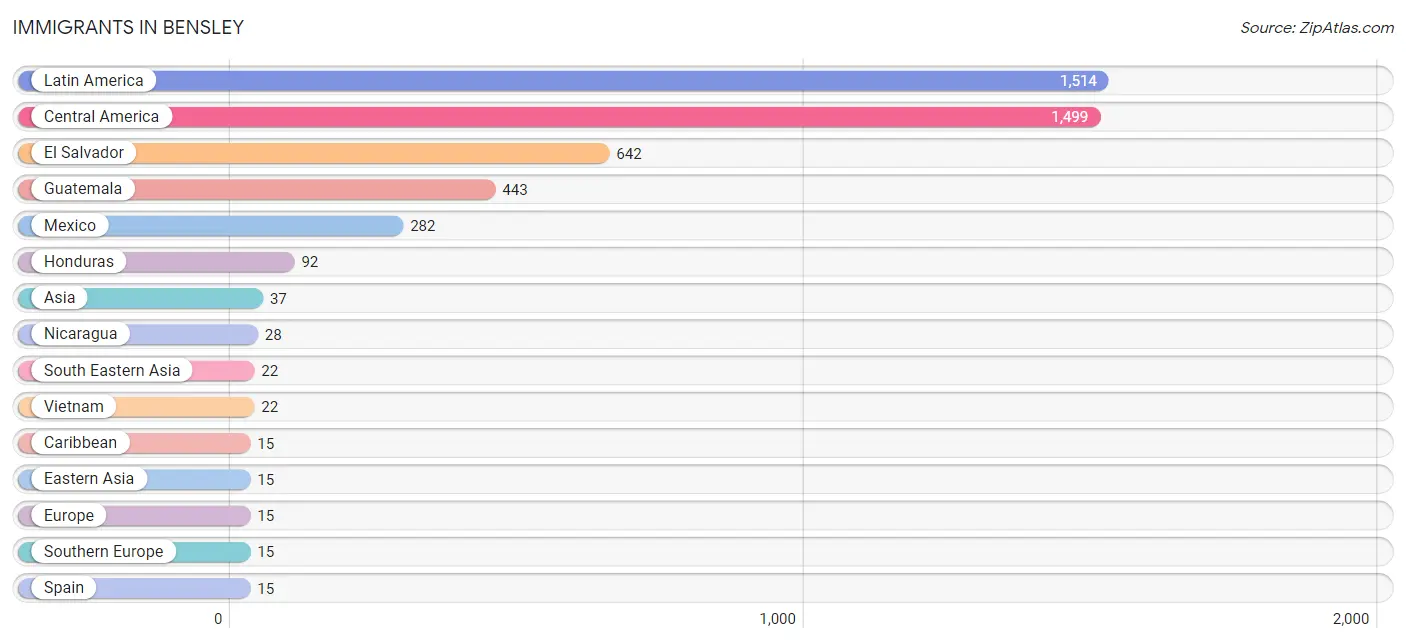
Immigrants in Bensley
The most numerous immigrant groups reported in Bensley came from Latin America (1,514 | 25.1%), Central America (1,499 | 24.8%), El Salvador (642 | 10.6%), Guatemala (443 | 7.3%), and Mexico (282 | 4.7%), together accounting for 72.6% of all Bensley residents.
| Immigration Origin | # Population | % Population |
| Asia | 37 | 0.6% |
| Caribbean | 15 | 0.3% |
| Central America | 1,499 | 24.8% |
| China | 7 | 0.1% |
| Dominican Republic | 8 | 0.1% |
| Eastern Asia | 15 | 0.3% |
| El Salvador | 642 | 10.6% |
| Europe | 15 | 0.3% |
| Guatemala | 443 | 7.3% |
| Honduras | 92 | 1.5% |
| Korea | 8 | 0.1% |
| Latin America | 1,514 | 25.1% |
| Mexico | 282 | 4.7% |
| Nicaragua | 28 | 0.5% |
| Panama | 12 | 0.2% |
| South Eastern Asia | 22 | 0.4% |
| Southern Europe | 15 | 0.3% |
| Spain | 15 | 0.3% |
| Trinidad and Tobago | 7 | 0.1% |
| Vietnam | 22 | 0.4% | View All 20 Rows |
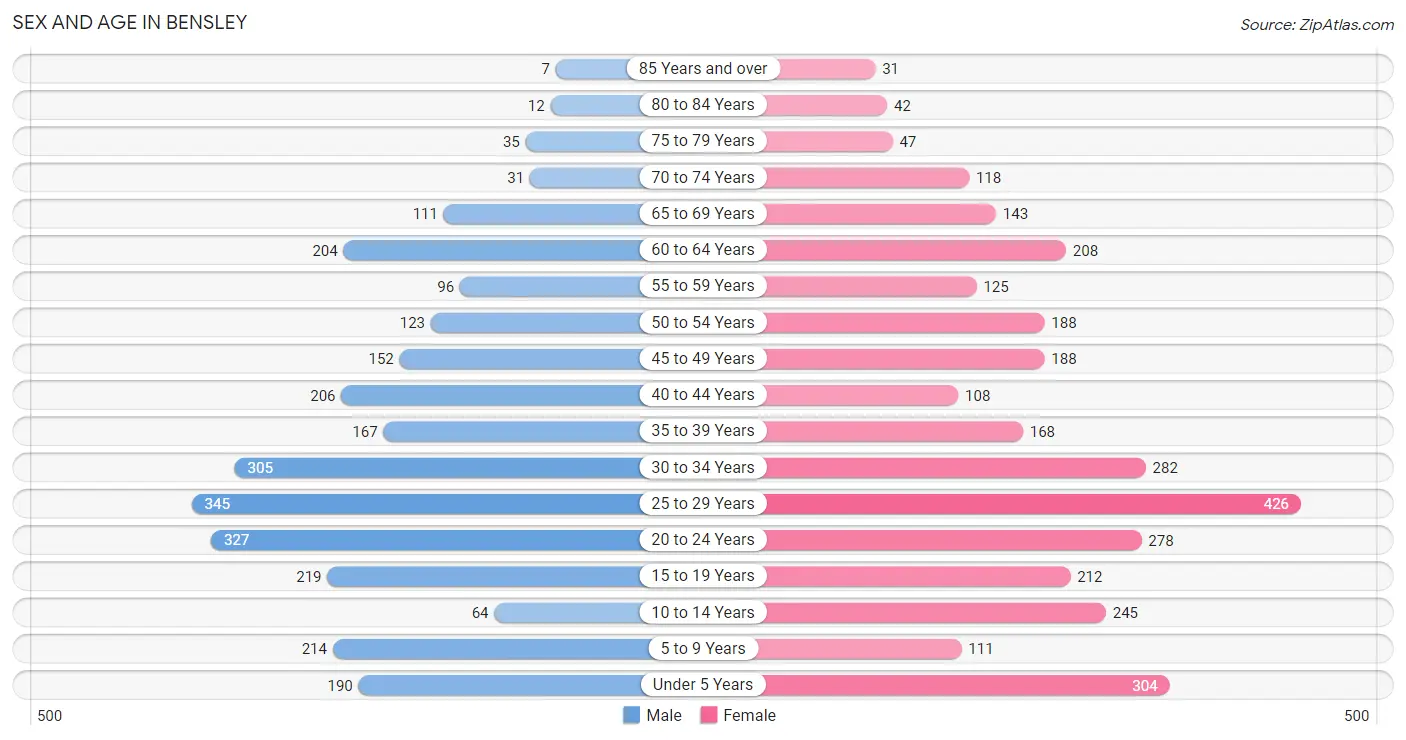
Sex and Age in Bensley
Sex and Age in Bensley
The most populous age groups in Bensley are 25 to 29 Years (345 | 12.3%) for men and 25 to 29 Years (426 | 13.2%) for women.
| Age Bracket | Male | Female |
| Under 5 Years | 190 (6.8%) | 304 (9.4%) |
| 5 to 9 Years | 214 (7.6%) | 111 (3.4%) |
| 10 to 14 Years | 64 (2.3%) | 245 (7.6%) |
| 15 to 19 Years | 219 (7.8%) | 212 (6.6%) |
| 20 to 24 Years | 327 (11.7%) | 278 (8.6%) |
| 25 to 29 Years | 345 (12.3%) | 426 (13.2%) |
| 30 to 34 Years | 305 (10.9%) | 282 (8.7%) |
| 35 to 39 Years | 167 (5.9%) | 168 (5.2%) |
| 40 to 44 Years | 206 (7.3%) | 108 (3.4%) |
| 45 to 49 Years | 152 (5.4%) | 188 (5.8%) |
| 50 to 54 Years | 123 (4.4%) | 188 (5.8%) |
| 55 to 59 Years | 96 (3.4%) | 125 (3.9%) |
| 60 to 64 Years | 204 (7.3%) | 208 (6.5%) |
| 65 to 69 Years | 111 (4.0%) | 143 (4.4%) |
| 70 to 74 Years | 31 (1.1%) | 118 (3.7%) |
| 75 to 79 Years | 35 (1.3%) | 47 (1.5%) |
| 80 to 84 Years | 12 (0.4%) | 42 (1.3%) |
| 85 Years and over | 7 (0.3%) | 31 (1.0%) |
| Total | 2,808 (100.0%) | 3,224 (100.0%) |
Families and Households in Bensley
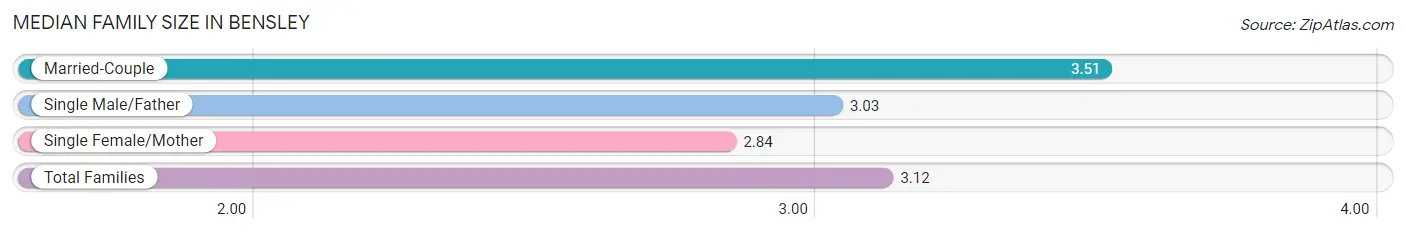
Median Family Size in Bensley
The median family size in Bensley is 3.12 persons per family, with married-couple families (564 | 38.2%) accounting for the largest median family size of 3.51 persons per family. On the other hand, single female/mother families (687 | 46.5%) represent the smallest median family size with 2.84 persons per family.
| Family Type | # Families | Family Size |
| Married-Couple | 564 (38.2%) | 3.51 |
| Single Male/Father | 227 (15.4%) | 3.03 |
| Single Female/Mother | 687 (46.5%) | 2.84 |
| Total Families | 1,478 (100.0%) | 3.12 |
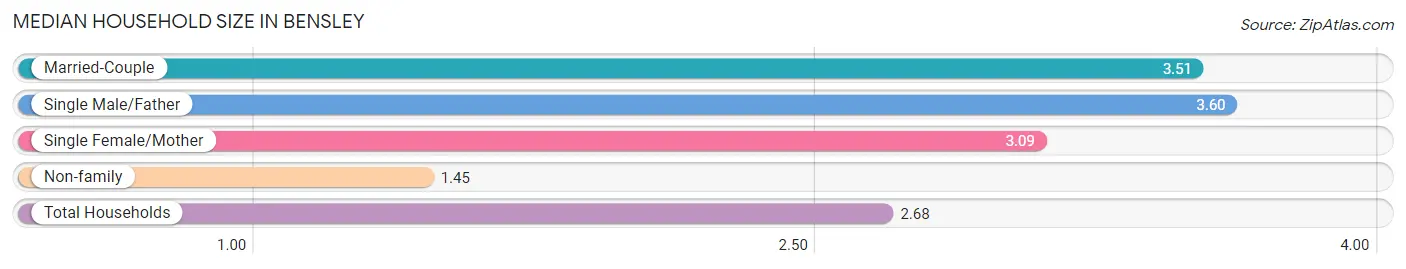
Median Household Size in Bensley
The median household size in Bensley is 2.68 persons per household, with single male/father households (227 | 10.1%) accounting for the largest median household size of 3.6 persons per household. non-family households (772 | 34.3%) represent the smallest median household size with 1.45 persons per household.
| Household Type | # Households | Household Size |
| Married-Couple | 564 (25.1%) | 3.51 |
| Single Male/Father | 227 (10.1%) | 3.60 |
| Single Female/Mother | 687 (30.5%) | 3.09 |
| Non-family | 772 (34.3%) | 1.45 |
| Total Households | 2,250 (100.0%) | 2.68 |
Household Size by Marriage Status in Bensley
Out of a total of 2,250 households in Bensley, 1,478 (65.7%) are family households, while 772 (34.3%) are nonfamily households. The most numerous type of family households are 3-person households, comprising 531, and the most common type of nonfamily households are 1-person households, comprising 520.
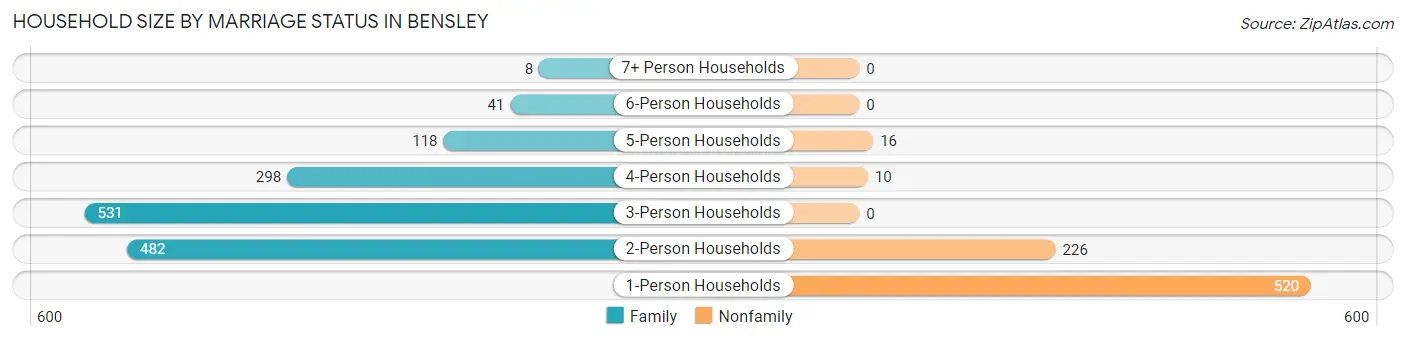
| Household Size | Family Households | Nonfamily Households |
| 1-Person Households | - | 520 (23.1%) |
| 2-Person Households | 482 (21.4%) | 226 (10.0%) |
| 3-Person Households | 531 (23.6%) | 0 (0.0%) |
| 4-Person Households | 298 (13.2%) | 10 (0.4%) |
| 5-Person Households | 118 (5.2%) | 16 (0.7%) |
| 6-Person Households | 41 (1.8%) | 0 (0.0%) |
| 7+ Person Households | 8 (0.4%) | 0 (0.0%) |
| Total | 1,478 (65.7%) | 772 (34.3%) |
Female Fertility in Bensley
Fertility by Age in Bensley
Average fertility rate in Bensley is 91.0 births per 1,000 women. Women in the age bracket of 20 to 34 years have the highest fertility rate with 138.0 births per 1,000 women. Women in the age bracket of 20 to 34 years acount for 87.7% of all women with births.
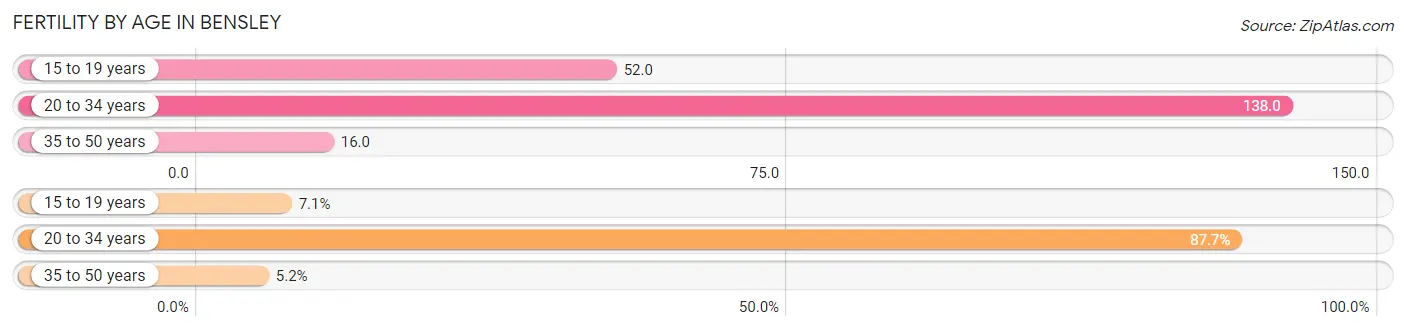
| Age Bracket | Women with Births | Births / 1,000 Women |
| 15 to 19 years | 11 (7.1%) | 52.0 |
| 20 to 34 years | 136 (87.7%) | 138.0 |
| 35 to 50 years | 8 (5.2%) | 16.0 |
| Total | 155 (100.0%) | 91.0 |
Fertility by Age by Marriage Status in Bensley
21.9% of women with births (155) in Bensley are married. The highest percentage of unmarried women with births falls into 15 to 19 years age bracket with 100.0% of them unmarried at the time of birth, while the lowest percentage of unmarried women with births belong to 35 to 50 years age bracket with 0.0% of them unmarried.
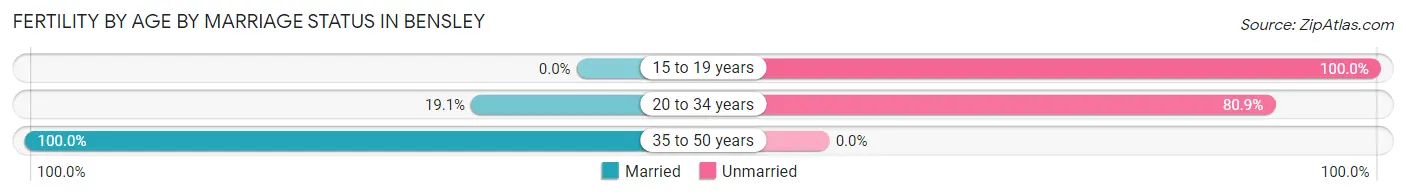
| Age Bracket | Married | Unmarried |
| 15 to 19 years | 0 (0.0%) | 11 (100.0%) |
| 20 to 34 years | 26 (19.1%) | 110 (80.9%) |
| 35 to 50 years | 8 (100.0%) | 0 (0.0%) |
| Total | 34 (21.9%) | 121 (78.1%) |
Fertility by Education in Bensley
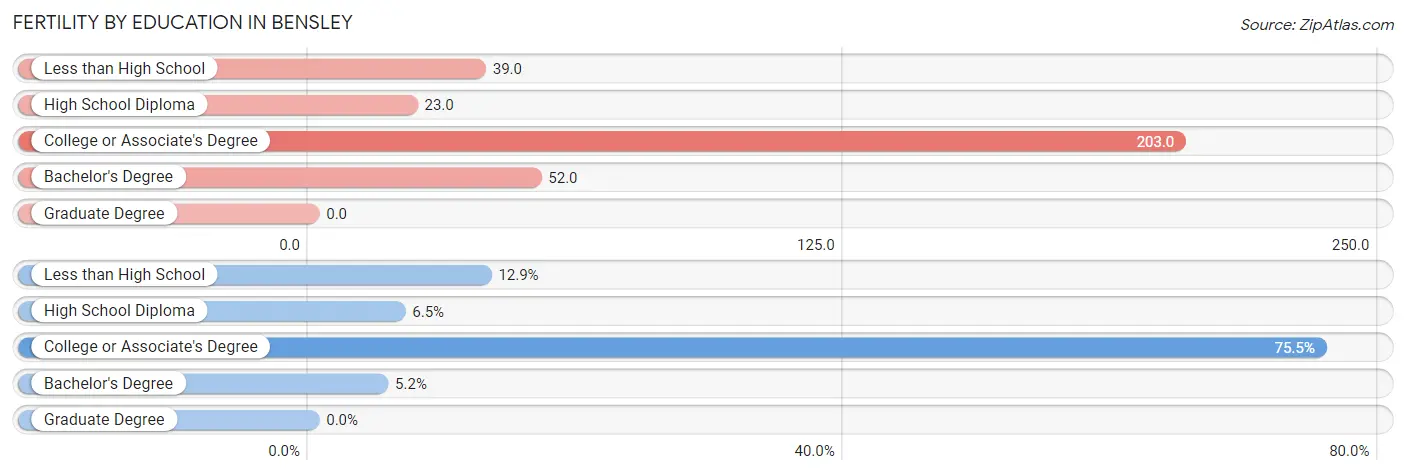
| Educational Attainment | Women with Births | Births / 1,000 Women |
| Less than High School | 20 (12.9%) | 39.0 |
| High School Diploma | 10 (6.5%) | 23.0 |
| College or Associate's Degree | 117 (75.5%) | 203.0 |
| Bachelor's Degree | 8 (5.2%) | 52.0 |
| Graduate Degree | 0 (0.0%) | 0.0 |
| Total | 155 (100.0%) | 91.0 |
Fertility by Education by Marriage Status in Bensley
78.1% of women with births in Bensley are unmarried. Women with the educational attainment of high school diploma are most likely to be married with 100.0% of them married at childbirth, while women with the educational attainment of college or associate's degree are least likely to be married with 90.6% of them unmarried at childbirth.
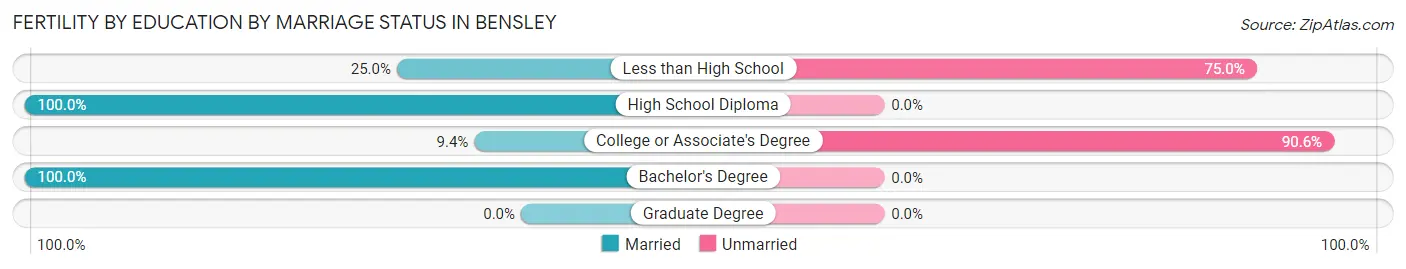
| Educational Attainment | Married | Unmarried |
| Less than High School | 5 (25.0%) | 15 (75.0%) |
| High School Diploma | 10 (100.0%) | 0 (0.0%) |
| College or Associate's Degree | 11 (9.4%) | 106 (90.6%) |
| Bachelor's Degree | 8 (100.0%) | 0 (0.0%) |
| Graduate Degree | 0 (0.0%) | 0 (0.0%) |
| Total | 34 (21.9%) | 121 (78.1%) |
Employment Characteristics in Bensley
Employment by Class of Employer in Bensley
Among the 2,946 employed individuals in Bensley, private company employees (2,405 | 81.6%), not-for-profit organizations (143 | 4.9%), and federal government employees (139 | 4.7%) make up the most common classes of employment.
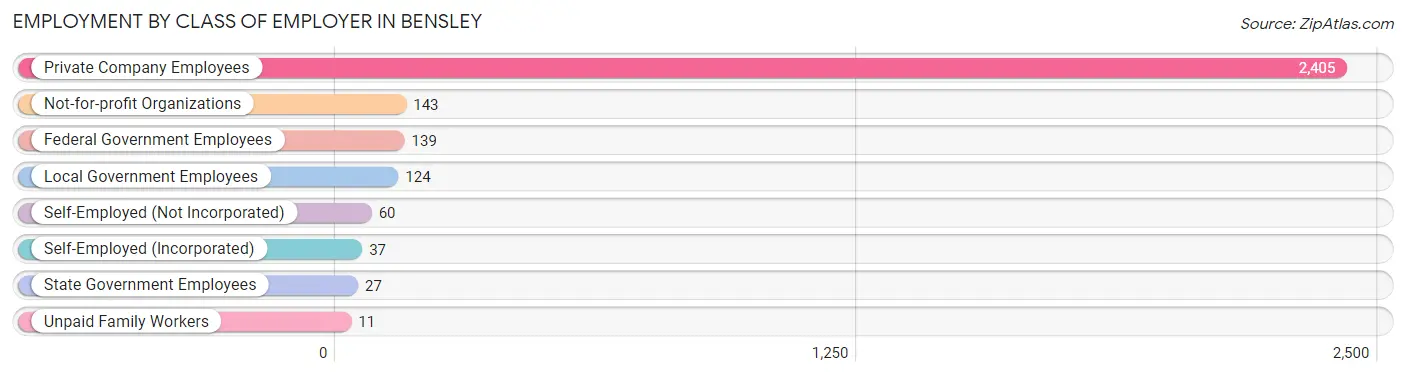
| Employer Class | # Employees | % Employees |
| Private Company Employees | 2,405 | 81.6% |
| Self-Employed (Incorporated) | 37 | 1.3% |
| Self-Employed (Not Incorporated) | 60 | 2.0% |
| Not-for-profit Organizations | 143 | 4.9% |
| Local Government Employees | 124 | 4.2% |
| State Government Employees | 27 | 0.9% |
| Federal Government Employees | 139 | 4.7% |
| Unpaid Family Workers | 11 | 0.4% |
| Total | 2,946 | 100.0% |
Employment Status by Age in Bensley
According to the labor force statistics for Bensley, out of the total population over 16 years of age (4,836), 67.0% or 3,240 individuals are in the labor force, with 8.5% or 275 of them unemployed. The age group with the highest labor force participation rate is 25 to 29 years, with 96.4% or 743 individuals in the labor force. Within the labor force, the 16 to 19 years age range has the highest percentage of unemployed individuals, with 54.7% or 29 of them being unemployed.
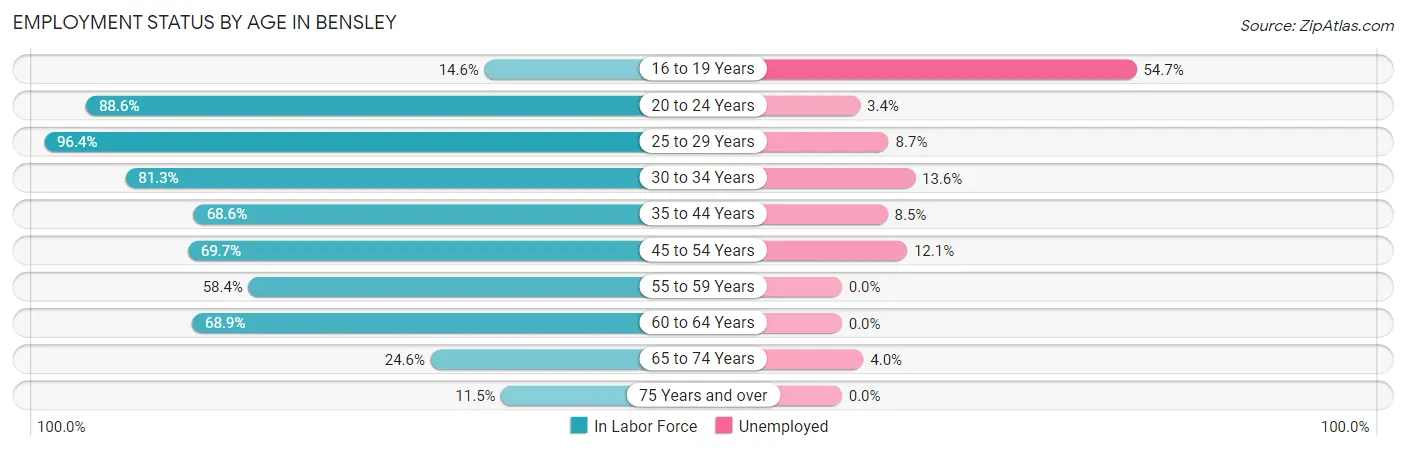
| Age Bracket | In Labor Force | Unemployed |
| 16 to 19 Years | 53 (14.6%) | 29 (54.7%) |
| 20 to 24 Years | 536 (88.6%) | 18 (3.4%) |
| 25 to 29 Years | 743 (96.4%) | 65 (8.7%) |
| 30 to 34 Years | 477 (81.3%) | 65 (13.6%) |
| 35 to 44 Years | 445 (68.6%) | 38 (8.5%) |
| 45 to 54 Years | 454 (69.7%) | 55 (12.1%) |
| 55 to 59 Years | 129 (58.4%) | 0 (0.0%) |
| 60 to 64 Years | 284 (68.9%) | 0 (0.0%) |
| 65 to 74 Years | 99 (24.6%) | 4 (4.0%) |
| 75 Years and over | 20 (11.5%) | 0 (0.0%) |
| Total | 3,240 (67.0%) | 275 (8.5%) |
Employment Status by Educational Attainment in Bensley
According to labor force statistics for Bensley, 76.9% of individuals (2,531) out of the total population between 25 and 64 years of age (3,291) are in the labor force, with 8.8% or 223 of them being unemployed. The group with the highest labor force participation rate are those with the educational attainment of bachelor's degree or higher, with 92.5% or 359 individuals in the labor force. Within the labor force, individuals with college / associate degree education have the highest percentage of unemployment, with 13.8% or 92 of them being unemployed.
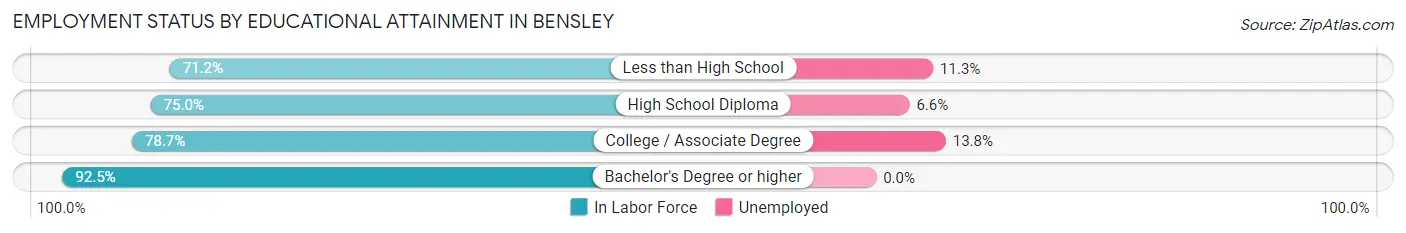
| Educational Attainment | In Labor Force | Unemployed |
| Less than High School | 662 (71.2%) | 105 (11.3%) |
| High School Diploma | 843 (75.0%) | 74 (6.6%) |
| College / Associate Degree | 668 (78.7%) | 117 (13.8%) |
| Bachelor's Degree or higher | 359 (92.5%) | 0 (0.0%) |
| Total | 2,531 (76.9%) | 290 (8.8%) |
Employment Occupations by Sex in Bensley
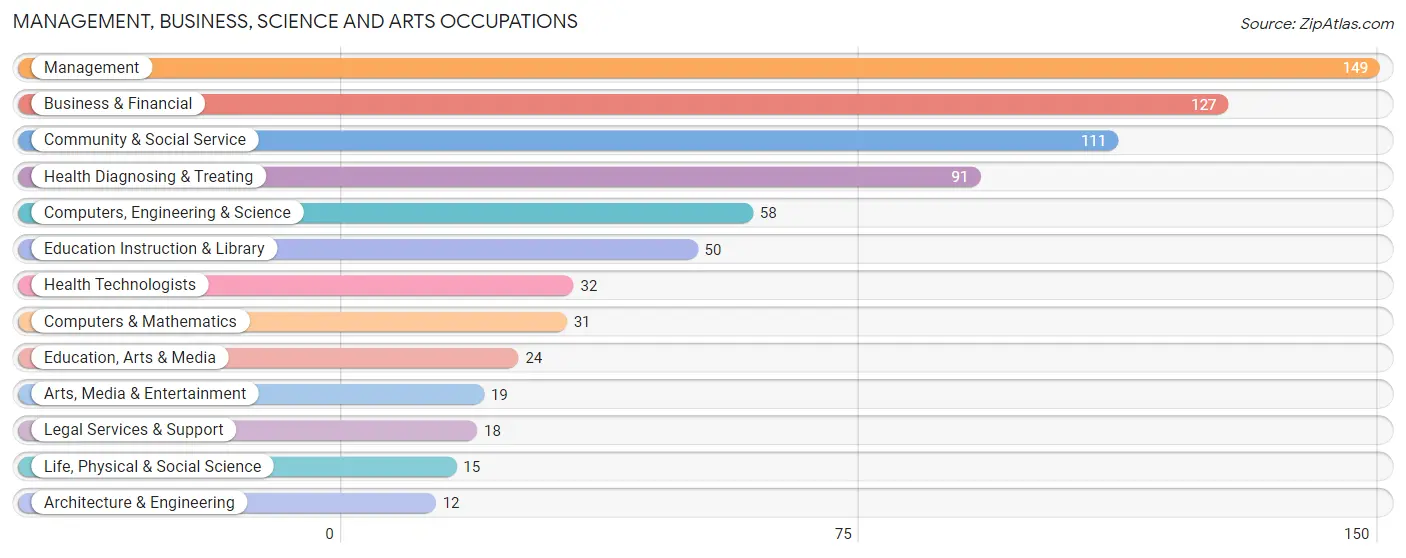
Management, Business, Science and Arts Occupations
The most common Management, Business, Science and Arts occupations in Bensley are Management (149 | 5.0%), Business & Financial (127 | 4.3%), Community & Social Service (111 | 3.7%), Health Diagnosing & Treating (91 | 3.1%), and Computers, Engineering & Science (58 | 2.0%).
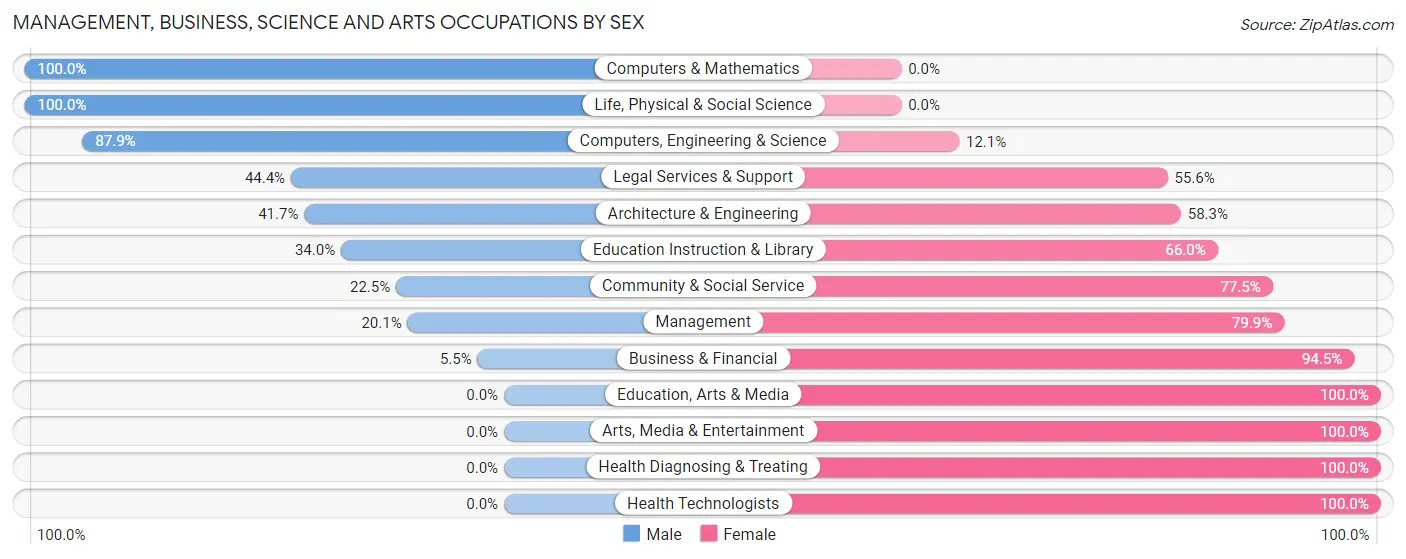
Management, Business, Science and Arts Occupations by Sex
Within the Management, Business, Science and Arts occupations in Bensley, the most male-oriented occupations are Computers & Mathematics (100.0%), Life, Physical & Social Science (100.0%), and Computers, Engineering & Science (87.9%), while the most female-oriented occupations are Education, Arts & Media (100.0%), Arts, Media & Entertainment (100.0%), and Health Diagnosing & Treating (100.0%).
| Occupation | Male | Female |
| Management | 30 (20.1%) | 119 (79.9%) |
| Business & Financial | 7 (5.5%) | 120 (94.5%) |
| Computers, Engineering & Science | 51 (87.9%) | 7 (12.1%) |
| Computers & Mathematics | 31 (100.0%) | 0 (0.0%) |
| Architecture & Engineering | 5 (41.7%) | 7 (58.3%) |
| Life, Physical & Social Science | 15 (100.0%) | 0 (0.0%) |
| Community & Social Service | 25 (22.5%) | 86 (77.5%) |
| Education, Arts & Media | 0 (0.0%) | 24 (100.0%) |
| Legal Services & Support | 8 (44.4%) | 10 (55.6%) |
| Education Instruction & Library | 17 (34.0%) | 33 (66.0%) |
| Arts, Media & Entertainment | 0 (0.0%) | 19 (100.0%) |
| Health Diagnosing & Treating | 0 (0.0%) | 91 (100.0%) |
| Health Technologists | 0 (0.0%) | 32 (100.0%) |
| Total (Category) | 113 (21.1%) | 423 (78.9%) |
| Total (Overall) | 1,738 (58.6%) | 1,228 (41.4%) |
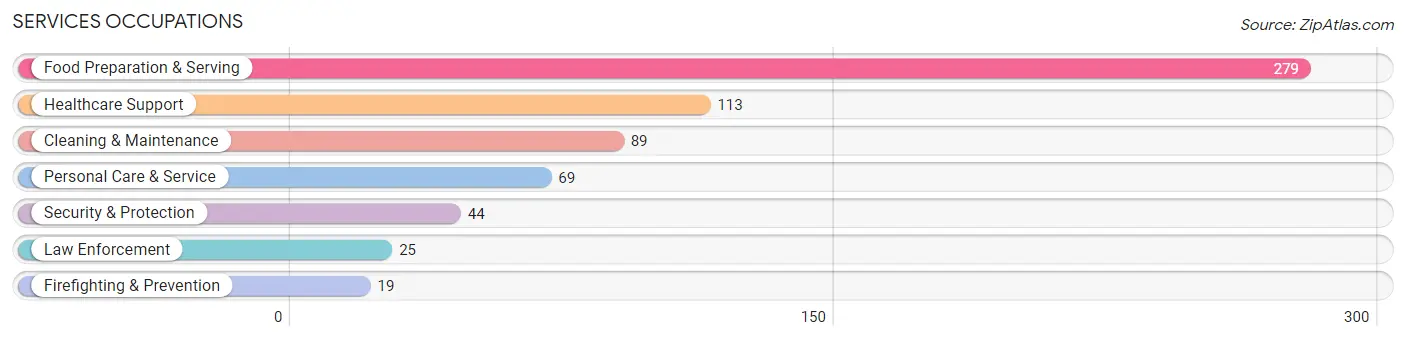
Services Occupations
The most common Services occupations in Bensley are Food Preparation & Serving (279 | 9.4%), Healthcare Support (113 | 3.8%), Cleaning & Maintenance (89 | 3.0%), Personal Care & Service (69 | 2.3%), and Security & Protection (44 | 1.5%).
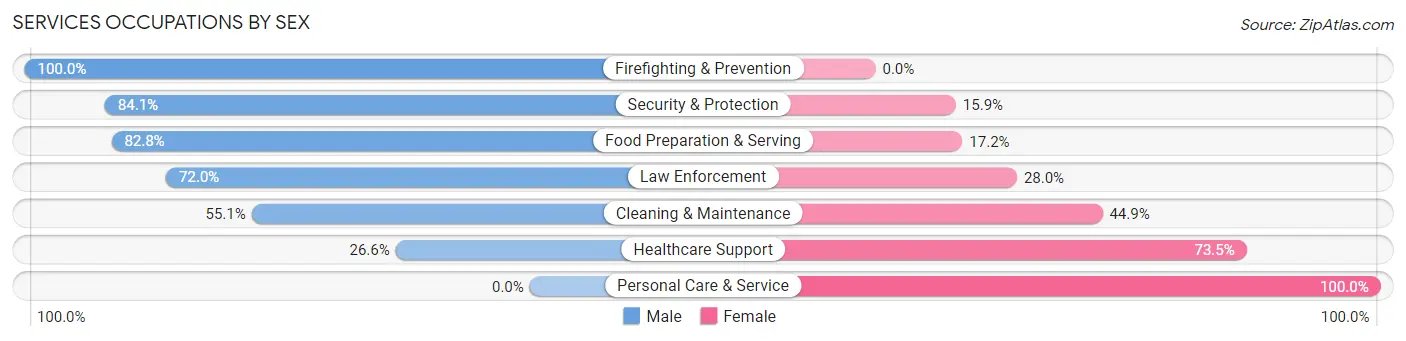
Services Occupations by Sex
Within the Services occupations in Bensley, the most male-oriented occupations are Firefighting & Prevention (100.0%), Security & Protection (84.1%), and Food Preparation & Serving (82.8%), while the most female-oriented occupations are Personal Care & Service (100.0%), Healthcare Support (73.5%), and Cleaning & Maintenance (44.9%).
| Occupation | Male | Female |
| Healthcare Support | 30 (26.6%) | 83 (73.5%) |
| Security & Protection | 37 (84.1%) | 7 (15.9%) |
| Firefighting & Prevention | 19 (100.0%) | 0 (0.0%) |
| Law Enforcement | 18 (72.0%) | 7 (28.0%) |
| Food Preparation & Serving | 231 (82.8%) | 48 (17.2%) |
| Cleaning & Maintenance | 49 (55.1%) | 40 (44.9%) |
| Personal Care & Service | 0 (0.0%) | 69 (100.0%) |
| Total (Category) | 347 (58.4%) | 247 (41.6%) |
| Total (Overall) | 1,738 (58.6%) | 1,228 (41.4%) |
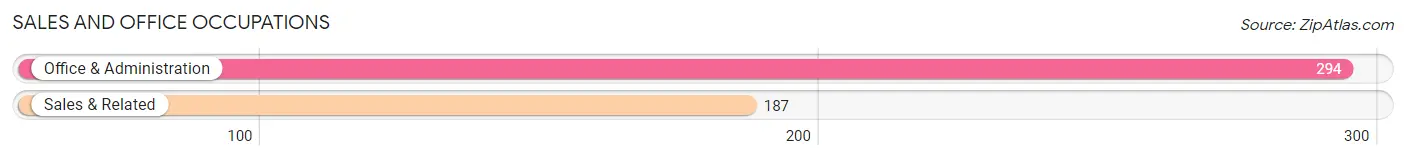
Sales and Office Occupations
The most common Sales and Office occupations in Bensley are Office & Administration (294 | 9.9%), and Sales & Related (187 | 6.3%).
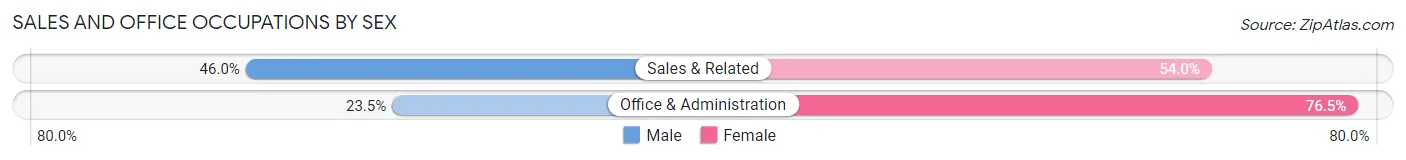
Sales and Office Occupations by Sex
| Occupation | Male | Female |
| Sales & Related | 86 (46.0%) | 101 (54.0%) |
| Office & Administration | 69 (23.5%) | 225 (76.5%) |
| Total (Category) | 155 (32.2%) | 326 (67.8%) |
| Total (Overall) | 1,738 (58.6%) | 1,228 (41.4%) |
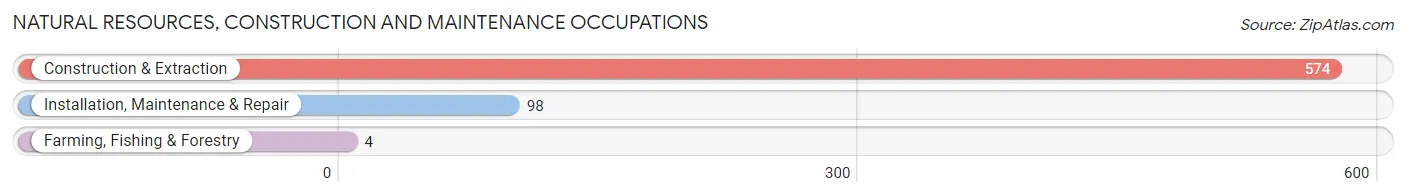
Natural Resources, Construction and Maintenance Occupations
The most common Natural Resources, Construction and Maintenance occupations in Bensley are Construction & Extraction (574 | 19.4%), Installation, Maintenance & Repair (98 | 3.3%), and Farming, Fishing & Forestry (4 | 0.1%).
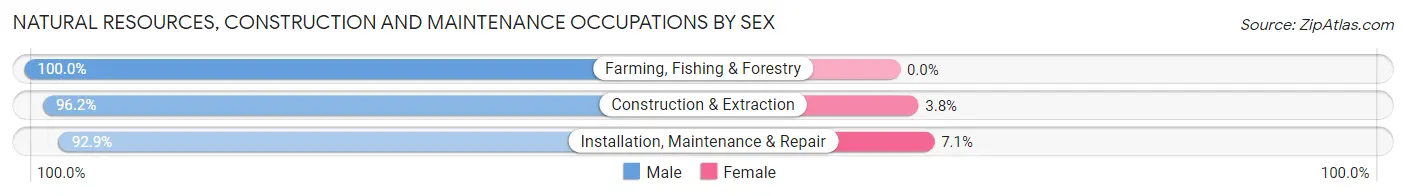
Natural Resources, Construction and Maintenance Occupations by Sex
| Occupation | Male | Female |
| Farming, Fishing & Forestry | 4 (100.0%) | 0 (0.0%) |
| Construction & Extraction | 552 (96.2%) | 22 (3.8%) |
| Installation, Maintenance & Repair | 91 (92.9%) | 7 (7.1%) |
| Total (Category) | 647 (95.7%) | 29 (4.3%) |
| Total (Overall) | 1,738 (58.6%) | 1,228 (41.4%) |
Production, Transportation and Moving Occupations
The most common Production, Transportation and Moving occupations in Bensley are Transportation (264 | 8.9%), Production (225 | 7.6%), and Material Moving (190 | 6.4%).
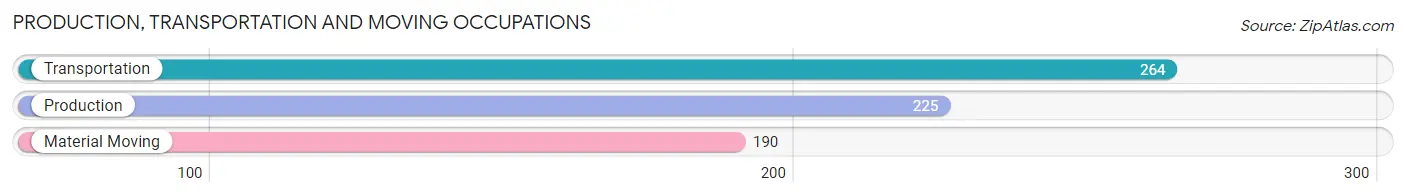
Production, Transportation and Moving Occupations by Sex
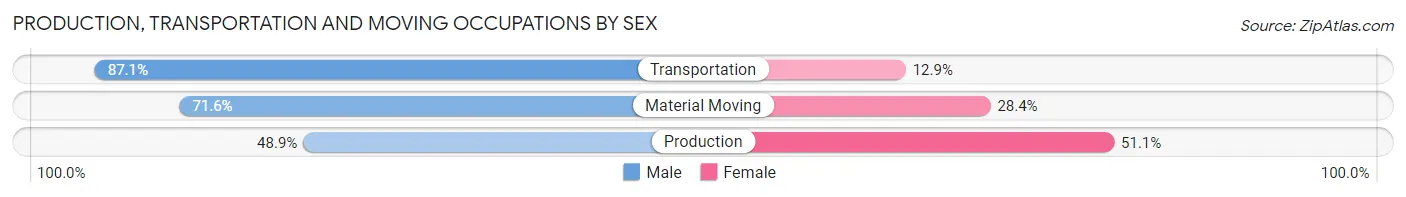
| Occupation | Male | Female |
| Production | 110 (48.9%) | 115 (51.1%) |
| Transportation | 230 (87.1%) | 34 (12.9%) |
| Material Moving | 136 (71.6%) | 54 (28.4%) |
| Total (Category) | 476 (70.1%) | 203 (29.9%) |
| Total (Overall) | 1,738 (58.6%) | 1,228 (41.4%) |
Employment Industries by Sex in Bensley
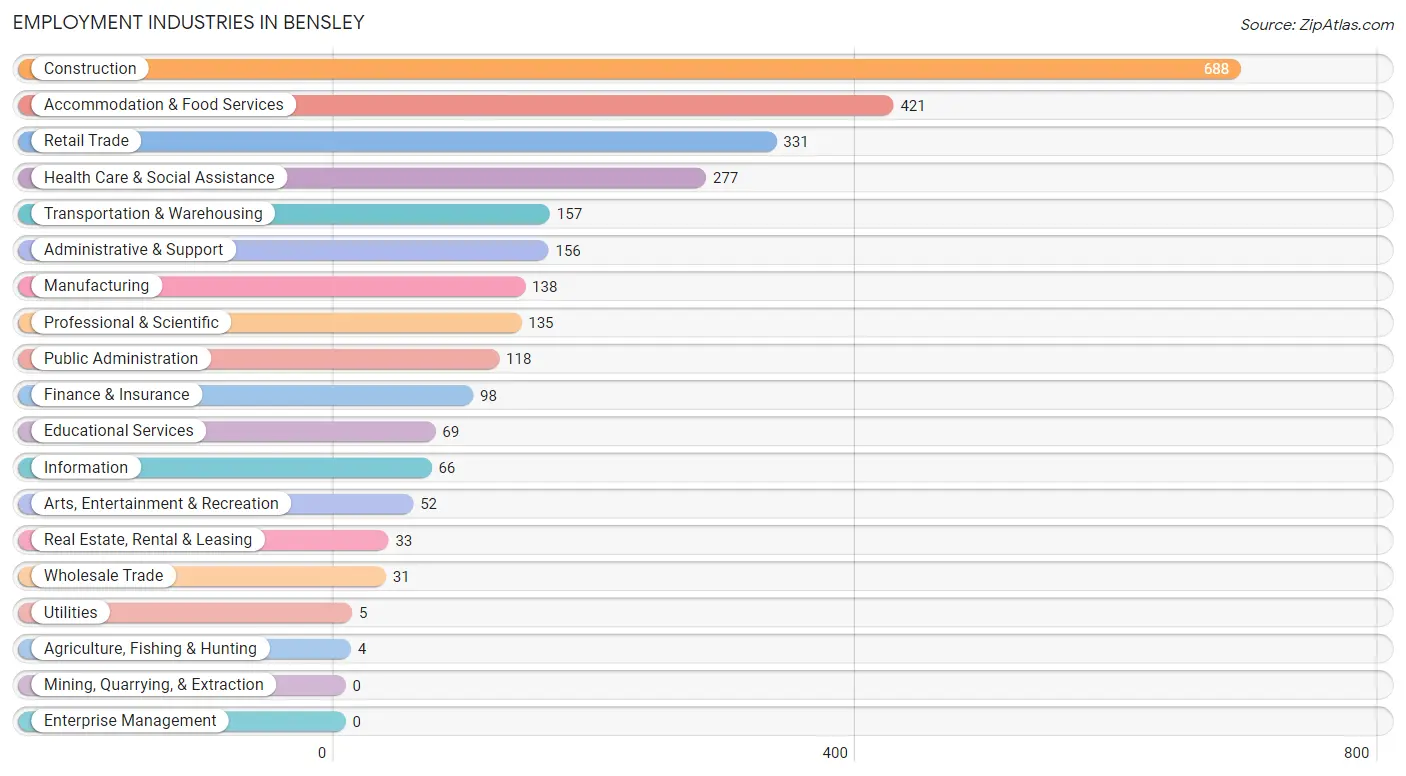
Employment Industries in Bensley
The major employment industries in Bensley include Construction (688 | 23.2%), Accommodation & Food Services (421 | 14.2%), Retail Trade (331 | 11.2%), Health Care & Social Assistance (277 | 9.3%), and Transportation & Warehousing (157 | 5.3%).
Employment Industries by Sex in Bensley
The Bensley industries that see more men than women are Agriculture, Fishing & Hunting (100.0%), Utilities (100.0%), and Construction (95.5%), whereas the industries that tend to have a higher number of women are Professional & Scientific (94.8%), Information (89.4%), and Educational Services (85.5%).
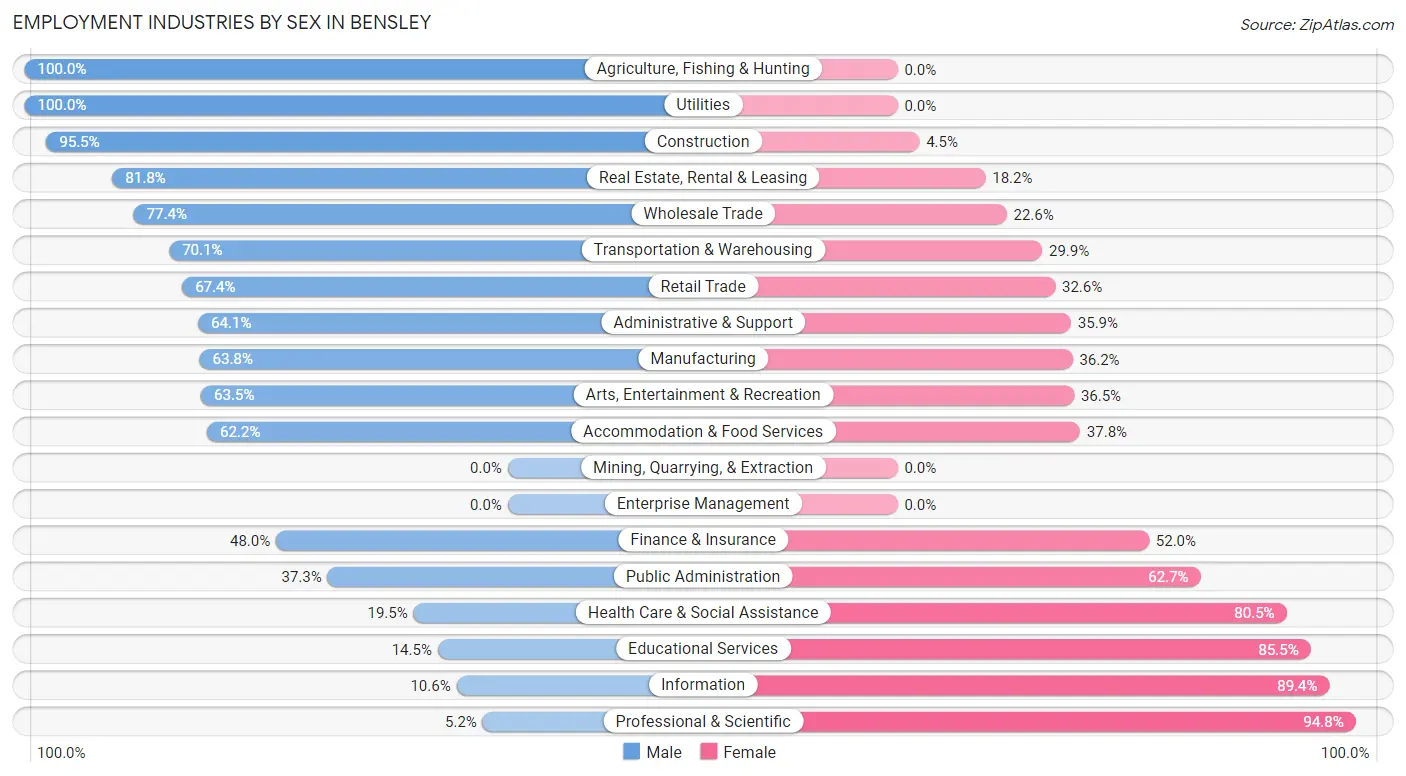
| Industry | Male | Female |
| Agriculture, Fishing & Hunting | 4 (100.0%) | 0 (0.0%) |
| Mining, Quarrying, & Extraction | 0 (0.0%) | 0 (0.0%) |
| Construction | 657 (95.5%) | 31 (4.5%) |
| Manufacturing | 88 (63.8%) | 50 (36.2%) |
| Wholesale Trade | 24 (77.4%) | 7 (22.6%) |
| Retail Trade | 223 (67.4%) | 108 (32.6%) |
| Transportation & Warehousing | 110 (70.1%) | 47 (29.9%) |
| Utilities | 5 (100.0%) | 0 (0.0%) |
| Information | 7 (10.6%) | 59 (89.4%) |
| Finance & Insurance | 47 (48.0%) | 51 (52.0%) |
| Real Estate, Rental & Leasing | 27 (81.8%) | 6 (18.2%) |
| Professional & Scientific | 7 (5.2%) | 128 (94.8%) |
| Enterprise Management | 0 (0.0%) | 0 (0.0%) |
| Administrative & Support | 100 (64.1%) | 56 (35.9%) |
| Educational Services | 10 (14.5%) | 59 (85.5%) |
| Health Care & Social Assistance | 54 (19.5%) | 223 (80.5%) |
| Arts, Entertainment & Recreation | 33 (63.5%) | 19 (36.5%) |
| Accommodation & Food Services | 262 (62.2%) | 159 (37.8%) |
| Public Administration | 44 (37.3%) | 74 (62.7%) |
| Total | 1,738 (58.6%) | 1,228 (41.4%) |
Education in Bensley
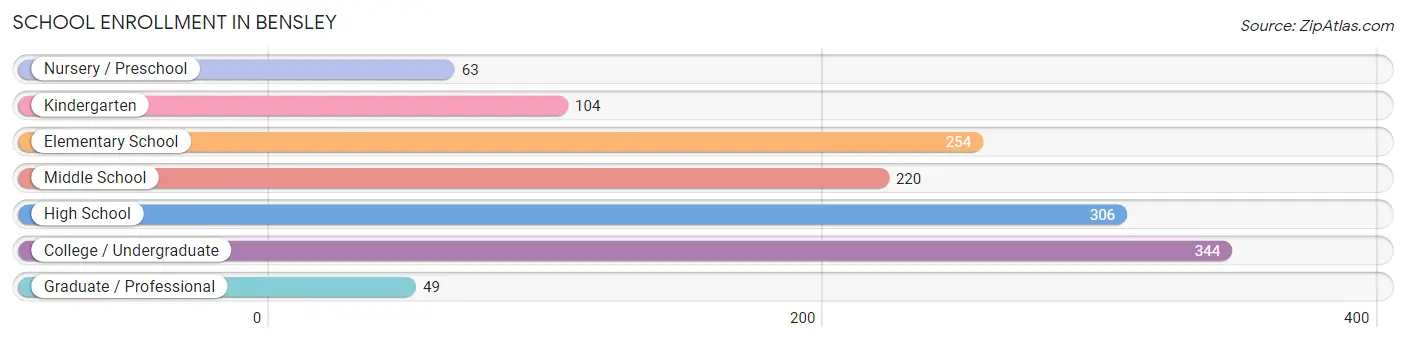
School Enrollment in Bensley
The most common levels of schooling among the 1,340 students in Bensley are college / undergraduate (344 | 25.7%), high school (306 | 22.8%), and elementary school (254 | 19.0%).
| School Level | # Students | % Students |
| Nursery / Preschool | 63 | 4.7% |
| Kindergarten | 104 | 7.8% |
| Elementary School | 254 | 19.0% |
| Middle School | 220 | 16.4% |
| High School | 306 | 22.8% |
| College / Undergraduate | 344 | 25.7% |
| Graduate / Professional | 49 | 3.7% |
| Total | 1,340 | 100.0% |
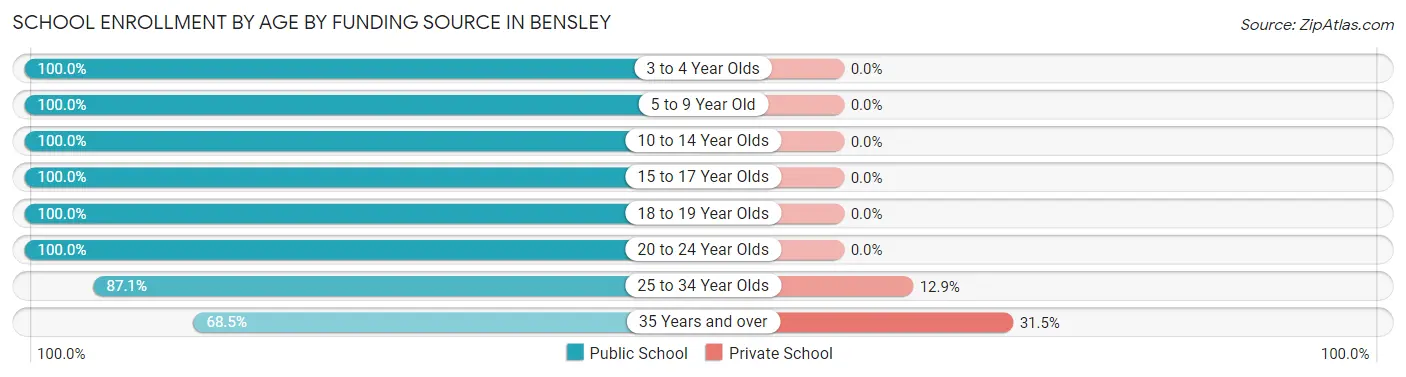
School Enrollment by Age by Funding Source in Bensley
Out of a total of 1,340 students who are enrolled in schools in Bensley, 43 (3.2%) attend a private institution, while the remaining 1,297 (96.8%) are enrolled in public schools. The age group of 35 years and over has the highest likelihood of being enrolled in private schools, with 34 (31.5% in the age bracket) enrolled. Conversely, the age group of 3 to 4 year olds has the lowest likelihood of being enrolled in a private school, with 53 (100.0% in the age bracket) attending a public institution.
| Age Bracket | Public School | Private School |
| 3 to 4 Year Olds | 53 (100.0%) | 0 (0.0%) |
| 5 to 9 Year Old | 292 (100.0%) | 0 (0.0%) |
| 10 to 14 Year Olds | 309 (100.0%) | 0 (0.0%) |
| 15 to 17 Year Olds | 293 (100.0%) | 0 (0.0%) |
| 18 to 19 Year Olds | 68 (100.0%) | 0 (0.0%) |
| 20 to 24 Year Olds | 147 (100.0%) | 0 (0.0%) |
| 25 to 34 Year Olds | 61 (87.1%) | 9 (12.9%) |
| 35 Years and over | 74 (68.5%) | 34 (31.5%) |
| Total | 1,297 (96.8%) | 43 (3.2%) |
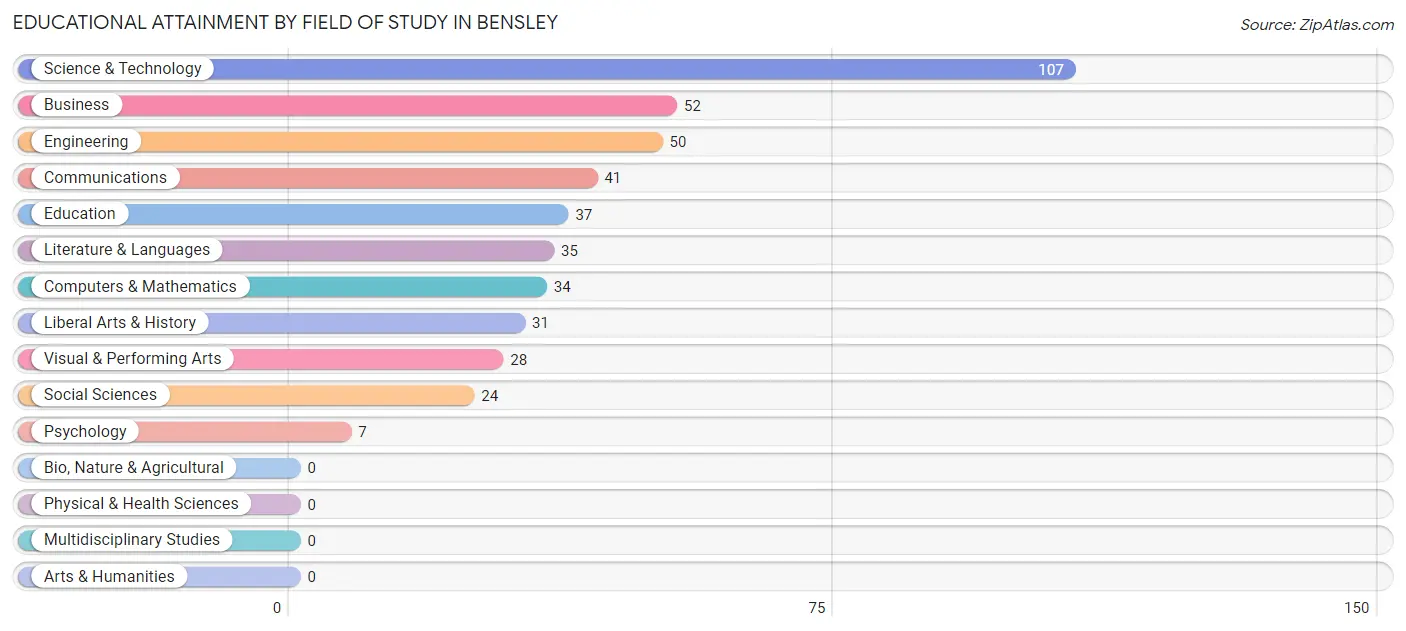
Educational Attainment by Field of Study in Bensley
Science & technology (107 | 24.0%), business (52 | 11.7%), engineering (50 | 11.2%), communications (41 | 9.2%), and education (37 | 8.3%) are the most common fields of study among 446 individuals in Bensley who have obtained a bachelor's degree or higher.
| Field of Study | # Graduates | % Graduates |
| Computers & Mathematics | 34 | 7.6% |
| Bio, Nature & Agricultural | 0 | 0.0% |
| Physical & Health Sciences | 0 | 0.0% |
| Psychology | 7 | 1.6% |
| Social Sciences | 24 | 5.4% |
| Engineering | 50 | 11.2% |
| Multidisciplinary Studies | 0 | 0.0% |
| Science & Technology | 107 | 24.0% |
| Business | 52 | 11.7% |
| Education | 37 | 8.3% |
| Literature & Languages | 35 | 7.9% |
| Liberal Arts & History | 31 | 7.0% |
| Visual & Performing Arts | 28 | 6.3% |
| Communications | 41 | 9.2% |
| Arts & Humanities | 0 | 0.0% |
| Total | 446 | 100.0% |
Transportation & Commute in Bensley
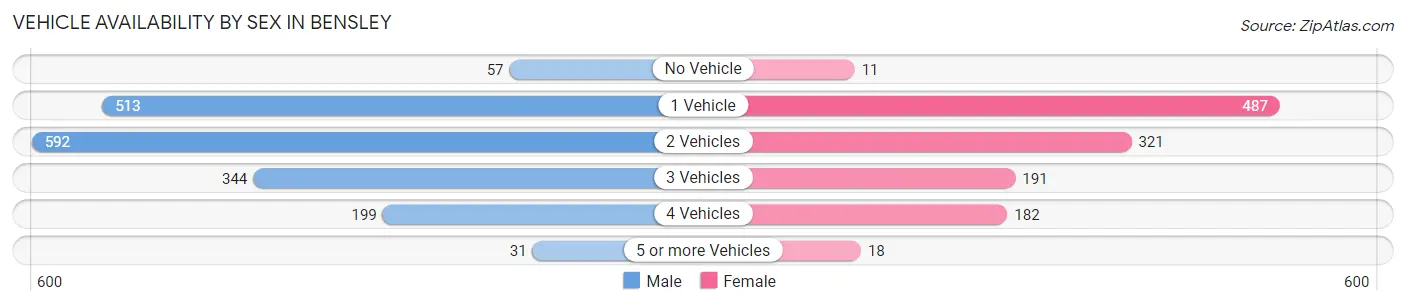
Vehicle Availability by Sex in Bensley
The most prevalent vehicle ownership categories in Bensley are males with 2 vehicles (592, accounting for 34.1%) and females with 2 vehicles (321, making up 48.9%).
| Vehicles Available | Male | Female |
| No Vehicle | 57 (3.3%) | 11 (0.9%) |
| 1 Vehicle | 513 (29.5%) | 487 (40.3%) |
| 2 Vehicles | 592 (34.1%) | 321 (26.5%) |
| 3 Vehicles | 344 (19.8%) | 191 (15.8%) |
| 4 Vehicles | 199 (11.5%) | 182 (15.0%) |
| 5 or more Vehicles | 31 (1.8%) | 18 (1.5%) |
| Total | 1,736 (100.0%) | 1,210 (100.0%) |
Commute Time in Bensley
The most frequently occuring commute durations in Bensley are 20 to 24 minutes (806 commuters, 29.2%), 15 to 19 minutes (525 commuters, 19.0%), and 30 to 34 minutes (443 commuters, 16.1%).
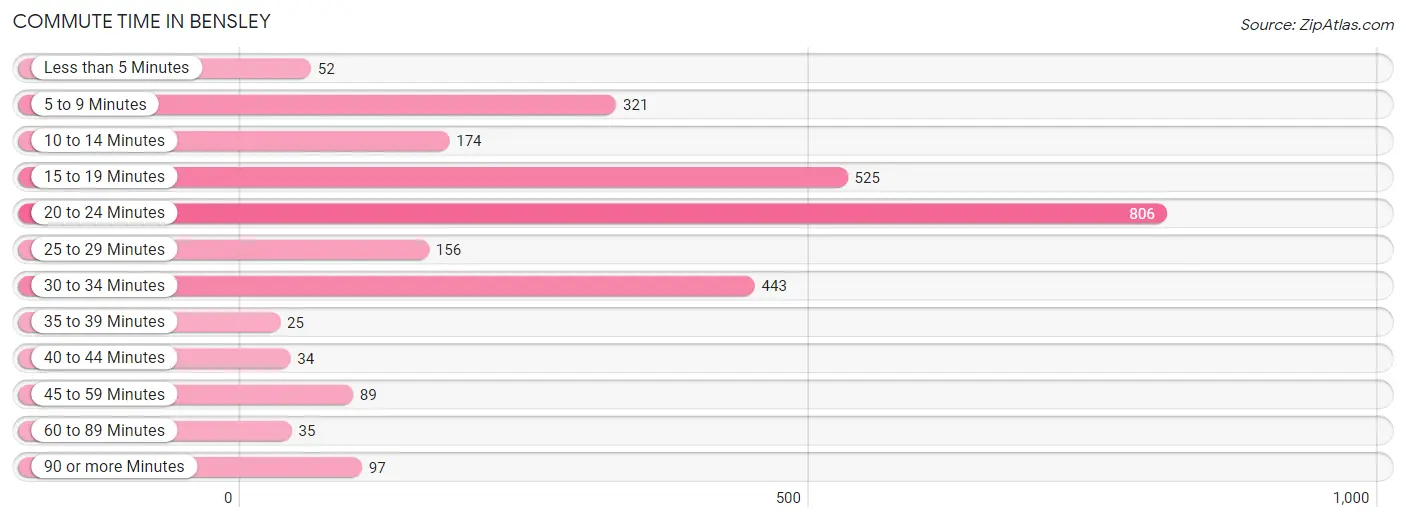
| Commute Time | # Commuters | % Commuters |
| Less than 5 Minutes | 52 | 1.9% |
| 5 to 9 Minutes | 321 | 11.6% |
| 10 to 14 Minutes | 174 | 6.3% |
| 15 to 19 Minutes | 525 | 19.0% |
| 20 to 24 Minutes | 806 | 29.2% |
| 25 to 29 Minutes | 156 | 5.7% |
| 30 to 34 Minutes | 443 | 16.1% |
| 35 to 39 Minutes | 25 | 0.9% |
| 40 to 44 Minutes | 34 | 1.2% |
| 45 to 59 Minutes | 89 | 3.2% |
| 60 to 89 Minutes | 35 | 1.3% |
| 90 or more Minutes | 97 | 3.5% |
Commute Time by Sex in Bensley
The most common commute times in Bensley are 20 to 24 minutes (509 commuters, 31.0%) for males and 20 to 24 minutes (297 commuters, 26.6%) for females.
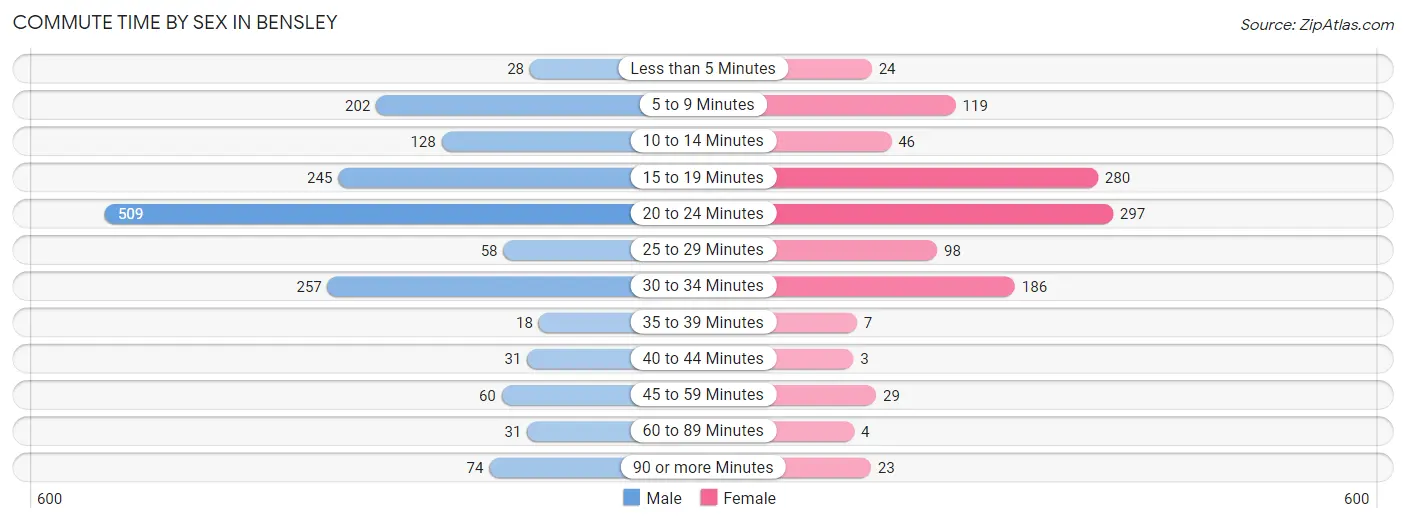
| Commute Time | Male | Female |
| Less than 5 Minutes | 28 (1.7%) | 24 (2.1%) |
| 5 to 9 Minutes | 202 (12.3%) | 119 (10.7%) |
| 10 to 14 Minutes | 128 (7.8%) | 46 (4.1%) |
| 15 to 19 Minutes | 245 (14.9%) | 280 (25.1%) |
| 20 to 24 Minutes | 509 (31.0%) | 297 (26.6%) |
| 25 to 29 Minutes | 58 (3.5%) | 98 (8.8%) |
| 30 to 34 Minutes | 257 (15.7%) | 186 (16.7%) |
| 35 to 39 Minutes | 18 (1.1%) | 7 (0.6%) |
| 40 to 44 Minutes | 31 (1.9%) | 3 (0.3%) |
| 45 to 59 Minutes | 60 (3.7%) | 29 (2.6%) |
| 60 to 89 Minutes | 31 (1.9%) | 4 (0.4%) |
| 90 or more Minutes | 74 (4.5%) | 23 (2.1%) |
Time of Departure to Work by Sex in Bensley
The most frequent times of departure to work in Bensley are 6:00 AM to 6:29 AM (262, 16.0%) for males and 8:00 AM to 8:29 AM (173, 15.5%) for females.
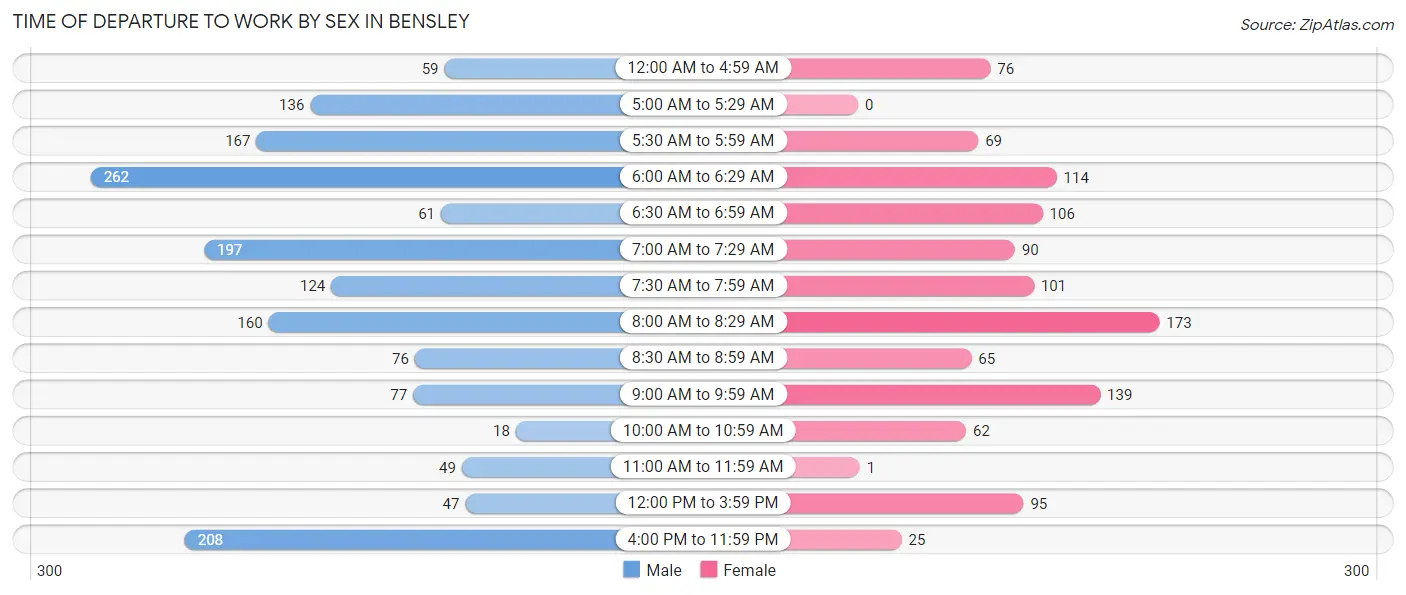
| Time of Departure | Male | Female |
| 12:00 AM to 4:59 AM | 59 (3.6%) | 76 (6.8%) |
| 5:00 AM to 5:29 AM | 136 (8.3%) | 0 (0.0%) |
| 5:30 AM to 5:59 AM | 167 (10.2%) | 69 (6.2%) |
| 6:00 AM to 6:29 AM | 262 (16.0%) | 114 (10.2%) |
| 6:30 AM to 6:59 AM | 61 (3.7%) | 106 (9.5%) |
| 7:00 AM to 7:29 AM | 197 (12.0%) | 90 (8.1%) |
| 7:30 AM to 7:59 AM | 124 (7.6%) | 101 (9.0%) |
| 8:00 AM to 8:29 AM | 160 (9.8%) | 173 (15.5%) |
| 8:30 AM to 8:59 AM | 76 (4.6%) | 65 (5.8%) |
| 9:00 AM to 9:59 AM | 77 (4.7%) | 139 (12.5%) |
| 10:00 AM to 10:59 AM | 18 (1.1%) | 62 (5.6%) |
| 11:00 AM to 11:59 AM | 49 (3.0%) | 1 (0.1%) |
| 12:00 PM to 3:59 PM | 47 (2.9%) | 95 (8.5%) |
| 4:00 PM to 11:59 PM | 208 (12.7%) | 25 (2.2%) |
| Total | 1,641 (100.0%) | 1,116 (100.0%) |
Housing Occupancy in Bensley
Occupancy by Ownership in Bensley
Of the total 2,250 dwellings in Bensley, owner-occupied units account for 881 (39.2%), while renter-occupied units make up 1,369 (60.8%).
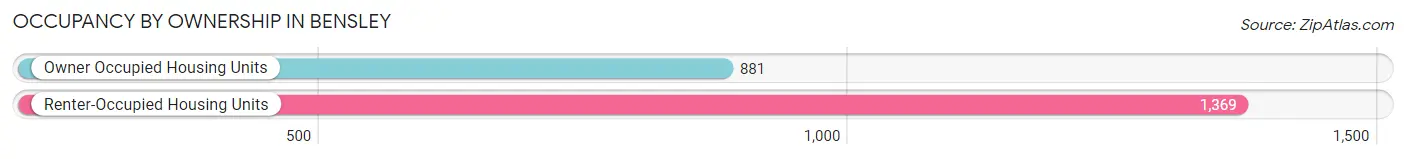
| Occupancy | # Housing Units | % Housing Units |
| Owner Occupied Housing Units | 881 | 39.2% |
| Renter-Occupied Housing Units | 1,369 | 60.8% |
| Total Occupied Housing Units | 2,250 | 100.0% |
Occupancy by Household Size in Bensley
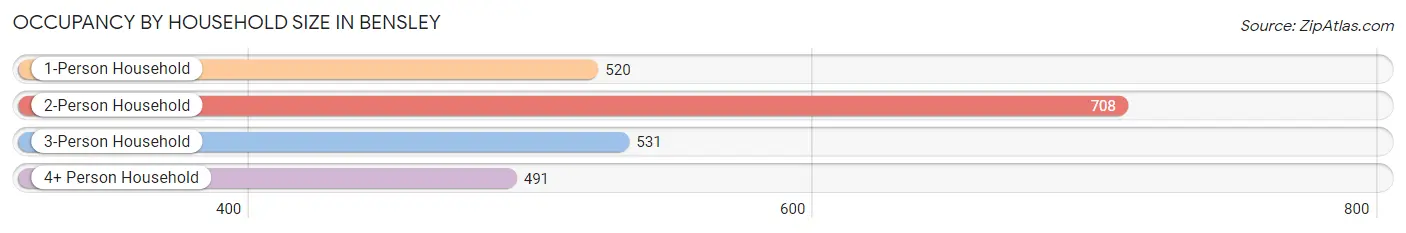
| Household Size | # Housing Units | % Housing Units |
| 1-Person Household | 520 | 23.1% |
| 2-Person Household | 708 | 31.5% |
| 3-Person Household | 531 | 23.6% |
| 4+ Person Household | 491 | 21.8% |
| Total Housing Units | 2,250 | 100.0% |
Occupancy by Ownership by Household Size in Bensley
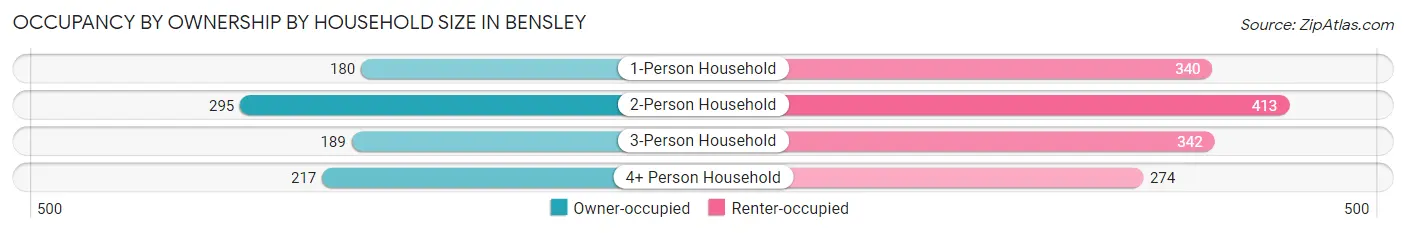
| Household Size | Owner-occupied | Renter-occupied |
| 1-Person Household | 180 (34.6%) | 340 (65.4%) |
| 2-Person Household | 295 (41.7%) | 413 (58.3%) |
| 3-Person Household | 189 (35.6%) | 342 (64.4%) |
| 4+ Person Household | 217 (44.2%) | 274 (55.8%) |
| Total Housing Units | 881 (39.2%) | 1,369 (60.8%) |
Occupancy by Educational Attainment in Bensley
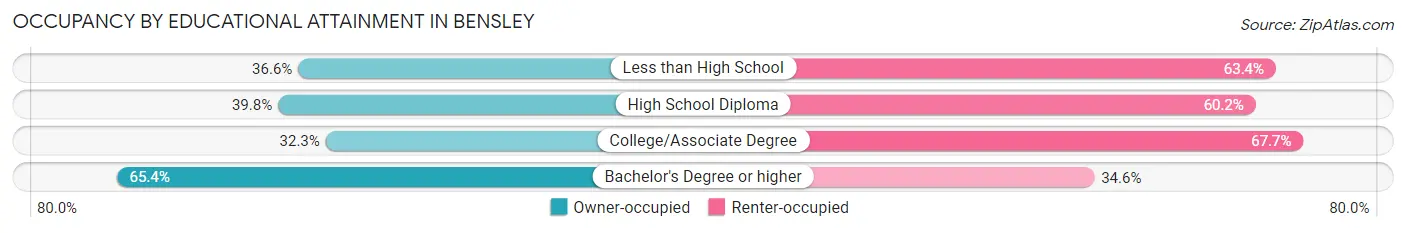
| Household Size | Owner-occupied | Renter-occupied |
| Less than High School | 201 (36.6%) | 348 (63.4%) |
| High School Diploma | 369 (39.8%) | 558 (60.2%) |
| College/Associate Degree | 190 (32.3%) | 399 (67.7%) |
| Bachelor's Degree or higher | 121 (65.4%) | 64 (34.6%) |
Occupancy by Age of Householder in Bensley
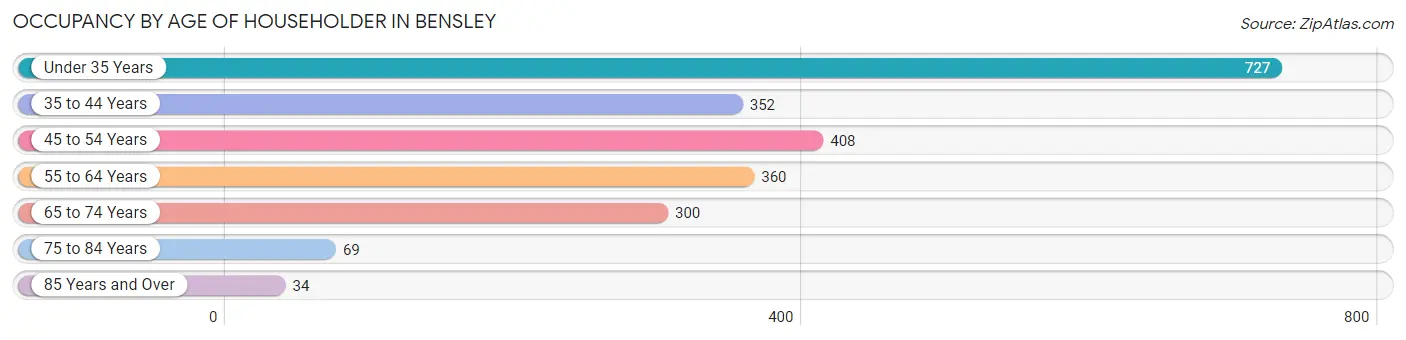
| Age Bracket | # Households | % Households |
| Under 35 Years | 727 | 32.3% |
| 35 to 44 Years | 352 | 15.6% |
| 45 to 54 Years | 408 | 18.1% |
| 55 to 64 Years | 360 | 16.0% |
| 65 to 74 Years | 300 | 13.3% |
| 75 to 84 Years | 69 | 3.1% |
| 85 Years and Over | 34 | 1.5% |
| Total | 2,250 | 100.0% |
Housing Finances in Bensley
Median Income by Occupancy in Bensley
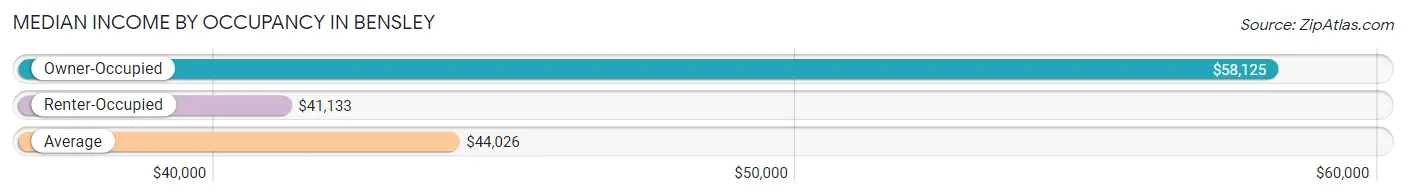
| Occupancy Type | # Households | Median Income |
| Owner-Occupied | 881 (39.2%) | $58,125 |
| Renter-Occupied | 1,369 (60.8%) | $41,133 |
| Average | 2,250 (100.0%) | $44,026 |
Occupancy by Householder Income Bracket in Bensley
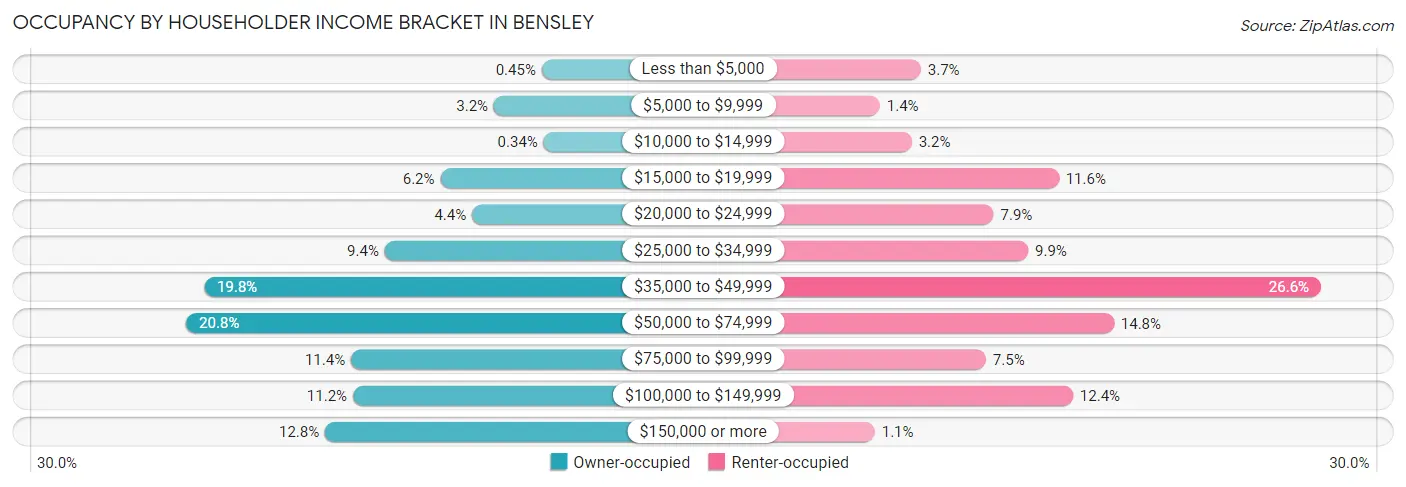
| Income Bracket | Owner-occupied | Renter-occupied |
| Less than $5,000 | 4 (0.4%) | 51 (3.7%) |
| $5,000 to $9,999 | 28 (3.2%) | 19 (1.4%) |
| $10,000 to $14,999 | 3 (0.3%) | 44 (3.2%) |
| $15,000 to $19,999 | 55 (6.2%) | 159 (11.6%) |
| $20,000 to $24,999 | 39 (4.4%) | 108 (7.9%) |
| $25,000 to $34,999 | 83 (9.4%) | 135 (9.9%) |
| $35,000 to $49,999 | 174 (19.8%) | 364 (26.6%) |
| $50,000 to $74,999 | 183 (20.8%) | 202 (14.8%) |
| $75,000 to $99,999 | 100 (11.4%) | 102 (7.4%) |
| $100,000 to $149,999 | 99 (11.2%) | 170 (12.4%) |
| $150,000 or more | 113 (12.8%) | 15 (1.1%) |
| Total | 881 (100.0%) | 1,369 (100.0%) |
Monthly Housing Cost Tiers in Bensley
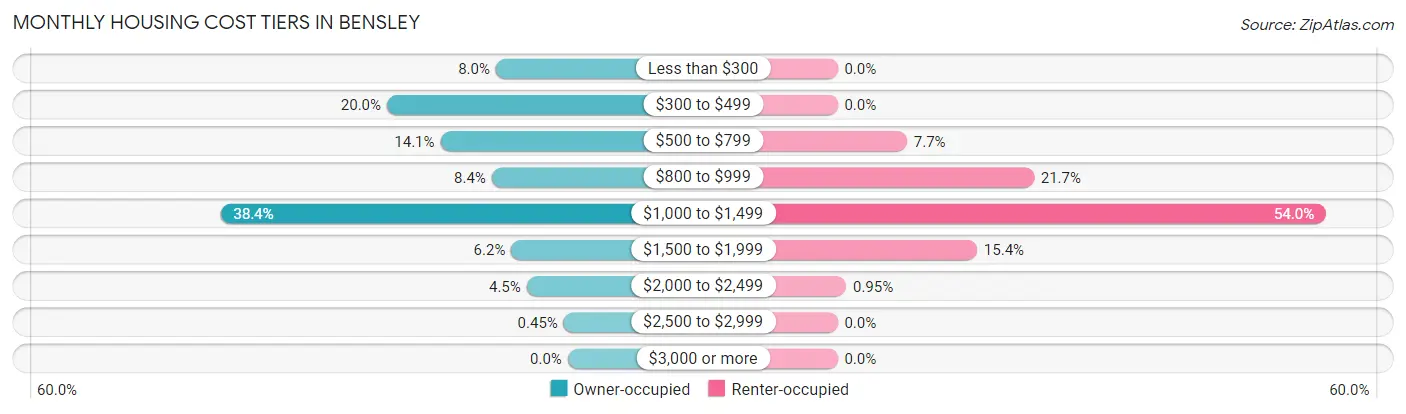
| Monthly Cost | Owner-occupied | Renter-occupied |
| Less than $300 | 70 (8.0%) | 0 (0.0%) |
| $300 to $499 | 176 (20.0%) | 0 (0.0%) |
| $500 to $799 | 124 (14.1%) | 105 (7.7%) |
| $800 to $999 | 74 (8.4%) | 297 (21.7%) |
| $1,000 to $1,499 | 338 (38.4%) | 739 (54.0%) |
| $1,500 to $1,999 | 55 (6.2%) | 211 (15.4%) |
| $2,000 to $2,499 | 40 (4.5%) | 13 (0.9%) |
| $2,500 to $2,999 | 4 (0.4%) | 0 (0.0%) |
| $3,000 or more | 0 (0.0%) | 0 (0.0%) |
| Total | 881 (100.0%) | 1,369 (100.0%) |
Physical Housing Characteristics in Bensley
Housing Structures in Bensley
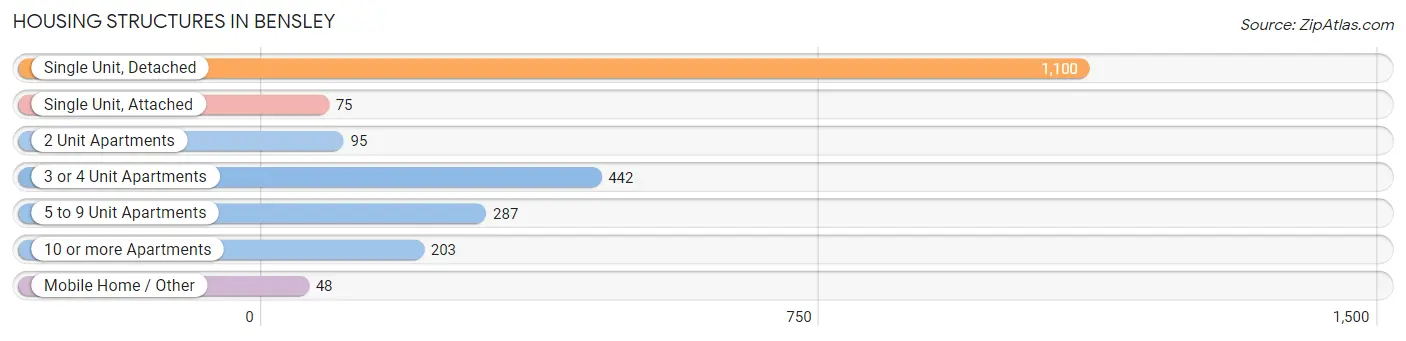
| Structure Type | # Housing Units | % Housing Units |
| Single Unit, Detached | 1,100 | 48.9% |
| Single Unit, Attached | 75 | 3.3% |
| 2 Unit Apartments | 95 | 4.2% |
| 3 or 4 Unit Apartments | 442 | 19.6% |
| 5 to 9 Unit Apartments | 287 | 12.8% |
| 10 or more Apartments | 203 | 9.0% |
| Mobile Home / Other | 48 | 2.1% |
| Total | 2,250 | 100.0% |
Housing Structures by Occupancy in Bensley
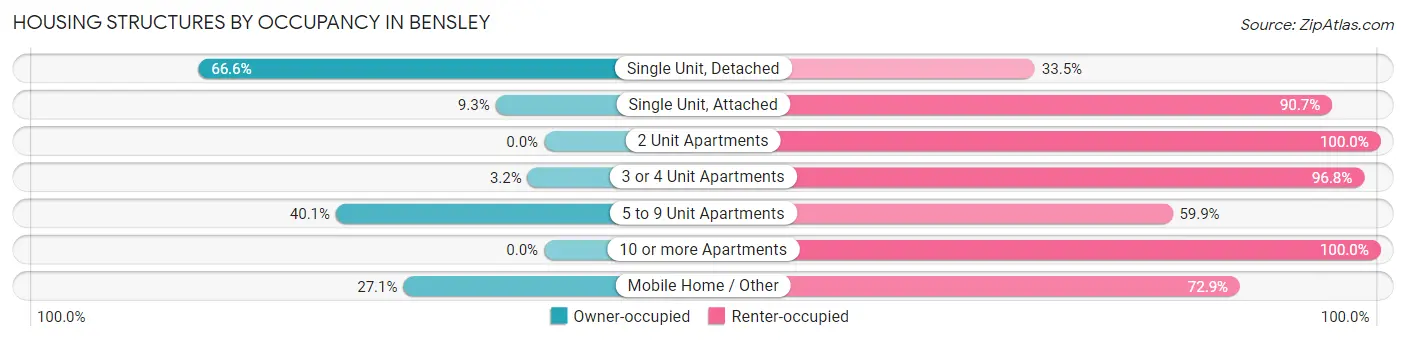
| Structure Type | Owner-occupied | Renter-occupied |
| Single Unit, Detached | 732 (66.5%) | 368 (33.5%) |
| Single Unit, Attached | 7 (9.3%) | 68 (90.7%) |
| 2 Unit Apartments | 0 (0.0%) | 95 (100.0%) |
| 3 or 4 Unit Apartments | 14 (3.2%) | 428 (96.8%) |
| 5 to 9 Unit Apartments | 115 (40.1%) | 172 (59.9%) |
| 10 or more Apartments | 0 (0.0%) | 203 (100.0%) |
| Mobile Home / Other | 13 (27.1%) | 35 (72.9%) |
| Total | 881 (39.2%) | 1,369 (60.8%) |
Housing Structures by Number of Rooms in Bensley
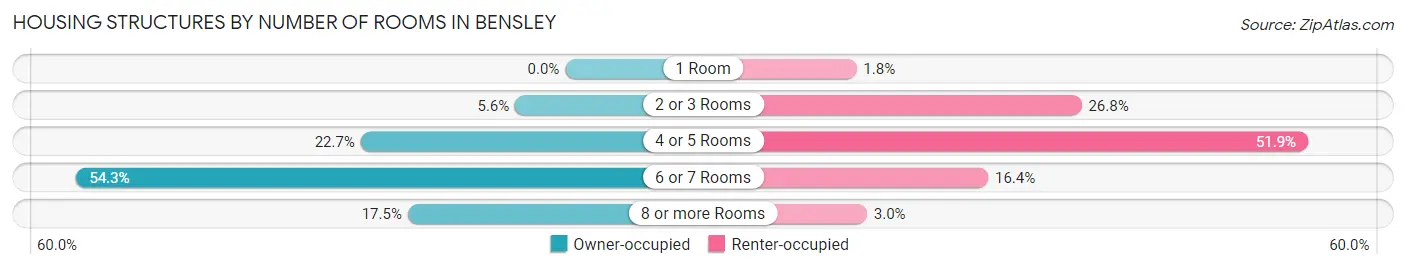
| Number of Rooms | Owner-occupied | Renter-occupied |
| 1 Room | 0 (0.0%) | 25 (1.8%) |
| 2 or 3 Rooms | 49 (5.6%) | 367 (26.8%) |
| 4 or 5 Rooms | 200 (22.7%) | 711 (51.9%) |
| 6 or 7 Rooms | 478 (54.3%) | 225 (16.4%) |
| 8 or more Rooms | 154 (17.5%) | 41 (3.0%) |
| Total | 881 (100.0%) | 1,369 (100.0%) |
Housing Structure by Heating Type in Bensley
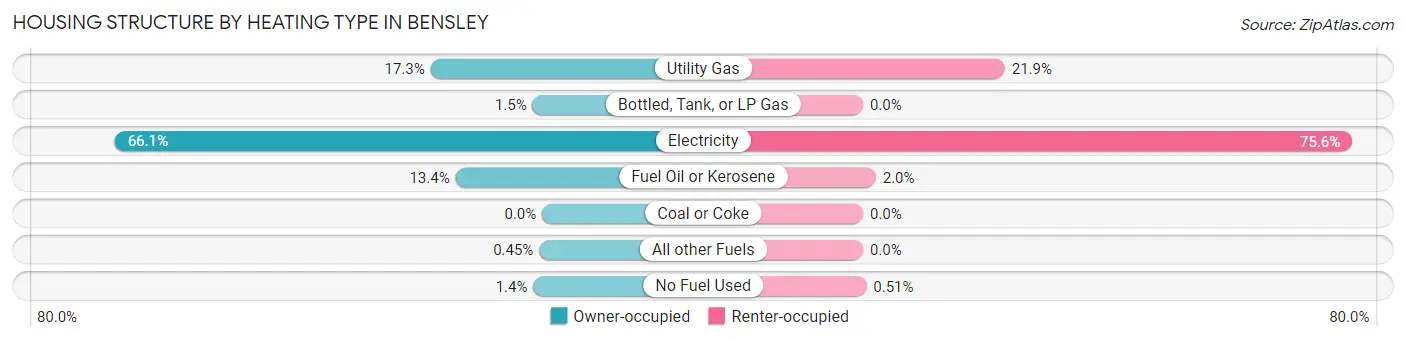
| Heating Type | Owner-occupied | Renter-occupied |
| Utility Gas | 152 (17.2%) | 300 (21.9%) |
| Bottled, Tank, or LP Gas | 13 (1.5%) | 0 (0.0%) |
| Electricity | 582 (66.1%) | 1,035 (75.6%) |
| Fuel Oil or Kerosene | 118 (13.4%) | 27 (2.0%) |
| Coal or Coke | 0 (0.0%) | 0 (0.0%) |
| All other Fuels | 4 (0.4%) | 0 (0.0%) |
| No Fuel Used | 12 (1.4%) | 7 (0.5%) |
| Total | 881 (100.0%) | 1,369 (100.0%) |
Household Vehicle Usage in Bensley
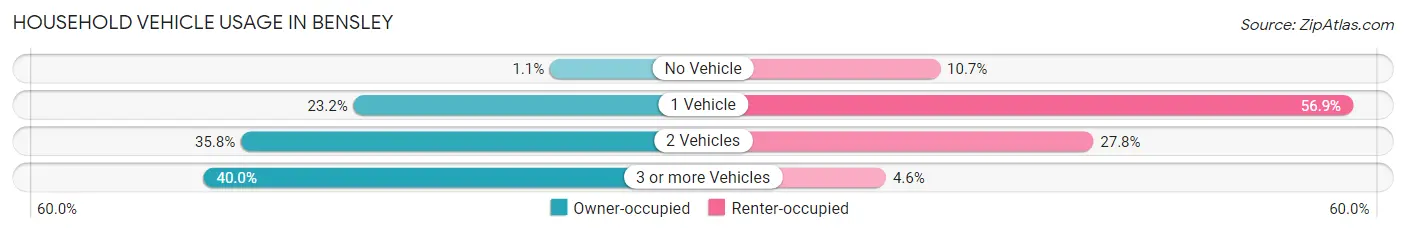
| Vehicles per Household | Owner-occupied | Renter-occupied |
| No Vehicle | 10 (1.1%) | 146 (10.7%) |
| 1 Vehicle | 204 (23.2%) | 779 (56.9%) |
| 2 Vehicles | 315 (35.7%) | 381 (27.8%) |
| 3 or more Vehicles | 352 (40.0%) | 63 (4.6%) |
| Total | 881 (100.0%) | 1,369 (100.0%) |
Real Estate & Mortgages in Bensley
Real Estate and Mortgage Overview in Bensley
| Characteristic | Without Mortgage | With Mortgage |
| Housing Units | 365 | 516 |
| Median Property Value | $169,000 | $179,400 |
| Median Household Income | $48,304 | $81 |
| Monthly Housing Costs | $455 | $0 |
| Real Estate Taxes | $1,654 | $10 |
Property Value by Mortgage Status in Bensley
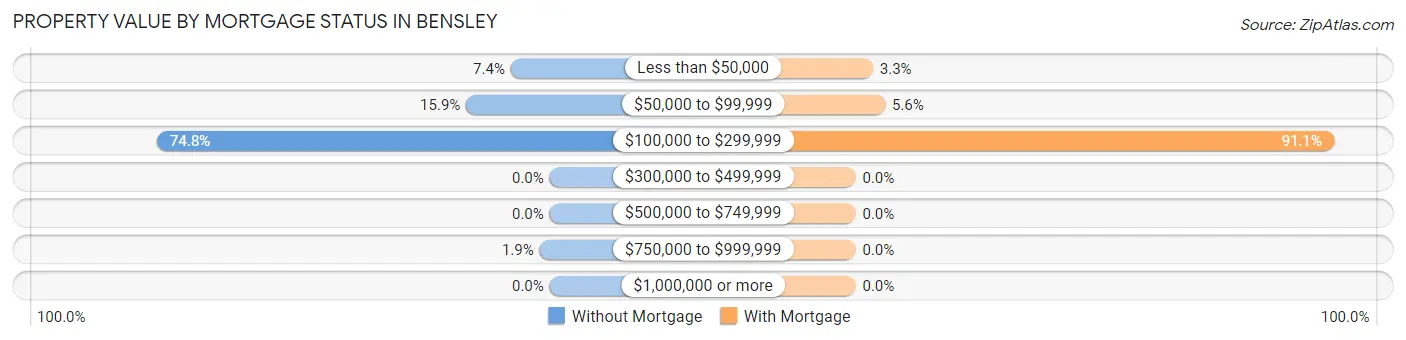
| Property Value | Without Mortgage | With Mortgage |
| Less than $50,000 | 27 (7.4%) | 17 (3.3%) |
| $50,000 to $99,999 | 58 (15.9%) | 29 (5.6%) |
| $100,000 to $299,999 | 273 (74.8%) | 470 (91.1%) |
| $300,000 to $499,999 | 0 (0.0%) | 0 (0.0%) |
| $500,000 to $749,999 | 0 (0.0%) | 0 (0.0%) |
| $750,000 to $999,999 | 7 (1.9%) | 0 (0.0%) |
| $1,000,000 or more | 0 (0.0%) | 0 (0.0%) |
| Total | 365 (100.0%) | 516 (100.0%) |
Household Income by Mortgage Status in Bensley
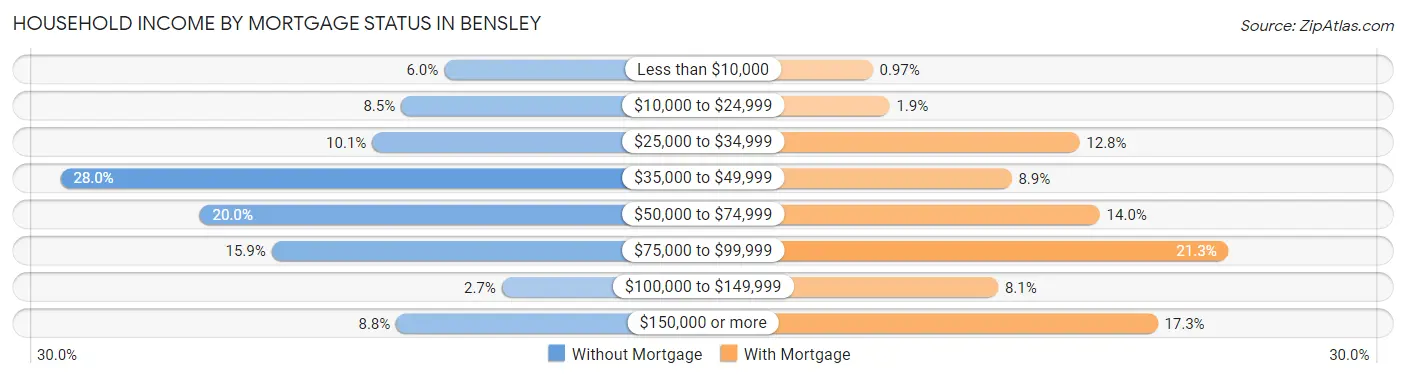
| Household Income | Without Mortgage | With Mortgage |
| Less than $10,000 | 22 (6.0%) | 5 (1.0%) |
| $10,000 to $24,999 | 31 (8.5%) | 10 (1.9%) |
| $25,000 to $34,999 | 37 (10.1%) | 66 (12.8%) |
| $35,000 to $49,999 | 102 (28.0%) | 46 (8.9%) |
| $50,000 to $74,999 | 73 (20.0%) | 72 (14.0%) |
| $75,000 to $99,999 | 58 (15.9%) | 110 (21.3%) |
| $100,000 to $149,999 | 10 (2.7%) | 42 (8.1%) |
| $150,000 or more | 32 (8.8%) | 89 (17.2%) |
| Total | 365 (100.0%) | 516 (100.0%) |
Property Value to Household Income Ratio in Bensley
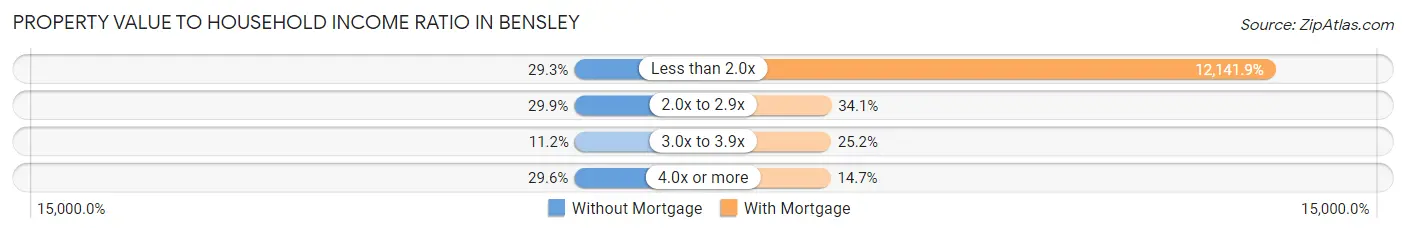
| Value-to-Income Ratio | Without Mortgage | With Mortgage |
| Less than 2.0x | 107 (29.3%) | 62,652 (12,141.9%) |
| 2.0x to 2.9x | 109 (29.9%) | 176 (34.1%) |
| 3.0x to 3.9x | 41 (11.2%) | 130 (25.2%) |
| 4.0x or more | 108 (29.6%) | 76 (14.7%) |
| Total | 365 (100.0%) | 516 (100.0%) |
Real Estate Taxes by Mortgage Status in Bensley
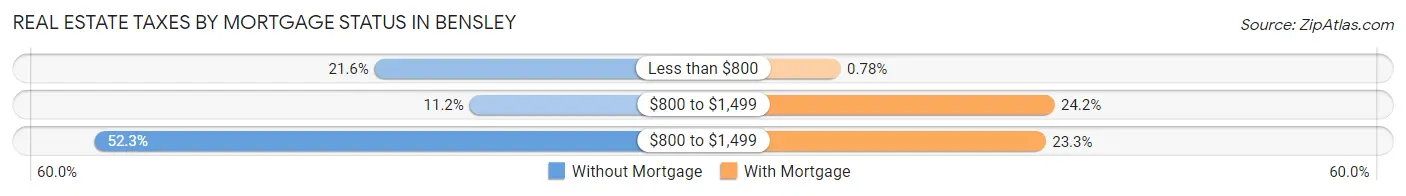
| Property Taxes | Without Mortgage | With Mortgage |
| Less than $800 | 79 (21.6%) | 4 (0.8%) |
| $800 to $1,499 | 41 (11.2%) | 125 (24.2%) |
| $800 to $1,499 | 191 (52.3%) | 120 (23.3%) |
| Total | 365 (100.0%) | 516 (100.0%) |
Health & Disability in Bensley
Health Insurance Coverage by Age in Bensley
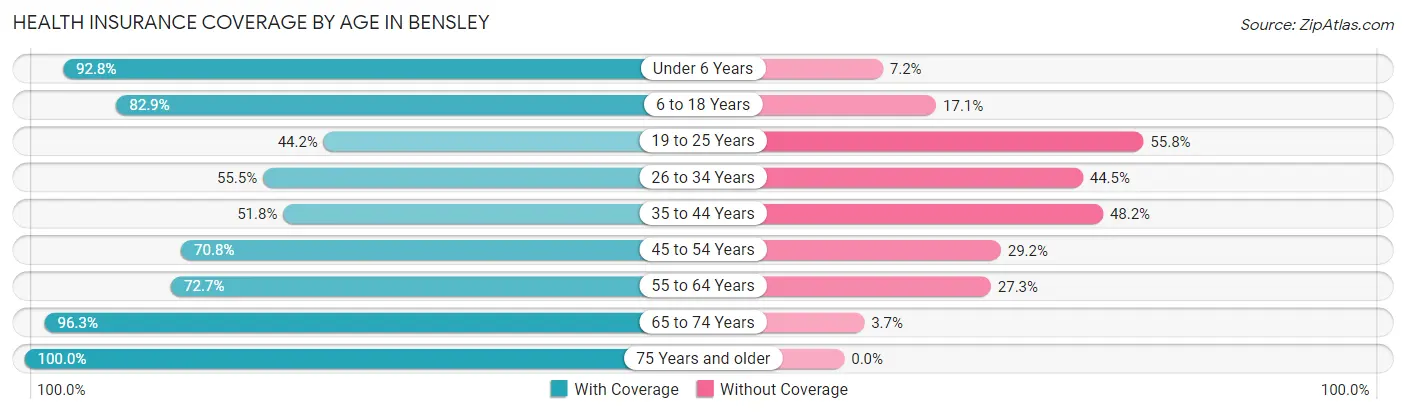
| Age Bracket | With Coverage | Without Coverage |
| Under 6 Years | 529 (92.8%) | 41 (7.2%) |
| 6 to 18 Years | 784 (82.9%) | 162 (17.1%) |
| 19 to 25 Years | 367 (44.2%) | 463 (55.8%) |
| 26 to 34 Years | 653 (55.5%) | 523 (44.5%) |
| 35 to 44 Years | 336 (51.8%) | 313 (48.2%) |
| 45 to 54 Years | 461 (70.8%) | 190 (29.2%) |
| 55 to 64 Years | 460 (72.7%) | 173 (27.3%) |
| 65 to 74 Years | 388 (96.3%) | 15 (3.7%) |
| 75 Years and older | 174 (100.0%) | 0 (0.0%) |
| Total | 4,152 (68.8%) | 1,880 (31.2%) |
Health Insurance Coverage by Citizenship Status in Bensley
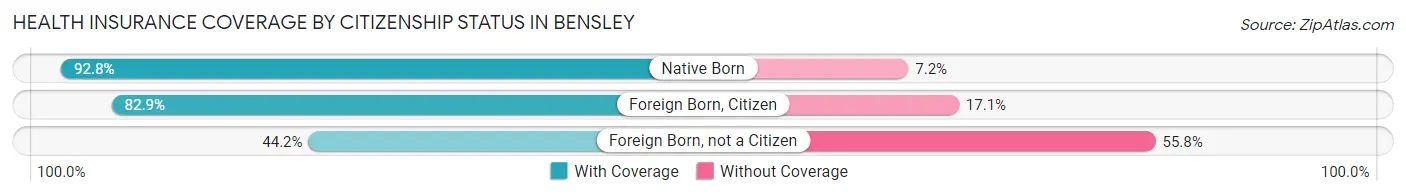
| Citizenship Status | With Coverage | Without Coverage |
| Native Born | 529 (92.8%) | 41 (7.2%) |
| Foreign Born, Citizen | 784 (82.9%) | 162 (17.1%) |
| Foreign Born, not a Citizen | 367 (44.2%) | 463 (55.8%) |
Health Insurance Coverage by Household Income in Bensley
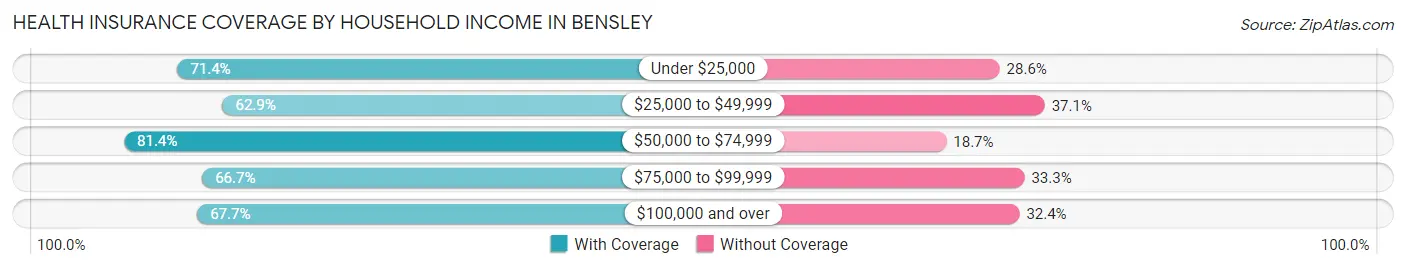
| Household Income | With Coverage | Without Coverage |
| Under $25,000 | 892 (71.4%) | 358 (28.6%) |
| $25,000 to $49,999 | 1,138 (62.9%) | 671 (37.1%) |
| $50,000 to $74,999 | 698 (81.4%) | 160 (18.6%) |
| $75,000 to $99,999 | 485 (66.7%) | 242 (33.3%) |
| $100,000 and over | 939 (67.6%) | 449 (32.4%) |
Public vs Private Health Insurance Coverage by Age in Bensley
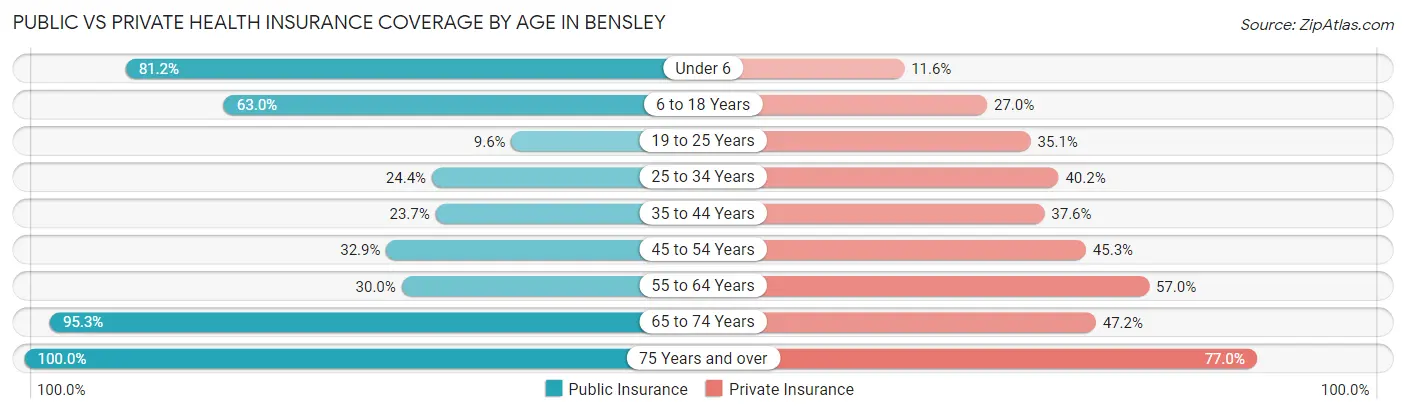
| Age Bracket | Public Insurance | Private Insurance |
| Under 6 | 463 (81.2%) | 66 (11.6%) |
| 6 to 18 Years | 596 (63.0%) | 255 (27.0%) |
| 19 to 25 Years | 80 (9.6%) | 291 (35.1%) |
| 25 to 34 Years | 287 (24.4%) | 473 (40.2%) |
| 35 to 44 Years | 154 (23.7%) | 244 (37.6%) |
| 45 to 54 Years | 214 (32.9%) | 295 (45.3%) |
| 55 to 64 Years | 190 (30.0%) | 361 (57.0%) |
| 65 to 74 Years | 384 (95.3%) | 190 (47.1%) |
| 75 Years and over | 174 (100.0%) | 134 (77.0%) |
| Total | 2,542 (42.1%) | 2,309 (38.3%) |
Disability Status by Sex by Age in Bensley
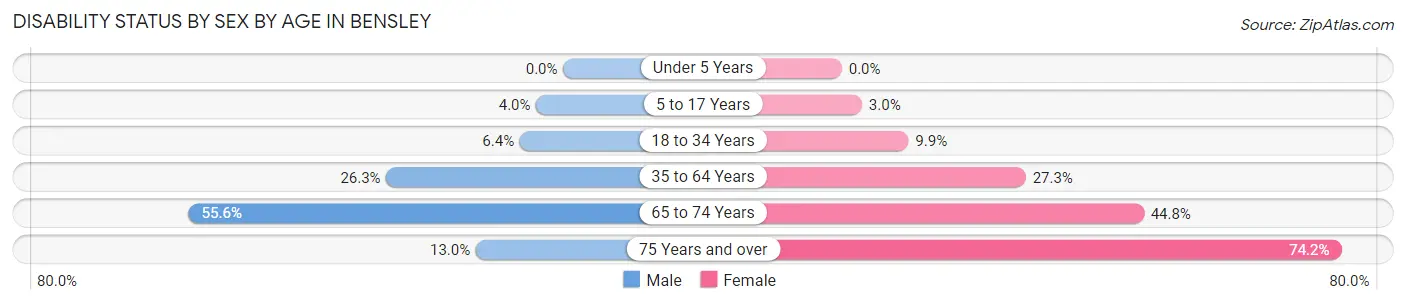
| Age Bracket | Male | Female |
| Under 5 Years | 0 (0.0%) | 0 (0.0%) |
| 5 to 17 Years | 18 (4.0%) | 15 (3.0%) |
| 18 to 34 Years | 66 (6.4%) | 104 (9.9%) |
| 35 to 64 Years | 249 (26.3%) | 269 (27.3%) |
| 65 to 74 Years | 79 (55.6%) | 117 (44.8%) |
| 75 Years and over | 7 (13.0%) | 89 (74.2%) |
Disability Class by Sex by Age in Bensley
Disability Class: Hearing Difficulty
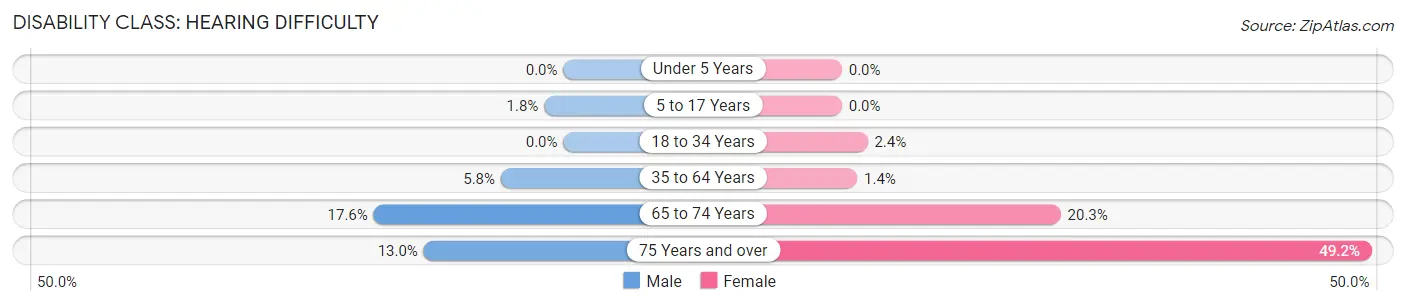
| Age Bracket | Male | Female |
| Under 5 Years | 0 (0.0%) | 0 (0.0%) |
| 5 to 17 Years | 8 (1.8%) | 0 (0.0%) |
| 18 to 34 Years | 0 (0.0%) | 25 (2.4%) |
| 35 to 64 Years | 55 (5.8%) | 14 (1.4%) |
| 65 to 74 Years | 25 (17.6%) | 53 (20.3%) |
| 75 Years and over | 7 (13.0%) | 59 (49.2%) |
Disability Class: Vision Difficulty
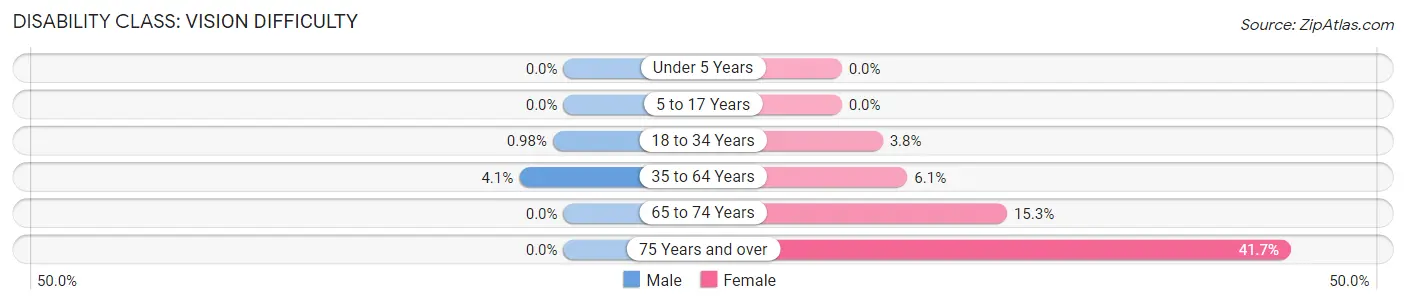
| Age Bracket | Male | Female |
| Under 5 Years | 0 (0.0%) | 0 (0.0%) |
| 5 to 17 Years | 0 (0.0%) | 0 (0.0%) |
| 18 to 34 Years | 10 (1.0%) | 40 (3.8%) |
| 35 to 64 Years | 39 (4.1%) | 60 (6.1%) |
| 65 to 74 Years | 0 (0.0%) | 40 (15.3%) |
| 75 Years and over | 0 (0.0%) | 50 (41.7%) |
Disability Class: Cognitive Difficulty
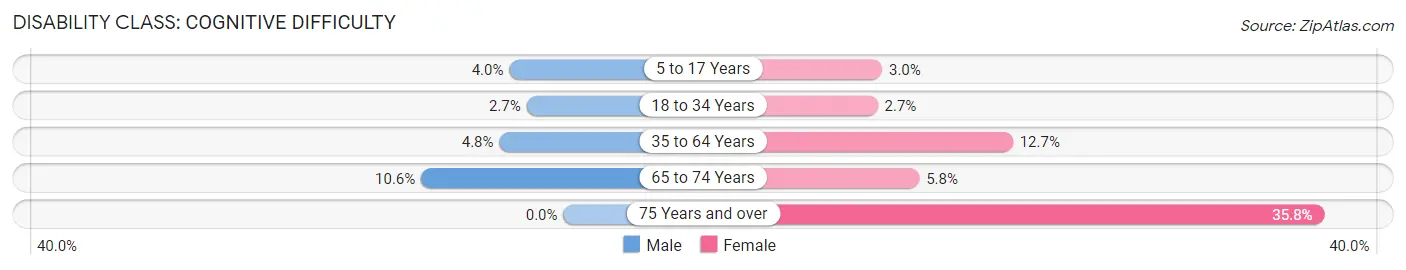
| Age Bracket | Male | Female |
| 5 to 17 Years | 18 (4.0%) | 15 (3.0%) |
| 18 to 34 Years | 28 (2.7%) | 28 (2.7%) |
| 35 to 64 Years | 45 (4.8%) | 125 (12.7%) |
| 65 to 74 Years | 15 (10.6%) | 15 (5.8%) |
| 75 Years and over | 0 (0.0%) | 43 (35.8%) |
Disability Class: Ambulatory Difficulty
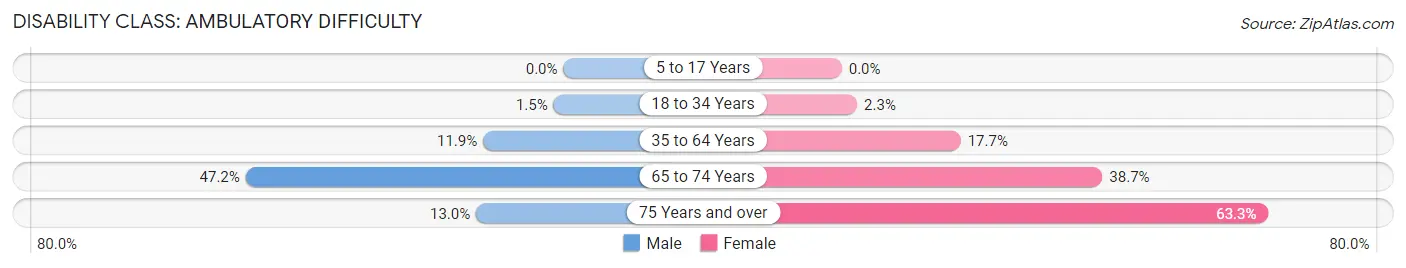
| Age Bracket | Male | Female |
| 5 to 17 Years | 0 (0.0%) | 0 (0.0%) |
| 18 to 34 Years | 15 (1.5%) | 24 (2.3%) |
| 35 to 64 Years | 113 (11.9%) | 174 (17.7%) |
| 65 to 74 Years | 67 (47.2%) | 101 (38.7%) |
| 75 Years and over | 7 (13.0%) | 76 (63.3%) |
Disability Class: Self-Care Difficulty
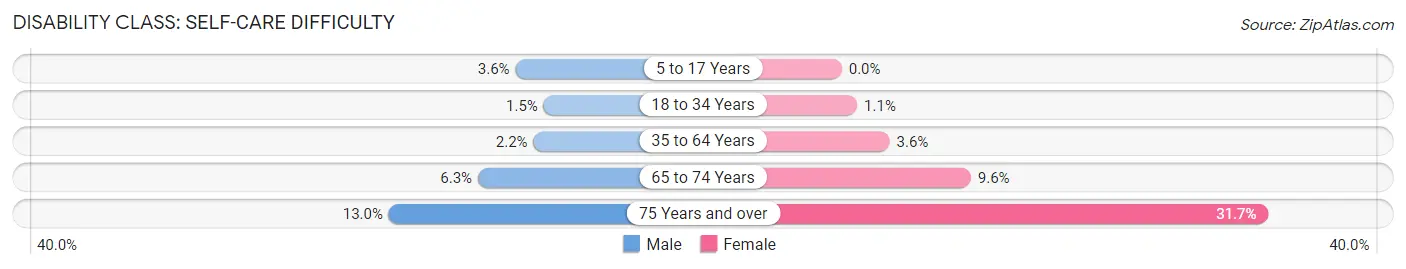
| Age Bracket | Male | Female |
| 5 to 17 Years | 16 (3.6%) | 0 (0.0%) |
| 18 to 34 Years | 15 (1.5%) | 12 (1.1%) |
| 35 to 64 Years | 21 (2.2%) | 35 (3.5%) |
| 65 to 74 Years | 9 (6.3%) | 25 (9.6%) |
| 75 Years and over | 7 (13.0%) | 38 (31.7%) |
Technology Access in Bensley
Computing Device Access in Bensley
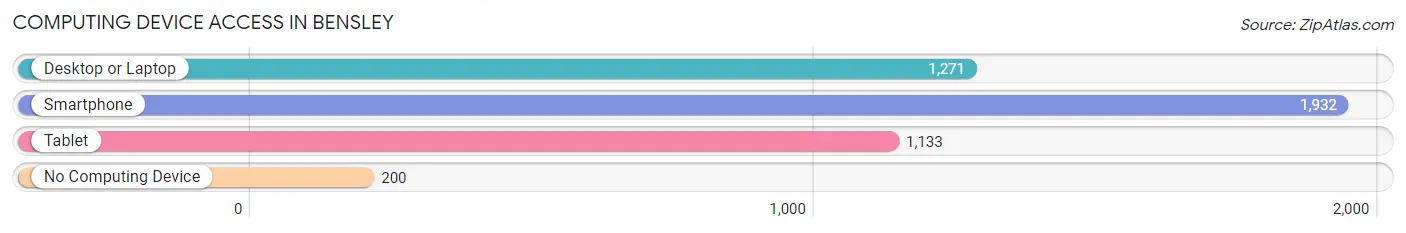
| Device Type | # Households | % Households |
| Desktop or Laptop | 1,271 | 56.5% |
| Smartphone | 1,932 | 85.9% |
| Tablet | 1,133 | 50.4% |
| No Computing Device | 200 | 8.9% |
| Total | 2,250 | 100.0% |
Internet Access in Bensley
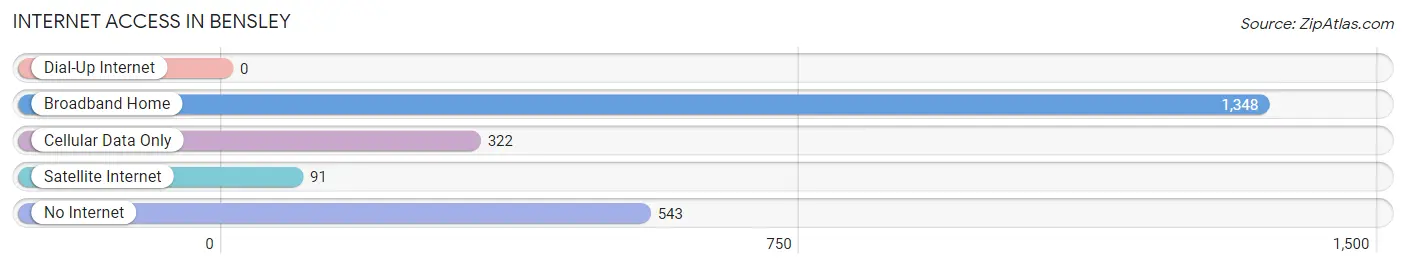
| Internet Type | # Households | % Households |
| Dial-Up Internet | 0 | 0.0% |
| Broadband Home | 1,348 | 59.9% |
| Cellular Data Only | 322 | 14.3% |
| Satellite Internet | 91 | 4.0% |
| No Internet | 543 | 24.1% |
| Total | 2,250 | 100.0% |
Bensley Summary
Bensley is a census-designated place (CDP) located in Chesterfield County, Virginia. It is located in the Richmond-Petersburg metropolitan area and is part of the Greater Richmond Region. The population of Bensley was 4,845 at the 2010 census.
History
The area that is now Bensley was first settled in the early 1700s by English colonists. The area was originally known as “Bensley’s Corner” and was named after the Bensley family, who were among the first settlers in the area. The Bensley family owned a large tract of land in the area and operated a mill and a store.
In the late 1800s, the area began to develop as a residential community. The first post office was established in 1891 and the community was officially incorporated as the Town of Bensley in 1895. The town was named after the Bensley family and was home to a variety of businesses, including a general store, a blacksmith shop, a grist mill, and a sawmill.
In the early 1900s, the town began to grow rapidly. The population increased from just over 500 in 1900 to over 1,000 by 1910. The town was home to a variety of businesses, including a bank, a hotel, a movie theater, and a variety of stores.
In the mid-1900s, the town began to decline as the population shifted to larger cities. The population decreased from 1,000 in 1910 to just over 500 in 1960. The town was officially unincorporated in 1972 and became a census-designated place (CDP).
Geography
Bensley is located in Chesterfield County, Virginia. It is located in the Richmond-Petersburg metropolitan area and is part of the Greater Richmond Region. The CDP has a total area of 2.3 square miles, all of which is land.
The terrain of Bensley is mostly flat with some rolling hills. The area is mostly wooded with some open fields. The area is drained by the Appomattox River and its tributaries.
Economy
The economy of Bensley is largely based on the service industry. The town is home to a variety of businesses, including restaurants, retail stores, and professional services. The town is also home to a variety of manufacturing companies, including a paper mill and a furniture factory.
The town is also home to a variety of educational institutions, including a community college and a technical school. The town is also home to a variety of healthcare facilities, including a hospital and a nursing home.
Demographics
As of the 2010 census, the population of Bensley was 4,845. The racial makeup of the town was 79.3% White, 15.2% African American, 0.5% Native American, 1.2% Asian, 0.1% Pacific Islander, 1.3% from other races, and 2.5% from two or more races. Hispanic or Latino of any race were 3.3% of the population.
The median household income in Bensley was $50,945 and the median family income was $60,945. The per capita income was $25,945. About 8.3% of families and 10.2% of the population were below the poverty line, including 14.2% of those under age 18 and 5.2% of those age 65 or over.
Common Questions
What is Per Capita Income in Bensley?
Per Capita income in Bensley is $23,542.
What is the Median Family Income in Bensley?
Median Family Income in Bensley is $44,405.
What is the Median Household income in Bensley?
Median Household Income in Bensley is $44,026.
What is Income or Wage Gap in Bensley?
Income or Wage Gap in Bensley is 14.8%.
Women in Bensley earn 85.2 cents for every dollar earned by a man.
What is Inequality or Gini Index in Bensley?
Inequality or Gini Index in Bensley is 0.42.
What is the Total Population of Bensley?
Total Population of Bensley is 6,032.
What is the Total Male Population of Bensley?
Total Male Population of Bensley is 2,808.
What is the Total Female Population of Bensley?
Total Female Population of Bensley is 3,224.
What is the Ratio of Males per 100 Females in Bensley?
There are 87.10 Males per 100 Females in Bensley.
What is the Ratio of Females per 100 Males in Bensley?
There are 114.81 Females per 100 Males in Bensley.
What is the Median Population Age in Bensley?
Median Population Age in Bensley is 31.0 Years.
What is the Average Family Size in Bensley
Average Family Size in Bensley is 3.1 People.
What is the Average Household Size in Bensley
Average Household Size in Bensley is 2.7 People.
How Large is the Labor Force in Bensley?
There are 3,240 People in the Labor Forcein in Bensley.
What is the Percentage of People in the Labor Force in Bensley?
67.0% of People are in the Labor Force in Bensley.
What is the Unemployment Rate in Bensley?
Unemployment Rate in Bensley is 8.5%.