Dumbarton, VA Map & Demographics
Dumbarton Map
Dumbarton Overview
$40,625
PER CAPITA INCOME
$67,614
AVG FAMILY INCOME
$59,005
AVG HOUSEHOLD INCOME
24.5%
WAGE / INCOME GAP [ % ]
75.5¢/ $1
WAGE / INCOME GAP [ $ ]
0.47
INEQUALITY / GINI INDEX
8,271
TOTAL POPULATION
4,032
MALE POPULATION
4,239
FEMALE POPULATION
95.12
MALES / 100 FEMALES
105.13
FEMALES / 100 MALES
36.5
MEDIAN AGE
2.9
AVG FAMILY SIZE
2.1
AVG HOUSEHOLD SIZE
5,505
LABOR FORCE [ PEOPLE ]
76.3%
PERCENT IN LABOR FORCE
4.5%
UNEMPLOYMENT RATE
Income in Dumbarton
Income Overview in Dumbarton
Per Capita Income in Dumbarton is $40,625, while median incomes of families and households are $67,614 and $59,005 respectively.
| Characteristic | Number | Measure |
| Per Capita Income | 8,271 | $40,625 |
| Median Family Income | 1,712 | $67,614 |
| Mean Family Income | 1,712 | $114,812 |
| Median Household Income | 3,921 | $59,005 |
| Mean Household Income | 3,921 | $85,658 |
| Income Deficit | 1,712 | $0 |
| Wage / Income Gap (%) | 8,271 | 24.47% |
| Wage / Income Gap ($) | 8,271 | 75.53¢ per $1 |
| Gini / Inequality Index | 8,271 | 0.47 |
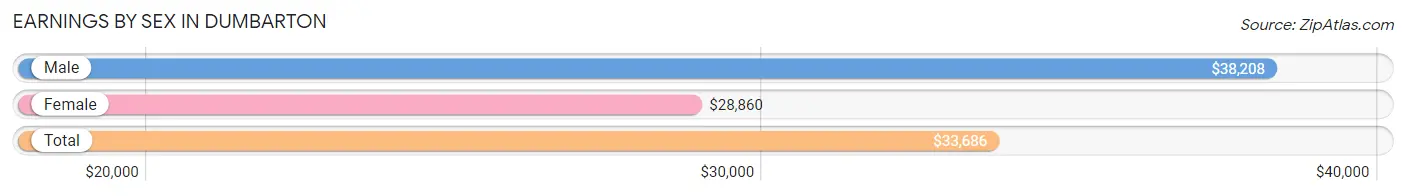
Earnings by Sex in Dumbarton
Average Earnings in Dumbarton are $33,686, $38,208 for men and $28,860 for women, a difference of 24.5%.
| Sex | Number | Average Earnings |
| Male | 2,947 (52.7%) | $38,208 |
| Female | 2,640 (47.2%) | $28,860 |
| Total | 5,587 (100.0%) | $33,686 |
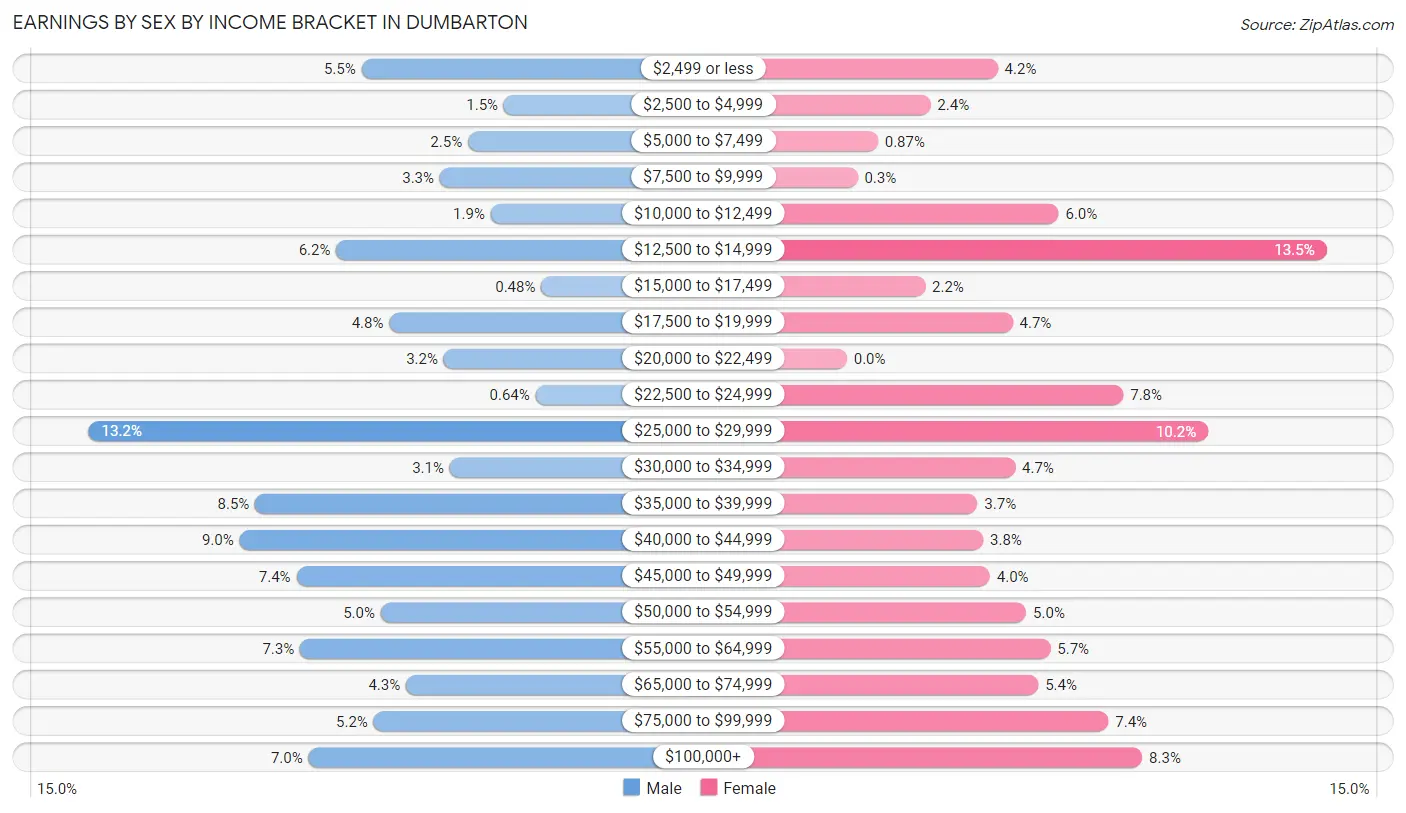
Earnings by Sex by Income Bracket in Dumbarton
The most common earnings brackets in Dumbarton are $25,000 to $29,999 for men (389 | 13.2%) and $12,500 to $14,999 for women (356 | 13.5%).
| Income | Male | Female |
| $2,499 or less | 163 (5.5%) | 112 (4.2%) |
| $2,500 to $4,999 | 45 (1.5%) | 62 (2.4%) |
| $5,000 to $7,499 | 75 (2.5%) | 23 (0.9%) |
| $7,500 to $9,999 | 98 (3.3%) | 8 (0.3%) |
| $10,000 to $12,499 | 56 (1.9%) | 157 (5.9%) |
| $12,500 to $14,999 | 184 (6.2%) | 356 (13.5%) |
| $15,000 to $17,499 | 14 (0.5%) | 58 (2.2%) |
| $17,500 to $19,999 | 140 (4.8%) | 123 (4.7%) |
| $20,000 to $22,499 | 95 (3.2%) | 0 (0.0%) |
| $22,500 to $24,999 | 19 (0.6%) | 205 (7.8%) |
| $25,000 to $29,999 | 389 (13.2%) | 268 (10.2%) |
| $30,000 to $34,999 | 90 (3.0%) | 125 (4.7%) |
| $35,000 to $39,999 | 251 (8.5%) | 97 (3.7%) |
| $40,000 to $44,999 | 264 (9.0%) | 101 (3.8%) |
| $45,000 to $49,999 | 217 (7.4%) | 106 (4.0%) |
| $50,000 to $54,999 | 147 (5.0%) | 133 (5.0%) |
| $55,000 to $64,999 | 214 (7.3%) | 151 (5.7%) |
| $65,000 to $74,999 | 126 (4.3%) | 142 (5.4%) |
| $75,000 to $99,999 | 153 (5.2%) | 194 (7.3%) |
| $100,000+ | 207 (7.0%) | 219 (8.3%) |
| Total | 2,947 (100.0%) | 2,640 (100.0%) |
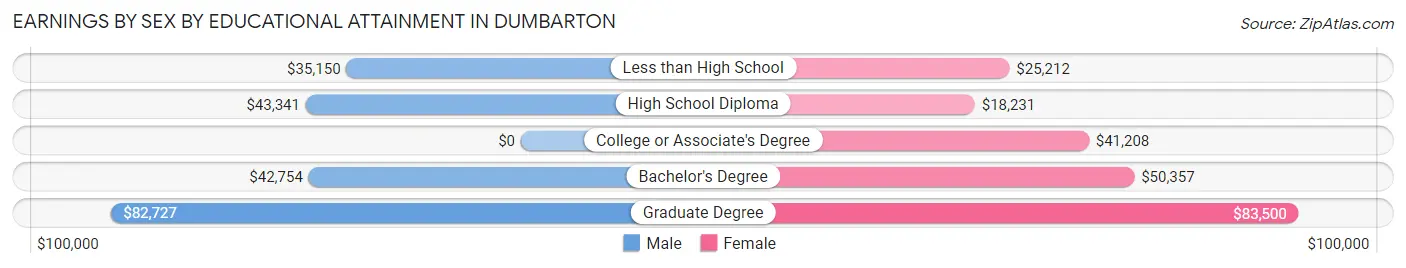
Earnings by Sex by Educational Attainment in Dumbarton
Average earnings in Dumbarton are $41,677 for men and $33,953 for women, a difference of 18.5%. Men with an educational attainment of graduate degree enjoy the highest average annual earnings of $82,727, while those with less than high school education earn the least with $35,150. Women with an educational attainment of graduate degree earn the most with the average annual earnings of $83,500, while those with high school diploma education have the smallest earnings of $18,231.
| Educational Attainment | Male Income | Female Income |
| Less than High School | $35,150 | $25,212 |
| High School Diploma | $43,341 | $18,231 |
| College or Associate's Degree | - | - |
| Bachelor's Degree | $42,754 | $50,357 |
| Graduate Degree | $82,727 | $83,500 |
| Total | $41,677 | $33,953 |
Family Income in Dumbarton
Family Income Brackets in Dumbarton
According to the Dumbarton family income data, there are 354 families falling into the $50,000 to $74,999 income range, which is the most common income bracket and makes up 20.7% of all families. Conversely, the $10,000 to $14,999 income bracket is the least frequent group with only 9 families (0.5%) belonging to this category.
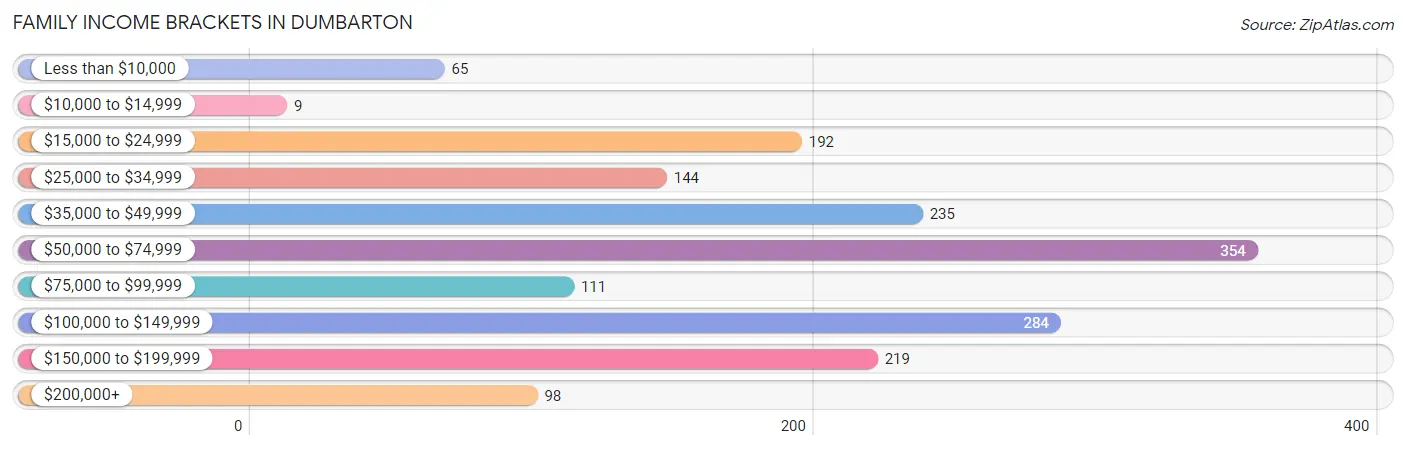
| Income Bracket | # Families | % Families |
| Less than $10,000 | 65 | 3.8% |
| $10,000 to $14,999 | 9 | 0.5% |
| $15,000 to $24,999 | 192 | 11.2% |
| $25,000 to $34,999 | 144 | 8.4% |
| $35,000 to $49,999 | 235 | 13.7% |
| $50,000 to $74,999 | 354 | 20.7% |
| $75,000 to $99,999 | 111 | 6.5% |
| $100,000 to $149,999 | 284 | 16.6% |
| $150,000 to $199,999 | 219 | 12.8% |
| $200,000+ | 98 | 5.7% |
Family Income by Famaliy Size in Dumbarton
4-person families (366 | 21.4%) account for the highest median family income in Dumbarton with $103,649 per family, while 2-person families (869 | 50.8%) have the highest median income of $35,852 per family member.
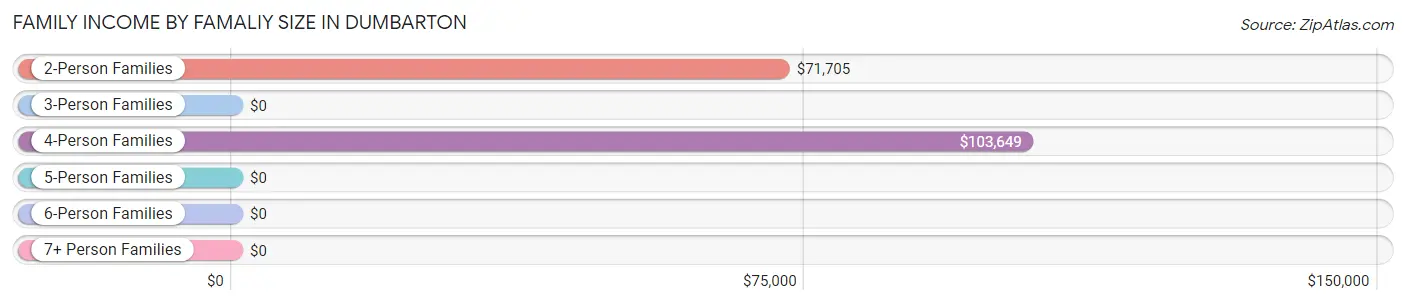
| Income Bracket | # Families | Median Income |
| 2-Person Families | 869 (50.8%) | $71,705 |
| 3-Person Families | 434 (25.4%) | $0 |
| 4-Person Families | 366 (21.4%) | $103,649 |
| 5-Person Families | 12 (0.7%) | $0 |
| 6-Person Families | 31 (1.8%) | $0 |
| 7+ Person Families | 0 (0.0%) | $0 |
| Total | 1,712 (100.0%) | $67,614 |
Family Income by Number of Earners in Dumbarton
The median family income in Dumbarton is $67,614, with families comprising 3+ earners (259) having the highest median family income of $92,266, while families with no earners (128) have the lowest median family income of $31,422, accounting for 15.1% and 7.5% of families, respectively.
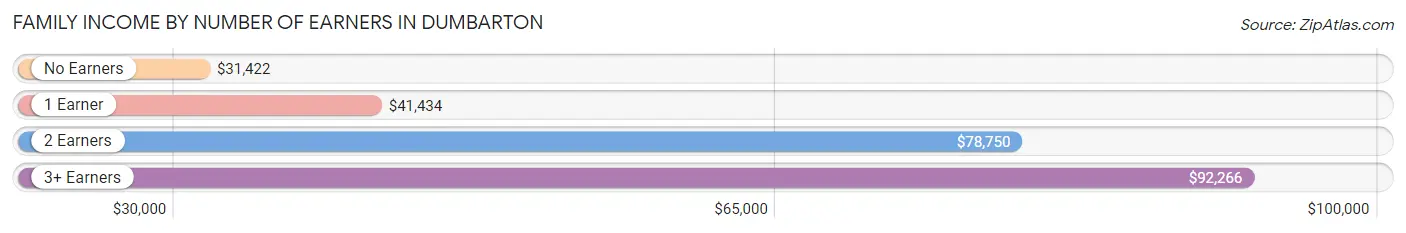
| Number of Earners | # Families | Median Income |
| No Earners | 128 (7.5%) | $31,422 |
| 1 Earner | 609 (35.6%) | $41,434 |
| 2 Earners | 716 (41.8%) | $78,750 |
| 3+ Earners | 259 (15.1%) | $92,266 |
| Total | 1,712 (100.0%) | $67,614 |
Household Income in Dumbarton
Household Income Brackets in Dumbarton
With 1,004 households falling in the category, the $50,000 to $74,999 income range is the most frequent in Dumbarton, accounting for 25.6% of all households. In contrast, only 59 households (1.5%) fall into the $10,000 to $14,999 income bracket, making it the least populous group.
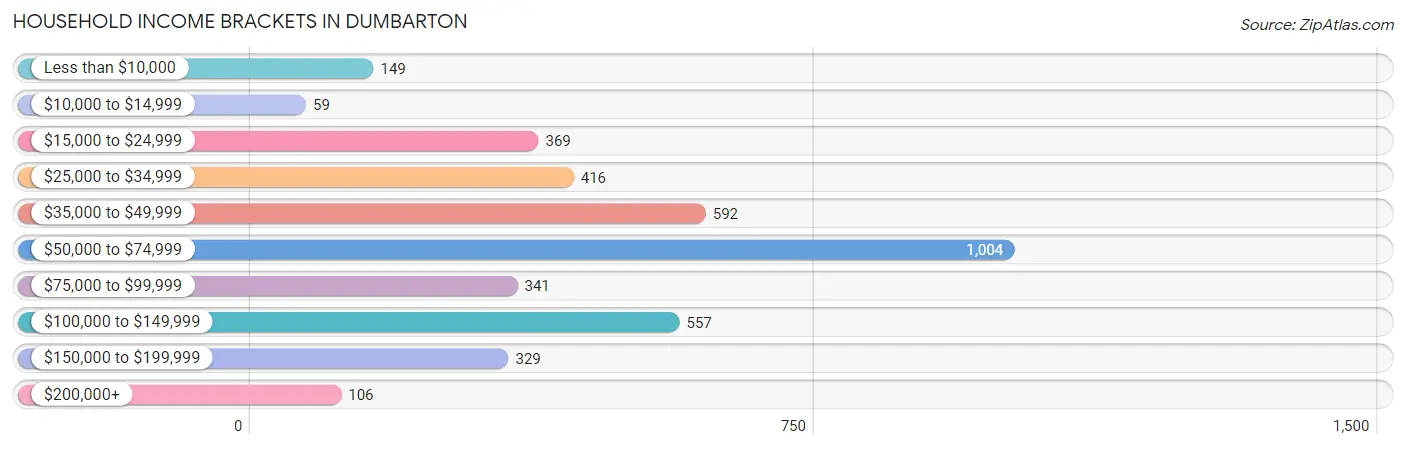
| Income Bracket | # Households | % Households |
| Less than $10,000 | 149 | 3.8% |
| $10,000 to $14,999 | 59 | 1.5% |
| $15,000 to $24,999 | 369 | 9.4% |
| $25,000 to $34,999 | 416 | 10.6% |
| $35,000 to $49,999 | 592 | 15.1% |
| $50,000 to $74,999 | 1,004 | 25.6% |
| $75,000 to $99,999 | 341 | 8.7% |
| $100,000 to $149,999 | 557 | 14.2% |
| $150,000 to $199,999 | 329 | 8.4% |
| $200,000+ | 106 | 2.7% |
Household Income by Householder Age in Dumbarton
The median household income in Dumbarton is $59,005, with the highest median household income of $67,571 found in the 45 to 64 years age bracket for the primary householder. A total of 1,291 households (32.9%) fall into this category. Meanwhile, the 15 to 24 years age bracket for the primary householder has the lowest median household income of $0, with 199 households (5.1%) in this group.
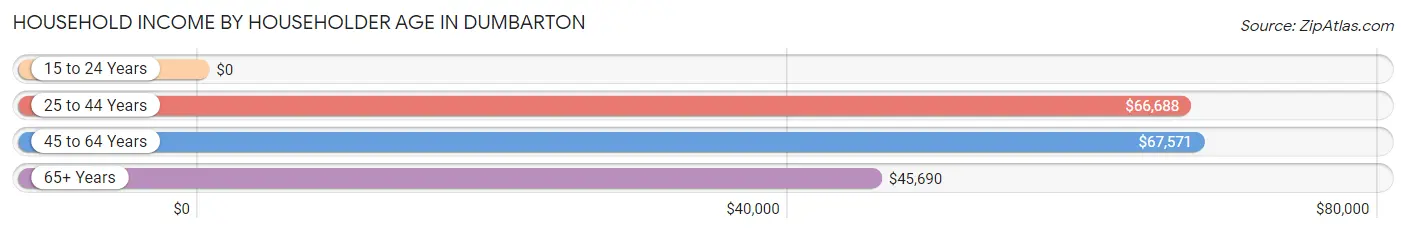
| Income Bracket | # Households | Median Income |
| 15 to 24 Years | 199 (5.1%) | $0 |
| 25 to 44 Years | 1,223 (31.2%) | $66,688 |
| 45 to 64 Years | 1,291 (32.9%) | $67,571 |
| 65+ Years | 1,208 (30.8%) | $45,690 |
| Total | 3,921 (100.0%) | $59,005 |
Poverty in Dumbarton
Income Below Poverty by Sex and Age in Dumbarton
With 12.7% poverty level for males and 19.8% for females among the residents of Dumbarton, under 5 year old males and under 5 year old females are the most vulnerable to poverty, with 84 males (50.3%) and 124 females (81.0%) in their respective age groups living below the poverty level.
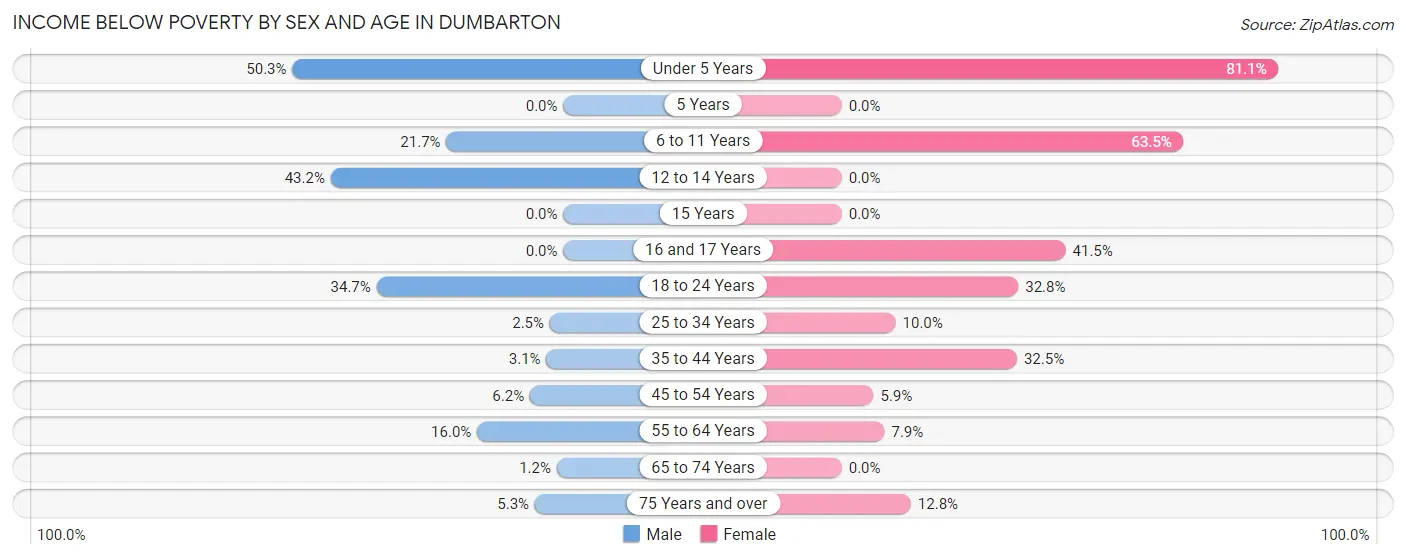
| Age Bracket | Male | Female |
| Under 5 Years | 84 (50.3%) | 124 (81.0%) |
| 5 Years | 0 (0.0%) | 0 (0.0%) |
| 6 to 11 Years | 38 (21.7%) | 158 (63.4%) |
| 12 to 14 Years | 38 (43.2%) | 0 (0.0%) |
| 15 Years | 0 (0.0%) | 0 (0.0%) |
| 16 and 17 Years | 0 (0.0%) | 27 (41.5%) |
| 18 to 24 Years | 183 (34.7%) | 189 (32.8%) |
| 25 to 34 Years | 25 (2.5%) | 69 (10.0%) |
| 35 to 44 Years | 11 (3.1%) | 146 (32.5%) |
| 45 to 54 Years | 18 (6.2%) | 34 (5.9%) |
| 55 to 64 Years | 88 (16.0%) | 48 (7.9%) |
| 65 to 74 Years | 5 (1.2%) | 0 (0.0%) |
| 75 Years and over | 18 (5.3%) | 44 (12.8%) |
| Total | 508 (12.7%) | 839 (19.8%) |
Income Above Poverty by Sex and Age in Dumbarton
According to the poverty statistics in Dumbarton, males aged 5 years and females aged 5 years are the age groups that are most secure financially, with 100.0% of males and 100.0% of females in these age groups living above the poverty line.
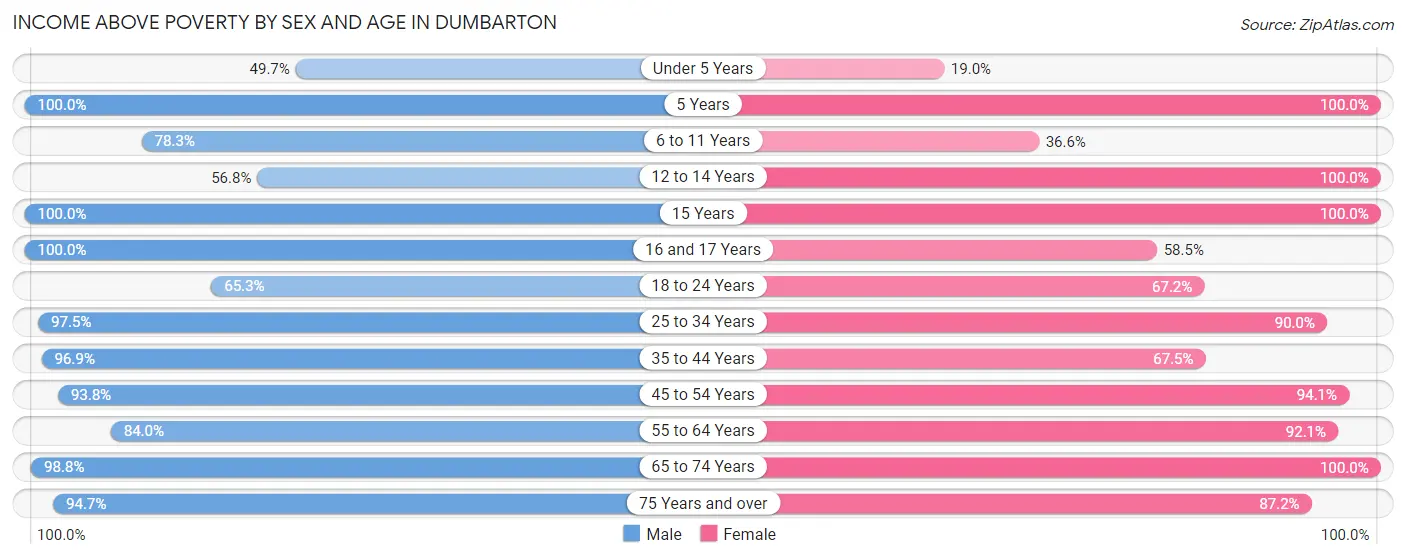
| Age Bracket | Male | Female |
| Under 5 Years | 83 (49.7%) | 29 (19.0%) |
| 5 Years | 32 (100.0%) | 12 (100.0%) |
| 6 to 11 Years | 137 (78.3%) | 91 (36.5%) |
| 12 to 14 Years | 50 (56.8%) | 87 (100.0%) |
| 15 Years | 45 (100.0%) | 25 (100.0%) |
| 16 and 17 Years | 12 (100.0%) | 38 (58.5%) |
| 18 to 24 Years | 345 (65.3%) | 388 (67.2%) |
| 25 to 34 Years | 975 (97.5%) | 622 (90.0%) |
| 35 to 44 Years | 339 (96.9%) | 303 (67.5%) |
| 45 to 54 Years | 273 (93.8%) | 543 (94.1%) |
| 55 to 64 Years | 462 (84.0%) | 557 (92.1%) |
| 65 to 74 Years | 409 (98.8%) | 406 (100.0%) |
| 75 Years and over | 323 (94.7%) | 299 (87.2%) |
| Total | 3,485 (87.3%) | 3,400 (80.2%) |
Income Below Poverty Among Married-Couple Families in Dumbarton
The poverty statistics for married-couple families in Dumbarton show that 3.2% or 34 of the total 1,057 families live below the poverty line. Families with 1 or 2 children have the highest poverty rate of 8.9%, comprising of 20 families. On the other hand, families with 3 or 4 children have the lowest poverty rate of 0.0%, which includes 0 families.
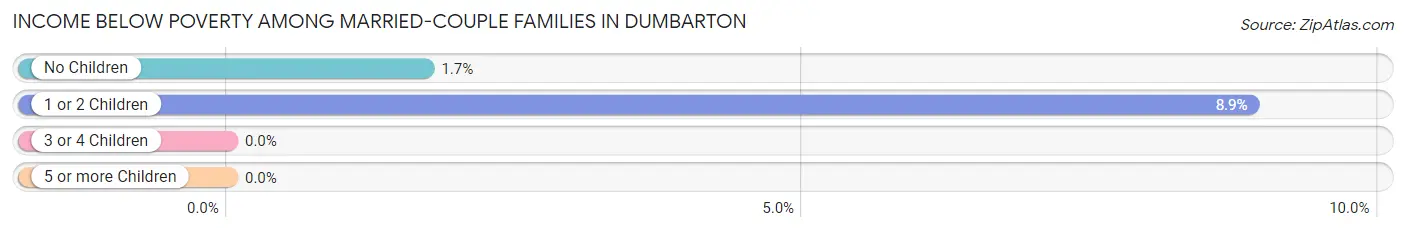
| Children | Above Poverty | Below Poverty |
| No Children | 806 (98.3%) | 14 (1.7%) |
| 1 or 2 Children | 205 (91.1%) | 20 (8.9%) |
| 3 or 4 Children | 12 (100.0%) | 0 (0.0%) |
| 5 or more Children | 0 (0.0%) | 0 (0.0%) |
| Total | 1,023 (96.8%) | 34 (3.2%) |
Income Below Poverty Among Single-Parent Households in Dumbarton
According to the poverty data in Dumbarton, 4.7% or 5 single-father households and 28.8% or 158 single-mother households are living below the poverty line. Among single-father households, those with 1 or 2 children have the highest poverty rate, with 5 households (41.7%) experiencing poverty. Likewise, among single-mother households, those with 1 or 2 children have the highest poverty rate, with 158 households (58.5%) falling below the poverty line.
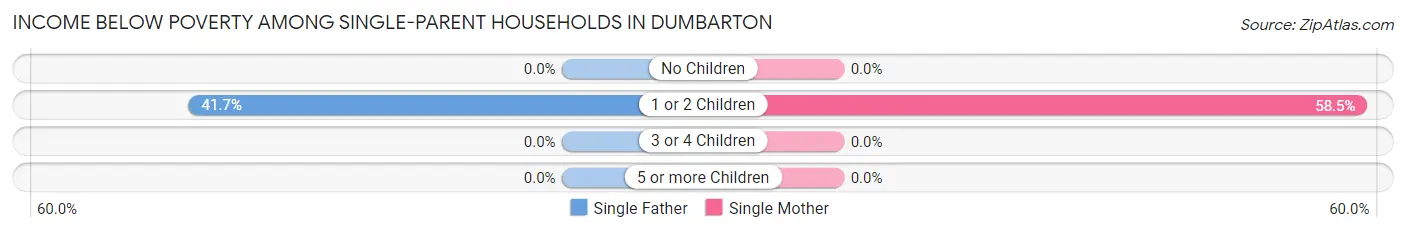
| Children | Single Father | Single Mother |
| No Children | 0 (0.0%) | 0 (0.0%) |
| 1 or 2 Children | 5 (41.7%) | 158 (58.5%) |
| 3 or 4 Children | 0 (0.0%) | 0 (0.0%) |
| 5 or more Children | 0 (0.0%) | 0 (0.0%) |
| Total | 5 (4.7%) | 158 (28.8%) |
Income Below Poverty Among Married-Couple vs Single-Parent Households in Dumbarton
The poverty data for Dumbarton shows that 34 of the married-couple family households (3.2%) and 163 of the single-parent households (24.9%) are living below the poverty level. Within the married-couple family households, those with 1 or 2 children have the highest poverty rate, with 20 households (8.9%) falling below the poverty line. Among the single-parent households, those with 1 or 2 children have the highest poverty rate, with 163 household (57.8%) living below poverty.
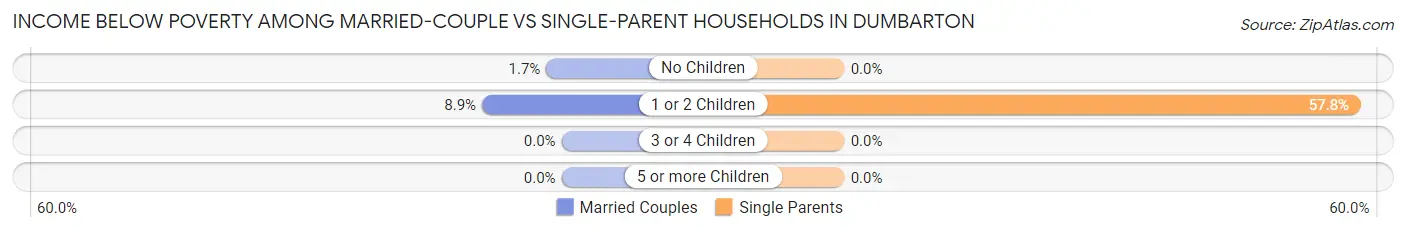
| Children | Married-Couple Families | Single-Parent Households |
| No Children | 14 (1.7%) | 0 (0.0%) |
| 1 or 2 Children | 20 (8.9%) | 163 (57.8%) |
| 3 or 4 Children | 0 (0.0%) | 0 (0.0%) |
| 5 or more Children | 0 (0.0%) | 0 (0.0%) |
| Total | 34 (3.2%) | 163 (24.9%) |
Race in Dumbarton
The most populous races in Dumbarton are White / Caucasian (4,241 | 51.3%), Hispanic or Latino (2,122 | 25.7%), and Black / African American (1,923 | 23.3%).
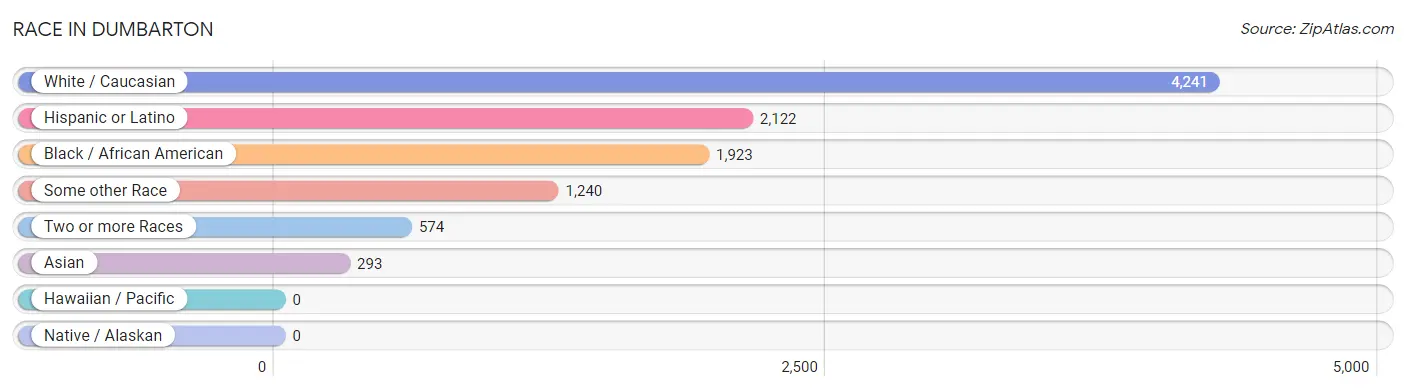
| Race | # Population | % Population |
| Asian | 293 | 3.5% |
| Black / African American | 1,923 | 23.3% |
| Hawaiian / Pacific | 0 | 0.0% |
| Hispanic or Latino | 2,122 | 25.7% |
| Native / Alaskan | 0 | 0.0% |
| White / Caucasian | 4,241 | 51.3% |
| Two or more Races | 574 | 6.9% |
| Some other Race | 1,240 | 15.0% |
| Total | 8,271 | 100.0% |
Ancestry in Dumbarton
The most populous ancestries reported in Dumbarton are Central American (1,158 | 14.0%), Salvadoran (816 | 9.9%), Mexican (641 | 7.7%), German (449 | 5.4%), and English (443 | 5.4%), together accounting for 42.4% of all Dumbarton residents.
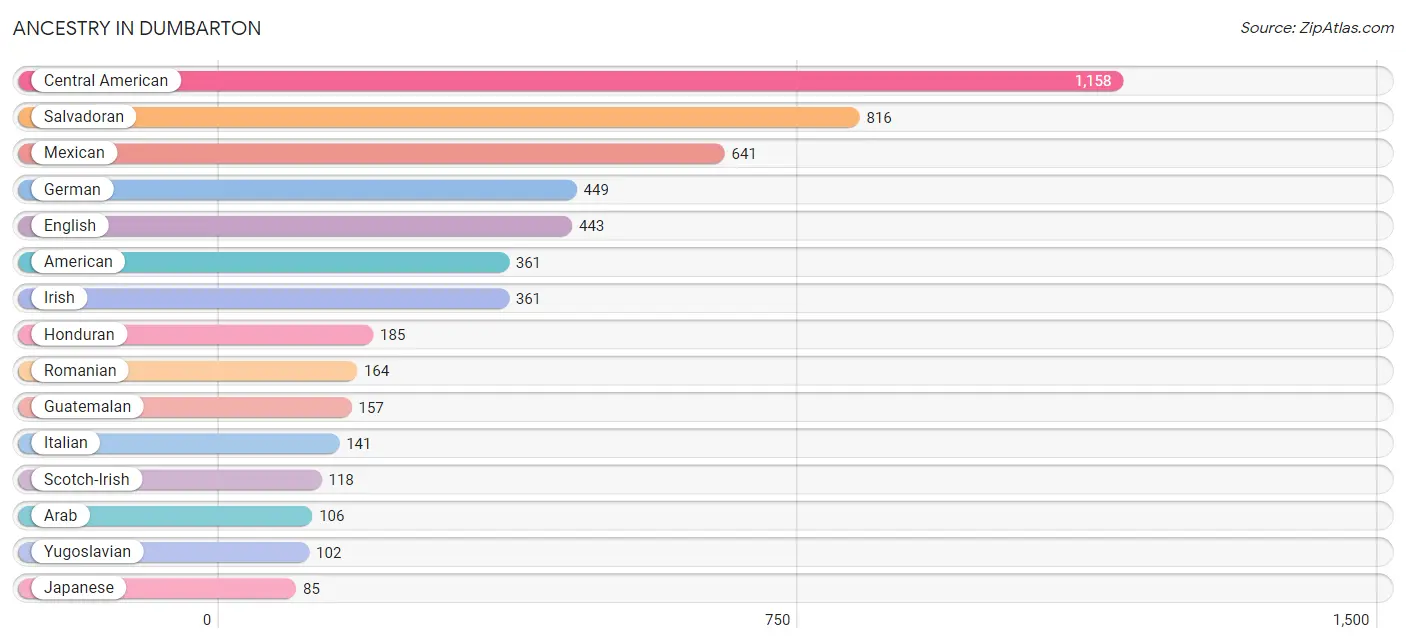
| Ancestry | # Population | % Population |
| African | 4 | 0.1% |
| American | 361 | 4.4% |
| Arab | 106 | 1.3% |
| Belgian | 17 | 0.2% |
| Brazilian | 20 | 0.2% |
| British | 28 | 0.3% |
| Central American | 1,158 | 14.0% |
| Central American Indian | 35 | 0.4% |
| Cuban | 37 | 0.4% |
| Czech | 15 | 0.2% |
| Czechoslovakian | 33 | 0.4% |
| Dutch | 19 | 0.2% |
| English | 443 | 5.4% |
| Ethiopian | 57 | 0.7% |
| European | 64 | 0.8% |
| French | 67 | 0.8% |
| French Canadian | 14 | 0.2% |
| German | 449 | 5.4% |
| German Russian | 8 | 0.1% |
| Greek | 29 | 0.4% |
| Guatemalan | 157 | 1.9% |
| Honduran | 185 | 2.2% |
| Hungarian | 23 | 0.3% |
| Indian (Asian) | 25 | 0.3% |
| Iranian | 17 | 0.2% |
| Irish | 361 | 4.4% |
| Italian | 141 | 1.7% |
| Jamaican | 77 | 0.9% |
| Japanese | 85 | 1.0% |
| Korean | 60 | 0.7% |
| Lebanese | 29 | 0.4% |
| Mexican | 641 | 7.7% |
| Mongolian | 15 | 0.2% |
| Pennsylvania German | 35 | 0.4% |
| Polish | 35 | 0.4% |
| Puerto Rican | 80 | 1.0% |
| Romanian | 164 | 2.0% |
| Salvadoran | 816 | 9.9% |
| Scotch-Irish | 118 | 1.4% |
| Scottish | 37 | 0.4% |
| Spaniard | 16 | 0.2% |
| Spanish | 12 | 0.2% |
| Sri Lankan | 38 | 0.5% |
| Subsaharan African | 63 | 0.8% |
| Yugoslavian | 102 | 1.2% | View All 45 Rows |
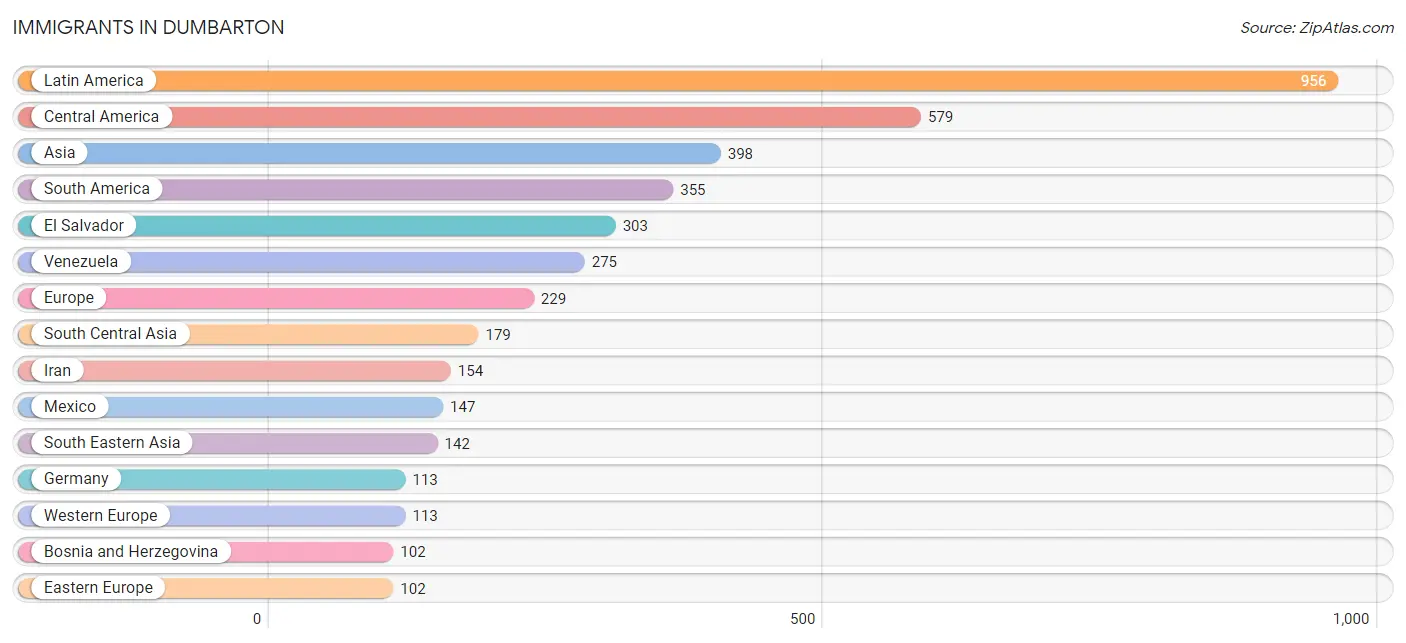
Immigrants in Dumbarton
The most numerous immigrant groups reported in Dumbarton came from Latin America (956 | 11.6%), Central America (579 | 7.0%), Asia (398 | 4.8%), South America (355 | 4.3%), and El Salvador (303 | 3.7%), together accounting for 31.3% of all Dumbarton residents.
| Immigration Origin | # Population | % Population |
| Africa | 72 | 0.9% |
| Asia | 398 | 4.8% |
| Bosnia and Herzegovina | 102 | 1.2% |
| Brazil | 20 | 0.2% |
| Cambodia | 42 | 0.5% |
| Caribbean | 22 | 0.3% |
| Central America | 579 | 7.0% |
| China | 61 | 0.7% |
| Eastern Africa | 30 | 0.4% |
| Eastern Asia | 61 | 0.7% |
| Eastern Europe | 102 | 1.2% |
| Ecuador | 60 | 0.7% |
| El Salvador | 303 | 3.7% |
| England | 14 | 0.2% |
| Ethiopia | 28 | 0.3% |
| Europe | 229 | 2.8% |
| Germany | 113 | 1.4% |
| Guatemala | 98 | 1.2% |
| Honduras | 31 | 0.4% |
| India | 14 | 0.2% |
| Iran | 154 | 1.9% |
| Jamaica | 22 | 0.3% |
| Latin America | 956 | 11.6% |
| Mexico | 147 | 1.8% |
| Morocco | 25 | 0.3% |
| Nepal | 11 | 0.1% |
| Northern Africa | 25 | 0.3% |
| Northern Europe | 14 | 0.2% |
| Philippines | 37 | 0.4% |
| Saudi Arabia | 16 | 0.2% |
| South America | 355 | 4.3% |
| South Central Asia | 179 | 2.2% |
| South Eastern Asia | 142 | 1.7% |
| Thailand | 19 | 0.2% |
| Venezuela | 275 | 3.3% |
| Vietnam | 44 | 0.5% |
| Western Asia | 16 | 0.2% |
| Western Europe | 113 | 1.4% | View All 38 Rows |
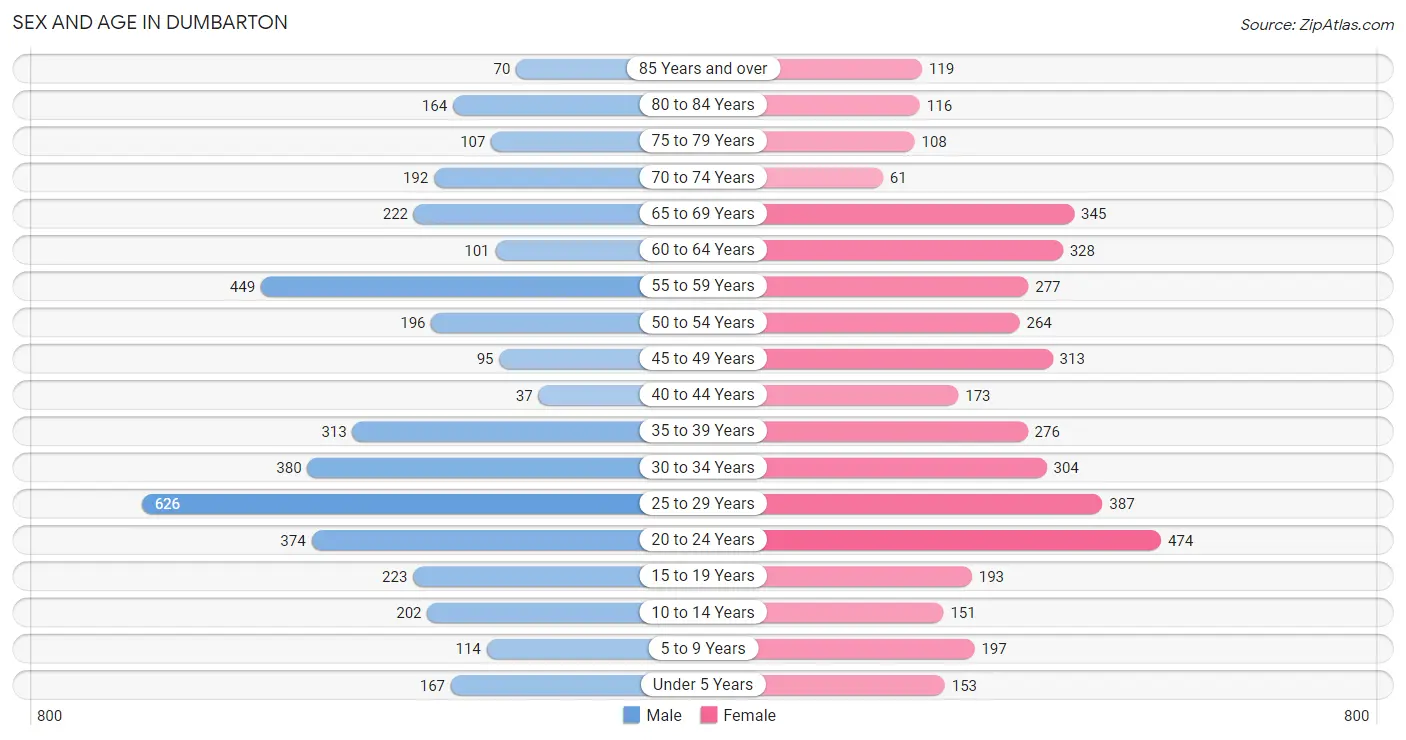
Sex and Age in Dumbarton
Sex and Age in Dumbarton
The most populous age groups in Dumbarton are 25 to 29 Years (626 | 15.5%) for men and 20 to 24 Years (474 | 11.2%) for women.
| Age Bracket | Male | Female |
| Under 5 Years | 167 (4.1%) | 153 (3.6%) |
| 5 to 9 Years | 114 (2.8%) | 197 (4.6%) |
| 10 to 14 Years | 202 (5.0%) | 151 (3.6%) |
| 15 to 19 Years | 223 (5.5%) | 193 (4.5%) |
| 20 to 24 Years | 374 (9.3%) | 474 (11.2%) |
| 25 to 29 Years | 626 (15.5%) | 387 (9.1%) |
| 30 to 34 Years | 380 (9.4%) | 304 (7.2%) |
| 35 to 39 Years | 313 (7.8%) | 276 (6.5%) |
| 40 to 44 Years | 37 (0.9%) | 173 (4.1%) |
| 45 to 49 Years | 95 (2.4%) | 313 (7.4%) |
| 50 to 54 Years | 196 (4.9%) | 264 (6.2%) |
| 55 to 59 Years | 449 (11.1%) | 277 (6.5%) |
| 60 to 64 Years | 101 (2.5%) | 328 (7.7%) |
| 65 to 69 Years | 222 (5.5%) | 345 (8.1%) |
| 70 to 74 Years | 192 (4.8%) | 61 (1.4%) |
| 75 to 79 Years | 107 (2.6%) | 108 (2.5%) |
| 80 to 84 Years | 164 (4.1%) | 116 (2.7%) |
| 85 Years and over | 70 (1.7%) | 119 (2.8%) |
| Total | 4,032 (100.0%) | 4,239 (100.0%) |
Families and Households in Dumbarton
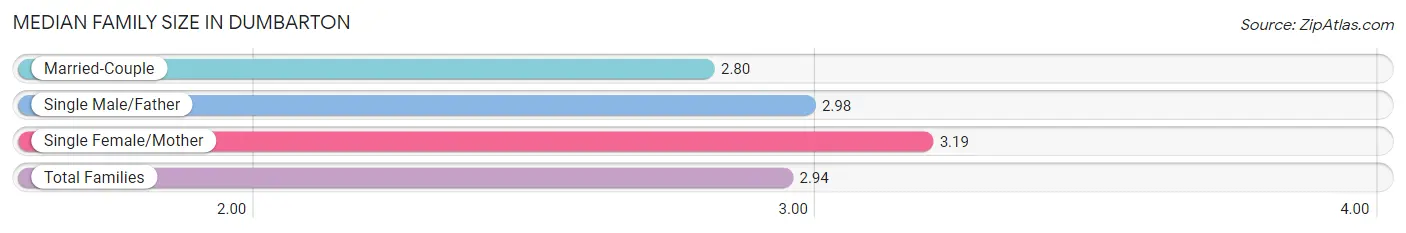
Median Family Size in Dumbarton
The median family size in Dumbarton is 2.94 persons per family, with single female/mother families (548 | 32.0%) accounting for the largest median family size of 3.19 persons per family. On the other hand, married-couple families (1,057 | 61.7%) represent the smallest median family size with 2.80 persons per family.
| Family Type | # Families | Family Size |
| Married-Couple | 1,057 (61.7%) | 2.80 |
| Single Male/Father | 107 (6.2%) | 2.98 |
| Single Female/Mother | 548 (32.0%) | 3.19 |
| Total Families | 1,712 (100.0%) | 2.94 |
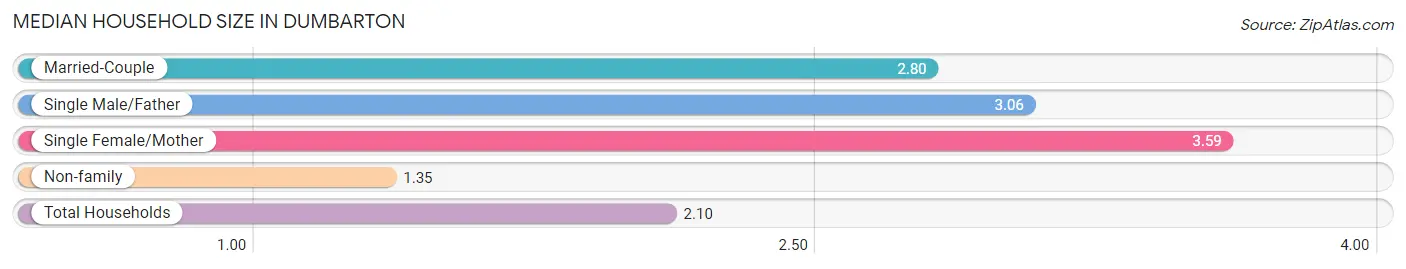
Median Household Size in Dumbarton
The median household size in Dumbarton is 2.10 persons per household, with single female/mother households (548 | 14.0%) accounting for the largest median household size of 3.59 persons per household. non-family households (2,209 | 56.3%) represent the smallest median household size with 1.35 persons per household.
| Household Type | # Households | Household Size |
| Married-Couple | 1,057 (27.0%) | 2.80 |
| Single Male/Father | 107 (2.7%) | 3.06 |
| Single Female/Mother | 548 (14.0%) | 3.59 |
| Non-family | 2,209 (56.3%) | 1.35 |
| Total Households | 3,921 (100.0%) | 2.10 |
Household Size by Marriage Status in Dumbarton
Out of a total of 3,921 households in Dumbarton, 1,712 (43.7%) are family households, while 2,209 (56.3%) are nonfamily households. The most numerous type of family households are 2-person households, comprising 823, and the most common type of nonfamily households are 1-person households, comprising 1,664.
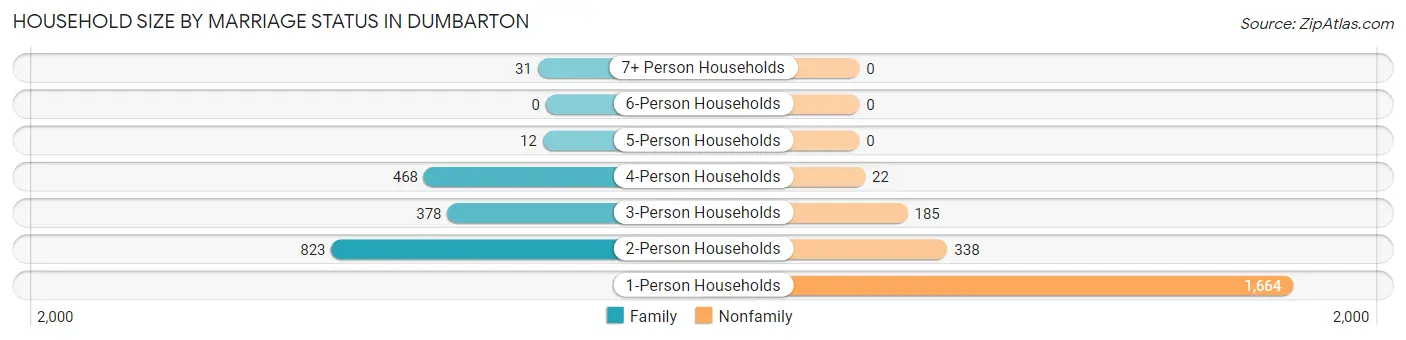
| Household Size | Family Households | Nonfamily Households |
| 1-Person Households | - | 1,664 (42.4%) |
| 2-Person Households | 823 (21.0%) | 338 (8.6%) |
| 3-Person Households | 378 (9.6%) | 185 (4.7%) |
| 4-Person Households | 468 (11.9%) | 22 (0.6%) |
| 5-Person Households | 12 (0.3%) | 0 (0.0%) |
| 6-Person Households | 0 (0.0%) | 0 (0.0%) |
| 7+ Person Households | 31 (0.8%) | 0 (0.0%) |
| Total | 1,712 (43.7%) | 2,209 (56.3%) |
Female Fertility in Dumbarton
Fertility by Age in Dumbarton
Average fertility rate in Dumbarton is 96.0 births per 1,000 women. Women in the age bracket of 20 to 34 years have the highest fertility rate with 144.0 births per 1,000 women. Women in the age bracket of 20 to 34 years acount for 82.0% of all women with births.
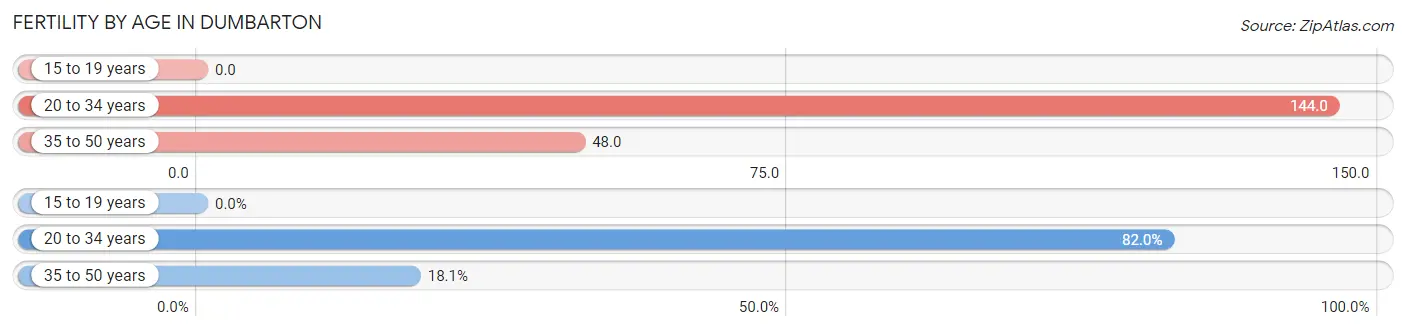
| Age Bracket | Women with Births | Births / 1,000 Women |
| 15 to 19 years | 0 (0.0%) | 0.0 |
| 20 to 34 years | 168 (82.0%) | 144.0 |
| 35 to 50 years | 37 (18.0%) | 48.0 |
| Total | 205 (100.0%) | 96.0 |
Fertility by Age by Marriage Status in Dumbarton
34.1% of women with births (205) in Dumbarton are married. The highest percentage of unmarried women with births falls into 20 to 34 years age bracket with 80.4% of them unmarried at the time of birth, while the lowest percentage of unmarried women with births belong to 35 to 50 years age bracket with 0.0% of them unmarried.
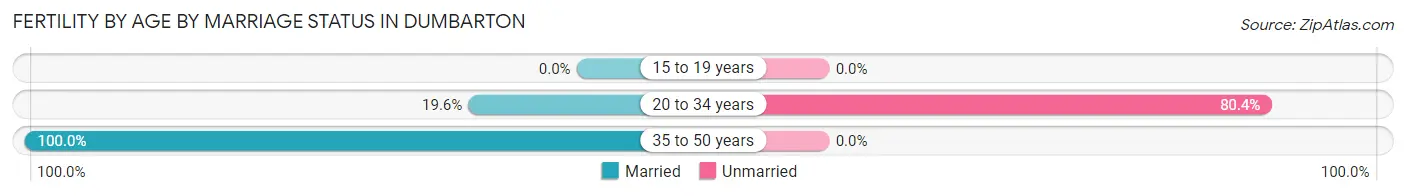
| Age Bracket | Married | Unmarried |
| 15 to 19 years | 0 (0.0%) | 0 (0.0%) |
| 20 to 34 years | 33 (19.6%) | 135 (80.4%) |
| 35 to 50 years | 37 (100.0%) | 0 (0.0%) |
| Total | 70 (34.2%) | 135 (65.8%) |
Fertility by Education in Dumbarton
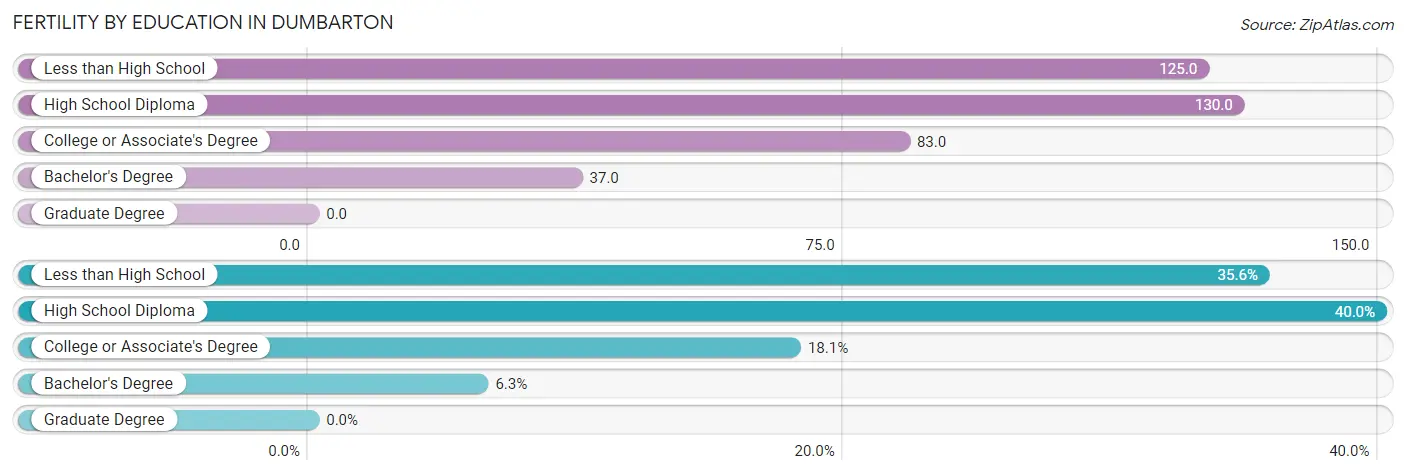
| Educational Attainment | Women with Births | Births / 1,000 Women |
| Less than High School | 73 (35.6%) | 125.0 |
| High School Diploma | 82 (40.0%) | 130.0 |
| College or Associate's Degree | 37 (18.0%) | 83.0 |
| Bachelor's Degree | 13 (6.3%) | 37.0 |
| Graduate Degree | 0 (0.0%) | 0.0 |
| Total | 205 (100.0%) | 96.0 |
Fertility by Education by Marriage Status in Dumbarton
65.8% of women with births in Dumbarton are unmarried. Women with the educational attainment of college or associate's degree are most likely to be married with 100.0% of them married at childbirth, while women with the educational attainment of less than high school are least likely to be married with 100.0% of them unmarried at childbirth.
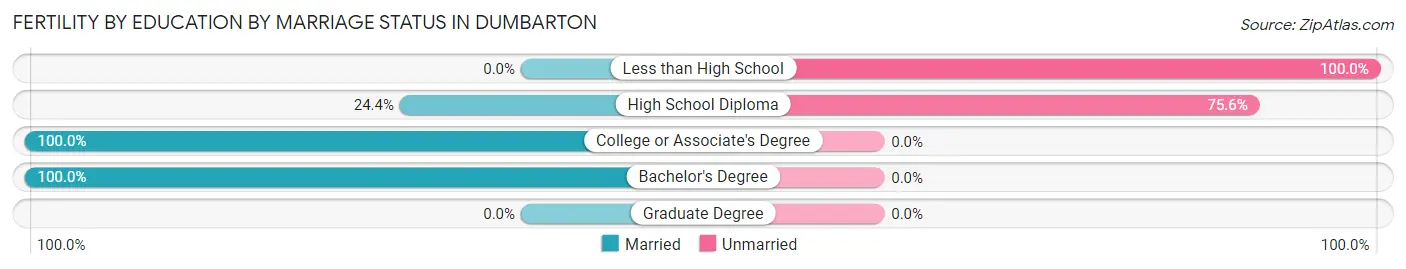
| Educational Attainment | Married | Unmarried |
| Less than High School | 0 (0.0%) | 73 (100.0%) |
| High School Diploma | 20 (24.4%) | 62 (75.6%) |
| College or Associate's Degree | 37 (100.0%) | 0 (0.0%) |
| Bachelor's Degree | 13 (100.0%) | 0 (0.0%) |
| Graduate Degree | 0 (0.0%) | 0 (0.0%) |
| Total | 70 (34.2%) | 135 (65.8%) |
Employment Characteristics in Dumbarton
Employment by Class of Employer in Dumbarton
Among the 5,226 employed individuals in Dumbarton, private company employees (3,929 | 75.2%), not-for-profit organizations (350 | 6.7%), and local government employees (339 | 6.5%) make up the most common classes of employment.
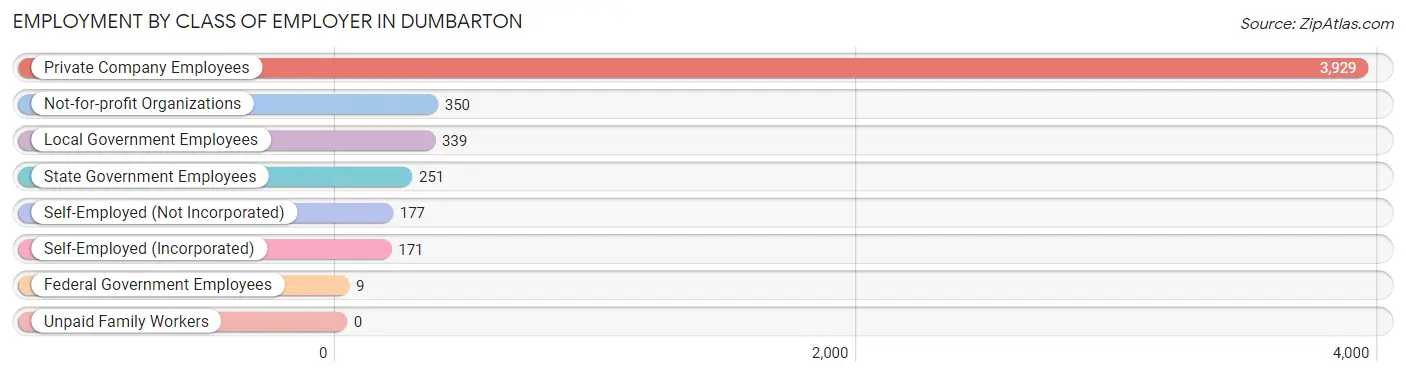
| Employer Class | # Employees | % Employees |
| Private Company Employees | 3,929 | 75.2% |
| Self-Employed (Incorporated) | 171 | 3.3% |
| Self-Employed (Not Incorporated) | 177 | 3.4% |
| Not-for-profit Organizations | 350 | 6.7% |
| Local Government Employees | 339 | 6.5% |
| State Government Employees | 251 | 4.8% |
| Federal Government Employees | 9 | 0.2% |
| Unpaid Family Workers | 0 | 0.0% |
| Total | 5,226 | 100.0% |
Employment Status by Age in Dumbarton
According to the labor force statistics for Dumbarton, out of the total population over 16 years of age (7,215), 76.3% or 5,505 individuals are in the labor force, with 4.5% or 248 of them unemployed. The age group with the highest labor force participation rate is 30 to 34 years, with 98.1% or 671 individuals in the labor force. Within the labor force, the 16 to 19 years age range has the highest percentage of unemployed individuals, with 26.3% or 67 of them being unemployed.
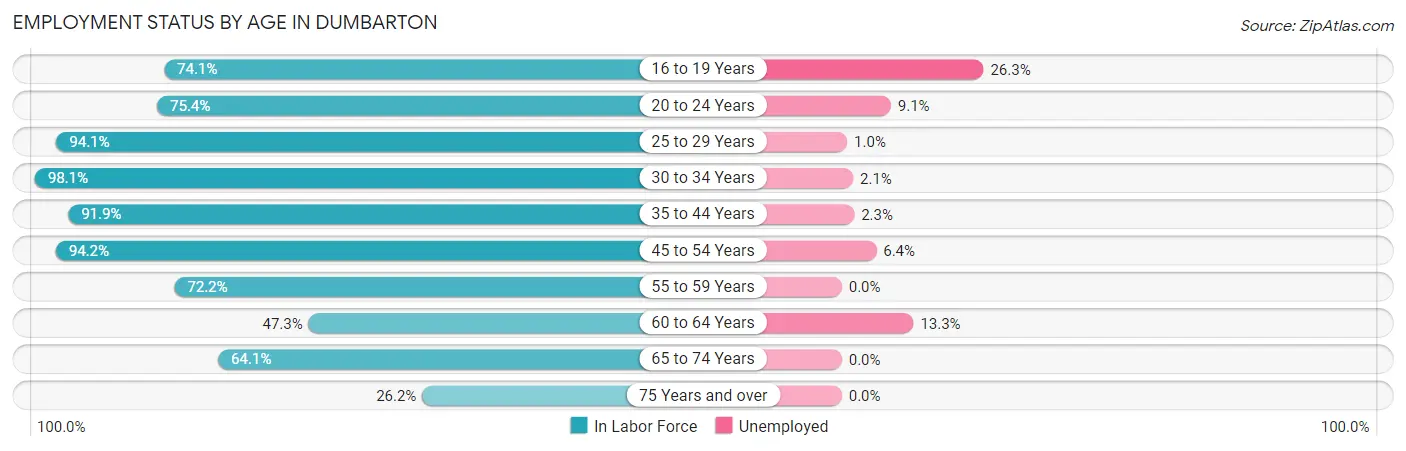
| Age Bracket | In Labor Force | Unemployed |
| 16 to 19 Years | 255 (74.1%) | 67 (26.3%) |
| 20 to 24 Years | 639 (75.4%) | 58 (9.1%) |
| 25 to 29 Years | 953 (94.1%) | 10 (1.0%) |
| 30 to 34 Years | 671 (98.1%) | 14 (2.1%) |
| 35 to 44 Years | 734 (91.9%) | 17 (2.3%) |
| 45 to 54 Years | 818 (94.2%) | 52 (6.4%) |
| 55 to 59 Years | 524 (72.2%) | 0 (0.0%) |
| 60 to 64 Years | 203 (47.3%) | 27 (13.3%) |
| 65 to 74 Years | 526 (64.1%) | 0 (0.0%) |
| 75 Years and over | 179 (26.2%) | 0 (0.0%) |
| Total | 5,505 (76.3%) | 248 (4.5%) |
Employment Status by Educational Attainment in Dumbarton
According to labor force statistics for Dumbarton, 86.4% of individuals (3,904) out of the total population between 25 and 64 years of age (4,519) are in the labor force, with 3.1% or 121 of them being unemployed. The group with the highest labor force participation rate are those with the educational attainment of less than high school, with 89.3% or 773 individuals in the labor force. Within the labor force, individuals with bachelor's degree or higher education have the highest percentage of unemployment, with 4.1% or 46 of them being unemployed.
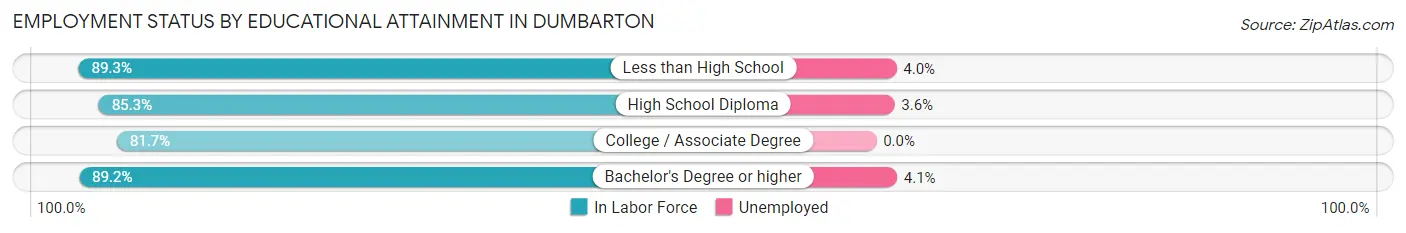
| Educational Attainment | In Labor Force | Unemployed |
| Less than High School | 773 (89.3%) | 35 (4.0%) |
| High School Diploma | 1,187 (85.3%) | 50 (3.6%) |
| College / Associate Degree | 812 (81.7%) | 0 (0.0%) |
| Bachelor's Degree or higher | 1,131 (89.2%) | 52 (4.1%) |
| Total | 3,904 (86.4%) | 140 (3.1%) |
Employment Occupations by Sex in Dumbarton
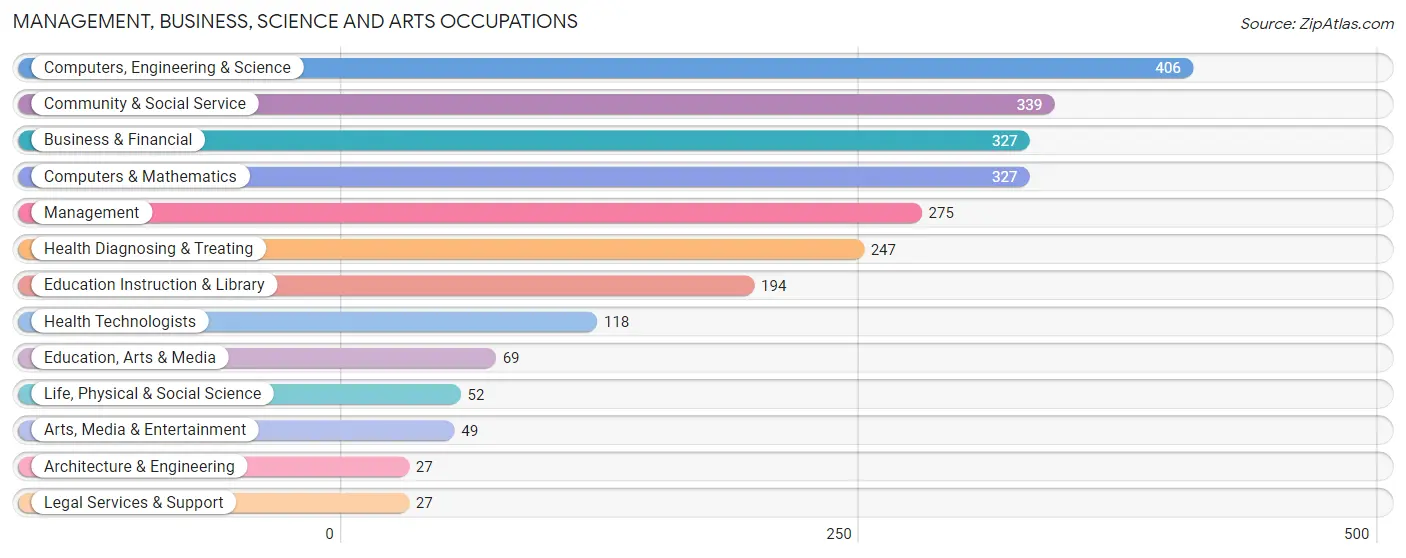
Management, Business, Science and Arts Occupations
The most common Management, Business, Science and Arts occupations in Dumbarton are Computers, Engineering & Science (406 | 7.7%), Community & Social Service (339 | 6.5%), Business & Financial (327 | 6.2%), Computers & Mathematics (327 | 6.2%), and Management (275 | 5.2%).
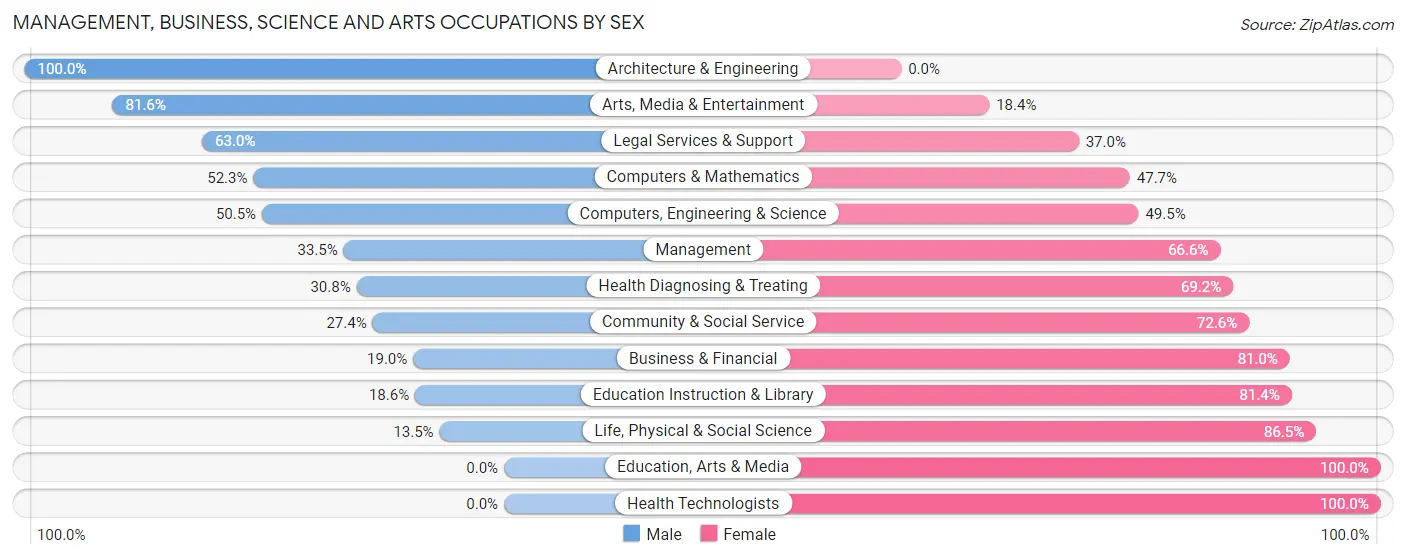
Management, Business, Science and Arts Occupations by Sex
Within the Management, Business, Science and Arts occupations in Dumbarton, the most male-oriented occupations are Architecture & Engineering (100.0%), Arts, Media & Entertainment (81.6%), and Legal Services & Support (63.0%), while the most female-oriented occupations are Education, Arts & Media (100.0%), Health Technologists (100.0%), and Life, Physical & Social Science (86.5%).
| Occupation | Male | Female |
| Management | 92 (33.5%) | 183 (66.5%) |
| Business & Financial | 62 (19.0%) | 265 (81.0%) |
| Computers, Engineering & Science | 205 (50.5%) | 201 (49.5%) |
| Computers & Mathematics | 171 (52.3%) | 156 (47.7%) |
| Architecture & Engineering | 27 (100.0%) | 0 (0.0%) |
| Life, Physical & Social Science | 7 (13.5%) | 45 (86.5%) |
| Community & Social Service | 93 (27.4%) | 246 (72.6%) |
| Education, Arts & Media | 0 (0.0%) | 69 (100.0%) |
| Legal Services & Support | 17 (63.0%) | 10 (37.0%) |
| Education Instruction & Library | 36 (18.6%) | 158 (81.4%) |
| Arts, Media & Entertainment | 40 (81.6%) | 9 (18.4%) |
| Health Diagnosing & Treating | 76 (30.8%) | 171 (69.2%) |
| Health Technologists | 0 (0.0%) | 118 (100.0%) |
| Total (Category) | 528 (33.1%) | 1,066 (66.9%) |
| Total (Overall) | 2,794 (53.2%) | 2,454 (46.8%) |
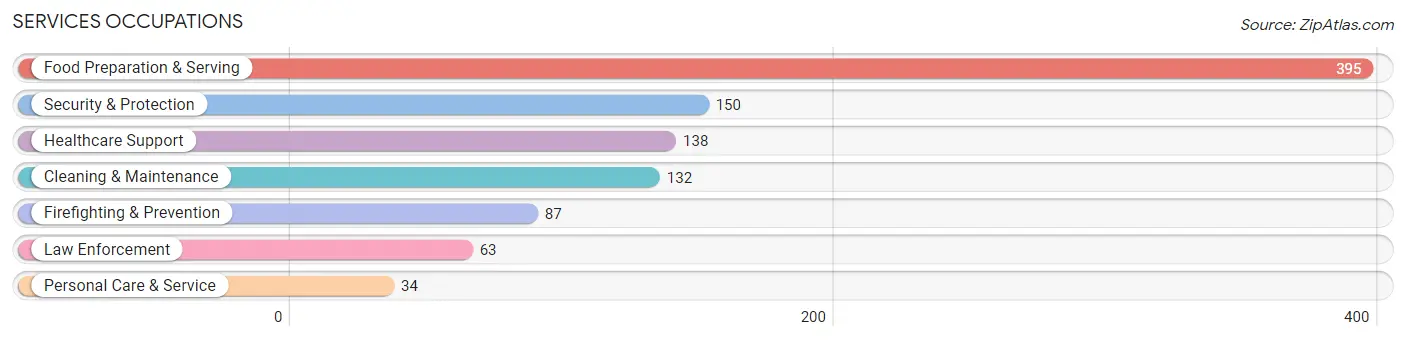
Services Occupations
The most common Services occupations in Dumbarton are Food Preparation & Serving (395 | 7.5%), Security & Protection (150 | 2.9%), Healthcare Support (138 | 2.6%), Cleaning & Maintenance (132 | 2.5%), and Firefighting & Prevention (87 | 1.7%).
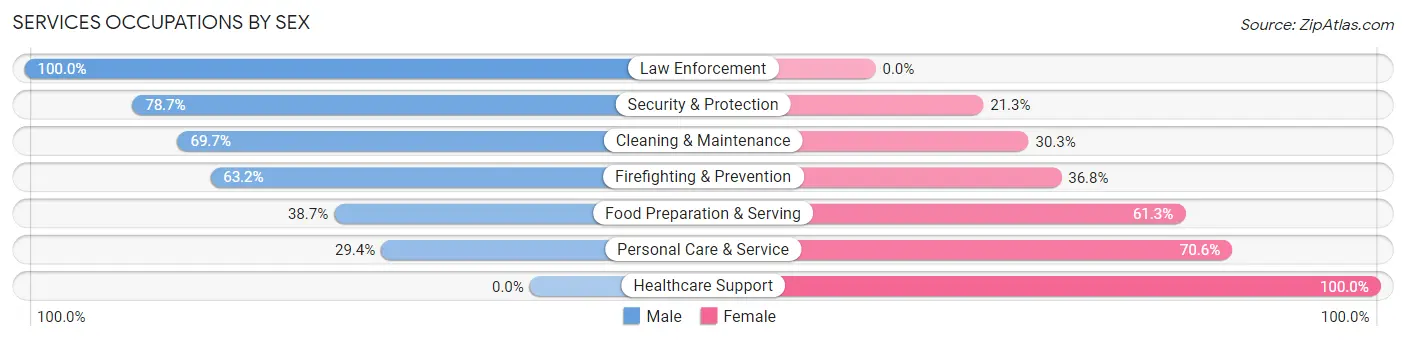
Services Occupations by Sex
Within the Services occupations in Dumbarton, the most male-oriented occupations are Law Enforcement (100.0%), Security & Protection (78.7%), and Cleaning & Maintenance (69.7%), while the most female-oriented occupations are Healthcare Support (100.0%), Personal Care & Service (70.6%), and Food Preparation & Serving (61.3%).
| Occupation | Male | Female |
| Healthcare Support | 0 (0.0%) | 138 (100.0%) |
| Security & Protection | 118 (78.7%) | 32 (21.3%) |
| Firefighting & Prevention | 55 (63.2%) | 32 (36.8%) |
| Law Enforcement | 63 (100.0%) | 0 (0.0%) |
| Food Preparation & Serving | 153 (38.7%) | 242 (61.3%) |
| Cleaning & Maintenance | 92 (69.7%) | 40 (30.3%) |
| Personal Care & Service | 10 (29.4%) | 24 (70.6%) |
| Total (Category) | 373 (43.9%) | 476 (56.1%) |
| Total (Overall) | 2,794 (53.2%) | 2,454 (46.8%) |
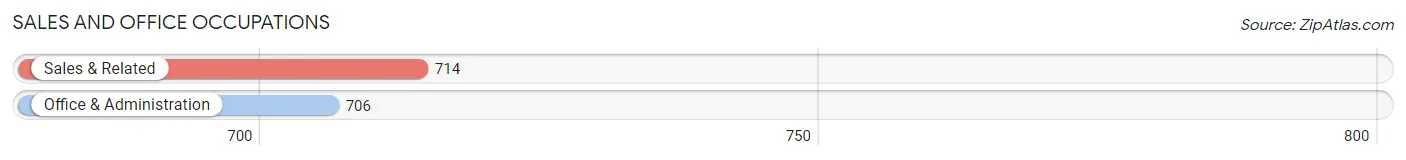
Sales and Office Occupations
The most common Sales and Office occupations in Dumbarton are Sales & Related (714 | 13.6%), and Office & Administration (706 | 13.5%).
Sales and Office Occupations by Sex
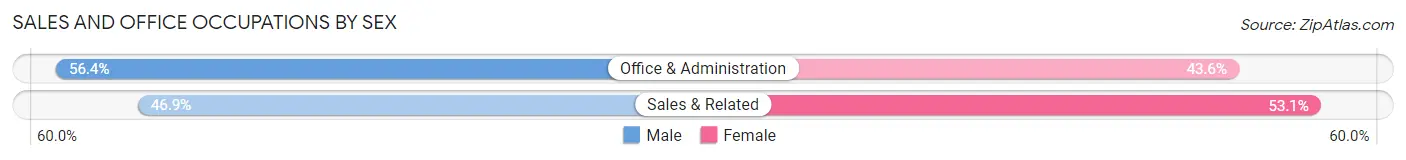
| Occupation | Male | Female |
| Sales & Related | 335 (46.9%) | 379 (53.1%) |
| Office & Administration | 398 (56.4%) | 308 (43.6%) |
| Total (Category) | 733 (51.6%) | 687 (48.4%) |
| Total (Overall) | 2,794 (53.2%) | 2,454 (46.8%) |
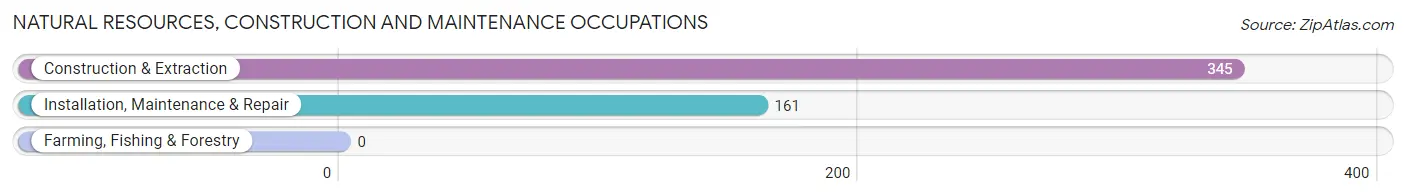
Natural Resources, Construction and Maintenance Occupations
The most common Natural Resources, Construction and Maintenance occupations in Dumbarton are Construction & Extraction (345 | 6.6%), and Installation, Maintenance & Repair (161 | 3.1%).
Natural Resources, Construction and Maintenance Occupations by Sex
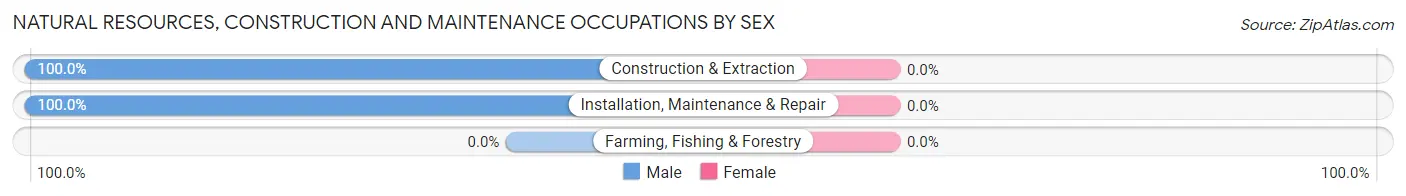
| Occupation | Male | Female |
| Farming, Fishing & Forestry | 0 (0.0%) | 0 (0.0%) |
| Construction & Extraction | 345 (100.0%) | 0 (0.0%) |
| Installation, Maintenance & Repair | 161 (100.0%) | 0 (0.0%) |
| Total (Category) | 506 (100.0%) | 0 (0.0%) |
| Total (Overall) | 2,794 (53.2%) | 2,454 (46.8%) |
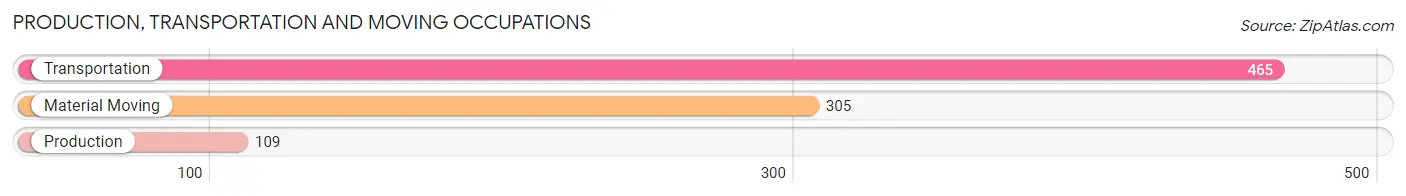
Production, Transportation and Moving Occupations
The most common Production, Transportation and Moving occupations in Dumbarton are Transportation (465 | 8.9%), Material Moving (305 | 5.8%), and Production (109 | 2.1%).
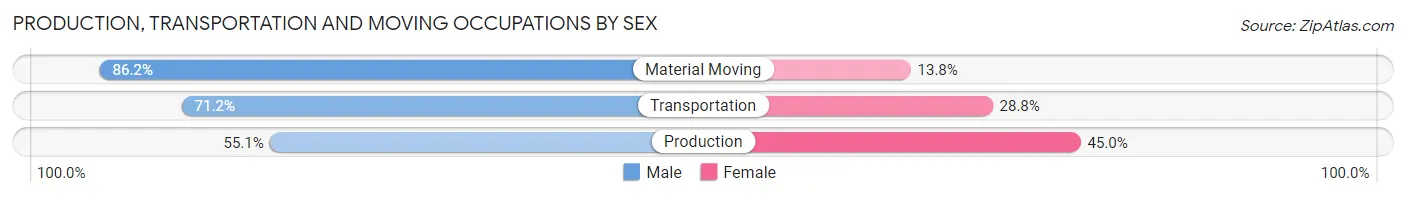
Production, Transportation and Moving Occupations by Sex
| Occupation | Male | Female |
| Production | 60 (55.0%) | 49 (45.0%) |
| Transportation | 331 (71.2%) | 134 (28.8%) |
| Material Moving | 263 (86.2%) | 42 (13.8%) |
| Total (Category) | 654 (74.4%) | 225 (25.6%) |
| Total (Overall) | 2,794 (53.2%) | 2,454 (46.8%) |
Employment Industries by Sex in Dumbarton
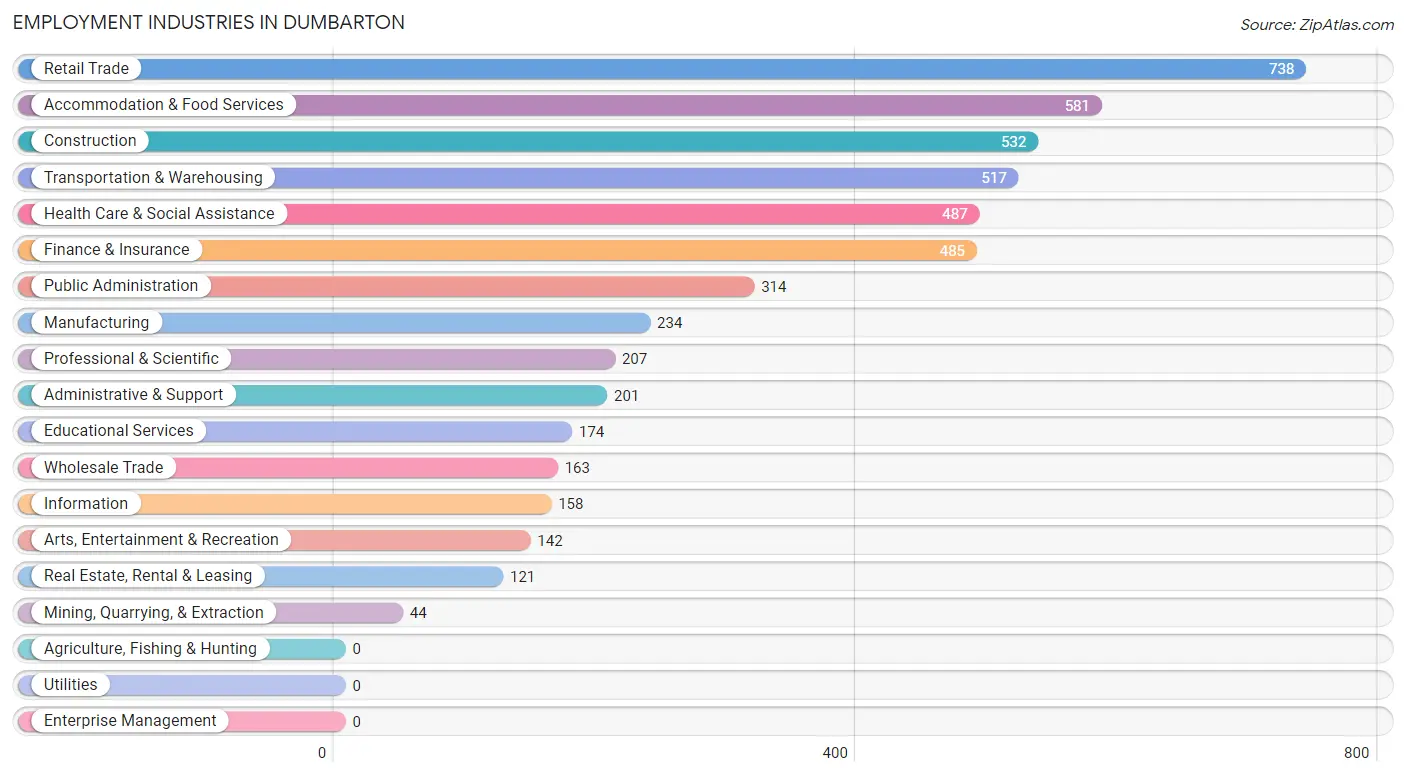
Employment Industries in Dumbarton
The major employment industries in Dumbarton include Retail Trade (738 | 14.1%), Accommodation & Food Services (581 | 11.1%), Construction (532 | 10.1%), Transportation & Warehousing (517 | 9.9%), and Health Care & Social Assistance (487 | 9.3%).
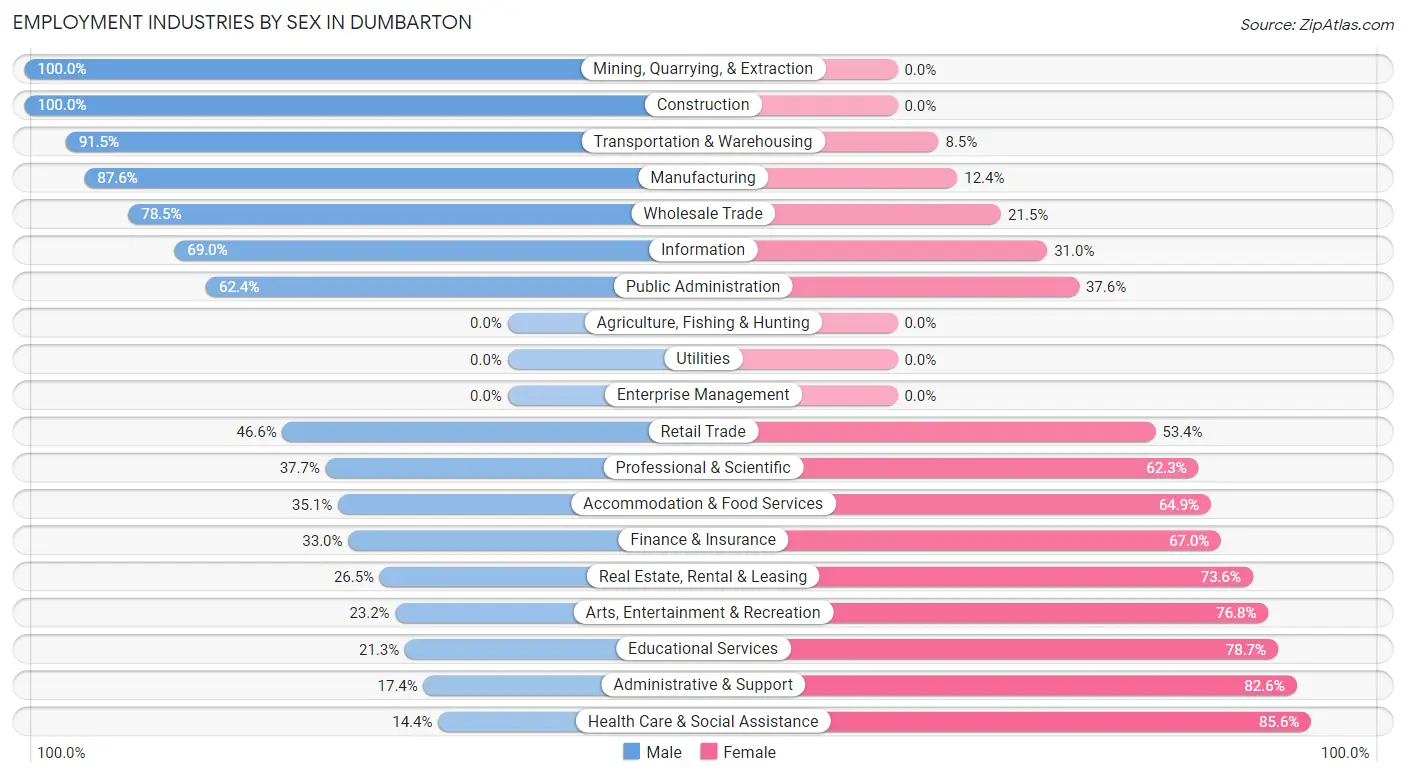
Employment Industries by Sex in Dumbarton
The Dumbarton industries that see more men than women are Mining, Quarrying, & Extraction (100.0%), Construction (100.0%), and Transportation & Warehousing (91.5%), whereas the industries that tend to have a higher number of women are Health Care & Social Assistance (85.6%), Administrative & Support (82.6%), and Educational Services (78.7%).
| Industry | Male | Female |
| Agriculture, Fishing & Hunting | 0 (0.0%) | 0 (0.0%) |
| Mining, Quarrying, & Extraction | 44 (100.0%) | 0 (0.0%) |
| Construction | 532 (100.0%) | 0 (0.0%) |
| Manufacturing | 205 (87.6%) | 29 (12.4%) |
| Wholesale Trade | 128 (78.5%) | 35 (21.5%) |
| Retail Trade | 344 (46.6%) | 394 (53.4%) |
| Transportation & Warehousing | 473 (91.5%) | 44 (8.5%) |
| Utilities | 0 (0.0%) | 0 (0.0%) |
| Information | 109 (69.0%) | 49 (31.0%) |
| Finance & Insurance | 160 (33.0%) | 325 (67.0%) |
| Real Estate, Rental & Leasing | 32 (26.5%) | 89 (73.6%) |
| Professional & Scientific | 78 (37.7%) | 129 (62.3%) |
| Enterprise Management | 0 (0.0%) | 0 (0.0%) |
| Administrative & Support | 35 (17.4%) | 166 (82.6%) |
| Educational Services | 37 (21.3%) | 137 (78.7%) |
| Health Care & Social Assistance | 70 (14.4%) | 417 (85.6%) |
| Arts, Entertainment & Recreation | 33 (23.2%) | 109 (76.8%) |
| Accommodation & Food Services | 204 (35.1%) | 377 (64.9%) |
| Public Administration | 196 (62.4%) | 118 (37.6%) |
| Total | 2,794 (53.2%) | 2,454 (46.8%) |
Education in Dumbarton
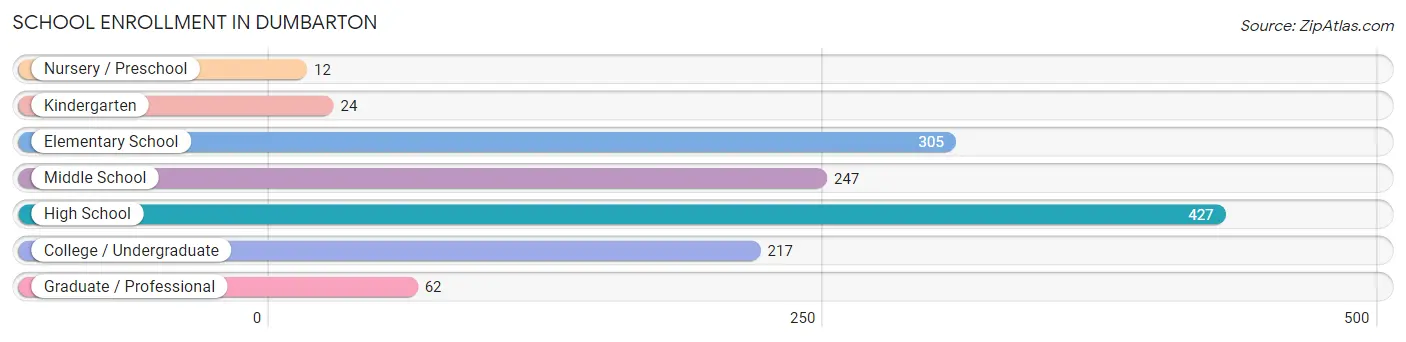
School Enrollment in Dumbarton
The most common levels of schooling among the 1,294 students in Dumbarton are high school (427 | 33.0%), elementary school (305 | 23.6%), and middle school (247 | 19.1%).
| School Level | # Students | % Students |
| Nursery / Preschool | 12 | 0.9% |
| Kindergarten | 24 | 1.8% |
| Elementary School | 305 | 23.6% |
| Middle School | 247 | 19.1% |
| High School | 427 | 33.0% |
| College / Undergraduate | 217 | 16.8% |
| Graduate / Professional | 62 | 4.8% |
| Total | 1,294 | 100.0% |
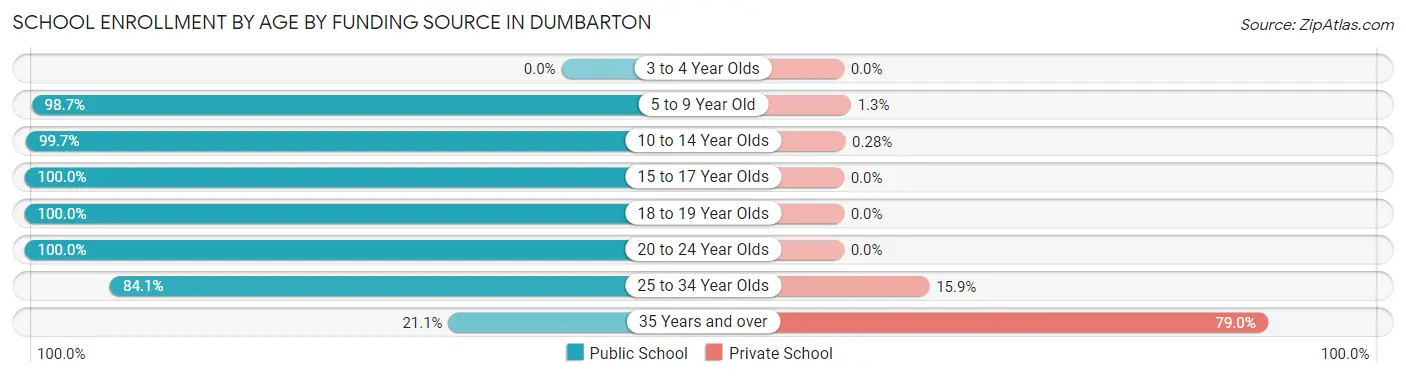
School Enrollment by Age by Funding Source in Dumbarton
Out of a total of 1,294 students who are enrolled in schools in Dumbarton, 69 (5.3%) attend a private institution, while the remaining 1,225 (94.7%) are enrolled in public schools. The age group of 35 years and over has the highest likelihood of being enrolled in private schools, with 45 (78.9% in the age bracket) enrolled. Conversely, the age group of 15 to 17 year olds has the lowest likelihood of being enrolled in a private school, with 149 (100.0% in the age bracket) attending a public institution.
| Age Bracket | Public School | Private School |
| 3 to 4 Year Olds | 0 (0.0%) | 0 (0.0%) |
| 5 to 9 Year Old | 299 (98.7%) | 4 (1.3%) |
| 10 to 14 Year Olds | 352 (99.7%) | 1 (0.3%) |
| 15 to 17 Year Olds | 149 (100.0%) | 0 (0.0%) |
| 18 to 19 Year Olds | 154 (100.0%) | 0 (0.0%) |
| 20 to 24 Year Olds | 165 (100.0%) | 0 (0.0%) |
| 25 to 34 Year Olds | 95 (84.1%) | 18 (15.9%) |
| 35 Years and over | 12 (21.0%) | 45 (78.9%) |
| Total | 1,225 (94.7%) | 69 (5.3%) |
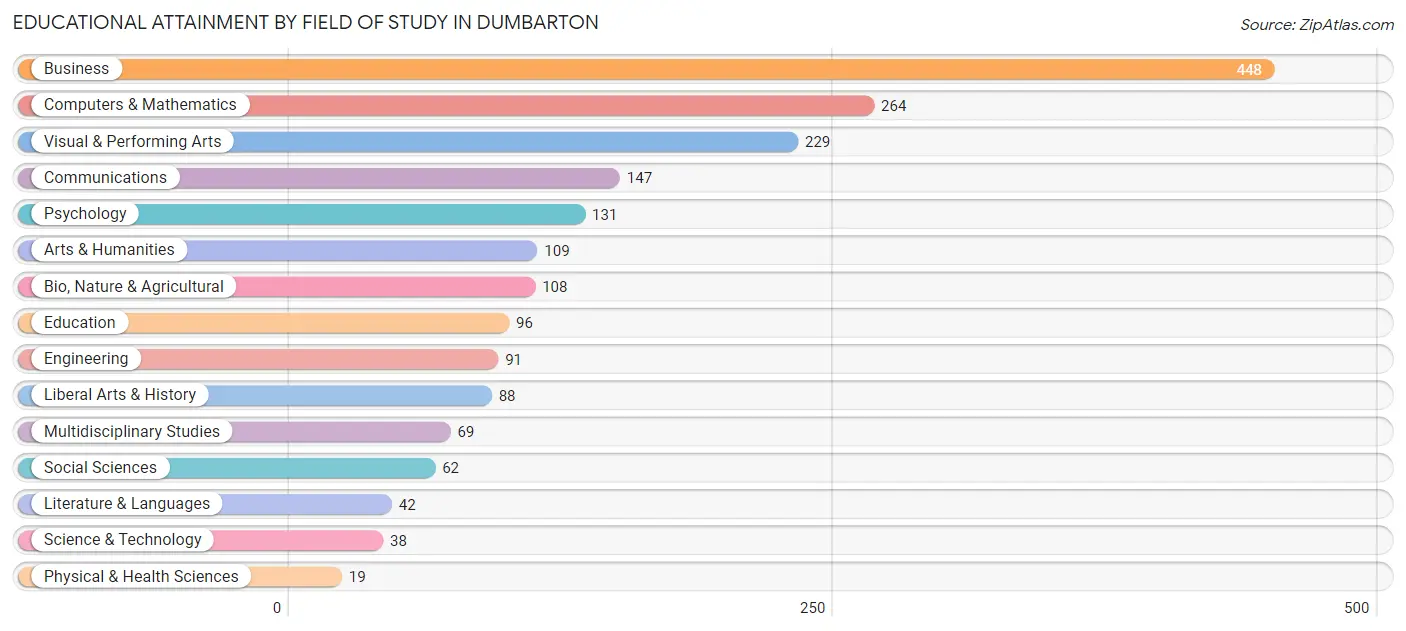
Educational Attainment by Field of Study in Dumbarton
Business (448 | 23.1%), computers & mathematics (264 | 13.6%), visual & performing arts (229 | 11.8%), communications (147 | 7.6%), and psychology (131 | 6.8%) are the most common fields of study among 1,941 individuals in Dumbarton who have obtained a bachelor's degree or higher.
| Field of Study | # Graduates | % Graduates |
| Computers & Mathematics | 264 | 13.6% |
| Bio, Nature & Agricultural | 108 | 5.6% |
| Physical & Health Sciences | 19 | 1.0% |
| Psychology | 131 | 6.8% |
| Social Sciences | 62 | 3.2% |
| Engineering | 91 | 4.7% |
| Multidisciplinary Studies | 69 | 3.5% |
| Science & Technology | 38 | 2.0% |
| Business | 448 | 23.1% |
| Education | 96 | 5.0% |
| Literature & Languages | 42 | 2.2% |
| Liberal Arts & History | 88 | 4.5% |
| Visual & Performing Arts | 229 | 11.8% |
| Communications | 147 | 7.6% |
| Arts & Humanities | 109 | 5.6% |
| Total | 1,941 | 100.0% |
Transportation & Commute in Dumbarton
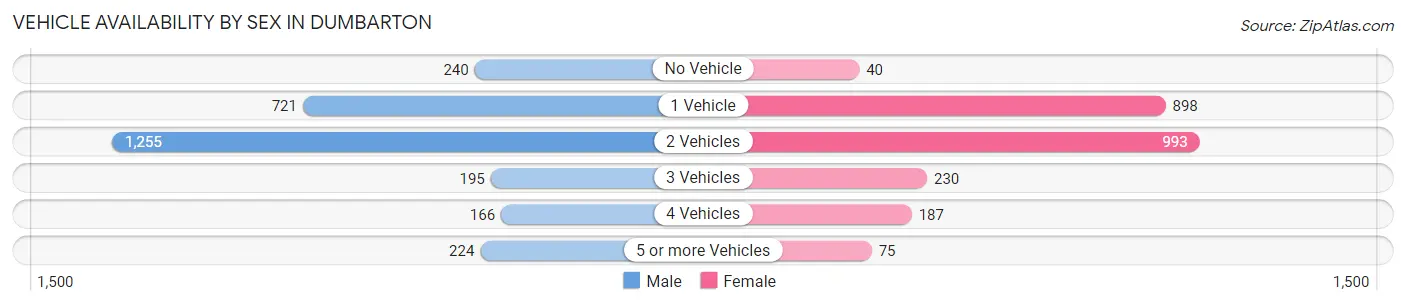
Vehicle Availability by Sex in Dumbarton
The most prevalent vehicle ownership categories in Dumbarton are males with 2 vehicles (1,255, accounting for 44.8%) and females with 2 vehicles (993, making up 51.8%).
| Vehicles Available | Male | Female |
| No Vehicle | 240 (8.6%) | 40 (1.7%) |
| 1 Vehicle | 721 (25.7%) | 898 (37.1%) |
| 2 Vehicles | 1,255 (44.8%) | 993 (41.0%) |
| 3 Vehicles | 195 (7.0%) | 230 (9.5%) |
| 4 Vehicles | 166 (5.9%) | 187 (7.7%) |
| 5 or more Vehicles | 224 (8.0%) | 75 (3.1%) |
| Total | 2,801 (100.0%) | 2,423 (100.0%) |
Commute Time in Dumbarton
The most frequently occuring commute durations in Dumbarton are 20 to 24 minutes (940 commuters, 21.3%), 15 to 19 minutes (724 commuters, 16.4%), and 5 to 9 minutes (699 commuters, 15.8%).
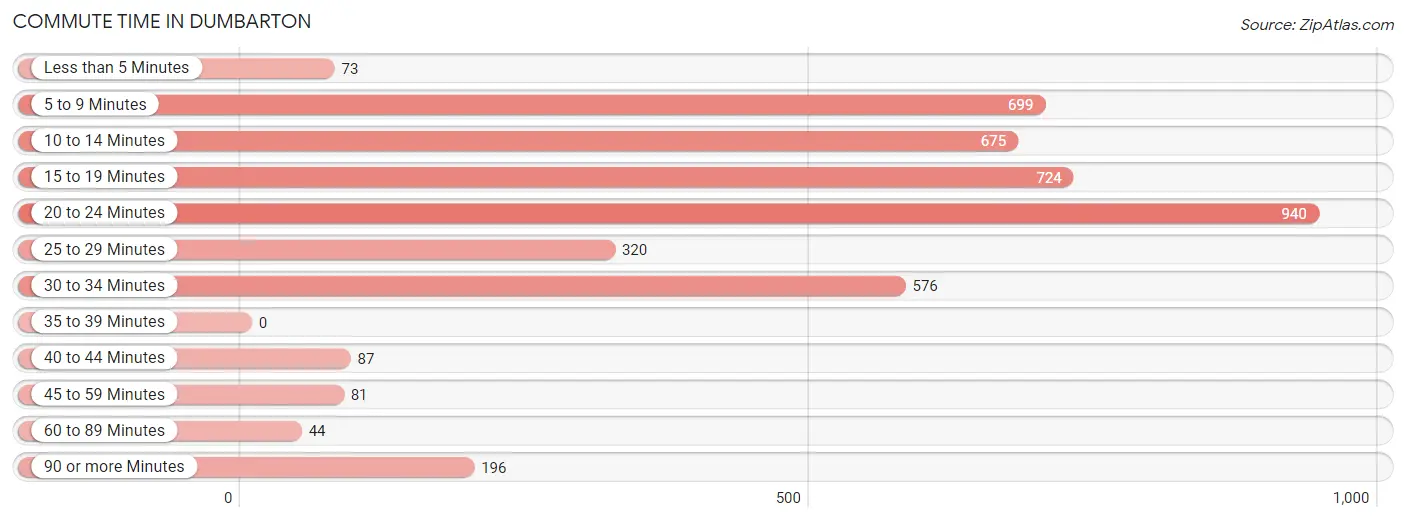
| Commute Time | # Commuters | % Commuters |
| Less than 5 Minutes | 73 | 1.7% |
| 5 to 9 Minutes | 699 | 15.8% |
| 10 to 14 Minutes | 675 | 15.3% |
| 15 to 19 Minutes | 724 | 16.4% |
| 20 to 24 Minutes | 940 | 21.3% |
| 25 to 29 Minutes | 320 | 7.2% |
| 30 to 34 Minutes | 576 | 13.1% |
| 35 to 39 Minutes | 0 | 0.0% |
| 40 to 44 Minutes | 87 | 2.0% |
| 45 to 59 Minutes | 81 | 1.8% |
| 60 to 89 Minutes | 44 | 1.0% |
| 90 or more Minutes | 196 | 4.4% |
Commute Time by Sex in Dumbarton
The most common commute times in Dumbarton are 20 to 24 minutes (706 commuters, 28.4%) for males and 5 to 9 minutes (459 commuters, 23.8%) for females.
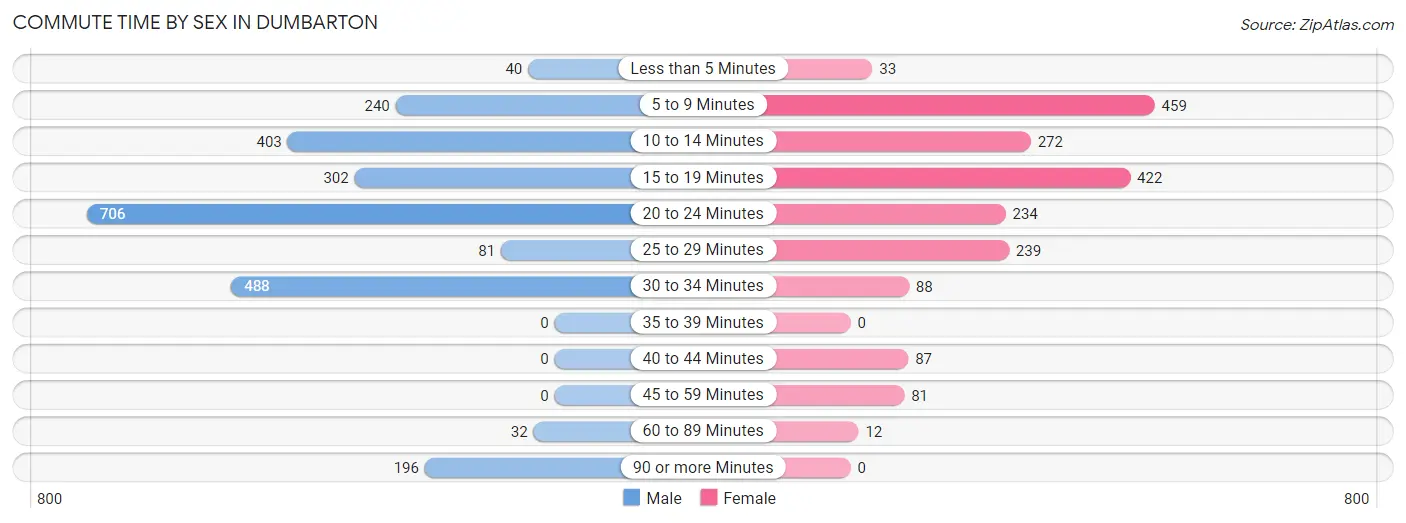
| Commute Time | Male | Female |
| Less than 5 Minutes | 40 (1.6%) | 33 (1.7%) |
| 5 to 9 Minutes | 240 (9.7%) | 459 (23.8%) |
| 10 to 14 Minutes | 403 (16.2%) | 272 (14.1%) |
| 15 to 19 Minutes | 302 (12.1%) | 422 (21.9%) |
| 20 to 24 Minutes | 706 (28.4%) | 234 (12.1%) |
| 25 to 29 Minutes | 81 (3.3%) | 239 (12.4%) |
| 30 to 34 Minutes | 488 (19.6%) | 88 (4.6%) |
| 35 to 39 Minutes | 0 (0.0%) | 0 (0.0%) |
| 40 to 44 Minutes | 0 (0.0%) | 87 (4.5%) |
| 45 to 59 Minutes | 0 (0.0%) | 81 (4.2%) |
| 60 to 89 Minutes | 32 (1.3%) | 12 (0.6%) |
| 90 or more Minutes | 196 (7.9%) | 0 (0.0%) |
Time of Departure to Work by Sex in Dumbarton
The most frequent times of departure to work in Dumbarton are 8:00 AM to 8:29 AM (489, 19.7%) for males and 8:30 AM to 8:59 AM (377, 19.6%) for females.
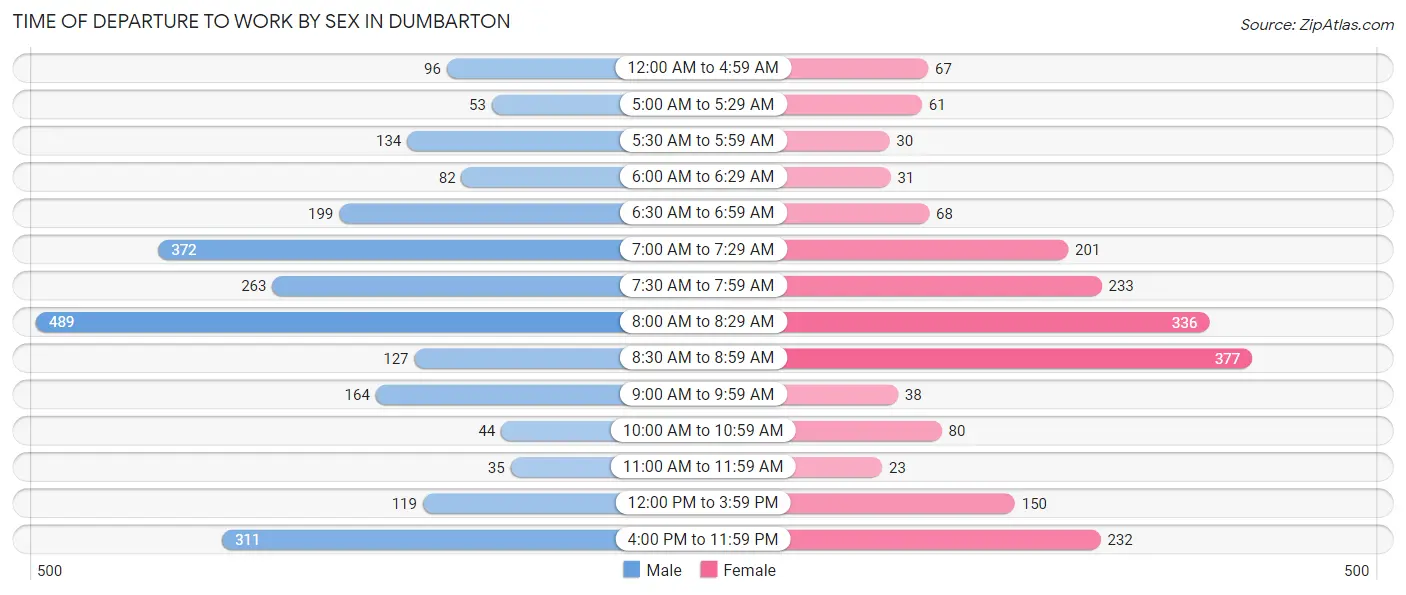
| Time of Departure | Male | Female |
| 12:00 AM to 4:59 AM | 96 (3.9%) | 67 (3.5%) |
| 5:00 AM to 5:29 AM | 53 (2.1%) | 61 (3.2%) |
| 5:30 AM to 5:59 AM | 134 (5.4%) | 30 (1.6%) |
| 6:00 AM to 6:29 AM | 82 (3.3%) | 31 (1.6%) |
| 6:30 AM to 6:59 AM | 199 (8.0%) | 68 (3.5%) |
| 7:00 AM to 7:29 AM | 372 (14.9%) | 201 (10.4%) |
| 7:30 AM to 7:59 AM | 263 (10.6%) | 233 (12.1%) |
| 8:00 AM to 8:29 AM | 489 (19.7%) | 336 (17.4%) |
| 8:30 AM to 8:59 AM | 127 (5.1%) | 377 (19.6%) |
| 9:00 AM to 9:59 AM | 164 (6.6%) | 38 (2.0%) |
| 10:00 AM to 10:59 AM | 44 (1.8%) | 80 (4.2%) |
| 11:00 AM to 11:59 AM | 35 (1.4%) | 23 (1.2%) |
| 12:00 PM to 3:59 PM | 119 (4.8%) | 150 (7.8%) |
| 4:00 PM to 11:59 PM | 311 (12.5%) | 232 (12.0%) |
| Total | 2,488 (100.0%) | 1,927 (100.0%) |
Housing Occupancy in Dumbarton
Occupancy by Ownership in Dumbarton
Of the total 3,921 dwellings in Dumbarton, owner-occupied units account for 1,208 (30.8%), while renter-occupied units make up 2,713 (69.2%).
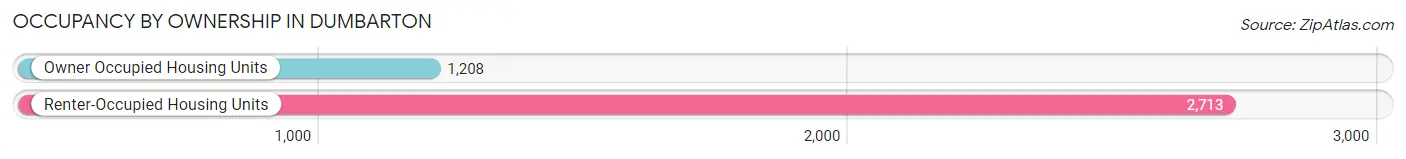
| Occupancy | # Housing Units | % Housing Units |
| Owner Occupied Housing Units | 1,208 | 30.8% |
| Renter-Occupied Housing Units | 2,713 | 69.2% |
| Total Occupied Housing Units | 3,921 | 100.0% |
Occupancy by Household Size in Dumbarton
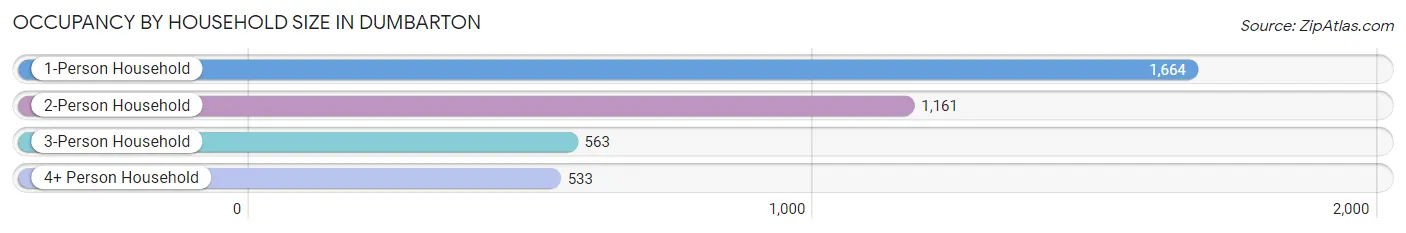
| Household Size | # Housing Units | % Housing Units |
| 1-Person Household | 1,664 | 42.4% |
| 2-Person Household | 1,161 | 29.6% |
| 3-Person Household | 563 | 14.4% |
| 4+ Person Household | 533 | 13.6% |
| Total Housing Units | 3,921 | 100.0% |
Occupancy by Ownership by Household Size in Dumbarton
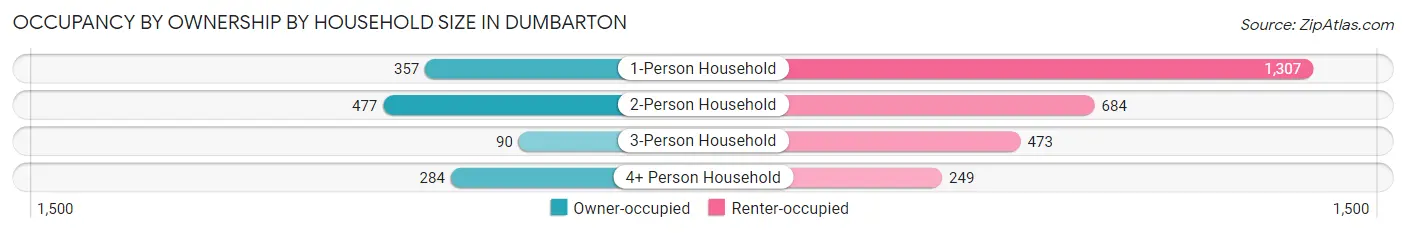
| Household Size | Owner-occupied | Renter-occupied |
| 1-Person Household | 357 (21.4%) | 1,307 (78.5%) |
| 2-Person Household | 477 (41.1%) | 684 (58.9%) |
| 3-Person Household | 90 (16.0%) | 473 (84.0%) |
| 4+ Person Household | 284 (53.3%) | 249 (46.7%) |
| Total Housing Units | 1,208 (30.8%) | 2,713 (69.2%) |
Occupancy by Educational Attainment in Dumbarton
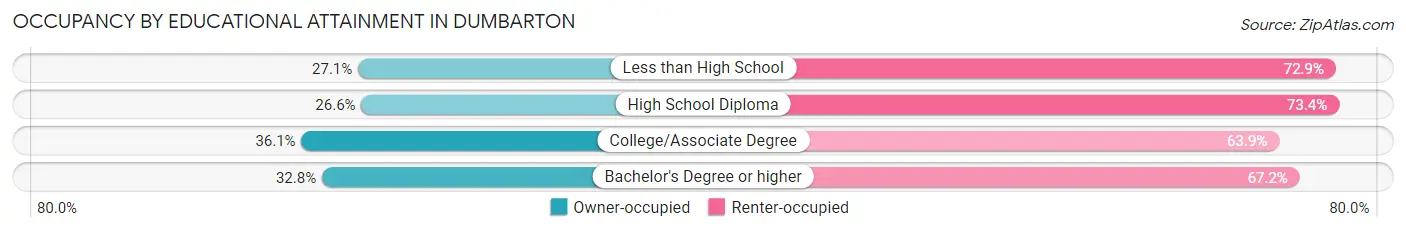
| Household Size | Owner-occupied | Renter-occupied |
| Less than High School | 203 (27.1%) | 546 (72.9%) |
| High School Diploma | 282 (26.6%) | 779 (73.4%) |
| College/Associate Degree | 332 (36.1%) | 588 (63.9%) |
| Bachelor's Degree or higher | 391 (32.8%) | 800 (67.2%) |
Occupancy by Age of Householder in Dumbarton
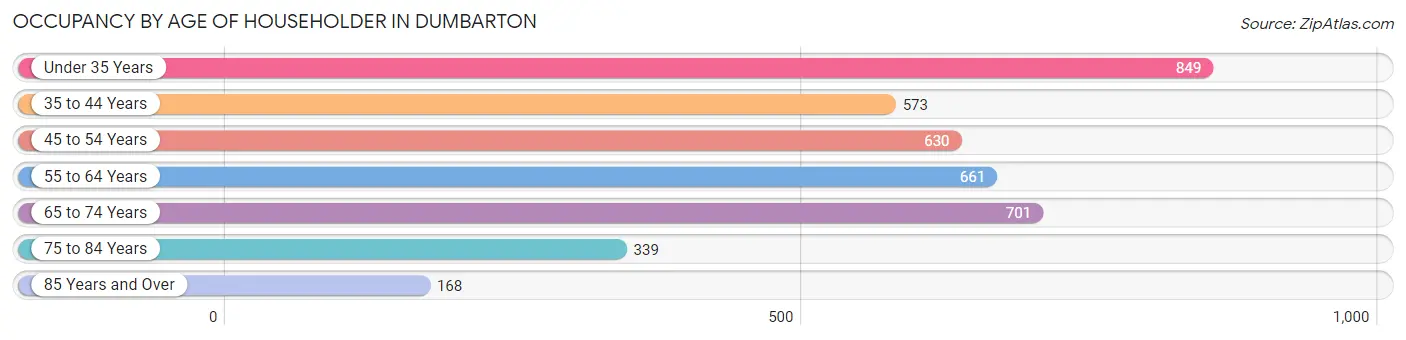
| Age Bracket | # Households | % Households |
| Under 35 Years | 849 | 21.6% |
| 35 to 44 Years | 573 | 14.6% |
| 45 to 54 Years | 630 | 16.1% |
| 55 to 64 Years | 661 | 16.9% |
| 65 to 74 Years | 701 | 17.9% |
| 75 to 84 Years | 339 | 8.6% |
| 85 Years and Over | 168 | 4.3% |
| Total | 3,921 | 100.0% |
Housing Finances in Dumbarton
Median Income by Occupancy in Dumbarton
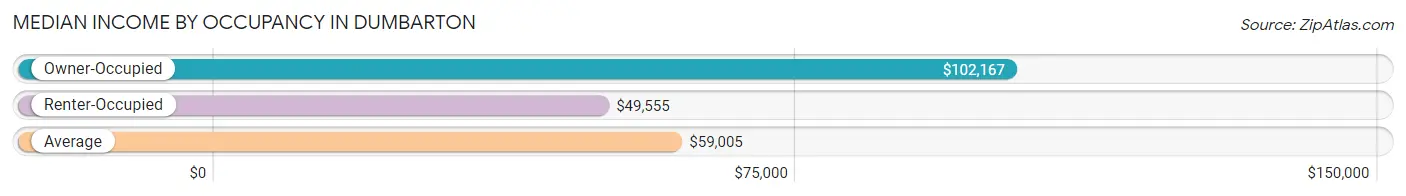
| Occupancy Type | # Households | Median Income |
| Owner-Occupied | 1,208 (30.8%) | $102,167 |
| Renter-Occupied | 2,713 (69.2%) | $49,555 |
| Average | 3,921 (100.0%) | $59,005 |
Occupancy by Householder Income Bracket in Dumbarton
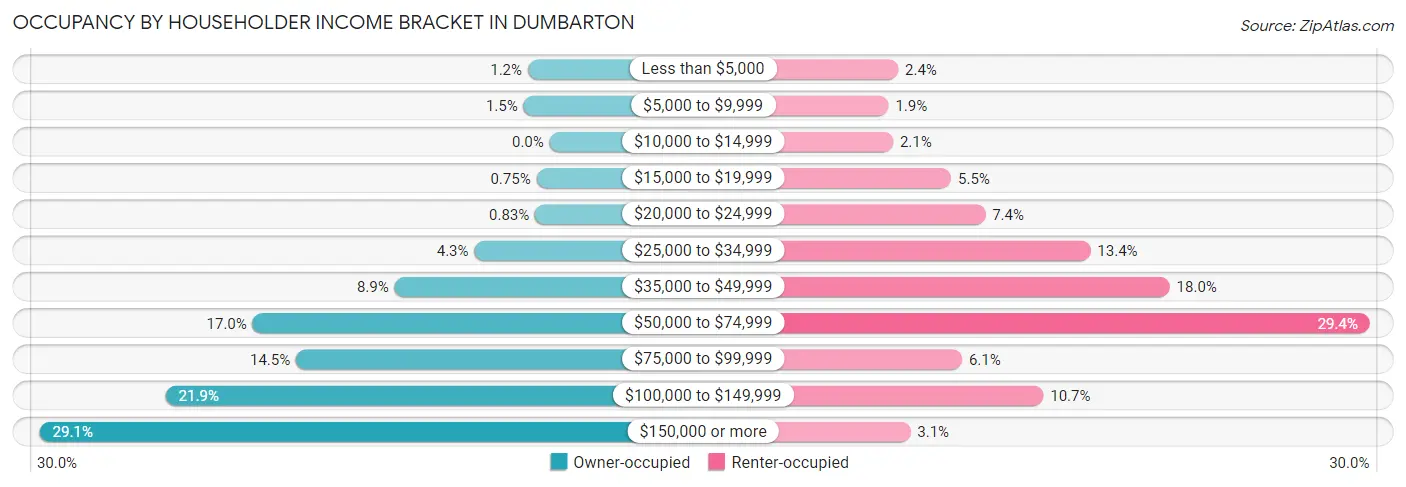
| Income Bracket | Owner-occupied | Renter-occupied |
| Less than $5,000 | 15 (1.2%) | 66 (2.4%) |
| $5,000 to $9,999 | 18 (1.5%) | 51 (1.9%) |
| $10,000 to $14,999 | 0 (0.0%) | 58 (2.1%) |
| $15,000 to $19,999 | 9 (0.7%) | 148 (5.5%) |
| $20,000 to $24,999 | 10 (0.8%) | 201 (7.4%) |
| $25,000 to $34,999 | 52 (4.3%) | 364 (13.4%) |
| $35,000 to $49,999 | 107 (8.9%) | 487 (17.9%) |
| $50,000 to $74,999 | 205 (17.0%) | 797 (29.4%) |
| $75,000 to $99,999 | 175 (14.5%) | 165 (6.1%) |
| $100,000 to $149,999 | 265 (21.9%) | 291 (10.7%) |
| $150,000 or more | 352 (29.1%) | 85 (3.1%) |
| Total | 1,208 (100.0%) | 2,713 (100.0%) |
Monthly Housing Cost Tiers in Dumbarton
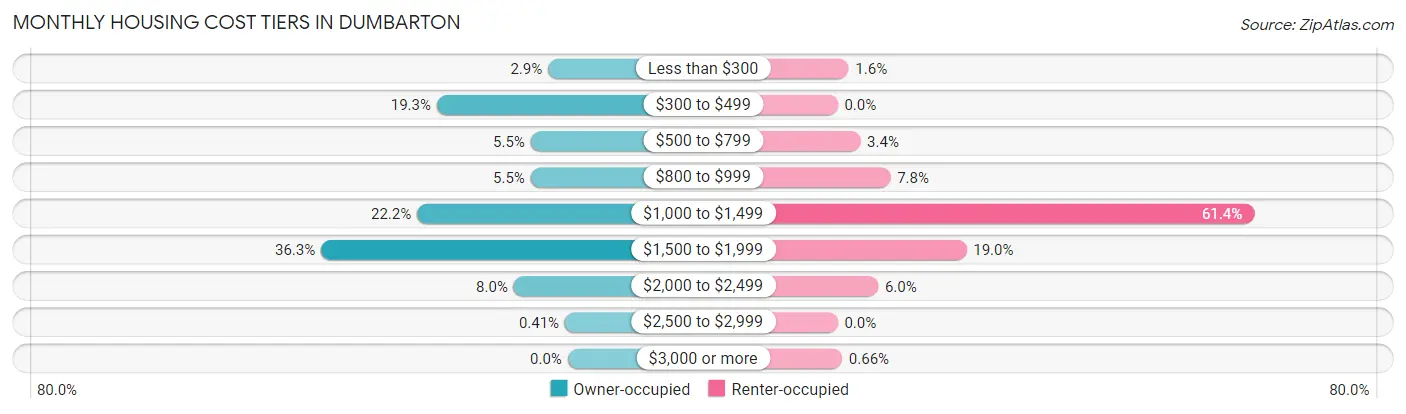
| Monthly Cost | Owner-occupied | Renter-occupied |
| Less than $300 | 35 (2.9%) | 44 (1.6%) |
| $300 to $499 | 233 (19.3%) | 0 (0.0%) |
| $500 to $799 | 66 (5.5%) | 91 (3.4%) |
| $800 to $999 | 66 (5.5%) | 211 (7.8%) |
| $1,000 to $1,499 | 268 (22.2%) | 1,665 (61.4%) |
| $1,500 to $1,999 | 439 (36.3%) | 515 (19.0%) |
| $2,000 to $2,499 | 96 (8.0%) | 162 (6.0%) |
| $2,500 to $2,999 | 5 (0.4%) | 0 (0.0%) |
| $3,000 or more | 0 (0.0%) | 18 (0.7%) |
| Total | 1,208 (100.0%) | 2,713 (100.0%) |
Physical Housing Characteristics in Dumbarton
Housing Structures in Dumbarton
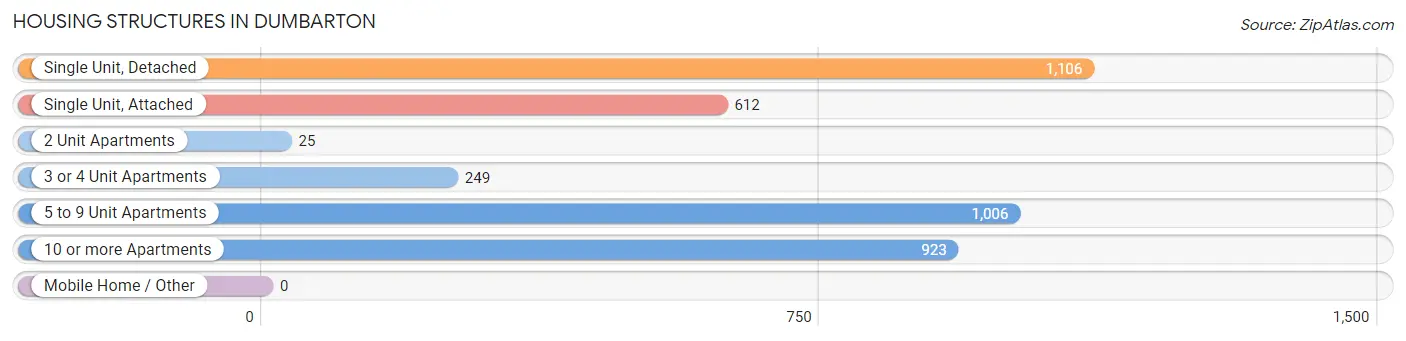
| Structure Type | # Housing Units | % Housing Units |
| Single Unit, Detached | 1,106 | 28.2% |
| Single Unit, Attached | 612 | 15.6% |
| 2 Unit Apartments | 25 | 0.6% |
| 3 or 4 Unit Apartments | 249 | 6.4% |
| 5 to 9 Unit Apartments | 1,006 | 25.7% |
| 10 or more Apartments | 923 | 23.5% |
| Mobile Home / Other | 0 | 0.0% |
| Total | 3,921 | 100.0% |
Housing Structures by Occupancy in Dumbarton
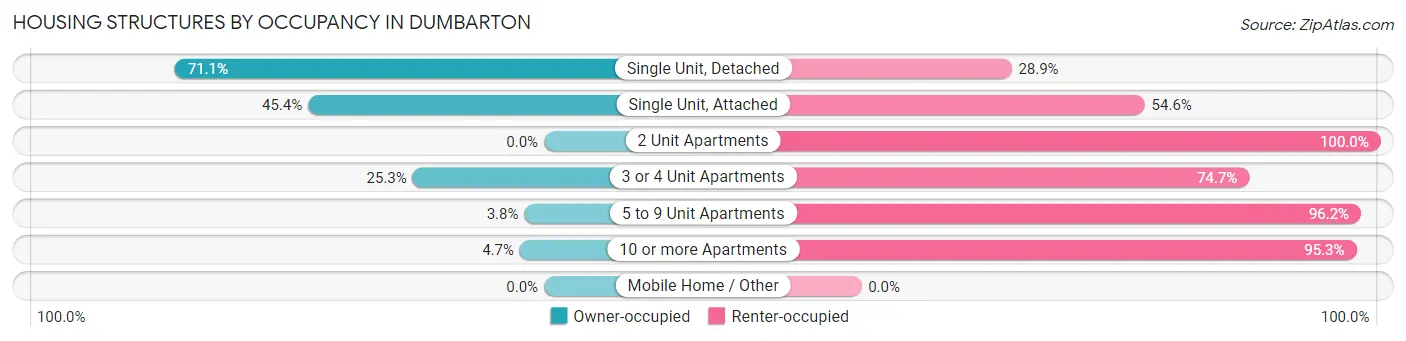
| Structure Type | Owner-occupied | Renter-occupied |
| Single Unit, Detached | 786 (71.1%) | 320 (28.9%) |
| Single Unit, Attached | 278 (45.4%) | 334 (54.6%) |
| 2 Unit Apartments | 0 (0.0%) | 25 (100.0%) |
| 3 or 4 Unit Apartments | 63 (25.3%) | 186 (74.7%) |
| 5 to 9 Unit Apartments | 38 (3.8%) | 968 (96.2%) |
| 10 or more Apartments | 43 (4.7%) | 880 (95.3%) |
| Mobile Home / Other | 0 (0.0%) | 0 (0.0%) |
| Total | 1,208 (30.8%) | 2,713 (69.2%) |
Housing Structures by Number of Rooms in Dumbarton
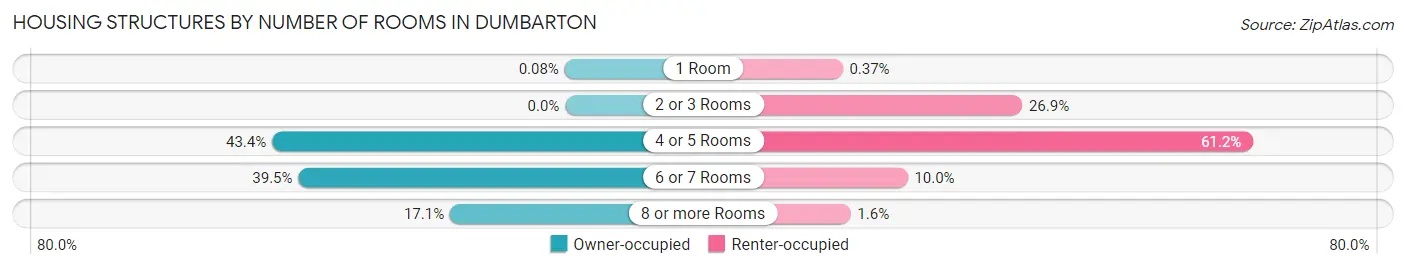
| Number of Rooms | Owner-occupied | Renter-occupied |
| 1 Room | 1 (0.1%) | 10 (0.4%) |
| 2 or 3 Rooms | 0 (0.0%) | 731 (26.9%) |
| 4 or 5 Rooms | 524 (43.4%) | 1,659 (61.2%) |
| 6 or 7 Rooms | 477 (39.5%) | 271 (10.0%) |
| 8 or more Rooms | 206 (17.1%) | 42 (1.5%) |
| Total | 1,208 (100.0%) | 2,713 (100.0%) |
Housing Structure by Heating Type in Dumbarton
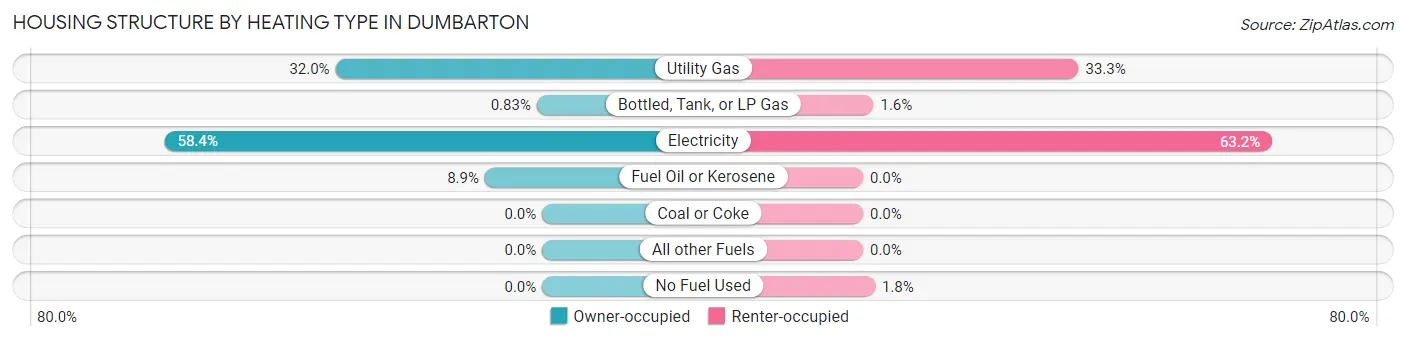
| Heating Type | Owner-occupied | Renter-occupied |
| Utility Gas | 386 (32.0%) | 904 (33.3%) |
| Bottled, Tank, or LP Gas | 10 (0.8%) | 44 (1.6%) |
| Electricity | 705 (58.4%) | 1,715 (63.2%) |
| Fuel Oil or Kerosene | 107 (8.9%) | 0 (0.0%) |
| Coal or Coke | 0 (0.0%) | 0 (0.0%) |
| All other Fuels | 0 (0.0%) | 0 (0.0%) |
| No Fuel Used | 0 (0.0%) | 50 (1.8%) |
| Total | 1,208 (100.0%) | 2,713 (100.0%) |
Household Vehicle Usage in Dumbarton
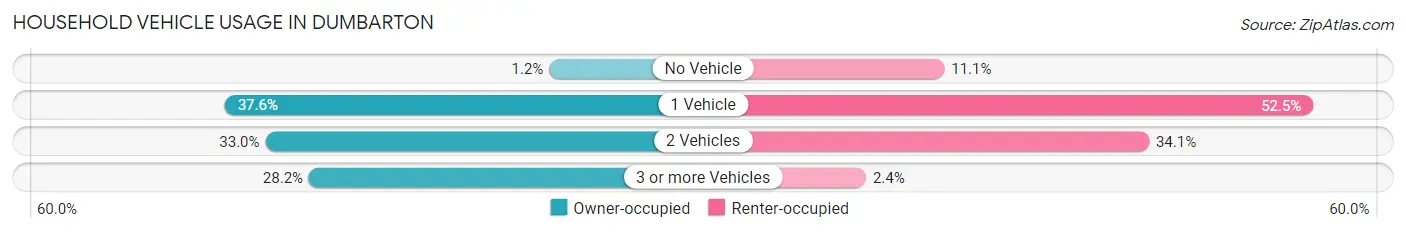
| Vehicles per Household | Owner-occupied | Renter-occupied |
| No Vehicle | 15 (1.2%) | 302 (11.1%) |
| 1 Vehicle | 454 (37.6%) | 1,423 (52.4%) |
| 2 Vehicles | 399 (33.0%) | 924 (34.1%) |
| 3 or more Vehicles | 340 (28.1%) | 64 (2.4%) |
| Total | 1,208 (100.0%) | 2,713 (100.0%) |
Real Estate & Mortgages in Dumbarton
Real Estate and Mortgage Overview in Dumbarton
| Characteristic | Without Mortgage | With Mortgage |
| Housing Units | 405 | 803 |
| Median Property Value | $162,700 | $285,900 |
| Median Household Income | $102,417 | $183 |
| Monthly Housing Costs | $391 | $0 |
| Real Estate Taxes | $1,259 | $17 |
Property Value by Mortgage Status in Dumbarton
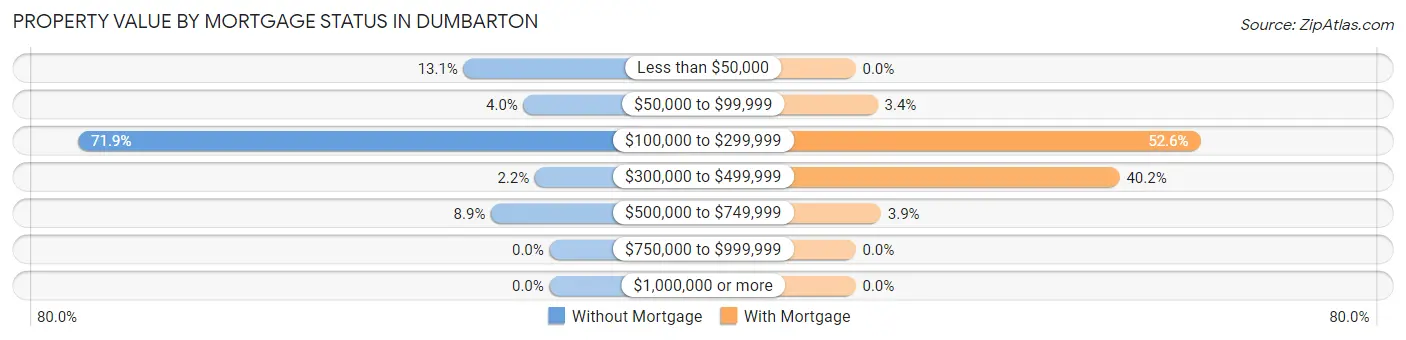
| Property Value | Without Mortgage | With Mortgage |
| Less than $50,000 | 53 (13.1%) | 0 (0.0%) |
| $50,000 to $99,999 | 16 (4.0%) | 27 (3.4%) |
| $100,000 to $299,999 | 291 (71.9%) | 422 (52.5%) |
| $300,000 to $499,999 | 9 (2.2%) | 323 (40.2%) |
| $500,000 to $749,999 | 36 (8.9%) | 31 (3.9%) |
| $750,000 to $999,999 | 0 (0.0%) | 0 (0.0%) |
| $1,000,000 or more | 0 (0.0%) | 0 (0.0%) |
| Total | 405 (100.0%) | 803 (100.0%) |
Household Income by Mortgage Status in Dumbarton
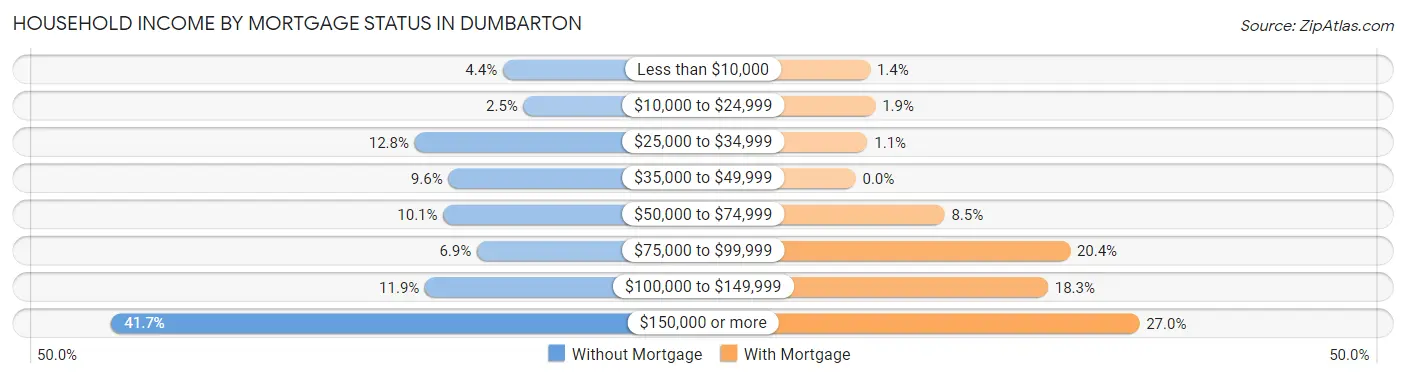
| Household Income | Without Mortgage | With Mortgage |
| Less than $10,000 | 18 (4.4%) | 11 (1.4%) |
| $10,000 to $24,999 | 10 (2.5%) | 15 (1.9%) |
| $25,000 to $34,999 | 52 (12.8%) | 9 (1.1%) |
| $35,000 to $49,999 | 39 (9.6%) | 0 (0.0%) |
| $50,000 to $74,999 | 41 (10.1%) | 68 (8.5%) |
| $75,000 to $99,999 | 28 (6.9%) | 164 (20.4%) |
| $100,000 to $149,999 | 48 (11.8%) | 147 (18.3%) |
| $150,000 or more | 169 (41.7%) | 217 (27.0%) |
| Total | 405 (100.0%) | 803 (100.0%) |
Property Value to Household Income Ratio in Dumbarton
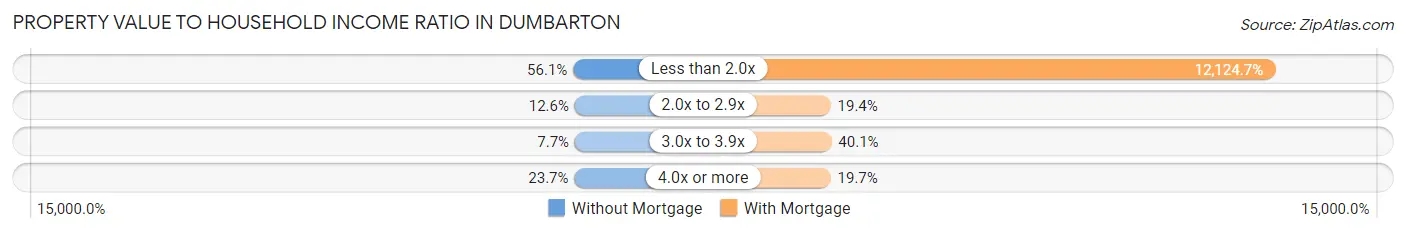
| Value-to-Income Ratio | Without Mortgage | With Mortgage |
| Less than 2.0x | 227 (56.0%) | 97,361 (12,124.7%) |
| 2.0x to 2.9x | 51 (12.6%) | 156 (19.4%) |
| 3.0x to 3.9x | 31 (7.6%) | 322 (40.1%) |
| 4.0x or more | 96 (23.7%) | 158 (19.7%) |
| Total | 405 (100.0%) | 803 (100.0%) |
Real Estate Taxes by Mortgage Status in Dumbarton
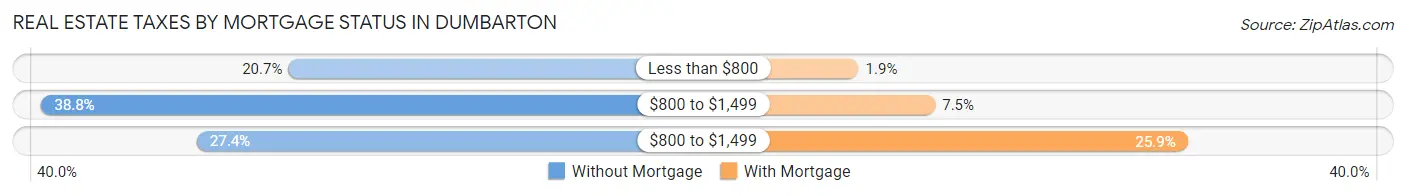
| Property Taxes | Without Mortgage | With Mortgage |
| Less than $800 | 84 (20.7%) | 15 (1.9%) |
| $800 to $1,499 | 157 (38.8%) | 60 (7.5%) |
| $800 to $1,499 | 111 (27.4%) | 208 (25.9%) |
| Total | 405 (100.0%) | 803 (100.0%) |
Health & Disability in Dumbarton
Health Insurance Coverage by Age in Dumbarton
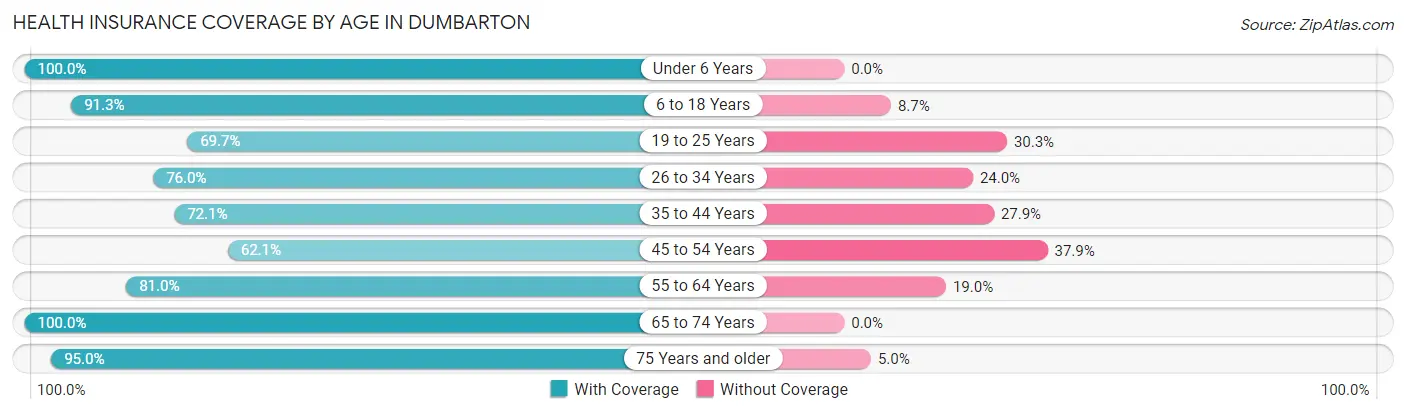
| Age Bracket | With Coverage | Without Coverage |
| Under 6 Years | 364 (100.0%) | 0 (0.0%) |
| 6 to 18 Years | 934 (91.3%) | 89 (8.7%) |
| 19 to 25 Years | 627 (69.7%) | 273 (30.3%) |
| 26 to 34 Years | 1,239 (76.0%) | 391 (24.0%) |
| 35 to 44 Years | 576 (72.1%) | 223 (27.9%) |
| 45 to 54 Years | 539 (62.1%) | 329 (37.9%) |
| 55 to 64 Years | 936 (81.0%) | 219 (19.0%) |
| 65 to 74 Years | 820 (100.0%) | 0 (0.0%) |
| 75 Years and older | 650 (95.0%) | 34 (5.0%) |
| Total | 6,685 (81.1%) | 1,558 (18.9%) |
Health Insurance Coverage by Citizenship Status in Dumbarton
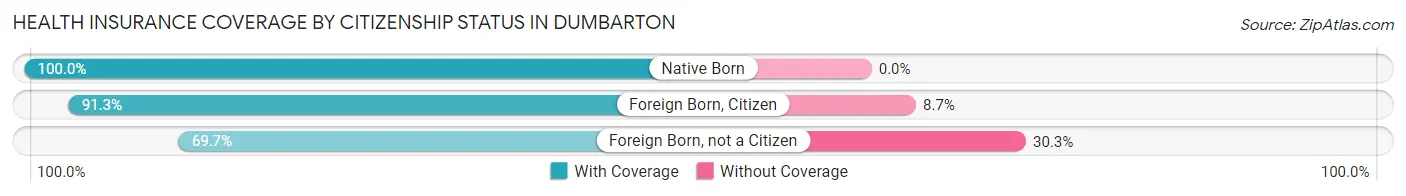
| Citizenship Status | With Coverage | Without Coverage |
| Native Born | 364 (100.0%) | 0 (0.0%) |
| Foreign Born, Citizen | 934 (91.3%) | 89 (8.7%) |
| Foreign Born, not a Citizen | 627 (69.7%) | 273 (30.3%) |
Health Insurance Coverage by Household Income in Dumbarton
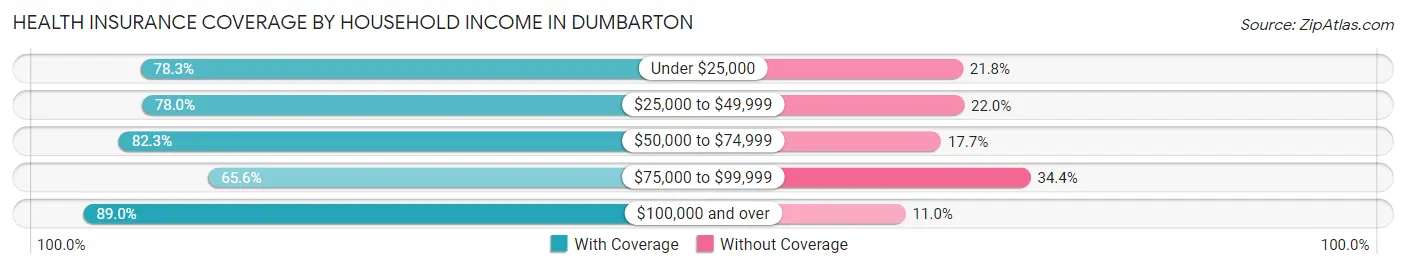
| Household Income | With Coverage | Without Coverage |
| Under $25,000 | 878 (78.2%) | 244 (21.7%) |
| $25,000 to $49,999 | 1,484 (78.0%) | 418 (22.0%) |
| $50,000 to $74,999 | 1,581 (82.3%) | 339 (17.7%) |
| $75,000 to $99,999 | 543 (65.6%) | 285 (34.4%) |
| $100,000 and over | 2,195 (89.0%) | 272 (11.0%) |
Public vs Private Health Insurance Coverage by Age in Dumbarton
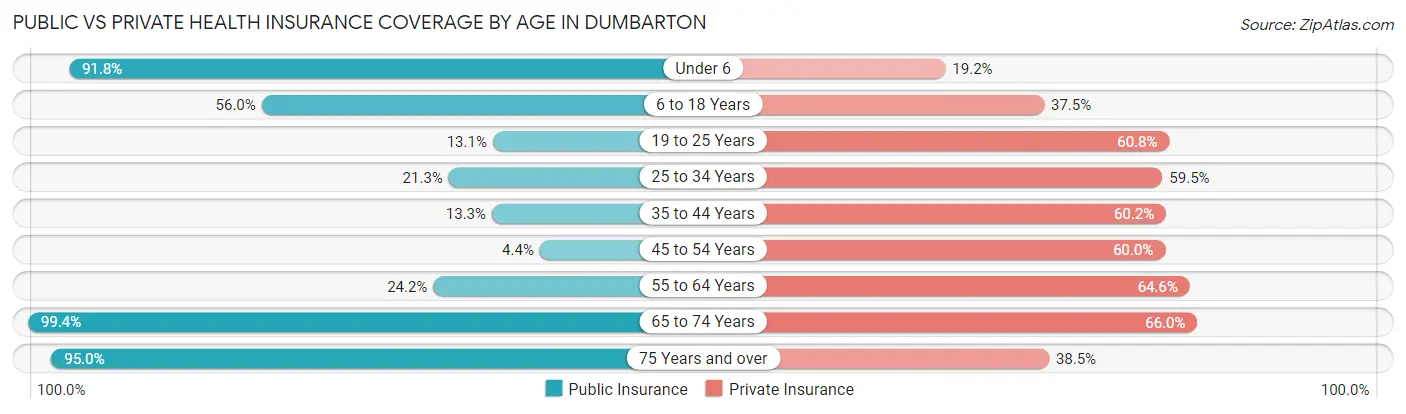
| Age Bracket | Public Insurance | Private Insurance |
| Under 6 | 334 (91.8%) | 70 (19.2%) |
| 6 to 18 Years | 573 (56.0%) | 384 (37.5%) |
| 19 to 25 Years | 118 (13.1%) | 547 (60.8%) |
| 25 to 34 Years | 347 (21.3%) | 970 (59.5%) |
| 35 to 44 Years | 106 (13.3%) | 481 (60.2%) |
| 45 to 54 Years | 38 (4.4%) | 521 (60.0%) |
| 55 to 64 Years | 279 (24.2%) | 746 (64.6%) |
| 65 to 74 Years | 815 (99.4%) | 541 (66.0%) |
| 75 Years and over | 650 (95.0%) | 263 (38.5%) |
| Total | 3,260 (39.6%) | 4,523 (54.9%) |
Disability Status by Sex by Age in Dumbarton
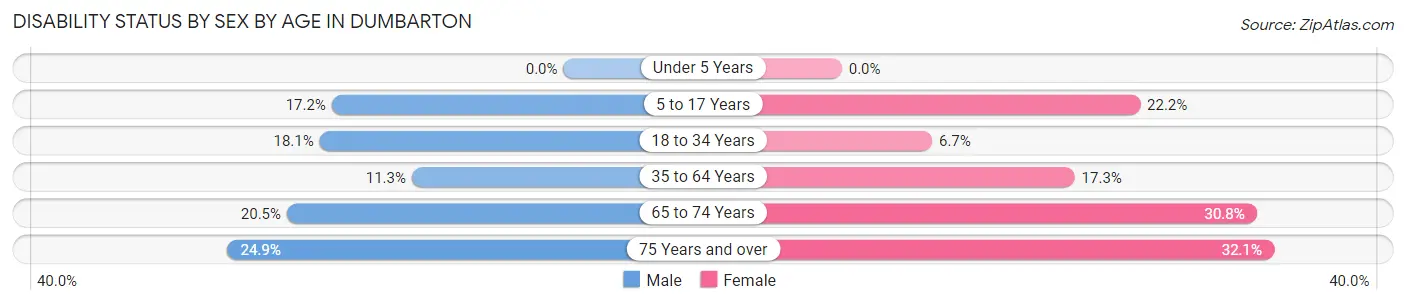
| Age Bracket | Male | Female |
| Under 5 Years | 0 (0.0%) | 0 (0.0%) |
| 5 to 17 Years | 64 (17.2%) | 97 (22.2%) |
| 18 to 34 Years | 275 (18.1%) | 85 (6.7%) |
| 35 to 64 Years | 134 (11.3%) | 282 (17.3%) |
| 65 to 74 Years | 85 (20.5%) | 125 (30.8%) |
| 75 Years and over | 85 (24.9%) | 110 (32.1%) |
Disability Class by Sex by Age in Dumbarton
Disability Class: Hearing Difficulty
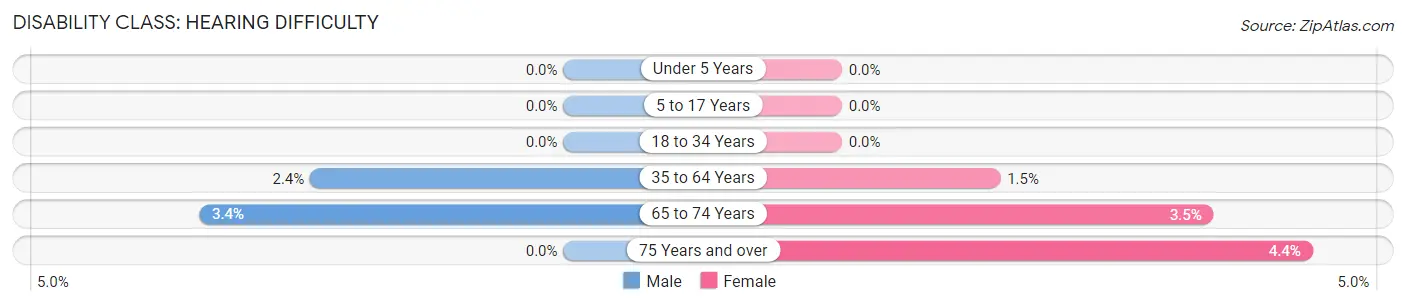
| Age Bracket | Male | Female |
| Under 5 Years | 0 (0.0%) | 0 (0.0%) |
| 5 to 17 Years | 0 (0.0%) | 0 (0.0%) |
| 18 to 34 Years | 0 (0.0%) | 0 (0.0%) |
| 35 to 64 Years | 28 (2.4%) | 24 (1.5%) |
| 65 to 74 Years | 14 (3.4%) | 14 (3.5%) |
| 75 Years and over | 0 (0.0%) | 15 (4.4%) |
Disability Class: Vision Difficulty
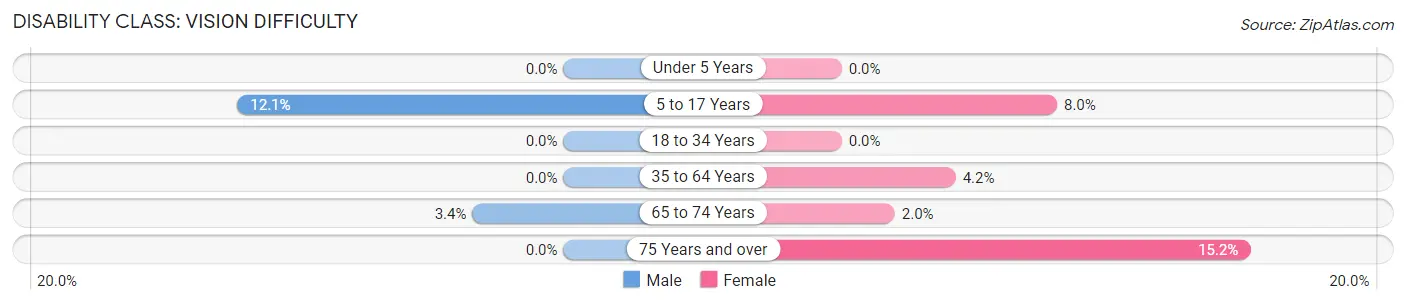
| Age Bracket | Male | Female |
| Under 5 Years | 0 (0.0%) | 0 (0.0%) |
| 5 to 17 Years | 45 (12.1%) | 35 (8.0%) |
| 18 to 34 Years | 0 (0.0%) | 0 (0.0%) |
| 35 to 64 Years | 0 (0.0%) | 69 (4.2%) |
| 65 to 74 Years | 14 (3.4%) | 8 (2.0%) |
| 75 Years and over | 0 (0.0%) | 52 (15.2%) |
Disability Class: Cognitive Difficulty
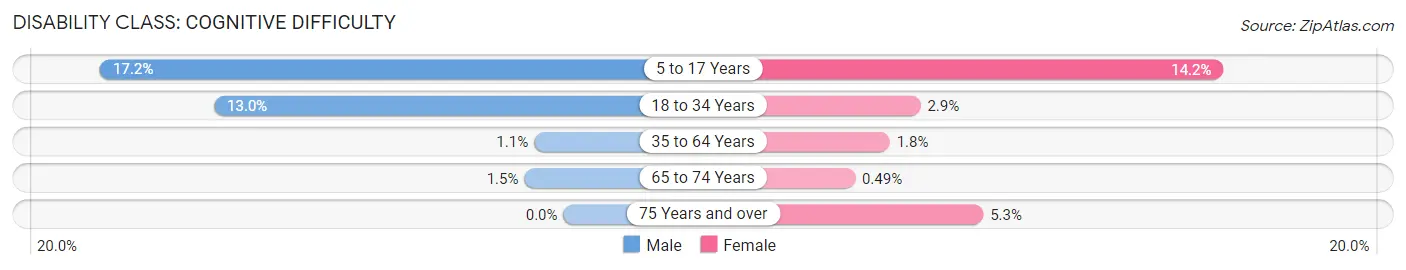
| Age Bracket | Male | Female |
| 5 to 17 Years | 64 (17.2%) | 62 (14.2%) |
| 18 to 34 Years | 197 (13.0%) | 37 (2.9%) |
| 35 to 64 Years | 13 (1.1%) | 29 (1.8%) |
| 65 to 74 Years | 6 (1.5%) | 2 (0.5%) |
| 75 Years and over | 0 (0.0%) | 18 (5.2%) |
Disability Class: Ambulatory Difficulty
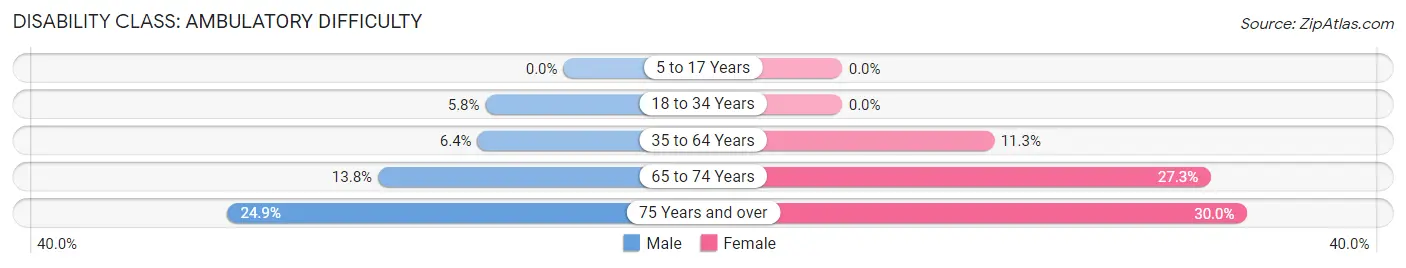
| Age Bracket | Male | Female |
| 5 to 17 Years | 0 (0.0%) | 0 (0.0%) |
| 18 to 34 Years | 88 (5.8%) | 0 (0.0%) |
| 35 to 64 Years | 76 (6.4%) | 184 (11.3%) |
| 65 to 74 Years | 57 (13.8%) | 111 (27.3%) |
| 75 Years and over | 85 (24.9%) | 103 (30.0%) |
Disability Class: Self-Care Difficulty
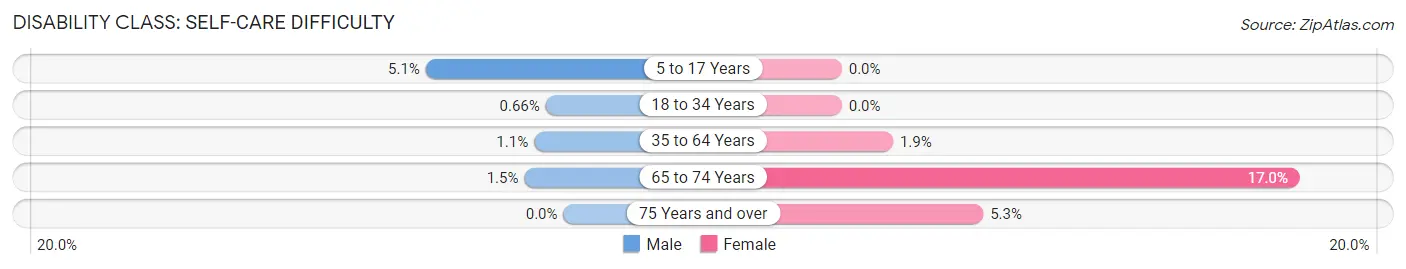
| Age Bracket | Male | Female |
| 5 to 17 Years | 19 (5.1%) | 0 (0.0%) |
| 18 to 34 Years | 10 (0.7%) | 0 (0.0%) |
| 35 to 64 Years | 13 (1.1%) | 31 (1.9%) |
| 65 to 74 Years | 6 (1.5%) | 69 (17.0%) |
| 75 Years and over | 0 (0.0%) | 18 (5.2%) |
Technology Access in Dumbarton
Computing Device Access in Dumbarton
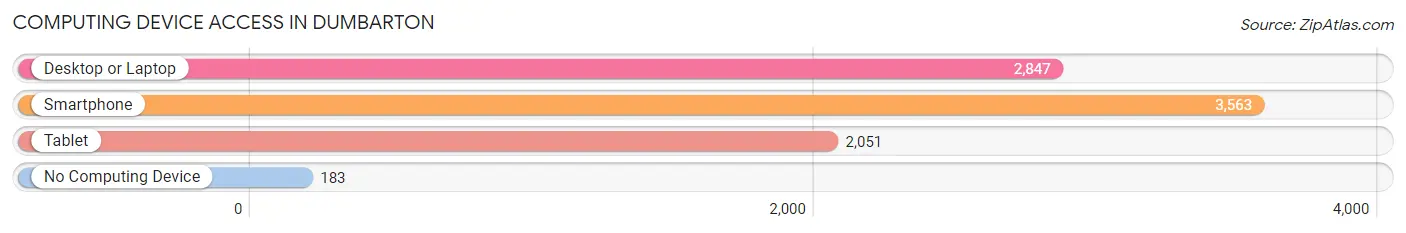
| Device Type | # Households | % Households |
| Desktop or Laptop | 2,847 | 72.6% |
| Smartphone | 3,563 | 90.9% |
| Tablet | 2,051 | 52.3% |
| No Computing Device | 183 | 4.7% |
| Total | 3,921 | 100.0% |
Internet Access in Dumbarton
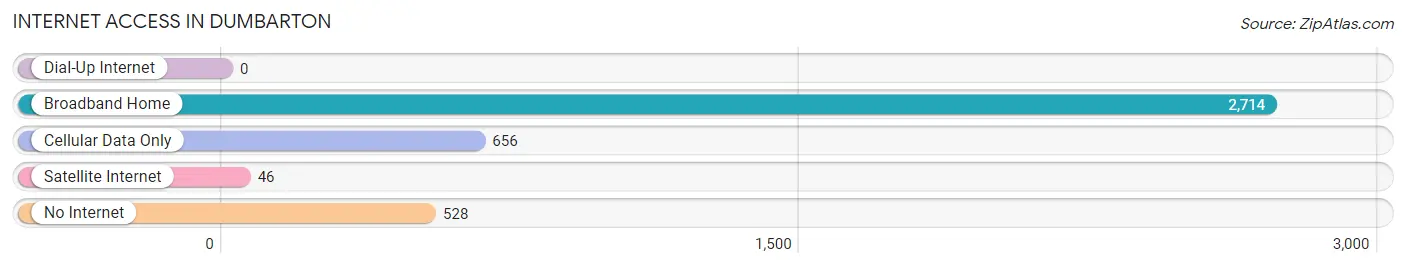
| Internet Type | # Households | % Households |
| Dial-Up Internet | 0 | 0.0% |
| Broadband Home | 2,714 | 69.2% |
| Cellular Data Only | 656 | 16.7% |
| Satellite Internet | 46 | 1.2% |
| No Internet | 528 | 13.5% |
| Total | 3,921 | 100.0% |
Dumbarton Summary
Dumbarton is a small town located in the state of Virginia, in the United States. It is situated in the northern part of the state, in Fairfax County, and is part of the Washington Metropolitan Area. The town has a population of around 1,500 people, and is known for its rural charm and small-town atmosphere.
History
The area that is now known as Dumbarton was first settled in the late 1700s by a group of Scottish immigrants. The town was originally known as “Dumbarton” after the town of Dumbarton in Scotland. The town was officially incorporated in 1810, and was named after the Scottish town.
The town was a small farming community for much of its history, and remained relatively unchanged until the 1950s. In the 1950s, the town began to experience a population boom as people moved to the area from Washington, D.C. and other parts of the country. This influx of people led to the development of new businesses and services in the town, and the population continued to grow throughout the 1960s and 1970s.
Geography
Dumbarton is located in the northern part of Fairfax County, Virginia. It is situated on the banks of the Potomac River, and is bordered by the towns of Herndon and Reston to the north, and the city of Fairfax to the south. The town is located approximately 25 miles from Washington, D.C., and is part of the Washington Metropolitan Area.
The town has a total area of 1.2 square miles, all of which is land. The terrain of the town is mostly flat, with some rolling hills in the northern part of the town. The town is located in a temperate climate zone, and experiences hot, humid summers and cold, wet winters.
Economy
The economy of Dumbarton is largely based on the service industry. The town is home to a number of small businesses, including restaurants, retail stores, and professional services. The town also has a number of government offices, including the Fairfax County Police Department and the Fairfax County Fire and Rescue Department.
The town is also home to a number of technology companies, including the software company, Oracle Corporation. The town is also home to a number of educational institutions, including the Northern Virginia Community College and George Mason University.
Demographics
As of the 2010 census, the population of Dumbarton was 1,521. The racial makeup of the town was 79.3% White, 11.2% African American, 0.3% Native American, 4.2% Asian, 0.1% Pacific Islander, and 4.9% from other races. The median household income in the town was $90,945, and the median family income was $103,945.
Conclusion
Dumbarton is a small town located in Fairfax County, Virginia. It has a population of around 1,500 people, and is known for its rural charm and small-town atmosphere. The town has a largely service-based economy, and is home to a number of small businesses, government offices, and educational institutions. The town has a diverse population, with a median household income of $90,945.
Common Questions
What is Per Capita Income in Dumbarton?
Per Capita income in Dumbarton is $40,625.
What is the Median Family Income in Dumbarton?
Median Family Income in Dumbarton is $67,614.
What is the Median Household income in Dumbarton?
Median Household Income in Dumbarton is $59,005.
What is Income or Wage Gap in Dumbarton?
Income or Wage Gap in Dumbarton is 24.5%.
Women in Dumbarton earn 75.5 cents for every dollar earned by a man.
What is Inequality or Gini Index in Dumbarton?
Inequality or Gini Index in Dumbarton is 0.47.
What is the Total Population of Dumbarton?
Total Population of Dumbarton is 8,271.
What is the Total Male Population of Dumbarton?
Total Male Population of Dumbarton is 4,032.
What is the Total Female Population of Dumbarton?
Total Female Population of Dumbarton is 4,239.
What is the Ratio of Males per 100 Females in Dumbarton?
There are 95.12 Males per 100 Females in Dumbarton.
What is the Ratio of Females per 100 Males in Dumbarton?
There are 105.13 Females per 100 Males in Dumbarton.
What is the Median Population Age in Dumbarton?
Median Population Age in Dumbarton is 36.5 Years.
What is the Average Family Size in Dumbarton
Average Family Size in Dumbarton is 2.9 People.
What is the Average Household Size in Dumbarton
Average Household Size in Dumbarton is 2.1 People.
How Large is the Labor Force in Dumbarton?
There are 5,505 People in the Labor Forcein in Dumbarton.
What is the Percentage of People in the Labor Force in Dumbarton?
76.3% of People are in the Labor Force in Dumbarton.
What is the Unemployment Rate in Dumbarton?
Unemployment Rate in Dumbarton is 4.5%.