Bellwood, VA Map & Demographics
Bellwood Map
Bellwood Overview
$23,085
PER CAPITA INCOME
$56,960
AVG FAMILY INCOME
$50,231
AVG HOUSEHOLD INCOME
7.8%
WAGE / INCOME GAP [ % ]
92.2¢/ $1
WAGE / INCOME GAP [ $ ]
0.41
INEQUALITY / GINI INDEX
7,783
TOTAL POPULATION
3,681
MALE POPULATION
4,102
FEMALE POPULATION
89.74
MALES / 100 FEMALES
111.44
FEMALES / 100 MALES
32.8
MEDIAN AGE
3.3
AVG FAMILY SIZE
2.6
AVG HOUSEHOLD SIZE
4,015
LABOR FORCE [ PEOPLE ]
65.5%
PERCENT IN LABOR FORCE
7.5%
UNEMPLOYMENT RATE
Income in Bellwood
Income Overview in Bellwood
Per Capita Income in Bellwood is $23,085, while median incomes of families and households are $56,960 and $50,231 respectively.
| Characteristic | Number | Measure |
| Per Capita Income | 7,783 | $23,085 |
| Median Family Income | 1,841 | $56,960 |
| Mean Family Income | 1,841 | $68,435 |
| Median Household Income | 3,019 | $50,231 |
| Mean Household Income | 3,019 | $59,479 |
| Income Deficit | 1,841 | $0 |
| Wage / Income Gap (%) | 7,783 | 7.81% |
| Wage / Income Gap ($) | 7,783 | 92.19¢ per $1 |
| Gini / Inequality Index | 7,783 | 0.41 |
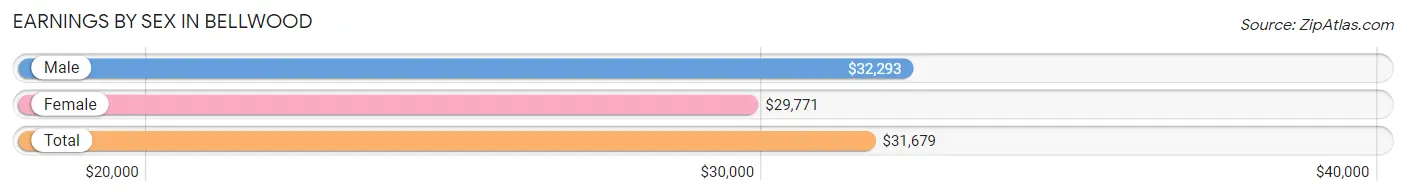
Earnings by Sex in Bellwood
Average Earnings in Bellwood are $31,679, $32,293 for men and $29,771 for women, a difference of 7.8%.
| Sex | Number | Average Earnings |
| Male | 2,037 (50.0%) | $32,293 |
| Female | 2,033 (49.9%) | $29,771 |
| Total | 4,070 (100.0%) | $31,679 |
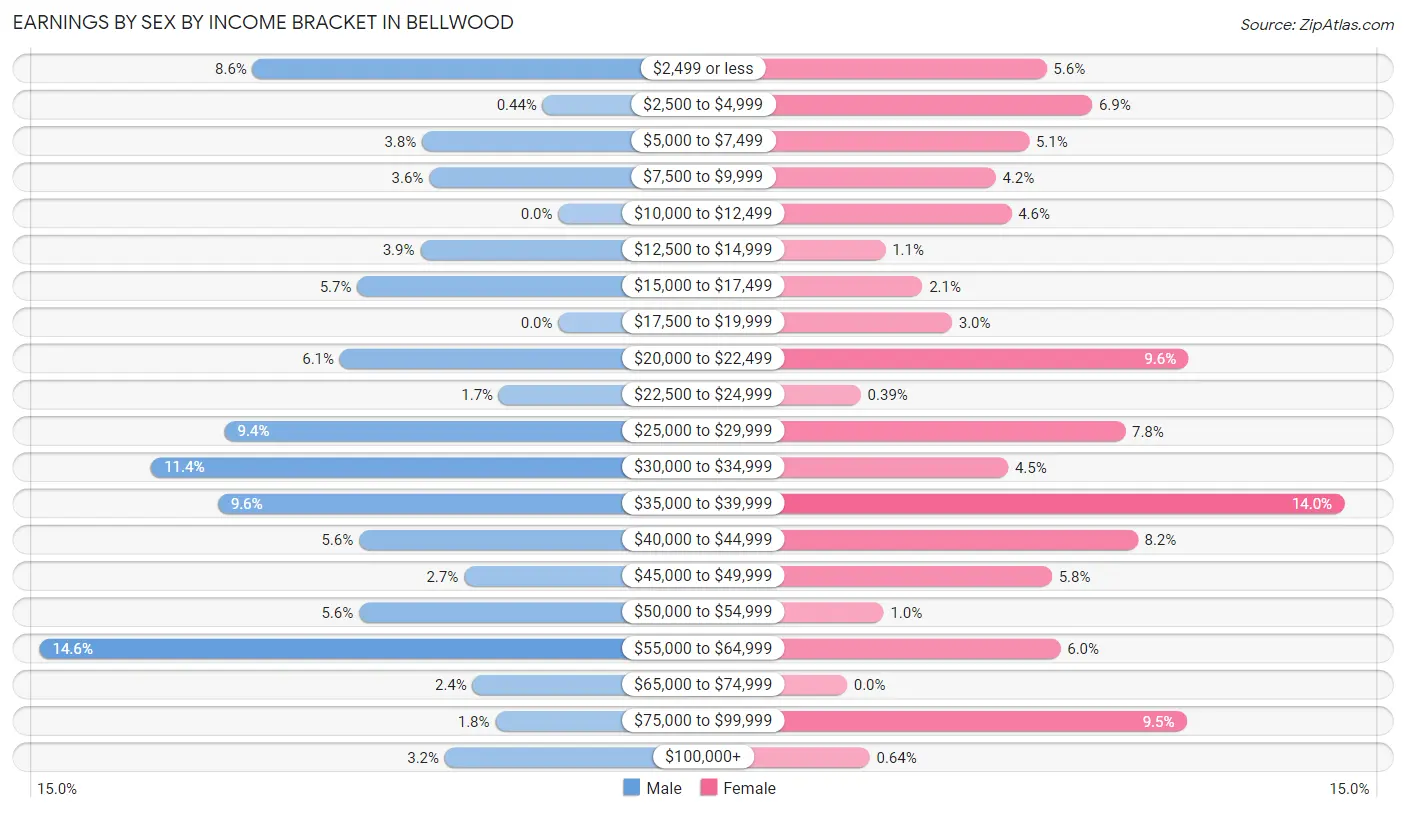
Earnings by Sex by Income Bracket in Bellwood
The most common earnings brackets in Bellwood are $55,000 to $64,999 for men (297 | 14.6%) and $35,000 to $39,999 for women (284 | 14.0%).
| Income | Male | Female |
| $2,499 or less | 175 (8.6%) | 114 (5.6%) |
| $2,500 to $4,999 | 9 (0.4%) | 140 (6.9%) |
| $5,000 to $7,499 | 78 (3.8%) | 104 (5.1%) |
| $7,500 to $9,999 | 74 (3.6%) | 85 (4.2%) |
| $10,000 to $12,499 | 0 (0.0%) | 94 (4.6%) |
| $12,500 to $14,999 | 79 (3.9%) | 22 (1.1%) |
| $15,000 to $17,499 | 115 (5.7%) | 43 (2.1%) |
| $17,500 to $19,999 | 0 (0.0%) | 60 (2.9%) |
| $20,000 to $22,499 | 125 (6.1%) | 195 (9.6%) |
| $22,500 to $24,999 | 34 (1.7%) | 8 (0.4%) |
| $25,000 to $29,999 | 191 (9.4%) | 159 (7.8%) |
| $30,000 to $34,999 | 233 (11.4%) | 92 (4.5%) |
| $35,000 to $39,999 | 195 (9.6%) | 284 (14.0%) |
| $40,000 to $44,999 | 114 (5.6%) | 166 (8.2%) |
| $45,000 to $49,999 | 54 (2.6%) | 117 (5.8%) |
| $50,000 to $54,999 | 114 (5.6%) | 21 (1.0%) |
| $55,000 to $64,999 | 297 (14.6%) | 122 (6.0%) |
| $65,000 to $74,999 | 49 (2.4%) | 0 (0.0%) |
| $75,000 to $99,999 | 36 (1.8%) | 194 (9.5%) |
| $100,000+ | 65 (3.2%) | 13 (0.6%) |
| Total | 2,037 (100.0%) | 2,033 (100.0%) |
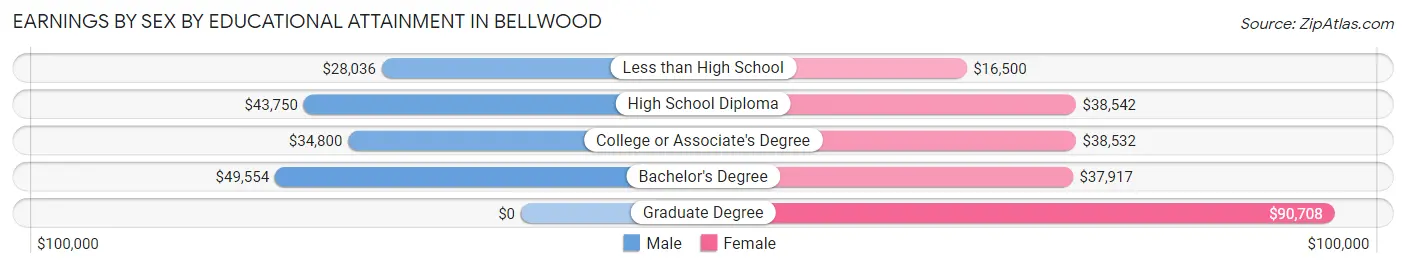
Earnings by Sex by Educational Attainment in Bellwood
Average earnings in Bellwood are $36,875 for men and $36,622 for women, a difference of 0.7%. Men with an educational attainment of bachelor's degree enjoy the highest average annual earnings of $49,554, while those with less than high school education earn the least with $28,036. Women with an educational attainment of graduate degree earn the most with the average annual earnings of $90,708, while those with less than high school education have the smallest earnings of $16,500.
| Educational Attainment | Male Income | Female Income |
| Less than High School | $28,036 | $16,500 |
| High School Diploma | $43,750 | $38,542 |
| College or Associate's Degree | $34,800 | $38,532 |
| Bachelor's Degree | $49,554 | $37,917 |
| Graduate Degree | - | - |
| Total | $36,875 | $36,622 |
Family Income in Bellwood
Family Income Brackets in Bellwood
According to the Bellwood family income data, there are 423 families falling into the $50,000 to $74,999 income range, which is the most common income bracket and makes up 23.0% of all families. Conversely, the $200,000+ income bracket is the least frequent group with only 6 families (0.3%) belonging to this category.
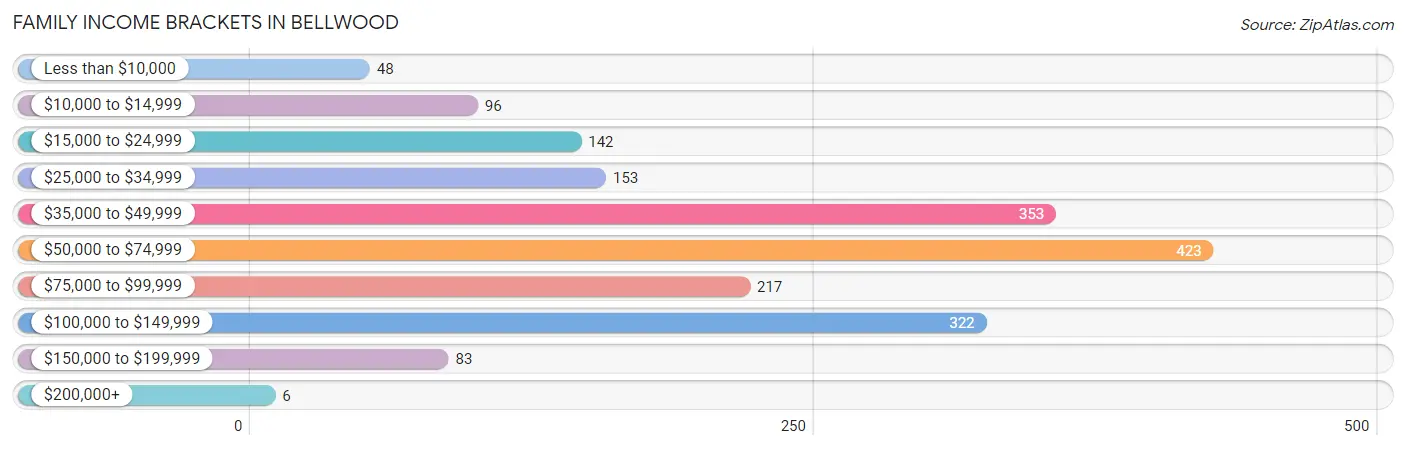
| Income Bracket | # Families | % Families |
| Less than $10,000 | 48 | 2.6% |
| $10,000 to $14,999 | 96 | 5.2% |
| $15,000 to $24,999 | 142 | 7.7% |
| $25,000 to $34,999 | 153 | 8.3% |
| $35,000 to $49,999 | 353 | 19.2% |
| $50,000 to $74,999 | 423 | 23.0% |
| $75,000 to $99,999 | 217 | 11.8% |
| $100,000 to $149,999 | 322 | 17.5% |
| $150,000 to $199,999 | 83 | 4.5% |
| $200,000+ | 6 | 0.3% |
Family Income by Famaliy Size in Bellwood
6-person families (208 | 11.3%) account for the highest median family income in Bellwood with $140,232 per family, while 2-person families (766 | 41.6%) have the highest median income of $26,536 per family member.
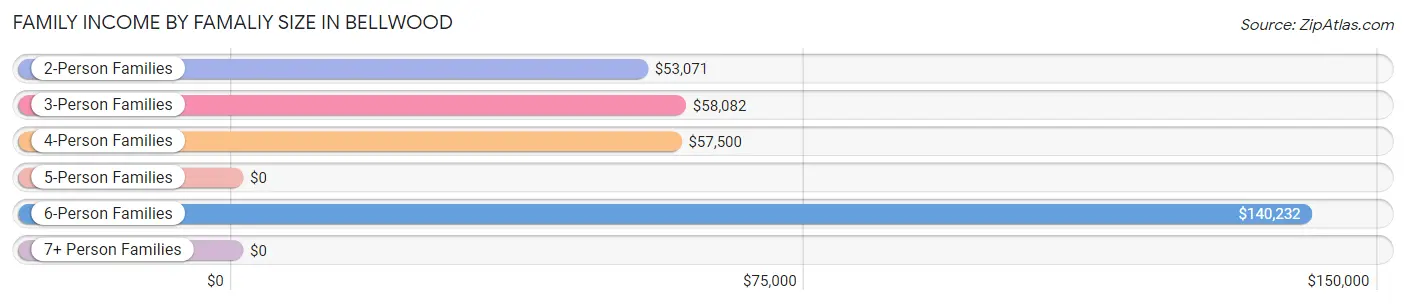
| Income Bracket | # Families | Median Income |
| 2-Person Families | 766 (41.6%) | $53,071 |
| 3-Person Families | 367 (19.9%) | $58,082 |
| 4-Person Families | 360 (19.6%) | $57,500 |
| 5-Person Families | 121 (6.6%) | $0 |
| 6-Person Families | 208 (11.3%) | $140,232 |
| 7+ Person Families | 19 (1.0%) | $0 |
| Total | 1,841 (100.0%) | $56,960 |
Family Income by Number of Earners in Bellwood
The median family income in Bellwood is $56,960, with families comprising 3+ earners (285) having the highest median family income of $140,271, while families with 1 earner (601) have the lowest median family income of $38,146, accounting for 15.5% and 32.7% of families, respectively.
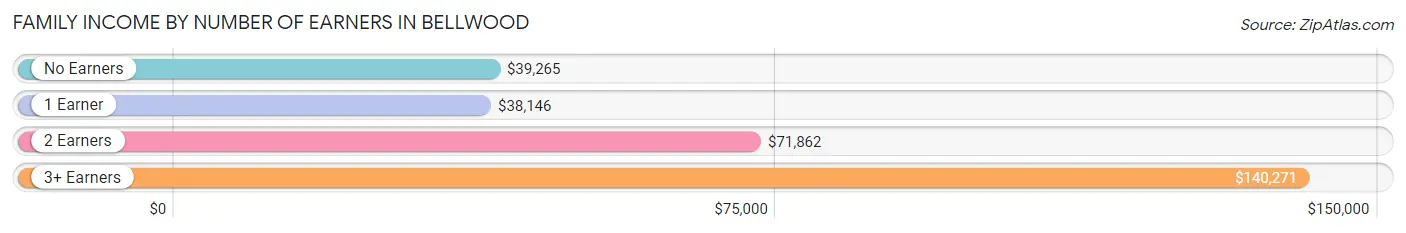
| Number of Earners | # Families | Median Income |
| No Earners | 282 (15.3%) | $39,265 |
| 1 Earner | 601 (32.7%) | $38,146 |
| 2 Earners | 673 (36.6%) | $71,862 |
| 3+ Earners | 285 (15.5%) | $140,271 |
| Total | 1,841 (100.0%) | $56,960 |
Household Income in Bellwood
Household Income Brackets in Bellwood
With 631 households falling in the category, the $50,000 to $74,999 income range is the most frequent in Bellwood, accounting for 20.9% of all households. In contrast, only 12 households (0.4%) fall into the $200,000+ income bracket, making it the least populous group.
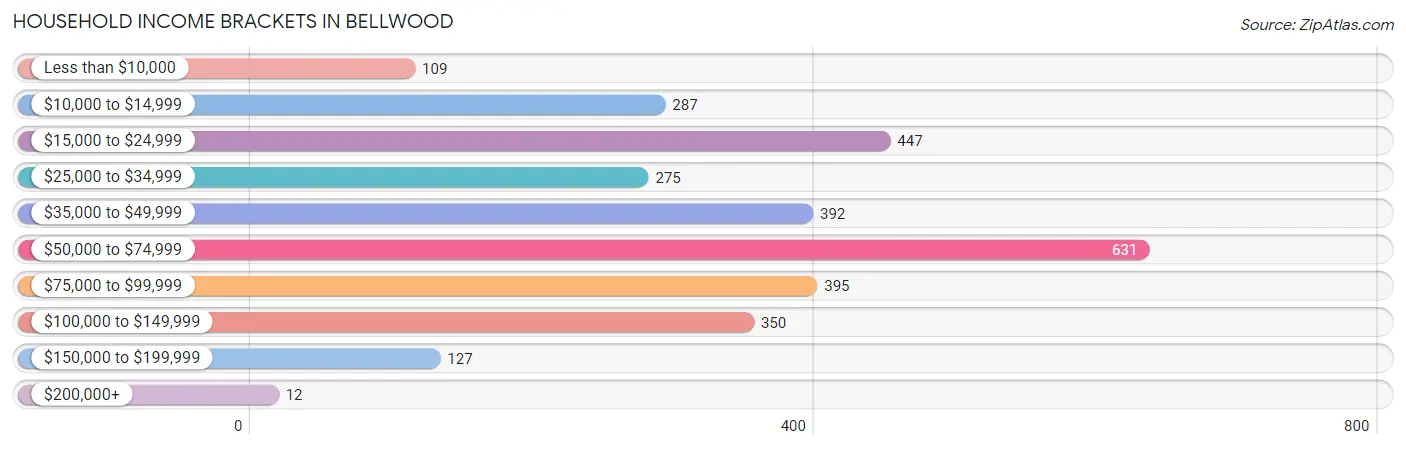
| Income Bracket | # Households | % Households |
| Less than $10,000 | 109 | 3.6% |
| $10,000 to $14,999 | 287 | 9.5% |
| $15,000 to $24,999 | 447 | 14.8% |
| $25,000 to $34,999 | 275 | 9.1% |
| $35,000 to $49,999 | 392 | 13.0% |
| $50,000 to $74,999 | 631 | 20.9% |
| $75,000 to $99,999 | 395 | 13.1% |
| $100,000 to $149,999 | 350 | 11.6% |
| $150,000 to $199,999 | 127 | 4.2% |
| $200,000+ | 12 | 0.4% |
Household Income by Householder Age in Bellwood
The median household income in Bellwood is $50,231, with the highest median household income of $58,811 found in the 45 to 64 years age bracket for the primary householder. A total of 976 households (32.3%) fall into this category. Meanwhile, the 15 to 24 years age bracket for the primary householder has the lowest median household income of $34,844, with 43 households (1.4%) in this group.
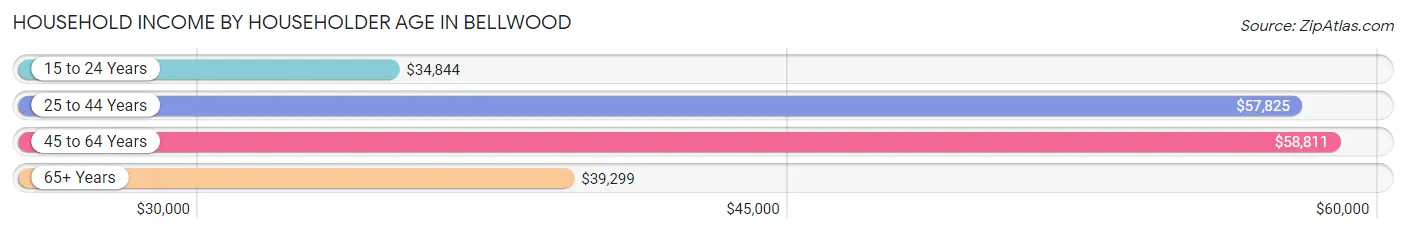
| Income Bracket | # Households | Median Income |
| 15 to 24 Years | 43 (1.4%) | $34,844 |
| 25 to 44 Years | 1,255 (41.6%) | $57,825 |
| 45 to 64 Years | 976 (32.3%) | $58,811 |
| 65+ Years | 745 (24.7%) | $39,299 |
| Total | 3,019 (100.0%) | $50,231 |
Poverty in Bellwood
Income Below Poverty by Sex and Age in Bellwood
With 17.9% poverty level for males and 20.0% for females among the residents of Bellwood, 6 to 11 year old males and 5 year old females are the most vulnerable to poverty, with 125 males (60.1%) and 8 females (50.0%) in their respective age groups living below the poverty level.
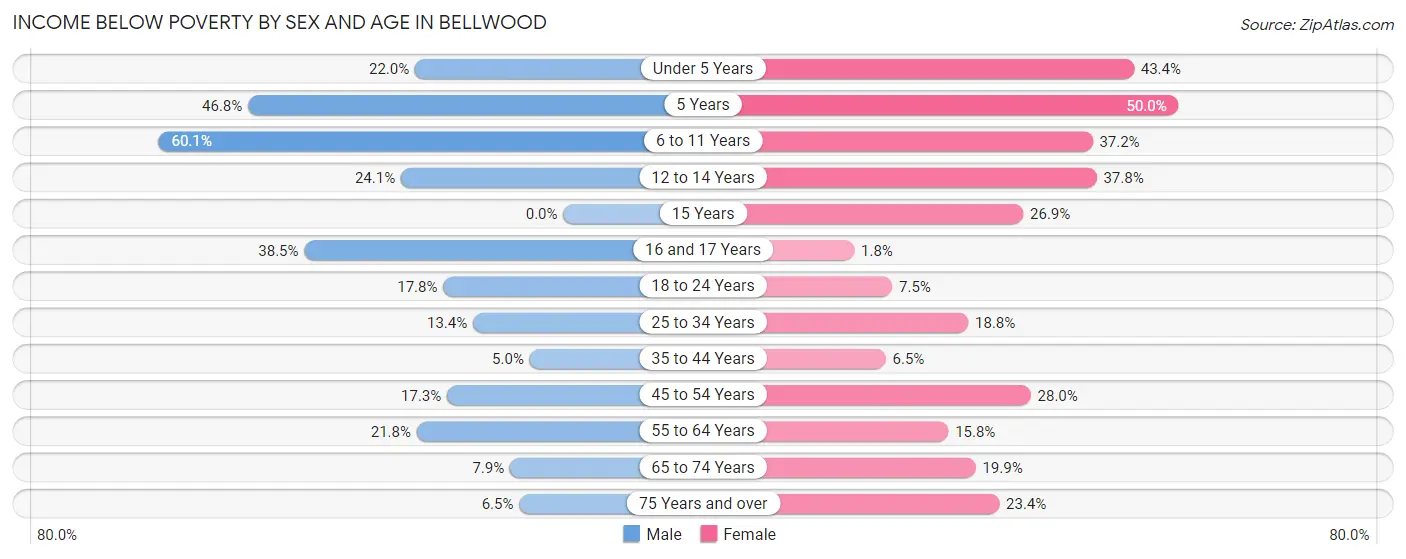
| Age Bracket | Male | Female |
| Under 5 Years | 48 (22.0%) | 62 (43.4%) |
| 5 Years | 22 (46.8%) | 8 (50.0%) |
| 6 to 11 Years | 125 (60.1%) | 150 (37.2%) |
| 12 to 14 Years | 68 (24.1%) | 45 (37.8%) |
| 15 Years | 0 (0.0%) | 28 (26.9%) |
| 16 and 17 Years | 10 (38.5%) | 2 (1.8%) |
| 18 to 24 Years | 84 (17.8%) | 31 (7.5%) |
| 25 to 34 Years | 107 (13.4%) | 118 (18.8%) |
| 35 to 44 Years | 23 (5.0%) | 41 (6.5%) |
| 45 to 54 Years | 63 (17.3%) | 127 (28.0%) |
| 55 to 64 Years | 89 (21.8%) | 58 (15.8%) |
| 65 to 74 Years | 14 (7.9%) | 81 (19.9%) |
| 75 Years and over | 7 (6.5%) | 71 (23.4%) |
| Total | 660 (17.9%) | 822 (20.0%) |
Income Above Poverty by Sex and Age in Bellwood
According to the poverty statistics in Bellwood, males aged 15 years and females aged 16 and 17 years are the age groups that are most secure financially, with 100.0% of males and 98.2% of females in these age groups living above the poverty line.
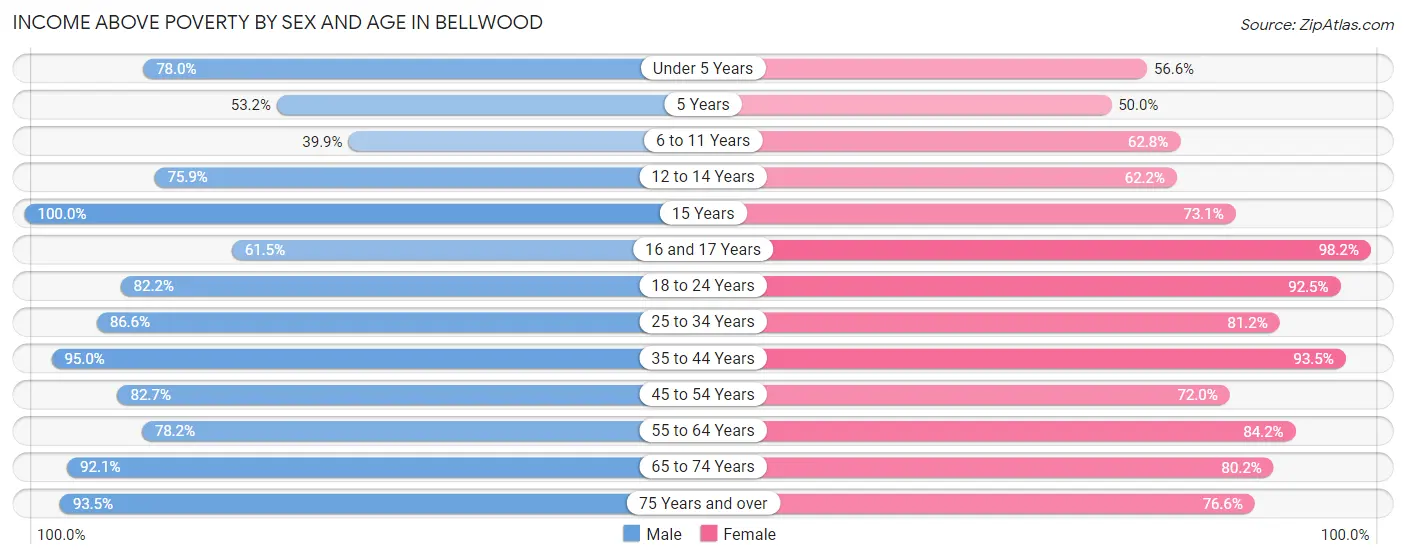
| Age Bracket | Male | Female |
| Under 5 Years | 170 (78.0%) | 81 (56.6%) |
| 5 Years | 25 (53.2%) | 8 (50.0%) |
| 6 to 11 Years | 83 (39.9%) | 253 (62.8%) |
| 12 to 14 Years | 214 (75.9%) | 74 (62.2%) |
| 15 Years | 111 (100.0%) | 76 (73.1%) |
| 16 and 17 Years | 16 (61.5%) | 107 (98.2%) |
| 18 to 24 Years | 387 (82.2%) | 384 (92.5%) |
| 25 to 34 Years | 691 (86.6%) | 511 (81.2%) |
| 35 to 44 Years | 438 (95.0%) | 590 (93.5%) |
| 45 to 54 Years | 302 (82.7%) | 326 (72.0%) |
| 55 to 64 Years | 320 (78.2%) | 309 (84.2%) |
| 65 to 74 Years | 163 (92.1%) | 327 (80.1%) |
| 75 Years and over | 100 (93.5%) | 233 (76.6%) |
| Total | 3,020 (82.1%) | 3,279 (80.0%) |
Income Below Poverty Among Married-Couple Families in Bellwood
The poverty statistics for married-couple families in Bellwood show that 8.6% or 93 of the total 1,079 families live below the poverty line. Families with 5 or more children have the highest poverty rate of 100.0%, comprising of 19 families. On the other hand, families with no children have the lowest poverty rate of 0.9%, which includes 5 families.
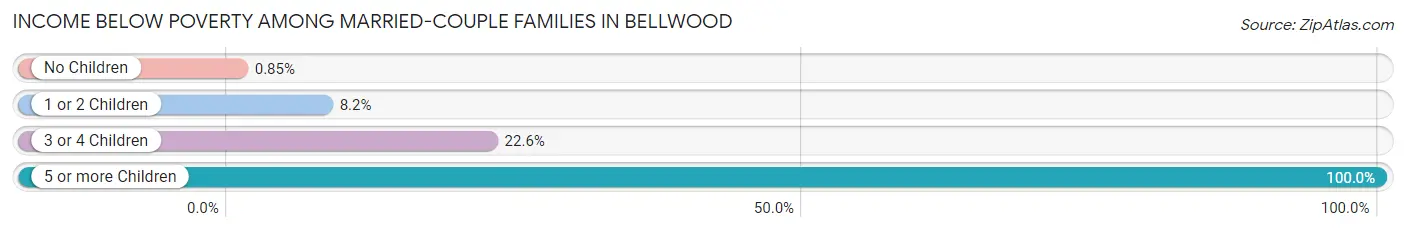
| Children | Above Poverty | Below Poverty |
| No Children | 580 (99.2%) | 5 (0.9%) |
| 1 or 2 Children | 245 (91.8%) | 22 (8.2%) |
| 3 or 4 Children | 161 (77.4%) | 47 (22.6%) |
| 5 or more Children | 0 (0.0%) | 19 (100.0%) |
| Total | 986 (91.4%) | 93 (8.6%) |
Income Below Poverty Among Single-Parent Households in Bellwood
According to the poverty data in Bellwood, 17.1% or 14 single-father households and 29.6% or 201 single-mother households are living below the poverty line. Among single-father households, those with 1 or 2 children have the highest poverty rate, with 14 households (40.0%) experiencing poverty. Likewise, among single-mother households, those with 3 or 4 children have the highest poverty rate, with 53 households (39.0%) falling below the poverty line.
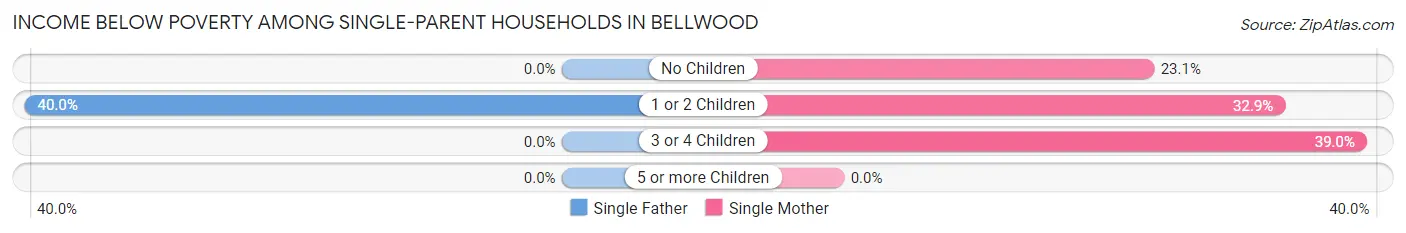
| Children | Single Father | Single Mother |
| No Children | 0 (0.0%) | 73 (23.1%) |
| 1 or 2 Children | 14 (40.0%) | 75 (32.9%) |
| 3 or 4 Children | 0 (0.0%) | 53 (39.0%) |
| 5 or more Children | 0 (0.0%) | 0 (0.0%) |
| Total | 14 (17.1%) | 201 (29.6%) |
Income Below Poverty Among Married-Couple vs Single-Parent Households in Bellwood
The poverty data for Bellwood shows that 93 of the married-couple family households (8.6%) and 215 of the single-parent households (28.2%) are living below the poverty level. Within the married-couple family households, those with 5 or more children have the highest poverty rate, with 19 households (100.0%) falling below the poverty line. Among the single-parent households, those with 3 or 4 children have the highest poverty rate, with 53 household (38.7%) living below poverty.
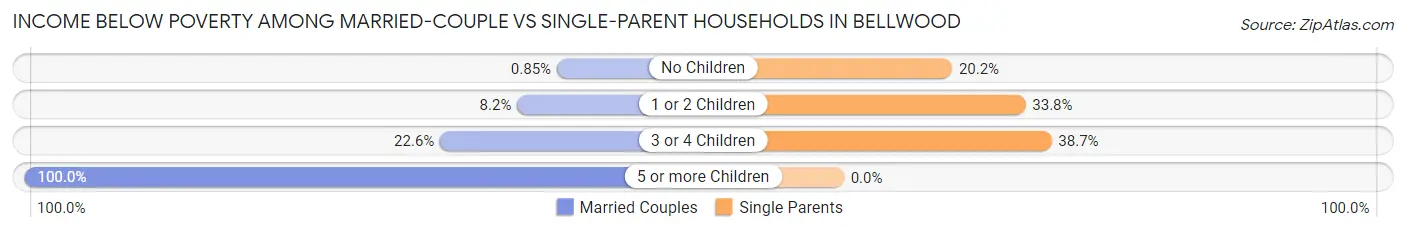
| Children | Married-Couple Families | Single-Parent Households |
| No Children | 5 (0.9%) | 73 (20.2%) |
| 1 or 2 Children | 22 (8.2%) | 89 (33.8%) |
| 3 or 4 Children | 47 (22.6%) | 53 (38.7%) |
| 5 or more Children | 19 (100.0%) | 0 (0.0%) |
| Total | 93 (8.6%) | 215 (28.2%) |
Race in Bellwood
The most populous races in Bellwood are White / Caucasian (3,271 | 42.0%), Black / African American (2,850 | 36.6%), and Hispanic or Latino (1,806 | 23.2%).
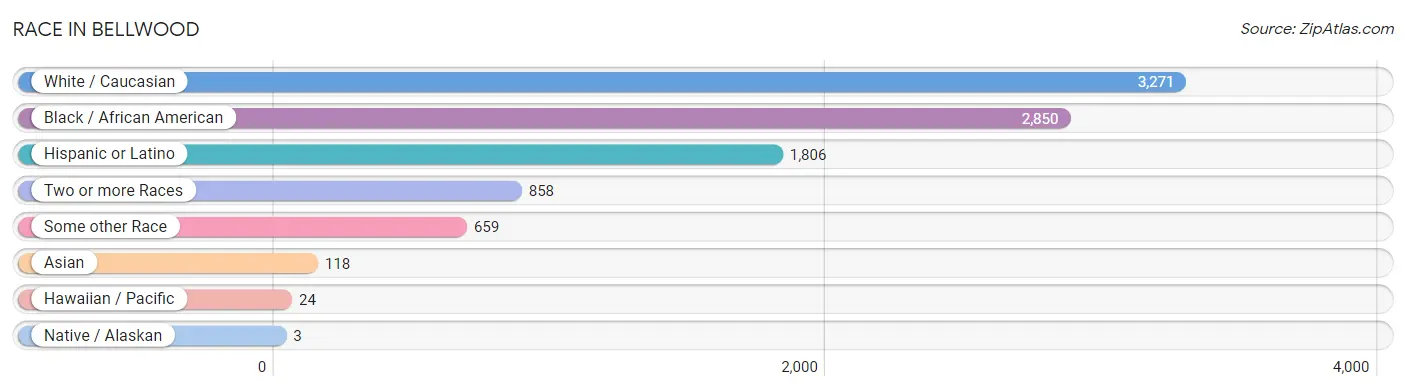
| Race | # Population | % Population |
| Asian | 118 | 1.5% |
| Black / African American | 2,850 | 36.6% |
| Hawaiian / Pacific | 24 | 0.3% |
| Hispanic or Latino | 1,806 | 23.2% |
| Native / Alaskan | 3 | 0.0% |
| White / Caucasian | 3,271 | 42.0% |
| Two or more Races | 858 | 11.0% |
| Some other Race | 659 | 8.5% |
| Total | 7,783 | 100.0% |
Ancestry in Bellwood
The most populous ancestries reported in Bellwood are Central American (841 | 10.8%), Mexican (746 | 9.6%), American (586 | 7.5%), Irish (531 | 6.8%), and German (447 | 5.7%), together accounting for 40.5% of all Bellwood residents.
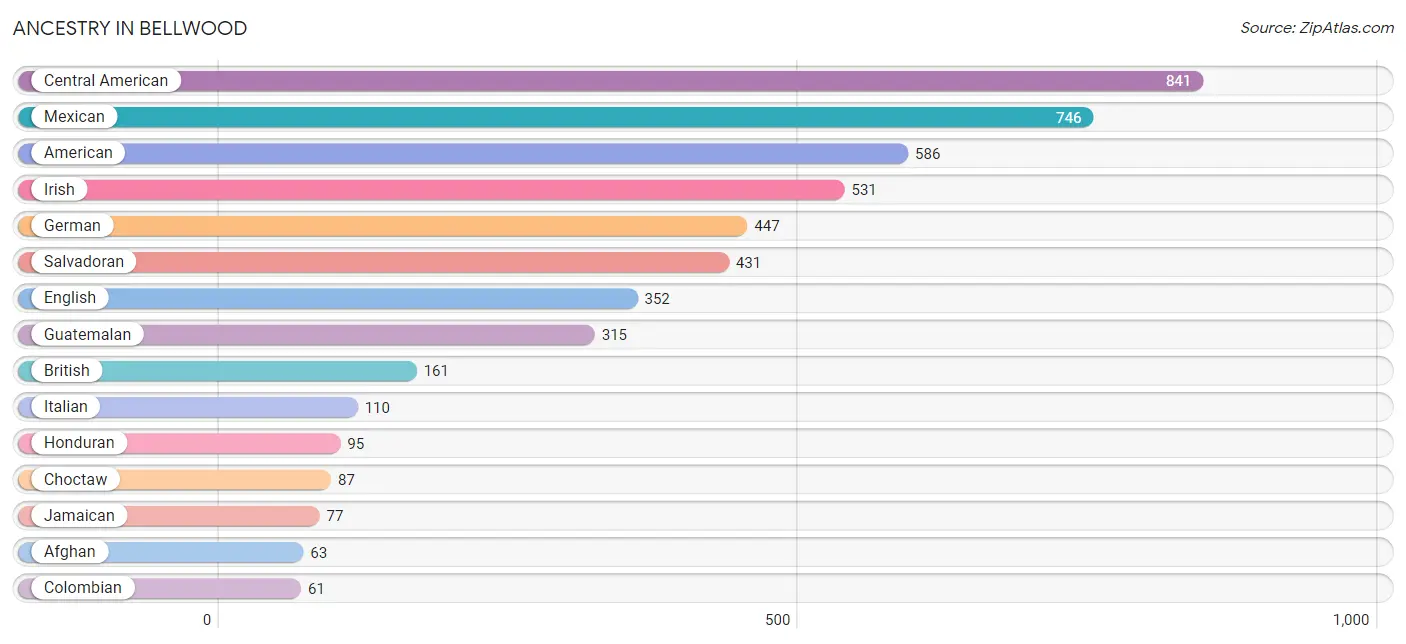
| Ancestry | # Population | % Population |
| Afghan | 63 | 0.8% |
| African | 32 | 0.4% |
| Alaska Native | 3 | 0.0% |
| American | 586 | 7.5% |
| Arab | 10 | 0.1% |
| Brazilian | 10 | 0.1% |
| British | 161 | 2.1% |
| Canadian | 8 | 0.1% |
| Central American | 841 | 10.8% |
| Choctaw | 87 | 1.1% |
| Colombian | 61 | 0.8% |
| Czech | 14 | 0.2% |
| Danish | 6 | 0.1% |
| Dominican | 25 | 0.3% |
| Dutch | 27 | 0.4% |
| English | 352 | 4.5% |
| European | 56 | 0.7% |
| French | 28 | 0.4% |
| French Canadian | 11 | 0.1% |
| German | 447 | 5.7% |
| Guamanian / Chamorro | 16 | 0.2% |
| Guatemalan | 315 | 4.1% |
| Honduran | 95 | 1.2% |
| Iranian | 52 | 0.7% |
| Irish | 531 | 6.8% |
| Italian | 110 | 1.4% |
| Jamaican | 77 | 1.0% |
| Japanese | 22 | 0.3% |
| Korean | 15 | 0.2% |
| Mexican | 746 | 9.6% |
| Native Hawaiian | 8 | 0.1% |
| Norwegian | 6 | 0.1% |
| Polish | 25 | 0.3% |
| Puerto Rican | 42 | 0.5% |
| Russian | 21 | 0.3% |
| Salvadoran | 431 | 5.5% |
| Scotch-Irish | 40 | 0.5% |
| Scottish | 21 | 0.3% |
| South American | 61 | 0.8% |
| Sri Lankan | 18 | 0.2% |
| Subsaharan African | 32 | 0.4% |
| Welsh | 7 | 0.1% |
| West Indian | 14 | 0.2% | View All 43 Rows |
Immigrants in Bellwood
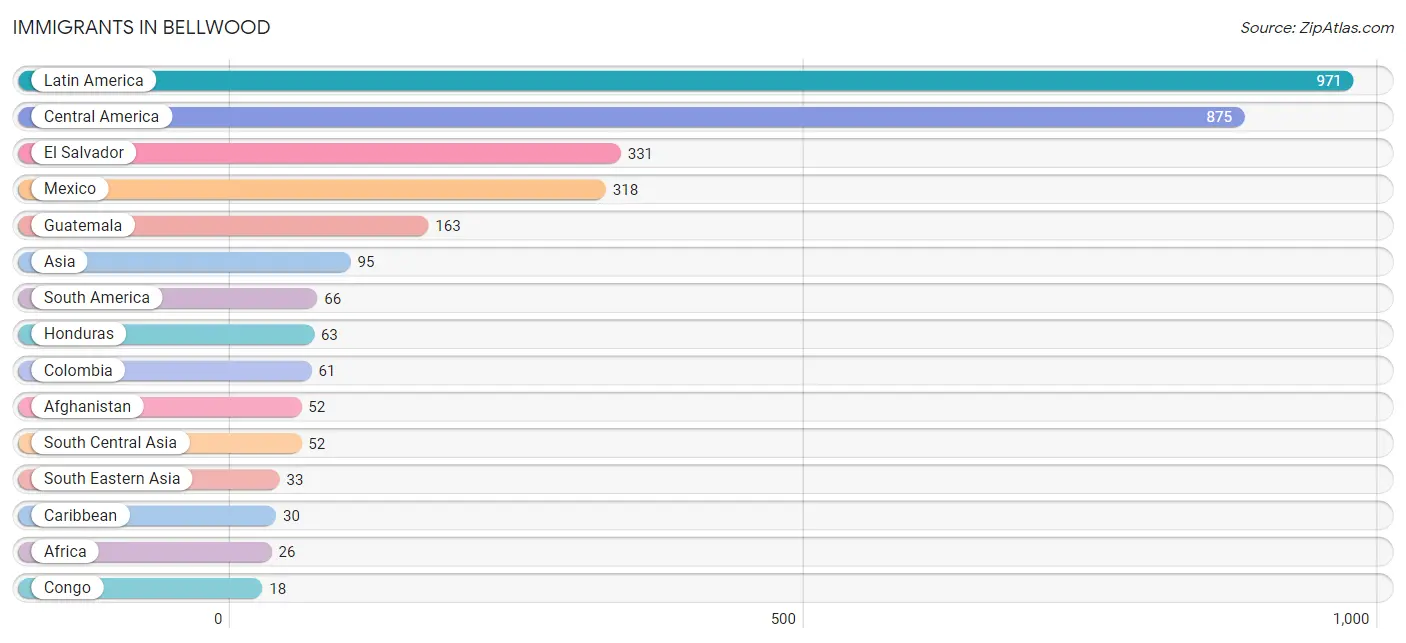
The most numerous immigrant groups reported in Bellwood came from Latin America (971 | 12.5%), Central America (875 | 11.2%), El Salvador (331 | 4.3%), Mexico (318 | 4.1%), and Guatemala (163 | 2.1%), together accounting for 34.1% of all Bellwood residents.
| Immigration Origin | # Population | % Population |
| Afghanistan | 52 | 0.7% |
| Africa | 26 | 0.3% |
| Asia | 95 | 1.2% |
| Brazil | 5 | 0.1% |
| Cambodia | 12 | 0.2% |
| Caribbean | 30 | 0.4% |
| Central America | 875 | 11.2% |
| Colombia | 61 | 0.8% |
| Congo | 18 | 0.2% |
| Dominican Republic | 6 | 0.1% |
| El Salvador | 331 | 4.3% |
| Europe | 8 | 0.1% |
| Germany | 8 | 0.1% |
| Guatemala | 163 | 2.1% |
| Honduras | 63 | 0.8% |
| Jamaica | 10 | 0.1% |
| Jordan | 10 | 0.1% |
| Latin America | 971 | 12.5% |
| Mexico | 318 | 4.1% |
| Middle Africa | 18 | 0.2% |
| Nigeria | 8 | 0.1% |
| Philippines | 15 | 0.2% |
| South America | 66 | 0.9% |
| South Central Asia | 52 | 0.7% |
| South Eastern Asia | 33 | 0.4% |
| St. Vincent and the Grenadines | 14 | 0.2% |
| Vietnam | 6 | 0.1% |
| Western Africa | 8 | 0.1% |
| Western Asia | 10 | 0.1% |
| Western Europe | 8 | 0.1% | View All 30 Rows |
Sex and Age in Bellwood
Sex and Age in Bellwood
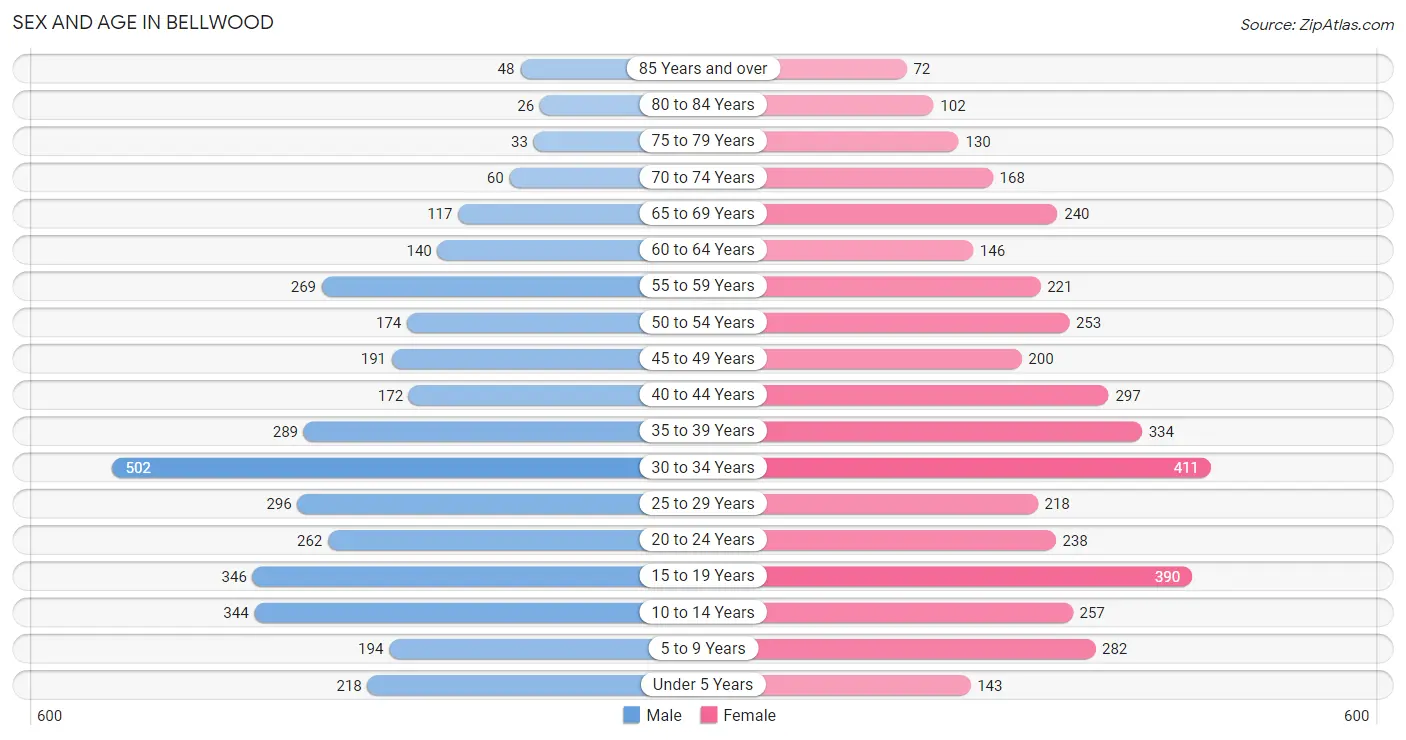
The most populous age groups in Bellwood are 30 to 34 Years (502 | 13.6%) for men and 30 to 34 Years (411 | 10.0%) for women.
| Age Bracket | Male | Female |
| Under 5 Years | 218 (5.9%) | 143 (3.5%) |
| 5 to 9 Years | 194 (5.3%) | 282 (6.9%) |
| 10 to 14 Years | 344 (9.3%) | 257 (6.3%) |
| 15 to 19 Years | 346 (9.4%) | 390 (9.5%) |
| 20 to 24 Years | 262 (7.1%) | 238 (5.8%) |
| 25 to 29 Years | 296 (8.0%) | 218 (5.3%) |
| 30 to 34 Years | 502 (13.6%) | 411 (10.0%) |
| 35 to 39 Years | 289 (7.9%) | 334 (8.1%) |
| 40 to 44 Years | 172 (4.7%) | 297 (7.2%) |
| 45 to 49 Years | 191 (5.2%) | 200 (4.9%) |
| 50 to 54 Years | 174 (4.7%) | 253 (6.2%) |
| 55 to 59 Years | 269 (7.3%) | 221 (5.4%) |
| 60 to 64 Years | 140 (3.8%) | 146 (3.6%) |
| 65 to 69 Years | 117 (3.2%) | 240 (5.9%) |
| 70 to 74 Years | 60 (1.6%) | 168 (4.1%) |
| 75 to 79 Years | 33 (0.9%) | 130 (3.2%) |
| 80 to 84 Years | 26 (0.7%) | 102 (2.5%) |
| 85 Years and over | 48 (1.3%) | 72 (1.8%) |
| Total | 3,681 (100.0%) | 4,102 (100.0%) |
Families and Households in Bellwood
Median Family Size in Bellwood
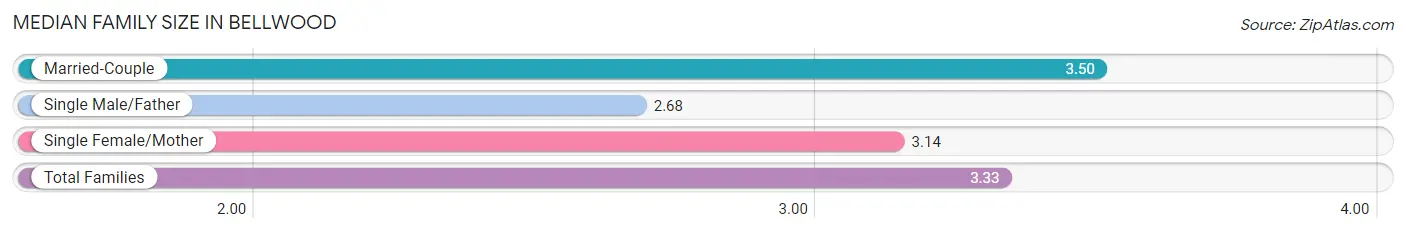
The median family size in Bellwood is 3.33 persons per family, with married-couple families (1,079 | 58.6%) accounting for the largest median family size of 3.5 persons per family. On the other hand, single male/father families (82 | 4.4%) represent the smallest median family size with 2.68 persons per family.
| Family Type | # Families | Family Size |
| Married-Couple | 1,079 (58.6%) | 3.50 |
| Single Male/Father | 82 (4.4%) | 2.68 |
| Single Female/Mother | 680 (36.9%) | 3.14 |
| Total Families | 1,841 (100.0%) | 3.33 |
Median Household Size in Bellwood
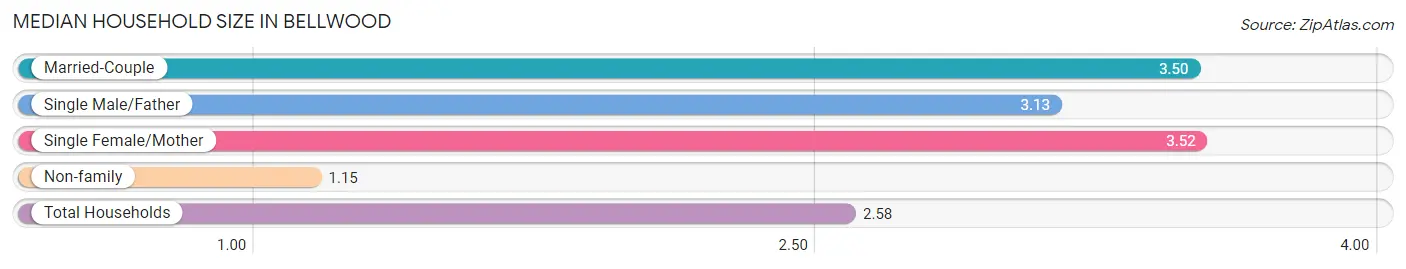
The median household size in Bellwood is 2.58 persons per household, with single female/mother households (680 | 22.5%) accounting for the largest median household size of 3.52 persons per household. non-family households (1,178 | 39.0%) represent the smallest median household size with 1.15 persons per household.
| Household Type | # Households | Household Size |
| Married-Couple | 1,079 (35.7%) | 3.50 |
| Single Male/Father | 82 (2.7%) | 3.13 |
| Single Female/Mother | 680 (22.5%) | 3.52 |
| Non-family | 1,178 (39.0%) | 1.15 |
| Total Households | 3,019 (100.0%) | 2.58 |
Household Size by Marriage Status in Bellwood
Out of a total of 3,019 households in Bellwood, 1,841 (61.0%) are family households, while 1,178 (39.0%) are nonfamily households. The most numerous type of family households are 2-person households, comprising 737, and the most common type of nonfamily households are 1-person households, comprising 1,061.
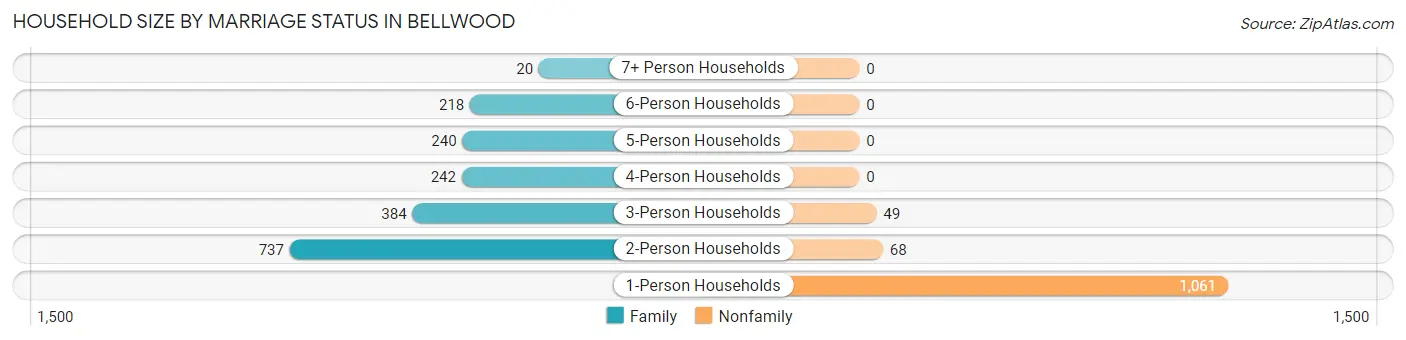
| Household Size | Family Households | Nonfamily Households |
| 1-Person Households | - | 1,061 (35.1%) |
| 2-Person Households | 737 (24.4%) | 68 (2.2%) |
| 3-Person Households | 384 (12.7%) | 49 (1.6%) |
| 4-Person Households | 242 (8.0%) | 0 (0.0%) |
| 5-Person Households | 240 (8.0%) | 0 (0.0%) |
| 6-Person Households | 218 (7.2%) | 0 (0.0%) |
| 7+ Person Households | 20 (0.7%) | 0 (0.0%) |
| Total | 1,841 (61.0%) | 1,178 (39.0%) |
Female Fertility in Bellwood
Fertility by Age in Bellwood
Average fertility rate in Bellwood is 90.0 births per 1,000 women. Women in the age bracket of 20 to 34 years have the highest fertility rate with 157.0 births per 1,000 women. Women in the age bracket of 20 to 34 years acount for 69.7% of all women with births.
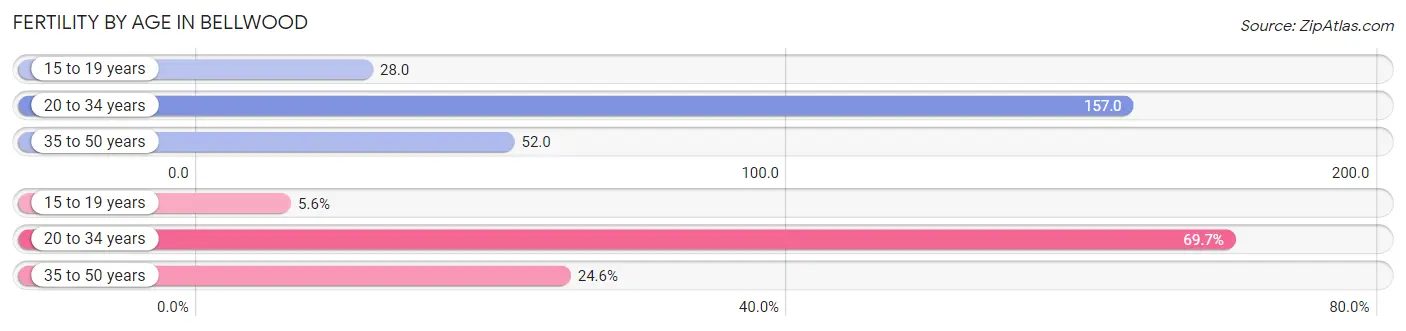
| Age Bracket | Women with Births | Births / 1,000 Women |
| 15 to 19 years | 11 (5.6%) | 28.0 |
| 20 to 34 years | 136 (69.7%) | 157.0 |
| 35 to 50 years | 48 (24.6%) | 52.0 |
| Total | 195 (100.0%) | 90.0 |
Fertility by Age by Marriage Status in Bellwood
67.2% of women with births (195) in Bellwood are married. The highest percentage of unmarried women with births falls into 15 to 19 years age bracket with 100.0% of them unmarried at the time of birth, while the lowest percentage of unmarried women with births belong to 35 to 50 years age bracket with 0.0% of them unmarried.
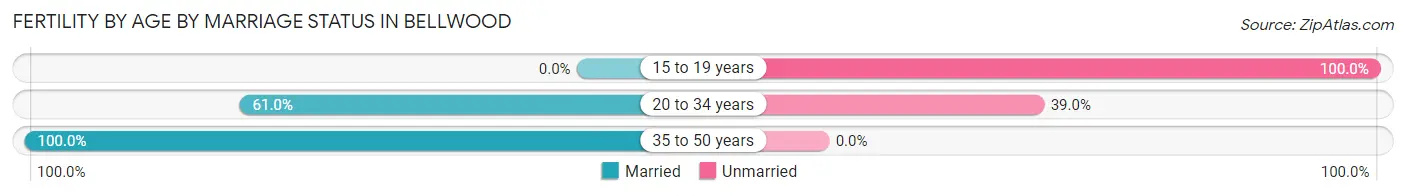
| Age Bracket | Married | Unmarried |
| 15 to 19 years | 0 (0.0%) | 11 (100.0%) |
| 20 to 34 years | 83 (61.0%) | 53 (39.0%) |
| 35 to 50 years | 48 (100.0%) | 0 (0.0%) |
| Total | 131 (67.2%) | 64 (32.8%) |
Fertility by Education in Bellwood
Average fertility rate in Bellwood is 90.0 births per 1,000 women. Women with the education attainment of bachelor's degree have the highest fertility rate of 248.0 births per 1,000 women, while women with the education attainment of less than high school have the lowest fertility at 25.0 births per 1,000 women. Women with the education attainment of high school diploma represent 33.9% of all women with births.
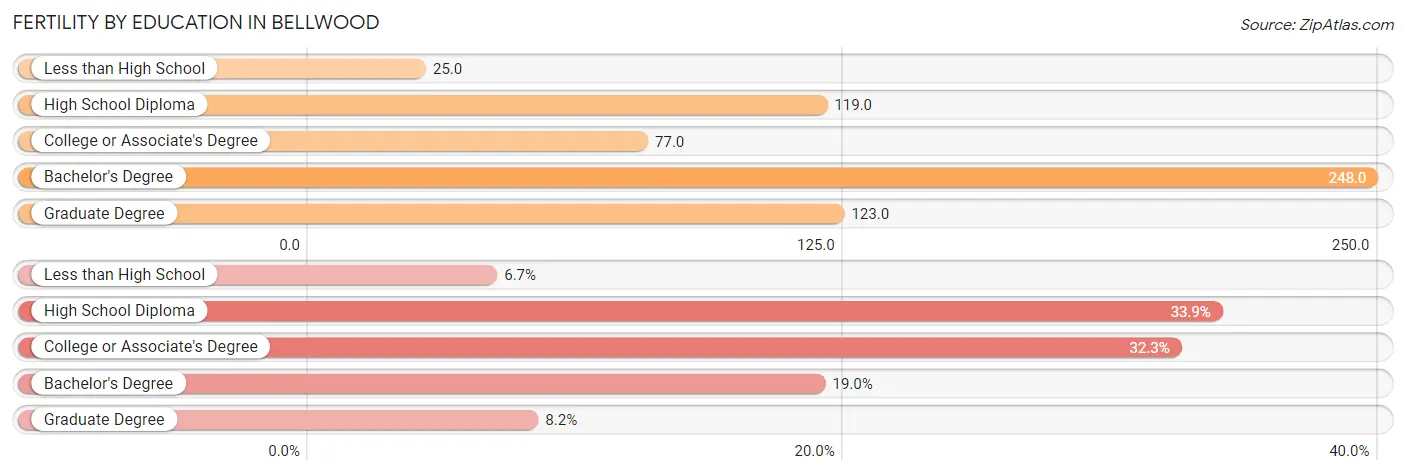
| Educational Attainment | Women with Births | Births / 1,000 Women |
| Less than High School | 13 (6.7%) | 25.0 |
| High School Diploma | 66 (33.9%) | 119.0 |
| College or Associate's Degree | 63 (32.3%) | 77.0 |
| Bachelor's Degree | 37 (19.0%) | 248.0 |
| Graduate Degree | 16 (8.2%) | 123.0 |
| Total | 195 (100.0%) | 90.0 |
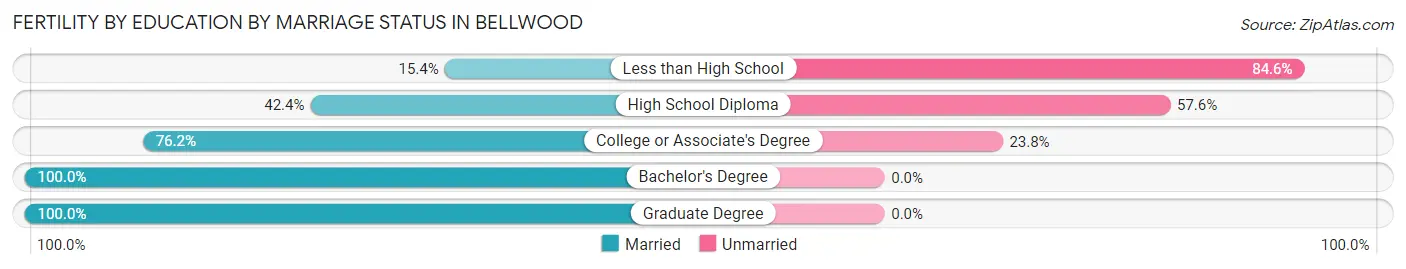
Fertility by Education by Marriage Status in Bellwood
32.8% of women with births in Bellwood are unmarried. Women with the educational attainment of bachelor's degree are most likely to be married with 100.0% of them married at childbirth, while women with the educational attainment of less than high school are least likely to be married with 84.6% of them unmarried at childbirth.
| Educational Attainment | Married | Unmarried |
| Less than High School | 2 (15.4%) | 11 (84.6%) |
| High School Diploma | 28 (42.4%) | 38 (57.6%) |
| College or Associate's Degree | 48 (76.2%) | 15 (23.8%) |
| Bachelor's Degree | 37 (100.0%) | 0 (0.0%) |
| Graduate Degree | 16 (100.0%) | 0 (0.0%) |
| Total | 131 (67.2%) | 64 (32.8%) |
Employment Characteristics in Bellwood
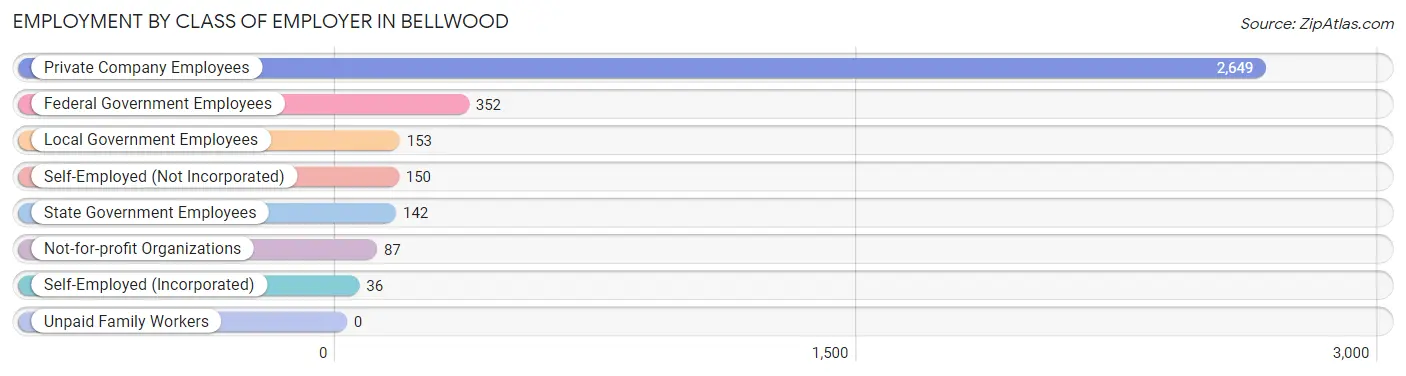
Employment by Class of Employer in Bellwood
Among the 3,569 employed individuals in Bellwood, private company employees (2,649 | 74.2%), federal government employees (352 | 9.9%), and local government employees (153 | 4.3%) make up the most common classes of employment.
| Employer Class | # Employees | % Employees |
| Private Company Employees | 2,649 | 74.2% |
| Self-Employed (Incorporated) | 36 | 1.0% |
| Self-Employed (Not Incorporated) | 150 | 4.2% |
| Not-for-profit Organizations | 87 | 2.4% |
| Local Government Employees | 153 | 4.3% |
| State Government Employees | 142 | 4.0% |
| Federal Government Employees | 352 | 9.9% |
| Unpaid Family Workers | 0 | 0.0% |
| Total | 3,569 | 100.0% |
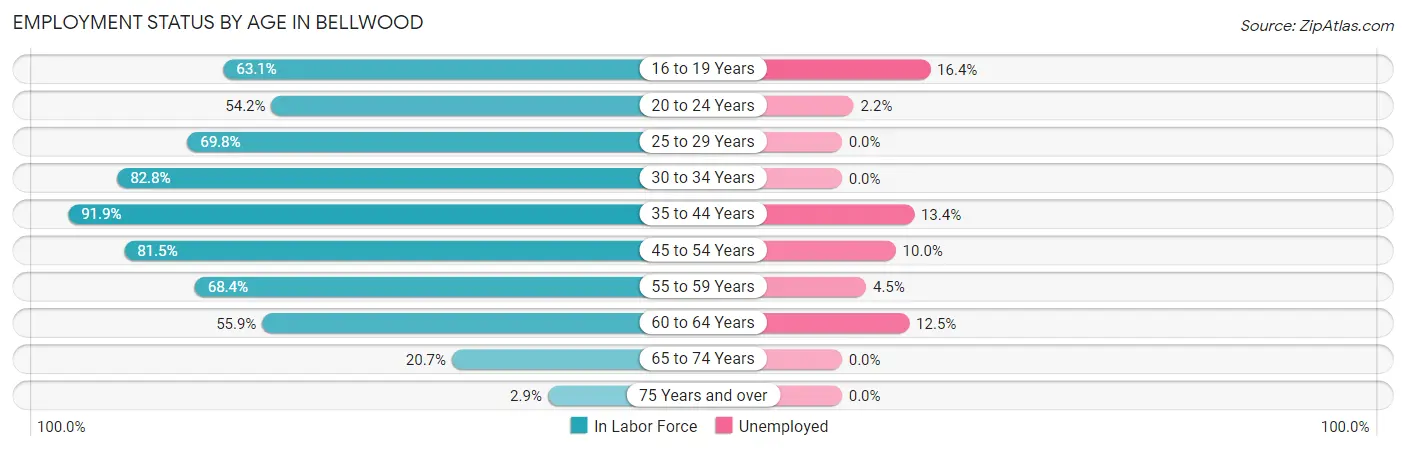
Employment Status by Age in Bellwood
According to the labor force statistics for Bellwood, out of the total population over 16 years of age (6,130), 65.5% or 4,015 individuals are in the labor force, with 7.5% or 301 of them unemployed. The age group with the highest labor force participation rate is 35 to 44 years, with 91.9% or 1,004 individuals in the labor force. Within the labor force, the 16 to 19 years age range has the highest percentage of unemployed individuals, with 16.4% or 54 of them being unemployed.
| Age Bracket | In Labor Force | Unemployed |
| 16 to 19 Years | 329 (63.1%) | 54 (16.4%) |
| 20 to 24 Years | 271 (54.2%) | 6 (2.2%) |
| 25 to 29 Years | 359 (69.8%) | 0 (0.0%) |
| 30 to 34 Years | 756 (82.8%) | 0 (0.0%) |
| 35 to 44 Years | 1,004 (91.9%) | 135 (13.4%) |
| 45 to 54 Years | 667 (81.5%) | 67 (10.0%) |
| 55 to 59 Years | 335 (68.4%) | 15 (4.5%) |
| 60 to 64 Years | 160 (55.9%) | 20 (12.5%) |
| 65 to 74 Years | 121 (20.7%) | 0 (0.0%) |
| 75 Years and over | 12 (2.9%) | 0 (0.0%) |
| Total | 4,015 (65.5%) | 301 (7.5%) |
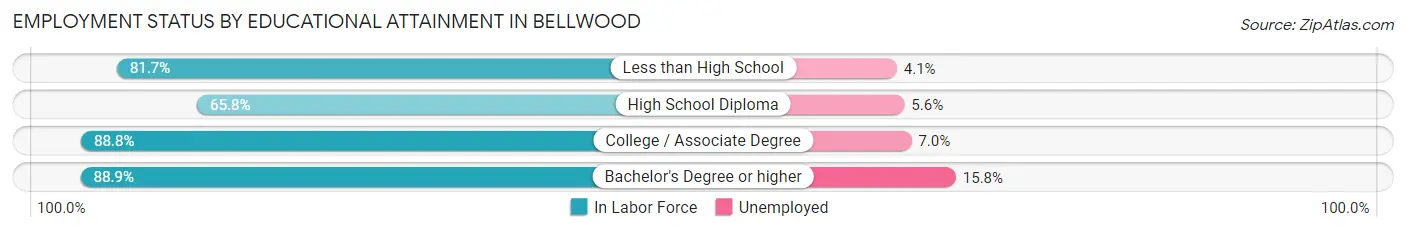
Employment Status by Educational Attainment in Bellwood
According to labor force statistics for Bellwood, 79.8% of individuals (3,282) out of the total population between 25 and 64 years of age (4,113) are in the labor force, with 7.3% or 240 of them being unemployed. The group with the highest labor force participation rate are those with the educational attainment of bachelor's degree or higher, with 88.9% or 563 individuals in the labor force. Within the labor force, individuals with bachelor's degree or higher education have the highest percentage of unemployment, with 15.8% or 89 of them being unemployed.
| Educational Attainment | In Labor Force | Unemployed |
| Less than High School | 760 (81.7%) | 38 (4.1%) |
| High School Diploma | 875 (65.8%) | 74 (5.6%) |
| College / Associate Degree | 1,083 (88.8%) | 85 (7.0%) |
| Bachelor's Degree or higher | 563 (88.9%) | 100 (15.8%) |
| Total | 3,282 (79.8%) | 300 (7.3%) |
Employment Occupations by Sex in Bellwood
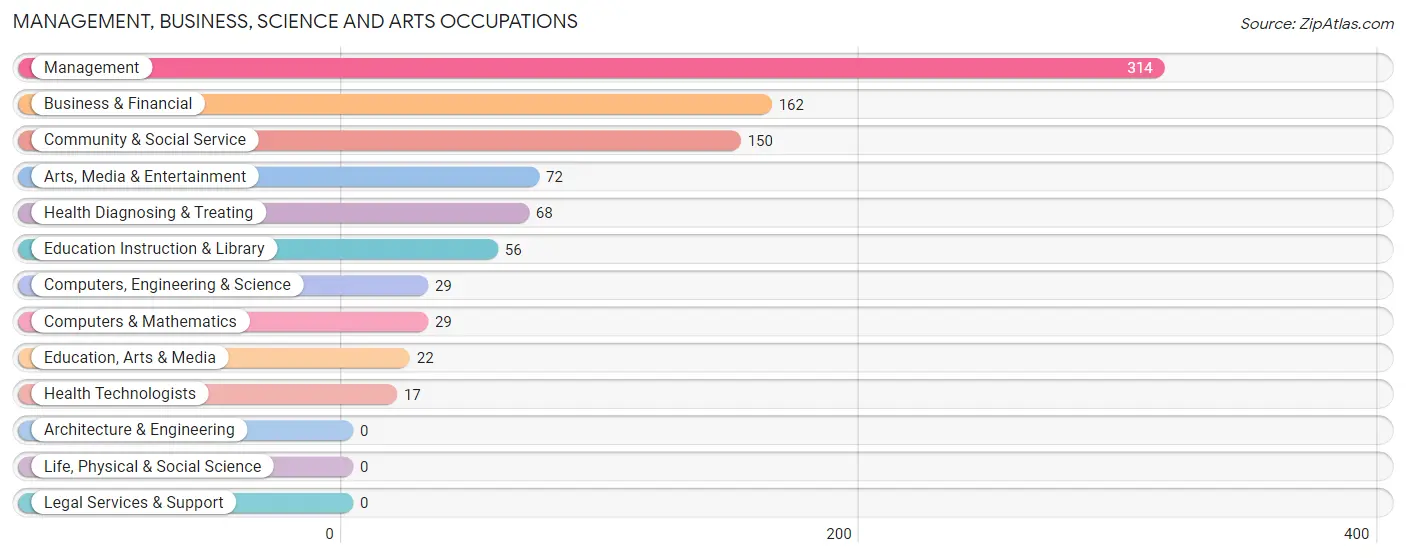
Management, Business, Science and Arts Occupations
The most common Management, Business, Science and Arts occupations in Bellwood are Management (314 | 8.6%), Business & Financial (162 | 4.4%), Community & Social Service (150 | 4.1%), Arts, Media & Entertainment (72 | 2.0%), and Health Diagnosing & Treating (68 | 1.8%).
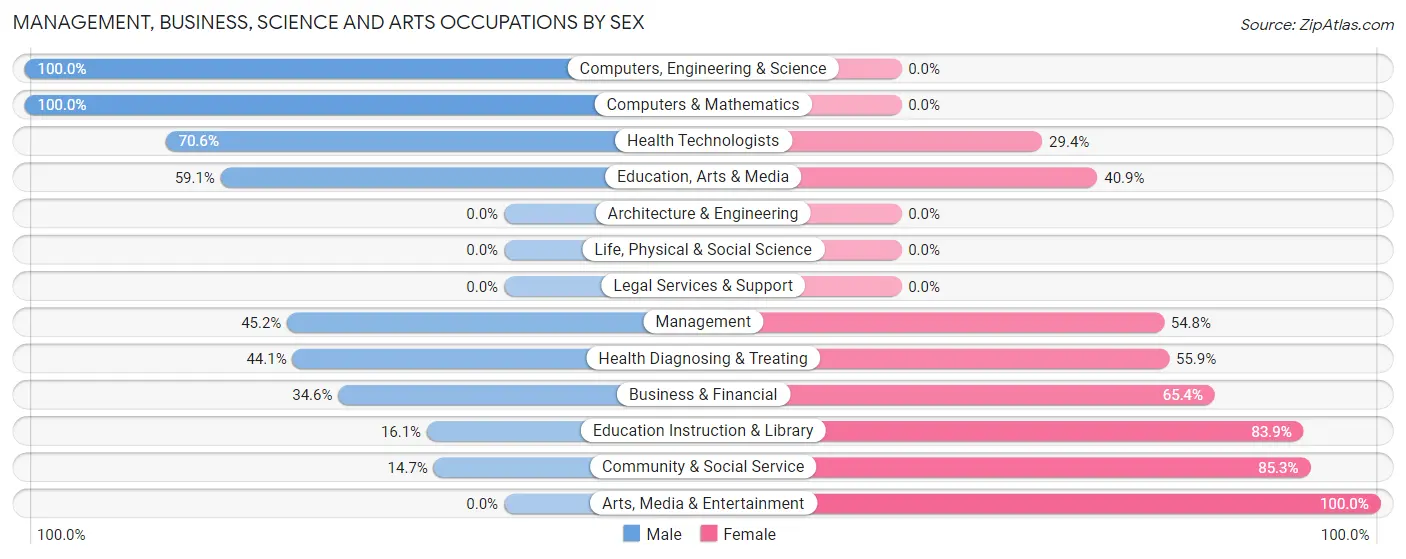
Management, Business, Science and Arts Occupations by Sex
Within the Management, Business, Science and Arts occupations in Bellwood, the most male-oriented occupations are Computers, Engineering & Science (100.0%), Computers & Mathematics (100.0%), and Health Technologists (70.6%), while the most female-oriented occupations are Arts, Media & Entertainment (100.0%), Community & Social Service (85.3%), and Education Instruction & Library (83.9%).
| Occupation | Male | Female |
| Management | 142 (45.2%) | 172 (54.8%) |
| Business & Financial | 56 (34.6%) | 106 (65.4%) |
| Computers, Engineering & Science | 29 (100.0%) | 0 (0.0%) |
| Computers & Mathematics | 29 (100.0%) | 0 (0.0%) |
| Architecture & Engineering | 0 (0.0%) | 0 (0.0%) |
| Life, Physical & Social Science | 0 (0.0%) | 0 (0.0%) |
| Community & Social Service | 22 (14.7%) | 128 (85.3%) |
| Education, Arts & Media | 13 (59.1%) | 9 (40.9%) |
| Legal Services & Support | 0 (0.0%) | 0 (0.0%) |
| Education Instruction & Library | 9 (16.1%) | 47 (83.9%) |
| Arts, Media & Entertainment | 0 (0.0%) | 72 (100.0%) |
| Health Diagnosing & Treating | 30 (44.1%) | 38 (55.9%) |
| Health Technologists | 12 (70.6%) | 5 (29.4%) |
| Total (Category) | 279 (38.6%) | 444 (61.4%) |
| Total (Overall) | 1,803 (49.2%) | 1,864 (50.8%) |
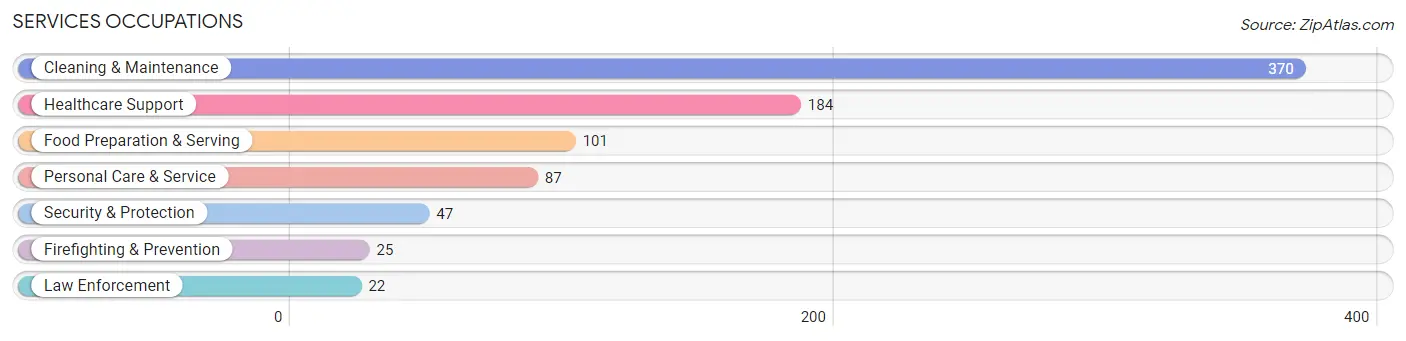
Services Occupations
The most common Services occupations in Bellwood are Cleaning & Maintenance (370 | 10.1%), Healthcare Support (184 | 5.0%), Food Preparation & Serving (101 | 2.8%), Personal Care & Service (87 | 2.4%), and Security & Protection (47 | 1.3%).
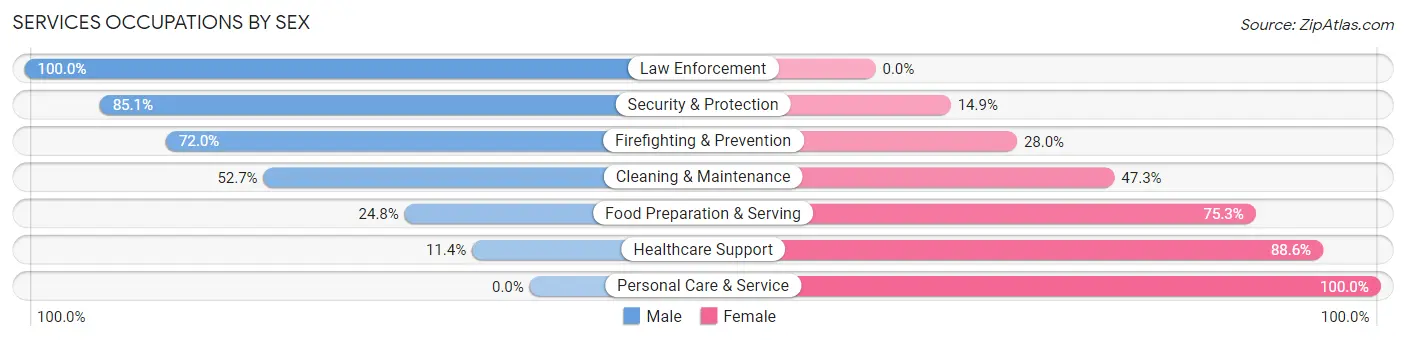
Services Occupations by Sex
Within the Services occupations in Bellwood, the most male-oriented occupations are Law Enforcement (100.0%), Security & Protection (85.1%), and Firefighting & Prevention (72.0%), while the most female-oriented occupations are Personal Care & Service (100.0%), Healthcare Support (88.6%), and Food Preparation & Serving (75.2%).
| Occupation | Male | Female |
| Healthcare Support | 21 (11.4%) | 163 (88.6%) |
| Security & Protection | 40 (85.1%) | 7 (14.9%) |
| Firefighting & Prevention | 18 (72.0%) | 7 (28.0%) |
| Law Enforcement | 22 (100.0%) | 0 (0.0%) |
| Food Preparation & Serving | 25 (24.7%) | 76 (75.2%) |
| Cleaning & Maintenance | 195 (52.7%) | 175 (47.3%) |
| Personal Care & Service | 0 (0.0%) | 87 (100.0%) |
| Total (Category) | 281 (35.6%) | 508 (64.4%) |
| Total (Overall) | 1,803 (49.2%) | 1,864 (50.8%) |
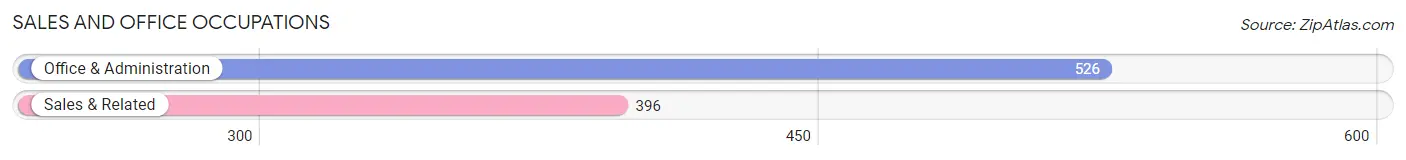
Sales and Office Occupations
The most common Sales and Office occupations in Bellwood are Office & Administration (526 | 14.3%), and Sales & Related (396 | 10.8%).
Sales and Office Occupations by Sex
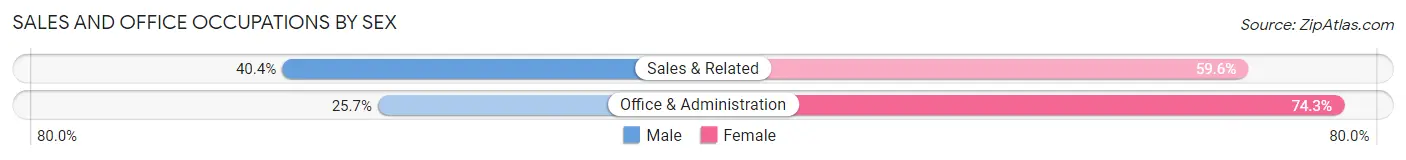
| Occupation | Male | Female |
| Sales & Related | 160 (40.4%) | 236 (59.6%) |
| Office & Administration | 135 (25.7%) | 391 (74.3%) |
| Total (Category) | 295 (32.0%) | 627 (68.0%) |
| Total (Overall) | 1,803 (49.2%) | 1,864 (50.8%) |
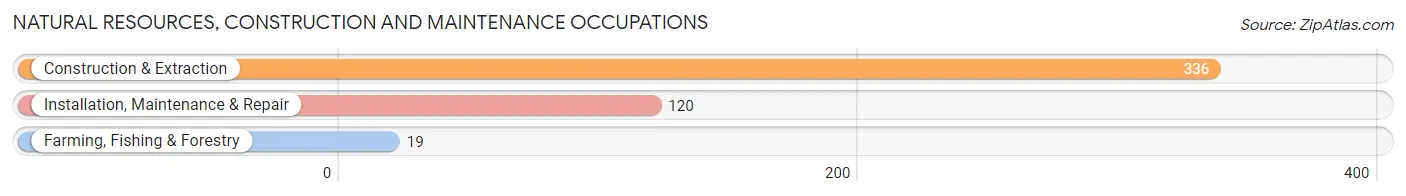
Natural Resources, Construction and Maintenance Occupations
The most common Natural Resources, Construction and Maintenance occupations in Bellwood are Construction & Extraction (336 | 9.2%), Installation, Maintenance & Repair (120 | 3.3%), and Farming, Fishing & Forestry (19 | 0.5%).
Natural Resources, Construction and Maintenance Occupations by Sex
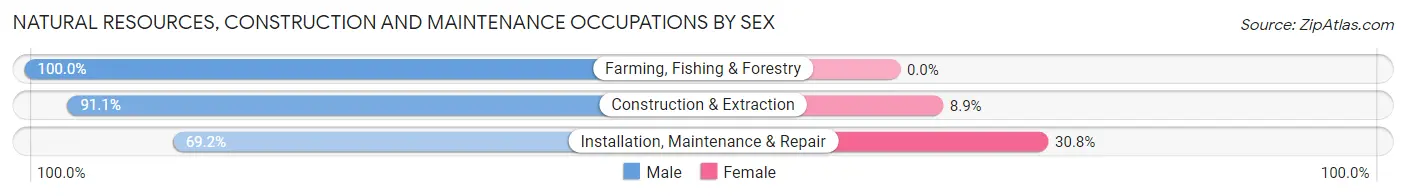
| Occupation | Male | Female |
| Farming, Fishing & Forestry | 19 (100.0%) | 0 (0.0%) |
| Construction & Extraction | 306 (91.1%) | 30 (8.9%) |
| Installation, Maintenance & Repair | 83 (69.2%) | 37 (30.8%) |
| Total (Category) | 408 (85.9%) | 67 (14.1%) |
| Total (Overall) | 1,803 (49.2%) | 1,864 (50.8%) |
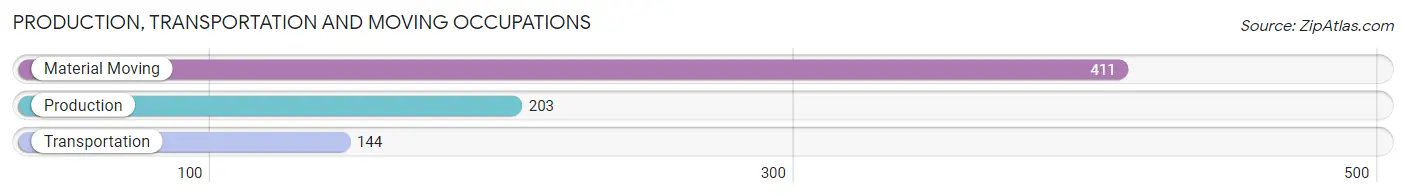
Production, Transportation and Moving Occupations
The most common Production, Transportation and Moving occupations in Bellwood are Material Moving (411 | 11.2%), Production (203 | 5.5%), and Transportation (144 | 3.9%).
Production, Transportation and Moving Occupations by Sex
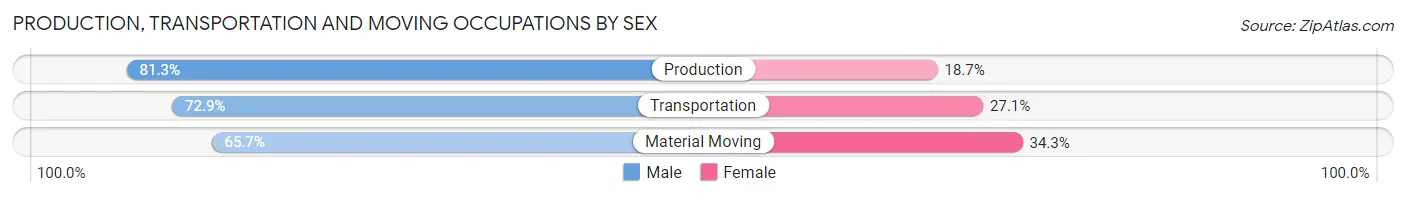
| Occupation | Male | Female |
| Production | 165 (81.3%) | 38 (18.7%) |
| Transportation | 105 (72.9%) | 39 (27.1%) |
| Material Moving | 270 (65.7%) | 141 (34.3%) |
| Total (Category) | 540 (71.2%) | 218 (28.8%) |
| Total (Overall) | 1,803 (49.2%) | 1,864 (50.8%) |
Employment Industries by Sex in Bellwood
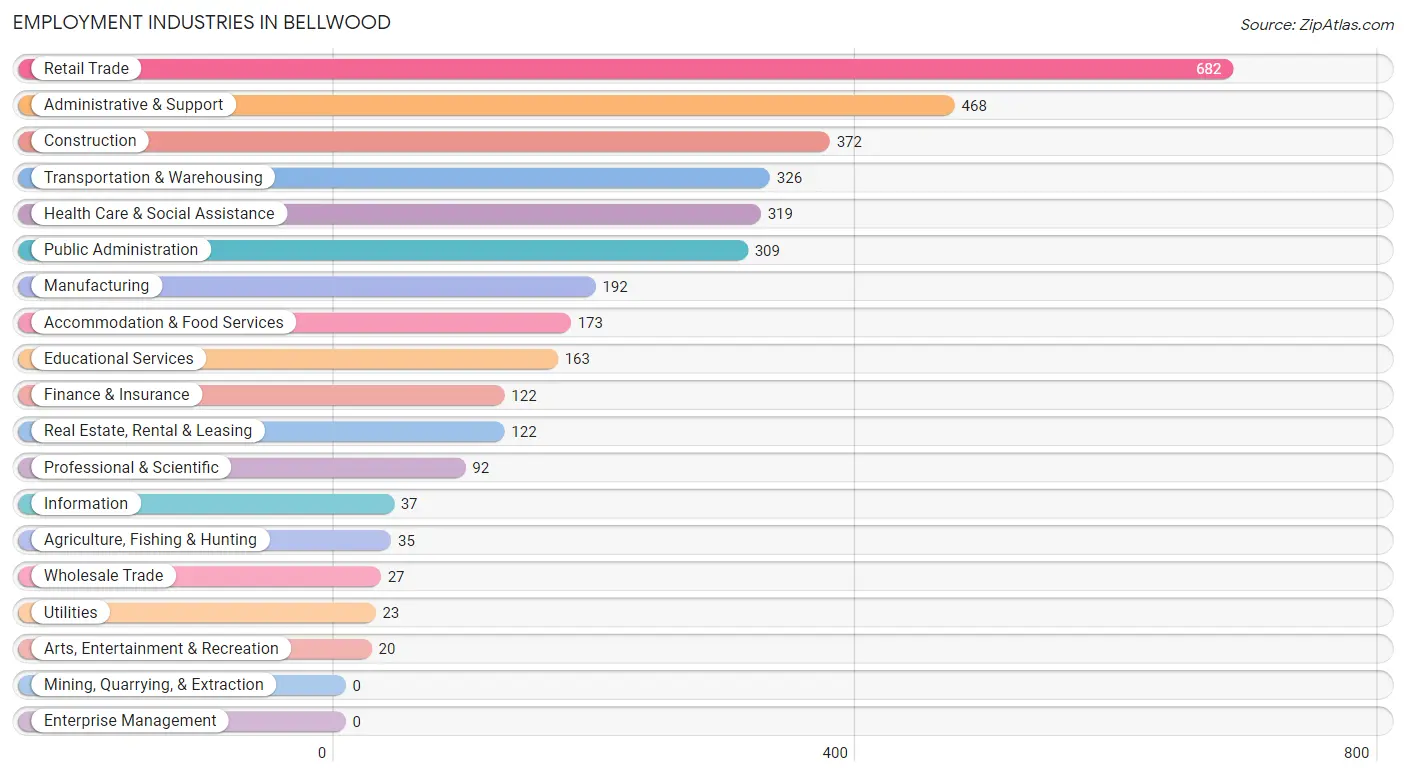
Employment Industries in Bellwood
The major employment industries in Bellwood include Retail Trade (682 | 18.6%), Administrative & Support (468 | 12.8%), Construction (372 | 10.1%), Transportation & Warehousing (326 | 8.9%), and Health Care & Social Assistance (319 | 8.7%).
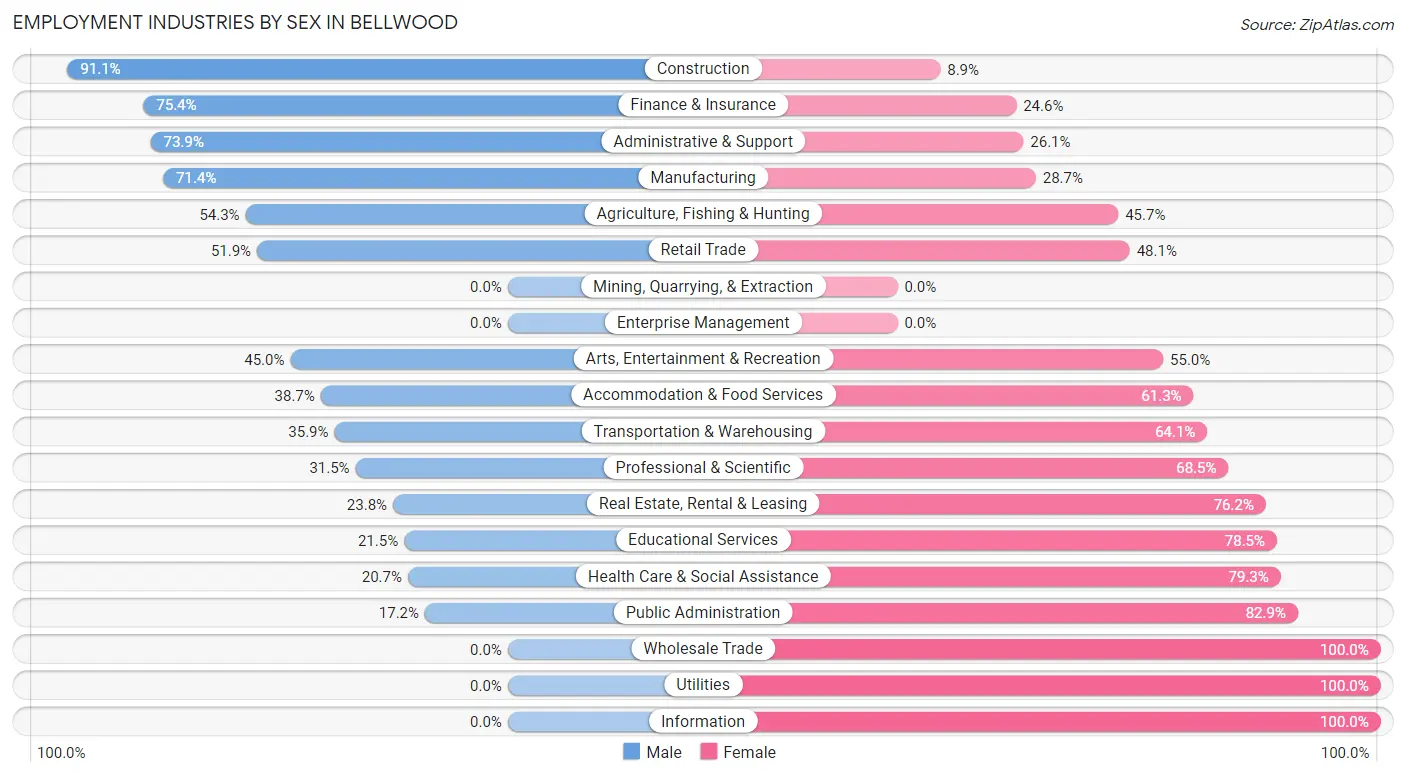
Employment Industries by Sex in Bellwood
The Bellwood industries that see more men than women are Construction (91.1%), Finance & Insurance (75.4%), and Administrative & Support (73.9%), whereas the industries that tend to have a higher number of women are Wholesale Trade (100.0%), Utilities (100.0%), and Information (100.0%).
| Industry | Male | Female |
| Agriculture, Fishing & Hunting | 19 (54.3%) | 16 (45.7%) |
| Mining, Quarrying, & Extraction | 0 (0.0%) | 0 (0.0%) |
| Construction | 339 (91.1%) | 33 (8.9%) |
| Manufacturing | 137 (71.4%) | 55 (28.6%) |
| Wholesale Trade | 0 (0.0%) | 27 (100.0%) |
| Retail Trade | 354 (51.9%) | 328 (48.1%) |
| Transportation & Warehousing | 117 (35.9%) | 209 (64.1%) |
| Utilities | 0 (0.0%) | 23 (100.0%) |
| Information | 0 (0.0%) | 37 (100.0%) |
| Finance & Insurance | 92 (75.4%) | 30 (24.6%) |
| Real Estate, Rental & Leasing | 29 (23.8%) | 93 (76.2%) |
| Professional & Scientific | 29 (31.5%) | 63 (68.5%) |
| Enterprise Management | 0 (0.0%) | 0 (0.0%) |
| Administrative & Support | 346 (73.9%) | 122 (26.1%) |
| Educational Services | 35 (21.5%) | 128 (78.5%) |
| Health Care & Social Assistance | 66 (20.7%) | 253 (79.3%) |
| Arts, Entertainment & Recreation | 9 (45.0%) | 11 (55.0%) |
| Accommodation & Food Services | 67 (38.7%) | 106 (61.3%) |
| Public Administration | 53 (17.2%) | 256 (82.9%) |
| Total | 1,803 (49.2%) | 1,864 (50.8%) |
Education in Bellwood
School Enrollment in Bellwood
The most common levels of schooling among the 2,158 students in Bellwood are high school (662 | 30.7%), middle school (438 | 20.3%), and college / undergraduate (396 | 18.3%).
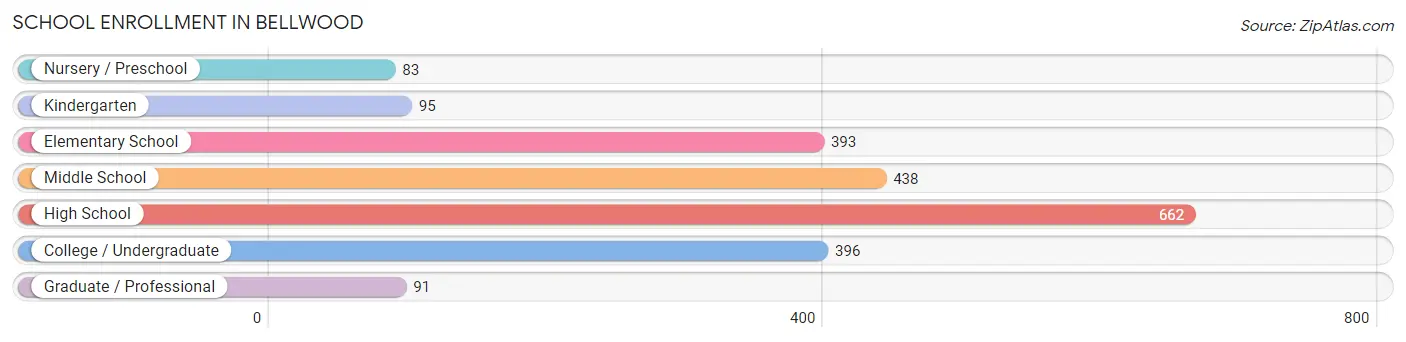
| School Level | # Students | % Students |
| Nursery / Preschool | 83 | 3.8% |
| Kindergarten | 95 | 4.4% |
| Elementary School | 393 | 18.2% |
| Middle School | 438 | 20.3% |
| High School | 662 | 30.7% |
| College / Undergraduate | 396 | 18.3% |
| Graduate / Professional | 91 | 4.2% |
| Total | 2,158 | 100.0% |
School Enrollment by Age by Funding Source in Bellwood
Out of a total of 2,158 students who are enrolled in schools in Bellwood, 175 (8.1%) attend a private institution, while the remaining 1,983 (91.9%) are enrolled in public schools. The age group of 3 to 4 year olds has the highest likelihood of being enrolled in private schools, with 42 (57.5% in the age bracket) enrolled. Conversely, the age group of 15 to 17 year olds has the lowest likelihood of being enrolled in a private school, with 247 (100.0% in the age bracket) attending a public institution.
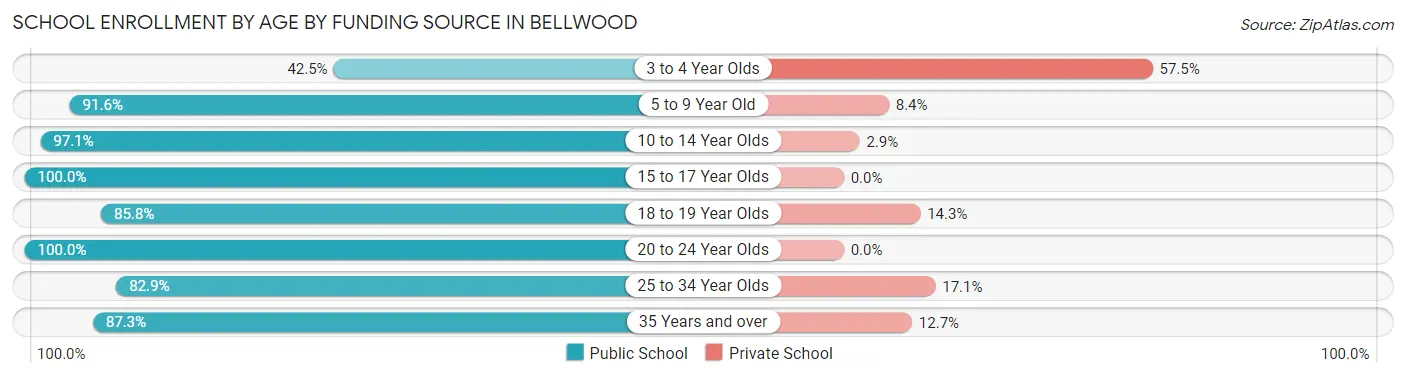
| Age Bracket | Public School | Private School |
| 3 to 4 Year Olds | 31 (42.5%) | 42 (57.5%) |
| 5 to 9 Year Old | 436 (91.6%) | 40 (8.4%) |
| 10 to 14 Year Olds | 528 (97.1%) | 16 (2.9%) |
| 15 to 17 Year Olds | 247 (100.0%) | 0 (0.0%) |
| 18 to 19 Year Olds | 325 (85.8%) | 54 (14.2%) |
| 20 to 24 Year Olds | 280 (100.0%) | 0 (0.0%) |
| 25 to 34 Year Olds | 34 (82.9%) | 7 (17.1%) |
| 35 Years and over | 103 (87.3%) | 15 (12.7%) |
| Total | 1,983 (91.9%) | 175 (8.1%) |
Educational Attainment by Field of Study in Bellwood
Business (212 | 29.0%), arts & humanities (91 | 12.4%), bio, nature & agricultural (69 | 9.4%), social sciences (67 | 9.2%), and psychology (63 | 8.6%) are the most common fields of study among 731 individuals in Bellwood who have obtained a bachelor's degree or higher.
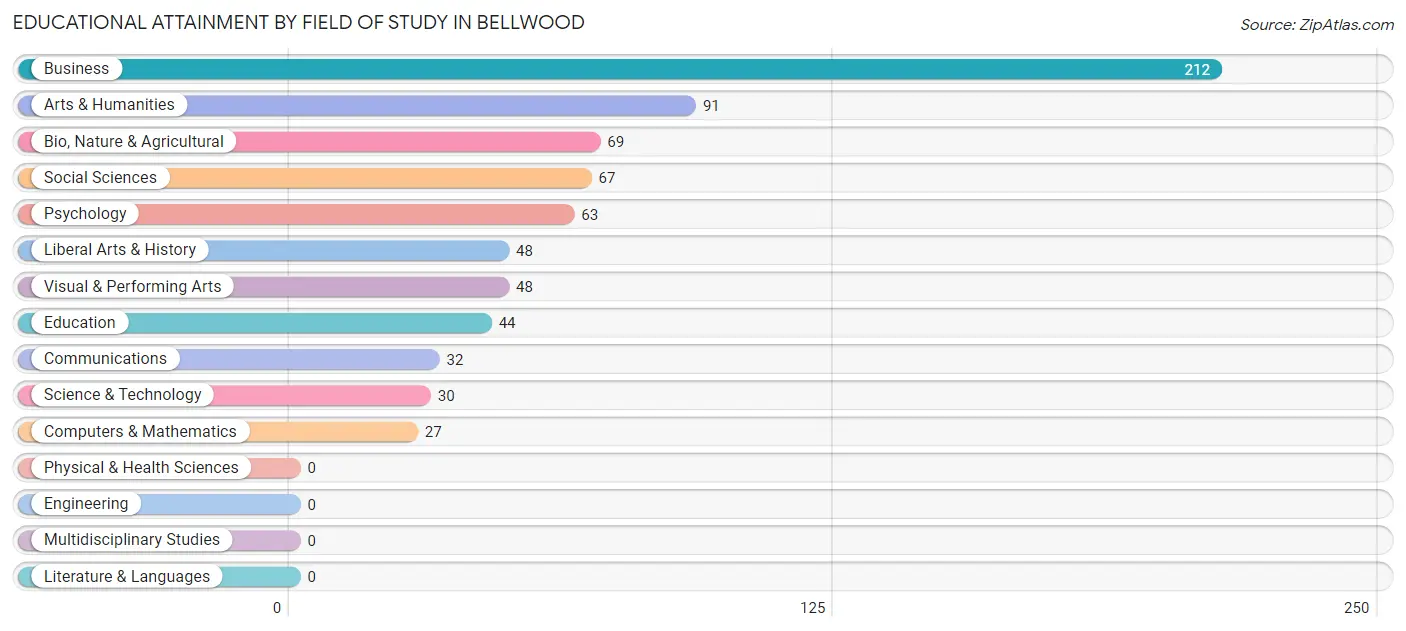
| Field of Study | # Graduates | % Graduates |
| Computers & Mathematics | 27 | 3.7% |
| Bio, Nature & Agricultural | 69 | 9.4% |
| Physical & Health Sciences | 0 | 0.0% |
| Psychology | 63 | 8.6% |
| Social Sciences | 67 | 9.2% |
| Engineering | 0 | 0.0% |
| Multidisciplinary Studies | 0 | 0.0% |
| Science & Technology | 30 | 4.1% |
| Business | 212 | 29.0% |
| Education | 44 | 6.0% |
| Literature & Languages | 0 | 0.0% |
| Liberal Arts & History | 48 | 6.6% |
| Visual & Performing Arts | 48 | 6.6% |
| Communications | 32 | 4.4% |
| Arts & Humanities | 91 | 12.4% |
| Total | 731 | 100.0% |
Transportation & Commute in Bellwood
Vehicle Availability by Sex in Bellwood
The most prevalent vehicle ownership categories in Bellwood are males with 3 vehicles (636, accounting for 34.6%) and females with 3 vehicles (421, making up 36.7%).
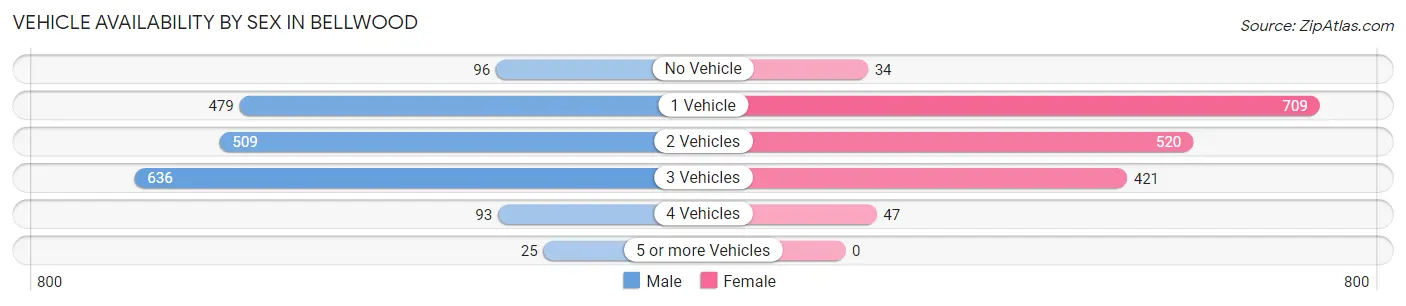
| Vehicles Available | Male | Female |
| No Vehicle | 96 (5.2%) | 34 (2.0%) |
| 1 Vehicle | 479 (26.1%) | 709 (41.0%) |
| 2 Vehicles | 509 (27.7%) | 520 (30.0%) |
| 3 Vehicles | 636 (34.6%) | 421 (24.3%) |
| 4 Vehicles | 93 (5.1%) | 47 (2.7%) |
| 5 or more Vehicles | 25 (1.4%) | 0 (0.0%) |
| Total | 1,838 (100.0%) | 1,731 (100.0%) |
Commute Time in Bellwood
The most frequently occuring commute durations in Bellwood are 20 to 24 minutes (983 commuters, 28.7%), 30 to 34 minutes (641 commuters, 18.7%), and 15 to 19 minutes (508 commuters, 14.8%).
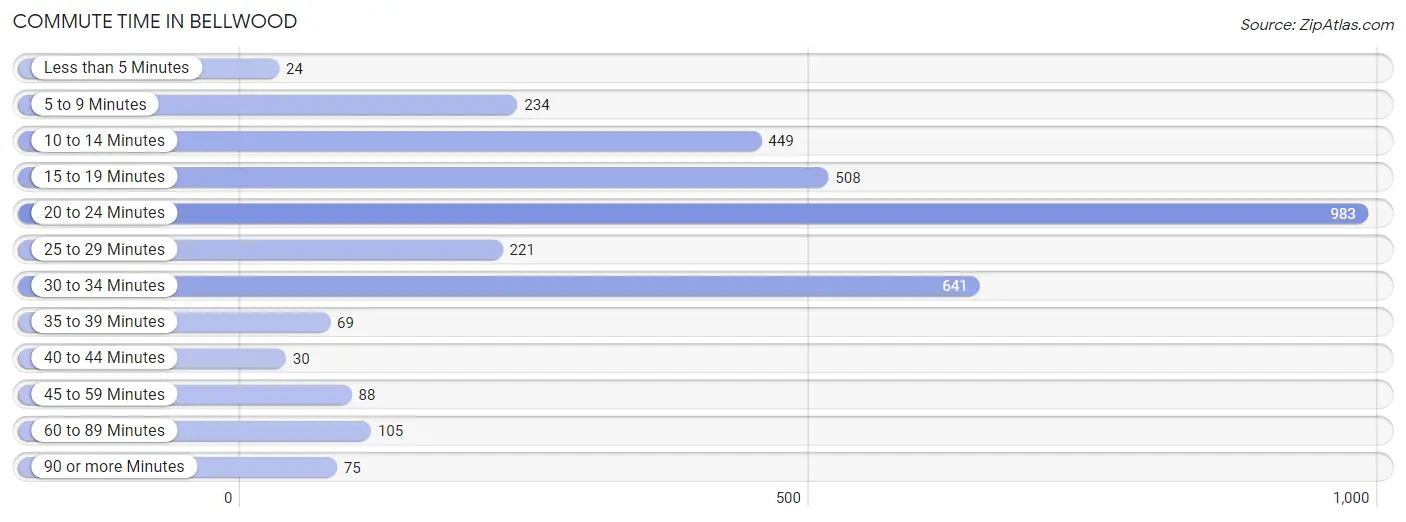
| Commute Time | # Commuters | % Commuters |
| Less than 5 Minutes | 24 | 0.7% |
| 5 to 9 Minutes | 234 | 6.8% |
| 10 to 14 Minutes | 449 | 13.1% |
| 15 to 19 Minutes | 508 | 14.8% |
| 20 to 24 Minutes | 983 | 28.7% |
| 25 to 29 Minutes | 221 | 6.5% |
| 30 to 34 Minutes | 641 | 18.7% |
| 35 to 39 Minutes | 69 | 2.0% |
| 40 to 44 Minutes | 30 | 0.9% |
| 45 to 59 Minutes | 88 | 2.6% |
| 60 to 89 Minutes | 105 | 3.1% |
| 90 or more Minutes | 75 | 2.2% |
Commute Time by Sex in Bellwood
The most common commute times in Bellwood are 30 to 34 minutes (512 commuters, 28.5%) for males and 20 to 24 minutes (580 commuters, 35.5%) for females.
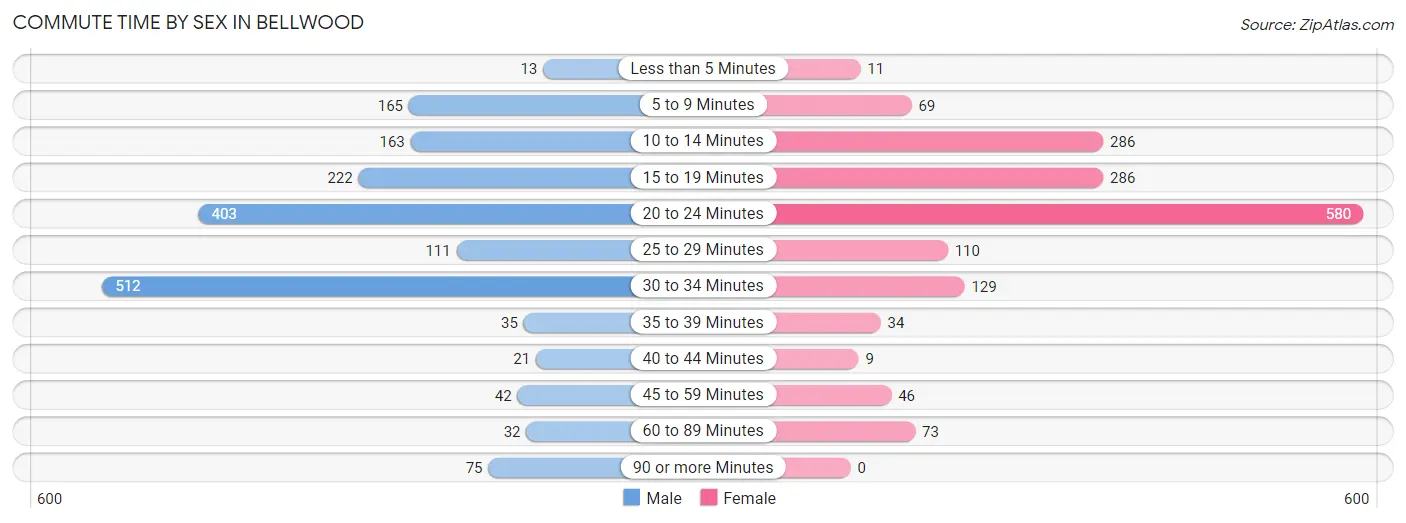
| Commute Time | Male | Female |
| Less than 5 Minutes | 13 (0.7%) | 11 (0.7%) |
| 5 to 9 Minutes | 165 (9.2%) | 69 (4.2%) |
| 10 to 14 Minutes | 163 (9.1%) | 286 (17.5%) |
| 15 to 19 Minutes | 222 (12.4%) | 286 (17.5%) |
| 20 to 24 Minutes | 403 (22.5%) | 580 (35.5%) |
| 25 to 29 Minutes | 111 (6.2%) | 110 (6.7%) |
| 30 to 34 Minutes | 512 (28.5%) | 129 (7.9%) |
| 35 to 39 Minutes | 35 (1.9%) | 34 (2.1%) |
| 40 to 44 Minutes | 21 (1.2%) | 9 (0.5%) |
| 45 to 59 Minutes | 42 (2.3%) | 46 (2.8%) |
| 60 to 89 Minutes | 32 (1.8%) | 73 (4.5%) |
| 90 or more Minutes | 75 (4.2%) | 0 (0.0%) |
Time of Departure to Work by Sex in Bellwood
The most frequent times of departure to work in Bellwood are 7:00 AM to 7:29 AM (342, 19.1%) for males and 9:00 AM to 9:59 AM (256, 15.7%) for females.
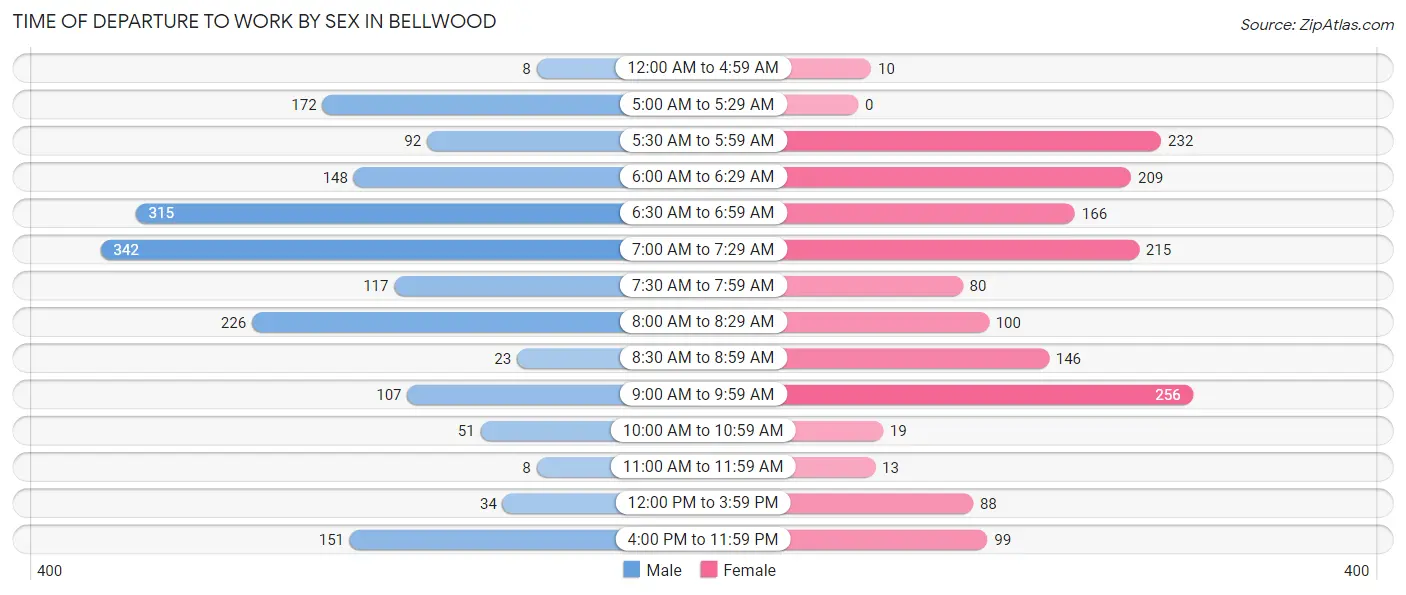
| Time of Departure | Male | Female |
| 12:00 AM to 4:59 AM | 8 (0.4%) | 10 (0.6%) |
| 5:00 AM to 5:29 AM | 172 (9.6%) | 0 (0.0%) |
| 5:30 AM to 5:59 AM | 92 (5.1%) | 232 (14.2%) |
| 6:00 AM to 6:29 AM | 148 (8.3%) | 209 (12.8%) |
| 6:30 AM to 6:59 AM | 315 (17.6%) | 166 (10.2%) |
| 7:00 AM to 7:29 AM | 342 (19.1%) | 215 (13.2%) |
| 7:30 AM to 7:59 AM | 117 (6.5%) | 80 (4.9%) |
| 8:00 AM to 8:29 AM | 226 (12.6%) | 100 (6.1%) |
| 8:30 AM to 8:59 AM | 23 (1.3%) | 146 (8.9%) |
| 9:00 AM to 9:59 AM | 107 (6.0%) | 256 (15.7%) |
| 10:00 AM to 10:59 AM | 51 (2.8%) | 19 (1.2%) |
| 11:00 AM to 11:59 AM | 8 (0.4%) | 13 (0.8%) |
| 12:00 PM to 3:59 PM | 34 (1.9%) | 88 (5.4%) |
| 4:00 PM to 11:59 PM | 151 (8.4%) | 99 (6.1%) |
| Total | 1,794 (100.0%) | 1,633 (100.0%) |
Housing Occupancy in Bellwood
Occupancy by Ownership in Bellwood
Of the total 3,019 dwellings in Bellwood, owner-occupied units account for 1,344 (44.5%), while renter-occupied units make up 1,675 (55.5%).
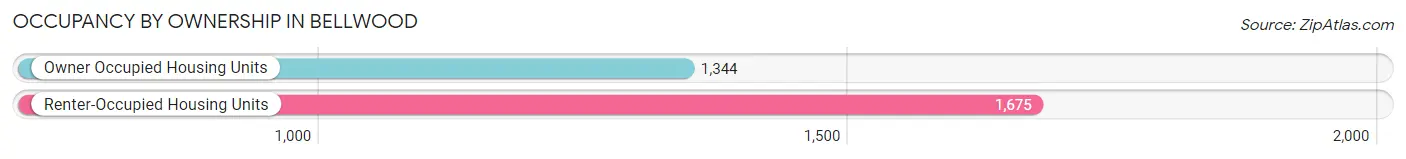
| Occupancy | # Housing Units | % Housing Units |
| Owner Occupied Housing Units | 1,344 | 44.5% |
| Renter-Occupied Housing Units | 1,675 | 55.5% |
| Total Occupied Housing Units | 3,019 | 100.0% |
Occupancy by Household Size in Bellwood
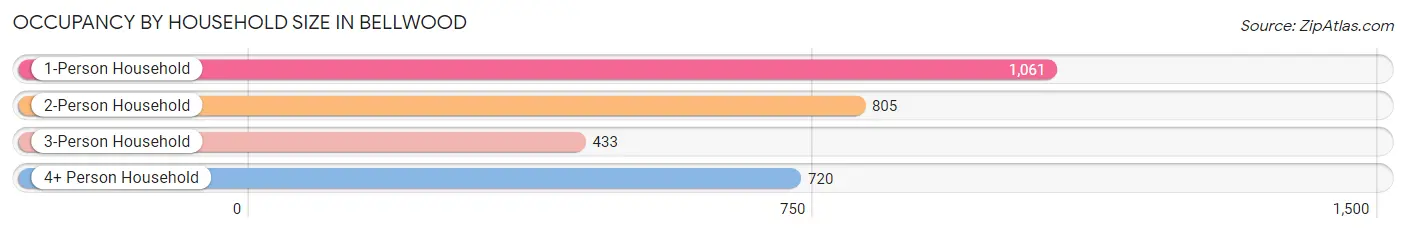
| Household Size | # Housing Units | % Housing Units |
| 1-Person Household | 1,061 | 35.1% |
| 2-Person Household | 805 | 26.7% |
| 3-Person Household | 433 | 14.3% |
| 4+ Person Household | 720 | 23.8% |
| Total Housing Units | 3,019 | 100.0% |
Occupancy by Ownership by Household Size in Bellwood
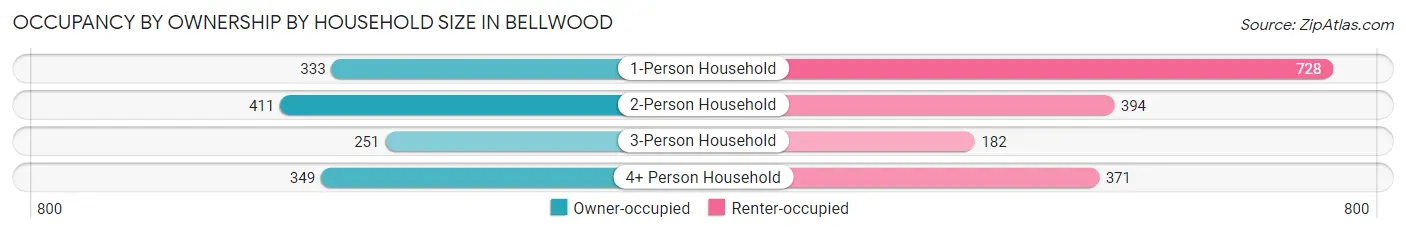
| Household Size | Owner-occupied | Renter-occupied |
| 1-Person Household | 333 (31.4%) | 728 (68.6%) |
| 2-Person Household | 411 (51.1%) | 394 (48.9%) |
| 3-Person Household | 251 (58.0%) | 182 (42.0%) |
| 4+ Person Household | 349 (48.5%) | 371 (51.5%) |
| Total Housing Units | 1,344 (44.5%) | 1,675 (55.5%) |
Occupancy by Educational Attainment in Bellwood
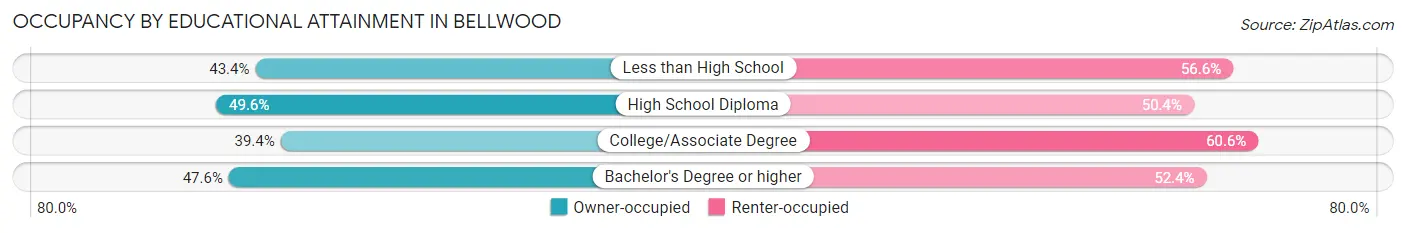
| Household Size | Owner-occupied | Renter-occupied |
| Less than High School | 290 (43.4%) | 378 (56.6%) |
| High School Diploma | 452 (49.6%) | 459 (50.4%) |
| College/Associate Degree | 402 (39.4%) | 618 (60.6%) |
| Bachelor's Degree or higher | 200 (47.6%) | 220 (52.4%) |
Occupancy by Age of Householder in Bellwood
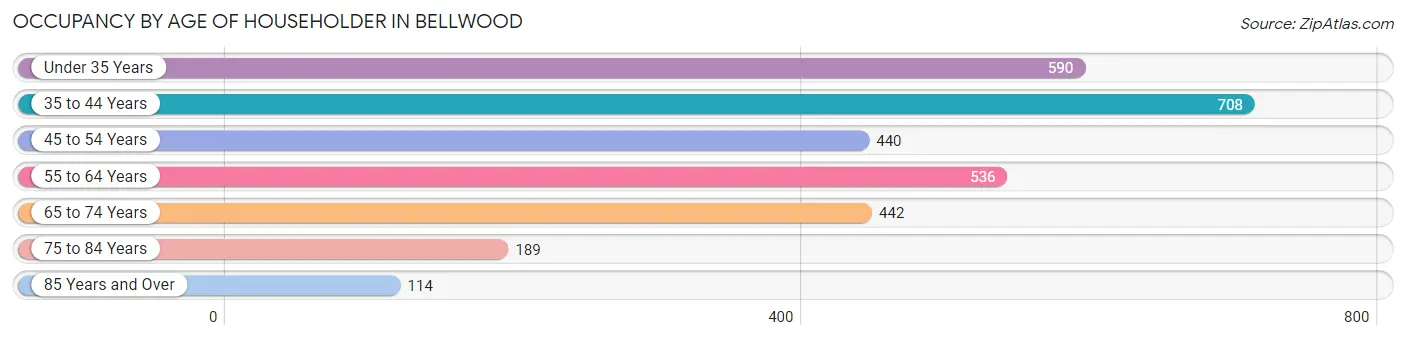
| Age Bracket | # Households | % Households |
| Under 35 Years | 590 | 19.5% |
| 35 to 44 Years | 708 | 23.4% |
| 45 to 54 Years | 440 | 14.6% |
| 55 to 64 Years | 536 | 17.7% |
| 65 to 74 Years | 442 | 14.6% |
| 75 to 84 Years | 189 | 6.3% |
| 85 Years and Over | 114 | 3.8% |
| Total | 3,019 | 100.0% |
Housing Finances in Bellwood
Median Income by Occupancy in Bellwood
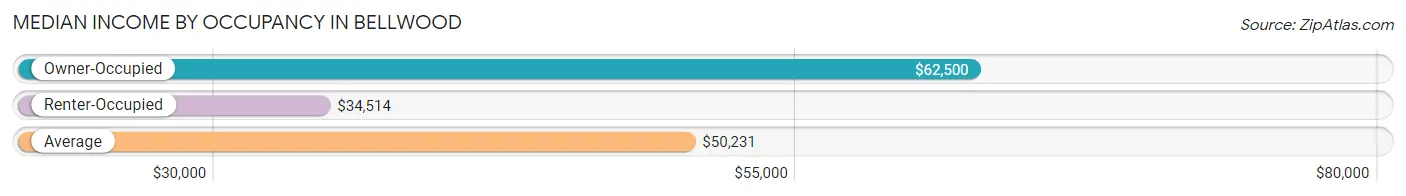
| Occupancy Type | # Households | Median Income |
| Owner-Occupied | 1,344 (44.5%) | $62,500 |
| Renter-Occupied | 1,675 (55.5%) | $34,514 |
| Average | 3,019 (100.0%) | $50,231 |
Occupancy by Householder Income Bracket in Bellwood
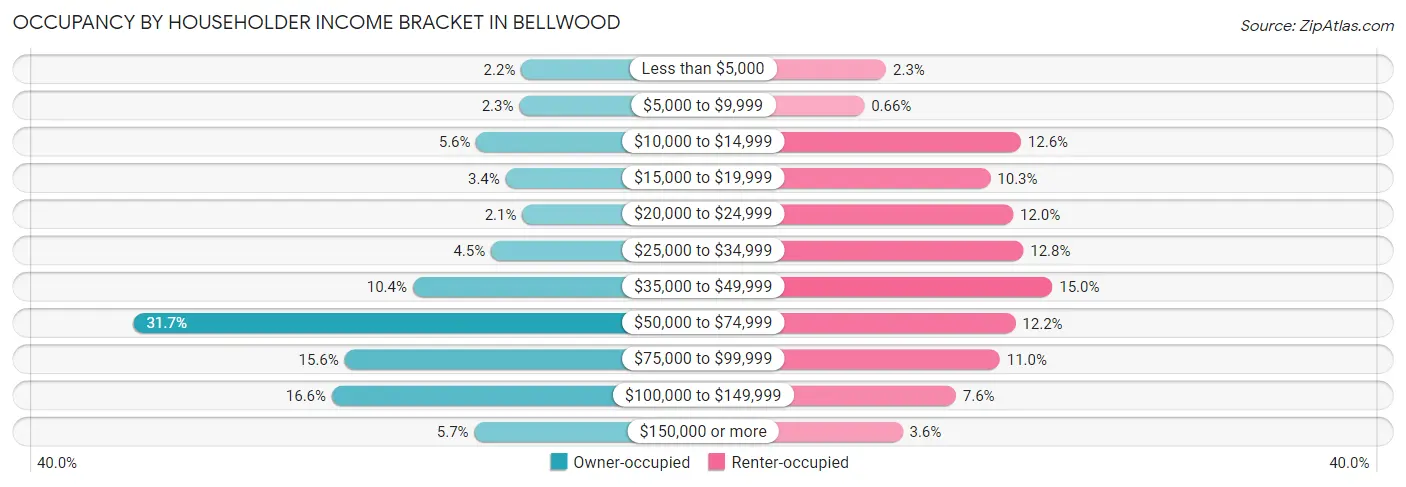
| Income Bracket | Owner-occupied | Renter-occupied |
| Less than $5,000 | 29 (2.2%) | 39 (2.3%) |
| $5,000 to $9,999 | 31 (2.3%) | 11 (0.7%) |
| $10,000 to $14,999 | 75 (5.6%) | 211 (12.6%) |
| $15,000 to $19,999 | 45 (3.4%) | 172 (10.3%) |
| $20,000 to $24,999 | 28 (2.1%) | 201 (12.0%) |
| $25,000 to $34,999 | 60 (4.5%) | 214 (12.8%) |
| $35,000 to $49,999 | 140 (10.4%) | 251 (15.0%) |
| $50,000 to $74,999 | 426 (31.7%) | 204 (12.2%) |
| $75,000 to $99,999 | 210 (15.6%) | 184 (11.0%) |
| $100,000 to $149,999 | 223 (16.6%) | 128 (7.6%) |
| $150,000 or more | 77 (5.7%) | 60 (3.6%) |
| Total | 1,344 (100.0%) | 1,675 (100.0%) |
Monthly Housing Cost Tiers in Bellwood
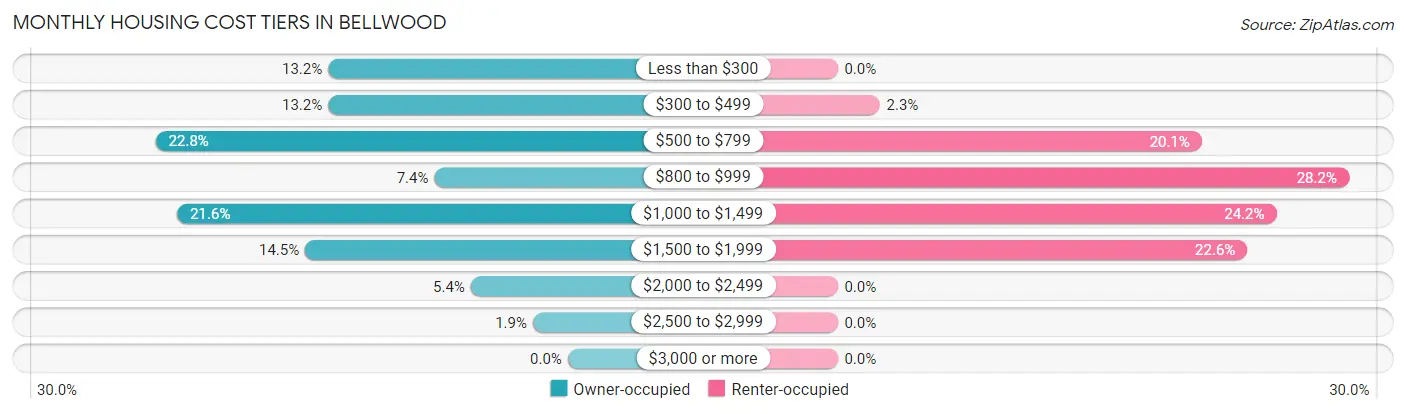
| Monthly Cost | Owner-occupied | Renter-occupied |
| Less than $300 | 178 (13.2%) | 0 (0.0%) |
| $300 to $499 | 178 (13.2%) | 39 (2.3%) |
| $500 to $799 | 306 (22.8%) | 337 (20.1%) |
| $800 to $999 | 99 (7.4%) | 473 (28.2%) |
| $1,000 to $1,499 | 290 (21.6%) | 406 (24.2%) |
| $1,500 to $1,999 | 195 (14.5%) | 379 (22.6%) |
| $2,000 to $2,499 | 72 (5.4%) | 0 (0.0%) |
| $2,500 to $2,999 | 26 (1.9%) | 0 (0.0%) |
| $3,000 or more | 0 (0.0%) | 0 (0.0%) |
| Total | 1,344 (100.0%) | 1,675 (100.0%) |
Physical Housing Characteristics in Bellwood
Housing Structures in Bellwood
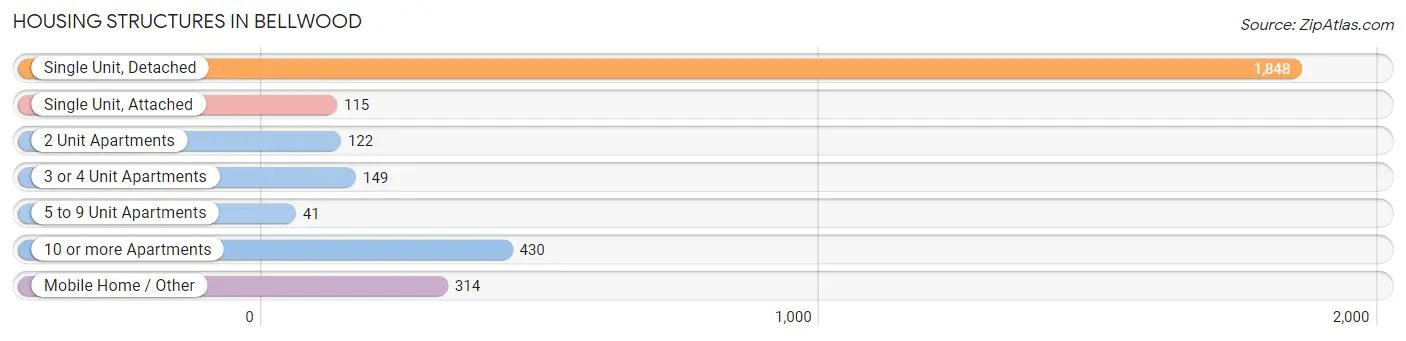
| Structure Type | # Housing Units | % Housing Units |
| Single Unit, Detached | 1,848 | 61.2% |
| Single Unit, Attached | 115 | 3.8% |
| 2 Unit Apartments | 122 | 4.0% |
| 3 or 4 Unit Apartments | 149 | 4.9% |
| 5 to 9 Unit Apartments | 41 | 1.4% |
| 10 or more Apartments | 430 | 14.2% |
| Mobile Home / Other | 314 | 10.4% |
| Total | 3,019 | 100.0% |
Housing Structures by Occupancy in Bellwood
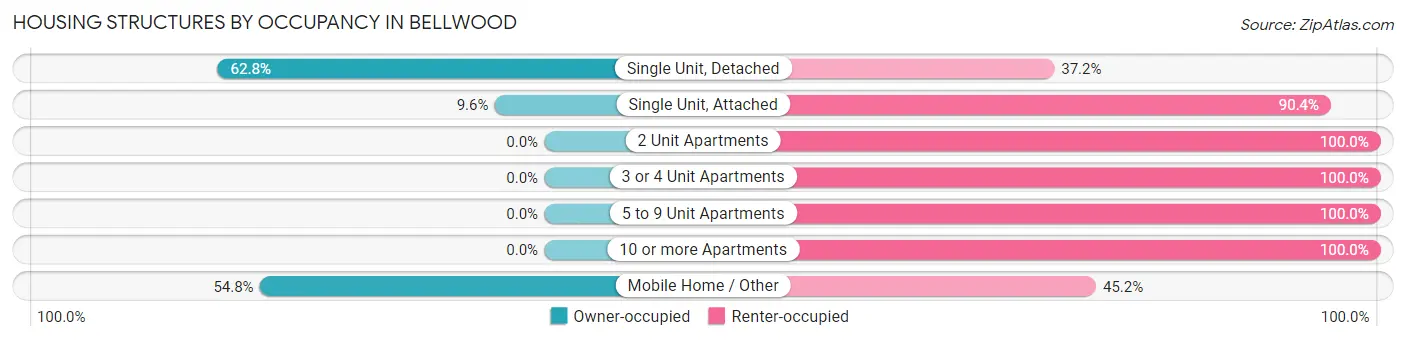
| Structure Type | Owner-occupied | Renter-occupied |
| Single Unit, Detached | 1,161 (62.8%) | 687 (37.2%) |
| Single Unit, Attached | 11 (9.6%) | 104 (90.4%) |
| 2 Unit Apartments | 0 (0.0%) | 122 (100.0%) |
| 3 or 4 Unit Apartments | 0 (0.0%) | 149 (100.0%) |
| 5 to 9 Unit Apartments | 0 (0.0%) | 41 (100.0%) |
| 10 or more Apartments | 0 (0.0%) | 430 (100.0%) |
| Mobile Home / Other | 172 (54.8%) | 142 (45.2%) |
| Total | 1,344 (44.5%) | 1,675 (55.5%) |
Housing Structures by Number of Rooms in Bellwood
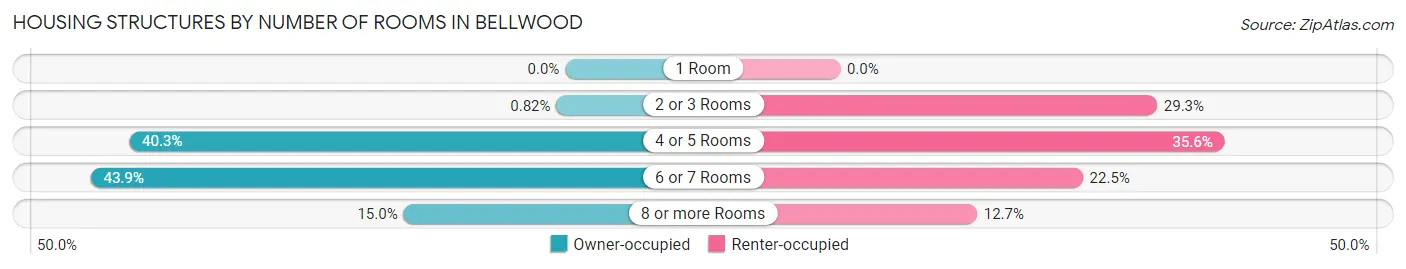
| Number of Rooms | Owner-occupied | Renter-occupied |
| 1 Room | 0 (0.0%) | 0 (0.0%) |
| 2 or 3 Rooms | 11 (0.8%) | 491 (29.3%) |
| 4 or 5 Rooms | 542 (40.3%) | 596 (35.6%) |
| 6 or 7 Rooms | 590 (43.9%) | 376 (22.5%) |
| 8 or more Rooms | 201 (15.0%) | 212 (12.7%) |
| Total | 1,344 (100.0%) | 1,675 (100.0%) |
Housing Structure by Heating Type in Bellwood
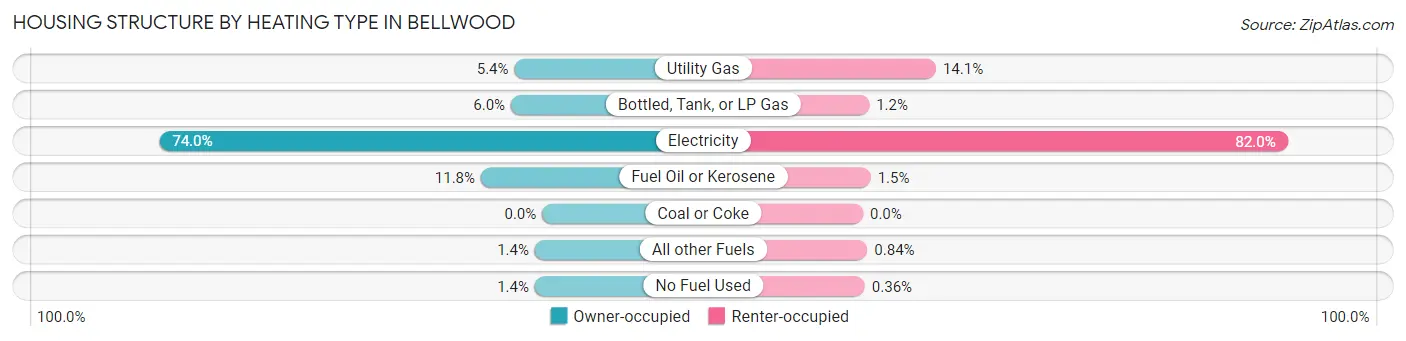
| Heating Type | Owner-occupied | Renter-occupied |
| Utility Gas | 72 (5.4%) | 236 (14.1%) |
| Bottled, Tank, or LP Gas | 81 (6.0%) | 20 (1.2%) |
| Electricity | 994 (74.0%) | 1,374 (82.0%) |
| Fuel Oil or Kerosene | 159 (11.8%) | 25 (1.5%) |
| Coal or Coke | 0 (0.0%) | 0 (0.0%) |
| All other Fuels | 19 (1.4%) | 14 (0.8%) |
| No Fuel Used | 19 (1.4%) | 6 (0.4%) |
| Total | 1,344 (100.0%) | 1,675 (100.0%) |
Household Vehicle Usage in Bellwood
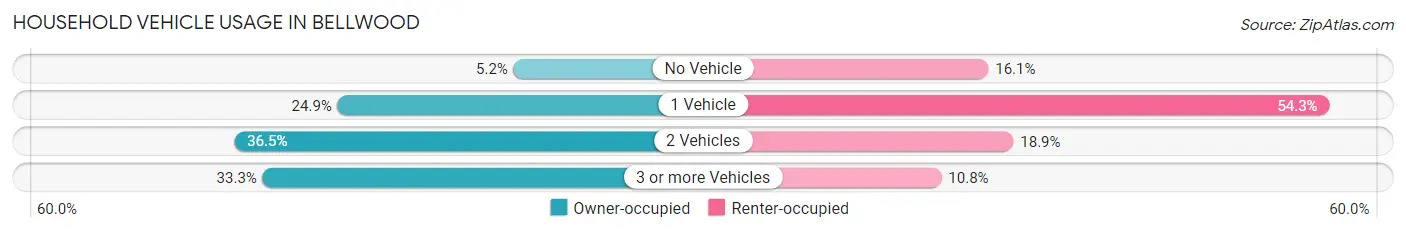
| Vehicles per Household | Owner-occupied | Renter-occupied |
| No Vehicle | 70 (5.2%) | 269 (16.1%) |
| 1 Vehicle | 335 (24.9%) | 909 (54.3%) |
| 2 Vehicles | 491 (36.5%) | 316 (18.9%) |
| 3 or more Vehicles | 448 (33.3%) | 181 (10.8%) |
| Total | 1,344 (100.0%) | 1,675 (100.0%) |
Real Estate & Mortgages in Bellwood
Real Estate and Mortgage Overview in Bellwood
| Characteristic | Without Mortgage | With Mortgage |
| Housing Units | 568 | 776 |
| Median Property Value | $204,800 | $178,500 |
| Median Household Income | $58,041 | $32 |
| Monthly Housing Costs | $389 | $0 |
| Real Estate Taxes | $1,281 | $100 |
Property Value by Mortgage Status in Bellwood
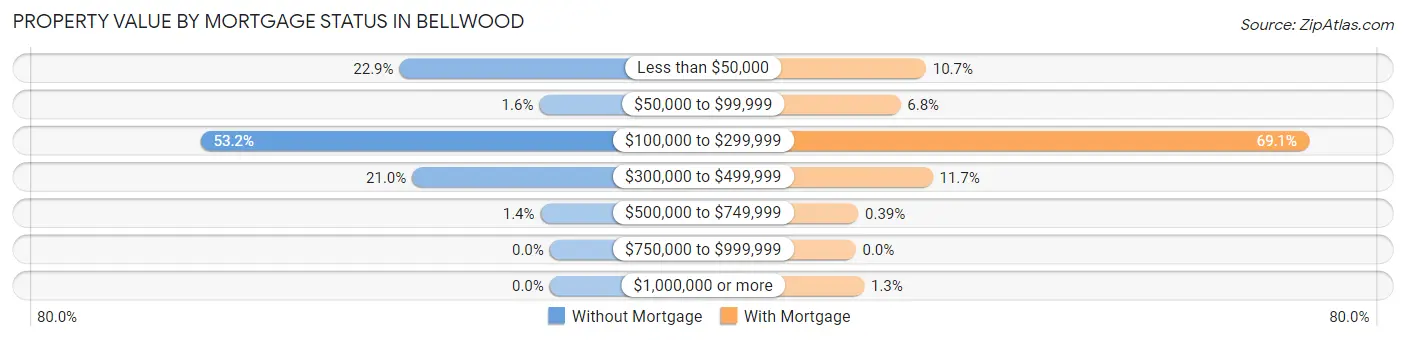
| Property Value | Without Mortgage | With Mortgage |
| Less than $50,000 | 130 (22.9%) | 83 (10.7%) |
| $50,000 to $99,999 | 9 (1.6%) | 53 (6.8%) |
| $100,000 to $299,999 | 302 (53.2%) | 536 (69.1%) |
| $300,000 to $499,999 | 119 (20.9%) | 91 (11.7%) |
| $500,000 to $749,999 | 8 (1.4%) | 3 (0.4%) |
| $750,000 to $999,999 | 0 (0.0%) | 0 (0.0%) |
| $1,000,000 or more | 0 (0.0%) | 10 (1.3%) |
| Total | 568 (100.0%) | 776 (100.0%) |
Household Income by Mortgage Status in Bellwood
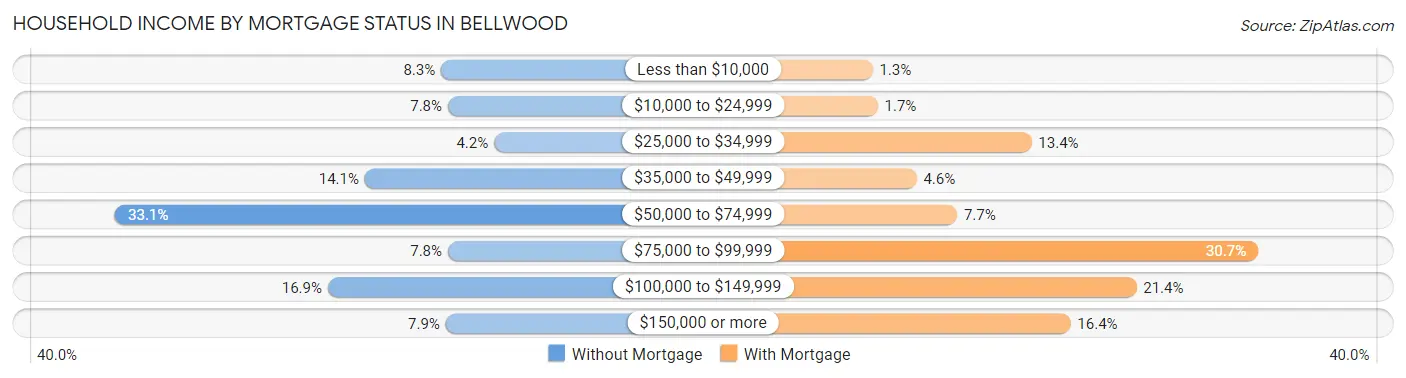
| Household Income | Without Mortgage | With Mortgage |
| Less than $10,000 | 47 (8.3%) | 10 (1.3%) |
| $10,000 to $24,999 | 44 (7.7%) | 13 (1.7%) |
| $25,000 to $34,999 | 24 (4.2%) | 104 (13.4%) |
| $35,000 to $49,999 | 80 (14.1%) | 36 (4.6%) |
| $50,000 to $74,999 | 188 (33.1%) | 60 (7.7%) |
| $75,000 to $99,999 | 44 (7.7%) | 238 (30.7%) |
| $100,000 to $149,999 | 96 (16.9%) | 166 (21.4%) |
| $150,000 or more | 45 (7.9%) | 127 (16.4%) |
| Total | 568 (100.0%) | 776 (100.0%) |
Property Value to Household Income Ratio in Bellwood
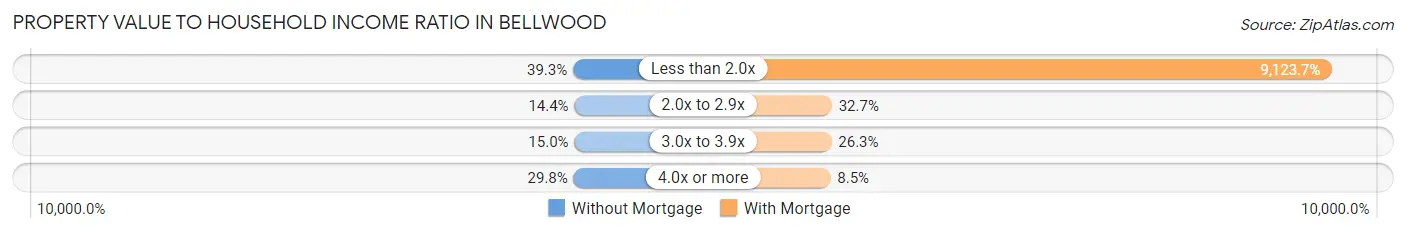
| Value-to-Income Ratio | Without Mortgage | With Mortgage |
| Less than 2.0x | 223 (39.3%) | 70,800 (9,123.7%) |
| 2.0x to 2.9x | 82 (14.4%) | 254 (32.7%) |
| 3.0x to 3.9x | 85 (15.0%) | 204 (26.3%) |
| 4.0x or more | 169 (29.7%) | 66 (8.5%) |
| Total | 568 (100.0%) | 776 (100.0%) |
Real Estate Taxes by Mortgage Status in Bellwood
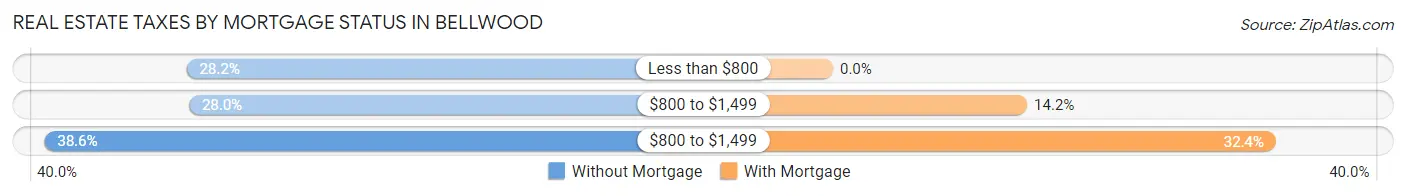
| Property Taxes | Without Mortgage | With Mortgage |
| Less than $800 | 160 (28.2%) | 0 (0.0%) |
| $800 to $1,499 | 159 (28.0%) | 110 (14.2%) |
| $800 to $1,499 | 219 (38.6%) | 251 (32.4%) |
| Total | 568 (100.0%) | 776 (100.0%) |
Health & Disability in Bellwood
Health Insurance Coverage by Age in Bellwood
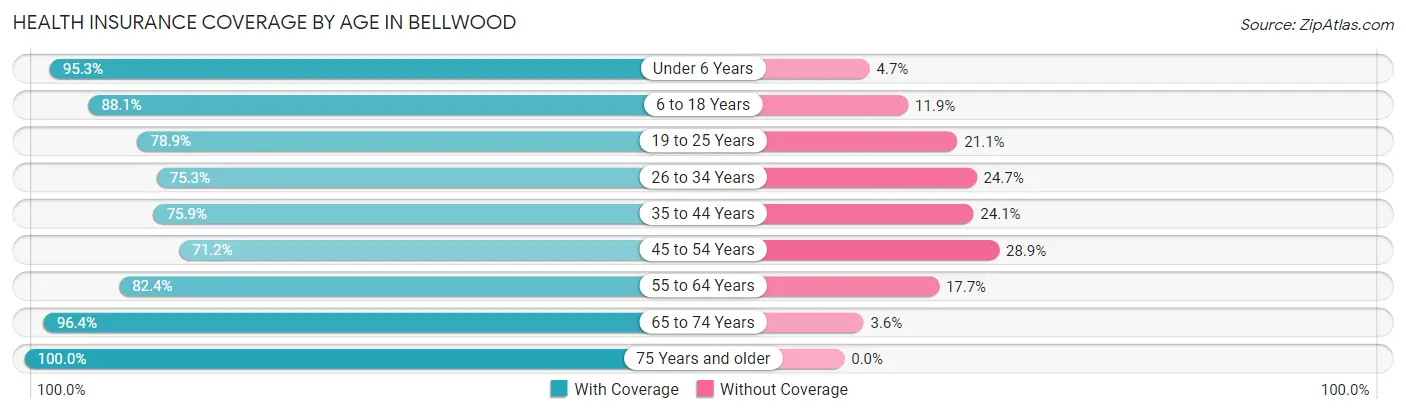
| Age Bracket | With Coverage | Without Coverage |
| Under 6 Years | 404 (95.3%) | 20 (4.7%) |
| 6 to 18 Years | 1,494 (88.1%) | 202 (11.9%) |
| 19 to 25 Years | 535 (78.9%) | 143 (21.1%) |
| 26 to 34 Years | 944 (75.3%) | 309 (24.7%) |
| 35 to 44 Years | 829 (75.9%) | 263 (24.1%) |
| 45 to 54 Years | 582 (71.2%) | 236 (28.8%) |
| 55 to 64 Years | 639 (82.4%) | 137 (17.6%) |
| 65 to 74 Years | 564 (96.4%) | 21 (3.6%) |
| 75 Years and older | 411 (100.0%) | 0 (0.0%) |
| Total | 6,402 (82.8%) | 1,331 (17.2%) |
Health Insurance Coverage by Citizenship Status in Bellwood
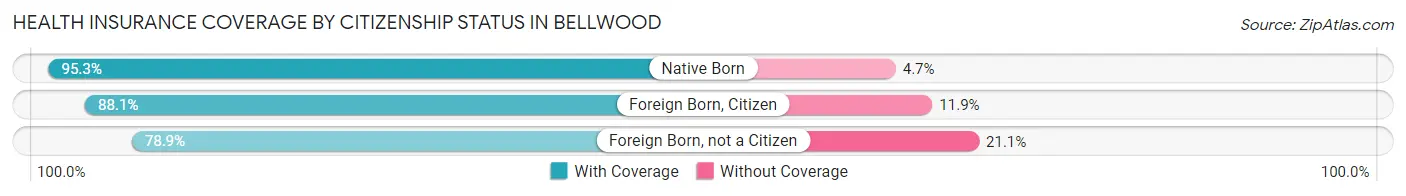
| Citizenship Status | With Coverage | Without Coverage |
| Native Born | 404 (95.3%) | 20 (4.7%) |
| Foreign Born, Citizen | 1,494 (88.1%) | 202 (11.9%) |
| Foreign Born, not a Citizen | 535 (78.9%) | 143 (21.1%) |
Health Insurance Coverage by Household Income in Bellwood
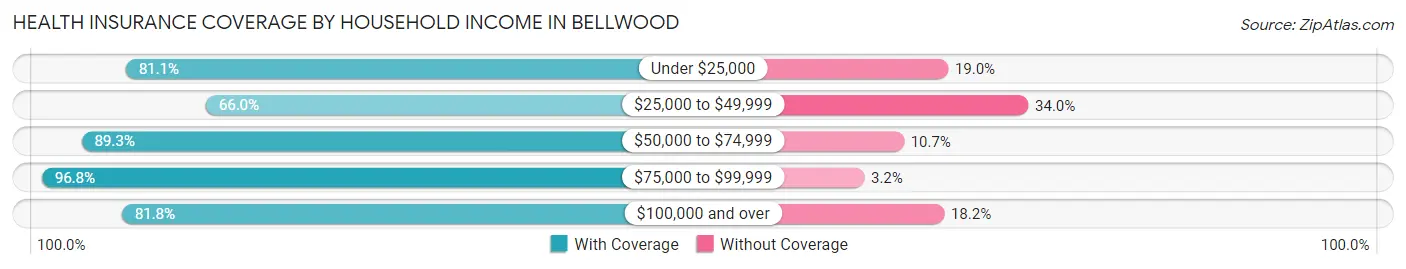
| Household Income | With Coverage | Without Coverage |
| Under $25,000 | 1,142 (81.0%) | 267 (19.0%) |
| $25,000 to $49,999 | 1,102 (66.0%) | 567 (34.0%) |
| $50,000 to $74,999 | 1,568 (89.3%) | 187 (10.7%) |
| $75,000 to $99,999 | 1,409 (96.8%) | 47 (3.2%) |
| $100,000 and over | 1,181 (81.8%) | 263 (18.2%) |
Public vs Private Health Insurance Coverage by Age in Bellwood
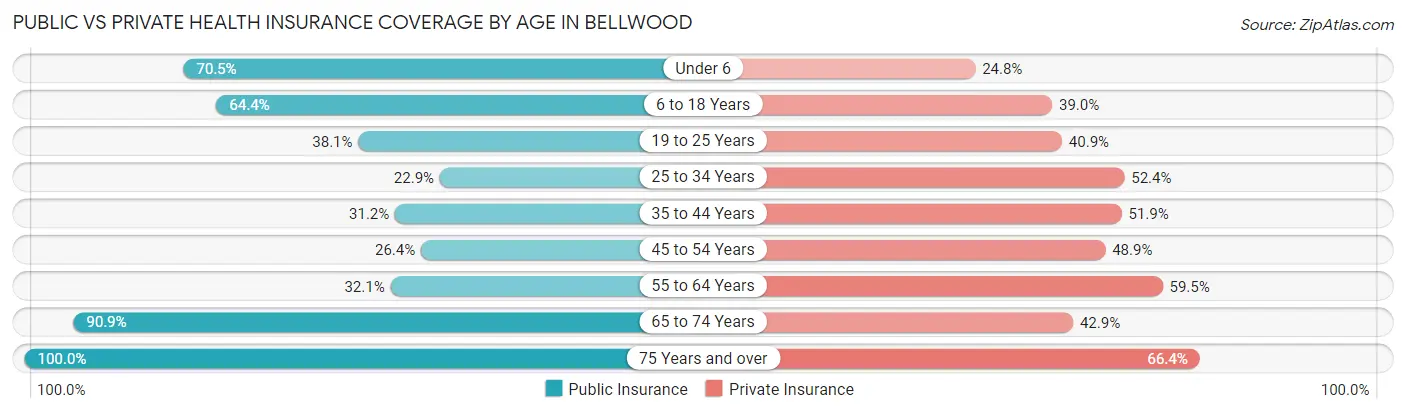
| Age Bracket | Public Insurance | Private Insurance |
| Under 6 | 299 (70.5%) | 105 (24.8%) |
| 6 to 18 Years | 1,092 (64.4%) | 662 (39.0%) |
| 19 to 25 Years | 258 (38.1%) | 277 (40.9%) |
| 25 to 34 Years | 287 (22.9%) | 657 (52.4%) |
| 35 to 44 Years | 341 (31.2%) | 567 (51.9%) |
| 45 to 54 Years | 216 (26.4%) | 400 (48.9%) |
| 55 to 64 Years | 249 (32.1%) | 462 (59.5%) |
| 65 to 74 Years | 532 (90.9%) | 251 (42.9%) |
| 75 Years and over | 411 (100.0%) | 273 (66.4%) |
| Total | 3,685 (47.6%) | 3,654 (47.2%) |
Disability Status by Sex by Age in Bellwood
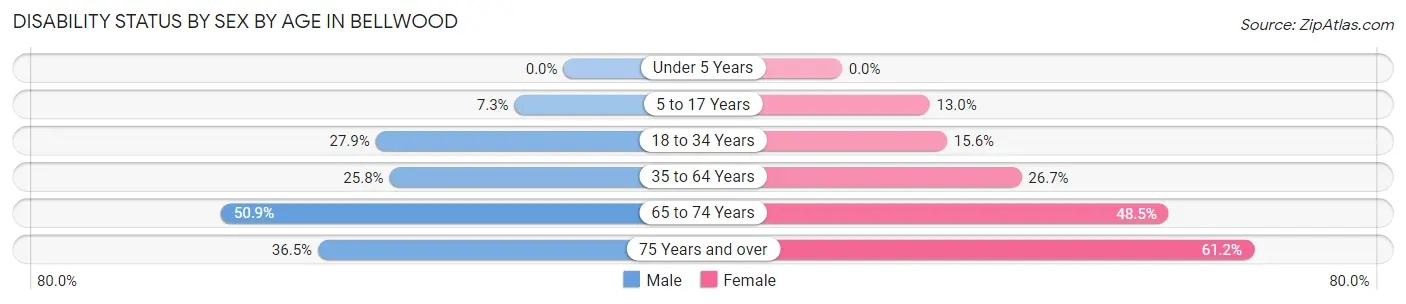
| Age Bracket | Male | Female |
| Under 5 Years | 0 (0.0%) | 0 (0.0%) |
| 5 to 17 Years | 49 (7.3%) | 98 (13.0%) |
| 18 to 34 Years | 340 (27.9%) | 163 (15.6%) |
| 35 to 64 Years | 319 (25.8%) | 387 (26.7%) |
| 65 to 74 Years | 90 (50.8%) | 198 (48.5%) |
| 75 Years and over | 39 (36.4%) | 186 (61.2%) |
Disability Class by Sex by Age in Bellwood
Disability Class: Hearing Difficulty
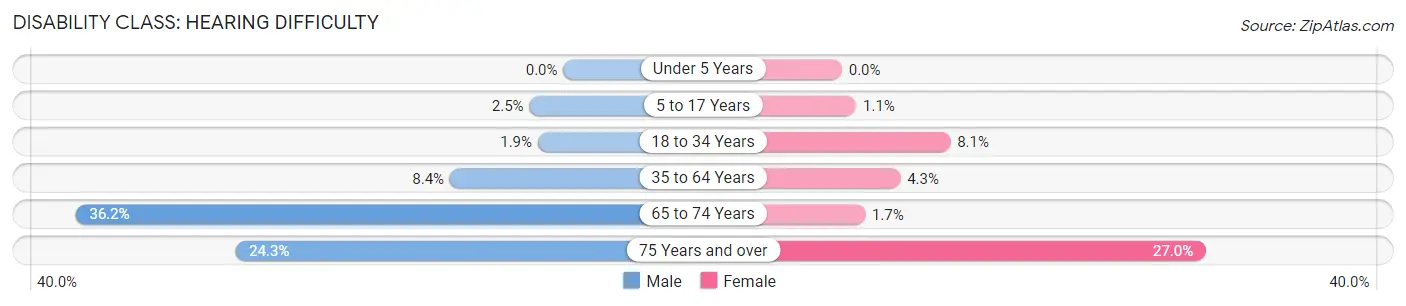
| Age Bracket | Male | Female |
| Under 5 Years | 0 (0.0%) | 0 (0.0%) |
| 5 to 17 Years | 17 (2.5%) | 8 (1.1%) |
| 18 to 34 Years | 23 (1.9%) | 84 (8.1%) |
| 35 to 64 Years | 104 (8.4%) | 63 (4.3%) |
| 65 to 74 Years | 64 (36.2%) | 7 (1.7%) |
| 75 Years and over | 26 (24.3%) | 82 (27.0%) |
Disability Class: Vision Difficulty
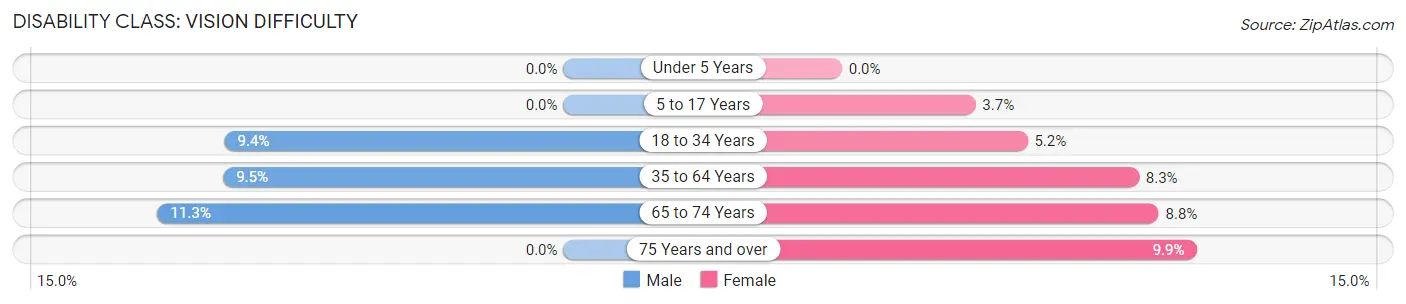
| Age Bracket | Male | Female |
| Under 5 Years | 0 (0.0%) | 0 (0.0%) |
| 5 to 17 Years | 0 (0.0%) | 28 (3.7%) |
| 18 to 34 Years | 115 (9.4%) | 54 (5.2%) |
| 35 to 64 Years | 117 (9.5%) | 120 (8.3%) |
| 65 to 74 Years | 20 (11.3%) | 36 (8.8%) |
| 75 Years and over | 0 (0.0%) | 30 (9.9%) |
Disability Class: Cognitive Difficulty
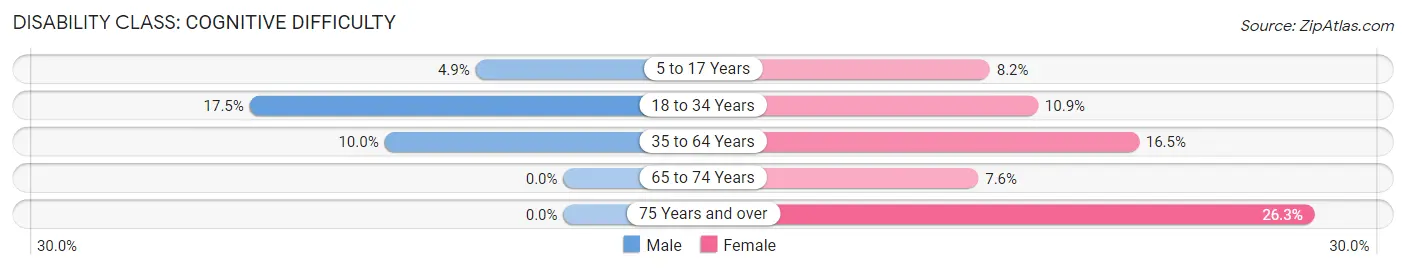
| Age Bracket | Male | Female |
| 5 to 17 Years | 33 (4.9%) | 62 (8.2%) |
| 18 to 34 Years | 213 (17.5%) | 114 (10.9%) |
| 35 to 64 Years | 123 (10.0%) | 240 (16.5%) |
| 65 to 74 Years | 0 (0.0%) | 31 (7.6%) |
| 75 Years and over | 0 (0.0%) | 80 (26.3%) |
Disability Class: Ambulatory Difficulty
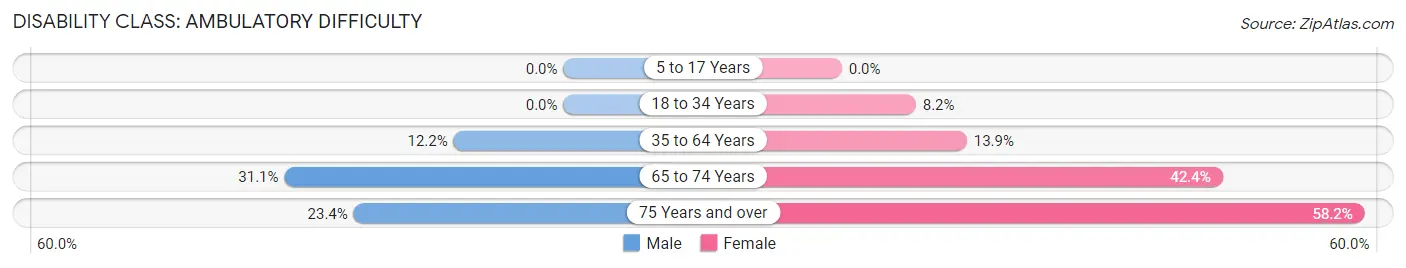
| Age Bracket | Male | Female |
| 5 to 17 Years | 0 (0.0%) | 0 (0.0%) |
| 18 to 34 Years | 0 (0.0%) | 86 (8.2%) |
| 35 to 64 Years | 151 (12.2%) | 202 (13.9%) |
| 65 to 74 Years | 55 (31.1%) | 173 (42.4%) |
| 75 Years and over | 25 (23.4%) | 177 (58.2%) |
Disability Class: Self-Care Difficulty
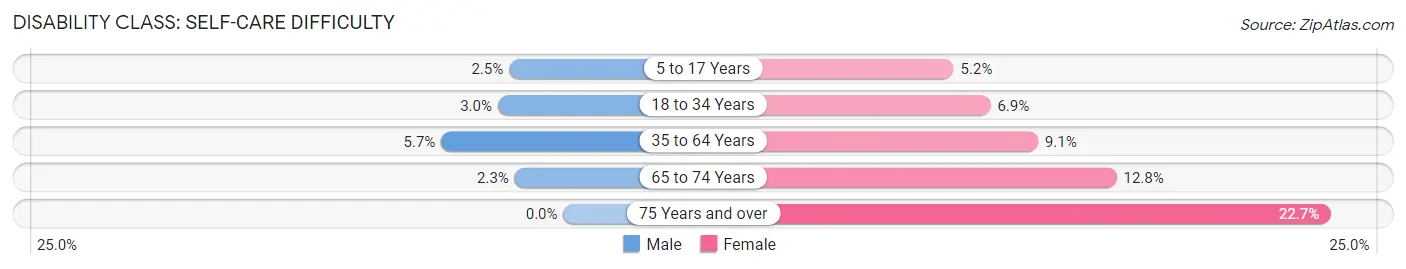
| Age Bracket | Male | Female |
| 5 to 17 Years | 17 (2.5%) | 39 (5.2%) |
| 18 to 34 Years | 37 (3.0%) | 72 (6.9%) |
| 35 to 64 Years | 70 (5.7%) | 132 (9.1%) |
| 65 to 74 Years | 4 (2.3%) | 52 (12.8%) |
| 75 Years and over | 0 (0.0%) | 69 (22.7%) |
Technology Access in Bellwood
Computing Device Access in Bellwood
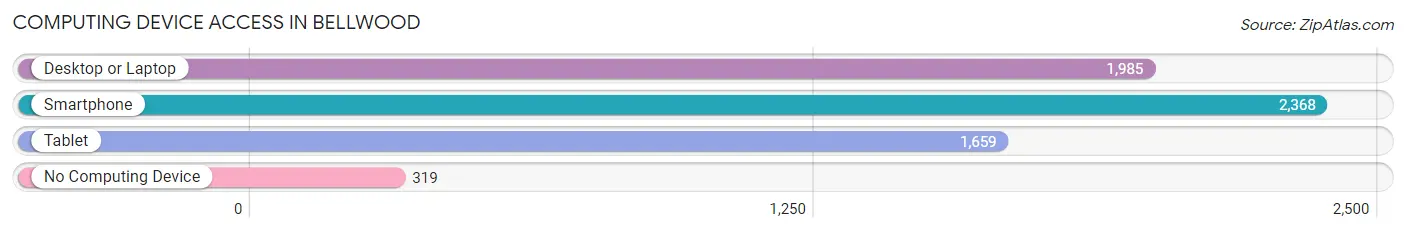
| Device Type | # Households | % Households |
| Desktop or Laptop | 1,985 | 65.7% |
| Smartphone | 2,368 | 78.4% |
| Tablet | 1,659 | 54.9% |
| No Computing Device | 319 | 10.6% |
| Total | 3,019 | 100.0% |
Internet Access in Bellwood
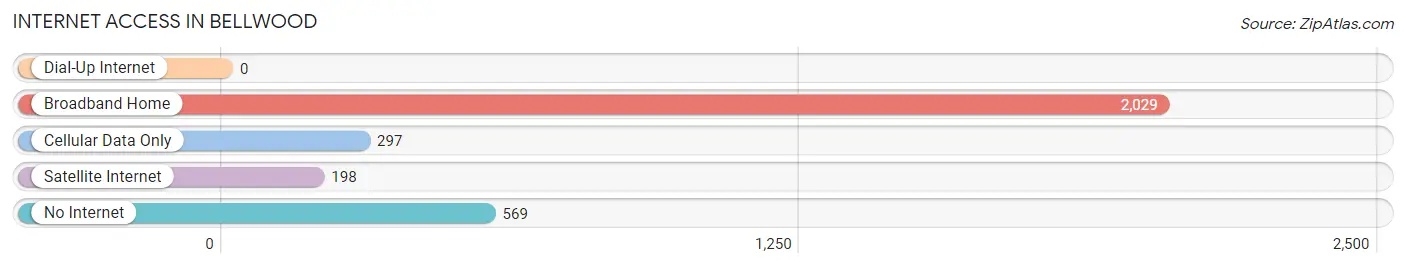
| Internet Type | # Households | % Households |
| Dial-Up Internet | 0 | 0.0% |
| Broadband Home | 2,029 | 67.2% |
| Cellular Data Only | 297 | 9.8% |
| Satellite Internet | 198 | 6.6% |
| No Internet | 569 | 18.9% |
| Total | 3,019 | 100.0% |
Bellwood Summary
Bellwood is a small town located in the state of Virginia in the United States. It is situated in the northern part of the state, in the Shenandoah Valley region. The town is located in Augusta County, and is part of the Staunton-Waynesboro Metropolitan Statistical Area. The population of Bellwood was estimated to be 1,845 in 2019.
History
Bellwood was founded in 1820 by William Bell, a Revolutionary War veteran. The town was originally known as Bell’s Crossroads, and was later renamed Bellwood in 1871. The town was incorporated in 1891.
Bellwood was a small farming community for much of its history. The town was home to a number of small businesses, including a general store, a blacksmith shop, and a grist mill. The town also had a post office, which opened in 1871.
In the early 20th century, Bellwood began to experience a period of growth. The town was connected to the railroad in 1906, and the first telephone service was established in 1908. The town also had a number of churches, including the Bellwood Methodist Church, which was founded in 1871.
Geography
Bellwood is located in the northern part of Virginia, in the Shenandoah Valley region. The town is situated in Augusta County, and is part of the Staunton-Waynesboro Metropolitan Statistical Area. The town is located at the intersection of US Route 11 and State Route 645.
The town is situated in a rural area, and is surrounded by rolling hills and farmland. The town is located near the Blue Ridge Mountains, and is approximately 30 miles from the city of Staunton.
Economy
Bellwood is a small, rural town, and the economy is largely based on agriculture. The town is home to a number of farms, and the surrounding area is known for its production of apples, peaches, and other fruits and vegetables.
The town is also home to a number of small businesses, including a general store, a hardware store, and a gas station. The town also has a number of restaurants, including a pizza shop and a diner.
Demographics
The population of Bellwood was estimated to be 1,845 in 2019. The town has a median age of 44.7, and the median household income is $45,945. The town is predominantly white, with 91.3% of the population identifying as white. The town also has a small Hispanic population, with 4.2% of the population identifying as Hispanic or Latino.
Conclusion
Bellwood is a small town located in the state of Virginia in the United States. The town was founded in 1820, and has a population of 1,845. The town is situated in a rural area, and the economy is largely based on agriculture. The town is predominantly white, with 91.3% of the population identifying as white. Bellwood is a small, rural town with a rich history and a bright future.
Common Questions
What is Per Capita Income in Bellwood?
Per Capita income in Bellwood is $23,085.
What is the Median Family Income in Bellwood?
Median Family Income in Bellwood is $56,960.
What is the Median Household income in Bellwood?
Median Household Income in Bellwood is $50,231.
What is Income or Wage Gap in Bellwood?
Income or Wage Gap in Bellwood is 7.8%.
Women in Bellwood earn 92.2 cents for every dollar earned by a man.
What is Inequality or Gini Index in Bellwood?
Inequality or Gini Index in Bellwood is 0.41.
What is the Total Population of Bellwood?
Total Population of Bellwood is 7,783.
What is the Total Male Population of Bellwood?
Total Male Population of Bellwood is 3,681.
What is the Total Female Population of Bellwood?
Total Female Population of Bellwood is 4,102.
What is the Ratio of Males per 100 Females in Bellwood?
There are 89.74 Males per 100 Females in Bellwood.
What is the Ratio of Females per 100 Males in Bellwood?
There are 111.44 Females per 100 Males in Bellwood.
What is the Median Population Age in Bellwood?
Median Population Age in Bellwood is 32.8 Years.
What is the Average Family Size in Bellwood
Average Family Size in Bellwood is 3.3 People.
What is the Average Household Size in Bellwood
Average Household Size in Bellwood is 2.6 People.
How Large is the Labor Force in Bellwood?
There are 4,015 People in the Labor Forcein in Bellwood.
What is the Percentage of People in the Labor Force in Bellwood?
65.5% of People are in the Labor Force in Bellwood.
What is the Unemployment Rate in Bellwood?
Unemployment Rate in Bellwood is 7.5%.