Midland, VA Map & Demographics
Midland Map
Midland Overview
$30,883
PER CAPITA INCOME
$119,479
AVG FAMILY INCOME
0.40
INEQUALITY / GINI INDEX
167
TOTAL POPULATION
122
MALE POPULATION
45
FEMALE POPULATION
271.11
MALES / 100 FEMALES
36.89
FEMALES / 100 MALES
52.1
MEDIAN AGE
4.3
AVG FAMILY SIZE
2.4
AVG HOUSEHOLD SIZE
117
LABOR FORCE [ PEOPLE ]
80.1%
PERCENT IN LABOR FORCE
Midland Zip Codes
Midland Area Codes
Income in Midland
Income Overview in Midland
| Characteristic | Number | Measure |
| Per Capita Income | 167 | $30,883 |
| Median Family Income | 29 | $119,479 |
| Mean Family Income | 29 | $120,683 |
| Median Household Income | 70 | $0 |
| Mean Household Income | 70 | $67,287 |
| Income Deficit | 29 | $0 |
| Wage / Income Gap (%) | 167 | 0.00% |
| Wage / Income Gap ($) | 167 | 100.00¢ per $1 |
| Gini / Inequality Index | 167 | 0.40 |
Earnings by Sex in Midland
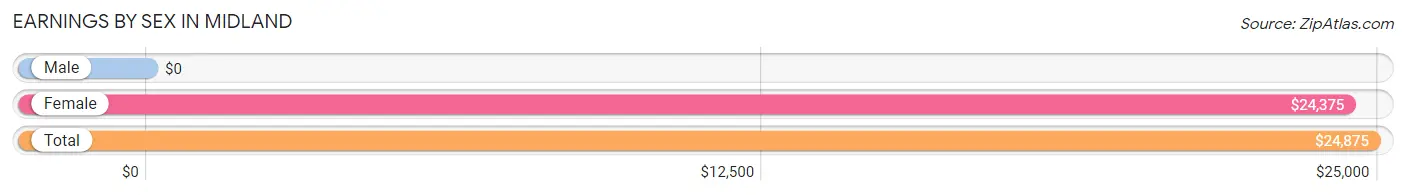
| Sex | Number | Average Earnings |
| Male | 72 (61.5%) | $0 |
| Female | 45 (38.5%) | $24,375 |
| Total | 117 (100.0%) | $24,875 |
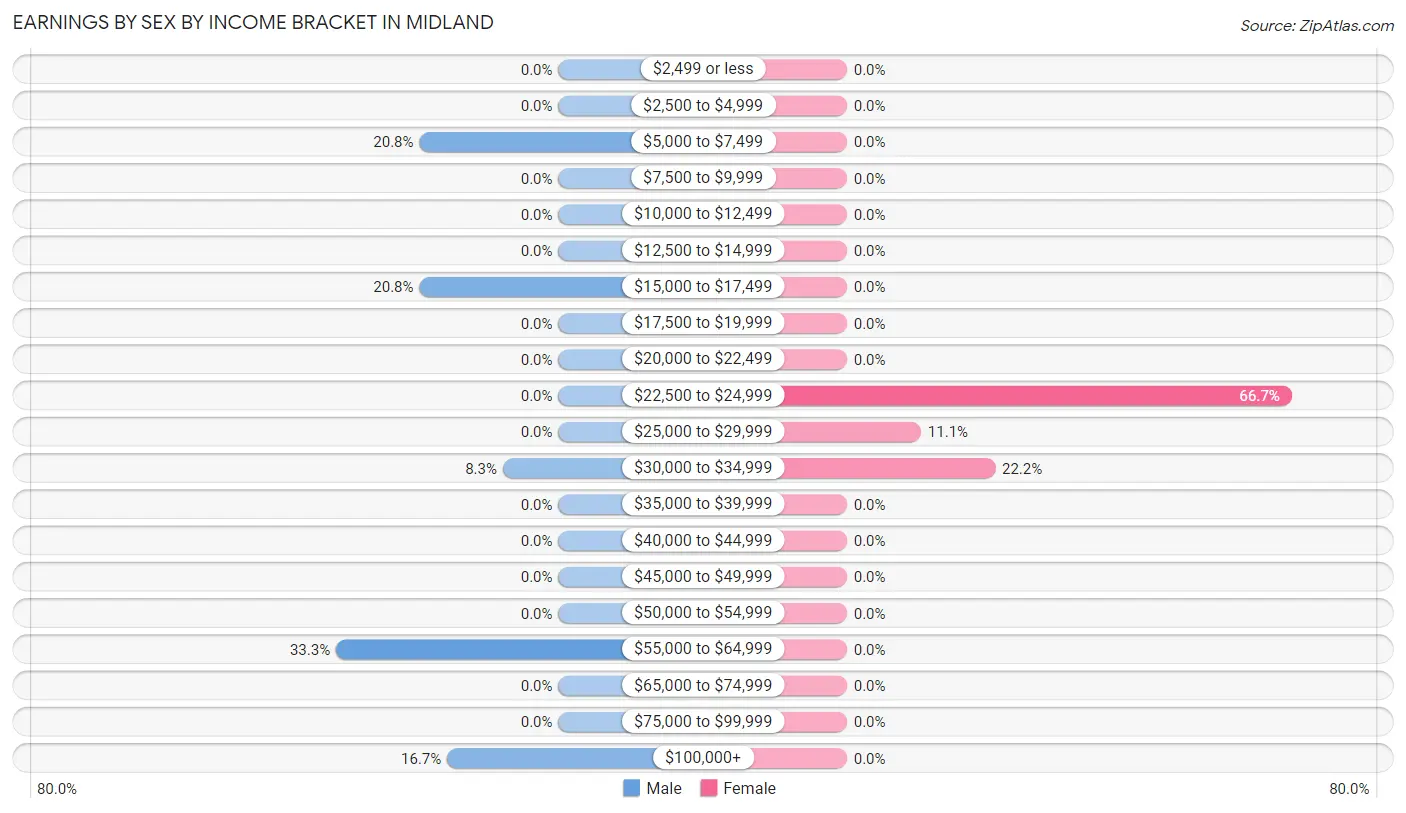
Earnings by Sex by Income Bracket in Midland
The most common earnings brackets in Midland are $55,000 to $64,999 for men (24 | 33.3%) and $22,500 to $24,999 for women (30 | 66.7%).
| Income | Male | Female |
| $2,499 or less | 0 (0.0%) | 0 (0.0%) |
| $2,500 to $4,999 | 0 (0.0%) | 0 (0.0%) |
| $5,000 to $7,499 | 15 (20.8%) | 0 (0.0%) |
| $7,500 to $9,999 | 0 (0.0%) | 0 (0.0%) |
| $10,000 to $12,499 | 0 (0.0%) | 0 (0.0%) |
| $12,500 to $14,999 | 0 (0.0%) | 0 (0.0%) |
| $15,000 to $17,499 | 15 (20.8%) | 0 (0.0%) |
| $17,500 to $19,999 | 0 (0.0%) | 0 (0.0%) |
| $20,000 to $22,499 | 0 (0.0%) | 0 (0.0%) |
| $22,500 to $24,999 | 0 (0.0%) | 30 (66.7%) |
| $25,000 to $29,999 | 0 (0.0%) | 5 (11.1%) |
| $30,000 to $34,999 | 6 (8.3%) | 10 (22.2%) |
| $35,000 to $39,999 | 0 (0.0%) | 0 (0.0%) |
| $40,000 to $44,999 | 0 (0.0%) | 0 (0.0%) |
| $45,000 to $49,999 | 0 (0.0%) | 0 (0.0%) |
| $50,000 to $54,999 | 0 (0.0%) | 0 (0.0%) |
| $55,000 to $64,999 | 24 (33.3%) | 0 (0.0%) |
| $65,000 to $74,999 | 0 (0.0%) | 0 (0.0%) |
| $75,000 to $99,999 | 0 (0.0%) | 0 (0.0%) |
| $100,000+ | 12 (16.7%) | 0 (0.0%) |
| Total | 72 (100.0%) | 45 (100.0%) |
Earnings by Sex by Educational Attainment in Midland
| Educational Attainment | Male Income | Female Income |
| Less than High School | - | - |
| High School Diploma | - | - |
| College or Associate's Degree | - | - |
| Bachelor's Degree | - | - |
| Graduate Degree | - | - |
| Total | $63,125 | $24,375 |
Family Income in Midland
Family Income Brackets in Midland
According to the Midland family income data, there are 24 families falling into the $100,000 to $149,999 income range, which is the most common income bracket and makes up 82.8% of all families.
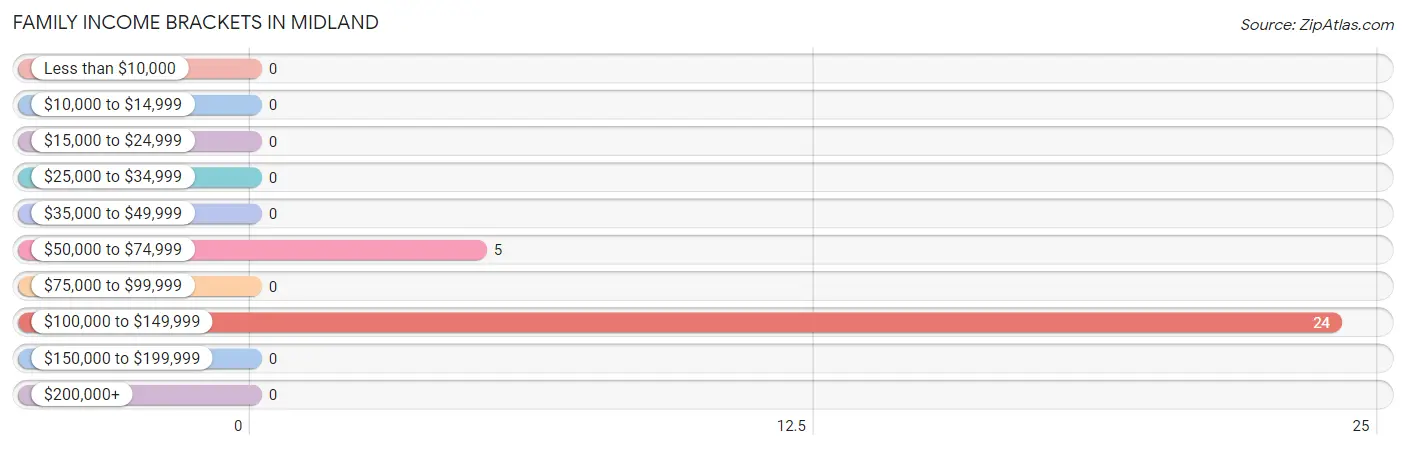
| Income Bracket | # Families | % Families |
| Less than $10,000 | 0 | 0.0% |
| $10,000 to $14,999 | 0 | 0.0% |
| $15,000 to $24,999 | 0 | 0.0% |
| $25,000 to $34,999 | 0 | 0.0% |
| $35,000 to $49,999 | 0 | 0.0% |
| $50,000 to $74,999 | 5 | 17.2% |
| $75,000 to $99,999 | 0 | 0.0% |
| $100,000 to $149,999 | 24 | 82.8% |
| $150,000 to $199,999 | 0 | 0.0% |
| $200,000+ | 0 | 0.0% |
Family Income by Famaliy Size in Midland
| Income Bracket | # Families | Median Income |
| 2-Person Families | 5 (17.2%) | $0 |
| 3-Person Families | 12 (41.4%) | $0 |
| 4-Person Families | 12 (41.4%) | $0 |
| 5-Person Families | 0 (0.0%) | $0 |
| 6-Person Families | 0 (0.0%) | $0 |
| 7+ Person Families | 0 (0.0%) | $0 |
| Total | 29 (100.0%) | $119,479 |
Family Income by Number of Earners in Midland
| Number of Earners | # Families | Median Income |
| No Earners | 0 (0.0%) | $0 |
| 1 Earner | 0 (0.0%) | $0 |
| 2 Earners | 17 (58.6%) | $0 |
| 3+ Earners | 12 (41.4%) | $0 |
| Total | 29 (100.0%) | $119,479 |
Household Income in Midland
Household Income Brackets in Midland
With 29 households falling in the category, the $15,000 to $24,999 income range is the most frequent in Midland, accounting for 41.4% of all households.
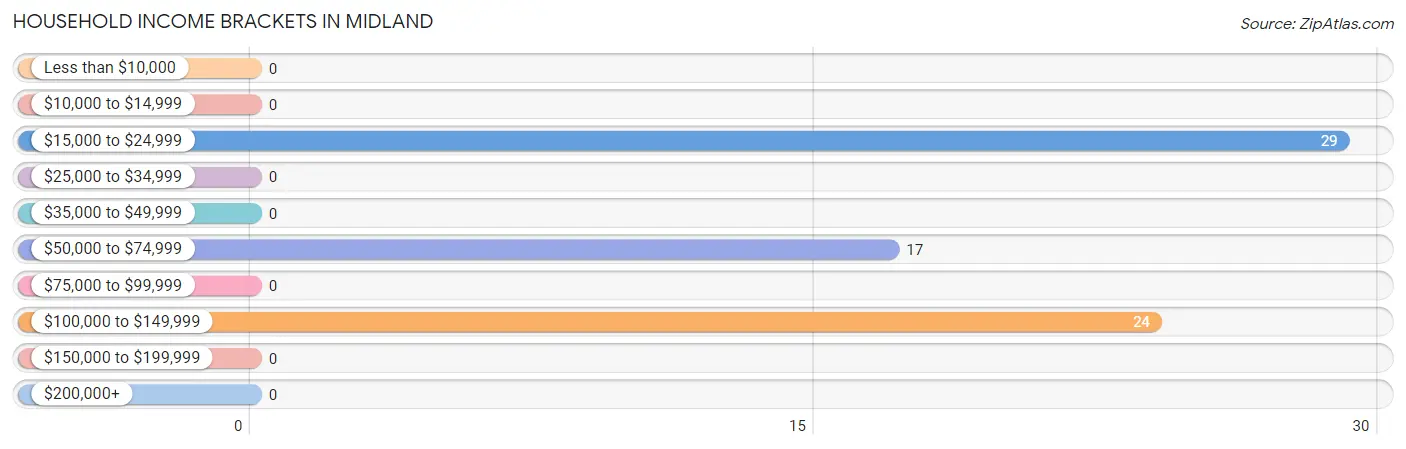
| Income Bracket | # Households | % Households |
| Less than $10,000 | 0 | 0.0% |
| $10,000 to $14,999 | 0 | 0.0% |
| $15,000 to $24,999 | 29 | 41.4% |
| $25,000 to $34,999 | 0 | 0.0% |
| $35,000 to $49,999 | 0 | 0.0% |
| $50,000 to $74,999 | 17 | 24.3% |
| $75,000 to $99,999 | 0 | 0.0% |
| $100,000 to $149,999 | 24 | 34.3% |
| $150,000 to $199,999 | 0 | 0.0% |
| $200,000+ | 0 | 0.0% |
Household Income by Householder Age in Midland
| Income Bracket | # Households | Median Income |
| 15 to 24 Years | 0 (0.0%) | $0 |
| 25 to 44 Years | 0 (0.0%) | $0 |
| 45 to 64 Years | 70 (100.0%) | $0 |
| 65+ Years | 0 (0.0%) | $0 |
| Total | 70 (100.0%) | $0 |
Poverty in Midland
Income Below Poverty by Sex and Age in Midland
| Age Bracket | Male | Female |
| Under 5 Years | 0 (0.0%) | 0 (0.0%) |
| 5 Years | 0 (0.0%) | 0 (0.0%) |
| 6 to 11 Years | 0 (0.0%) | 0 (0.0%) |
| 12 to 14 Years | 0 (0.0%) | 0 (0.0%) |
| 15 Years | 0 (0.0%) | 0 (0.0%) |
| 16 and 17 Years | 0 (0.0%) | 0 (0.0%) |
| 18 to 24 Years | 0 (0.0%) | 0 (0.0%) |
| 25 to 34 Years | 0 (0.0%) | 0 (0.0%) |
| 35 to 44 Years | 0 (0.0%) | 0 (0.0%) |
| 45 to 54 Years | 0 (0.0%) | 0 (0.0%) |
| 55 to 64 Years | 0 (0.0%) | 0 (0.0%) |
| 65 to 74 Years | 0 (0.0%) | 0 (0.0%) |
| 75 Years and over | 0 (0.0%) | 0 (0.0%) |
| Total | 0 (0.0%) | 0 (0.0%) |
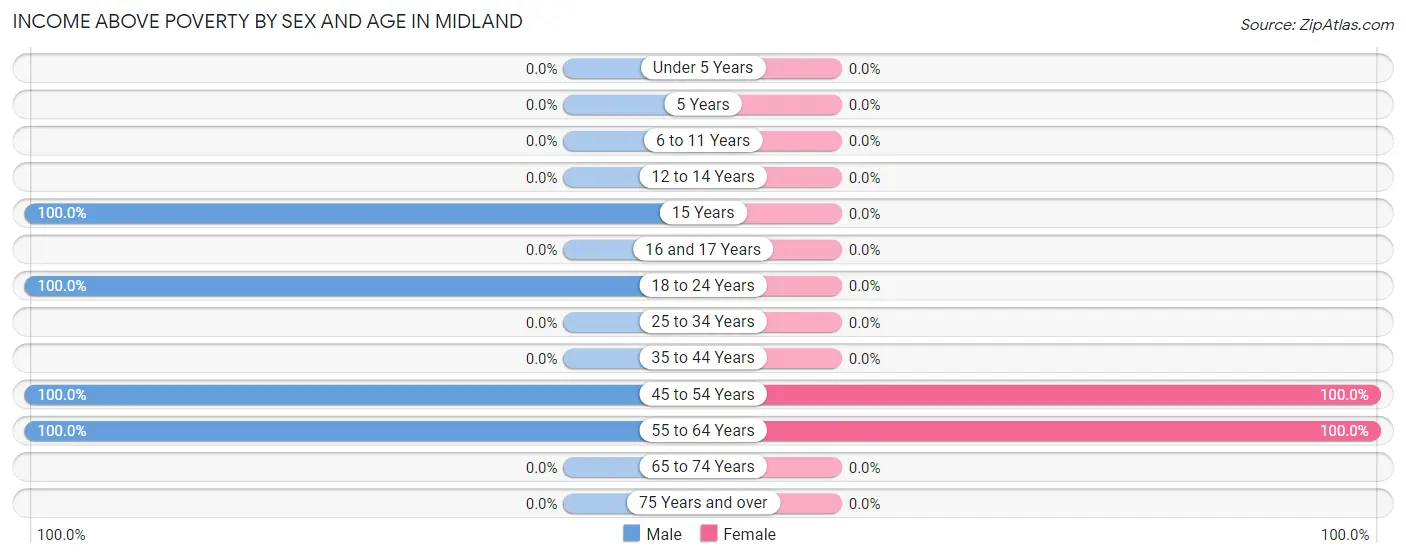
Income Above Poverty by Sex and Age in Midland
According to the poverty statistics in Midland, males aged 15 years and females aged 45 to 54 years are the age groups that are most secure financially, with 100.0% of males and 100.0% of females in these age groups living above the poverty line.
| Age Bracket | Male | Female |
| Under 5 Years | 0 (0.0%) | 0 (0.0%) |
| 5 Years | 0 (0.0%) | 0 (0.0%) |
| 6 to 11 Years | 0 (0.0%) | 0 (0.0%) |
| 12 to 14 Years | 0 (0.0%) | 0 (0.0%) |
| 15 Years | 21 (100.0%) | 0 (0.0%) |
| 16 and 17 Years | 0 (0.0%) | 0 (0.0%) |
| 18 to 24 Years | 30 (100.0%) | 0 (0.0%) |
| 25 to 34 Years | 0 (0.0%) | 0 (0.0%) |
| 35 to 44 Years | 0 (0.0%) | 0 (0.0%) |
| 45 to 54 Years | 29 (100.0%) | 30 (100.0%) |
| 55 to 64 Years | 42 (100.0%) | 15 (100.0%) |
| 65 to 74 Years | 0 (0.0%) | 0 (0.0%) |
| 75 Years and over | 0 (0.0%) | 0 (0.0%) |
| Total | 122 (100.0%) | 45 (100.0%) |
Income Below Poverty Among Married-Couple Families in Midland
| Children | Above Poverty | Below Poverty |
| No Children | 17 (100.0%) | 0 (0.0%) |
| 1 or 2 Children | 12 (100.0%) | 0 (0.0%) |
| 3 or 4 Children | 0 (0.0%) | 0 (0.0%) |
| 5 or more Children | 0 (0.0%) | 0 (0.0%) |
| Total | 29 (100.0%) | 0 (0.0%) |
Income Below Poverty Among Single-Parent Households in Midland
| Children | Single Father | Single Mother |
| No Children | 0 (0.0%) | 0 (0.0%) |
| 1 or 2 Children | 0 (0.0%) | 0 (0.0%) |
| 3 or 4 Children | 0 (0.0%) | 0 (0.0%) |
| 5 or more Children | 0 (0.0%) | 0 (0.0%) |
| Total | 0 (0.0%) | 0 (0.0%) |
Income Below Poverty Among Married-Couple vs Single-Parent Households in Midland
| Children | Married-Couple Families | Single-Parent Households |
| No Children | 0 (0.0%) | 0 (0.0%) |
| 1 or 2 Children | 0 (0.0%) | 0 (0.0%) |
| 3 or 4 Children | 0 (0.0%) | 0 (0.0%) |
| 5 or more Children | 0 (0.0%) | 0 (0.0%) |
| Total | 0 (0.0%) | 0 (0.0%) |
Race in Midland
The most populous races in Midland are White / Caucasian (167 | 100.0%), and Hispanic or Latino (63 | 37.7%).
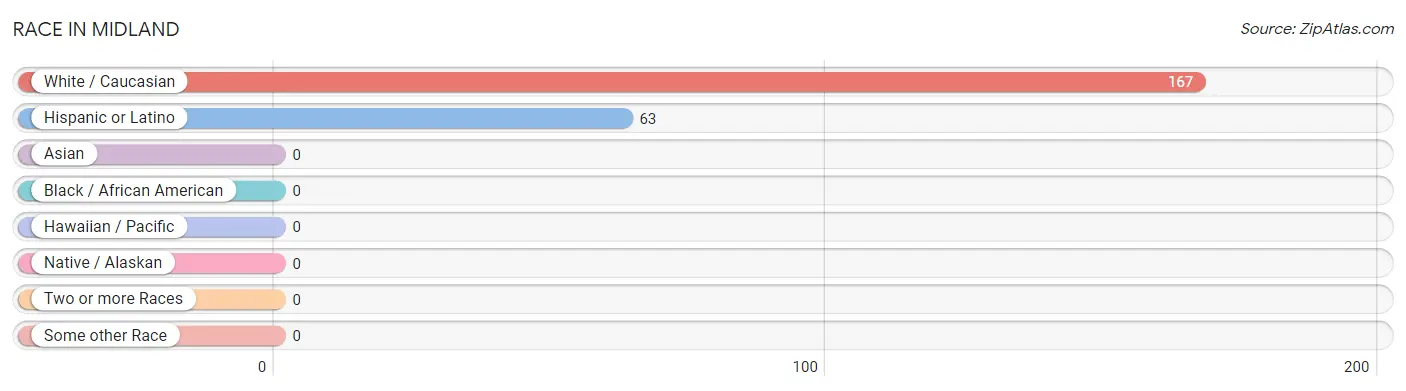
| Race | # Population | % Population |
| Asian | 0 | 0.0% |
| Black / African American | 0 | 0.0% |
| Hawaiian / Pacific | 0 | 0.0% |
| Hispanic or Latino | 63 | 37.7% |
| Native / Alaskan | 0 | 0.0% |
| White / Caucasian | 167 | 100.0% |
| Two or more Races | 0 | 0.0% |
| Some other Race | 0 | 0.0% |
| Total | 167 | 100.0% |
Ancestry in Midland
The most populous ancestries reported in Midland are Irish (35 | 21.0%), Central American (33 | 19.8%), Costa Rican (33 | 19.8%), Cuban (30 | 18.0%), and English (29 | 17.4%), together accounting for 95.8% of all Midland residents.
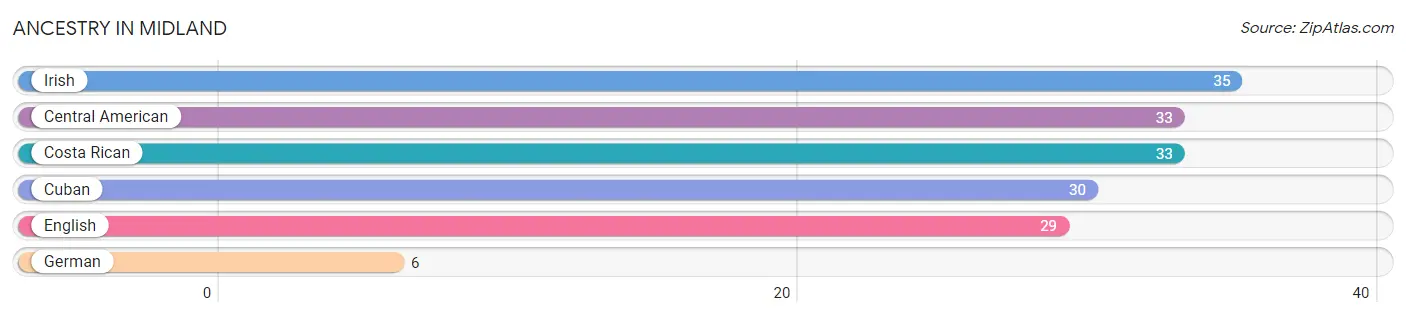
| Ancestry | # Population | % Population |
| Central American | 33 | 19.8% |
| Costa Rican | 33 | 19.8% |
| Cuban | 30 | 18.0% |
| English | 29 | 17.4% |
| German | 6 | 3.6% |
| Irish | 35 | 21.0% | View All 6 Rows |
Immigrants in Midland
The most numerous immigrant groups reported in Midland came from Central America (12 | 7.2%), Costa Rica (12 | 7.2%), and Latin America (12 | 7.2%), together accounting for 21.6% of all Midland residents.
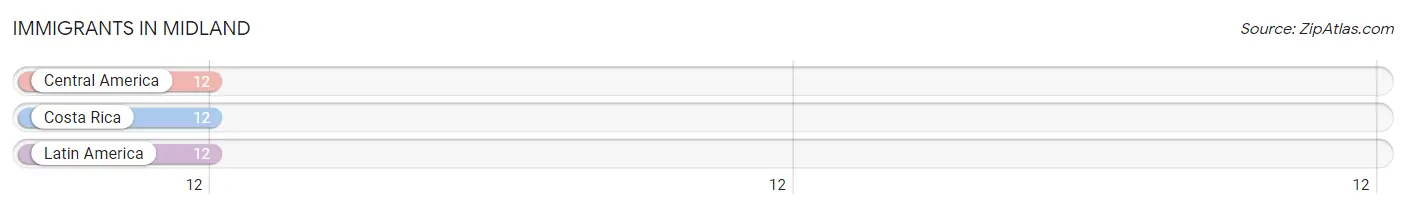
| Immigration Origin | # Population | % Population |
| Central America | 12 | 7.2% |
| Costa Rica | 12 | 7.2% |
| Latin America | 12 | 7.2% | View All 3 Rows |
Sex and Age in Midland
Sex and Age in Midland
The most populous age groups in Midland are 15 to 19 Years (36 | 29.5%) for men and 50 to 54 Years (30 | 66.7%) for women.
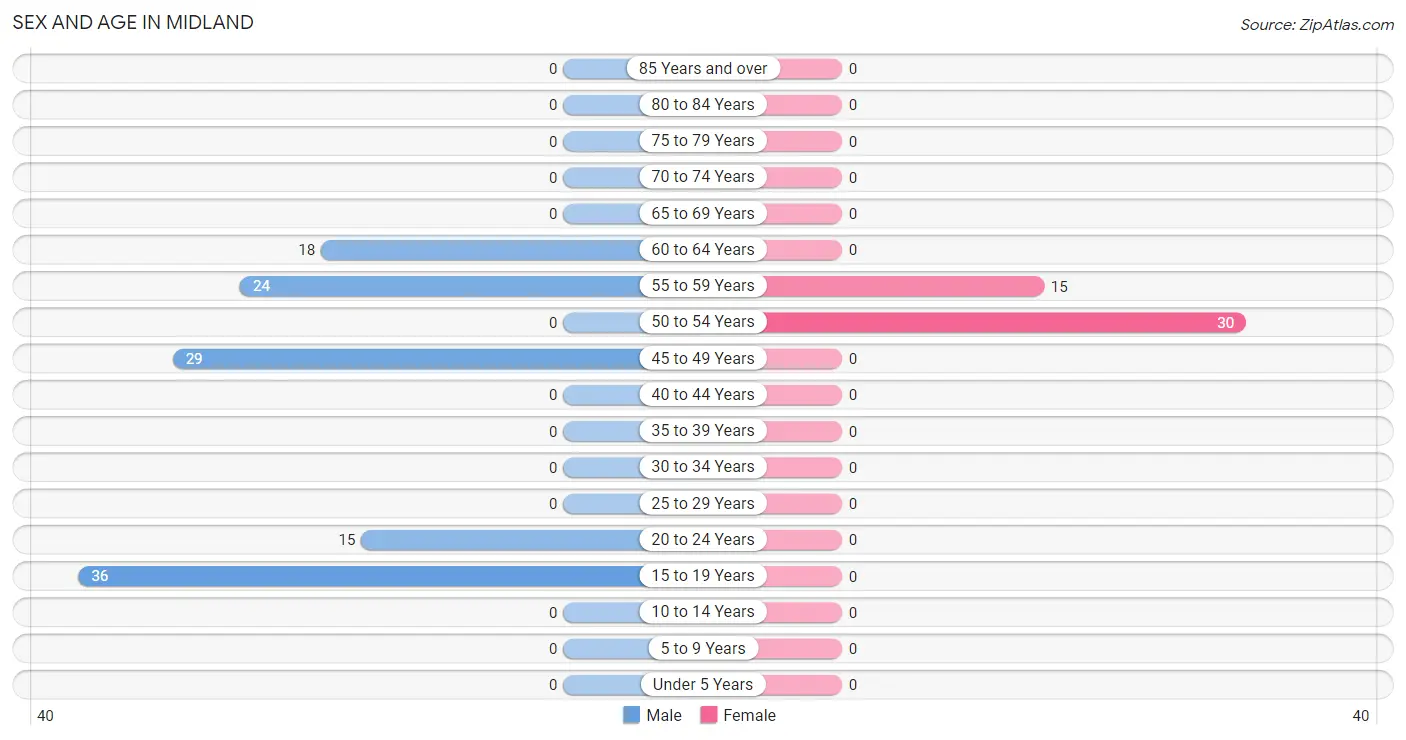
| Age Bracket | Male | Female |
| Under 5 Years | 0 (0.0%) | 0 (0.0%) |
| 5 to 9 Years | 0 (0.0%) | 0 (0.0%) |
| 10 to 14 Years | 0 (0.0%) | 0 (0.0%) |
| 15 to 19 Years | 36 (29.5%) | 0 (0.0%) |
| 20 to 24 Years | 15 (12.3%) | 0 (0.0%) |
| 25 to 29 Years | 0 (0.0%) | 0 (0.0%) |
| 30 to 34 Years | 0 (0.0%) | 0 (0.0%) |
| 35 to 39 Years | 0 (0.0%) | 0 (0.0%) |
| 40 to 44 Years | 0 (0.0%) | 0 (0.0%) |
| 45 to 49 Years | 29 (23.8%) | 0 (0.0%) |
| 50 to 54 Years | 0 (0.0%) | 30 (66.7%) |
| 55 to 59 Years | 24 (19.7%) | 15 (33.3%) |
| 60 to 64 Years | 18 (14.7%) | 0 (0.0%) |
| 65 to 69 Years | 0 (0.0%) | 0 (0.0%) |
| 70 to 74 Years | 0 (0.0%) | 0 (0.0%) |
| 75 to 79 Years | 0 (0.0%) | 0 (0.0%) |
| 80 to 84 Years | 0 (0.0%) | 0 (0.0%) |
| 85 Years and over | 0 (0.0%) | 0 (0.0%) |
| Total | 122 (100.0%) | 45 (100.0%) |
Families and Households in Midland
Median Family Size in Midland
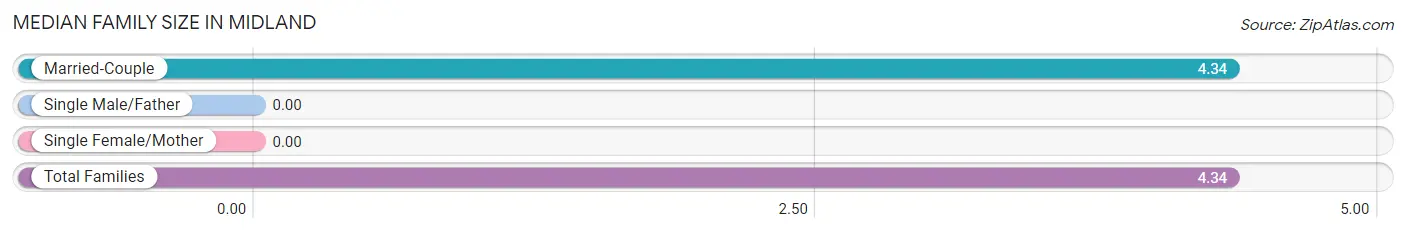
| Family Type | # Families | Family Size |
| Married-Couple | 29 (100.0%) | 4.34 |
| Single Male/Father | 0 (0.0%) | - |
| Single Female/Mother | 0 (0.0%) | - |
| Total Families | 29 (100.0%) | 4.34 |
Median Household Size in Midland
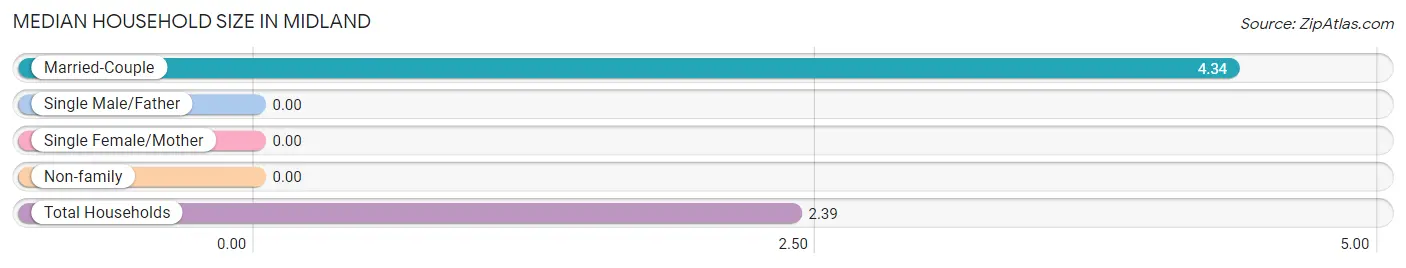
| Household Type | # Households | Household Size |
| Married-Couple | 29 (41.4%) | 4.34 |
| Single Male/Father | 0 (0.0%) | - |
| Single Female/Mother | 0 (0.0%) | - |
| Non-family | 41 (58.6%) | - |
| Total Households | 70 (100.0%) | 2.39 |
Household Size by Marriage Status in Midland
Out of a total of 70 households in Midland, 29 (41.4%) are family households, while 41 (58.6%) are nonfamily households. The most numerous type of family households are 3-person households, comprising 12, and the most common type of nonfamily households are 1-person households, comprising 41.
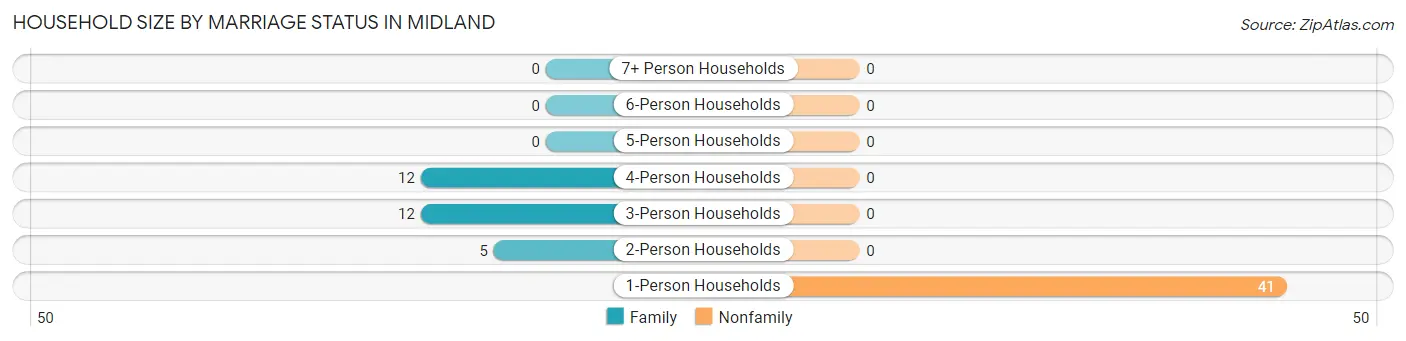
| Household Size | Family Households | Nonfamily Households |
| 1-Person Households | - | 41 (58.6%) |
| 2-Person Households | 5 (7.1%) | 0 (0.0%) |
| 3-Person Households | 12 (17.1%) | 0 (0.0%) |
| 4-Person Households | 12 (17.1%) | 0 (0.0%) |
| 5-Person Households | 0 (0.0%) | 0 (0.0%) |
| 6-Person Households | 0 (0.0%) | 0 (0.0%) |
| 7+ Person Households | 0 (0.0%) | 0 (0.0%) |
| Total | 29 (41.4%) | 41 (58.6%) |
Female Fertility in Midland
Fertility by Age in Midland
| Age Bracket | Women with Births | Births / 1,000 Women |
| 15 to 19 years | 0 (0.0%) | 0.0 |
| 20 to 34 years | 0 (0.0%) | 0.0 |
| 35 to 50 years | 0 (0.0%) | 0.0 |
| Total | 0 (0.0%) | 0.0 |
Fertility by Age by Marriage Status in Midland
| Age Bracket | Married | Unmarried |
| 15 to 19 years | 0 (0.0%) | 0 (0.0%) |
| 20 to 34 years | 0 (0.0%) | 0 (0.0%) |
| 35 to 50 years | 0 (0.0%) | 0 (0.0%) |
| Total | 0 (0.0%) | 0 (0.0%) |
Fertility by Education in Midland
| Educational Attainment | Women with Births | Births / 1,000 Women |
| Less than High School | 0 (0.0%) | 0.0 |
| High School Diploma | 0 (0.0%) | 0.0 |
| College or Associate's Degree | 0 (0.0%) | 0.0 |
| Bachelor's Degree | 0 (0.0%) | 0.0 |
| Graduate Degree | 0 (0.0%) | 0.0 |
| Total | 0 (0.0%) | 0.0 |
Fertility by Education by Marriage Status in Midland
| Educational Attainment | Married | Unmarried |
| Less than High School | 0 (0.0%) | 0 (0.0%) |
| High School Diploma | 0 (0.0%) | 0 (0.0%) |
| College or Associate's Degree | 0 (0.0%) | 0 (0.0%) |
| Bachelor's Degree | 0 (0.0%) | 0 (0.0%) |
| Graduate Degree | 0 (0.0%) | 0 (0.0%) |
| Total | 0 (0.0%) | 0 (0.0%) |
Employment Characteristics in Midland
Employment by Class of Employer in Midland
Among the 117 employed individuals in Midland, self-employed (incorporated) (53 | 45.3%), private company employees (52 | 44.4%), and local government employees (12 | 10.3%) make up the most common classes of employment.
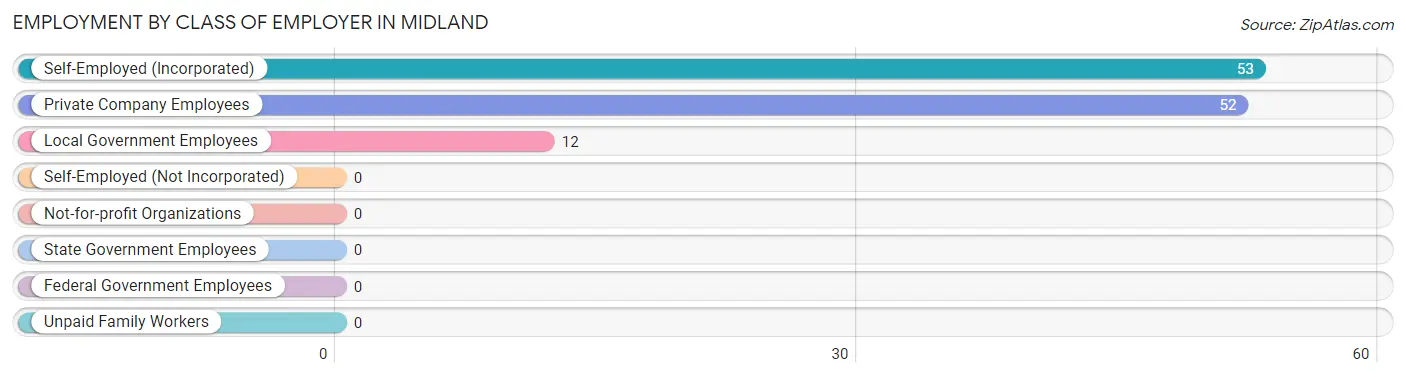
| Employer Class | # Employees | % Employees |
| Private Company Employees | 52 | 44.4% |
| Self-Employed (Incorporated) | 53 | 45.3% |
| Self-Employed (Not Incorporated) | 0 | 0.0% |
| Not-for-profit Organizations | 0 | 0.0% |
| Local Government Employees | 12 | 10.3% |
| State Government Employees | 0 | 0.0% |
| Federal Government Employees | 0 | 0.0% |
| Unpaid Family Workers | 0 | 0.0% |
| Total | 117 | 100.0% |
Employment Status by Age in Midland
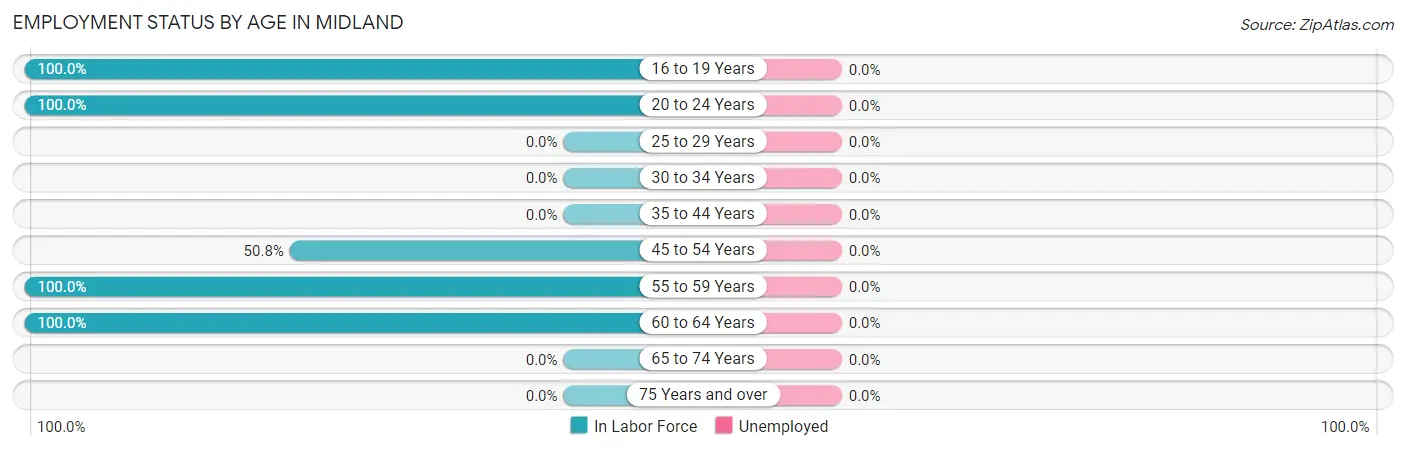
| Age Bracket | In Labor Force | Unemployed |
| 16 to 19 Years | 15 (100.0%) | 0 (0.0%) |
| 20 to 24 Years | 15 (100.0%) | 0 (0.0%) |
| 25 to 29 Years | 0 (0.0%) | 0 (0.0%) |
| 30 to 34 Years | 0 (0.0%) | 0 (0.0%) |
| 35 to 44 Years | 0 (0.0%) | 0 (0.0%) |
| 45 to 54 Years | 30 (50.8%) | 0 (0.0%) |
| 55 to 59 Years | 39 (100.0%) | 0 (0.0%) |
| 60 to 64 Years | 18 (100.0%) | 0 (0.0%) |
| 65 to 74 Years | 0 (0.0%) | 0 (0.0%) |
| 75 Years and over | 0 (0.0%) | 0 (0.0%) |
| Total | 117 (80.1%) | 0 (0.0%) |
Employment Status by Educational Attainment in Midland
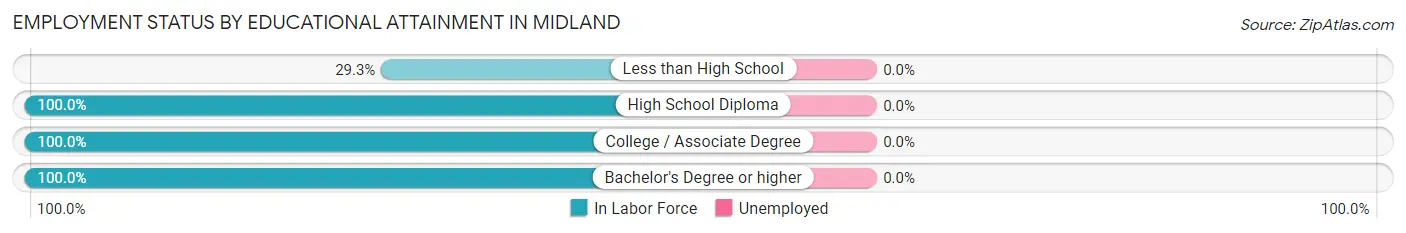
| Educational Attainment | In Labor Force | Unemployed |
| Less than High School | 12 (29.3%) | 0 (0.0%) |
| High School Diploma | 24 (100.0%) | 0 (0.0%) |
| College / Associate Degree | 21 (100.0%) | 0 (0.0%) |
| Bachelor's Degree or higher | 30 (100.0%) | 0 (0.0%) |
| Total | 87 (75.0%) | 0 (0.0%) |
Employment Occupations by Sex in Midland
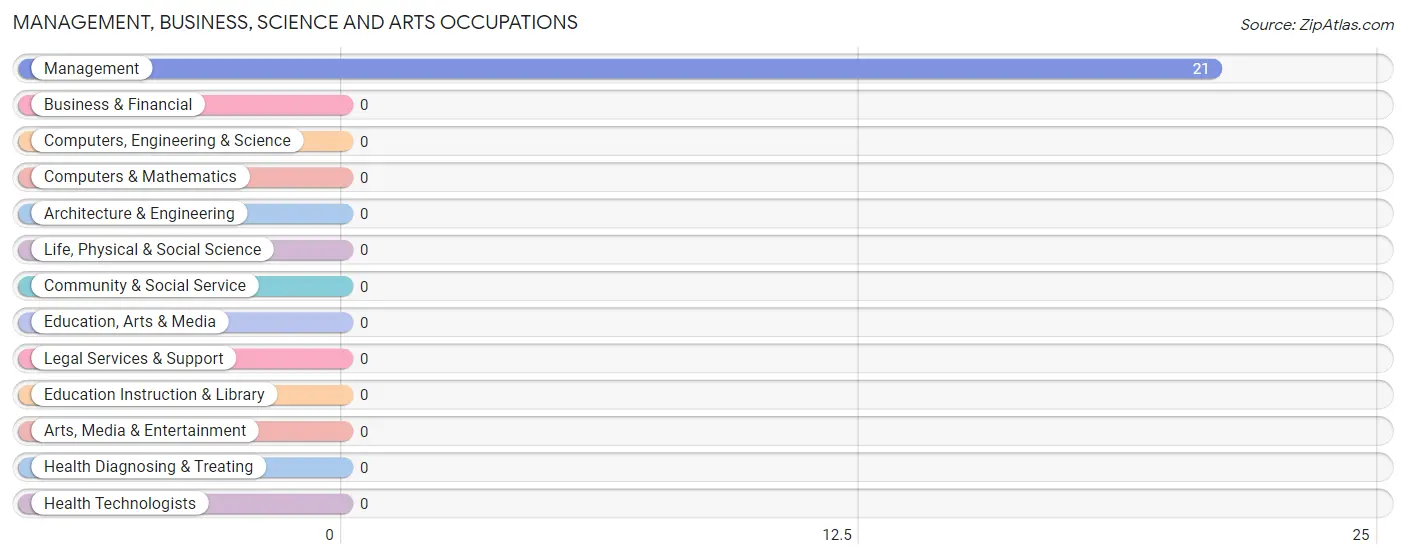
Management, Business, Science and Arts Occupations
The most common Management, Business, Science and Arts occupations in Midland are , and Management (21 | 17.9%).
Management, Business, Science and Arts Occupations by Sex
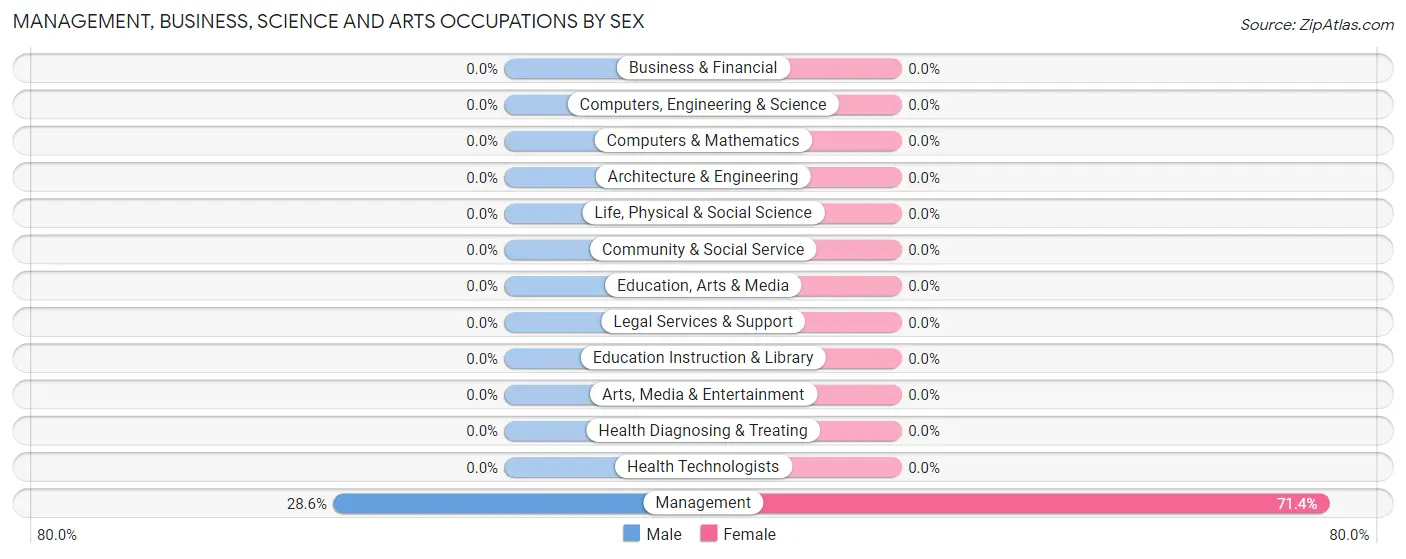
| Occupation | Male | Female |
| Management | 6 (28.6%) | 15 (71.4%) |
| Business & Financial | 0 (0.0%) | 0 (0.0%) |
| Computers, Engineering & Science | 0 (0.0%) | 0 (0.0%) |
| Computers & Mathematics | 0 (0.0%) | 0 (0.0%) |
| Architecture & Engineering | 0 (0.0%) | 0 (0.0%) |
| Life, Physical & Social Science | 0 (0.0%) | 0 (0.0%) |
| Community & Social Service | 0 (0.0%) | 0 (0.0%) |
| Education, Arts & Media | 0 (0.0%) | 0 (0.0%) |
| Legal Services & Support | 0 (0.0%) | 0 (0.0%) |
| Education Instruction & Library | 0 (0.0%) | 0 (0.0%) |
| Arts, Media & Entertainment | 0 (0.0%) | 0 (0.0%) |
| Health Diagnosing & Treating | 0 (0.0%) | 0 (0.0%) |
| Health Technologists | 0 (0.0%) | 0 (0.0%) |
| Total (Category) | 6 (28.6%) | 15 (71.4%) |
| Total (Overall) | 72 (61.5%) | 45 (38.5%) |
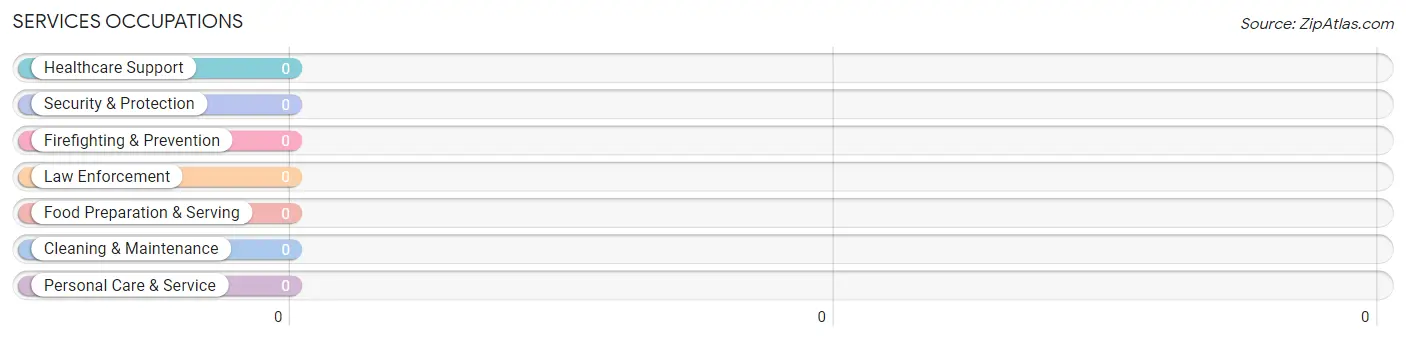
Services Occupations
Services Occupations by Sex
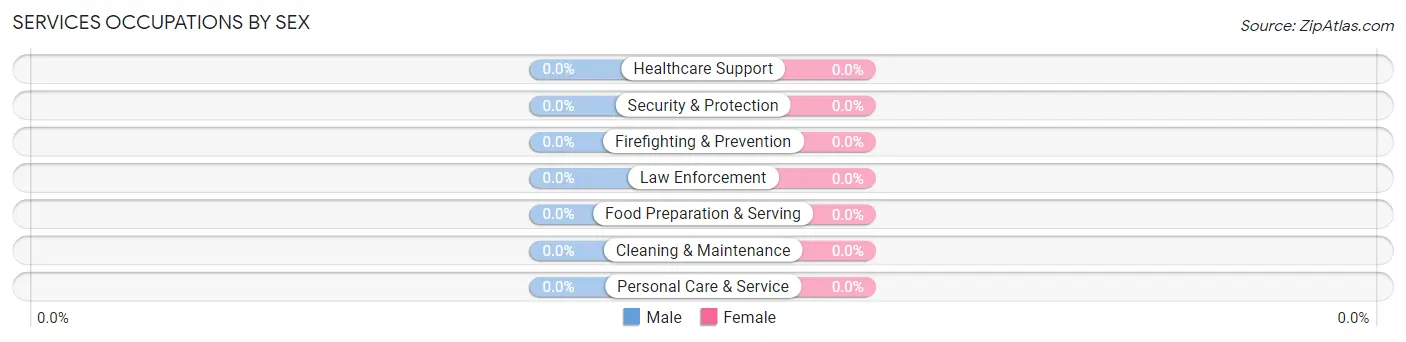
| Occupation | Male | Female |
| Healthcare Support | 0 (0.0%) | 0 (0.0%) |
| Security & Protection | 0 (0.0%) | 0 (0.0%) |
| Firefighting & Prevention | 0 (0.0%) | 0 (0.0%) |
| Law Enforcement | 0 (0.0%) | 0 (0.0%) |
| Food Preparation & Serving | 0 (0.0%) | 0 (0.0%) |
| Cleaning & Maintenance | 0 (0.0%) | 0 (0.0%) |
| Personal Care & Service | 0 (0.0%) | 0 (0.0%) |
| Total (Category) | 0 (0.0%) | 0 (0.0%) |
| Total (Overall) | 72 (61.5%) | 45 (38.5%) |
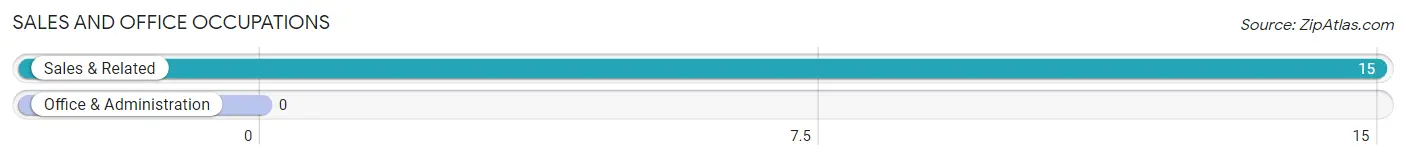
Sales and Office Occupations
The most common Sales and Office occupations in Midland are , and Sales & Related (15 | 12.8%).
Sales and Office Occupations by Sex

| Occupation | Male | Female |
| Sales & Related | 15 (100.0%) | 0 (0.0%) |
| Office & Administration | 0 (0.0%) | 0 (0.0%) |
| Total (Category) | 15 (100.0%) | 0 (0.0%) |
| Total (Overall) | 72 (61.5%) | 45 (38.5%) |
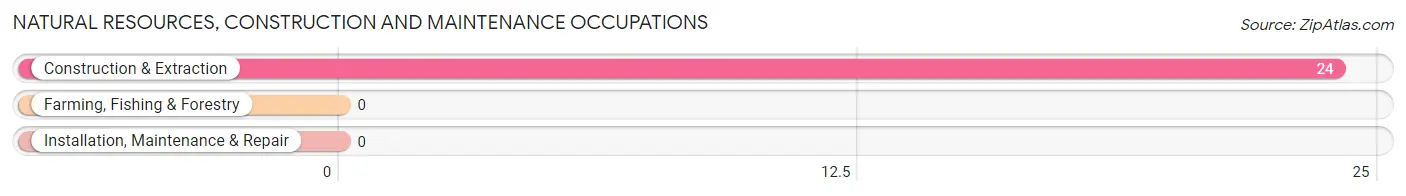
Natural Resources, Construction and Maintenance Occupations
The most common Natural Resources, Construction and Maintenance occupations in Midland are , and Construction & Extraction (24 | 20.5%).
Natural Resources, Construction and Maintenance Occupations by Sex
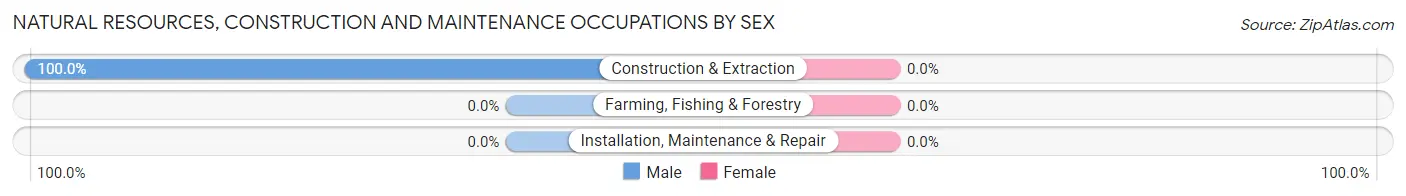
| Occupation | Male | Female |
| Farming, Fishing & Forestry | 0 (0.0%) | 0 (0.0%) |
| Construction & Extraction | 24 (100.0%) | 0 (0.0%) |
| Installation, Maintenance & Repair | 0 (0.0%) | 0 (0.0%) |
| Total (Category) | 24 (100.0%) | 0 (0.0%) |
| Total (Overall) | 72 (61.5%) | 45 (38.5%) |
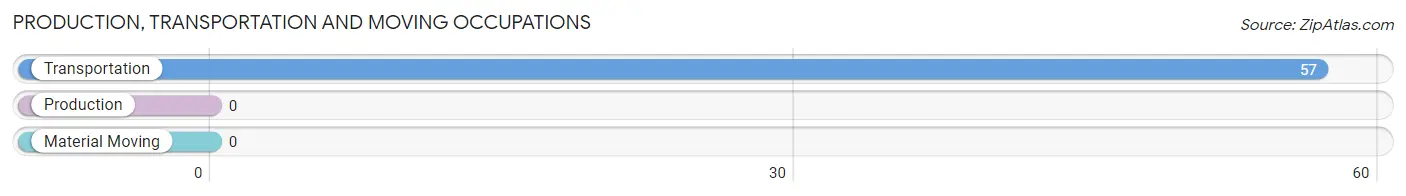
Production, Transportation and Moving Occupations
The most common Production, Transportation and Moving occupations in Midland are , and Transportation (57 | 48.7%).
Production, Transportation and Moving Occupations by Sex
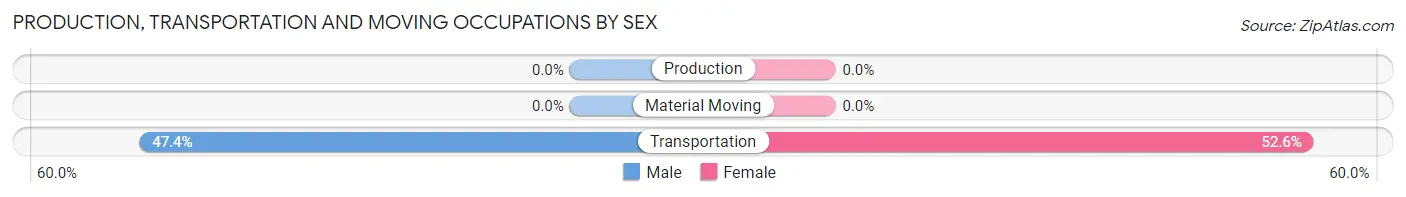
| Occupation | Male | Female |
| Production | 0 (0.0%) | 0 (0.0%) |
| Transportation | 27 (47.4%) | 30 (52.6%) |
| Material Moving | 0 (0.0%) | 0 (0.0%) |
| Total (Category) | 27 (47.4%) | 30 (52.6%) |
| Total (Overall) | 72 (61.5%) | 45 (38.5%) |
Employment Industries by Sex in Midland
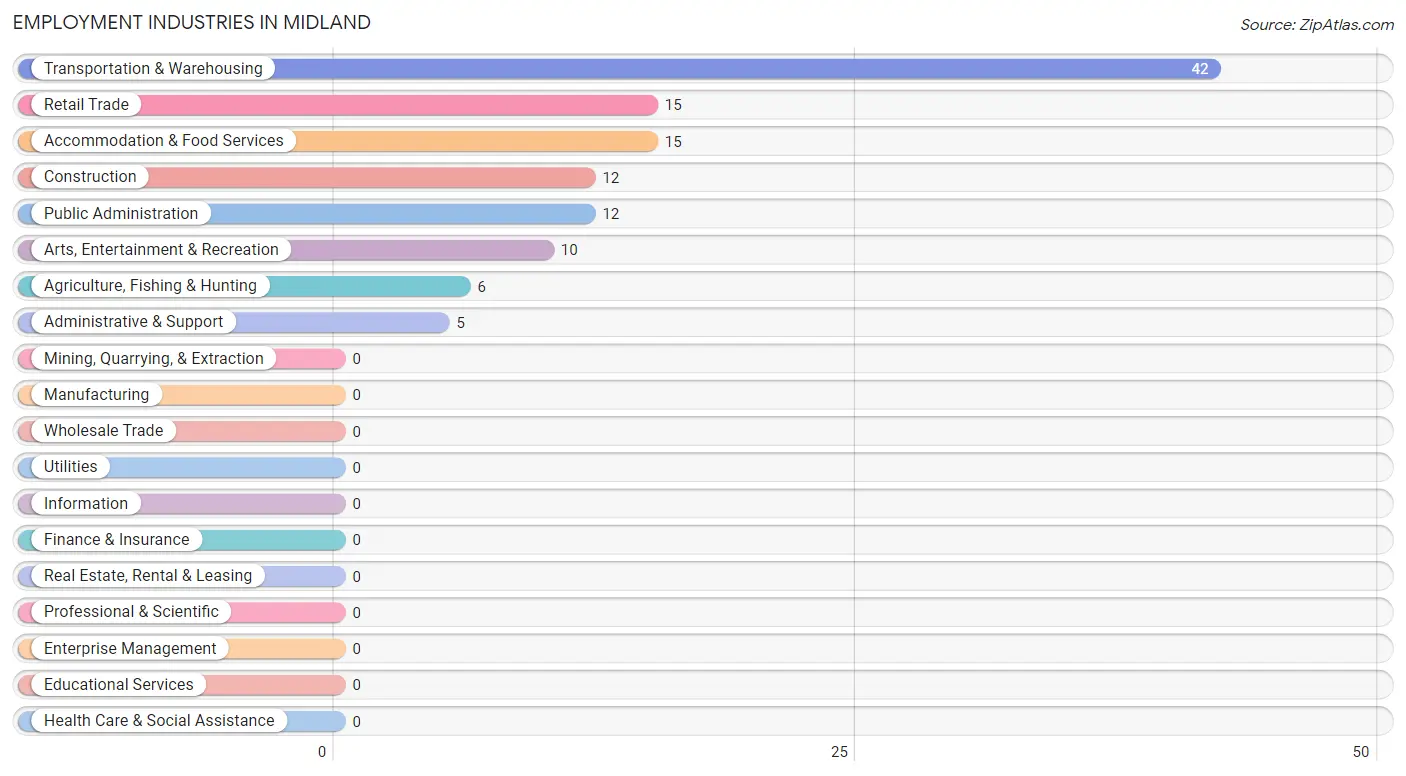
Employment Industries in Midland
The major employment industries in Midland include Transportation & Warehousing (42 | 35.9%), Retail Trade (15 | 12.8%), Accommodation & Food Services (15 | 12.8%), Construction (12 | 10.3%), and Public Administration (12 | 10.3%).
Employment Industries by Sex in Midland
The Midland industries that see more men than women are Agriculture, Fishing & Hunting (100.0%), Construction (100.0%), and Retail Trade (100.0%), whereas the industries that tend to have a higher number of women are Administrative & Support (100.0%), Arts, Entertainment & Recreation (100.0%), and Transportation & Warehousing (71.4%).
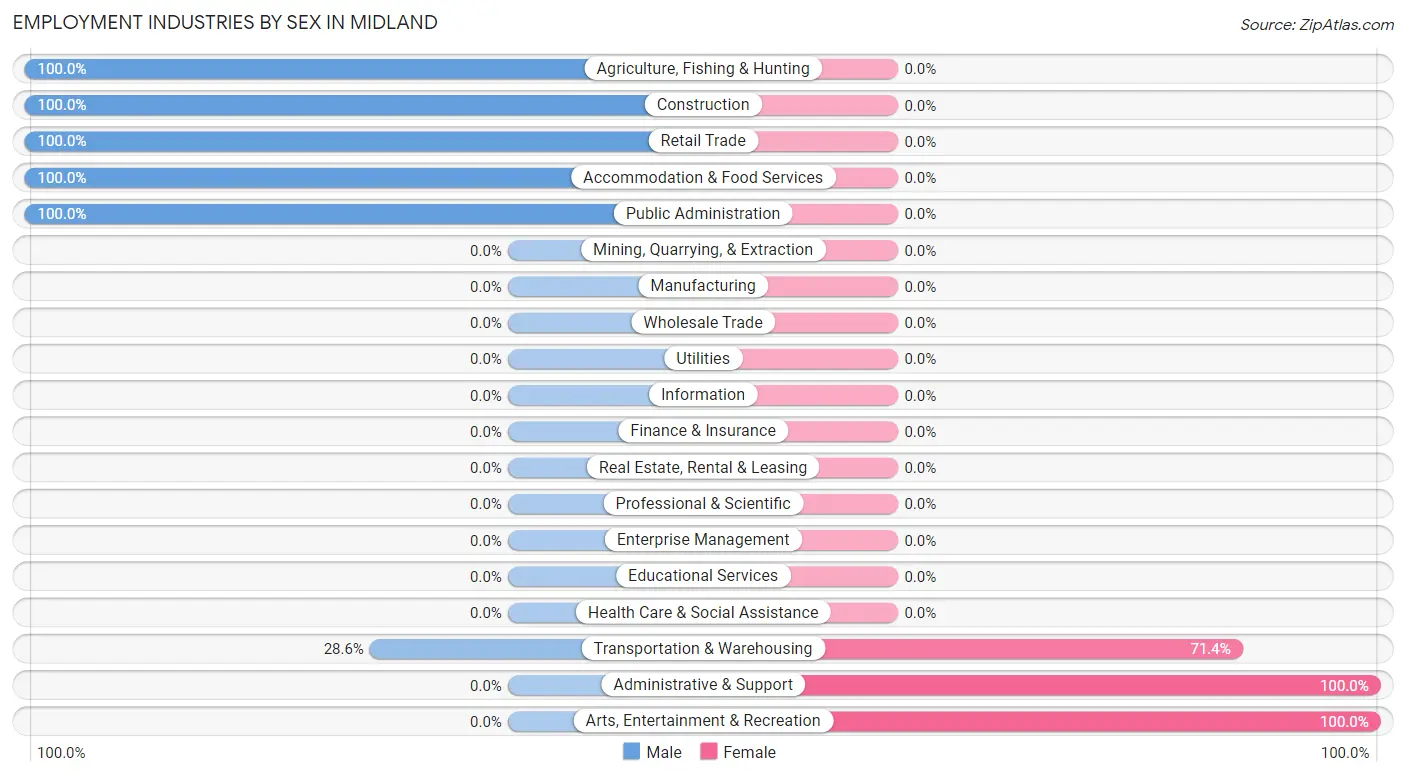
| Industry | Male | Female |
| Agriculture, Fishing & Hunting | 6 (100.0%) | 0 (0.0%) |
| Mining, Quarrying, & Extraction | 0 (0.0%) | 0 (0.0%) |
| Construction | 12 (100.0%) | 0 (0.0%) |
| Manufacturing | 0 (0.0%) | 0 (0.0%) |
| Wholesale Trade | 0 (0.0%) | 0 (0.0%) |
| Retail Trade | 15 (100.0%) | 0 (0.0%) |
| Transportation & Warehousing | 12 (28.6%) | 30 (71.4%) |
| Utilities | 0 (0.0%) | 0 (0.0%) |
| Information | 0 (0.0%) | 0 (0.0%) |
| Finance & Insurance | 0 (0.0%) | 0 (0.0%) |
| Real Estate, Rental & Leasing | 0 (0.0%) | 0 (0.0%) |
| Professional & Scientific | 0 (0.0%) | 0 (0.0%) |
| Enterprise Management | 0 (0.0%) | 0 (0.0%) |
| Administrative & Support | 0 (0.0%) | 5 (100.0%) |
| Educational Services | 0 (0.0%) | 0 (0.0%) |
| Health Care & Social Assistance | 0 (0.0%) | 0 (0.0%) |
| Arts, Entertainment & Recreation | 0 (0.0%) | 10 (100.0%) |
| Accommodation & Food Services | 15 (100.0%) | 0 (0.0%) |
| Public Administration | 12 (100.0%) | 0 (0.0%) |
| Total | 72 (61.5%) | 45 (38.5%) |
Education in Midland
School Enrollment in Midland
The most common levels of schooling among the 51 students in Midland are college / undergraduate (30 | 58.8%), and high school (21 | 41.2%).
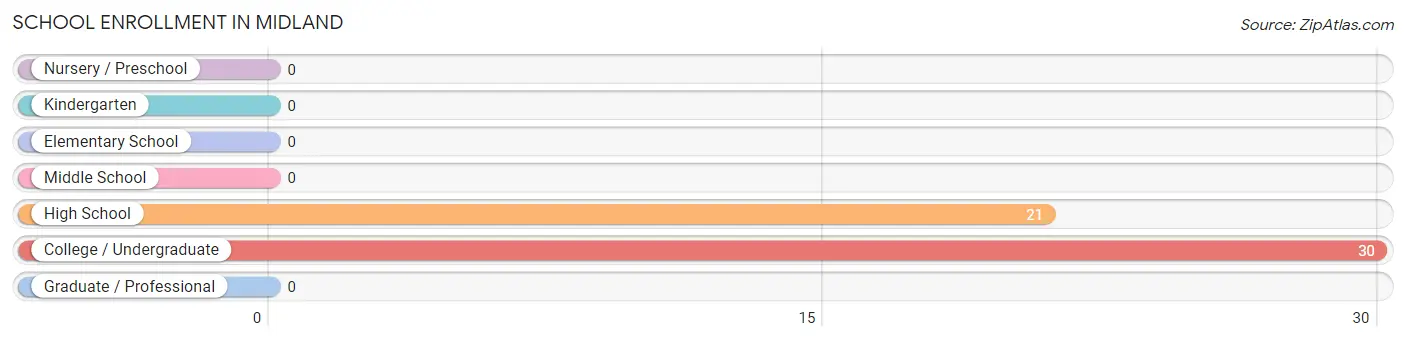
| School Level | # Students | % Students |
| Nursery / Preschool | 0 | 0.0% |
| Kindergarten | 0 | 0.0% |
| Elementary School | 0 | 0.0% |
| Middle School | 0 | 0.0% |
| High School | 21 | 41.2% |
| College / Undergraduate | 30 | 58.8% |
| Graduate / Professional | 0 | 0.0% |
| Total | 51 | 100.0% |
School Enrollment by Age by Funding Source in Midland
Out of a total of 51 students who are enrolled in schools in Midland, 15 (29.4%) attend a private institution, while the remaining 36 (70.6%) are enrolled in public schools. The age group of 20 to 24 year olds has the highest likelihood of being enrolled in private schools, with 15 (100.0% in the age bracket) enrolled. Conversely, the age group of 15 to 17 year olds has the lowest likelihood of being enrolled in a private school, with 21 (100.0% in the age bracket) attending a public institution.
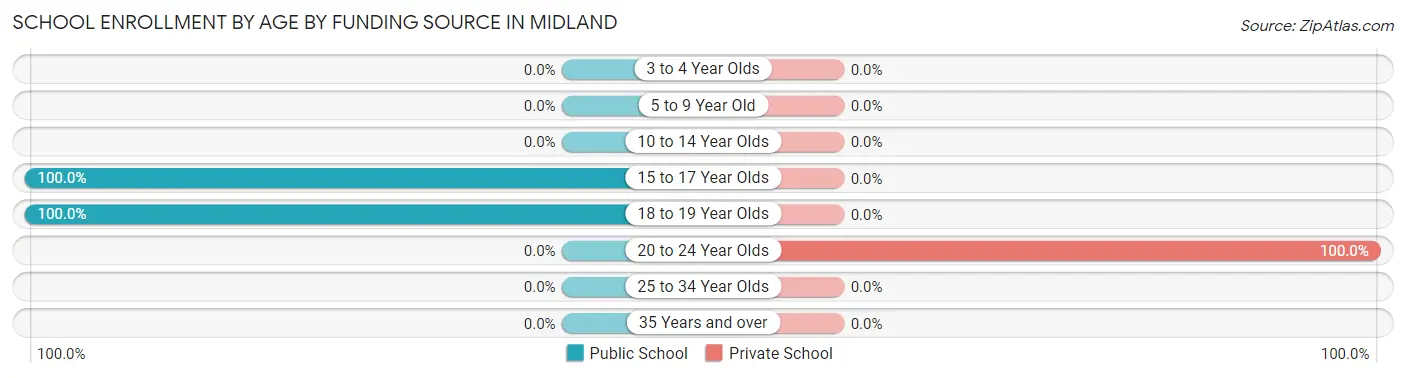
| Age Bracket | Public School | Private School |
| 3 to 4 Year Olds | 0 (0.0%) | 0 (0.0%) |
| 5 to 9 Year Old | 0 (0.0%) | 0 (0.0%) |
| 10 to 14 Year Olds | 0 (0.0%) | 0 (0.0%) |
| 15 to 17 Year Olds | 21 (100.0%) | 0 (0.0%) |
| 18 to 19 Year Olds | 15 (100.0%) | 0 (0.0%) |
| 20 to 24 Year Olds | 0 (0.0%) | 15 (100.0%) |
| 25 to 34 Year Olds | 0 (0.0%) | 0 (0.0%) |
| 35 Years and over | 0 (0.0%) | 0 (0.0%) |
| Total | 36 (70.6%) | 15 (29.4%) |
Educational Attainment by Field of Study in Midland
Social sciences (30 | 50.0%), and education (30 | 50.0%) are the most common fields of study among 60 individuals in Midland who have obtained a bachelor's degree or higher.
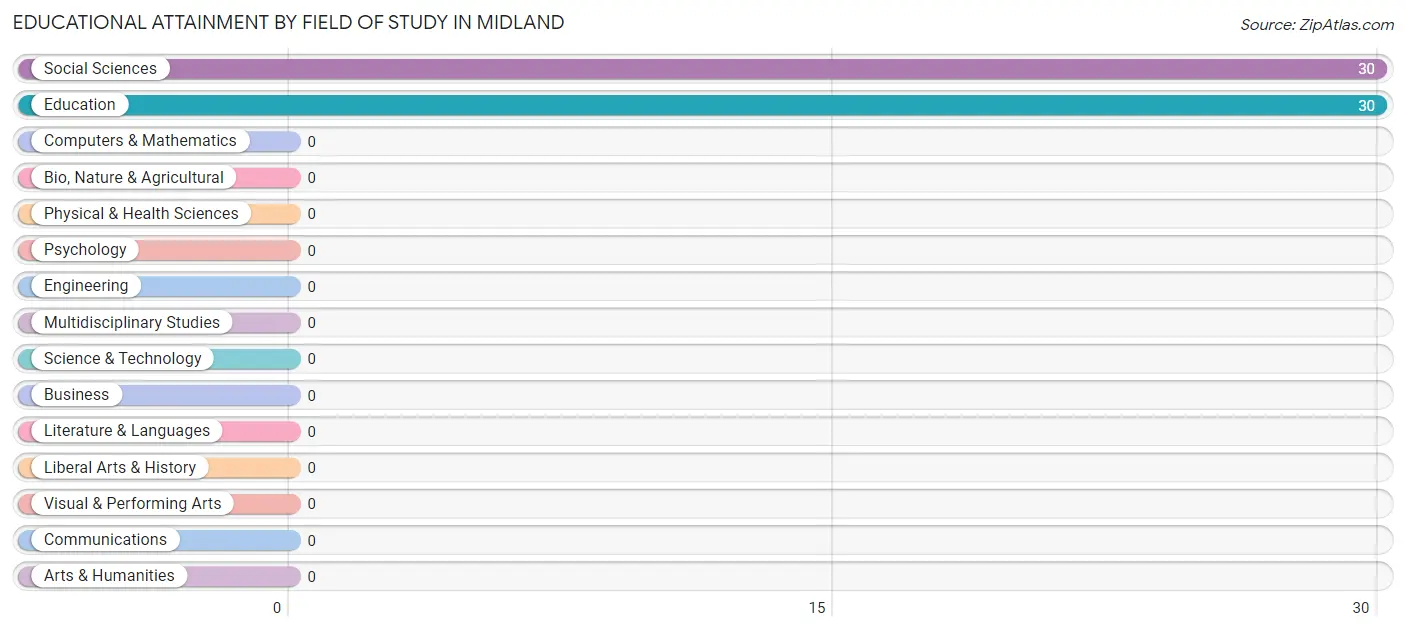
| Field of Study | # Graduates | % Graduates |
| Computers & Mathematics | 0 | 0.0% |
| Bio, Nature & Agricultural | 0 | 0.0% |
| Physical & Health Sciences | 0 | 0.0% |
| Psychology | 0 | 0.0% |
| Social Sciences | 30 | 50.0% |
| Engineering | 0 | 0.0% |
| Multidisciplinary Studies | 0 | 0.0% |
| Science & Technology | 0 | 0.0% |
| Business | 0 | 0.0% |
| Education | 30 | 50.0% |
| Literature & Languages | 0 | 0.0% |
| Liberal Arts & History | 0 | 0.0% |
| Visual & Performing Arts | 0 | 0.0% |
| Communications | 0 | 0.0% |
| Arts & Humanities | 0 | 0.0% |
| Total | 60 | 100.0% |
Transportation & Commute in Midland
Vehicle Availability by Sex in Midland
The most prevalent vehicle ownership categories in Midland are males with 2 vehicles (42, accounting for 58.3%) and females with 2 vehicles (10, making up 93.3%).
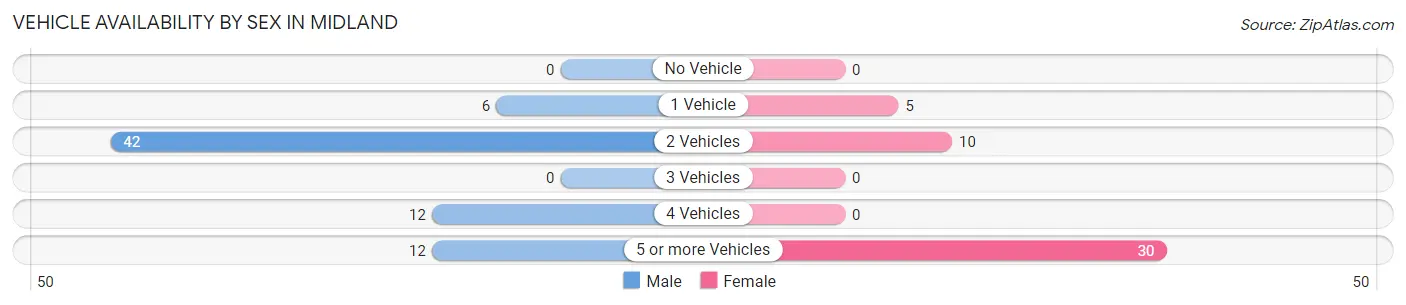
| Vehicles Available | Male | Female |
| No Vehicle | 0 (0.0%) | 0 (0.0%) |
| 1 Vehicle | 6 (8.3%) | 5 (11.1%) |
| 2 Vehicles | 42 (58.3%) | 10 (22.2%) |
| 3 Vehicles | 0 (0.0%) | 0 (0.0%) |
| 4 Vehicles | 12 (16.7%) | 0 (0.0%) |
| 5 or more Vehicles | 12 (16.7%) | 30 (66.7%) |
| Total | 72 (100.0%) | 45 (100.0%) |
Commute Time in Midland
The most frequently occuring commute durations in Midland are 60 to 89 minutes (52 commuters, 46.4%), 15 to 19 minutes (27 commuters, 24.1%), and 35 to 39 minutes (15 commuters, 13.4%).
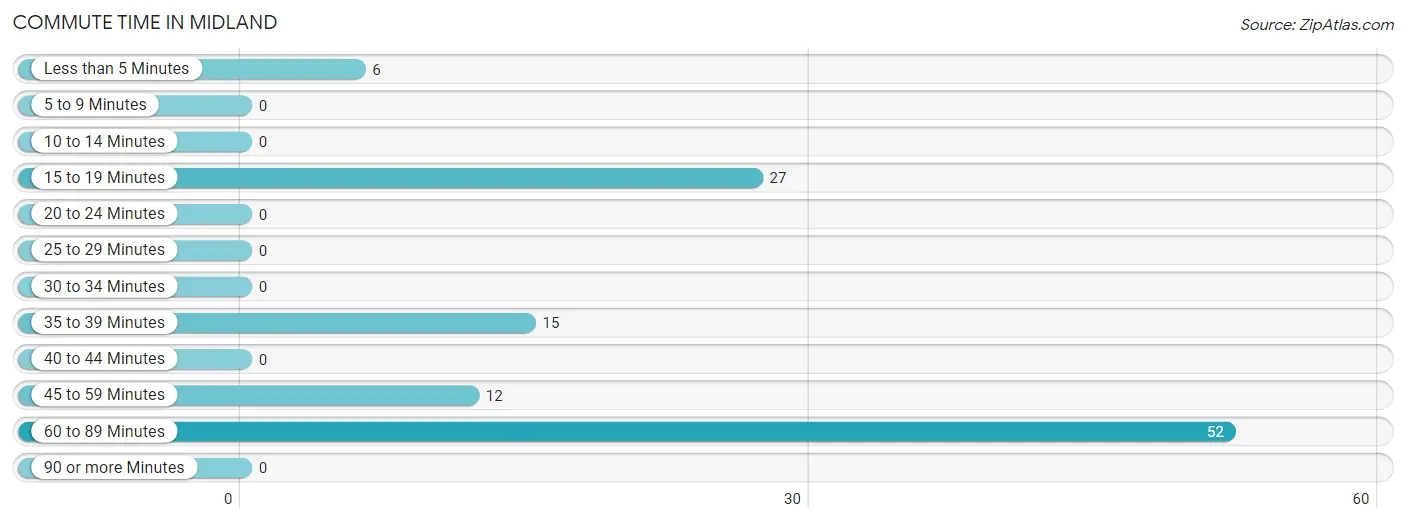
| Commute Time | # Commuters | % Commuters |
| Less than 5 Minutes | 6 | 5.4% |
| 5 to 9 Minutes | 0 | 0.0% |
| 10 to 14 Minutes | 0 | 0.0% |
| 15 to 19 Minutes | 27 | 24.1% |
| 20 to 24 Minutes | 0 | 0.0% |
| 25 to 29 Minutes | 0 | 0.0% |
| 30 to 34 Minutes | 0 | 0.0% |
| 35 to 39 Minutes | 15 | 13.4% |
| 40 to 44 Minutes | 0 | 0.0% |
| 45 to 59 Minutes | 12 | 10.7% |
| 60 to 89 Minutes | 52 | 46.4% |
| 90 or more Minutes | 0 | 0.0% |
Commute Time by Sex in Midland
The most common commute times in Midland are 15 to 19 minutes (27 commuters, 37.5%) for males and 60 to 89 minutes (40 commuters, 100.0%) for females.
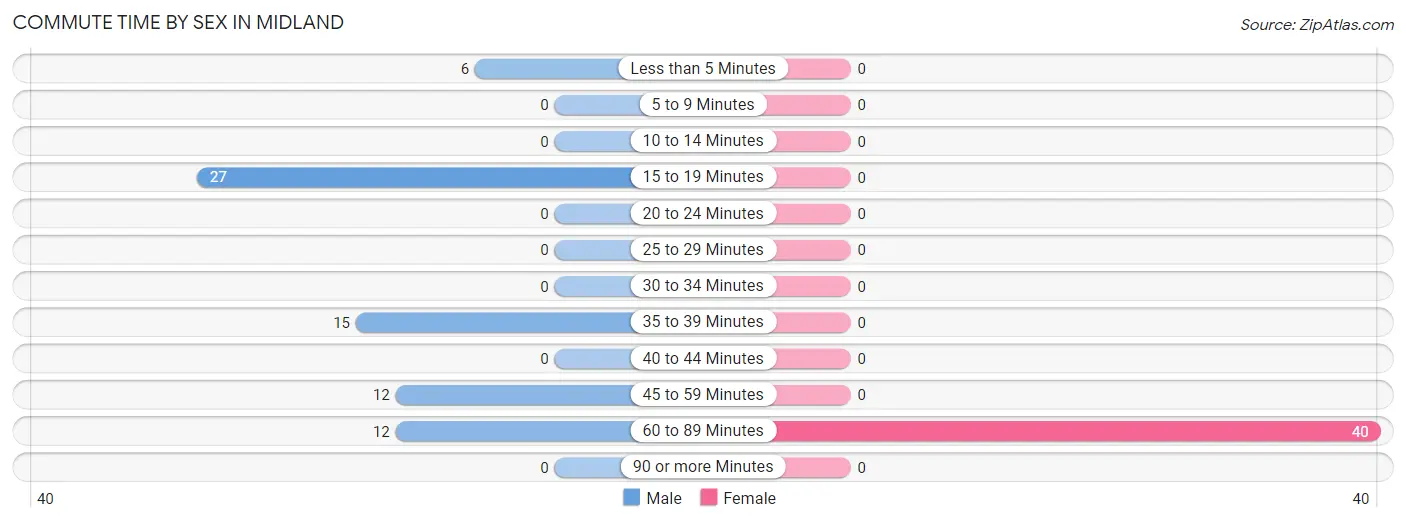
| Commute Time | Male | Female |
| Less than 5 Minutes | 6 (8.3%) | 0 (0.0%) |
| 5 to 9 Minutes | 0 (0.0%) | 0 (0.0%) |
| 10 to 14 Minutes | 0 (0.0%) | 0 (0.0%) |
| 15 to 19 Minutes | 27 (37.5%) | 0 (0.0%) |
| 20 to 24 Minutes | 0 (0.0%) | 0 (0.0%) |
| 25 to 29 Minutes | 0 (0.0%) | 0 (0.0%) |
| 30 to 34 Minutes | 0 (0.0%) | 0 (0.0%) |
| 35 to 39 Minutes | 15 (20.8%) | 0 (0.0%) |
| 40 to 44 Minutes | 0 (0.0%) | 0 (0.0%) |
| 45 to 59 Minutes | 12 (16.7%) | 0 (0.0%) |
| 60 to 89 Minutes | 12 (16.7%) | 40 (100.0%) |
| 90 or more Minutes | 0 (0.0%) | 0 (0.0%) |
Time of Departure to Work by Sex in Midland
The most frequent times of departure to work in Midland are 12:00 AM to 4:59 AM (27, 37.5%) for males and 12:00 AM to 4:59 AM (30, 75.0%) for females.
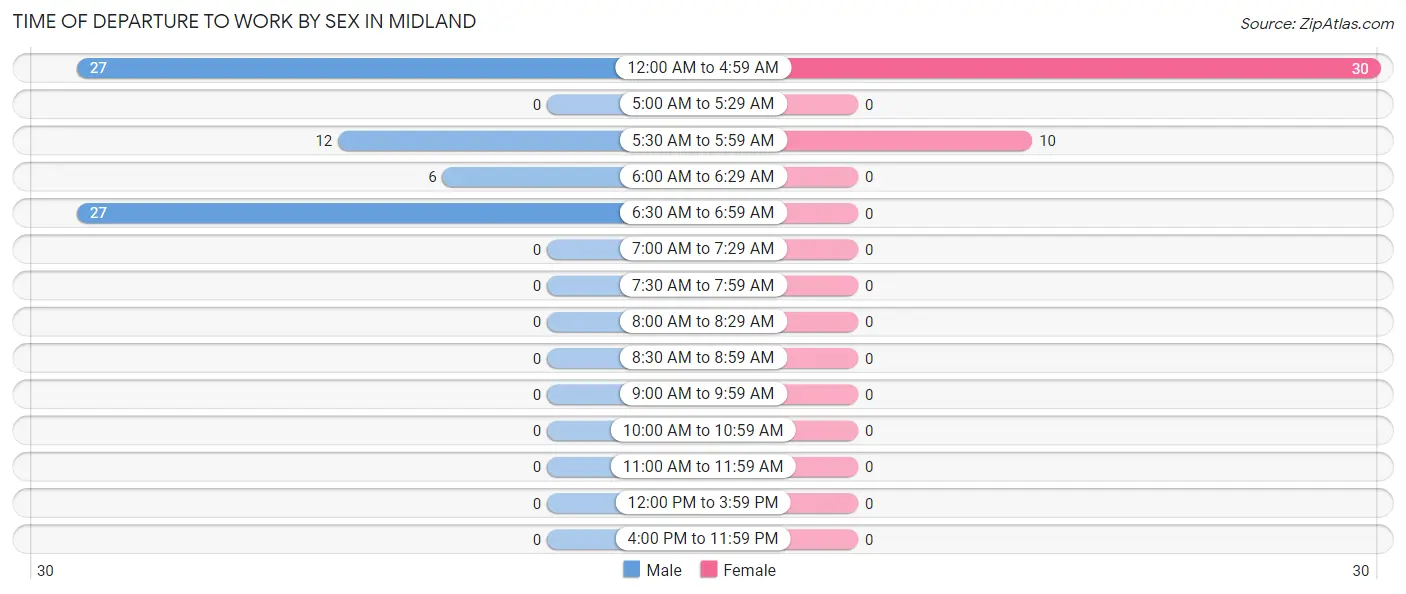
| Time of Departure | Male | Female |
| 12:00 AM to 4:59 AM | 27 (37.5%) | 30 (75.0%) |
| 5:00 AM to 5:29 AM | 0 (0.0%) | 0 (0.0%) |
| 5:30 AM to 5:59 AM | 12 (16.7%) | 10 (25.0%) |
| 6:00 AM to 6:29 AM | 6 (8.3%) | 0 (0.0%) |
| 6:30 AM to 6:59 AM | 27 (37.5%) | 0 (0.0%) |
| 7:00 AM to 7:29 AM | 0 (0.0%) | 0 (0.0%) |
| 7:30 AM to 7:59 AM | 0 (0.0%) | 0 (0.0%) |
| 8:00 AM to 8:29 AM | 0 (0.0%) | 0 (0.0%) |
| 8:30 AM to 8:59 AM | 0 (0.0%) | 0 (0.0%) |
| 9:00 AM to 9:59 AM | 0 (0.0%) | 0 (0.0%) |
| 10:00 AM to 10:59 AM | 0 (0.0%) | 0 (0.0%) |
| 11:00 AM to 11:59 AM | 0 (0.0%) | 0 (0.0%) |
| 12:00 PM to 3:59 PM | 0 (0.0%) | 0 (0.0%) |
| 4:00 PM to 11:59 PM | 0 (0.0%) | 0 (0.0%) |
| Total | 72 (100.0%) | 40 (100.0%) |
Housing Occupancy in Midland
Occupancy by Ownership in Midland
Of the total 70 dwellings in Midland, owner-occupied units account for 29 (41.4%), while renter-occupied units make up 41 (58.6%).
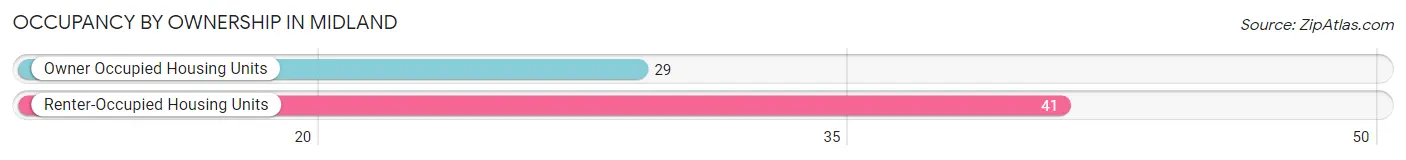
| Occupancy | # Housing Units | % Housing Units |
| Owner Occupied Housing Units | 29 | 41.4% |
| Renter-Occupied Housing Units | 41 | 58.6% |
| Total Occupied Housing Units | 70 | 100.0% |
Occupancy by Household Size in Midland
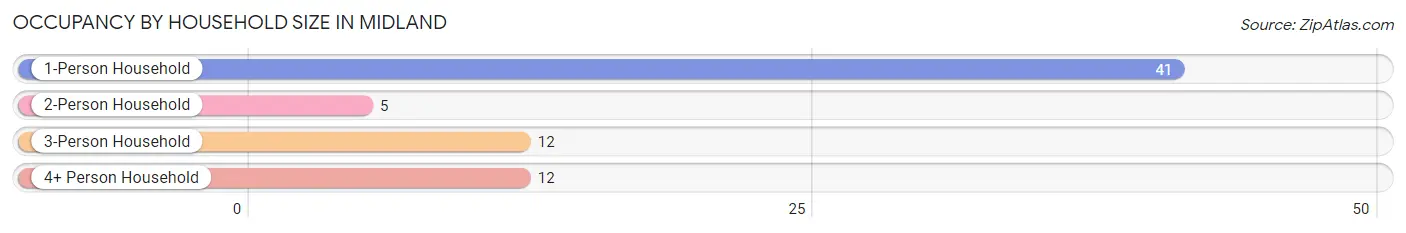
| Household Size | # Housing Units | % Housing Units |
| 1-Person Household | 41 | 58.6% |
| 2-Person Household | 5 | 7.1% |
| 3-Person Household | 12 | 17.1% |
| 4+ Person Household | 12 | 17.1% |
| Total Housing Units | 70 | 100.0% |
Occupancy by Ownership by Household Size in Midland
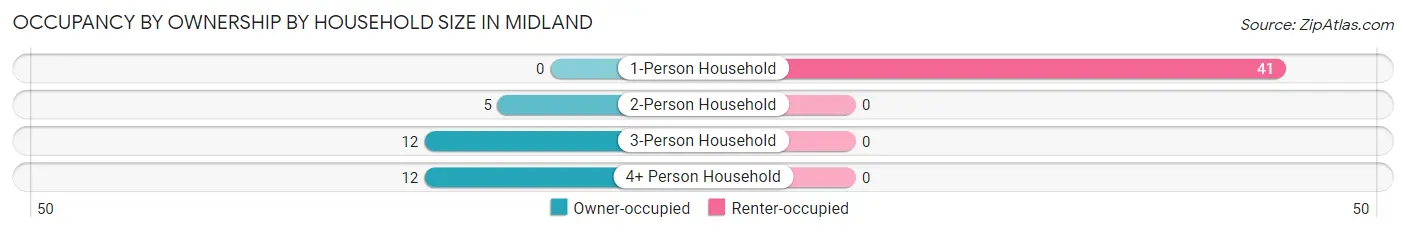
| Household Size | Owner-occupied | Renter-occupied |
| 1-Person Household | 0 (0.0%) | 41 (100.0%) |
| 2-Person Household | 5 (100.0%) | 0 (0.0%) |
| 3-Person Household | 12 (100.0%) | 0 (0.0%) |
| 4+ Person Household | 12 (100.0%) | 0 (0.0%) |
| Total Housing Units | 29 (41.4%) | 41 (58.6%) |
Occupancy by Educational Attainment in Midland
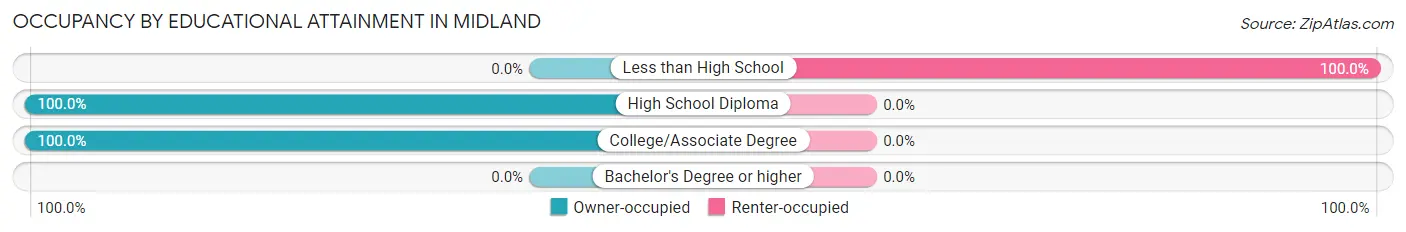
| Household Size | Owner-occupied | Renter-occupied |
| Less than High School | 0 (0.0%) | 41 (100.0%) |
| High School Diploma | 24 (100.0%) | 0 (0.0%) |
| College/Associate Degree | 5 (100.0%) | 0 (0.0%) |
| Bachelor's Degree or higher | 0 (0.0%) | 0 (0.0%) |
Occupancy by Age of Householder in Midland
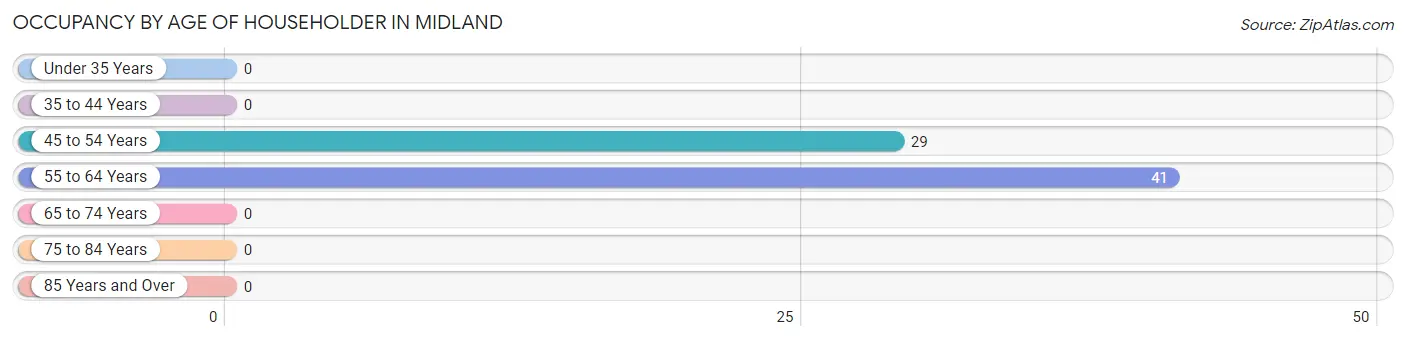
| Age Bracket | # Households | % Households |
| Under 35 Years | 0 | 0.0% |
| 35 to 44 Years | 0 | 0.0% |
| 45 to 54 Years | 29 | 41.4% |
| 55 to 64 Years | 41 | 58.6% |
| 65 to 74 Years | 0 | 0.0% |
| 75 to 84 Years | 0 | 0.0% |
| 85 Years and Over | 0 | 0.0% |
| Total | 70 | 100.0% |
Housing Finances in Midland
Median Income by Occupancy in Midland
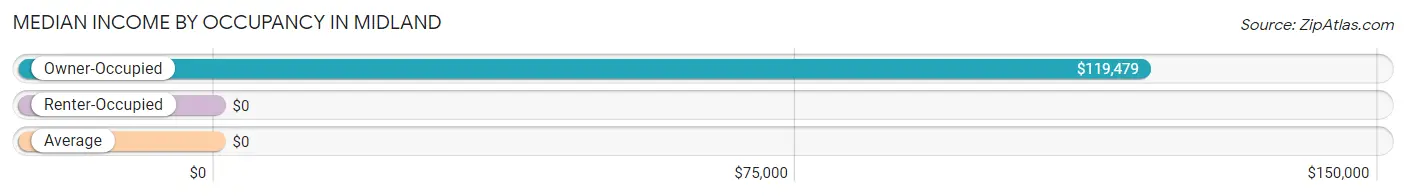
| Occupancy Type | # Households | Median Income |
| Owner-Occupied | 29 (41.4%) | $119,479 |
| Renter-Occupied | 41 (58.6%) | $0 |
| Average | 70 (100.0%) | $0 |
Occupancy by Householder Income Bracket in Midland
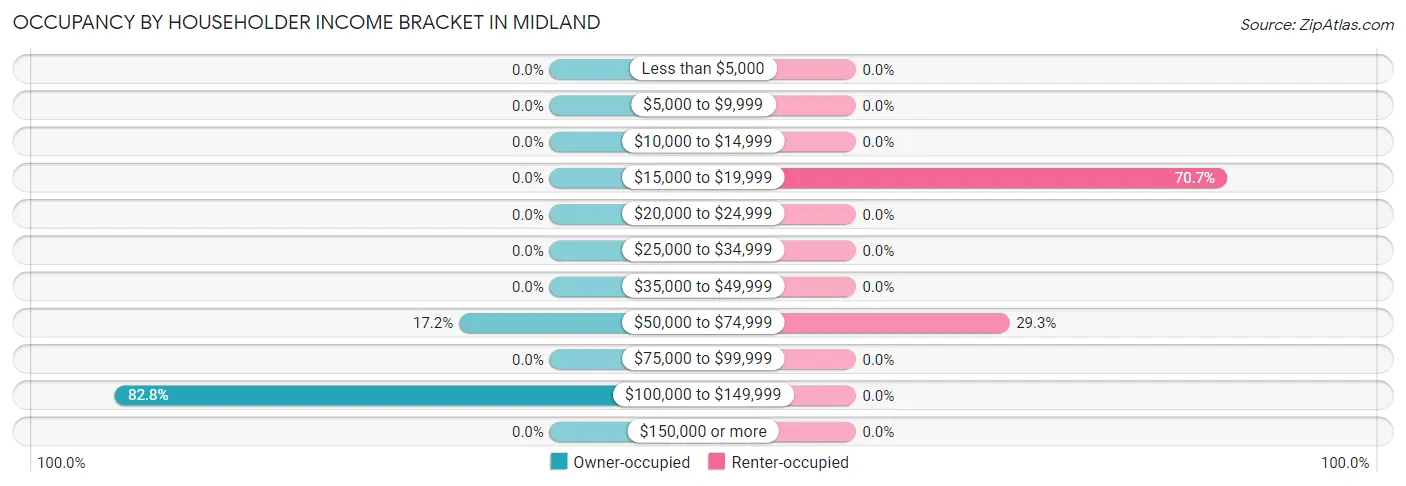
| Income Bracket | Owner-occupied | Renter-occupied |
| Less than $5,000 | 0 (0.0%) | 0 (0.0%) |
| $5,000 to $9,999 | 0 (0.0%) | 0 (0.0%) |
| $10,000 to $14,999 | 0 (0.0%) | 0 (0.0%) |
| $15,000 to $19,999 | 0 (0.0%) | 29 (70.7%) |
| $20,000 to $24,999 | 0 (0.0%) | 0 (0.0%) |
| $25,000 to $34,999 | 0 (0.0%) | 0 (0.0%) |
| $35,000 to $49,999 | 0 (0.0%) | 0 (0.0%) |
| $50,000 to $74,999 | 5 (17.2%) | 12 (29.3%) |
| $75,000 to $99,999 | 0 (0.0%) | 0 (0.0%) |
| $100,000 to $149,999 | 24 (82.8%) | 0 (0.0%) |
| $150,000 or more | 0 (0.0%) | 0 (0.0%) |
| Total | 29 (100.0%) | 41 (100.0%) |
Monthly Housing Cost Tiers in Midland
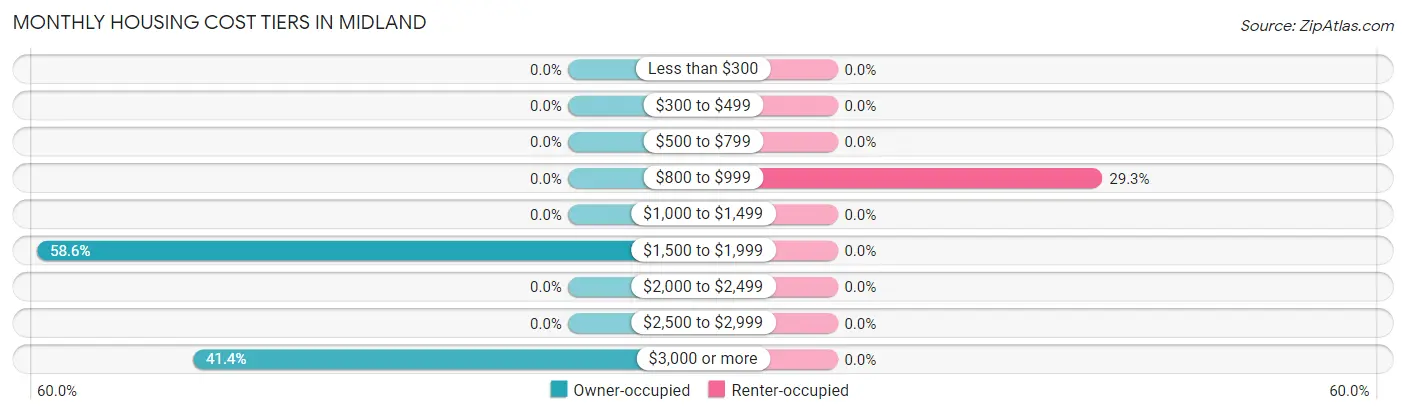
| Monthly Cost | Owner-occupied | Renter-occupied |
| Less than $300 | 0 (0.0%) | 0 (0.0%) |
| $300 to $499 | 0 (0.0%) | 0 (0.0%) |
| $500 to $799 | 0 (0.0%) | 0 (0.0%) |
| $800 to $999 | 0 (0.0%) | 12 (29.3%) |
| $1,000 to $1,499 | 0 (0.0%) | 0 (0.0%) |
| $1,500 to $1,999 | 17 (58.6%) | 0 (0.0%) |
| $2,000 to $2,499 | 0 (0.0%) | 0 (0.0%) |
| $2,500 to $2,999 | 0 (0.0%) | 0 (0.0%) |
| $3,000 or more | 12 (41.4%) | 0 (0.0%) |
| Total | 29 (100.0%) | 41 (100.0%) |
Physical Housing Characteristics in Midland
Housing Structures in Midland
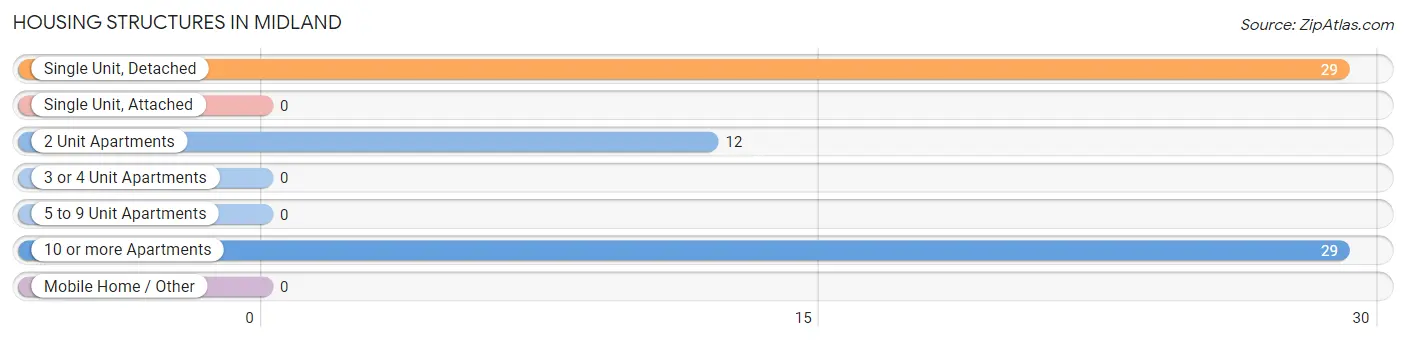
| Structure Type | # Housing Units | % Housing Units |
| Single Unit, Detached | 29 | 41.4% |
| Single Unit, Attached | 0 | 0.0% |
| 2 Unit Apartments | 12 | 17.1% |
| 3 or 4 Unit Apartments | 0 | 0.0% |
| 5 to 9 Unit Apartments | 0 | 0.0% |
| 10 or more Apartments | 29 | 41.4% |
| Mobile Home / Other | 0 | 0.0% |
| Total | 70 | 100.0% |
Housing Structures by Occupancy in Midland
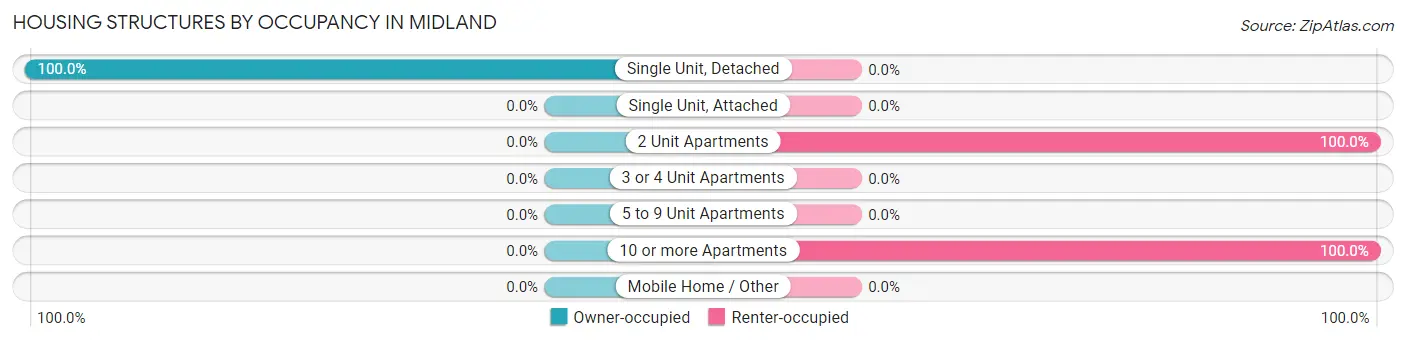
| Structure Type | Owner-occupied | Renter-occupied |
| Single Unit, Detached | 29 (100.0%) | 0 (0.0%) |
| Single Unit, Attached | 0 (0.0%) | 0 (0.0%) |
| 2 Unit Apartments | 0 (0.0%) | 12 (100.0%) |
| 3 or 4 Unit Apartments | 0 (0.0%) | 0 (0.0%) |
| 5 to 9 Unit Apartments | 0 (0.0%) | 0 (0.0%) |
| 10 or more Apartments | 0 (0.0%) | 29 (100.0%) |
| Mobile Home / Other | 0 (0.0%) | 0 (0.0%) |
| Total | 29 (41.4%) | 41 (58.6%) |
Housing Structures by Number of Rooms in Midland
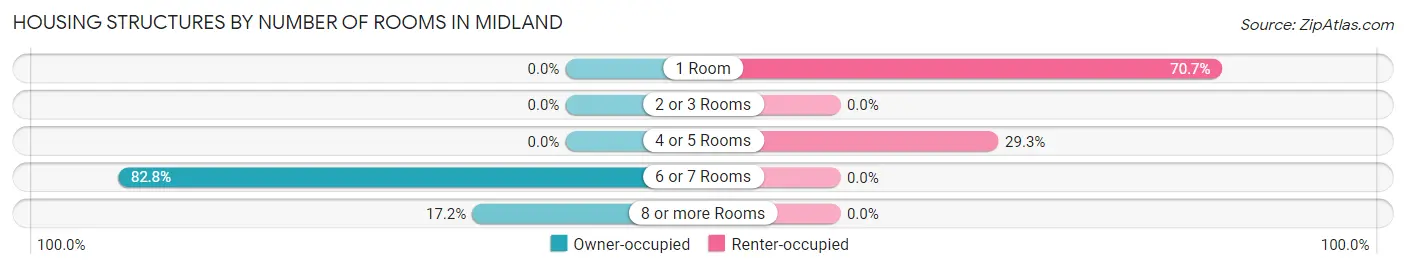
| Number of Rooms | Owner-occupied | Renter-occupied |
| 1 Room | 0 (0.0%) | 29 (70.7%) |
| 2 or 3 Rooms | 0 (0.0%) | 0 (0.0%) |
| 4 or 5 Rooms | 0 (0.0%) | 12 (29.3%) |
| 6 or 7 Rooms | 24 (82.8%) | 0 (0.0%) |
| 8 or more Rooms | 5 (17.2%) | 0 (0.0%) |
| Total | 29 (100.0%) | 41 (100.0%) |
Housing Structure by Heating Type in Midland
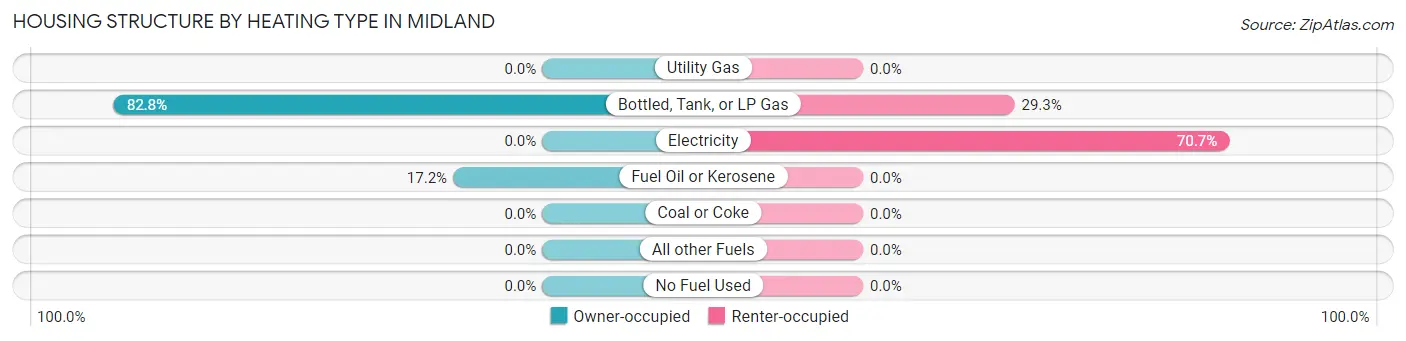
| Heating Type | Owner-occupied | Renter-occupied |
| Utility Gas | 0 (0.0%) | 0 (0.0%) |
| Bottled, Tank, or LP Gas | 24 (82.8%) | 12 (29.3%) |
| Electricity | 0 (0.0%) | 29 (70.7%) |
| Fuel Oil or Kerosene | 5 (17.2%) | 0 (0.0%) |
| Coal or Coke | 0 (0.0%) | 0 (0.0%) |
| All other Fuels | 0 (0.0%) | 0 (0.0%) |
| No Fuel Used | 0 (0.0%) | 0 (0.0%) |
| Total | 29 (100.0%) | 41 (100.0%) |
Household Vehicle Usage in Midland
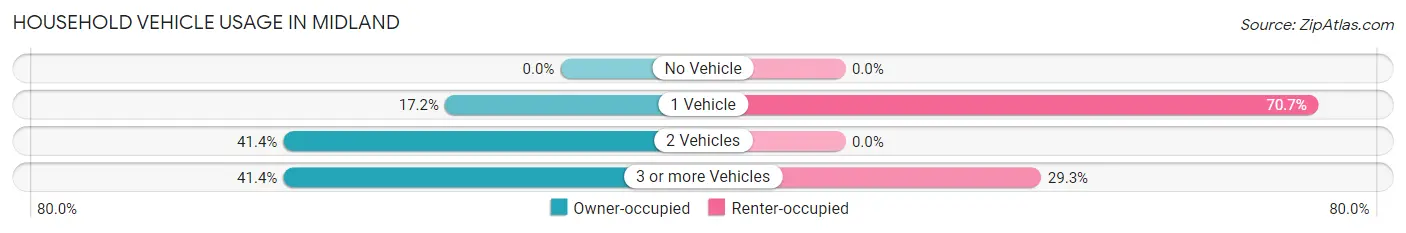
| Vehicles per Household | Owner-occupied | Renter-occupied |
| No Vehicle | 0 (0.0%) | 0 (0.0%) |
| 1 Vehicle | 5 (17.2%) | 29 (70.7%) |
| 2 Vehicles | 12 (41.4%) | 0 (0.0%) |
| 3 or more Vehicles | 12 (41.4%) | 12 (29.3%) |
| Total | 29 (100.0%) | 41 (100.0%) |
Real Estate & Mortgages in Midland
Real Estate and Mortgage Overview in Midland
| Characteristic | Without Mortgage | With Mortgage |
| Housing Units | 0 | 29 |
| Median Property Value | - | - |
| Median Household Income | - | - |
| Monthly Housing Costs | - | - |
| Real Estate Taxes | - | - |
Property Value by Mortgage Status in Midland
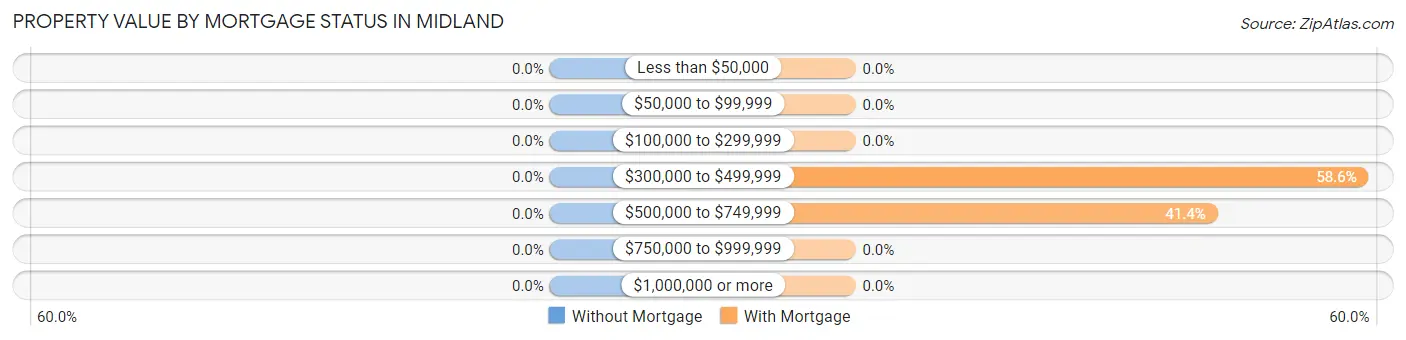
| Property Value | Without Mortgage | With Mortgage |
| Less than $50,000 | 0 (0.0%) | 0 (0.0%) |
| $50,000 to $99,999 | 0 (0.0%) | 0 (0.0%) |
| $100,000 to $299,999 | 0 (0.0%) | 0 (0.0%) |
| $300,000 to $499,999 | 0 (0.0%) | 17 (58.6%) |
| $500,000 to $749,999 | 0 (0.0%) | 12 (41.4%) |
| $750,000 to $999,999 | 0 (0.0%) | 0 (0.0%) |
| $1,000,000 or more | 0 (0.0%) | 0 (0.0%) |
| Total | 0 (0.0%) | 29 (100.0%) |
Household Income by Mortgage Status in Midland
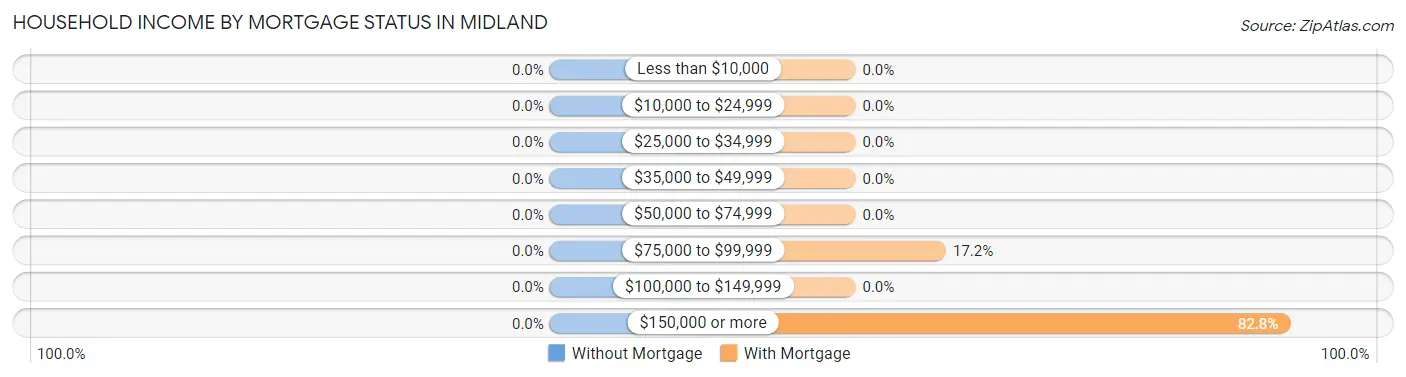
| Household Income | Without Mortgage | With Mortgage |
| Less than $10,000 | 0 (0.0%) | 0 (0.0%) |
| $10,000 to $24,999 | 0 (0.0%) | 0 (0.0%) |
| $25,000 to $34,999 | 0 (0.0%) | 0 (0.0%) |
| $35,000 to $49,999 | 0 (0.0%) | 0 (0.0%) |
| $50,000 to $74,999 | 0 (0.0%) | 0 (0.0%) |
| $75,000 to $99,999 | 0 (0.0%) | 5 (17.2%) |
| $100,000 to $149,999 | 0 (0.0%) | 0 (0.0%) |
| $150,000 or more | 0 (0.0%) | 24 (82.8%) |
| Total | 0 (0.0%) | 29 (100.0%) |
Property Value to Household Income Ratio in Midland
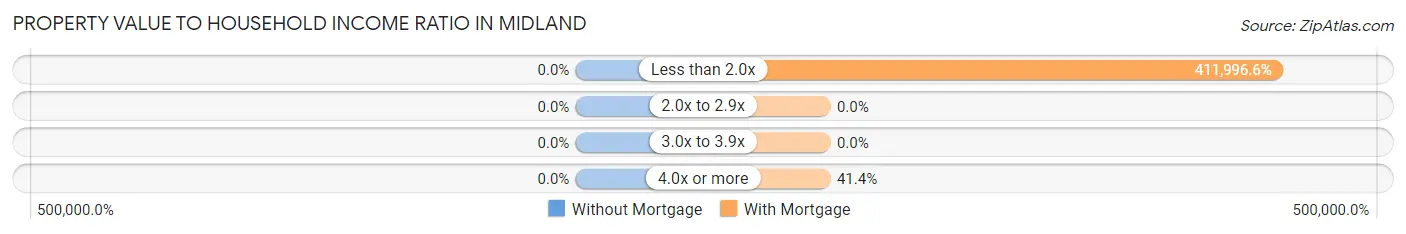
| Value-to-Income Ratio | Without Mortgage | With Mortgage |
| Less than 2.0x | 0 (0.0%) | 119,479 (411,996.6%) |
| 2.0x to 2.9x | 0 (0.0%) | 0 (0.0%) |
| 3.0x to 3.9x | 0 (0.0%) | 0 (0.0%) |
| 4.0x or more | 0 (0.0%) | 12 (41.4%) |
| Total | 0 (0.0%) | 29 (100.0%) |
Real Estate Taxes by Mortgage Status in Midland
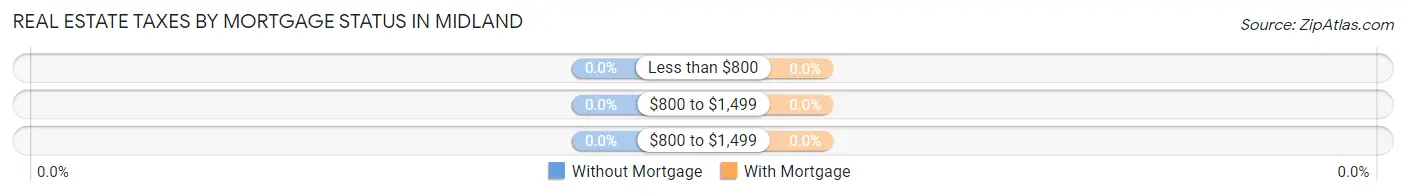
| Property Taxes | Without Mortgage | With Mortgage |
| Less than $800 | 0 (0.0%) | 0 (0.0%) |
| $800 to $1,499 | 0 (0.0%) | 0 (0.0%) |
| $800 to $1,499 | 0 (0.0%) | 0 (0.0%) |
| Total | 0 (0.0%) | 29 (100.0%) |
Health & Disability in Midland
Health Insurance Coverage by Age in Midland
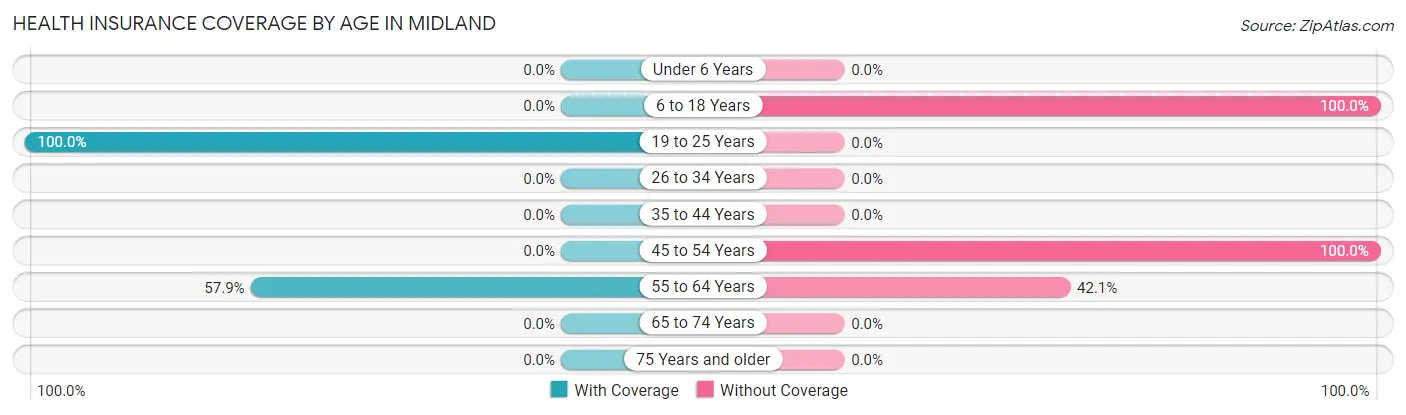
| Age Bracket | With Coverage | Without Coverage |
| Under 6 Years | 0 (0.0%) | 0 (0.0%) |
| 6 to 18 Years | 0 (0.0%) | 21 (100.0%) |
| 19 to 25 Years | 30 (100.0%) | 0 (0.0%) |
| 26 to 34 Years | 0 (0.0%) | 0 (0.0%) |
| 35 to 44 Years | 0 (0.0%) | 0 (0.0%) |
| 45 to 54 Years | 0 (0.0%) | 59 (100.0%) |
| 55 to 64 Years | 33 (57.9%) | 24 (42.1%) |
| 65 to 74 Years | 0 (0.0%) | 0 (0.0%) |
| 75 Years and older | 0 (0.0%) | 0 (0.0%) |
| Total | 63 (37.7%) | 104 (62.3%) |
Health Insurance Coverage by Citizenship Status in Midland
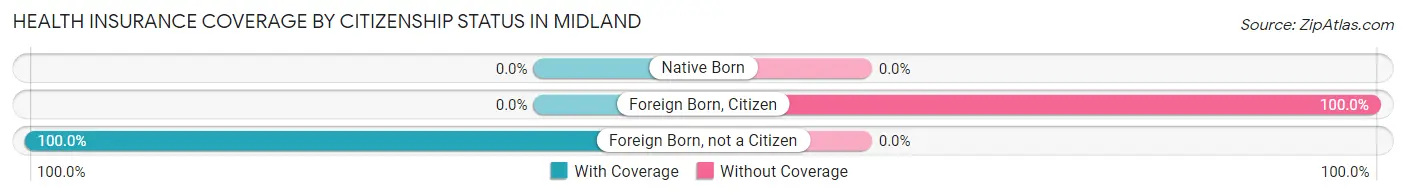
| Citizenship Status | With Coverage | Without Coverage |
| Native Born | 0 (0.0%) | 0 (0.0%) |
| Foreign Born, Citizen | 0 (0.0%) | 21 (100.0%) |
| Foreign Born, not a Citizen | 30 (100.0%) | 0 (0.0%) |
Health Insurance Coverage by Household Income in Midland
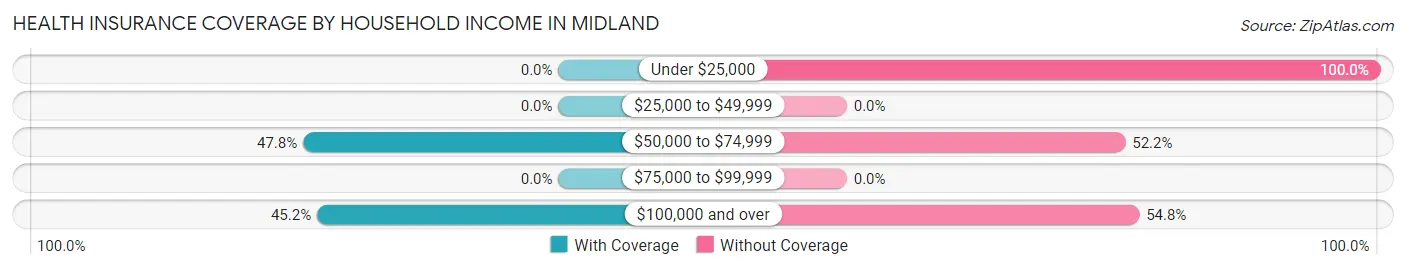
| Household Income | With Coverage | Without Coverage |
| Under $25,000 | 0 (0.0%) | 29 (100.0%) |
| $25,000 to $49,999 | 0 (0.0%) | 0 (0.0%) |
| $50,000 to $74,999 | 11 (47.8%) | 12 (52.2%) |
| $75,000 to $99,999 | 0 (0.0%) | 0 (0.0%) |
| $100,000 and over | 52 (45.2%) | 63 (54.8%) |
Public vs Private Health Insurance Coverage by Age in Midland
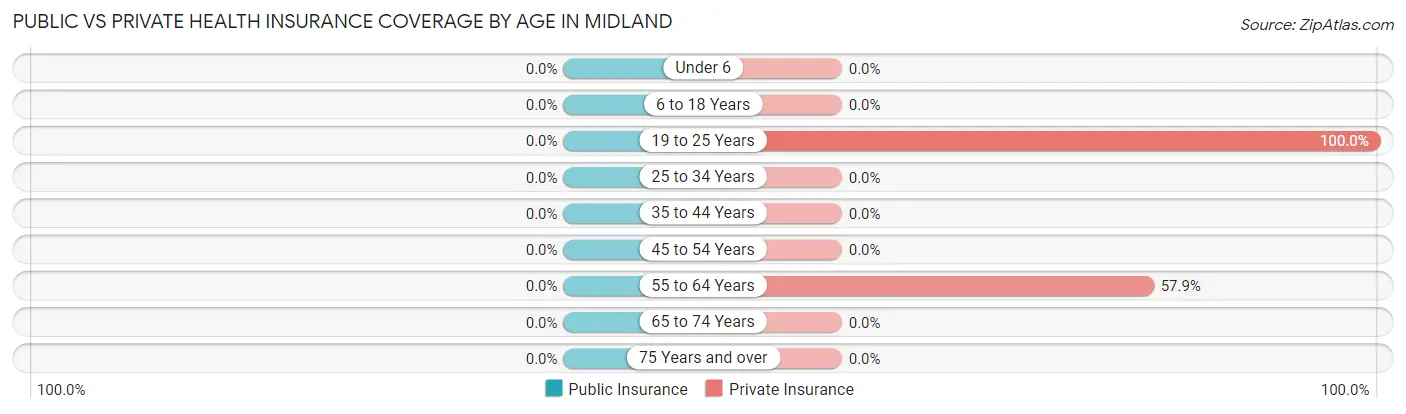
| Age Bracket | Public Insurance | Private Insurance |
| Under 6 | 0 (0.0%) | 0 (0.0%) |
| 6 to 18 Years | 0 (0.0%) | 0 (0.0%) |
| 19 to 25 Years | 0 (0.0%) | 30 (100.0%) |
| 25 to 34 Years | 0 (0.0%) | 0 (0.0%) |
| 35 to 44 Years | 0 (0.0%) | 0 (0.0%) |
| 45 to 54 Years | 0 (0.0%) | 0 (0.0%) |
| 55 to 64 Years | 0 (0.0%) | 33 (57.9%) |
| 65 to 74 Years | 0 (0.0%) | 0 (0.0%) |
| 75 Years and over | 0 (0.0%) | 0 (0.0%) |
| Total | 0 (0.0%) | 63 (37.7%) |
Disability Status by Sex by Age in Midland
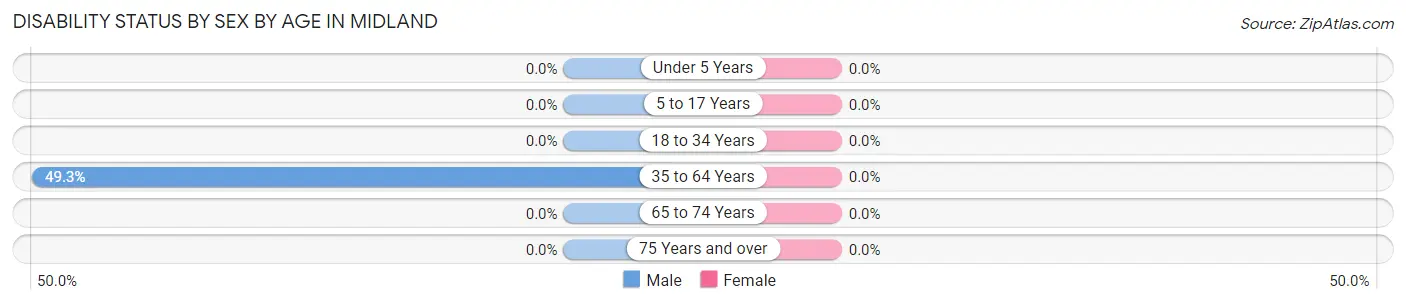
| Age Bracket | Male | Female |
| Under 5 Years | 0 (0.0%) | 0 (0.0%) |
| 5 to 17 Years | 0 (0.0%) | 0 (0.0%) |
| 18 to 34 Years | 0 (0.0%) | 0 (0.0%) |
| 35 to 64 Years | 35 (49.3%) | 0 (0.0%) |
| 65 to 74 Years | 0 (0.0%) | 0 (0.0%) |
| 75 Years and over | 0 (0.0%) | 0 (0.0%) |
Disability Class by Sex by Age in Midland
Disability Class: Hearing Difficulty
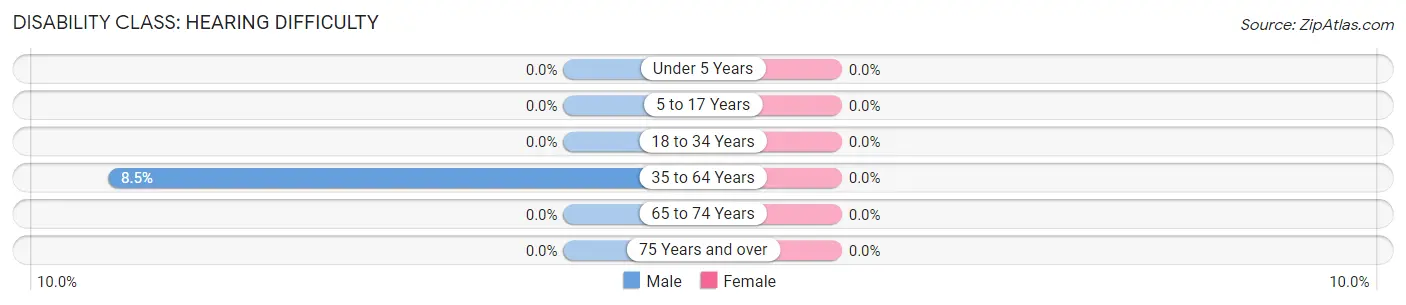
| Age Bracket | Male | Female |
| Under 5 Years | 0 (0.0%) | 0 (0.0%) |
| 5 to 17 Years | 0 (0.0%) | 0 (0.0%) |
| 18 to 34 Years | 0 (0.0%) | 0 (0.0%) |
| 35 to 64 Years | 6 (8.5%) | 0 (0.0%) |
| 65 to 74 Years | 0 (0.0%) | 0 (0.0%) |
| 75 Years and over | 0 (0.0%) | 0 (0.0%) |
Disability Class: Vision Difficulty
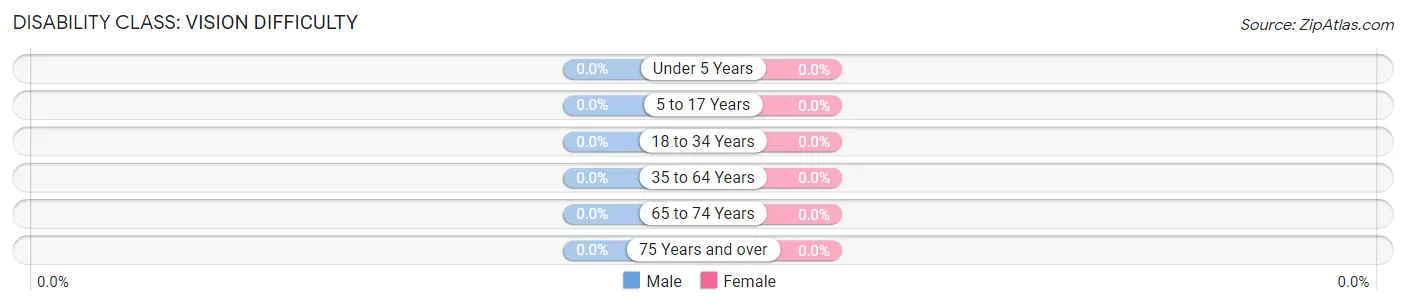
| Age Bracket | Male | Female |
| Under 5 Years | 0 (0.0%) | 0 (0.0%) |
| 5 to 17 Years | 0 (0.0%) | 0 (0.0%) |
| 18 to 34 Years | 0 (0.0%) | 0 (0.0%) |
| 35 to 64 Years | 0 (0.0%) | 0 (0.0%) |
| 65 to 74 Years | 0 (0.0%) | 0 (0.0%) |
| 75 Years and over | 0 (0.0%) | 0 (0.0%) |
Disability Class: Cognitive Difficulty
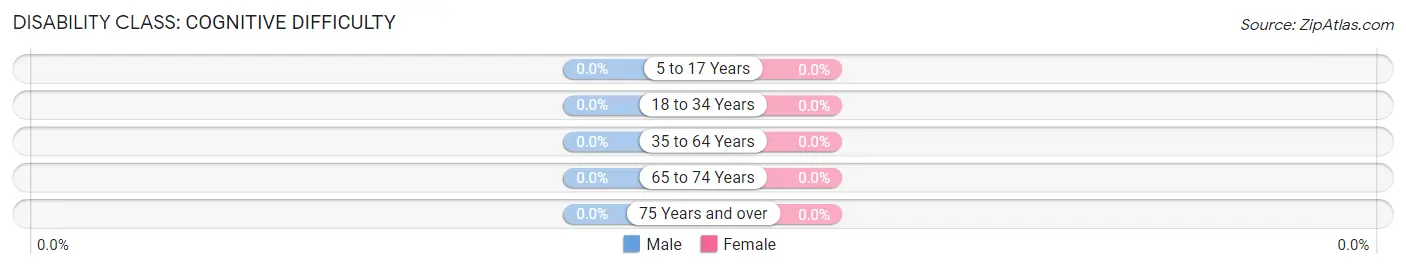
| Age Bracket | Male | Female |
| 5 to 17 Years | 0 (0.0%) | 0 (0.0%) |
| 18 to 34 Years | 0 (0.0%) | 0 (0.0%) |
| 35 to 64 Years | 0 (0.0%) | 0 (0.0%) |
| 65 to 74 Years | 0 (0.0%) | 0 (0.0%) |
| 75 Years and over | 0 (0.0%) | 0 (0.0%) |
Disability Class: Ambulatory Difficulty
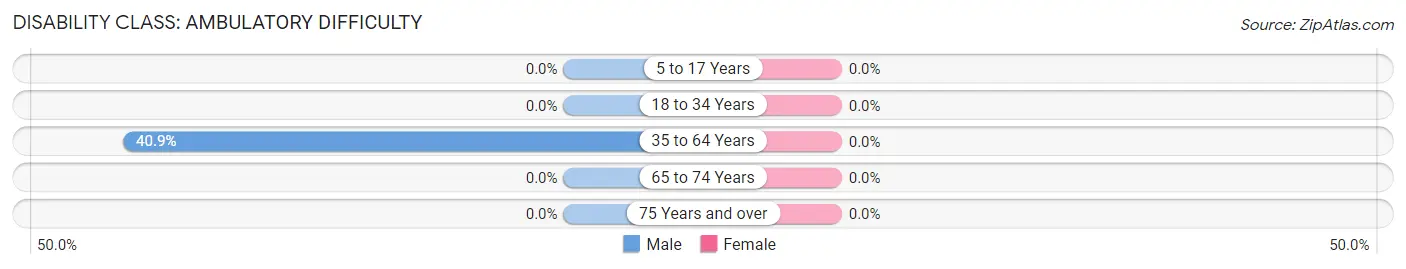
| Age Bracket | Male | Female |
| 5 to 17 Years | 0 (0.0%) | 0 (0.0%) |
| 18 to 34 Years | 0 (0.0%) | 0 (0.0%) |
| 35 to 64 Years | 29 (40.8%) | 0 (0.0%) |
| 65 to 74 Years | 0 (0.0%) | 0 (0.0%) |
| 75 Years and over | 0 (0.0%) | 0 (0.0%) |
Disability Class: Self-Care Difficulty
| Age Bracket | Male | Female |
| 5 to 17 Years | 0 (0.0%) | 0 (0.0%) |
| 18 to 34 Years | 0 (0.0%) | 0 (0.0%) |
| 35 to 64 Years | 0 (0.0%) | 0 (0.0%) |
| 65 to 74 Years | 0 (0.0%) | 0 (0.0%) |
| 75 Years and over | 0 (0.0%) | 0 (0.0%) |
Technology Access in Midland
Computing Device Access in Midland
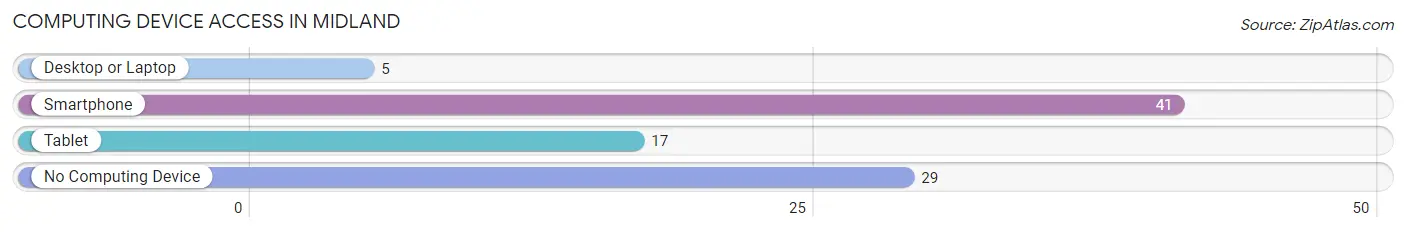
| Device Type | # Households | % Households |
| Desktop or Laptop | 5 | 7.1% |
| Smartphone | 41 | 58.6% |
| Tablet | 17 | 24.3% |
| No Computing Device | 29 | 41.4% |
| Total | 70 | 100.0% |
Internet Access in Midland
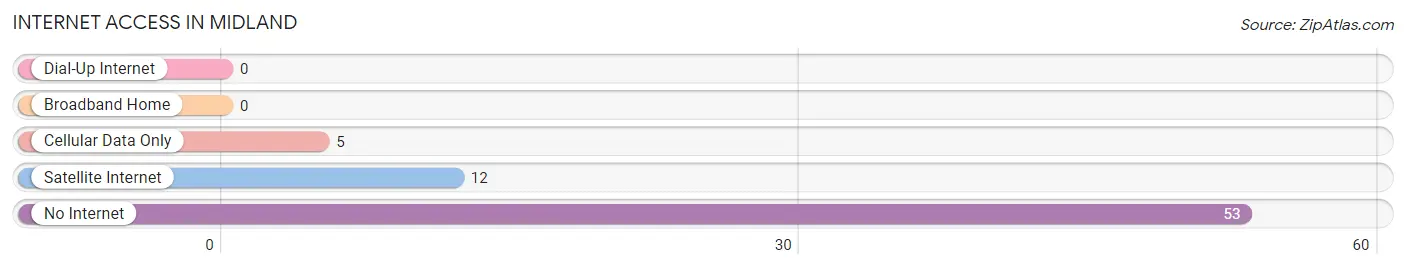
| Internet Type | # Households | % Households |
| Dial-Up Internet | 0 | 0.0% |
| Broadband Home | 0 | 0.0% |
| Cellular Data Only | 5 | 7.1% |
| Satellite Internet | 12 | 17.1% |
| No Internet | 53 | 75.7% |
| Total | 70 | 100.0% |
Midland Summary
Midland, Virginia is a small town located in Fauquier County, Virginia. It is situated in the foothills of the Blue Ridge Mountains, about an hour west of Washington, D.C. The town has a population of about 1,000 people and is known for its rural charm and small-town atmosphere.
History
Midland was first settled in the late 1700s by a group of German immigrants. The town was originally known as “Middletown” and was part of the original Fauquier County. In 1810, the town was renamed “Midland” and was officially incorporated in 1817.
The town was a major stop on the Orange and Alexandria Railroad, which connected Washington, D.C. to the Shenandoah Valley. The railroad was a major factor in the town’s growth and development. In the late 1800s, Midland was a bustling center of commerce and industry, with several mills, a tannery, and a brickyard.
In the early 1900s, Midland began to decline as the railroad industry declined and the town’s economy shifted to agriculture. The town’s population decreased and many of the businesses closed. In the 1950s, the town began to experience a resurgence as the population began to grow again and new businesses opened.
Geography
Midland is located in the foothills of the Blue Ridge Mountains in Fauquier County, Virginia. The town is situated on the banks of the Rappahannock River, which flows through the town. The town is surrounded by rolling hills and farmland, and is located about an hour west of Washington, D.C.
Economy
Midland’s economy is largely based on agriculture and tourism. The town is home to several farms, which produce a variety of crops, including corn, soybeans, wheat, and hay. The town is also home to several wineries, which attract tourists from all over the region.
In addition to agriculture and tourism, Midland is home to several small businesses, including restaurants, shops, and a hardware store. The town is also home to a few light manufacturing businesses, which produce a variety of products, including furniture and clothing.
Demographics
As of the 2010 census, Midland had a population of 1,000 people. The town is predominantly white, with about 90% of the population identifying as white. The town also has a small African American population, with about 5% of the population identifying as African American. The town also has a small Hispanic population, with about 2% of the population identifying as Hispanic. The median household income in Midland is about $50,000, and the median home value is about $200,000.
Common Questions
What is Per Capita Income in Midland?
Per Capita income in Midland is $30,883.
What is the Median Family Income in Midland?
Median Family Income in Midland is $119,479.
What is Inequality or Gini Index in Midland?
Inequality or Gini Index in Midland is 0.40.
What is the Total Population of Midland?
Total Population of Midland is 167.
What is the Total Male Population of Midland?
Total Male Population of Midland is 122.
What is the Total Female Population of Midland?
Total Female Population of Midland is 45.
What is the Ratio of Males per 100 Females in Midland?
There are 271.11 Males per 100 Females in Midland.
What is the Ratio of Females per 100 Males in Midland?
There are 36.89 Females per 100 Males in Midland.
What is the Median Population Age in Midland?
Median Population Age in Midland is 52.1 Years.
What is the Average Family Size in Midland
Average Family Size in Midland is 4.3 People.
What is the Average Household Size in Midland
Average Household Size in Midland is 2.4 People.
How Large is the Labor Force in Midland?
There are 117 People in the Labor Forcein in Midland.
What is the Percentage of People in the Labor Force in Midland?
80.1% of People are in the Labor Force in Midland.