La Crosse, VA Map & Demographics
La Crosse Map
La Crosse Overview
$16,926
PER CAPITA INCOME
$41,094
AVG FAMILY INCOME
$34,306
AVG HOUSEHOLD INCOME
4.4%
WAGE / INCOME GAP [ % ]
95.6¢/ $1
WAGE / INCOME GAP [ $ ]
0.37
INEQUALITY / GINI INDEX
565
TOTAL POPULATION
296
MALE POPULATION
269
FEMALE POPULATION
110.04
MALES / 100 FEMALES
90.88
FEMALES / 100 MALES
51.1
MEDIAN AGE
2.9
AVG FAMILY SIZE
2.3
AVG HOUSEHOLD SIZE
229
LABOR FORCE [ PEOPLE ]
49.6%
PERCENT IN LABOR FORCE
2.6%
UNEMPLOYMENT RATE
La Crosse Zip Codes
La Crosse Area Codes
Income in La Crosse
Income Overview in La Crosse
Per Capita Income in La Crosse is $16,926, while median incomes of families and households are $41,094 and $34,306 respectively.
| Characteristic | Number | Measure |
| Per Capita Income | 565 | $16,926 |
| Median Family Income | 123 | $41,094 |
| Mean Family Income | 123 | $48,734 |
| Median Household Income | 227 | $34,306 |
| Mean Household Income | 227 | $43,466 |
| Income Deficit | 123 | $0 |
| Wage / Income Gap (%) | 565 | 4.44% |
| Wage / Income Gap ($) | 565 | 95.56¢ per $1 |
| Gini / Inequality Index | 565 | 0.37 |
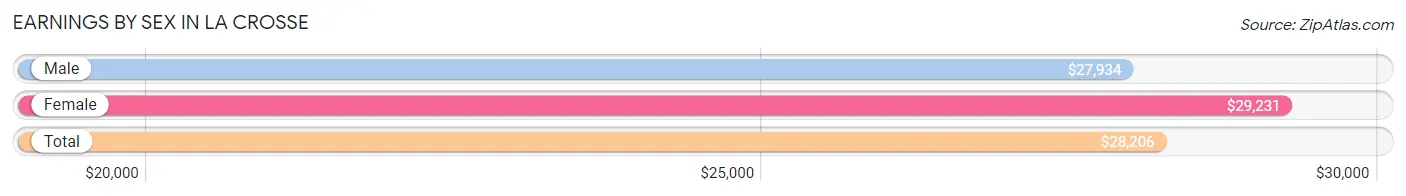
Earnings by Sex in La Crosse
Average Earnings in La Crosse are $28,206, $27,934 for men and $29,231 for women, a difference of 4.4%.
| Sex | Number | Average Earnings |
| Male | 147 (64.2%) | $27,934 |
| Female | 82 (35.8%) | $29,231 |
| Total | 229 (100.0%) | $28,206 |
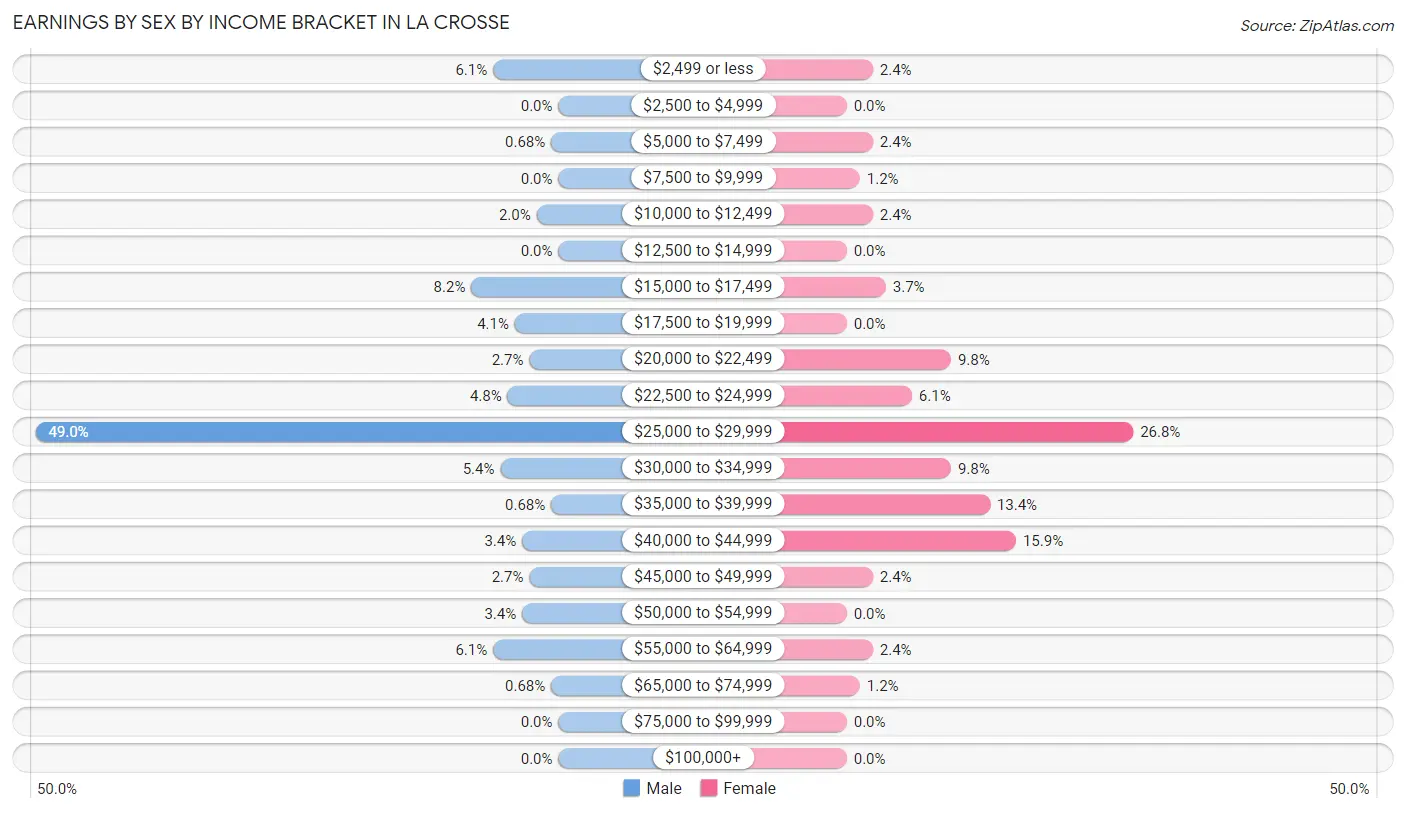
Earnings by Sex by Income Bracket in La Crosse
The most common earnings brackets in La Crosse are $25,000 to $29,999 for men (72 | 49.0%) and $25,000 to $29,999 for women (22 | 26.8%).
| Income | Male | Female |
| $2,499 or less | 9 (6.1%) | 2 (2.4%) |
| $2,500 to $4,999 | 0 (0.0%) | 0 (0.0%) |
| $5,000 to $7,499 | 1 (0.7%) | 2 (2.4%) |
| $7,500 to $9,999 | 0 (0.0%) | 1 (1.2%) |
| $10,000 to $12,499 | 3 (2.0%) | 2 (2.4%) |
| $12,500 to $14,999 | 0 (0.0%) | 0 (0.0%) |
| $15,000 to $17,499 | 12 (8.2%) | 3 (3.7%) |
| $17,500 to $19,999 | 6 (4.1%) | 0 (0.0%) |
| $20,000 to $22,499 | 4 (2.7%) | 8 (9.8%) |
| $22,500 to $24,999 | 7 (4.8%) | 5 (6.1%) |
| $25,000 to $29,999 | 72 (49.0%) | 22 (26.8%) |
| $30,000 to $34,999 | 8 (5.4%) | 8 (9.8%) |
| $35,000 to $39,999 | 1 (0.7%) | 11 (13.4%) |
| $40,000 to $44,999 | 5 (3.4%) | 13 (15.9%) |
| $45,000 to $49,999 | 4 (2.7%) | 2 (2.4%) |
| $50,000 to $54,999 | 5 (3.4%) | 0 (0.0%) |
| $55,000 to $64,999 | 9 (6.1%) | 2 (2.4%) |
| $65,000 to $74,999 | 1 (0.7%) | 1 (1.2%) |
| $75,000 to $99,999 | 0 (0.0%) | 0 (0.0%) |
| $100,000+ | 0 (0.0%) | 0 (0.0%) |
| Total | 147 (100.0%) | 82 (100.0%) |
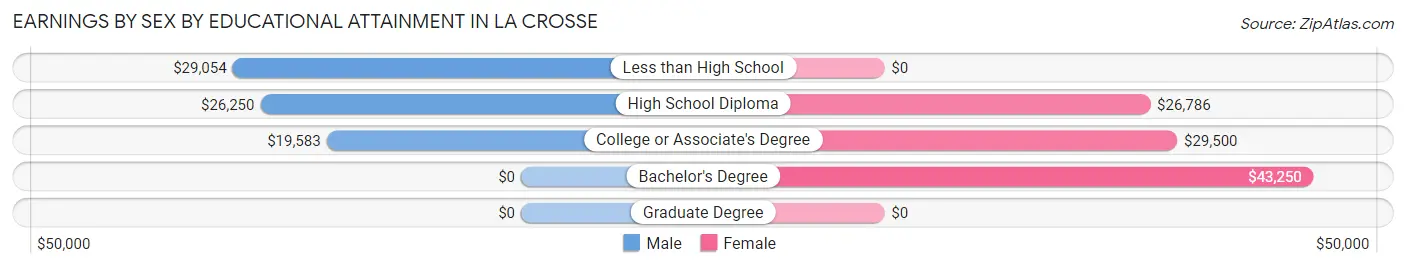
Earnings by Sex by Educational Attainment in La Crosse
Average earnings in La Crosse are $27,832 for men and $32,708 for women, a difference of 14.9%. Men with an educational attainment of less than high school enjoy the highest average annual earnings of $29,054, while those with college or associate's degree education earn the least with $19,583. Women with an educational attainment of bachelor's degree earn the most with the average annual earnings of $43,250, while those with high school diploma education have the smallest earnings of $26,786.
| Educational Attainment | Male Income | Female Income |
| Less than High School | $29,054 | $0 |
| High School Diploma | $26,250 | $26,786 |
| College or Associate's Degree | $19,583 | $29,500 |
| Bachelor's Degree | - | - |
| Graduate Degree | - | - |
| Total | $27,832 | $32,708 |
Family Income in La Crosse
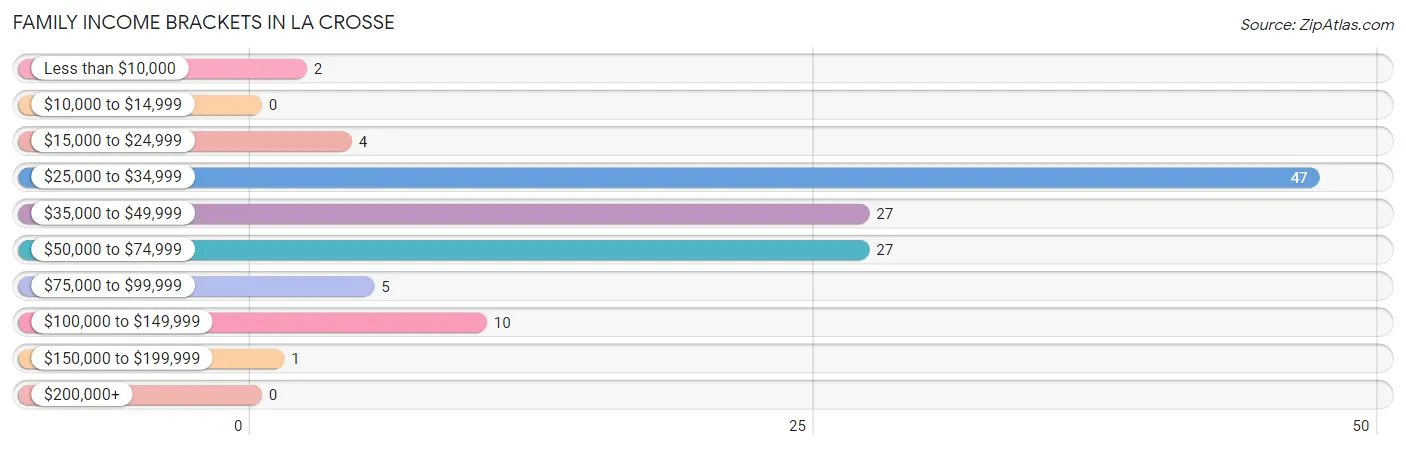
Family Income Brackets in La Crosse
According to the La Crosse family income data, there are 47 families falling into the $25,000 to $34,999 income range, which is the most common income bracket and makes up 38.2% of all families.
| Income Bracket | # Families | % Families |
| Less than $10,000 | 2 | 1.6% |
| $10,000 to $14,999 | 0 | 0.0% |
| $15,000 to $24,999 | 4 | 3.3% |
| $25,000 to $34,999 | 47 | 38.2% |
| $35,000 to $49,999 | 27 | 22.0% |
| $50,000 to $74,999 | 27 | 22.0% |
| $75,000 to $99,999 | 5 | 4.1% |
| $100,000 to $149,999 | 10 | 8.1% |
| $150,000 to $199,999 | 1 | 0.8% |
| $200,000+ | 0 | 0.0% |
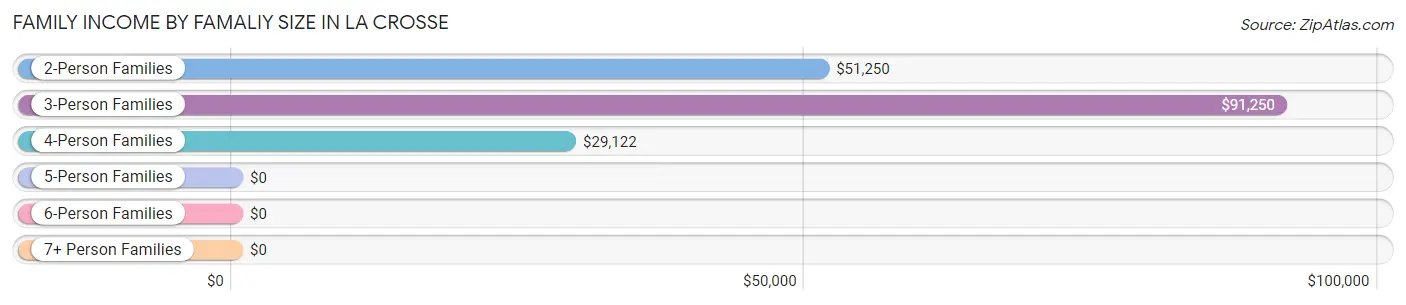
Family Income by Famaliy Size in La Crosse
3-person families (18 | 14.6%) account for the highest median family income in La Crosse with $91,250 per family, while 3-person families (18 | 14.6%) have the highest median income of $30,417 per family member.
| Income Bracket | # Families | Median Income |
| 2-Person Families | 50 (40.6%) | $51,250 |
| 3-Person Families | 18 (14.6%) | $91,250 |
| 4-Person Families | 48 (39.0%) | $29,122 |
| 5-Person Families | 4 (3.3%) | $0 |
| 6-Person Families | 3 (2.4%) | $0 |
| 7+ Person Families | 0 (0.0%) | $0 |
| Total | 123 (100.0%) | $41,094 |
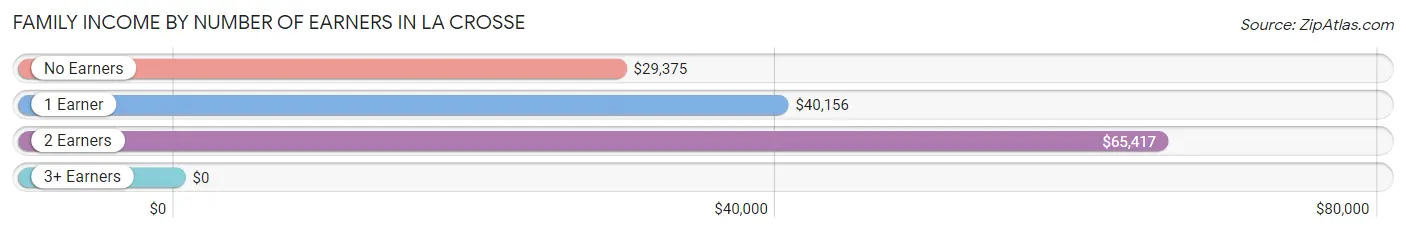
Family Income by Number of Earners in La Crosse
| Number of Earners | # Families | Median Income |
| No Earners | 18 (14.6%) | $29,375 |
| 1 Earner | 77 (62.6%) | $40,156 |
| 2 Earners | 24 (19.5%) | $65,417 |
| 3+ Earners | 4 (3.3%) | $0 |
| Total | 123 (100.0%) | $41,094 |
Household Income in La Crosse
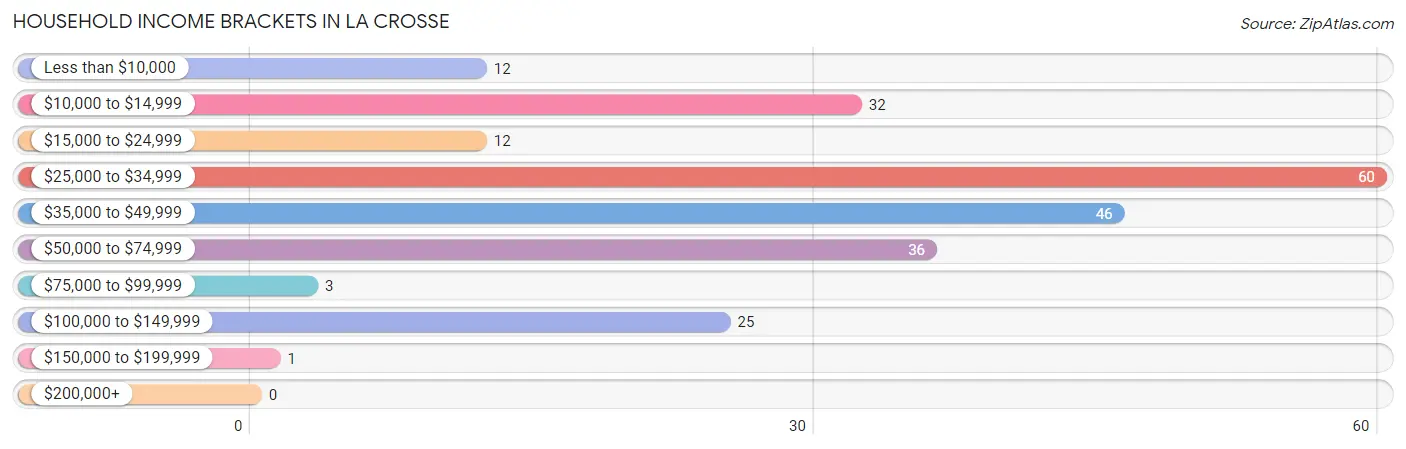
Household Income Brackets in La Crosse
With 60 households falling in the category, the $25,000 to $34,999 income range is the most frequent in La Crosse, accounting for 26.4% of all households.
| Income Bracket | # Households | % Households |
| Less than $10,000 | 12 | 5.3% |
| $10,000 to $14,999 | 32 | 14.1% |
| $15,000 to $24,999 | 12 | 5.3% |
| $25,000 to $34,999 | 60 | 26.4% |
| $35,000 to $49,999 | 46 | 20.3% |
| $50,000 to $74,999 | 36 | 15.9% |
| $75,000 to $99,999 | 3 | 1.3% |
| $100,000 to $149,999 | 25 | 11.0% |
| $150,000 to $199,999 | 1 | 0.4% |
| $200,000+ | 0 | 0.0% |
Household Income by Householder Age in La Crosse
The median household income in La Crosse is $34,306, with the highest median household income of $48,500 found in the 25 to 44 years age bracket for the primary householder. A total of 44 households (19.4%) fall into this category. Meanwhile, the 15 to 24 years age bracket for the primary householder has the lowest median household income of $0, with 9 households (4.0%) in this group.
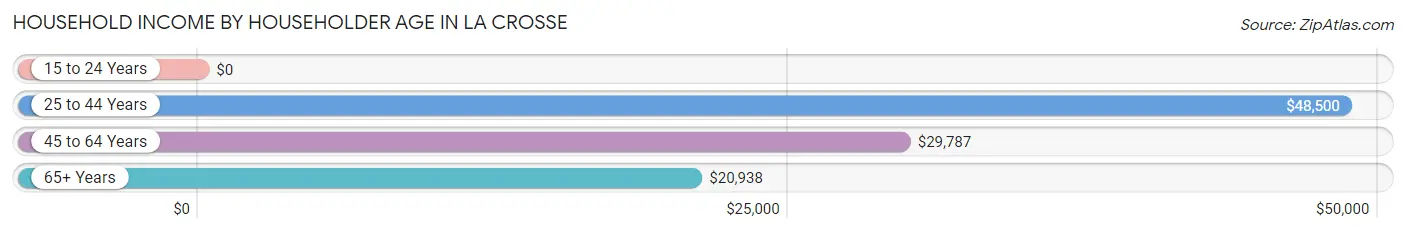
| Income Bracket | # Households | Median Income |
| 15 to 24 Years | 9 (4.0%) | $0 |
| 25 to 44 Years | 44 (19.4%) | $48,500 |
| 45 to 64 Years | 115 (50.7%) | $29,787 |
| 65+ Years | 59 (26.0%) | $20,938 |
| Total | 227 (100.0%) | $34,306 |
Poverty in La Crosse
Income Below Poverty by Sex and Age in La Crosse
With 39.2% poverty level for males and 36.8% for females among the residents of La Crosse, 45 to 54 year old males and 12 to 14 year old females are the most vulnerable to poverty, with 46 males (86.8%) and 39 females (88.6%) in their respective age groups living below the poverty level.
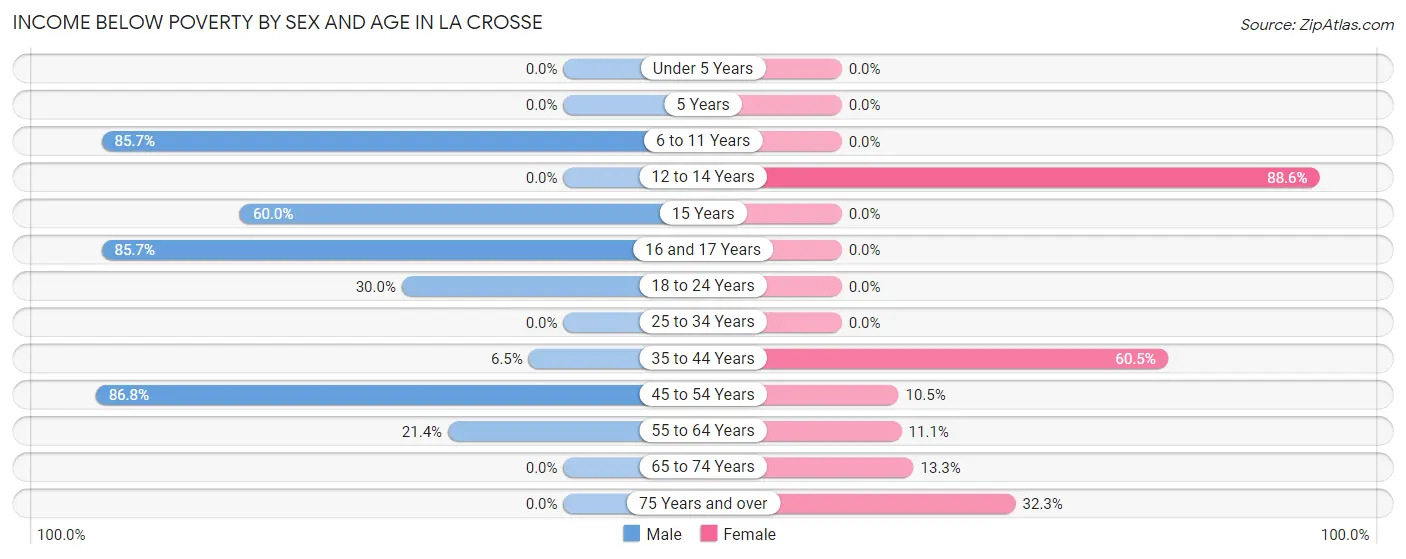
| Age Bracket | Male | Female |
| Under 5 Years | 0 (0.0%) | 0 (0.0%) |
| 5 Years | 0 (0.0%) | 0 (0.0%) |
| 6 to 11 Years | 30 (85.7%) | 0 (0.0%) |
| 12 to 14 Years | 0 (0.0%) | 39 (88.6%) |
| 15 Years | 3 (60.0%) | 0 (0.0%) |
| 16 and 17 Years | 18 (85.7%) | 0 (0.0%) |
| 18 to 24 Years | 3 (30.0%) | 0 (0.0%) |
| 25 to 34 Years | 0 (0.0%) | 0 (0.0%) |
| 35 to 44 Years | 4 (6.5%) | 26 (60.5%) |
| 45 to 54 Years | 46 (86.8%) | 2 (10.5%) |
| 55 to 64 Years | 12 (21.4%) | 6 (11.1%) |
| 65 to 74 Years | 0 (0.0%) | 2 (13.3%) |
| 75 Years and over | 0 (0.0%) | 10 (32.3%) |
| Total | 116 (39.2%) | 85 (36.8%) |
Income Above Poverty by Sex and Age in La Crosse
According to the poverty statistics in La Crosse, males aged under 5 years and females aged under 5 years are the age groups that are most secure financially, with 100.0% of males and 100.0% of females in these age groups living above the poverty line.
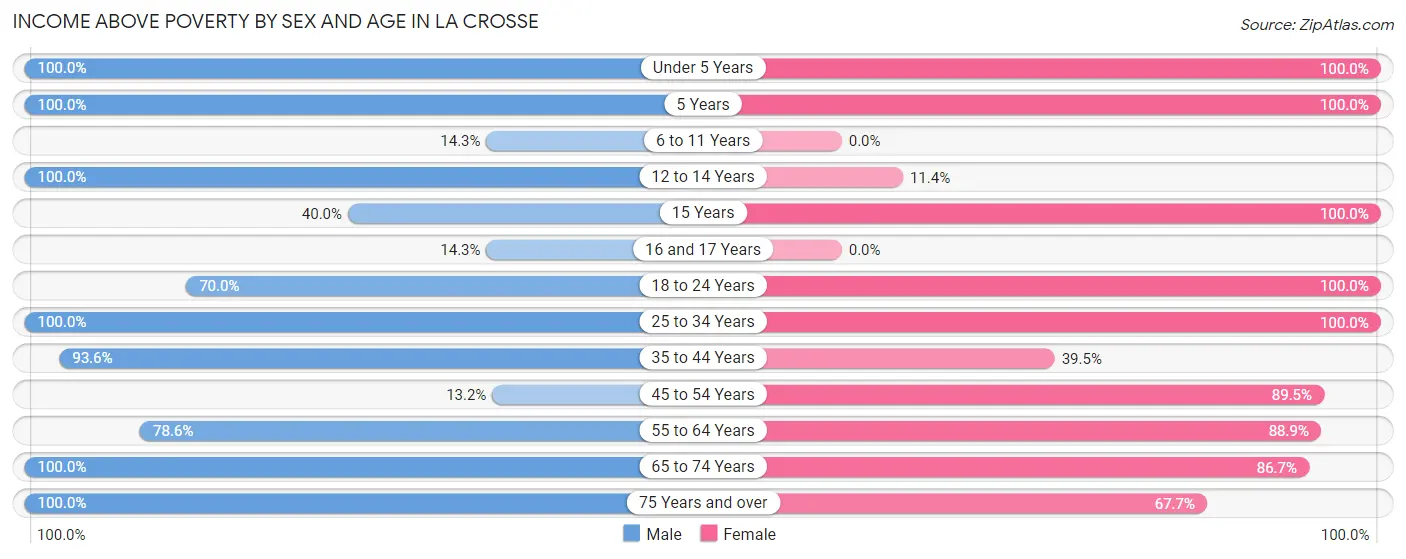
| Age Bracket | Male | Female |
| Under 5 Years | 3 (100.0%) | 2 (100.0%) |
| 5 Years | 2 (100.0%) | 1 (100.0%) |
| 6 to 11 Years | 5 (14.3%) | 0 (0.0%) |
| 12 to 14 Years | 9 (100.0%) | 5 (11.4%) |
| 15 Years | 2 (40.0%) | 2 (100.0%) |
| 16 and 17 Years | 3 (14.3%) | 0 (0.0%) |
| 18 to 24 Years | 7 (70.0%) | 13 (100.0%) |
| 25 to 34 Years | 4 (100.0%) | 7 (100.0%) |
| 35 to 44 Years | 58 (93.5%) | 17 (39.5%) |
| 45 to 54 Years | 7 (13.2%) | 17 (89.5%) |
| 55 to 64 Years | 44 (78.6%) | 48 (88.9%) |
| 65 to 74 Years | 15 (100.0%) | 13 (86.7%) |
| 75 Years and over | 21 (100.0%) | 21 (67.7%) |
| Total | 180 (60.8%) | 146 (63.2%) |
Income Below Poverty Among Married-Couple Families in La Crosse
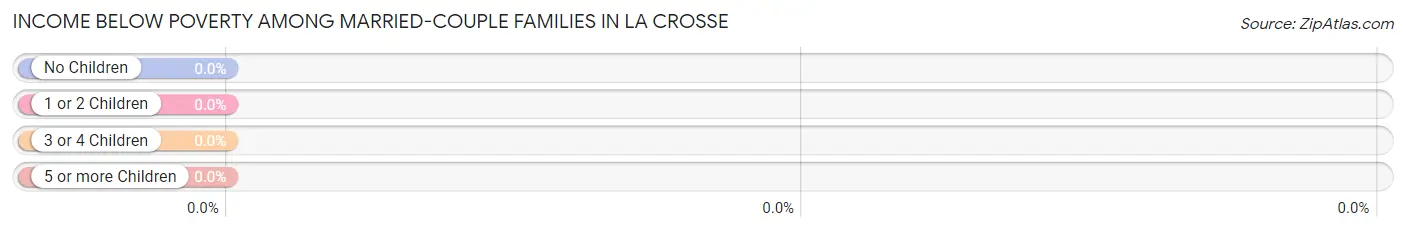
| Children | Above Poverty | Below Poverty |
| No Children | 56 (100.0%) | 0 (0.0%) |
| 1 or 2 Children | 9 (100.0%) | 0 (0.0%) |
| 3 or 4 Children | 4 (100.0%) | 0 (0.0%) |
| 5 or more Children | 0 (0.0%) | 0 (0.0%) |
| Total | 69 (100.0%) | 0 (0.0%) |
Income Below Poverty Among Single-Parent Households in La Crosse
According to the poverty data in La Crosse, 87.2% or 41 single-father households and 28.6% or 2 single-mother households are living below the poverty line. Among single-father households, those with no children have the highest poverty rate, with 4 households (100.0%) experiencing poverty. Likewise, among single-mother households, those with 1 or 2 children have the highest poverty rate, with 2 households (28.6%) falling below the poverty line.
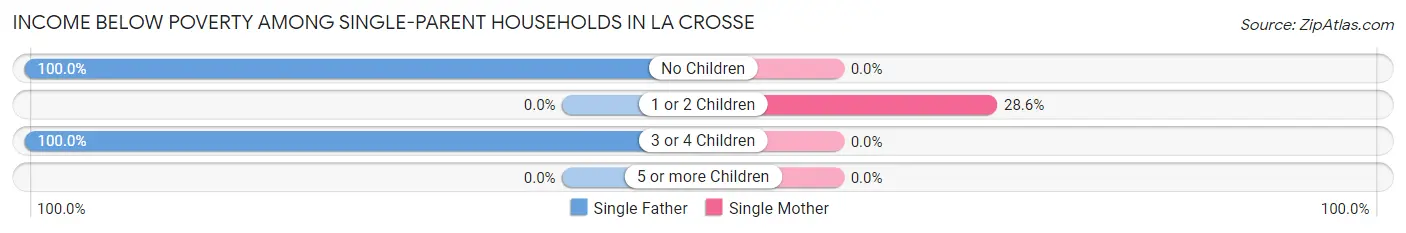
| Children | Single Father | Single Mother |
| No Children | 4 (100.0%) | 0 (0.0%) |
| 1 or 2 Children | 0 (0.0%) | 2 (28.6%) |
| 3 or 4 Children | 37 (100.0%) | 0 (0.0%) |
| 5 or more Children | 0 (0.0%) | 0 (0.0%) |
| Total | 41 (87.2%) | 2 (28.6%) |
Income Below Poverty Among Married-Couple vs Single-Parent Households in La Crosse
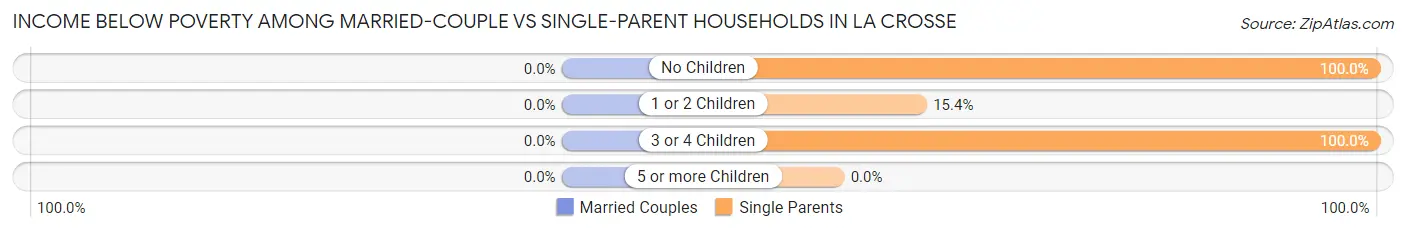
| Children | Married-Couple Families | Single-Parent Households |
| No Children | 0 (0.0%) | 4 (100.0%) |
| 1 or 2 Children | 0 (0.0%) | 2 (15.4%) |
| 3 or 4 Children | 0 (0.0%) | 37 (100.0%) |
| 5 or more Children | 0 (0.0%) | 0 (0.0%) |
| Total | 0 (0.0%) | 43 (79.6%) |
Race in La Crosse
The most populous races in La Crosse are White / Caucasian (372 | 65.8%), Hispanic or Latino (210 | 37.2%), and Black / African American (134 | 23.7%).
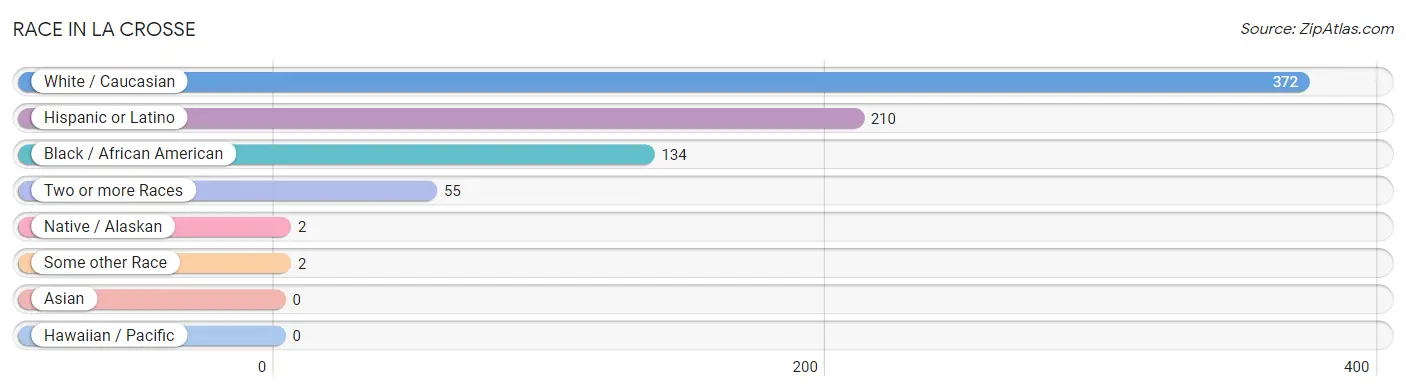
| Race | # Population | % Population |
| Asian | 0 | 0.0% |
| Black / African American | 134 | 23.7% |
| Hawaiian / Pacific | 0 | 0.0% |
| Hispanic or Latino | 210 | 37.2% |
| Native / Alaskan | 2 | 0.4% |
| White / Caucasian | 372 | 65.8% |
| Two or more Races | 55 | 9.7% |
| Some other Race | 2 | 0.4% |
| Total | 565 | 100.0% |
Ancestry in La Crosse
The most populous ancestries reported in La Crosse are Mexican (205 | 36.3%), American (141 | 25.0%), English (44 | 7.8%), Irish (17 | 3.0%), and German (8 | 1.4%), together accounting for 73.5% of all La Crosse residents.
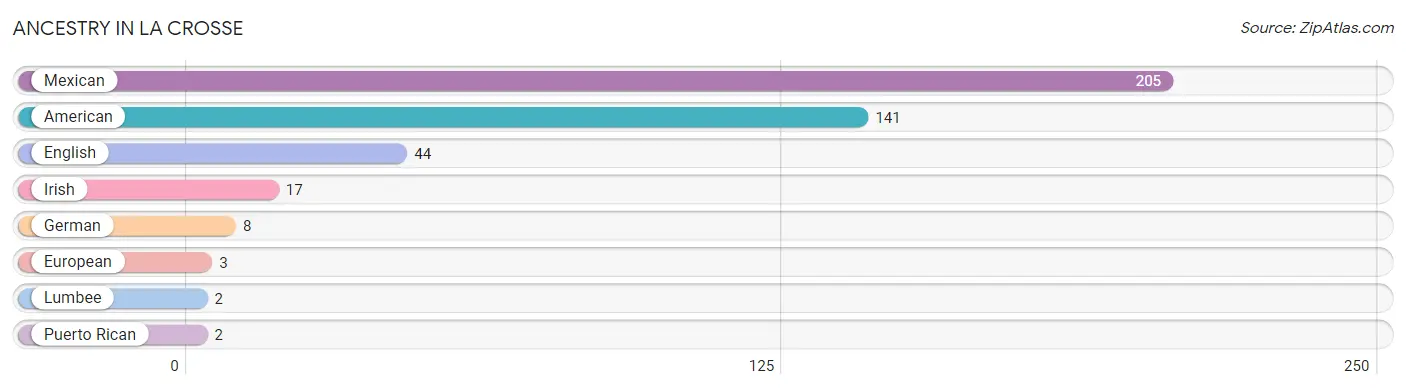
| Ancestry | # Population | % Population |
| American | 141 | 25.0% |
| English | 44 | 7.8% |
| European | 3 | 0.5% |
| German | 8 | 1.4% |
| Irish | 17 | 3.0% |
| Lumbee | 2 | 0.4% |
| Mexican | 205 | 36.3% |
| Puerto Rican | 2 | 0.4% | View All 8 Rows |
Immigrants in La Crosse
The most numerous immigrant groups reported in La Crosse came from Central America (90 | 15.9%), Latin America (90 | 15.9%), Mexico (68 | 12.0%), Guatemala (19 | 3.4%), and Honduras (3 | 0.5%), together accounting for 47.8% of all La Crosse residents.
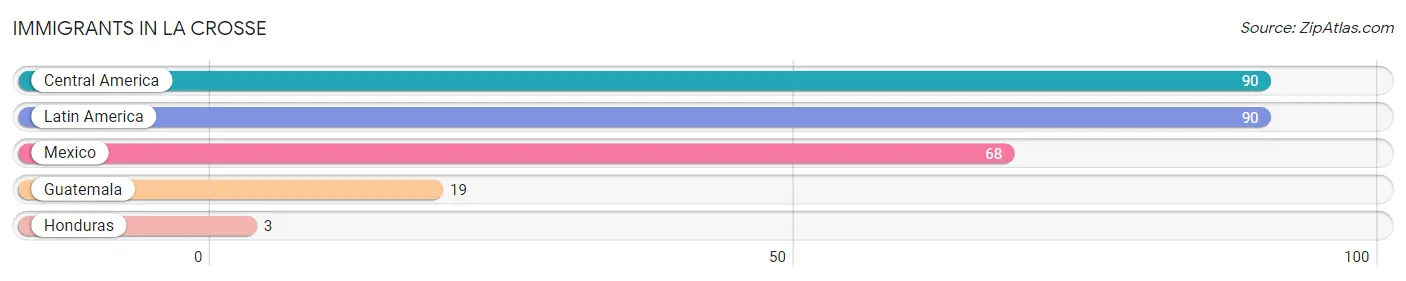
| Immigration Origin | # Population | % Population |
| Central America | 90 | 15.9% |
| Guatemala | 19 | 3.4% |
| Honduras | 3 | 0.5% |
| Latin America | 90 | 15.9% |
| Mexico | 68 | 12.0% | View All 5 Rows |
Sex and Age in La Crosse
Sex and Age in La Crosse
The most populous age groups in La Crosse are 50 to 54 Years (51 | 17.2%) for men and 10 to 14 Years (44 | 16.4%) for women.
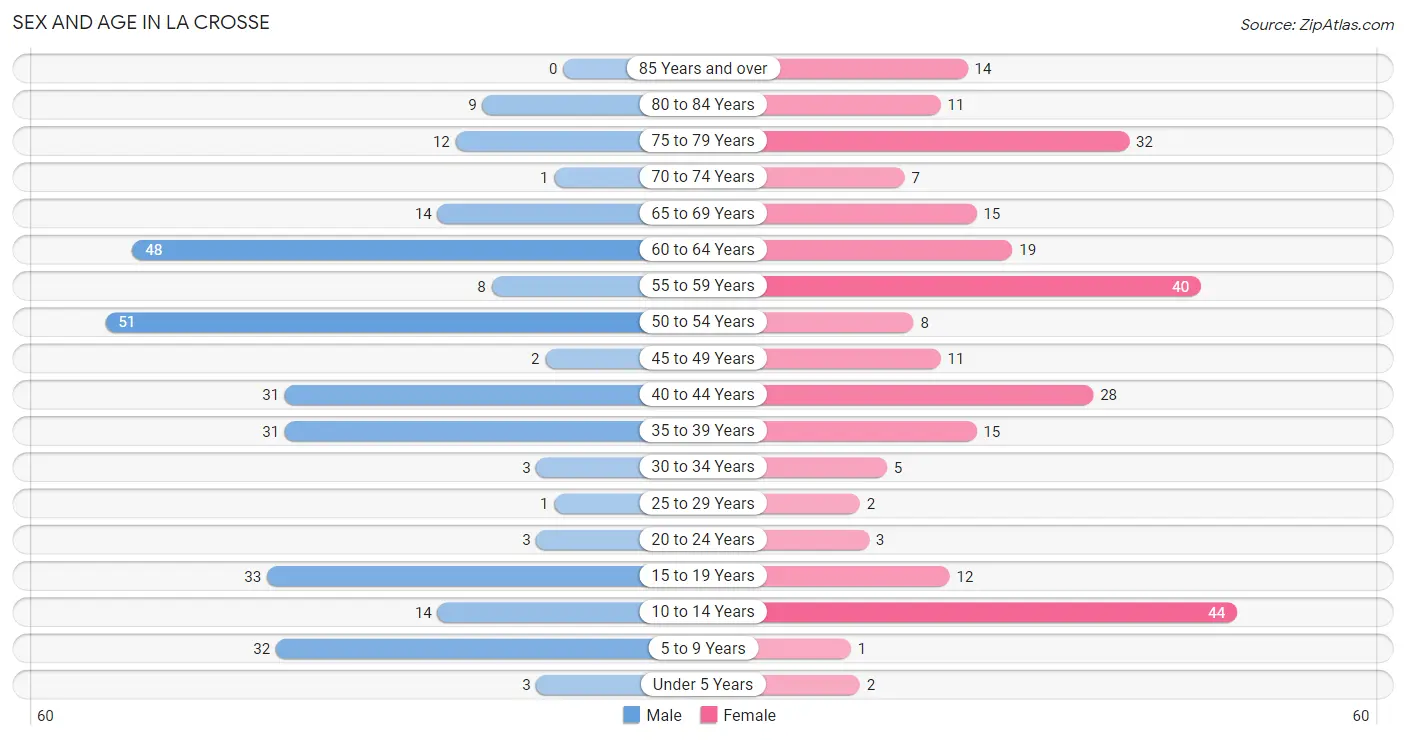
| Age Bracket | Male | Female |
| Under 5 Years | 3 (1.0%) | 2 (0.7%) |
| 5 to 9 Years | 32 (10.8%) | 1 (0.4%) |
| 10 to 14 Years | 14 (4.7%) | 44 (16.4%) |
| 15 to 19 Years | 33 (11.2%) | 12 (4.5%) |
| 20 to 24 Years | 3 (1.0%) | 3 (1.1%) |
| 25 to 29 Years | 1 (0.3%) | 2 (0.7%) |
| 30 to 34 Years | 3 (1.0%) | 5 (1.9%) |
| 35 to 39 Years | 31 (10.5%) | 15 (5.6%) |
| 40 to 44 Years | 31 (10.5%) | 28 (10.4%) |
| 45 to 49 Years | 2 (0.7%) | 11 (4.1%) |
| 50 to 54 Years | 51 (17.2%) | 8 (3.0%) |
| 55 to 59 Years | 8 (2.7%) | 40 (14.9%) |
| 60 to 64 Years | 48 (16.2%) | 19 (7.1%) |
| 65 to 69 Years | 14 (4.7%) | 15 (5.6%) |
| 70 to 74 Years | 1 (0.3%) | 7 (2.6%) |
| 75 to 79 Years | 12 (4.1%) | 32 (11.9%) |
| 80 to 84 Years | 9 (3.0%) | 11 (4.1%) |
| 85 Years and over | 0 (0.0%) | 14 (5.2%) |
| Total | 296 (100.0%) | 269 (100.0%) |
Families and Households in La Crosse
Median Family Size in La Crosse
The median family size in La Crosse is 2.88 persons per family, with single female/mother families (7 | 5.7%) accounting for the largest median family size of 3.57 persons per family. On the other hand, married-couple families (69 | 56.1%) represent the smallest median family size with 2.46 persons per family.
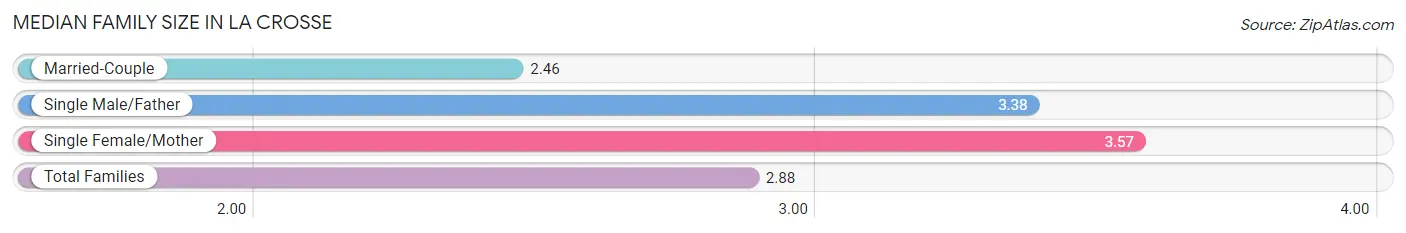
| Family Type | # Families | Family Size |
| Married-Couple | 69 (56.1%) | 2.46 |
| Single Male/Father | 47 (38.2%) | 3.38 |
| Single Female/Mother | 7 (5.7%) | 3.57 |
| Total Families | 123 (100.0%) | 2.88 |
Median Household Size in La Crosse
The median household size in La Crosse is 2.32 persons per household, with single male/father households (47 | 20.7%) accounting for the largest median household size of 3.91 persons per household. non-family households (104 | 45.8%) represent the smallest median household size with 1.41 persons per household.
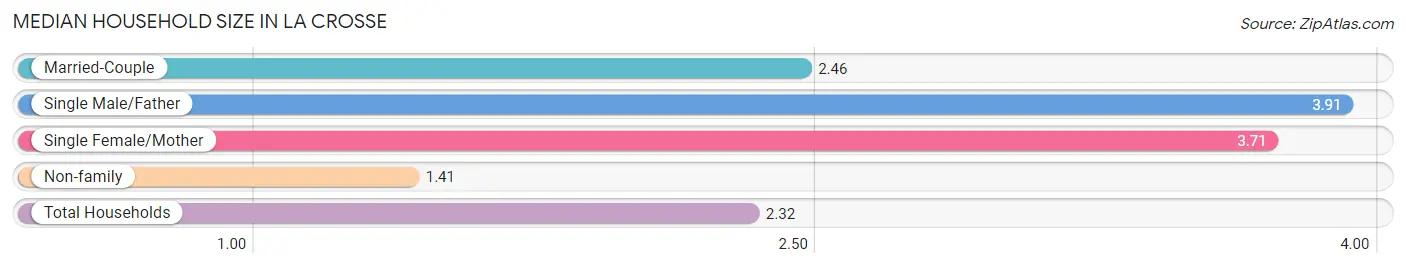
| Household Type | # Households | Household Size |
| Married-Couple | 69 (30.4%) | 2.46 |
| Single Male/Father | 47 (20.7%) | 3.91 |
| Single Female/Mother | 7 (3.1%) | 3.71 |
| Non-family | 104 (45.8%) | 1.41 |
| Total Households | 227 (100.0%) | 2.32 |
Household Size by Marriage Status in La Crosse
Out of a total of 227 households in La Crosse, 123 (54.2%) are family households, while 104 (45.8%) are nonfamily households. The most numerous type of family households are 2-person households, comprising 50, and the most common type of nonfamily households are 1-person households, comprising 75.
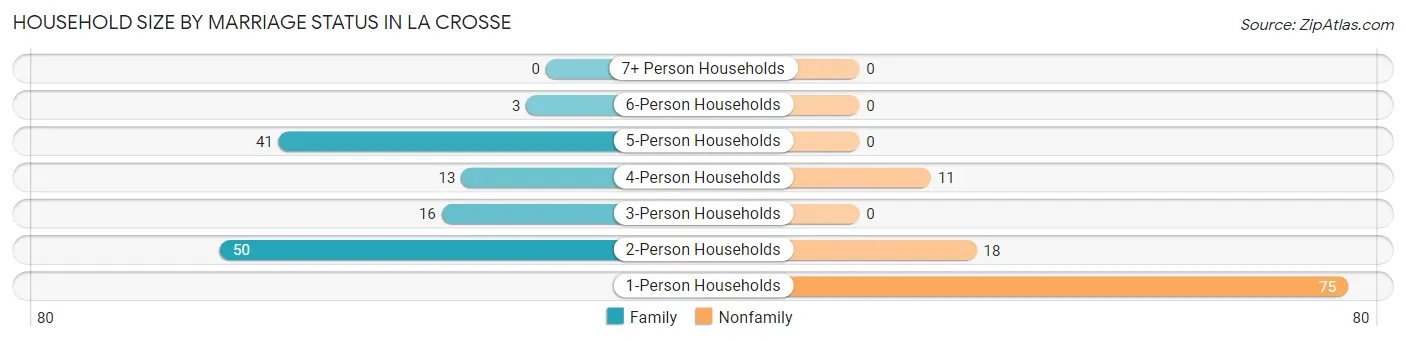
| Household Size | Family Households | Nonfamily Households |
| 1-Person Households | - | 75 (33.0%) |
| 2-Person Households | 50 (22.0%) | 18 (7.9%) |
| 3-Person Households | 16 (7.0%) | 0 (0.0%) |
| 4-Person Households | 13 (5.7%) | 11 (4.9%) |
| 5-Person Households | 41 (18.1%) | 0 (0.0%) |
| 6-Person Households | 3 (1.3%) | 0 (0.0%) |
| 7+ Person Households | 0 (0.0%) | 0 (0.0%) |
| Total | 123 (54.2%) | 104 (45.8%) |
Female Fertility in La Crosse
Fertility by Age in La Crosse
Average fertility rate in La Crosse is 53.0 births per 1,000 women. Women in the age bracket of 20 to 34 years have the highest fertility rate with 200.0 births per 1,000 women. Women in the age bracket of 20 to 34 years acount for 50.0% of all women with births.
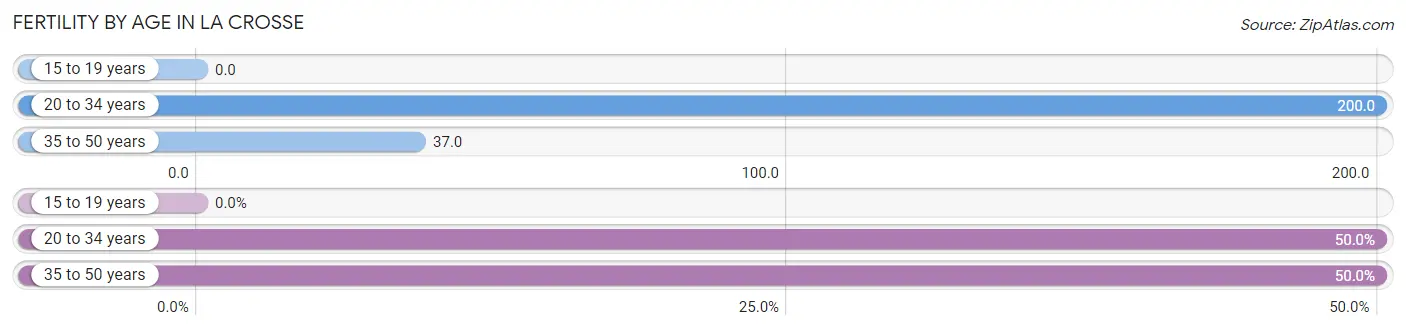
| Age Bracket | Women with Births | Births / 1,000 Women |
| 15 to 19 years | 0 (0.0%) | 0.0 |
| 20 to 34 years | 2 (50.0%) | 200.0 |
| 35 to 50 years | 2 (50.0%) | 37.0 |
| Total | 4 (100.0%) | 53.0 |
Fertility by Age by Marriage Status in La Crosse
50.0% of women with births (4) in La Crosse are married. The highest percentage of unmarried women with births falls into 35 to 50 years age bracket with 100.0% of them unmarried at the time of birth, while the lowest percentage of unmarried women with births belong to 20 to 34 years age bracket with 0.0% of them unmarried.
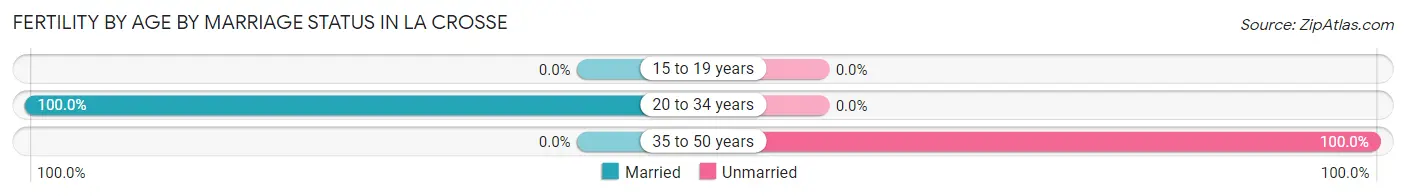
| Age Bracket | Married | Unmarried |
| 15 to 19 years | 0 (0.0%) | 0 (0.0%) |
| 20 to 34 years | 2 (100.0%) | 0 (0.0%) |
| 35 to 50 years | 0 (0.0%) | 2 (100.0%) |
| Total | 2 (50.0%) | 2 (50.0%) |
Fertility by Education in La Crosse
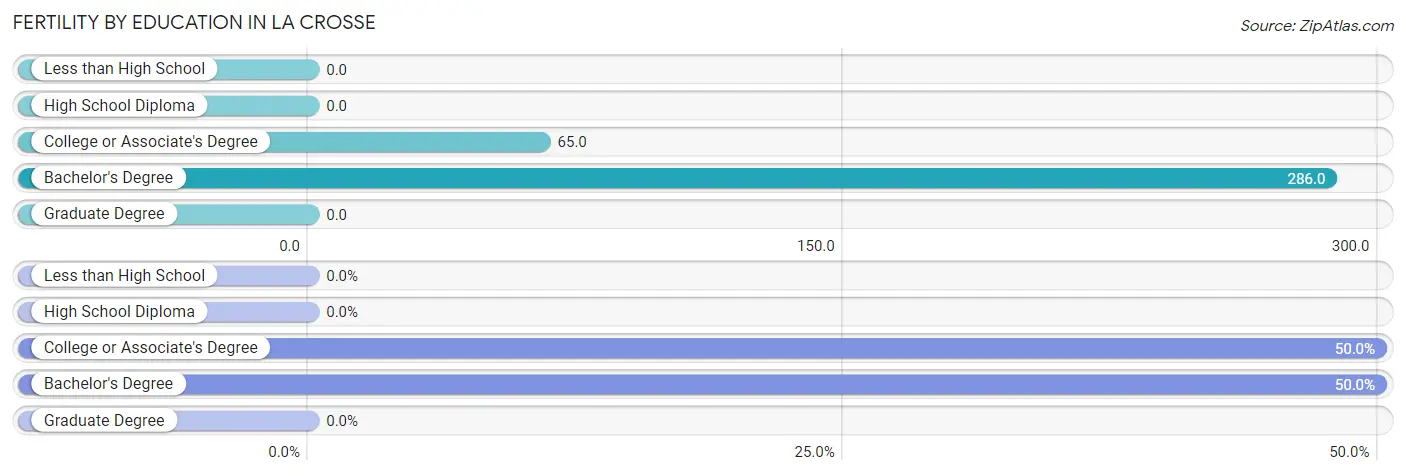
| Educational Attainment | Women with Births | Births / 1,000 Women |
| Less than High School | 0 (0.0%) | 0.0 |
| High School Diploma | 0 (0.0%) | 0.0 |
| College or Associate's Degree | 2 (50.0%) | 65.0 |
| Bachelor's Degree | 2 (50.0%) | 286.0 |
| Graduate Degree | 0 (0.0%) | 0.0 |
| Total | 4 (100.0%) | 53.0 |
Fertility by Education by Marriage Status in La Crosse
50.0% of women with births in La Crosse are unmarried. Women with the educational attainment of bachelor's degree are most likely to be married with 100.0% of them married at childbirth, while women with the educational attainment of college or associate's degree are least likely to be married with 100.0% of them unmarried at childbirth.
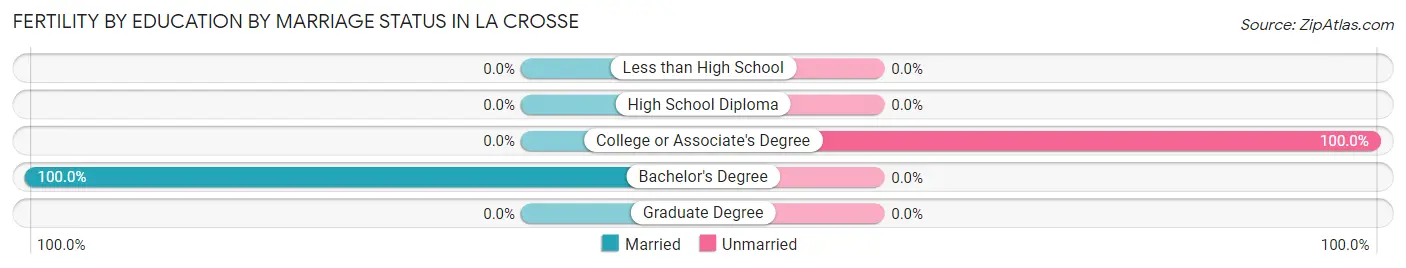
| Educational Attainment | Married | Unmarried |
| Less than High School | 0 (0.0%) | 0 (0.0%) |
| High School Diploma | 0 (0.0%) | 0 (0.0%) |
| College or Associate's Degree | 0 (0.0%) | 2 (100.0%) |
| Bachelor's Degree | 2 (100.0%) | 0 (0.0%) |
| Graduate Degree | 0 (0.0%) | 0 (0.0%) |
| Total | 2 (50.0%) | 2 (50.0%) |
Employment Characteristics in La Crosse
Employment by Class of Employer in La Crosse
Among the 223 employed individuals in La Crosse, private company employees (170 | 76.2%), local government employees (15 | 6.7%), and state government employees (13 | 5.8%) make up the most common classes of employment.
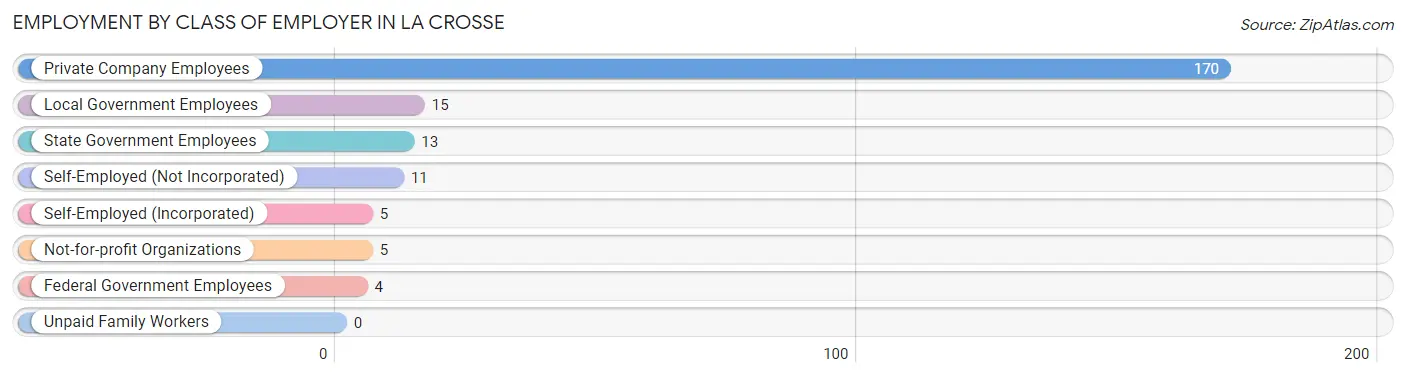
| Employer Class | # Employees | % Employees |
| Private Company Employees | 170 | 76.2% |
| Self-Employed (Incorporated) | 5 | 2.2% |
| Self-Employed (Not Incorporated) | 11 | 4.9% |
| Not-for-profit Organizations | 5 | 2.2% |
| Local Government Employees | 15 | 6.7% |
| State Government Employees | 13 | 5.8% |
| Federal Government Employees | 4 | 1.8% |
| Unpaid Family Workers | 0 | 0.0% |
| Total | 223 | 100.0% |
Employment Status by Age in La Crosse
According to the labor force statistics for La Crosse, out of the total population over 16 years of age (462), 49.6% or 229 individuals are in the labor force, with 2.6% or 6 of them unemployed. The age group with the highest labor force participation rate is 20 to 24 years, with 100.0% or 6 individuals in the labor force. Within the labor force, the 30 to 34 years age range has the highest percentage of unemployed individuals, with 25.0% or 2 of them being unemployed.
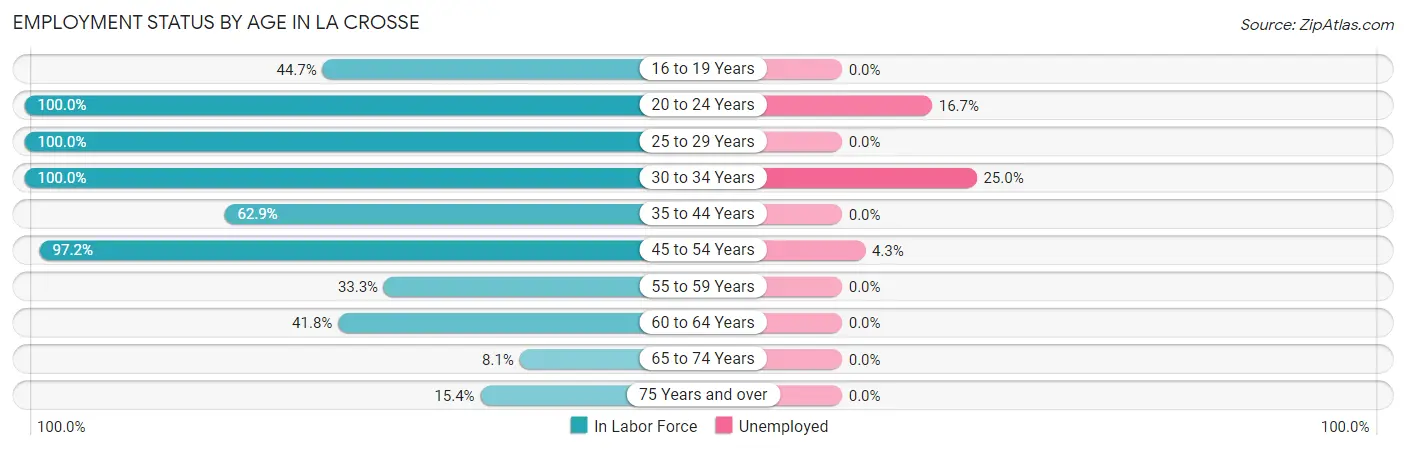
| Age Bracket | In Labor Force | Unemployed |
| 16 to 19 Years | 17 (44.7%) | 0 (0.0%) |
| 20 to 24 Years | 6 (100.0%) | 1 (16.7%) |
| 25 to 29 Years | 3 (100.0%) | 0 (0.0%) |
| 30 to 34 Years | 8 (100.0%) | 2 (25.0%) |
| 35 to 44 Years | 66 (62.9%) | 0 (0.0%) |
| 45 to 54 Years | 70 (97.2%) | 3 (4.3%) |
| 55 to 59 Years | 16 (33.3%) | 0 (0.0%) |
| 60 to 64 Years | 28 (41.8%) | 0 (0.0%) |
| 65 to 74 Years | 3 (8.1%) | 0 (0.0%) |
| 75 Years and over | 12 (15.4%) | 0 (0.0%) |
| Total | 229 (49.6%) | 6 (2.6%) |
Employment Status by Educational Attainment in La Crosse
According to labor force statistics for La Crosse, 63.0% of individuals (191) out of the total population between 25 and 64 years of age (303) are in the labor force, with 2.6% or 5 of them being unemployed. The group with the highest labor force participation rate are those with the educational attainment of high school diploma, with 66.4% or 75 individuals in the labor force. Within the labor force, individuals with high school diploma education have the highest percentage of unemployment, with 6.7% or 5 of them being unemployed.
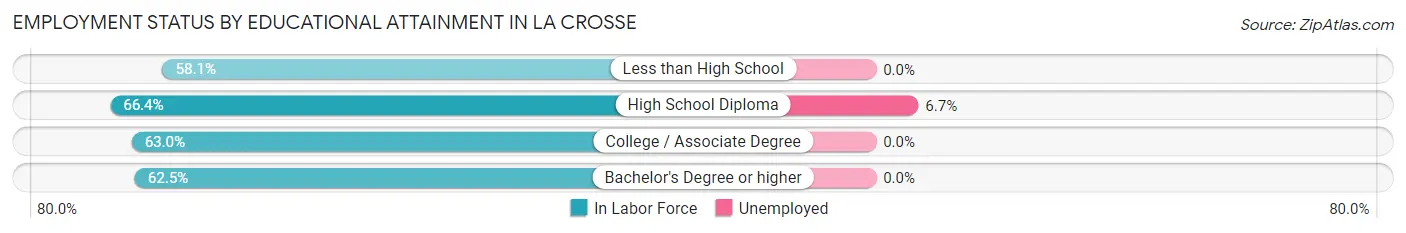
| Educational Attainment | In Labor Force | Unemployed |
| Less than High School | 43 (58.1%) | 0 (0.0%) |
| High School Diploma | 75 (66.4%) | 8 (6.7%) |
| College / Associate Degree | 58 (63.0%) | 0 (0.0%) |
| Bachelor's Degree or higher | 15 (62.5%) | 0 (0.0%) |
| Total | 191 (63.0%) | 8 (2.6%) |
Employment Occupations by Sex in La Crosse
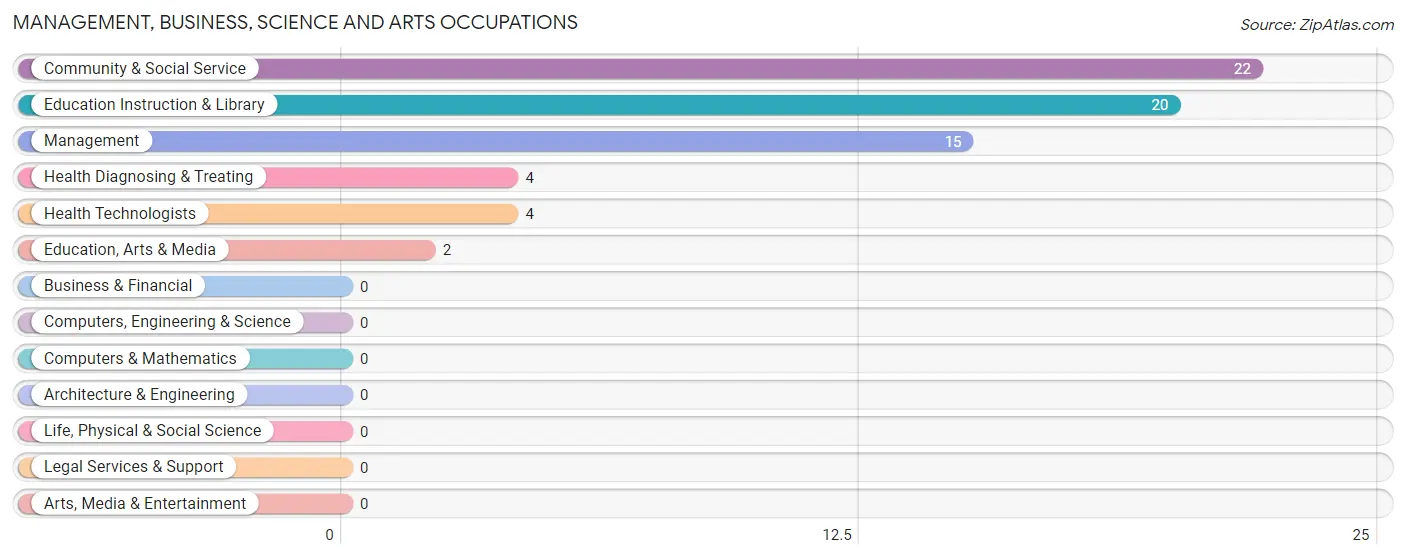
Management, Business, Science and Arts Occupations
The most common Management, Business, Science and Arts occupations in La Crosse are Community & Social Service (22 | 9.9%), Education Instruction & Library (20 | 9.0%), Management (15 | 6.7%), Health Diagnosing & Treating (4 | 1.8%), and Health Technologists (4 | 1.8%).
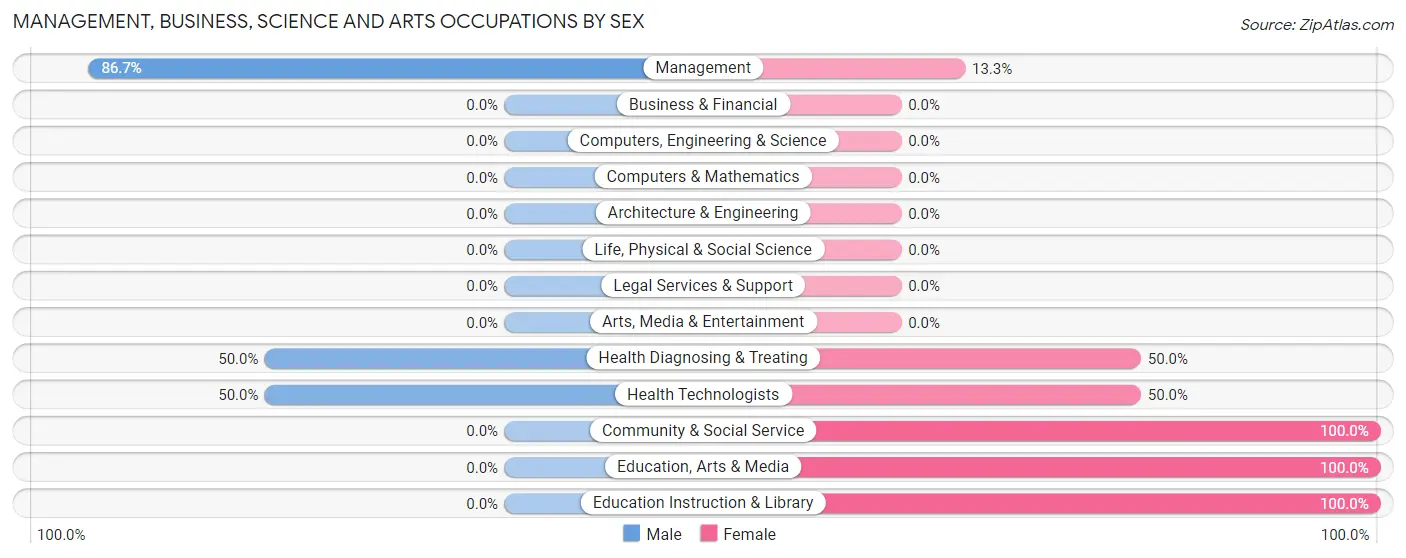
Management, Business, Science and Arts Occupations by Sex
Within the Management, Business, Science and Arts occupations in La Crosse, the most male-oriented occupations are Management (86.7%), Health Diagnosing & Treating (50.0%), and Health Technologists (50.0%), while the most female-oriented occupations are Community & Social Service (100.0%), Education, Arts & Media (100.0%), and Education Instruction & Library (100.0%).
| Occupation | Male | Female |
| Management | 13 (86.7%) | 2 (13.3%) |
| Business & Financial | 0 (0.0%) | 0 (0.0%) |
| Computers, Engineering & Science | 0 (0.0%) | 0 (0.0%) |
| Computers & Mathematics | 0 (0.0%) | 0 (0.0%) |
| Architecture & Engineering | 0 (0.0%) | 0 (0.0%) |
| Life, Physical & Social Science | 0 (0.0%) | 0 (0.0%) |
| Community & Social Service | 0 (0.0%) | 22 (100.0%) |
| Education, Arts & Media | 0 (0.0%) | 2 (100.0%) |
| Legal Services & Support | 0 (0.0%) | 0 (0.0%) |
| Education Instruction & Library | 0 (0.0%) | 20 (100.0%) |
| Arts, Media & Entertainment | 0 (0.0%) | 0 (0.0%) |
| Health Diagnosing & Treating | 2 (50.0%) | 2 (50.0%) |
| Health Technologists | 2 (50.0%) | 2 (50.0%) |
| Total (Category) | 15 (36.6%) | 26 (63.4%) |
| Total (Overall) | 142 (63.7%) | 81 (36.3%) |
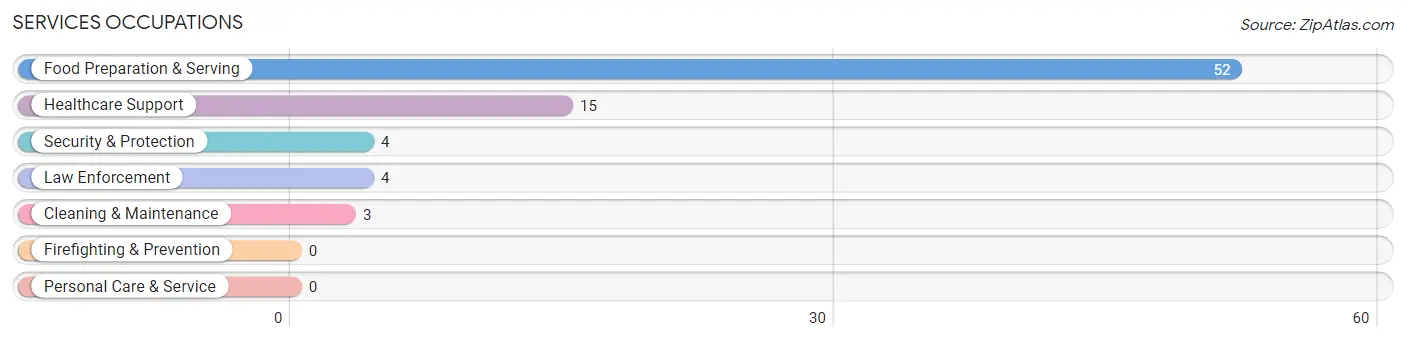
Services Occupations
The most common Services occupations in La Crosse are Food Preparation & Serving (52 | 23.3%), Healthcare Support (15 | 6.7%), Security & Protection (4 | 1.8%), Law Enforcement (4 | 1.8%), and Cleaning & Maintenance (3 | 1.3%).
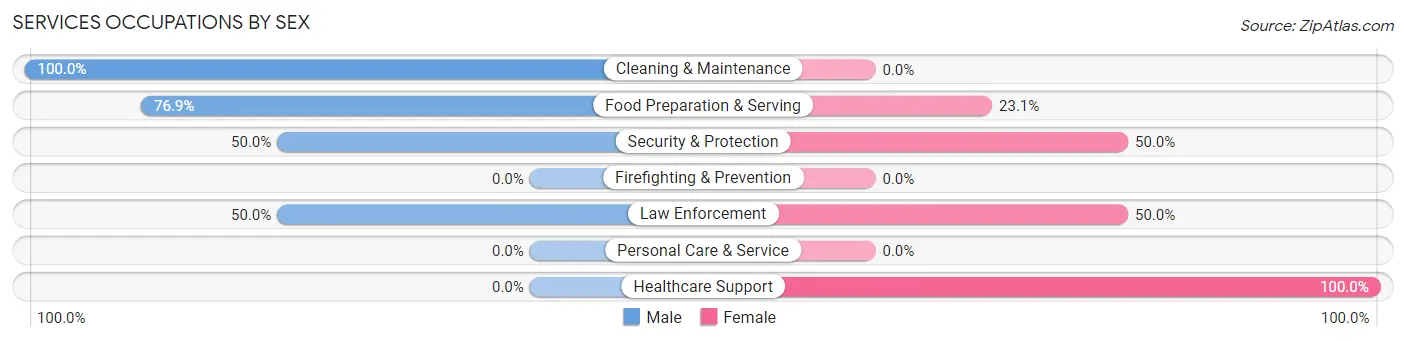
Services Occupations by Sex
Within the Services occupations in La Crosse, the most male-oriented occupations are Cleaning & Maintenance (100.0%), Food Preparation & Serving (76.9%), and Security & Protection (50.0%), while the most female-oriented occupations are Healthcare Support (100.0%), Security & Protection (50.0%), and Law Enforcement (50.0%).
| Occupation | Male | Female |
| Healthcare Support | 0 (0.0%) | 15 (100.0%) |
| Security & Protection | 2 (50.0%) | 2 (50.0%) |
| Firefighting & Prevention | 0 (0.0%) | 0 (0.0%) |
| Law Enforcement | 2 (50.0%) | 2 (50.0%) |
| Food Preparation & Serving | 40 (76.9%) | 12 (23.1%) |
| Cleaning & Maintenance | 3 (100.0%) | 0 (0.0%) |
| Personal Care & Service | 0 (0.0%) | 0 (0.0%) |
| Total (Category) | 45 (60.8%) | 29 (39.2%) |
| Total (Overall) | 142 (63.7%) | 81 (36.3%) |
Sales and Office Occupations
The most common Sales and Office occupations in La Crosse are Office & Administration (13 | 5.8%), and Sales & Related (9 | 4.0%).
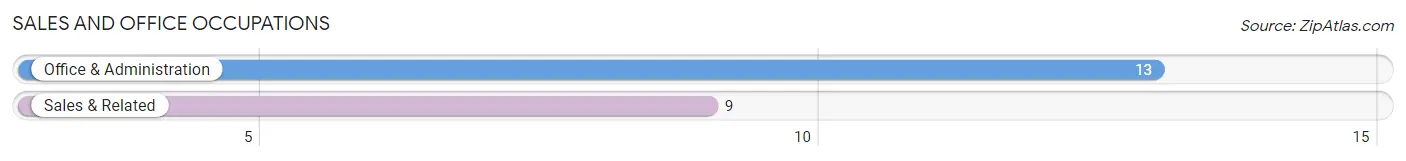
Sales and Office Occupations by Sex
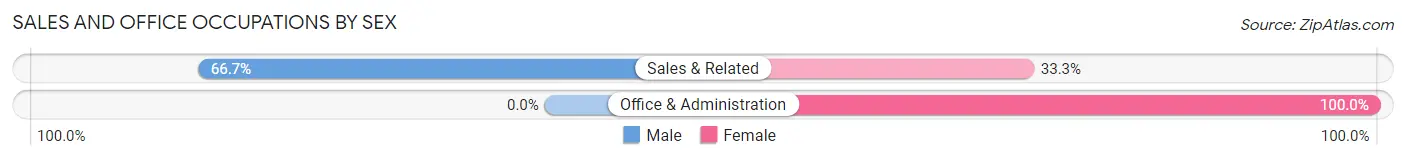
| Occupation | Male | Female |
| Sales & Related | 6 (66.7%) | 3 (33.3%) |
| Office & Administration | 0 (0.0%) | 13 (100.0%) |
| Total (Category) | 6 (27.3%) | 16 (72.7%) |
| Total (Overall) | 142 (63.7%) | 81 (36.3%) |
Natural Resources, Construction and Maintenance Occupations
The most common Natural Resources, Construction and Maintenance occupations in La Crosse are Farming, Fishing & Forestry (3 | 1.3%), Construction & Extraction (3 | 1.3%), and Installation, Maintenance & Repair (3 | 1.3%).
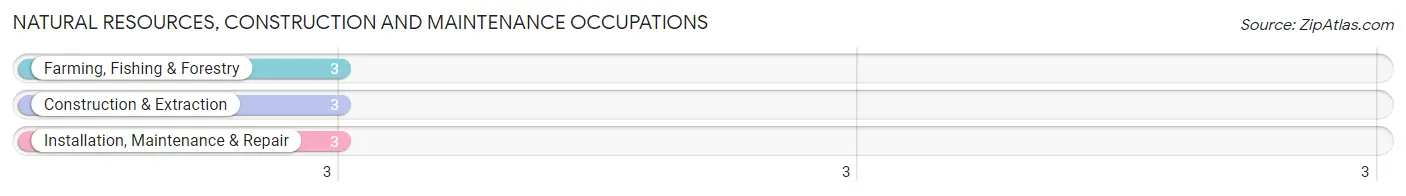
Natural Resources, Construction and Maintenance Occupations by Sex
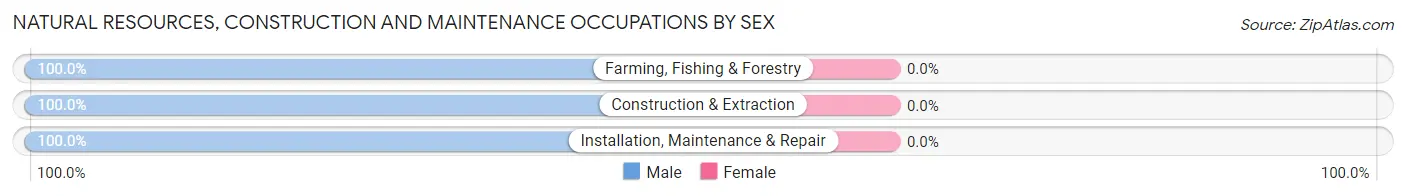
| Occupation | Male | Female |
| Farming, Fishing & Forestry | 3 (100.0%) | 0 (0.0%) |
| Construction & Extraction | 3 (100.0%) | 0 (0.0%) |
| Installation, Maintenance & Repair | 3 (100.0%) | 0 (0.0%) |
| Total (Category) | 9 (100.0%) | 0 (0.0%) |
| Total (Overall) | 142 (63.7%) | 81 (36.3%) |
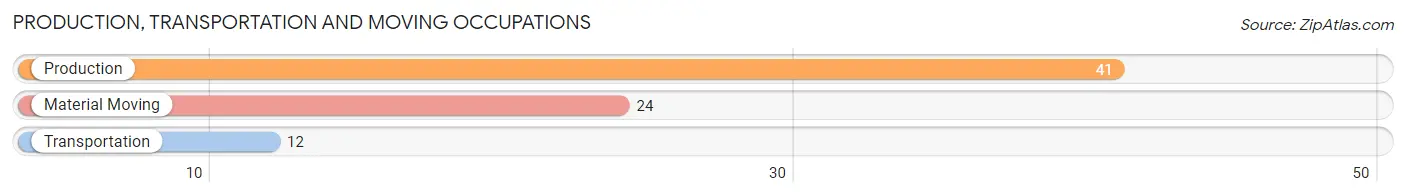
Production, Transportation and Moving Occupations
The most common Production, Transportation and Moving occupations in La Crosse are Production (41 | 18.4%), Material Moving (24 | 10.8%), and Transportation (12 | 5.4%).
Production, Transportation and Moving Occupations by Sex
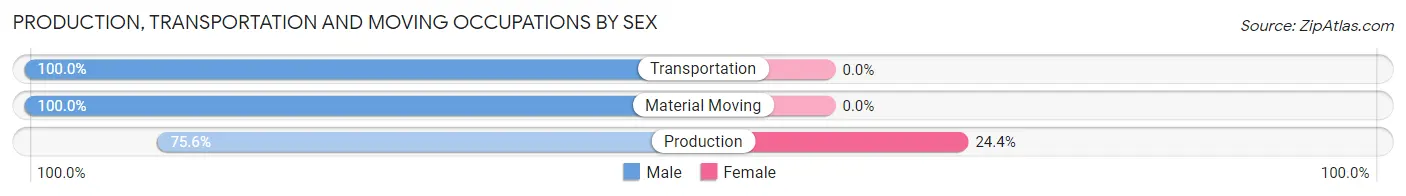
| Occupation | Male | Female |
| Production | 31 (75.6%) | 10 (24.4%) |
| Transportation | 12 (100.0%) | 0 (0.0%) |
| Material Moving | 24 (100.0%) | 0 (0.0%) |
| Total (Category) | 67 (87.0%) | 10 (13.0%) |
| Total (Overall) | 142 (63.7%) | 81 (36.3%) |
Employment Industries by Sex in La Crosse
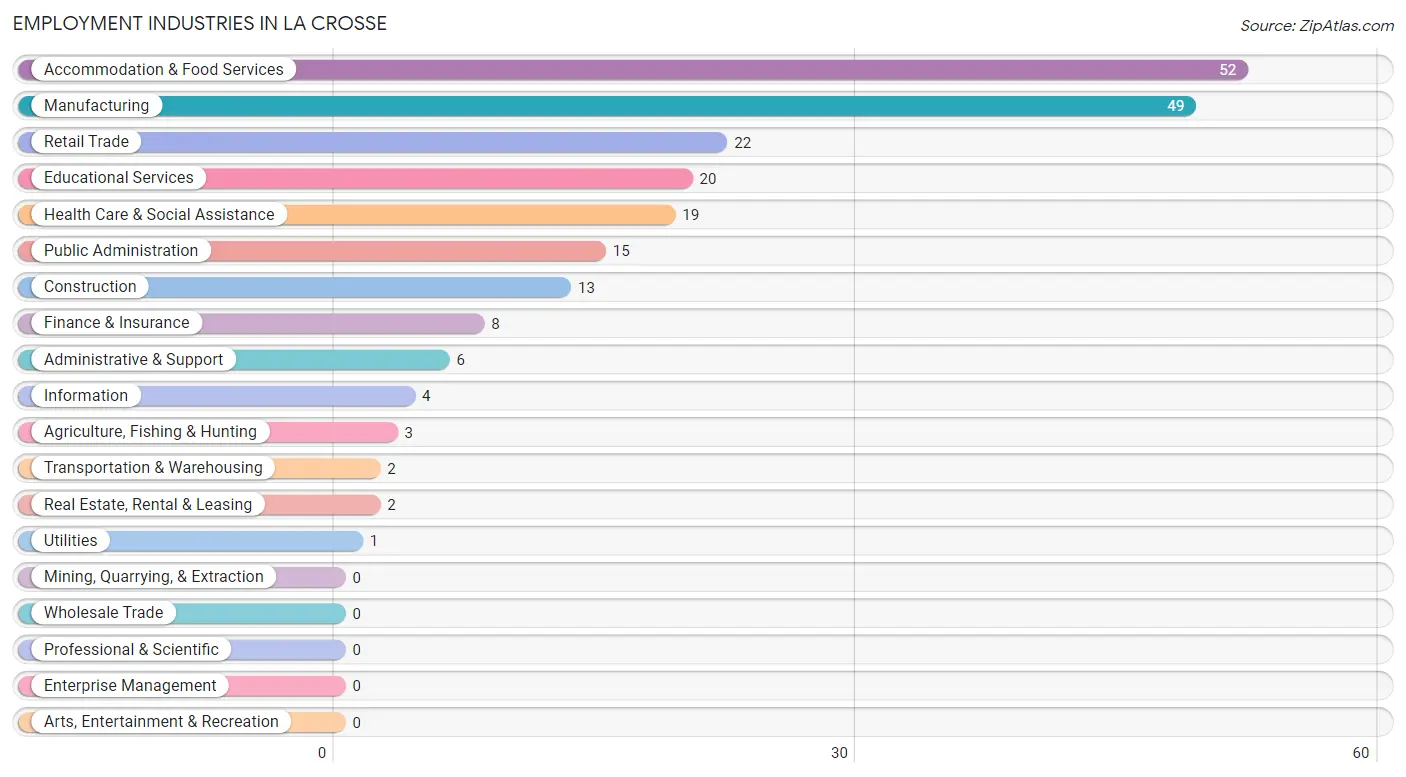
Employment Industries in La Crosse
The major employment industries in La Crosse include Accommodation & Food Services (52 | 23.3%), Manufacturing (49 | 22.0%), Retail Trade (22 | 9.9%), Educational Services (20 | 9.0%), and Health Care & Social Assistance (19 | 8.5%).
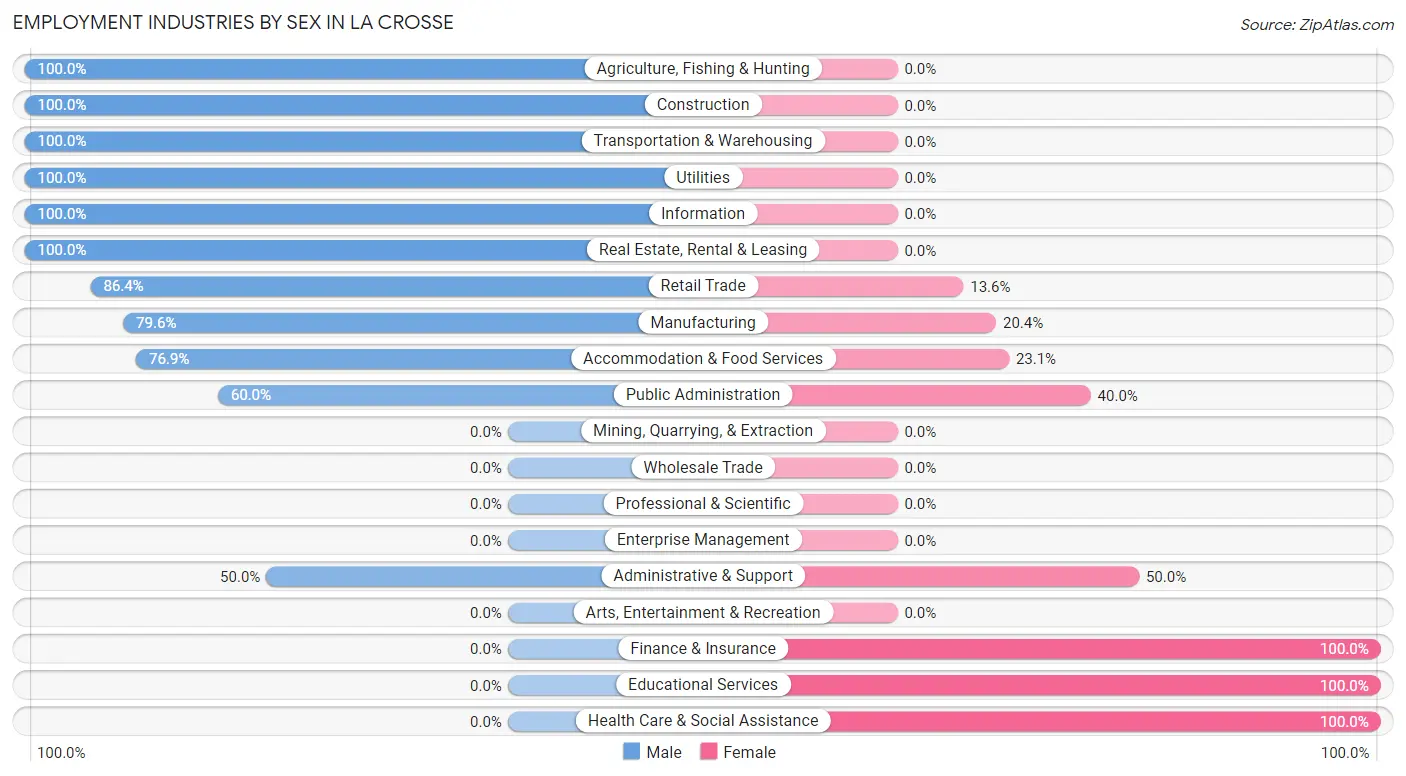
Employment Industries by Sex in La Crosse
The La Crosse industries that see more men than women are Agriculture, Fishing & Hunting (100.0%), Construction (100.0%), and Transportation & Warehousing (100.0%), whereas the industries that tend to have a higher number of women are Finance & Insurance (100.0%), Educational Services (100.0%), and Health Care & Social Assistance (100.0%).
| Industry | Male | Female |
| Agriculture, Fishing & Hunting | 3 (100.0%) | 0 (0.0%) |
| Mining, Quarrying, & Extraction | 0 (0.0%) | 0 (0.0%) |
| Construction | 13 (100.0%) | 0 (0.0%) |
| Manufacturing | 39 (79.6%) | 10 (20.4%) |
| Wholesale Trade | 0 (0.0%) | 0 (0.0%) |
| Retail Trade | 19 (86.4%) | 3 (13.6%) |
| Transportation & Warehousing | 2 (100.0%) | 0 (0.0%) |
| Utilities | 1 (100.0%) | 0 (0.0%) |
| Information | 4 (100.0%) | 0 (0.0%) |
| Finance & Insurance | 0 (0.0%) | 8 (100.0%) |
| Real Estate, Rental & Leasing | 2 (100.0%) | 0 (0.0%) |
| Professional & Scientific | 0 (0.0%) | 0 (0.0%) |
| Enterprise Management | 0 (0.0%) | 0 (0.0%) |
| Administrative & Support | 3 (50.0%) | 3 (50.0%) |
| Educational Services | 0 (0.0%) | 20 (100.0%) |
| Health Care & Social Assistance | 0 (0.0%) | 19 (100.0%) |
| Arts, Entertainment & Recreation | 0 (0.0%) | 0 (0.0%) |
| Accommodation & Food Services | 40 (76.9%) | 12 (23.1%) |
| Public Administration | 9 (60.0%) | 6 (40.0%) |
| Total | 142 (63.7%) | 81 (36.3%) |
Education in La Crosse
School Enrollment in La Crosse
The most common levels of schooling among the 132 students in La Crosse are middle school (48 | 36.4%), high school (34 | 25.8%), and elementary school (31 | 23.5%).
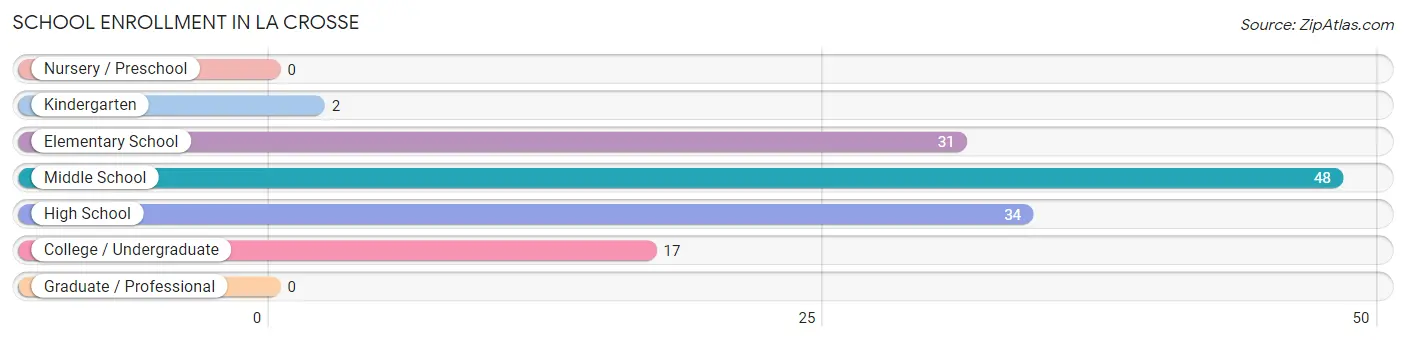
| School Level | # Students | % Students |
| Nursery / Preschool | 0 | 0.0% |
| Kindergarten | 2 | 1.5% |
| Elementary School | 31 | 23.5% |
| Middle School | 48 | 36.4% |
| High School | 34 | 25.8% |
| College / Undergraduate | 17 | 12.9% |
| Graduate / Professional | 0 | 0.0% |
| Total | 132 | 100.0% |
School Enrollment by Age by Funding Source in La Crosse
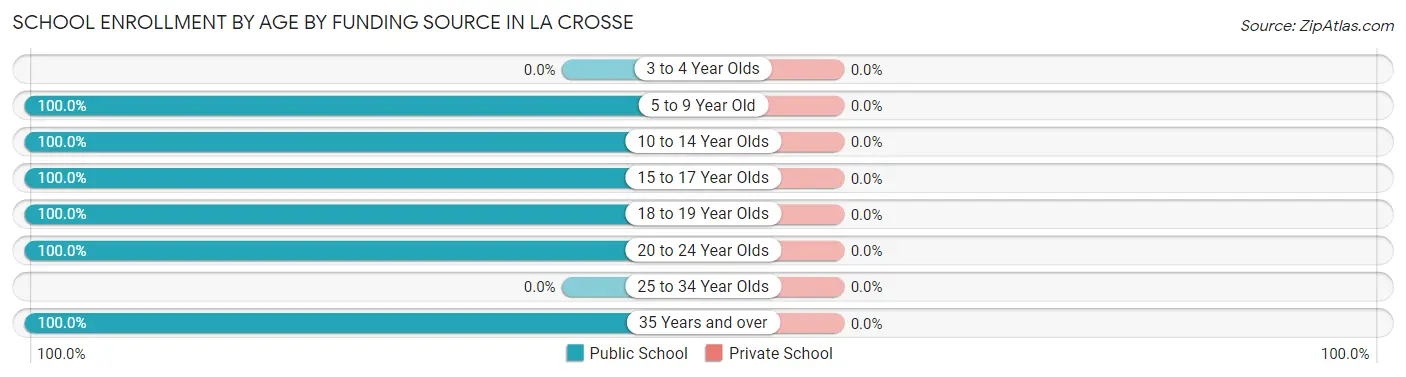
| Age Bracket | Public School | Private School |
| 3 to 4 Year Olds | 0 (0.0%) | 0 (0.0%) |
| 5 to 9 Year Old | 32 (100.0%) | 0 (0.0%) |
| 10 to 14 Year Olds | 52 (100.0%) | 0 (0.0%) |
| 15 to 17 Year Olds | 28 (100.0%) | 0 (0.0%) |
| 18 to 19 Year Olds | 13 (100.0%) | 0 (0.0%) |
| 20 to 24 Year Olds | 2 (100.0%) | 0 (0.0%) |
| 25 to 34 Year Olds | 0 (0.0%) | 0 (0.0%) |
| 35 Years and over | 5 (100.0%) | 0 (0.0%) |
| Total | 132 (100.0%) | 0 (0.0%) |
Educational Attainment by Field of Study in La Crosse
Education (22 | 53.7%), computers & mathematics (7 | 17.1%), science & technology (4 | 9.8%), bio, nature & agricultural (3 | 7.3%), and business (2 | 4.9%) are the most common fields of study among 41 individuals in La Crosse who have obtained a bachelor's degree or higher.
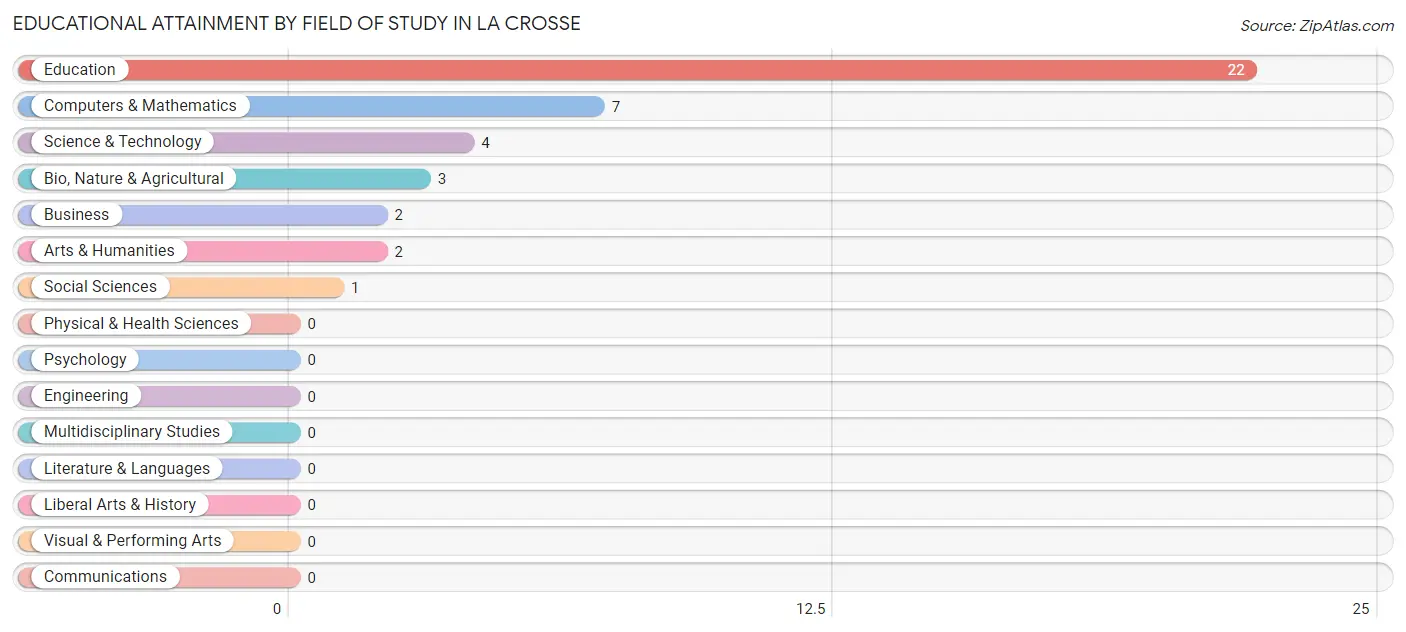
| Field of Study | # Graduates | % Graduates |
| Computers & Mathematics | 7 | 17.1% |
| Bio, Nature & Agricultural | 3 | 7.3% |
| Physical & Health Sciences | 0 | 0.0% |
| Psychology | 0 | 0.0% |
| Social Sciences | 1 | 2.4% |
| Engineering | 0 | 0.0% |
| Multidisciplinary Studies | 0 | 0.0% |
| Science & Technology | 4 | 9.8% |
| Business | 2 | 4.9% |
| Education | 22 | 53.7% |
| Literature & Languages | 0 | 0.0% |
| Liberal Arts & History | 0 | 0.0% |
| Visual & Performing Arts | 0 | 0.0% |
| Communications | 0 | 0.0% |
| Arts & Humanities | 2 | 4.9% |
| Total | 41 | 100.0% |
Transportation & Commute in La Crosse
Vehicle Availability by Sex in La Crosse
The most prevalent vehicle ownership categories in La Crosse are males with 3 vehicles (100, accounting for 70.4%) and females with 3 vehicles (19, making up 123.5%).
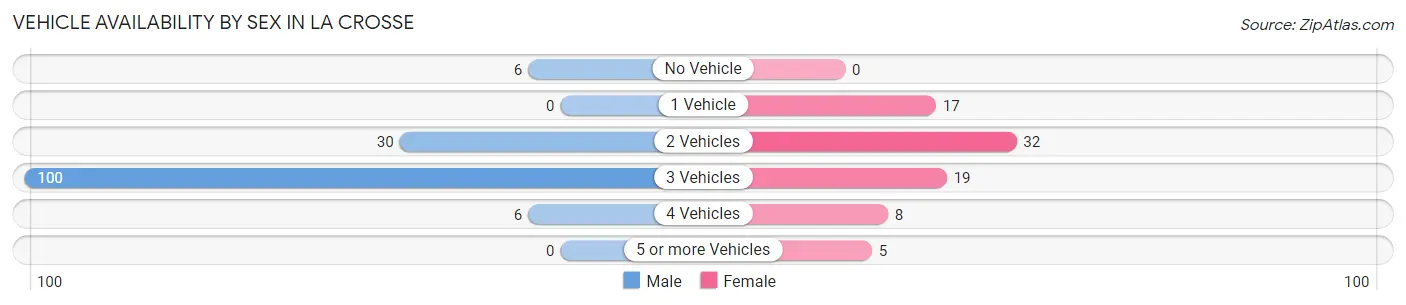
| Vehicles Available | Male | Female |
| No Vehicle | 6 (4.2%) | 0 (0.0%) |
| 1 Vehicle | 0 (0.0%) | 17 (21.0%) |
| 2 Vehicles | 30 (21.1%) | 32 (39.5%) |
| 3 Vehicles | 100 (70.4%) | 19 (23.5%) |
| 4 Vehicles | 6 (4.2%) | 8 (9.9%) |
| 5 or more Vehicles | 0 (0.0%) | 5 (6.2%) |
| Total | 142 (100.0%) | 81 (100.0%) |
Commute Time in La Crosse
The most frequently occuring commute durations in La Crosse are 10 to 14 minutes (88 commuters, 39.5%), 5 to 9 minutes (68 commuters, 30.5%), and 20 to 24 minutes (18 commuters, 8.1%).
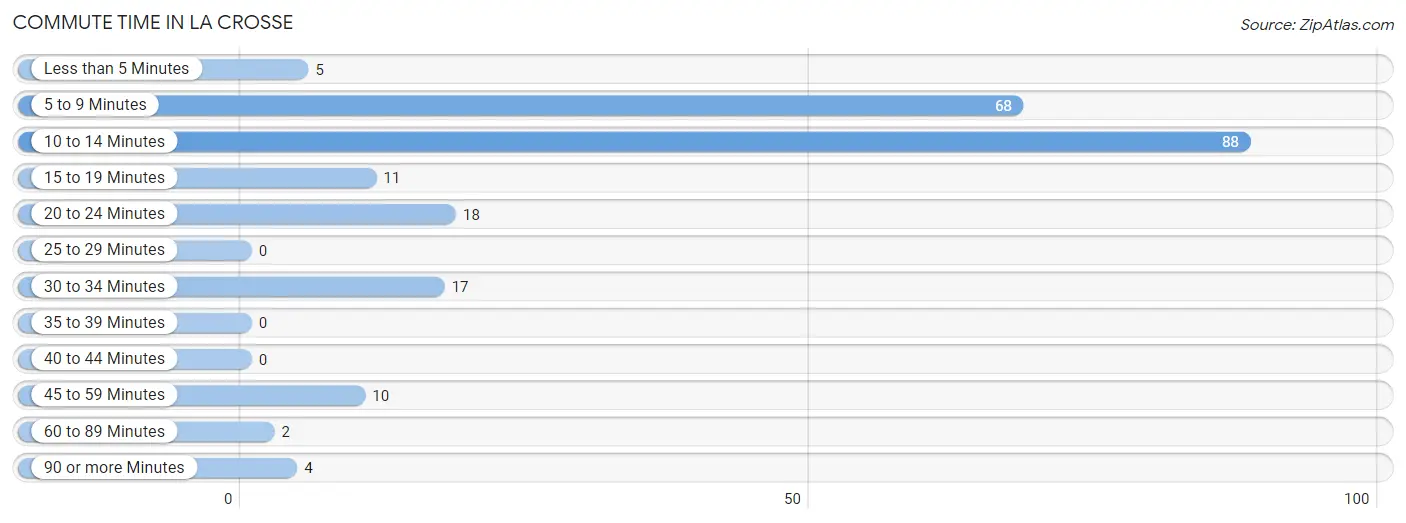
| Commute Time | # Commuters | % Commuters |
| Less than 5 Minutes | 5 | 2.2% |
| 5 to 9 Minutes | 68 | 30.5% |
| 10 to 14 Minutes | 88 | 39.5% |
| 15 to 19 Minutes | 11 | 4.9% |
| 20 to 24 Minutes | 18 | 8.1% |
| 25 to 29 Minutes | 0 | 0.0% |
| 30 to 34 Minutes | 17 | 7.6% |
| 35 to 39 Minutes | 0 | 0.0% |
| 40 to 44 Minutes | 0 | 0.0% |
| 45 to 59 Minutes | 10 | 4.5% |
| 60 to 89 Minutes | 2 | 0.9% |
| 90 or more Minutes | 4 | 1.8% |
Commute Time by Sex in La Crosse
The most common commute times in La Crosse are 10 to 14 minutes (56 commuters, 39.4%) for males and 10 to 14 minutes (32 commuters, 39.5%) for females.
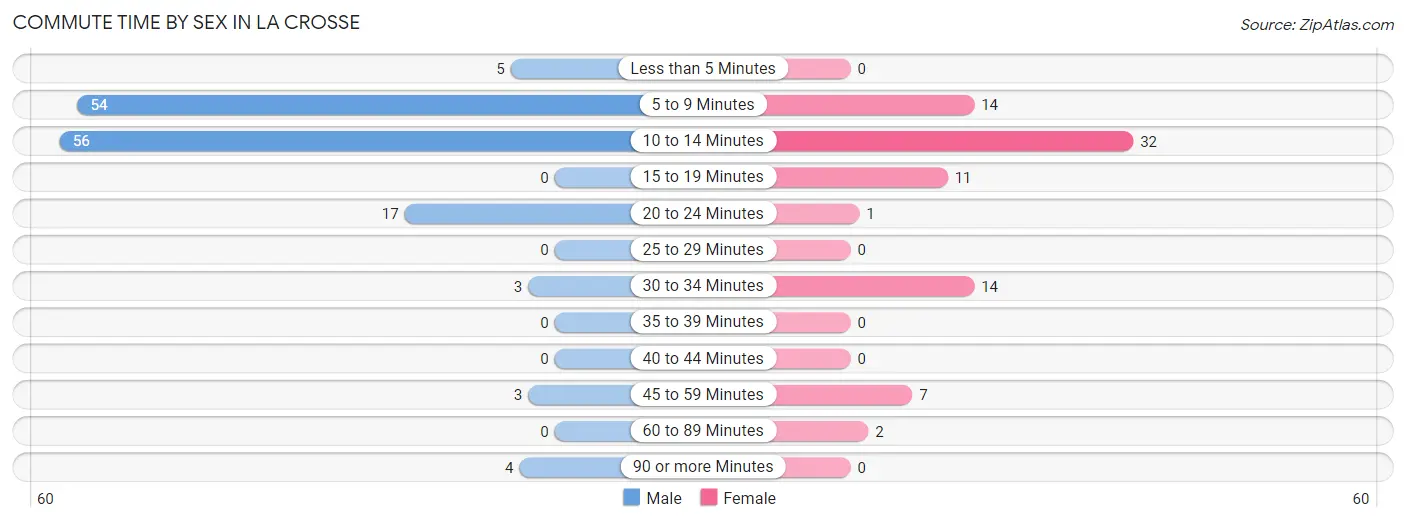
| Commute Time | Male | Female |
| Less than 5 Minutes | 5 (3.5%) | 0 (0.0%) |
| 5 to 9 Minutes | 54 (38.0%) | 14 (17.3%) |
| 10 to 14 Minutes | 56 (39.4%) | 32 (39.5%) |
| 15 to 19 Minutes | 0 (0.0%) | 11 (13.6%) |
| 20 to 24 Minutes | 17 (12.0%) | 1 (1.2%) |
| 25 to 29 Minutes | 0 (0.0%) | 0 (0.0%) |
| 30 to 34 Minutes | 3 (2.1%) | 14 (17.3%) |
| 35 to 39 Minutes | 0 (0.0%) | 0 (0.0%) |
| 40 to 44 Minutes | 0 (0.0%) | 0 (0.0%) |
| 45 to 59 Minutes | 3 (2.1%) | 7 (8.6%) |
| 60 to 89 Minutes | 0 (0.0%) | 2 (2.5%) |
| 90 or more Minutes | 4 (2.8%) | 0 (0.0%) |
Time of Departure to Work by Sex in La Crosse
The most frequent times of departure to work in La Crosse are 9:00 AM to 9:59 AM (42, 29.6%) for males and 7:00 AM to 7:29 AM (18, 22.2%) for females.
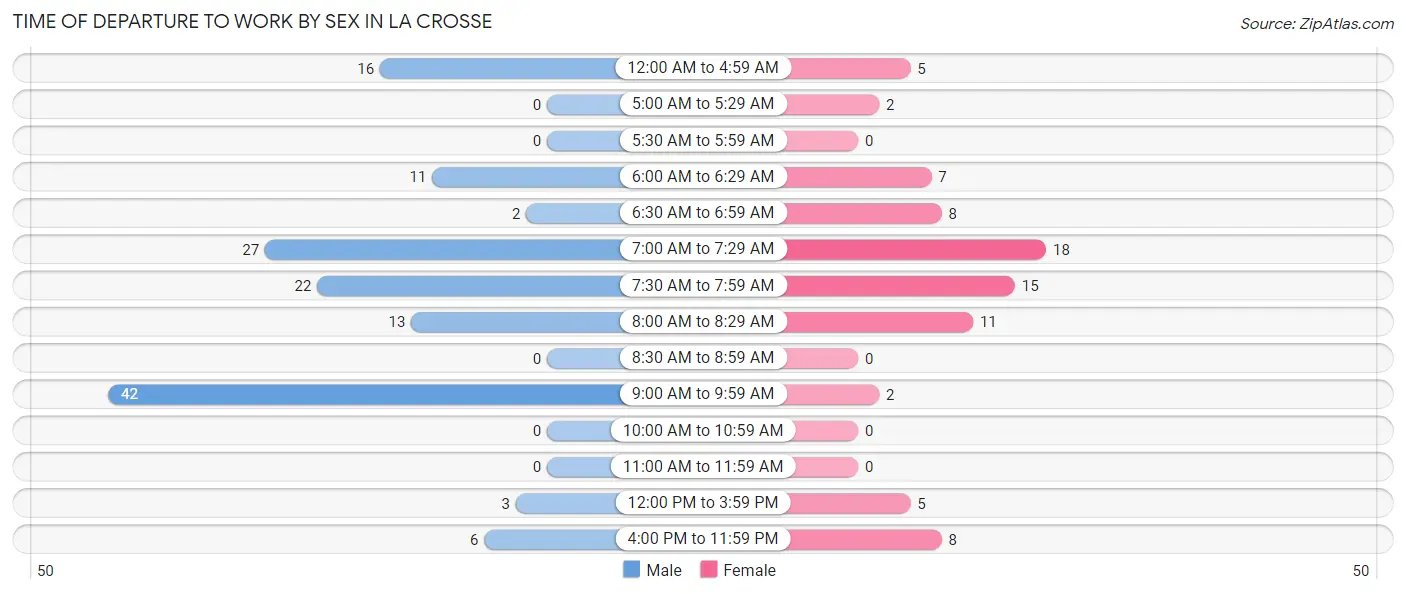
| Time of Departure | Male | Female |
| 12:00 AM to 4:59 AM | 16 (11.3%) | 5 (6.2%) |
| 5:00 AM to 5:29 AM | 0 (0.0%) | 2 (2.5%) |
| 5:30 AM to 5:59 AM | 0 (0.0%) | 0 (0.0%) |
| 6:00 AM to 6:29 AM | 11 (7.7%) | 7 (8.6%) |
| 6:30 AM to 6:59 AM | 2 (1.4%) | 8 (9.9%) |
| 7:00 AM to 7:29 AM | 27 (19.0%) | 18 (22.2%) |
| 7:30 AM to 7:59 AM | 22 (15.5%) | 15 (18.5%) |
| 8:00 AM to 8:29 AM | 13 (9.1%) | 11 (13.6%) |
| 8:30 AM to 8:59 AM | 0 (0.0%) | 0 (0.0%) |
| 9:00 AM to 9:59 AM | 42 (29.6%) | 2 (2.5%) |
| 10:00 AM to 10:59 AM | 0 (0.0%) | 0 (0.0%) |
| 11:00 AM to 11:59 AM | 0 (0.0%) | 0 (0.0%) |
| 12:00 PM to 3:59 PM | 3 (2.1%) | 5 (6.2%) |
| 4:00 PM to 11:59 PM | 6 (4.2%) | 8 (9.9%) |
| Total | 142 (100.0%) | 81 (100.0%) |
Housing Occupancy in La Crosse
Occupancy by Ownership in La Crosse
Of the total 227 dwellings in La Crosse, owner-occupied units account for 109 (48.0%), while renter-occupied units make up 118 (52.0%).
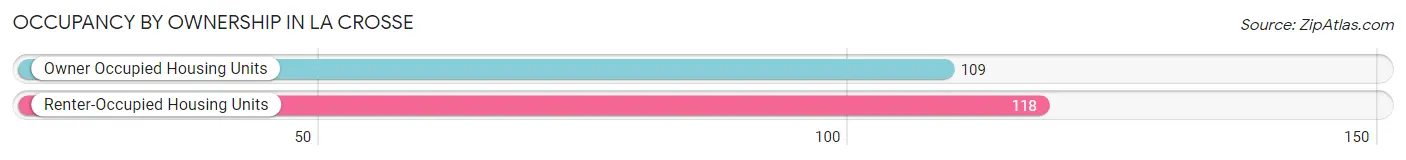
| Occupancy | # Housing Units | % Housing Units |
| Owner Occupied Housing Units | 109 | 48.0% |
| Renter-Occupied Housing Units | 118 | 52.0% |
| Total Occupied Housing Units | 227 | 100.0% |
Occupancy by Household Size in La Crosse
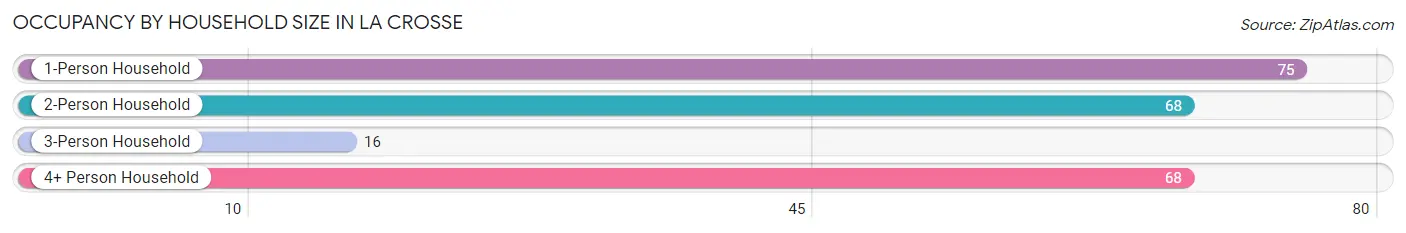
| Household Size | # Housing Units | % Housing Units |
| 1-Person Household | 75 | 33.0% |
| 2-Person Household | 68 | 30.0% |
| 3-Person Household | 16 | 7.0% |
| 4+ Person Household | 68 | 30.0% |
| Total Housing Units | 227 | 100.0% |
Occupancy by Ownership by Household Size in La Crosse
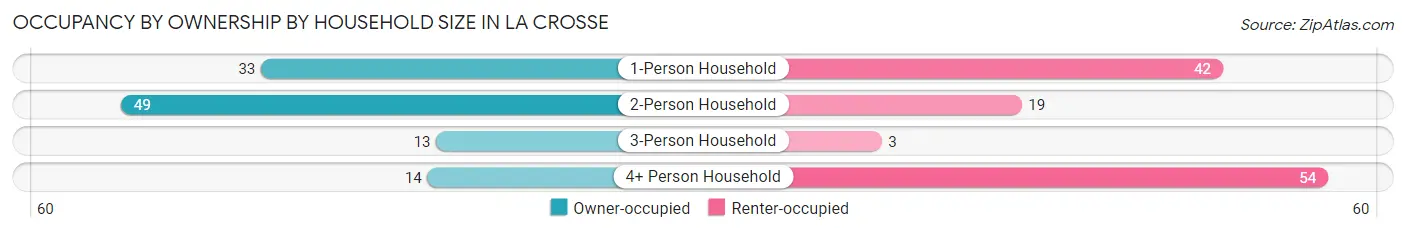
| Household Size | Owner-occupied | Renter-occupied |
| 1-Person Household | 33 (44.0%) | 42 (56.0%) |
| 2-Person Household | 49 (72.1%) | 19 (27.9%) |
| 3-Person Household | 13 (81.2%) | 3 (18.8%) |
| 4+ Person Household | 14 (20.6%) | 54 (79.4%) |
| Total Housing Units | 109 (48.0%) | 118 (52.0%) |
Occupancy by Educational Attainment in La Crosse
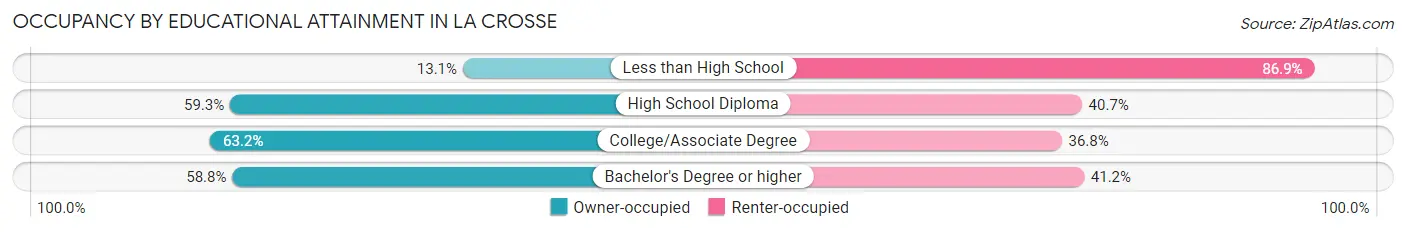
| Household Size | Owner-occupied | Renter-occupied |
| Less than High School | 8 (13.1%) | 53 (86.9%) |
| High School Diploma | 48 (59.3%) | 33 (40.7%) |
| College/Associate Degree | 43 (63.2%) | 25 (36.8%) |
| Bachelor's Degree or higher | 10 (58.8%) | 7 (41.2%) |
Occupancy by Age of Householder in La Crosse
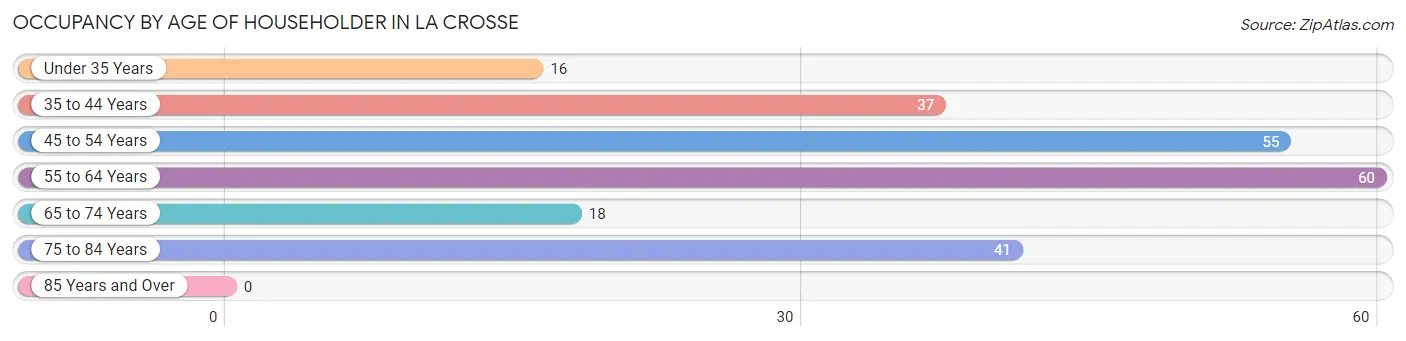
| Age Bracket | # Households | % Households |
| Under 35 Years | 16 | 7.0% |
| 35 to 44 Years | 37 | 16.3% |
| 45 to 54 Years | 55 | 24.2% |
| 55 to 64 Years | 60 | 26.4% |
| 65 to 74 Years | 18 | 7.9% |
| 75 to 84 Years | 41 | 18.1% |
| 85 Years and Over | 0 | 0.0% |
| Total | 227 | 100.0% |
Housing Finances in La Crosse
Median Income by Occupancy in La Crosse
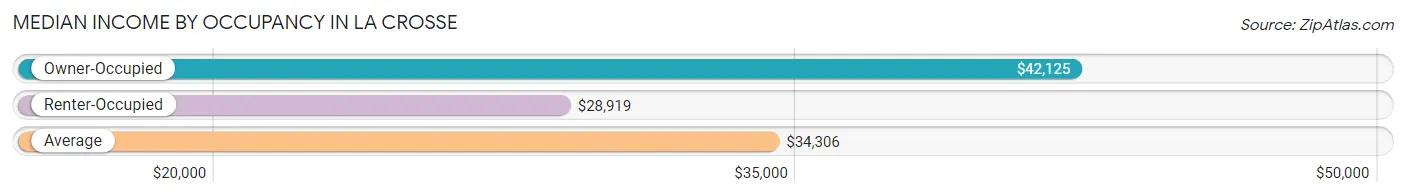
| Occupancy Type | # Households | Median Income |
| Owner-Occupied | 109 (48.0%) | $42,125 |
| Renter-Occupied | 118 (52.0%) | $28,919 |
| Average | 227 (100.0%) | $34,306 |
Occupancy by Householder Income Bracket in La Crosse
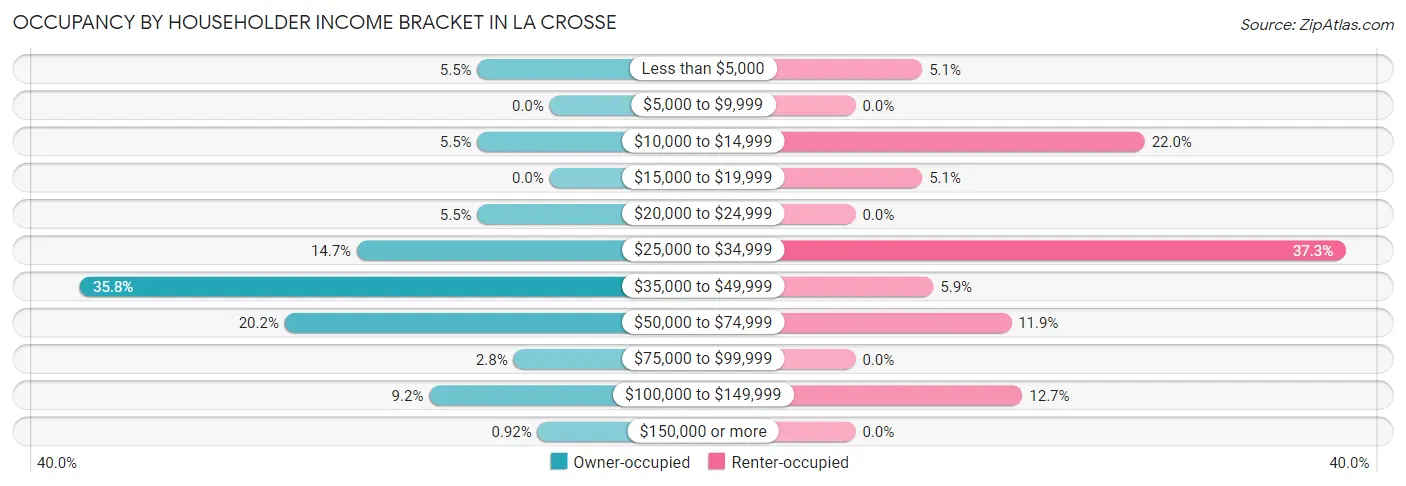
| Income Bracket | Owner-occupied | Renter-occupied |
| Less than $5,000 | 6 (5.5%) | 6 (5.1%) |
| $5,000 to $9,999 | 0 (0.0%) | 0 (0.0%) |
| $10,000 to $14,999 | 6 (5.5%) | 26 (22.0%) |
| $15,000 to $19,999 | 0 (0.0%) | 6 (5.1%) |
| $20,000 to $24,999 | 6 (5.5%) | 0 (0.0%) |
| $25,000 to $34,999 | 16 (14.7%) | 44 (37.3%) |
| $35,000 to $49,999 | 39 (35.8%) | 7 (5.9%) |
| $50,000 to $74,999 | 22 (20.2%) | 14 (11.9%) |
| $75,000 to $99,999 | 3 (2.8%) | 0 (0.0%) |
| $100,000 to $149,999 | 10 (9.2%) | 15 (12.7%) |
| $150,000 or more | 1 (0.9%) | 0 (0.0%) |
| Total | 109 (100.0%) | 118 (100.0%) |
Monthly Housing Cost Tiers in La Crosse
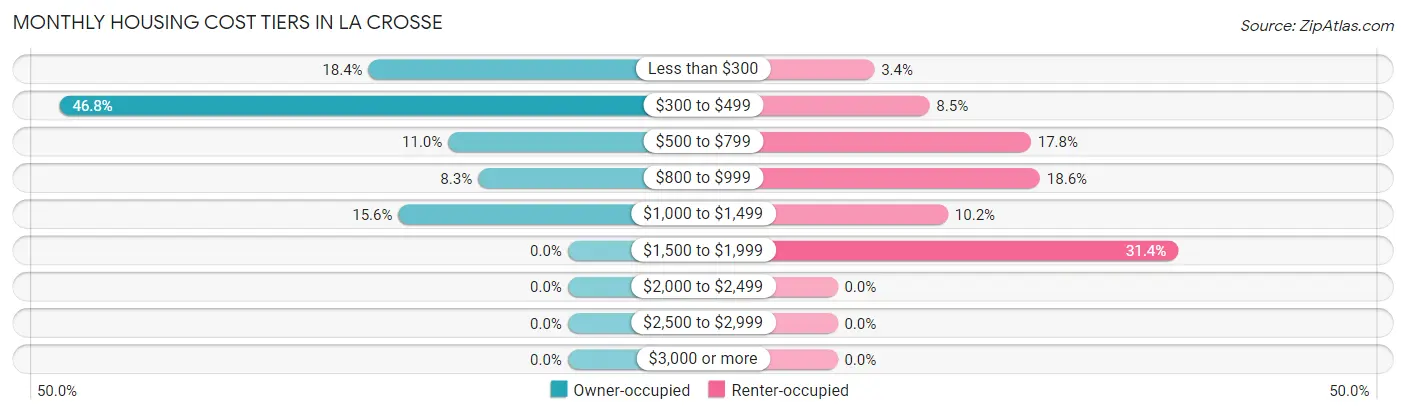
| Monthly Cost | Owner-occupied | Renter-occupied |
| Less than $300 | 20 (18.3%) | 4 (3.4%) |
| $300 to $499 | 51 (46.8%) | 10 (8.5%) |
| $500 to $799 | 12 (11.0%) | 21 (17.8%) |
| $800 to $999 | 9 (8.3%) | 22 (18.6%) |
| $1,000 to $1,499 | 17 (15.6%) | 12 (10.2%) |
| $1,500 to $1,999 | 0 (0.0%) | 37 (31.4%) |
| $2,000 to $2,499 | 0 (0.0%) | 0 (0.0%) |
| $2,500 to $2,999 | 0 (0.0%) | 0 (0.0%) |
| $3,000 or more | 0 (0.0%) | 0 (0.0%) |
| Total | 109 (100.0%) | 118 (100.0%) |
Physical Housing Characteristics in La Crosse
Housing Structures in La Crosse
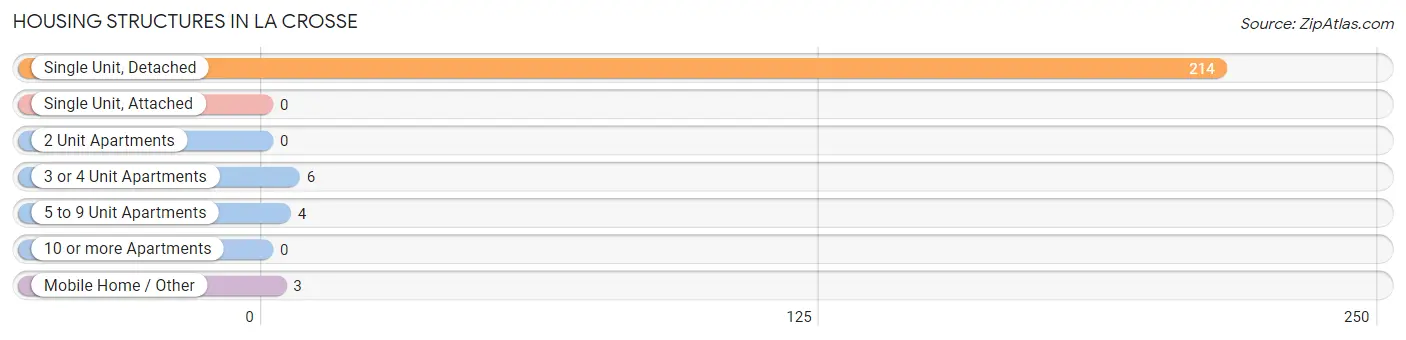
| Structure Type | # Housing Units | % Housing Units |
| Single Unit, Detached | 214 | 94.3% |
| Single Unit, Attached | 0 | 0.0% |
| 2 Unit Apartments | 0 | 0.0% |
| 3 or 4 Unit Apartments | 6 | 2.6% |
| 5 to 9 Unit Apartments | 4 | 1.8% |
| 10 or more Apartments | 0 | 0.0% |
| Mobile Home / Other | 3 | 1.3% |
| Total | 227 | 100.0% |
Housing Structures by Occupancy in La Crosse
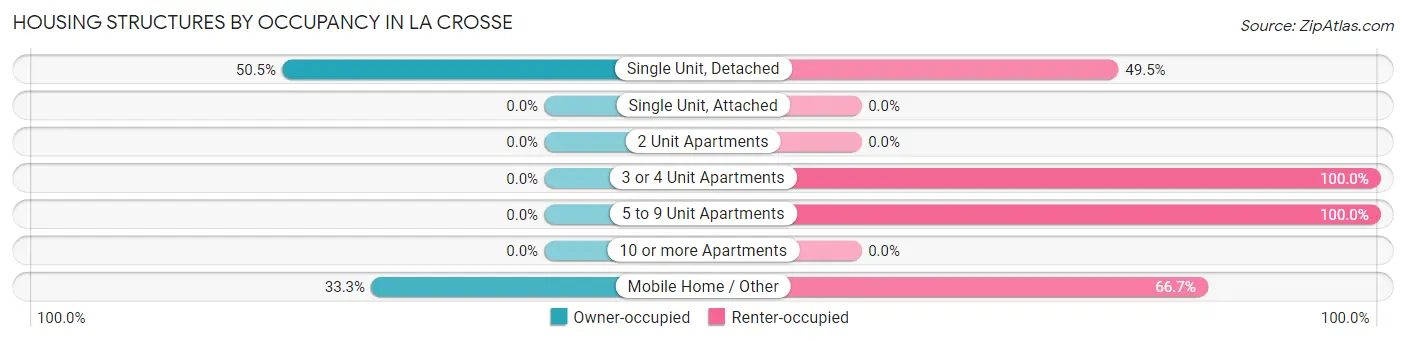
| Structure Type | Owner-occupied | Renter-occupied |
| Single Unit, Detached | 108 (50.5%) | 106 (49.5%) |
| Single Unit, Attached | 0 (0.0%) | 0 (0.0%) |
| 2 Unit Apartments | 0 (0.0%) | 0 (0.0%) |
| 3 or 4 Unit Apartments | 0 (0.0%) | 6 (100.0%) |
| 5 to 9 Unit Apartments | 0 (0.0%) | 4 (100.0%) |
| 10 or more Apartments | 0 (0.0%) | 0 (0.0%) |
| Mobile Home / Other | 1 (33.3%) | 2 (66.7%) |
| Total | 109 (48.0%) | 118 (52.0%) |
Housing Structures by Number of Rooms in La Crosse
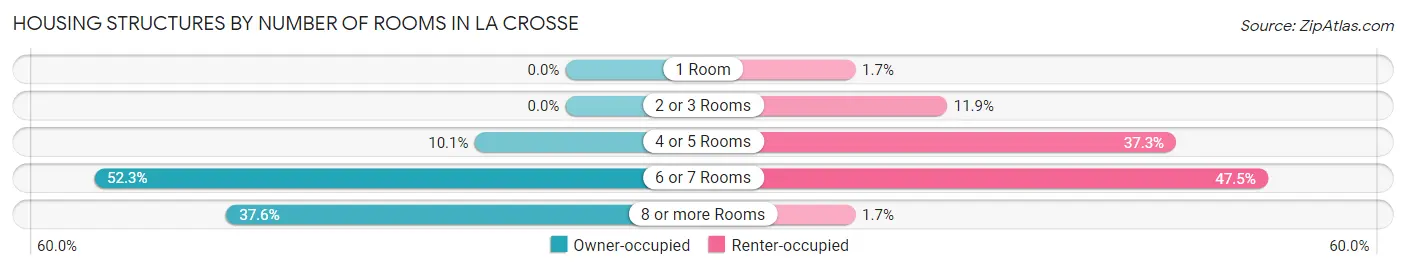
| Number of Rooms | Owner-occupied | Renter-occupied |
| 1 Room | 0 (0.0%) | 2 (1.7%) |
| 2 or 3 Rooms | 0 (0.0%) | 14 (11.9%) |
| 4 or 5 Rooms | 11 (10.1%) | 44 (37.3%) |
| 6 or 7 Rooms | 57 (52.3%) | 56 (47.5%) |
| 8 or more Rooms | 41 (37.6%) | 2 (1.7%) |
| Total | 109 (100.0%) | 118 (100.0%) |
Housing Structure by Heating Type in La Crosse
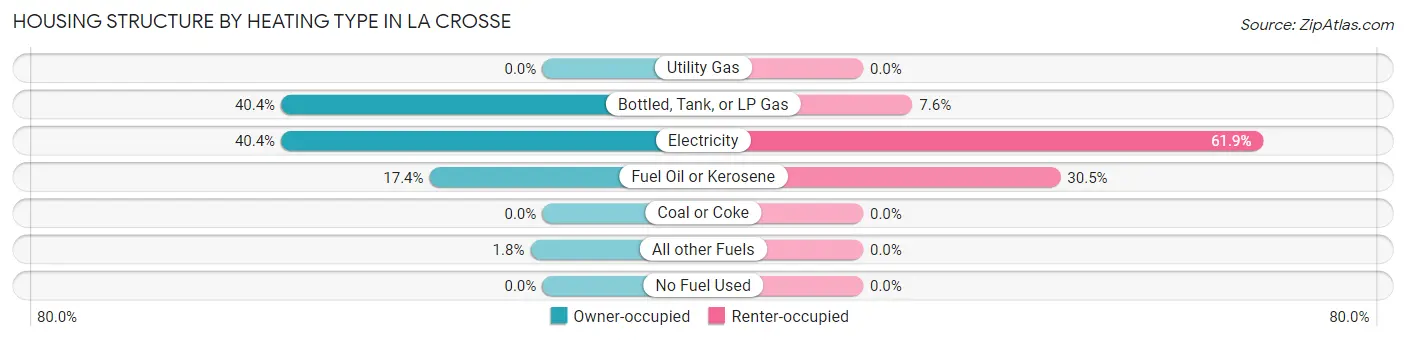
| Heating Type | Owner-occupied | Renter-occupied |
| Utility Gas | 0 (0.0%) | 0 (0.0%) |
| Bottled, Tank, or LP Gas | 44 (40.4%) | 9 (7.6%) |
| Electricity | 44 (40.4%) | 73 (61.9%) |
| Fuel Oil or Kerosene | 19 (17.4%) | 36 (30.5%) |
| Coal or Coke | 0 (0.0%) | 0 (0.0%) |
| All other Fuels | 2 (1.8%) | 0 (0.0%) |
| No Fuel Used | 0 (0.0%) | 0 (0.0%) |
| Total | 109 (100.0%) | 118 (100.0%) |
Household Vehicle Usage in La Crosse
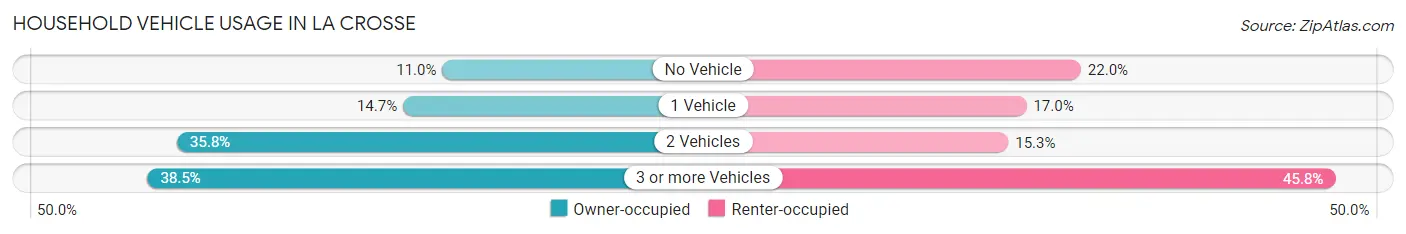
| Vehicles per Household | Owner-occupied | Renter-occupied |
| No Vehicle | 12 (11.0%) | 26 (22.0%) |
| 1 Vehicle | 16 (14.7%) | 20 (17.0%) |
| 2 Vehicles | 39 (35.8%) | 18 (15.2%) |
| 3 or more Vehicles | 42 (38.5%) | 54 (45.8%) |
| Total | 109 (100.0%) | 118 (100.0%) |
Real Estate & Mortgages in La Crosse
Real Estate and Mortgage Overview in La Crosse
| Characteristic | Without Mortgage | With Mortgage |
| Housing Units | 80 | 29 |
| Median Property Value | $96,100 | $97,500 |
| Median Household Income | $44,286 | $1 |
| Monthly Housing Costs | $393 | $0 |
| Real Estate Taxes | $576 | $0 |
Property Value by Mortgage Status in La Crosse
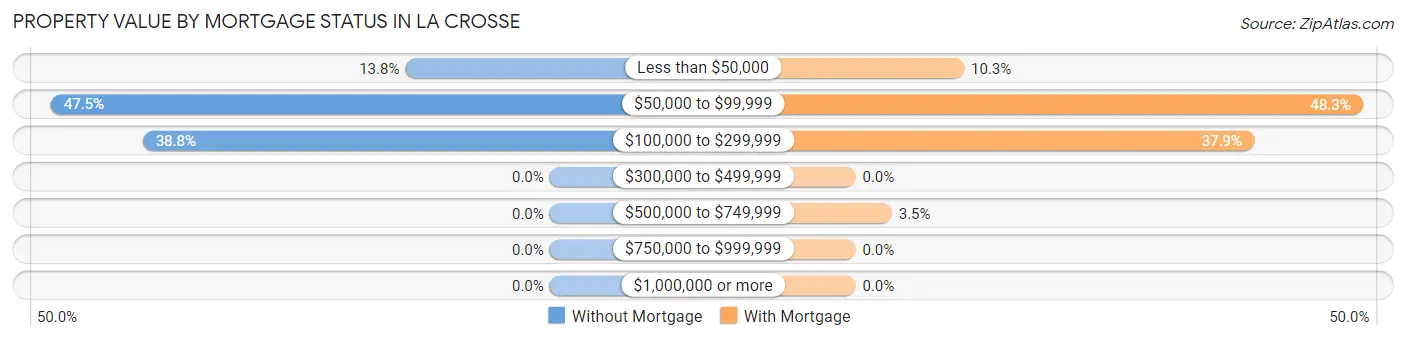
| Property Value | Without Mortgage | With Mortgage |
| Less than $50,000 | 11 (13.8%) | 3 (10.3%) |
| $50,000 to $99,999 | 38 (47.5%) | 14 (48.3%) |
| $100,000 to $299,999 | 31 (38.8%) | 11 (37.9%) |
| $300,000 to $499,999 | 0 (0.0%) | 0 (0.0%) |
| $500,000 to $749,999 | 0 (0.0%) | 1 (3.5%) |
| $750,000 to $999,999 | 0 (0.0%) | 0 (0.0%) |
| $1,000,000 or more | 0 (0.0%) | 0 (0.0%) |
| Total | 80 (100.0%) | 29 (100.0%) |
Household Income by Mortgage Status in La Crosse
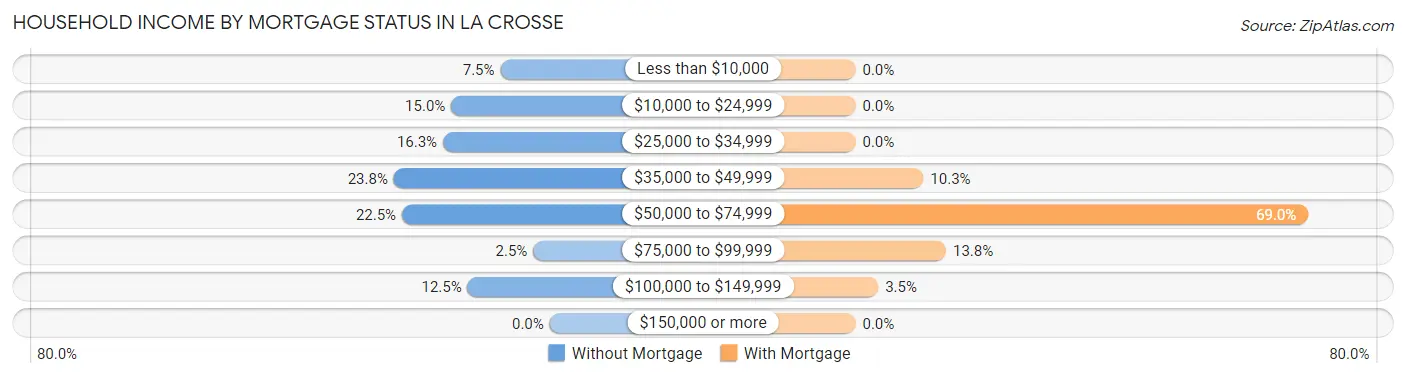
| Household Income | Without Mortgage | With Mortgage |
| Less than $10,000 | 6 (7.5%) | 0 (0.0%) |
| $10,000 to $24,999 | 12 (15.0%) | 0 (0.0%) |
| $25,000 to $34,999 | 13 (16.3%) | 0 (0.0%) |
| $35,000 to $49,999 | 19 (23.7%) | 3 (10.3%) |
| $50,000 to $74,999 | 18 (22.5%) | 20 (69.0%) |
| $75,000 to $99,999 | 2 (2.5%) | 4 (13.8%) |
| $100,000 to $149,999 | 10 (12.5%) | 1 (3.5%) |
| $150,000 or more | 0 (0.0%) | 0 (0.0%) |
| Total | 80 (100.0%) | 29 (100.0%) |
Property Value to Household Income Ratio in La Crosse
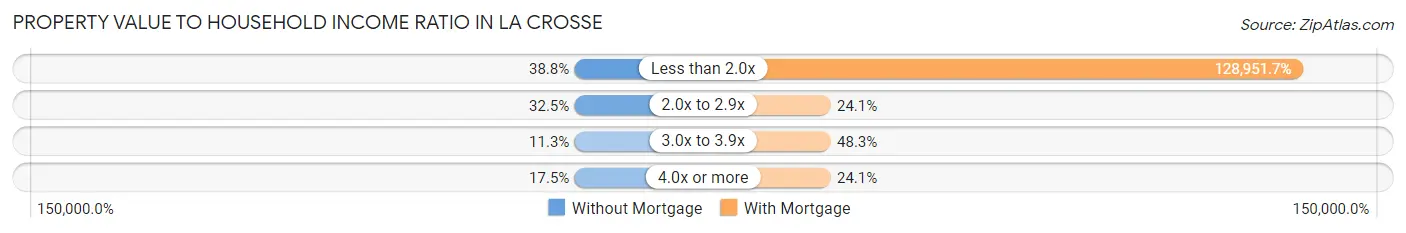
| Value-to-Income Ratio | Without Mortgage | With Mortgage |
| Less than 2.0x | 31 (38.8%) | 37,396 (128,951.7%) |
| 2.0x to 2.9x | 26 (32.5%) | 7 (24.1%) |
| 3.0x to 3.9x | 9 (11.3%) | 14 (48.3%) |
| 4.0x or more | 14 (17.5%) | 7 (24.1%) |
| Total | 80 (100.0%) | 29 (100.0%) |
Real Estate Taxes by Mortgage Status in La Crosse
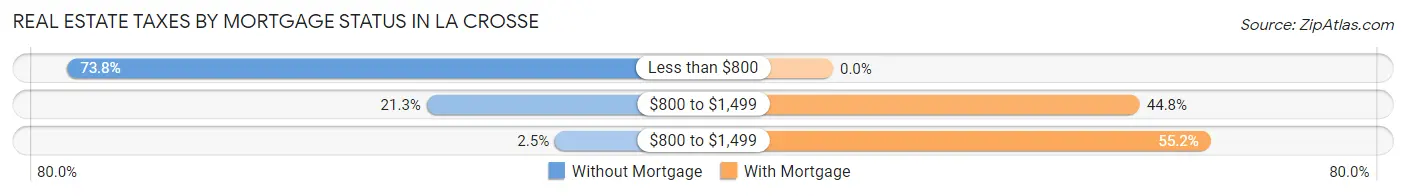
| Property Taxes | Without Mortgage | With Mortgage |
| Less than $800 | 59 (73.8%) | 0 (0.0%) |
| $800 to $1,499 | 17 (21.2%) | 13 (44.8%) |
| $800 to $1,499 | 2 (2.5%) | 16 (55.2%) |
| Total | 80 (100.0%) | 29 (100.0%) |
Health & Disability in La Crosse
Health Insurance Coverage by Age in La Crosse
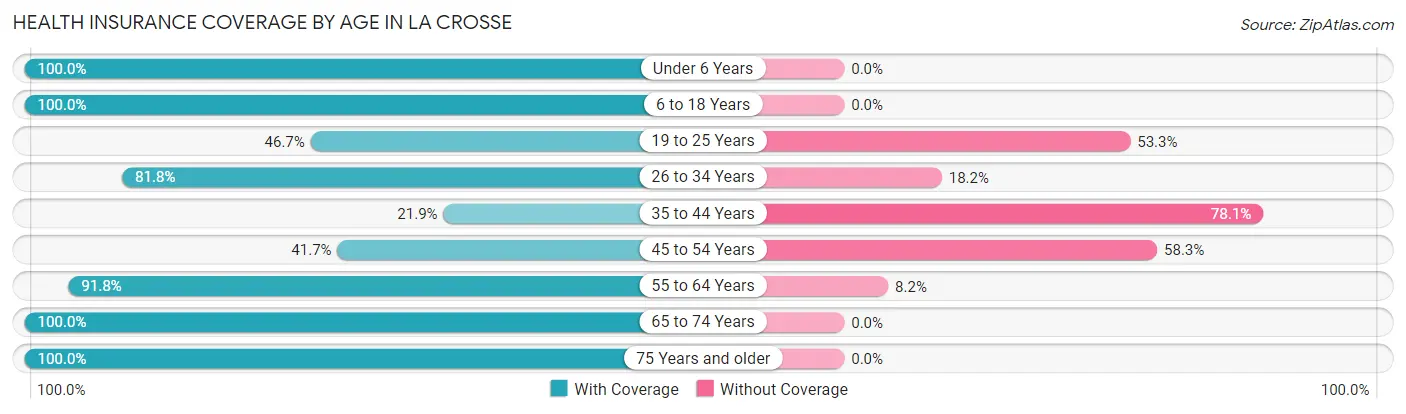
| Age Bracket | With Coverage | Without Coverage |
| Under 6 Years | 8 (100.0%) | 0 (0.0%) |
| 6 to 18 Years | 124 (100.0%) | 0 (0.0%) |
| 19 to 25 Years | 7 (46.7%) | 8 (53.3%) |
| 26 to 34 Years | 9 (81.8%) | 2 (18.2%) |
| 35 to 44 Years | 23 (21.9%) | 82 (78.1%) |
| 45 to 54 Years | 30 (41.7%) | 42 (58.3%) |
| 55 to 64 Years | 101 (91.8%) | 9 (8.2%) |
| 65 to 74 Years | 30 (100.0%) | 0 (0.0%) |
| 75 Years and older | 52 (100.0%) | 0 (0.0%) |
| Total | 384 (72.9%) | 143 (27.1%) |
Health Insurance Coverage by Citizenship Status in La Crosse
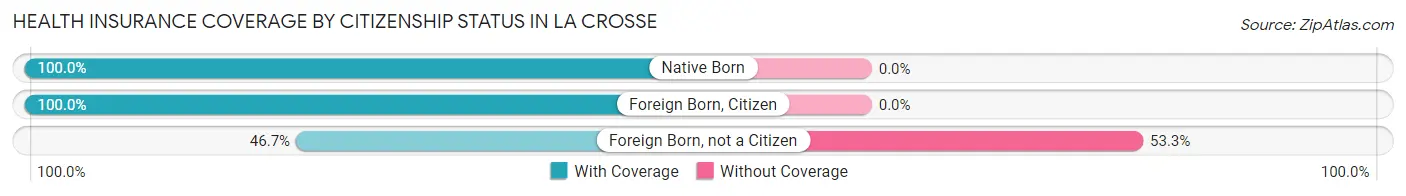
| Citizenship Status | With Coverage | Without Coverage |
| Native Born | 8 (100.0%) | 0 (0.0%) |
| Foreign Born, Citizen | 124 (100.0%) | 0 (0.0%) |
| Foreign Born, not a Citizen | 7 (46.7%) | 8 (53.3%) |
Health Insurance Coverage by Household Income in La Crosse
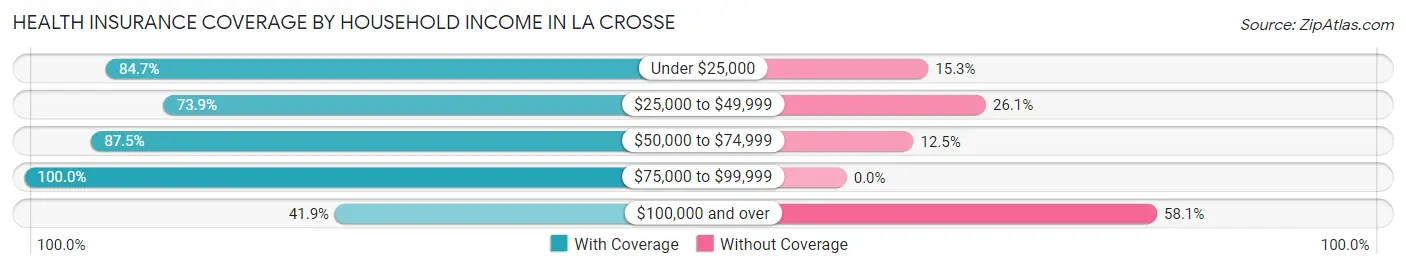
| Household Income | With Coverage | Without Coverage |
| Under $25,000 | 61 (84.7%) | 11 (15.3%) |
| $25,000 to $49,999 | 204 (73.9%) | 72 (26.1%) |
| $50,000 to $74,999 | 70 (87.5%) | 10 (12.5%) |
| $75,000 to $99,999 | 13 (100.0%) | 0 (0.0%) |
| $100,000 and over | 36 (41.9%) | 50 (58.1%) |
Public vs Private Health Insurance Coverage by Age in La Crosse
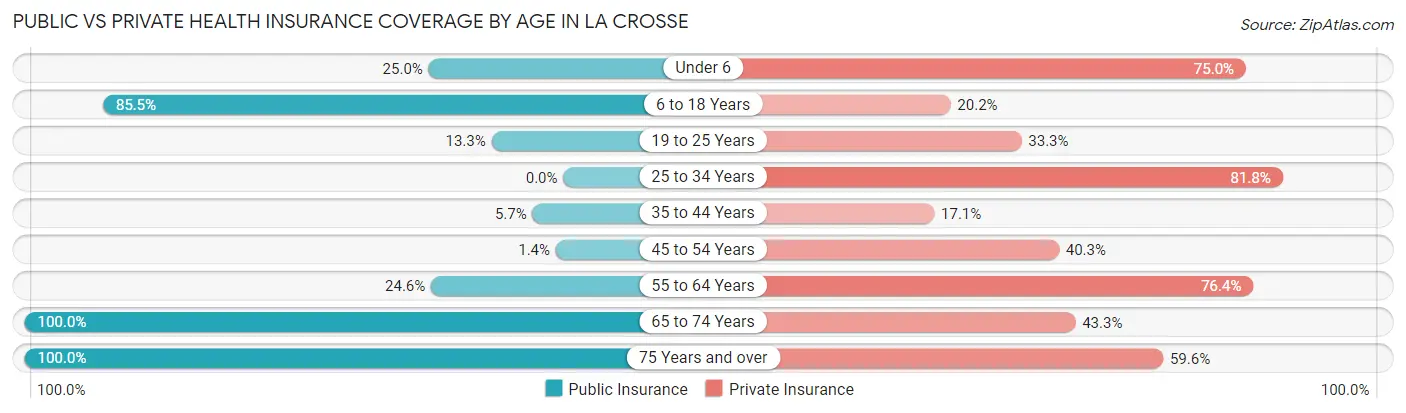
| Age Bracket | Public Insurance | Private Insurance |
| Under 6 | 2 (25.0%) | 6 (75.0%) |
| 6 to 18 Years | 106 (85.5%) | 25 (20.2%) |
| 19 to 25 Years | 2 (13.3%) | 5 (33.3%) |
| 25 to 34 Years | 0 (0.0%) | 9 (81.8%) |
| 35 to 44 Years | 6 (5.7%) | 18 (17.1%) |
| 45 to 54 Years | 1 (1.4%) | 29 (40.3%) |
| 55 to 64 Years | 27 (24.5%) | 84 (76.4%) |
| 65 to 74 Years | 30 (100.0%) | 13 (43.3%) |
| 75 Years and over | 52 (100.0%) | 31 (59.6%) |
| Total | 226 (42.9%) | 220 (41.7%) |
Disability Status by Sex by Age in La Crosse
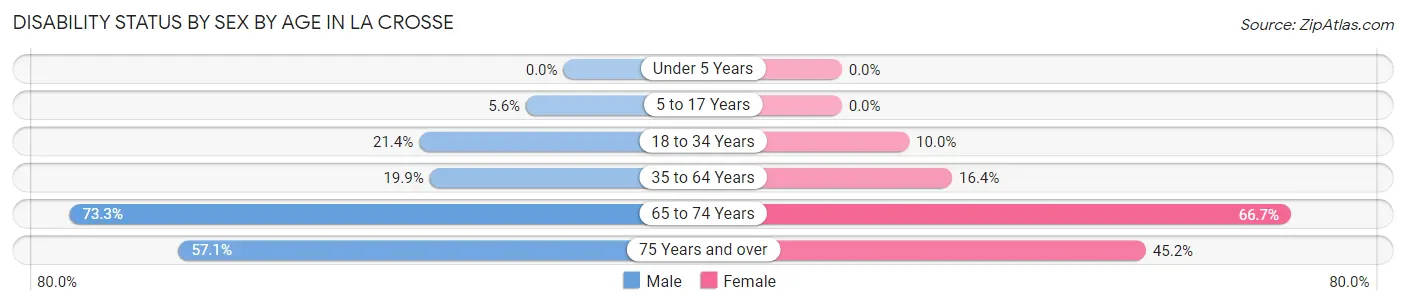
| Age Bracket | Male | Female |
| Under 5 Years | 0 (0.0%) | 0 (0.0%) |
| 5 to 17 Years | 4 (5.6%) | 0 (0.0%) |
| 18 to 34 Years | 3 (21.4%) | 2 (10.0%) |
| 35 to 64 Years | 34 (19.9%) | 19 (16.4%) |
| 65 to 74 Years | 11 (73.3%) | 10 (66.7%) |
| 75 Years and over | 12 (57.1%) | 14 (45.2%) |
Disability Class by Sex by Age in La Crosse
Disability Class: Hearing Difficulty
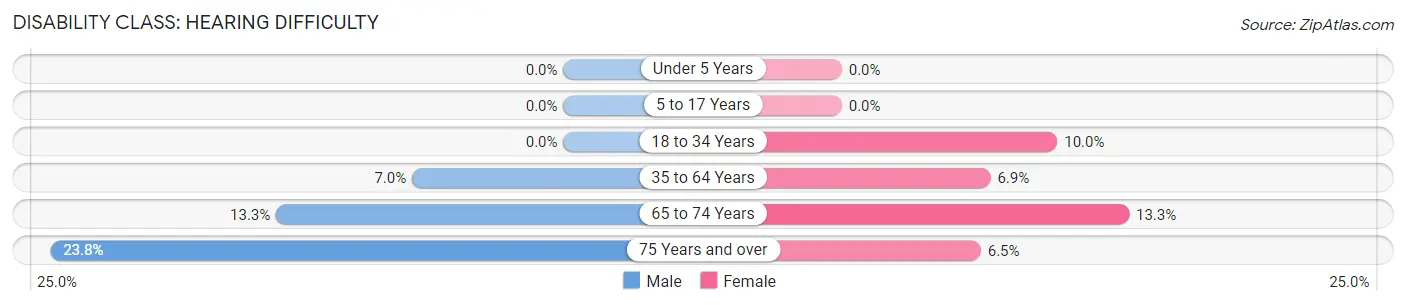
| Age Bracket | Male | Female |
| Under 5 Years | 0 (0.0%) | 0 (0.0%) |
| 5 to 17 Years | 0 (0.0%) | 0 (0.0%) |
| 18 to 34 Years | 0 (0.0%) | 2 (10.0%) |
| 35 to 64 Years | 12 (7.0%) | 8 (6.9%) |
| 65 to 74 Years | 2 (13.3%) | 2 (13.3%) |
| 75 Years and over | 5 (23.8%) | 2 (6.5%) |
Disability Class: Vision Difficulty
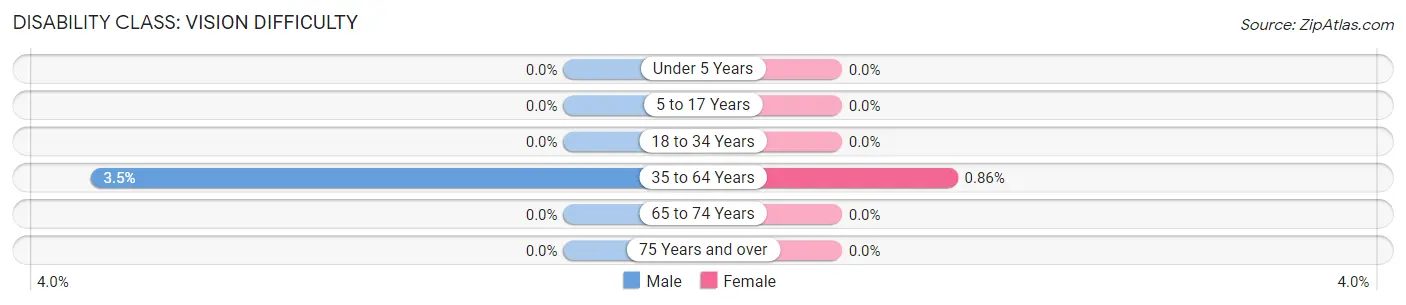
| Age Bracket | Male | Female |
| Under 5 Years | 0 (0.0%) | 0 (0.0%) |
| 5 to 17 Years | 0 (0.0%) | 0 (0.0%) |
| 18 to 34 Years | 0 (0.0%) | 0 (0.0%) |
| 35 to 64 Years | 6 (3.5%) | 1 (0.9%) |
| 65 to 74 Years | 0 (0.0%) | 0 (0.0%) |
| 75 Years and over | 0 (0.0%) | 0 (0.0%) |
Disability Class: Cognitive Difficulty
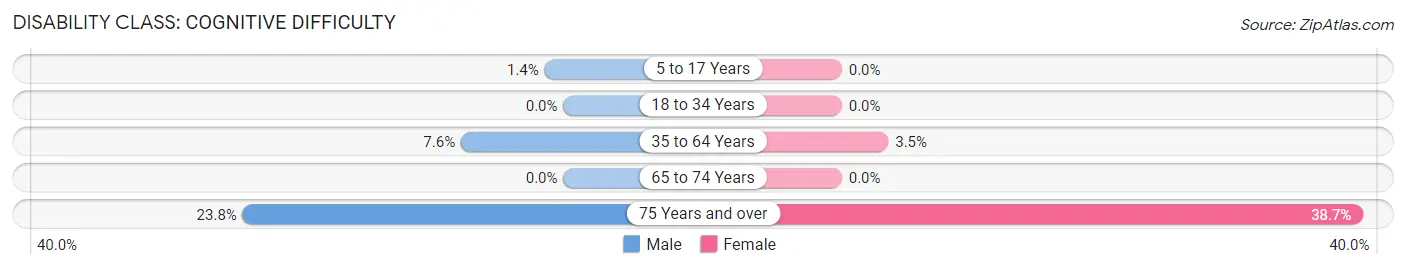
| Age Bracket | Male | Female |
| 5 to 17 Years | 1 (1.4%) | 0 (0.0%) |
| 18 to 34 Years | 0 (0.0%) | 0 (0.0%) |
| 35 to 64 Years | 13 (7.6%) | 4 (3.5%) |
| 65 to 74 Years | 0 (0.0%) | 0 (0.0%) |
| 75 Years and over | 5 (23.8%) | 12 (38.7%) |
Disability Class: Ambulatory Difficulty
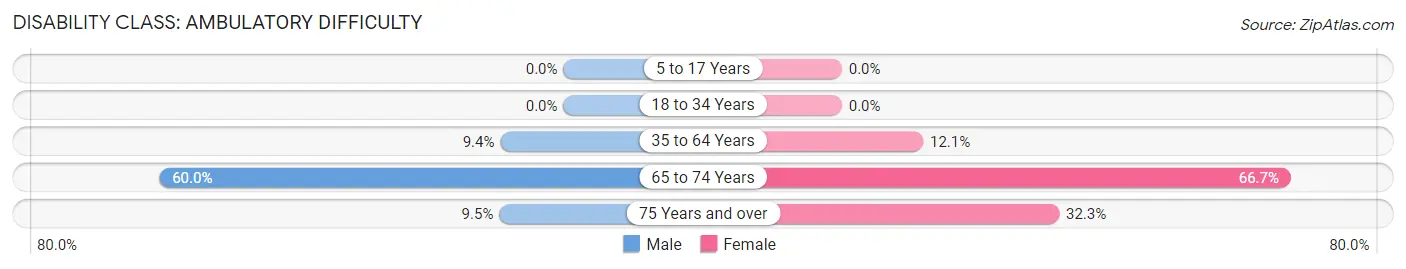
| Age Bracket | Male | Female |
| 5 to 17 Years | 0 (0.0%) | 0 (0.0%) |
| 18 to 34 Years | 0 (0.0%) | 0 (0.0%) |
| 35 to 64 Years | 16 (9.4%) | 14 (12.1%) |
| 65 to 74 Years | 9 (60.0%) | 10 (66.7%) |
| 75 Years and over | 2 (9.5%) | 10 (32.3%) |
Disability Class: Self-Care Difficulty
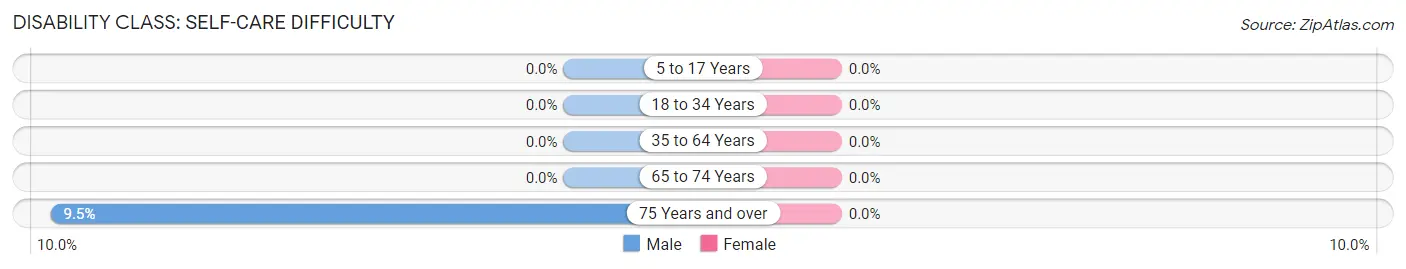
| Age Bracket | Male | Female |
| 5 to 17 Years | 0 (0.0%) | 0 (0.0%) |
| 18 to 34 Years | 0 (0.0%) | 0 (0.0%) |
| 35 to 64 Years | 0 (0.0%) | 0 (0.0%) |
| 65 to 74 Years | 0 (0.0%) | 0 (0.0%) |
| 75 Years and over | 2 (9.5%) | 0 (0.0%) |
Technology Access in La Crosse
Computing Device Access in La Crosse
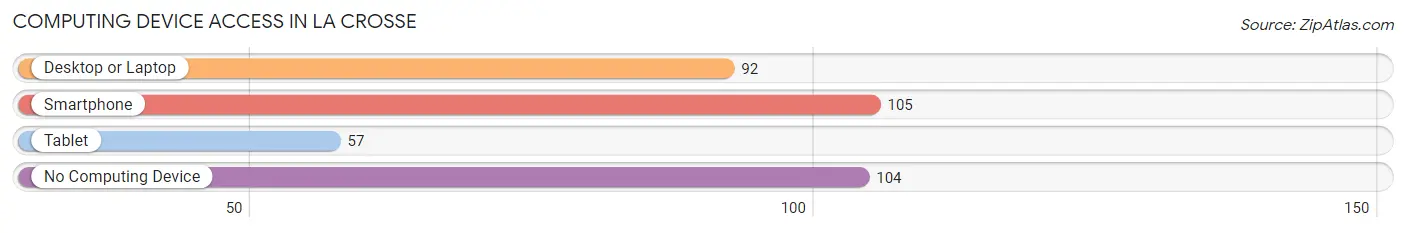
| Device Type | # Households | % Households |
| Desktop or Laptop | 92 | 40.5% |
| Smartphone | 105 | 46.3% |
| Tablet | 57 | 25.1% |
| No Computing Device | 104 | 45.8% |
| Total | 227 | 100.0% |
Internet Access in La Crosse
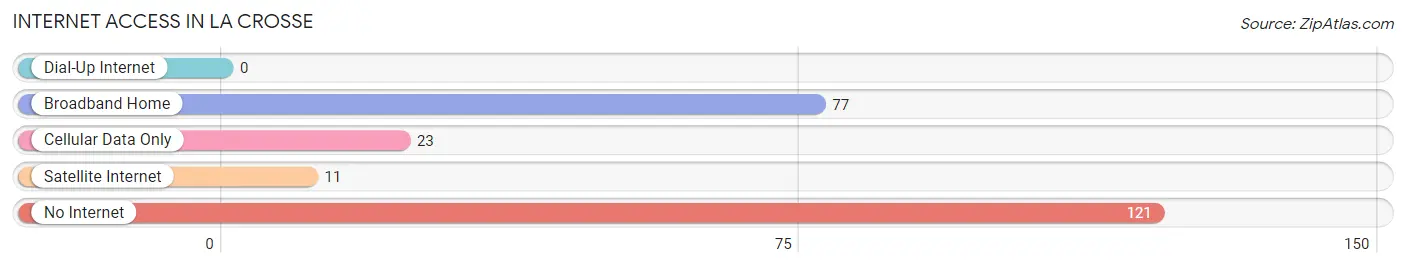
| Internet Type | # Households | % Households |
| Dial-Up Internet | 0 | 0.0% |
| Broadband Home | 77 | 33.9% |
| Cellular Data Only | 23 | 10.1% |
| Satellite Internet | 11 | 4.9% |
| No Internet | 121 | 53.3% |
| Total | 227 | 100.0% |
La Crosse Summary
La Crosse, Virginia is a small town located in Mecklenburg County, Virginia. It is situated on the banks of the Roanoke River, and is part of the Southside Virginia region. The town has a population of approximately 1,000 people, and is known for its rural charm and small-town atmosphere.
History
La Crosse was first settled in the late 1700s by a group of German immigrants. The town was originally known as “Crossroads” due to its location at the intersection of two major roads. In 1820, the town was officially incorporated as La Crosse, and the name was chosen to honor the French explorer La Salle, who explored the area in the 1600s.
The town grew slowly over the years, and by the mid-1800s, it had become a thriving agricultural community. The town was home to several mills, including a grist mill, a saw mill, and a cotton mill. The town also had a post office, a general store, and a blacksmith shop.
In the late 1800s, the town began to decline as the railroad bypassed it. The town’s population decreased, and many of the businesses closed. However, the town was able to survive due to its strong agricultural base.
Geography
La Crosse is located in the Southside Virginia region of the state. It is situated on the banks of the Roanoke River, and is surrounded by rolling hills and farmland. The town is located approximately 30 miles south of the state capital, Richmond.
The town has a total area of 1.2 square miles, all of which is land. The town is located at an elevation of approximately 400 feet above sea level.
Economy
The economy of La Crosse is largely based on agriculture. The town is home to several farms, and the surrounding area is known for its production of tobacco, corn, soybeans, and other crops.
The town also has a few small businesses, including a general store, a gas station, and a few restaurants. The town is also home to a few small manufacturing companies.
Demographics
As of the 2010 census, the population of La Crosse was 1,000 people. The racial makeup of the town was 95.2% White, 2.2% African American, 0.2% Native American, 0.2% Asian, 0.2% from other races, and 1.9% from two or more races. Hispanic or Latino of any race were 1.2% of the population.
The median income for a household in the town was $30,000, and the median income for a family was $35,000. The per capita income for the town was $14,000. About 15.2% of families and 17.2% of the population were below the poverty line, including 22.2% of those under age 18 and 8.2% of those age 65 or over.
Common Questions
What is Per Capita Income in La Crosse?
Per Capita income in La Crosse is $16,926.
What is the Median Family Income in La Crosse?
Median Family Income in La Crosse is $41,094.
What is the Median Household income in La Crosse?
Median Household Income in La Crosse is $34,306.
What is Income or Wage Gap in La Crosse?
Income or Wage Gap in La Crosse is 4.4%.
Women in La Crosse earn 95.6 cents for every dollar earned by a man.
What is Inequality or Gini Index in La Crosse?
Inequality or Gini Index in La Crosse is 0.37.
What is the Total Population of La Crosse?
Total Population of La Crosse is 565.
What is the Total Male Population of La Crosse?
Total Male Population of La Crosse is 296.
What is the Total Female Population of La Crosse?
Total Female Population of La Crosse is 269.
What is the Ratio of Males per 100 Females in La Crosse?
There are 110.04 Males per 100 Females in La Crosse.
What is the Ratio of Females per 100 Males in La Crosse?
There are 90.88 Females per 100 Males in La Crosse.
What is the Median Population Age in La Crosse?
Median Population Age in La Crosse is 51.1 Years.
What is the Average Family Size in La Crosse
Average Family Size in La Crosse is 2.9 People.
What is the Average Household Size in La Crosse
Average Household Size in La Crosse is 2.3 People.
How Large is the Labor Force in La Crosse?
There are 229 People in the Labor Forcein in La Crosse.
What is the Percentage of People in the Labor Force in La Crosse?
49.6% of People are in the Labor Force in La Crosse.
What is the Unemployment Rate in La Crosse?
Unemployment Rate in La Crosse is 2.6%.