Mount Jackson, VA Map & Demographics
Mount Jackson Map
Mount Jackson Overview
$23,804
PER CAPITA INCOME
$49,973
AVG FAMILY INCOME
$45,583
AVG HOUSEHOLD INCOME
30.5%
WAGE / INCOME GAP [ % ]
69.5¢/ $1
WAGE / INCOME GAP [ $ ]
$10,577
FAMILY INCOME DEFICIT
0.42
INEQUALITY / GINI INDEX
1,833
TOTAL POPULATION
806
MALE POPULATION
1,027
FEMALE POPULATION
78.48
MALES / 100 FEMALES
127.42
FEMALES / 100 MALES
37.9
MEDIAN AGE
3.3
AVG FAMILY SIZE
2.5
AVG HOUSEHOLD SIZE
897
LABOR FORCE [ PEOPLE ]
64.4%
PERCENT IN LABOR FORCE
10.7%
UNEMPLOYMENT RATE
Mount Jackson Zip Codes
Mount Jackson Area Codes
Income in Mount Jackson
Income Overview in Mount Jackson
Per Capita Income in Mount Jackson is $23,804, while median incomes of families and households are $49,973 and $45,583 respectively.
| Characteristic | Number | Measure |
| Per Capita Income | 1,833 | $23,804 |
| Median Family Income | 425 | $49,973 |
| Mean Family Income | 425 | $68,429 |
| Median Household Income | 714 | $45,583 |
| Mean Household Income | 714 | $57,212 |
| Income Deficit | 425 | $10,577 |
| Wage / Income Gap (%) | 1,833 | 30.53% |
| Wage / Income Gap ($) | 1,833 | 69.47¢ per $1 |
| Gini / Inequality Index | 1,833 | 0.42 |
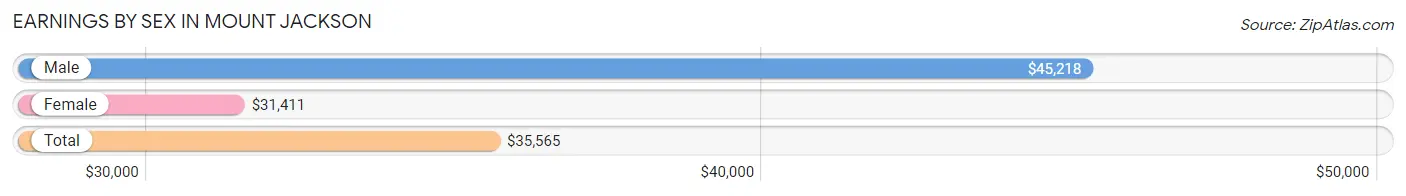
Earnings by Sex in Mount Jackson
Average Earnings in Mount Jackson are $35,565, $45,218 for men and $31,411 for women, a difference of 30.5%.
| Sex | Number | Average Earnings |
| Male | 464 (48.7%) | $45,218 |
| Female | 489 (51.3%) | $31,411 |
| Total | 953 (100.0%) | $35,565 |
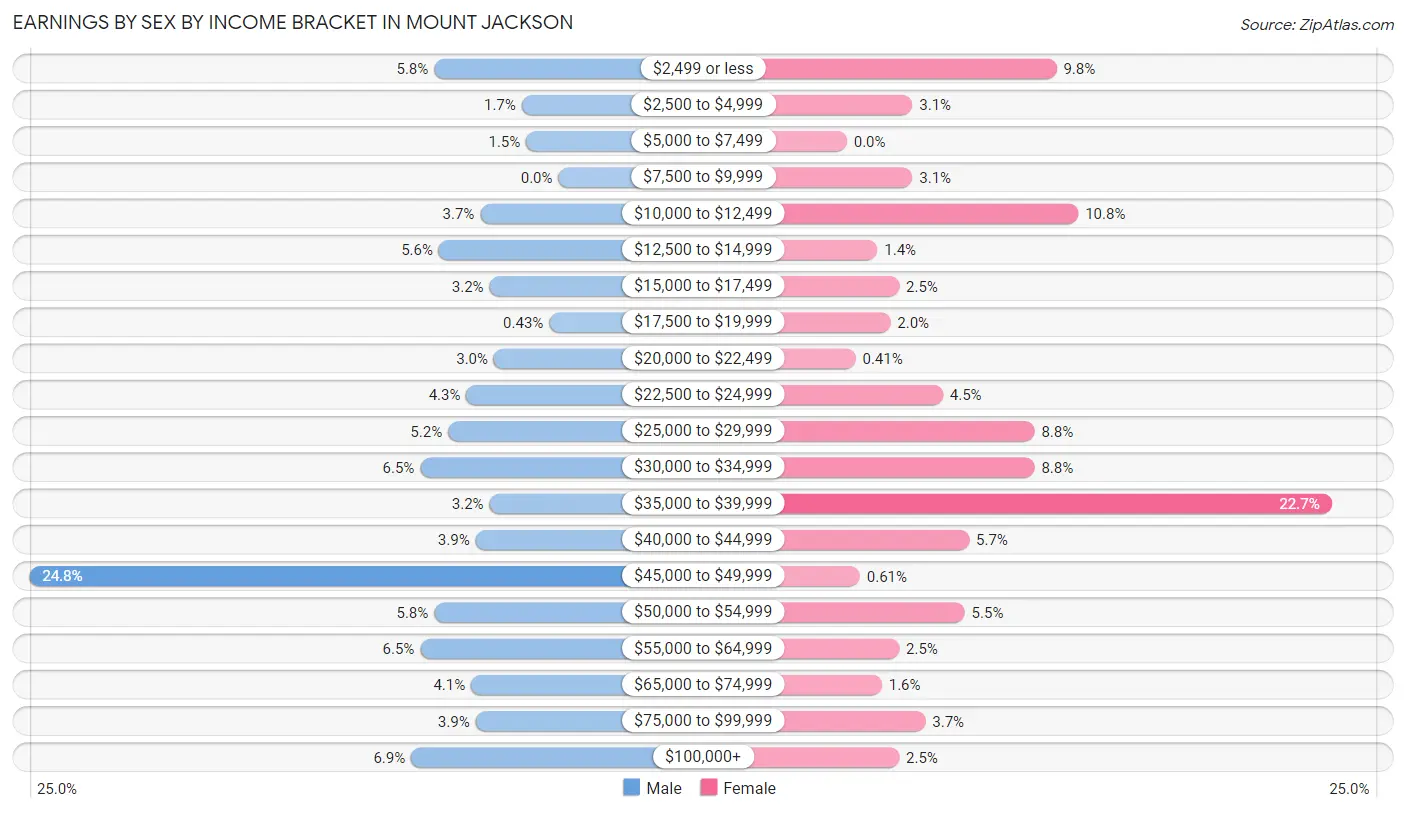
Earnings by Sex by Income Bracket in Mount Jackson
The most common earnings brackets in Mount Jackson are $45,000 to $49,999 for men (115 | 24.8%) and $35,000 to $39,999 for women (111 | 22.7%).
| Income | Male | Female |
| $2,499 or less | 27 (5.8%) | 48 (9.8%) |
| $2,500 to $4,999 | 8 (1.7%) | 15 (3.1%) |
| $5,000 to $7,499 | 7 (1.5%) | 0 (0.0%) |
| $7,500 to $9,999 | 0 (0.0%) | 15 (3.1%) |
| $10,000 to $12,499 | 17 (3.7%) | 53 (10.8%) |
| $12,500 to $14,999 | 26 (5.6%) | 7 (1.4%) |
| $15,000 to $17,499 | 15 (3.2%) | 12 (2.5%) |
| $17,500 to $19,999 | 2 (0.4%) | 10 (2.0%) |
| $20,000 to $22,499 | 14 (3.0%) | 2 (0.4%) |
| $22,500 to $24,999 | 20 (4.3%) | 22 (4.5%) |
| $25,000 to $29,999 | 24 (5.2%) | 43 (8.8%) |
| $30,000 to $34,999 | 30 (6.5%) | 43 (8.8%) |
| $35,000 to $39,999 | 15 (3.2%) | 111 (22.7%) |
| $40,000 to $44,999 | 18 (3.9%) | 28 (5.7%) |
| $45,000 to $49,999 | 115 (24.8%) | 3 (0.6%) |
| $50,000 to $54,999 | 27 (5.8%) | 27 (5.5%) |
| $55,000 to $64,999 | 30 (6.5%) | 12 (2.5%) |
| $65,000 to $74,999 | 19 (4.1%) | 8 (1.6%) |
| $75,000 to $99,999 | 18 (3.9%) | 18 (3.7%) |
| $100,000+ | 32 (6.9%) | 12 (2.5%) |
| Total | 464 (100.0%) | 489 (100.0%) |
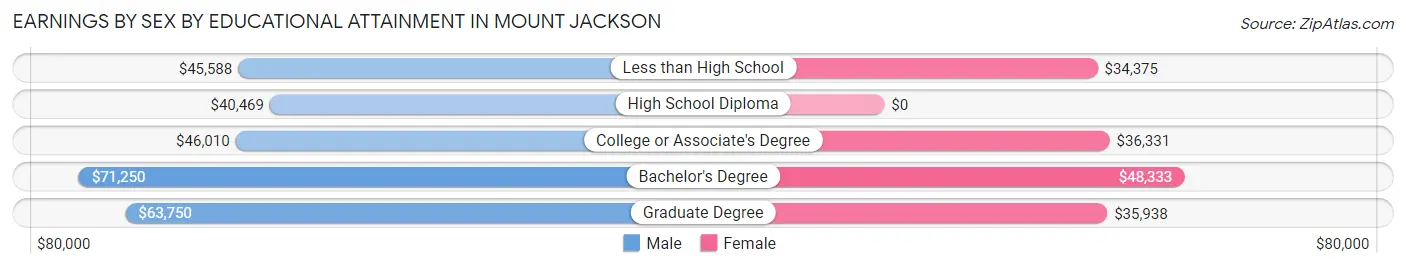
Earnings by Sex by Educational Attainment in Mount Jackson
Average earnings in Mount Jackson are $46,035 for men and $35,582 for women, a difference of 22.7%. Men with an educational attainment of bachelor's degree enjoy the highest average annual earnings of $71,250, while those with high school diploma education earn the least with $40,469. Women with an educational attainment of bachelor's degree earn the most with the average annual earnings of $48,333, while those with less than high school education have the smallest earnings of $34,375.
| Educational Attainment | Male Income | Female Income |
| Less than High School | $45,588 | $34,375 |
| High School Diploma | $40,469 | $0 |
| College or Associate's Degree | $46,010 | $36,331 |
| Bachelor's Degree | $71,250 | $48,333 |
| Graduate Degree | $63,750 | $35,938 |
| Total | $46,035 | $35,582 |
Family Income in Mount Jackson
Family Income Brackets in Mount Jackson
According to the Mount Jackson family income data, there are 124 families falling into the $35,000 to $49,999 income range, which is the most common income bracket and makes up 29.2% of all families. Conversely, the $200,000+ income bracket is the least frequent group with only 6 families (1.4%) belonging to this category.
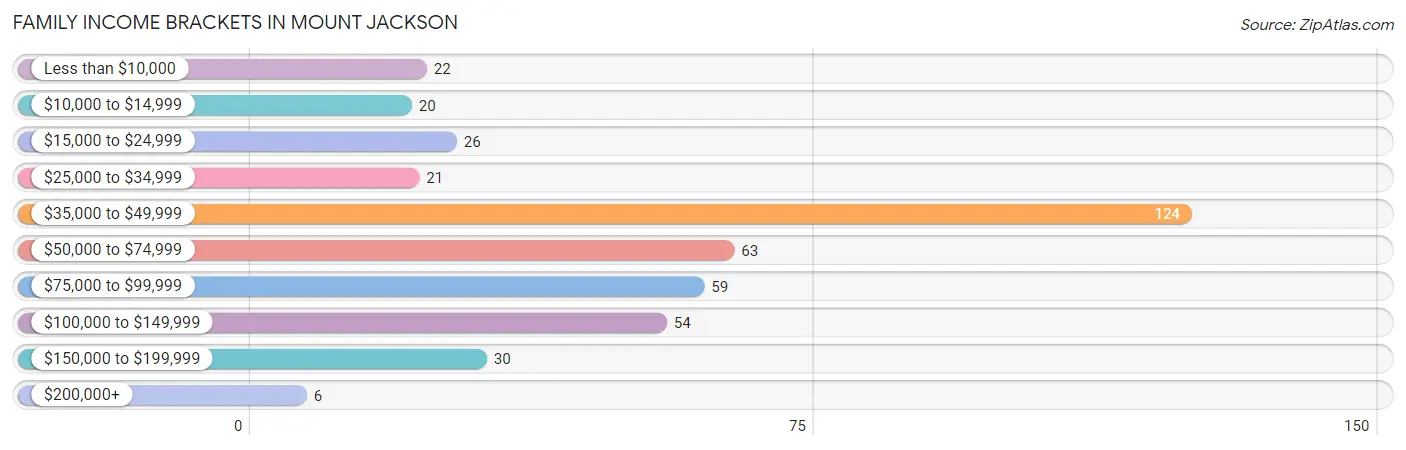
| Income Bracket | # Families | % Families |
| Less than $10,000 | 22 | 5.2% |
| $10,000 to $14,999 | 20 | 4.7% |
| $15,000 to $24,999 | 26 | 6.1% |
| $25,000 to $34,999 | 21 | 4.9% |
| $35,000 to $49,999 | 124 | 29.2% |
| $50,000 to $74,999 | 63 | 14.8% |
| $75,000 to $99,999 | 59 | 13.9% |
| $100,000 to $149,999 | 54 | 12.7% |
| $150,000 to $199,999 | 30 | 7.1% |
| $200,000+ | 6 | 1.4% |
Family Income by Famaliy Size in Mount Jackson
4-person families (49 | 11.5%) account for the highest median family income in Mount Jackson with $90,938 per family, while 2-person families (243 | 57.2%) have the highest median income of $24,244 per family member.
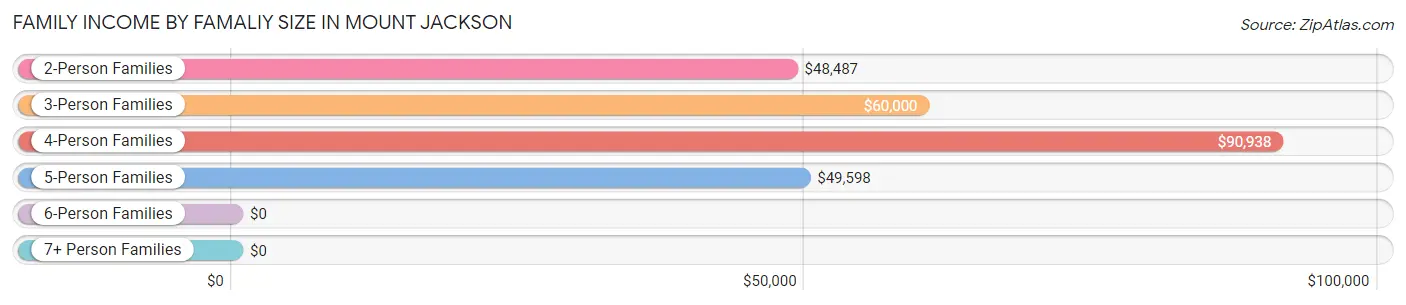
| Income Bracket | # Families | Median Income |
| 2-Person Families | 243 (57.2%) | $48,487 |
| 3-Person Families | 68 (16.0%) | $60,000 |
| 4-Person Families | 49 (11.5%) | $90,938 |
| 5-Person Families | 63 (14.8%) | $49,598 |
| 6-Person Families | 0 (0.0%) | $0 |
| 7+ Person Families | 2 (0.5%) | $0 |
| Total | 425 (100.0%) | $49,973 |
Family Income by Number of Earners in Mount Jackson
The median family income in Mount Jackson is $49,973, with families comprising 3+ earners (50) having the highest median family income of $126,250, while families with no earners (66) have the lowest median family income of $33,250, accounting for 11.8% and 15.5% of families, respectively.
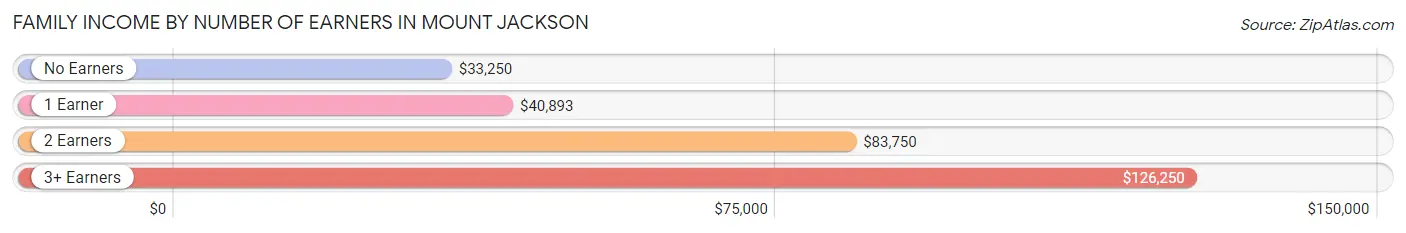
| Number of Earners | # Families | Median Income |
| No Earners | 66 (15.5%) | $33,250 |
| 1 Earner | 149 (35.1%) | $40,893 |
| 2 Earners | 160 (37.7%) | $83,750 |
| 3+ Earners | 50 (11.8%) | $126,250 |
| Total | 425 (100.0%) | $49,973 |
Household Income in Mount Jackson
Household Income Brackets in Mount Jackson
With 153 households falling in the category, the $35,000 to $49,999 income range is the most frequent in Mount Jackson, accounting for 21.4% of all households. In contrast, only 6 households (0.8%) fall into the $200,000+ income bracket, making it the least populous group.
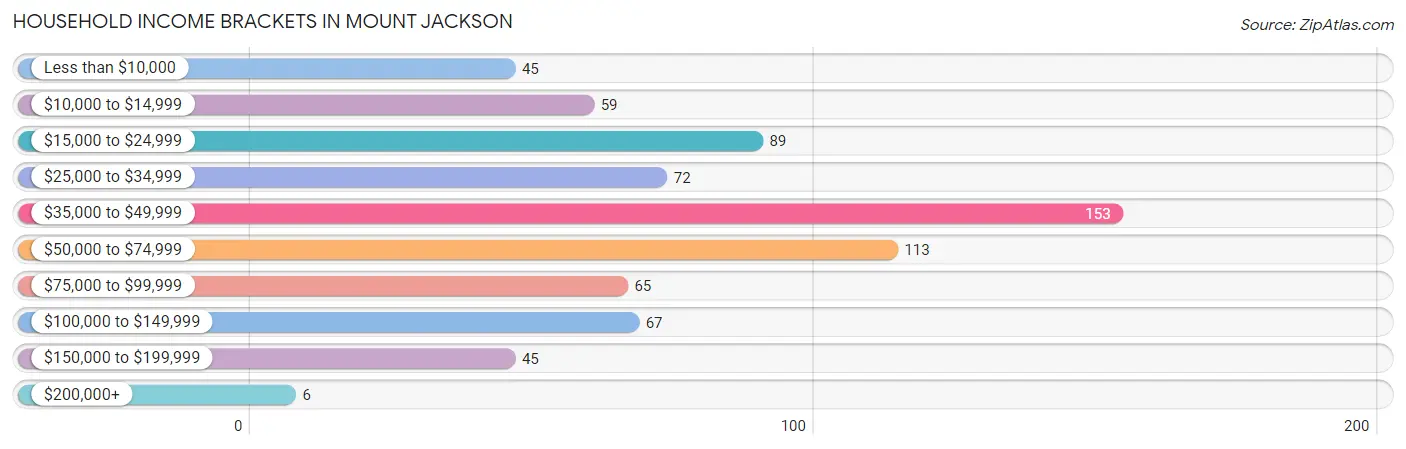
| Income Bracket | # Households | % Households |
| Less than $10,000 | 45 | 6.3% |
| $10,000 to $14,999 | 59 | 8.3% |
| $15,000 to $24,999 | 89 | 12.5% |
| $25,000 to $34,999 | 72 | 10.1% |
| $35,000 to $49,999 | 153 | 21.4% |
| $50,000 to $74,999 | 113 | 15.8% |
| $75,000 to $99,999 | 65 | 9.1% |
| $100,000 to $149,999 | 67 | 9.4% |
| $150,000 to $199,999 | 45 | 6.3% |
| $200,000+ | 6 | 0.8% |
Household Income by Householder Age in Mount Jackson
The median household income in Mount Jackson is $45,583, with the highest median household income of $51,500 found in the 45 to 64 years age bracket for the primary householder. A total of 300 households (42.0%) fall into this category. Meanwhile, the 15 to 24 years age bracket for the primary householder has the lowest median household income of $0, with 35 households (4.9%) in this group.
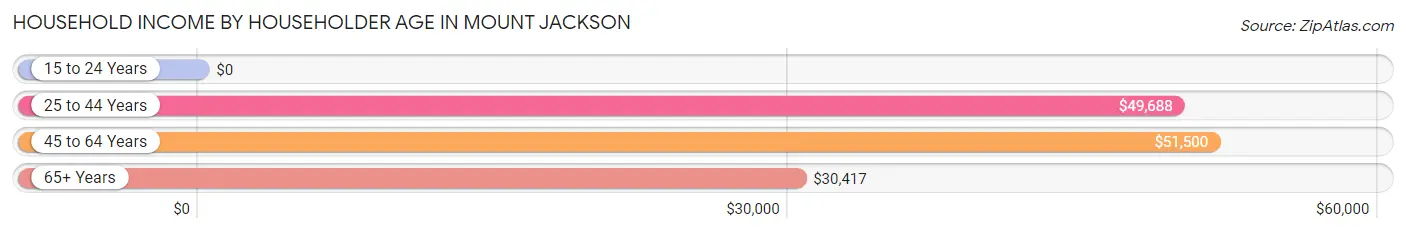
| Income Bracket | # Households | Median Income |
| 15 to 24 Years | 35 (4.9%) | $0 |
| 25 to 44 Years | 201 (28.1%) | $49,688 |
| 45 to 64 Years | 300 (42.0%) | $51,500 |
| 65+ Years | 178 (24.9%) | $30,417 |
| Total | 714 (100.0%) | $45,583 |
Poverty in Mount Jackson
Income Below Poverty by Sex and Age in Mount Jackson
With 18.9% poverty level for males and 16.7% for females among the residents of Mount Jackson, 12 to 14 year old males and 5 year old females are the most vulnerable to poverty, with 9 males (100.0%) and 10 females (50.0%) in their respective age groups living below the poverty level.
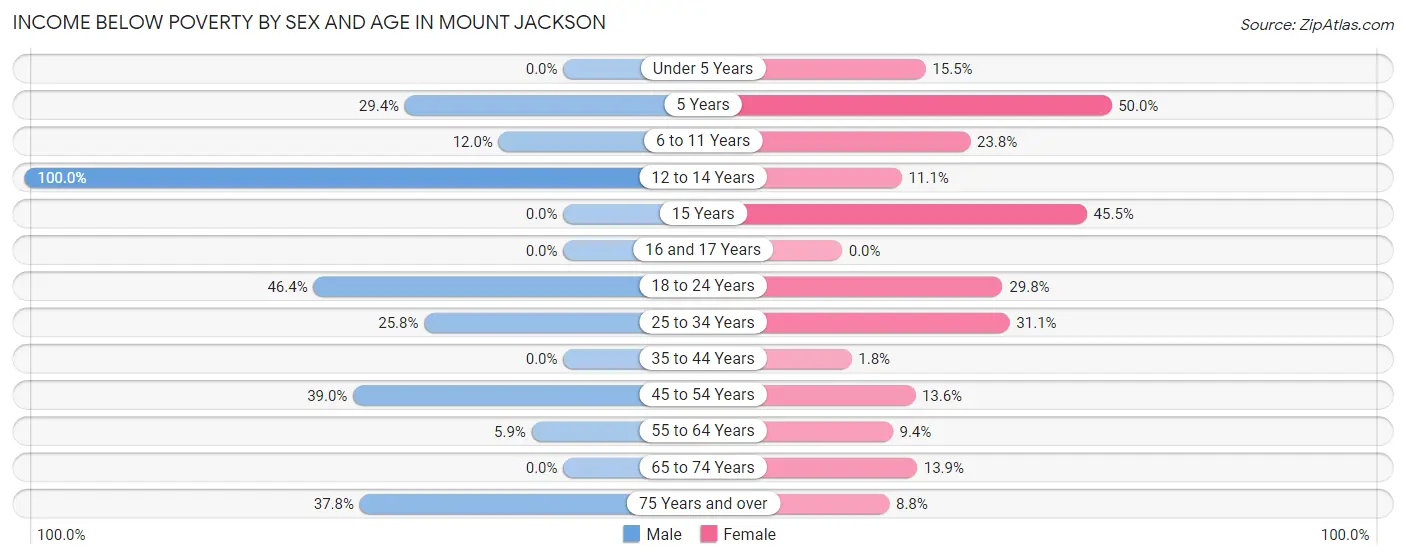
| Age Bracket | Male | Female |
| Under 5 Years | 0 (0.0%) | 18 (15.5%) |
| 5 Years | 5 (29.4%) | 10 (50.0%) |
| 6 to 11 Years | 12 (12.0%) | 20 (23.8%) |
| 12 to 14 Years | 9 (100.0%) | 3 (11.1%) |
| 15 Years | 0 (0.0%) | 5 (45.5%) |
| 16 and 17 Years | 0 (0.0%) | 0 (0.0%) |
| 18 to 24 Years | 32 (46.4%) | 31 (29.8%) |
| 25 to 34 Years | 16 (25.8%) | 28 (31.1%) |
| 35 to 44 Years | 0 (0.0%) | 2 (1.8%) |
| 45 to 54 Years | 55 (39.0%) | 22 (13.6%) |
| 55 to 64 Years | 6 (5.9%) | 13 (9.4%) |
| 65 to 74 Years | 0 (0.0%) | 11 (13.9%) |
| 75 Years and over | 17 (37.8%) | 5 (8.8%) |
| Total | 152 (18.9%) | 168 (16.7%) |
Income Above Poverty by Sex and Age in Mount Jackson
According to the poverty statistics in Mount Jackson, males aged under 5 years and females aged 16 and 17 years are the age groups that are most secure financially, with 100.0% of males and 100.0% of females in these age groups living above the poverty line.
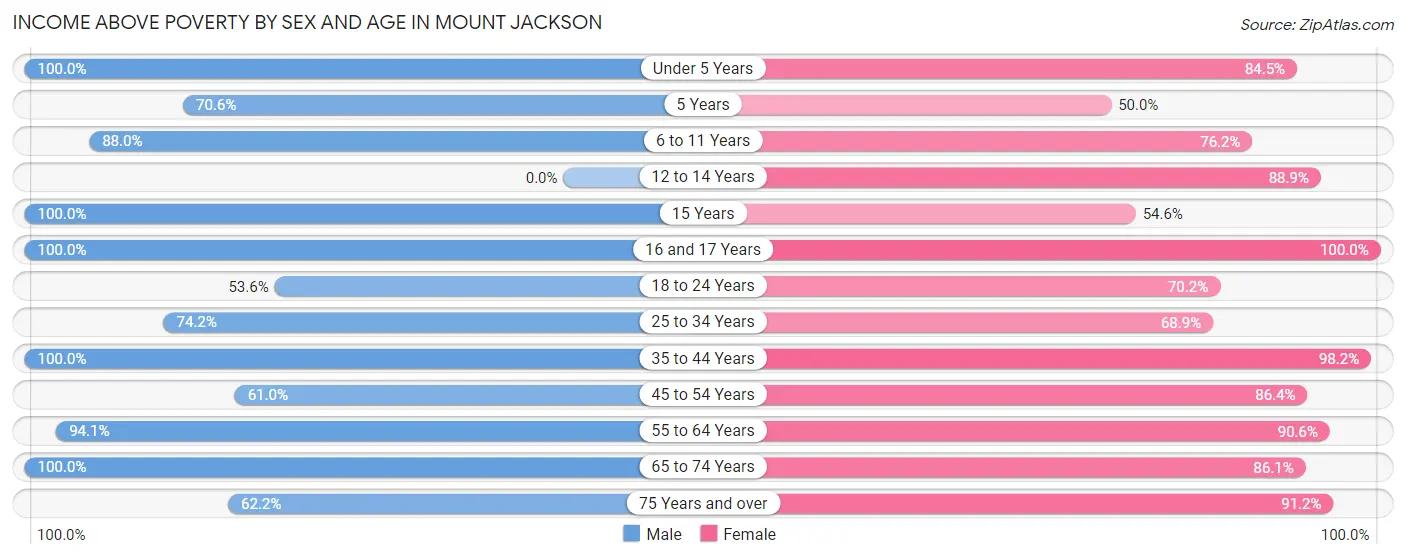
| Age Bracket | Male | Female |
| Under 5 Years | 21 (100.0%) | 98 (84.5%) |
| 5 Years | 12 (70.6%) | 10 (50.0%) |
| 6 to 11 Years | 88 (88.0%) | 64 (76.2%) |
| 12 to 14 Years | 0 (0.0%) | 24 (88.9%) |
| 15 Years | 14 (100.0%) | 6 (54.5%) |
| 16 and 17 Years | 23 (100.0%) | 5 (100.0%) |
| 18 to 24 Years | 37 (53.6%) | 73 (70.2%) |
| 25 to 34 Years | 46 (74.2%) | 62 (68.9%) |
| 35 to 44 Years | 115 (100.0%) | 111 (98.2%) |
| 45 to 54 Years | 86 (61.0%) | 140 (86.4%) |
| 55 to 64 Years | 96 (94.1%) | 125 (90.6%) |
| 65 to 74 Years | 88 (100.0%) | 68 (86.1%) |
| 75 Years and over | 28 (62.2%) | 52 (91.2%) |
| Total | 654 (81.1%) | 838 (83.3%) |
Income Below Poverty Among Married-Couple Families in Mount Jackson
The poverty statistics for married-couple families in Mount Jackson show that 5.5% or 15 of the total 273 families live below the poverty line. Families with 1 or 2 children have the highest poverty rate of 13.3%, comprising of 10 families. On the other hand, families with 3 or 4 children have the lowest poverty rate of 0.0%, which includes 0 families.
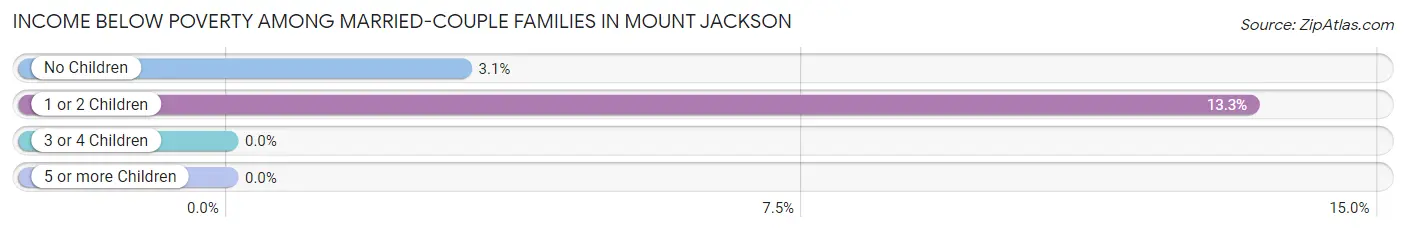
| Children | Above Poverty | Below Poverty |
| No Children | 159 (97.0%) | 5 (3.0%) |
| 1 or 2 Children | 65 (86.7%) | 10 (13.3%) |
| 3 or 4 Children | 34 (100.0%) | 0 (0.0%) |
| 5 or more Children | 0 (0.0%) | 0 (0.0%) |
| Total | 258 (94.5%) | 15 (5.5%) |
Income Below Poverty Among Single-Parent Households in Mount Jackson
According to the poverty data in Mount Jackson, 35.7% or 15 single-father households and 29.1% or 32 single-mother households are living below the poverty line. Among single-father households, those with no children have the highest poverty rate, with 10 households (35.7%) experiencing poverty. Likewise, among single-mother households, those with 3 or 4 children have the highest poverty rate, with 12 households (100.0%) falling below the poverty line.
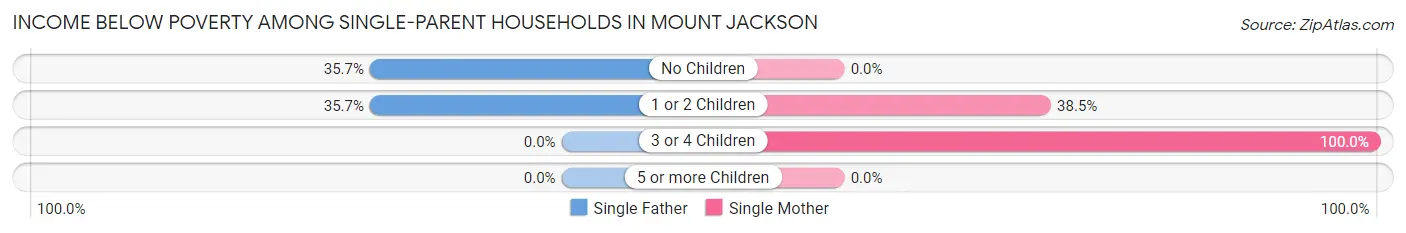
| Children | Single Father | Single Mother |
| No Children | 10 (35.7%) | 0 (0.0%) |
| 1 or 2 Children | 5 (35.7%) | 20 (38.5%) |
| 3 or 4 Children | 0 (0.0%) | 12 (100.0%) |
| 5 or more Children | 0 (0.0%) | 0 (0.0%) |
| Total | 15 (35.7%) | 32 (29.1%) |
Income Below Poverty Among Married-Couple vs Single-Parent Households in Mount Jackson
The poverty data for Mount Jackson shows that 15 of the married-couple family households (5.5%) and 47 of the single-parent households (30.9%) are living below the poverty level. Within the married-couple family households, those with 1 or 2 children have the highest poverty rate, with 10 households (13.3%) falling below the poverty line. Among the single-parent households, those with 3 or 4 children have the highest poverty rate, with 12 household (100.0%) living below poverty.
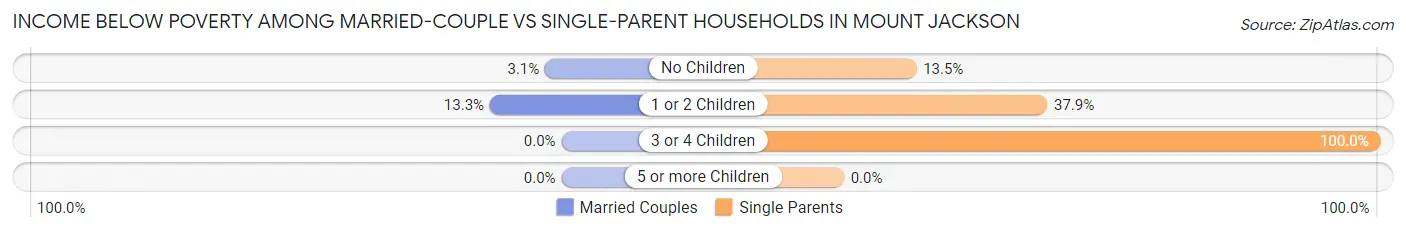
| Children | Married-Couple Families | Single-Parent Households |
| No Children | 5 (3.0%) | 10 (13.5%) |
| 1 or 2 Children | 10 (13.3%) | 25 (37.9%) |
| 3 or 4 Children | 0 (0.0%) | 12 (100.0%) |
| 5 or more Children | 0 (0.0%) | 0 (0.0%) |
| Total | 15 (5.5%) | 47 (30.9%) |
Race in Mount Jackson
The most populous races in Mount Jackson are White / Caucasian (1,475 | 80.5%), Hispanic or Latino (627 | 34.2%), and Two or more Races (130 | 7.1%).
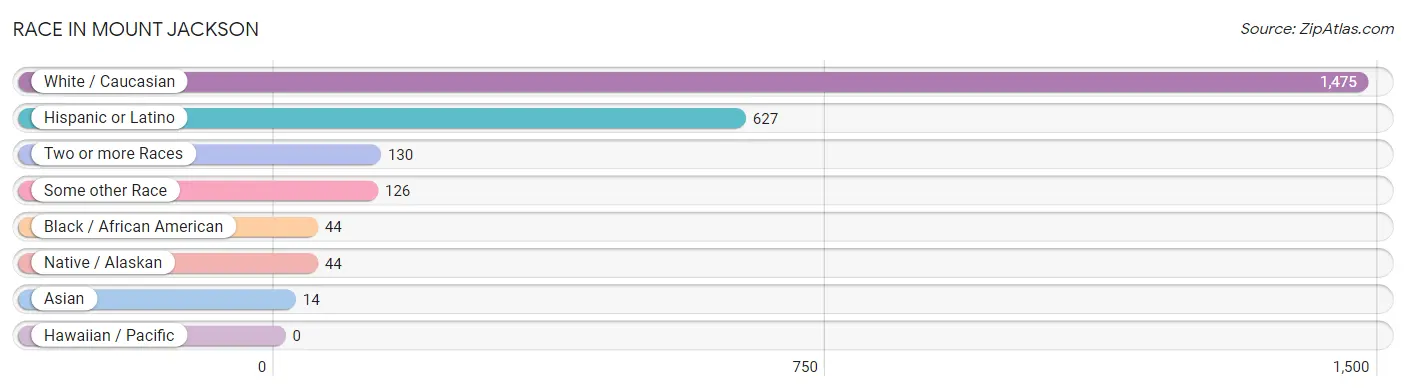
| Race | # Population | % Population |
| Asian | 14 | 0.8% |
| Black / African American | 44 | 2.4% |
| Hawaiian / Pacific | 0 | 0.0% |
| Hispanic or Latino | 627 | 34.2% |
| Native / Alaskan | 44 | 2.4% |
| White / Caucasian | 1,475 | 80.5% |
| Two or more Races | 130 | 7.1% |
| Some other Race | 126 | 6.9% |
| Total | 1,833 | 100.0% |
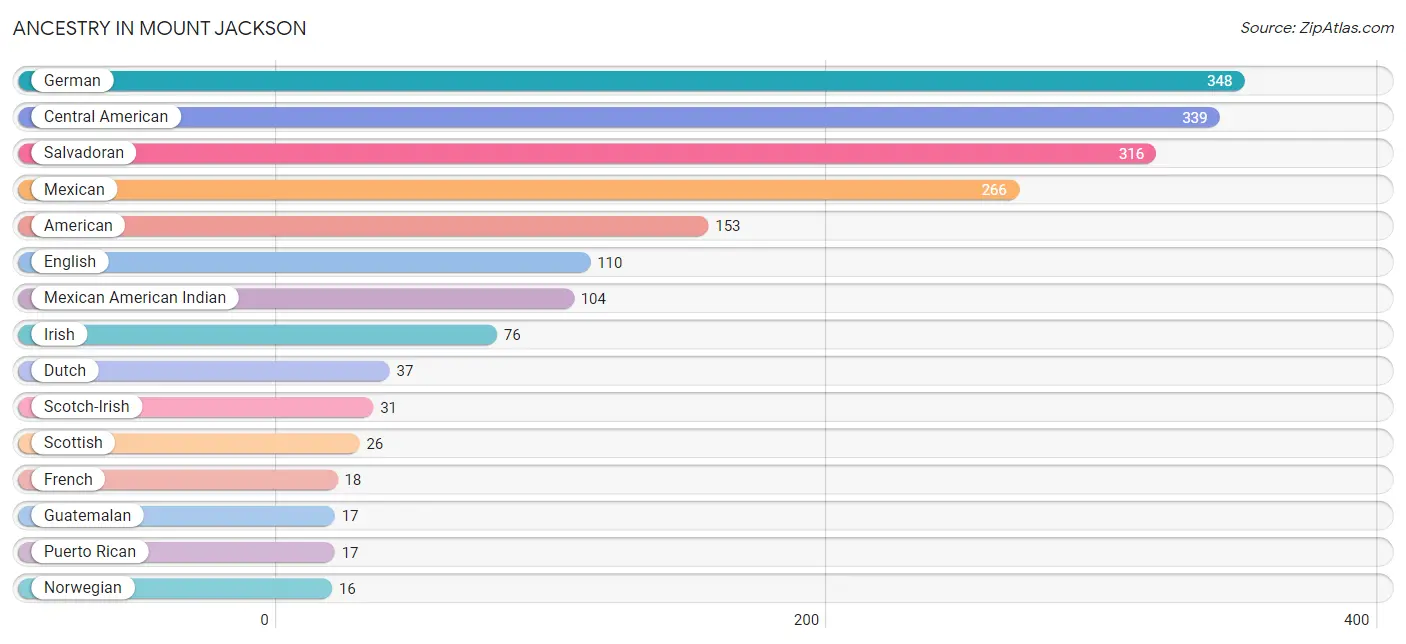
Ancestry in Mount Jackson
The most populous ancestries reported in Mount Jackson are German (348 | 19.0%), Central American (339 | 18.5%), Salvadoran (316 | 17.2%), Mexican (266 | 14.5%), and American (153 | 8.4%), together accounting for 77.6% of all Mount Jackson residents.
| Ancestry | # Population | % Population |
| African | 2 | 0.1% |
| American | 153 | 8.4% |
| Burmese | 9 | 0.5% |
| Canadian | 3 | 0.2% |
| Central American | 339 | 18.5% |
| Chippewa | 3 | 0.2% |
| Croatian | 3 | 0.2% |
| Dominican | 2 | 0.1% |
| Dutch | 37 | 2.0% |
| English | 110 | 6.0% |
| Ethiopian | 4 | 0.2% |
| French | 18 | 1.0% |
| German | 348 | 19.0% |
| Guatemalan | 17 | 0.9% |
| Hungarian | 3 | 0.2% |
| Indian (Asian) | 5 | 0.3% |
| Irish | 76 | 4.2% |
| Italian | 11 | 0.6% |
| Korean | 9 | 0.5% |
| Mexican | 266 | 14.5% |
| Mexican American Indian | 104 | 5.7% |
| Nicaraguan | 6 | 0.3% |
| Norwegian | 16 | 0.9% |
| Polish | 3 | 0.2% |
| Puerto Rican | 17 | 0.9% |
| Salvadoran | 316 | 17.2% |
| Scandinavian | 2 | 0.1% |
| Scotch-Irish | 31 | 1.7% |
| Scottish | 26 | 1.4% |
| Slovak | 9 | 0.5% |
| Subsaharan African | 12 | 0.6% |
| Swedish | 10 | 0.5% |
| Swiss | 3 | 0.2% |
| Welsh | 8 | 0.4% | View All 34 Rows |
Immigrants in Mount Jackson
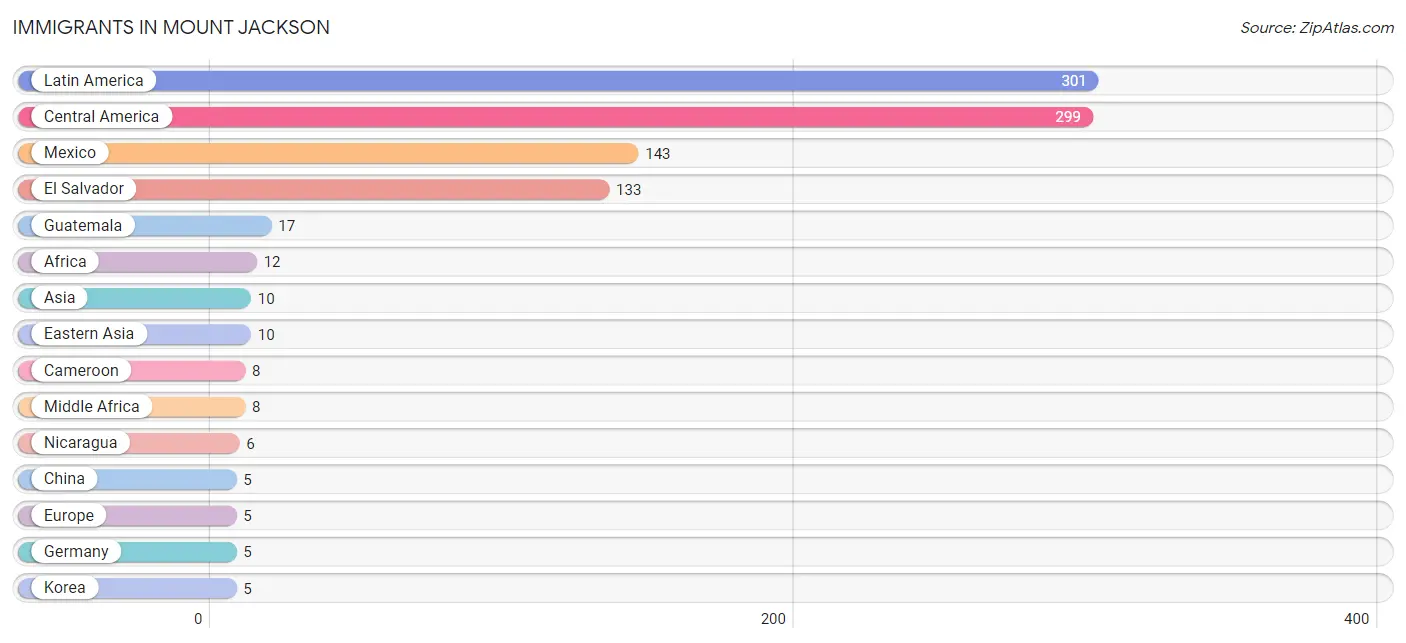
The most numerous immigrant groups reported in Mount Jackson came from Latin America (301 | 16.4%), Central America (299 | 16.3%), Mexico (143 | 7.8%), El Salvador (133 | 7.3%), and Guatemala (17 | 0.9%), together accounting for 48.7% of all Mount Jackson residents.
| Immigration Origin | # Population | % Population |
| Africa | 12 | 0.6% |
| Asia | 10 | 0.5% |
| Cameroon | 8 | 0.4% |
| Caribbean | 2 | 0.1% |
| Central America | 299 | 16.3% |
| China | 5 | 0.3% |
| Dominican Republic | 2 | 0.1% |
| Eastern Africa | 4 | 0.2% |
| Eastern Asia | 10 | 0.5% |
| El Salvador | 133 | 7.3% |
| Ethiopia | 4 | 0.2% |
| Europe | 5 | 0.3% |
| Germany | 5 | 0.3% |
| Guatemala | 17 | 0.9% |
| Korea | 5 | 0.3% |
| Latin America | 301 | 16.4% |
| Mexico | 143 | 7.8% |
| Middle Africa | 8 | 0.4% |
| Nicaragua | 6 | 0.3% |
| Western Europe | 5 | 0.3% | View All 20 Rows |
Sex and Age in Mount Jackson
Sex and Age in Mount Jackson
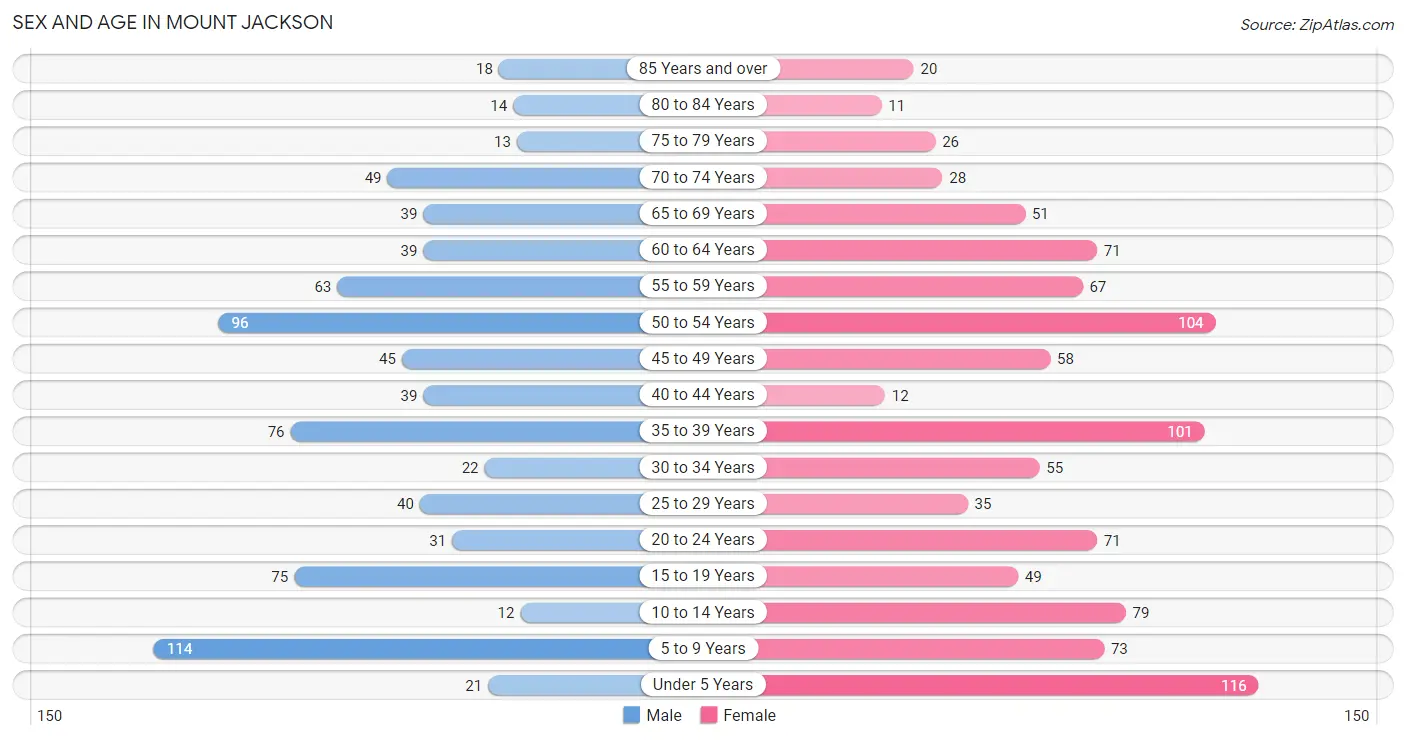
The most populous age groups in Mount Jackson are 5 to 9 Years (114 | 14.1%) for men and Under 5 Years (116 | 11.3%) for women.
| Age Bracket | Male | Female |
| Under 5 Years | 21 (2.6%) | 116 (11.3%) |
| 5 to 9 Years | 114 (14.1%) | 73 (7.1%) |
| 10 to 14 Years | 12 (1.5%) | 79 (7.7%) |
| 15 to 19 Years | 75 (9.3%) | 49 (4.8%) |
| 20 to 24 Years | 31 (3.8%) | 71 (6.9%) |
| 25 to 29 Years | 40 (5.0%) | 35 (3.4%) |
| 30 to 34 Years | 22 (2.7%) | 55 (5.4%) |
| 35 to 39 Years | 76 (9.4%) | 101 (9.8%) |
| 40 to 44 Years | 39 (4.8%) | 12 (1.2%) |
| 45 to 49 Years | 45 (5.6%) | 58 (5.7%) |
| 50 to 54 Years | 96 (11.9%) | 104 (10.1%) |
| 55 to 59 Years | 63 (7.8%) | 67 (6.5%) |
| 60 to 64 Years | 39 (4.8%) | 71 (6.9%) |
| 65 to 69 Years | 39 (4.8%) | 51 (5.0%) |
| 70 to 74 Years | 49 (6.1%) | 28 (2.7%) |
| 75 to 79 Years | 13 (1.6%) | 26 (2.5%) |
| 80 to 84 Years | 14 (1.7%) | 11 (1.1%) |
| 85 Years and over | 18 (2.2%) | 20 (1.9%) |
| Total | 806 (100.0%) | 1,027 (100.0%) |
Families and Households in Mount Jackson
Median Family Size in Mount Jackson
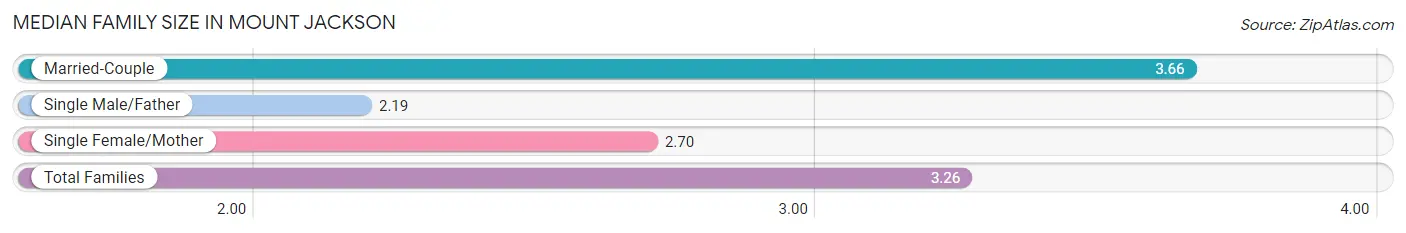
The median family size in Mount Jackson is 3.26 persons per family, with married-couple families (273 | 64.2%) accounting for the largest median family size of 3.66 persons per family. On the other hand, single male/father families (42 | 9.9%) represent the smallest median family size with 2.19 persons per family.
| Family Type | # Families | Family Size |
| Married-Couple | 273 (64.2%) | 3.66 |
| Single Male/Father | 42 (9.9%) | 2.19 |
| Single Female/Mother | 110 (25.9%) | 2.70 |
| Total Families | 425 (100.0%) | 3.26 |
Median Household Size in Mount Jackson
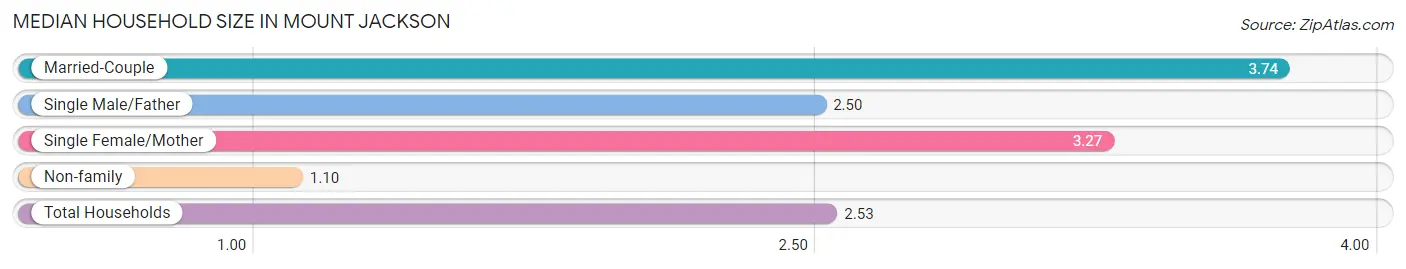
The median household size in Mount Jackson is 2.53 persons per household, with married-couple households (273 | 38.2%) accounting for the largest median household size of 3.74 persons per household. non-family households (289 | 40.5%) represent the smallest median household size with 1.10 persons per household.
| Household Type | # Households | Household Size |
| Married-Couple | 273 (38.2%) | 3.74 |
| Single Male/Father | 42 (5.9%) | 2.50 |
| Single Female/Mother | 110 (15.4%) | 3.27 |
| Non-family | 289 (40.5%) | 1.10 |
| Total Households | 714 (100.0%) | 2.53 |
Household Size by Marriage Status in Mount Jackson
Out of a total of 714 households in Mount Jackson, 425 (59.5%) are family households, while 289 (40.5%) are nonfamily households. The most numerous type of family households are 2-person households, comprising 196, and the most common type of nonfamily households are 1-person households, comprising 256.
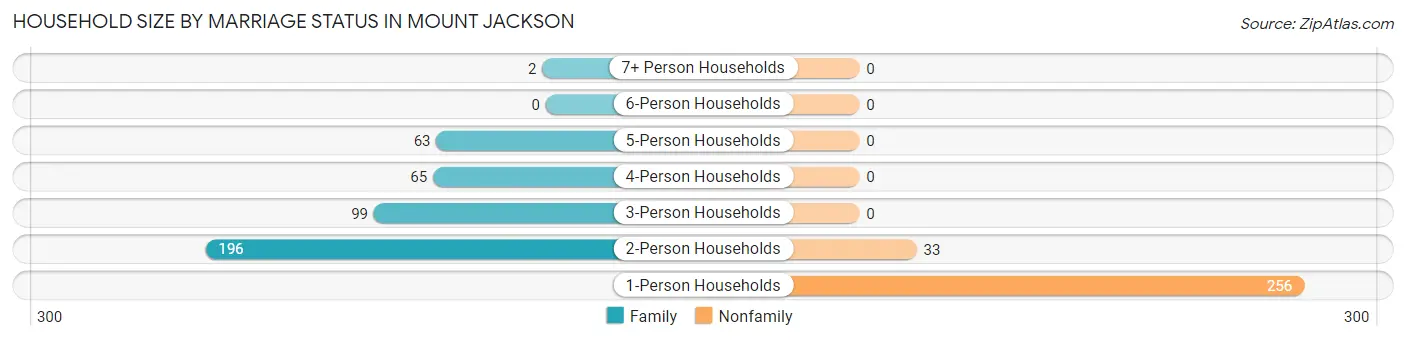
| Household Size | Family Households | Nonfamily Households |
| 1-Person Households | - | 256 (35.8%) |
| 2-Person Households | 196 (27.5%) | 33 (4.6%) |
| 3-Person Households | 99 (13.9%) | 0 (0.0%) |
| 4-Person Households | 65 (9.1%) | 0 (0.0%) |
| 5-Person Households | 63 (8.8%) | 0 (0.0%) |
| 6-Person Households | 0 (0.0%) | 0 (0.0%) |
| 7+ Person Households | 2 (0.3%) | 0 (0.0%) |
| Total | 425 (59.5%) | 289 (40.5%) |
Female Fertility in Mount Jackson
Fertility by Age in Mount Jackson
Average fertility rate in Mount Jackson is 24.0 births per 1,000 women. Women in the age bracket of 20 to 34 years have the highest fertility rate with 37.0 births per 1,000 women. Women in the age bracket of 20 to 34 years acount for 60.0% of all women with births.
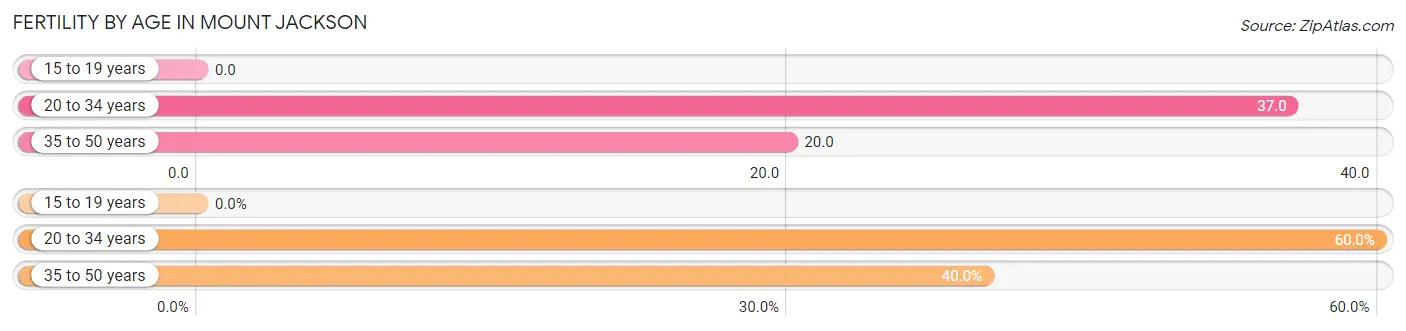
| Age Bracket | Women with Births | Births / 1,000 Women |
| 15 to 19 years | 0 (0.0%) | 0.0 |
| 20 to 34 years | 6 (60.0%) | 37.0 |
| 35 to 50 years | 4 (40.0%) | 20.0 |
| Total | 10 (100.0%) | 24.0 |
Fertility by Age by Marriage Status in Mount Jackson
30.0% of women with births (10) in Mount Jackson are married. The highest percentage of unmarried women with births falls into 35 to 50 years age bracket with 100.0% of them unmarried at the time of birth, while the lowest percentage of unmarried women with births belong to 20 to 34 years age bracket with 50.0% of them unmarried.
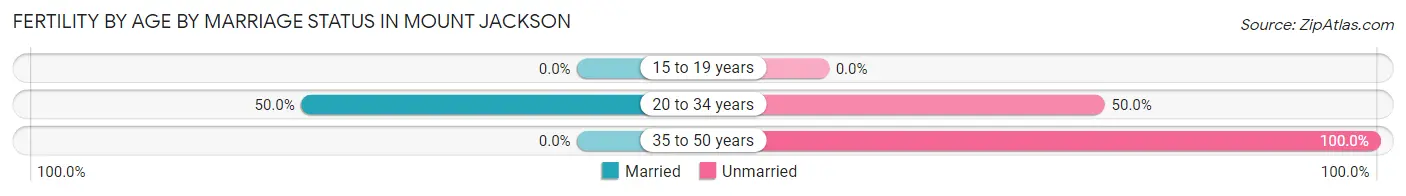
| Age Bracket | Married | Unmarried |
| 15 to 19 years | 0 (0.0%) | 0 (0.0%) |
| 20 to 34 years | 3 (50.0%) | 3 (50.0%) |
| 35 to 50 years | 0 (0.0%) | 4 (100.0%) |
| Total | 3 (30.0%) | 7 (70.0%) |
Fertility by Education in Mount Jackson
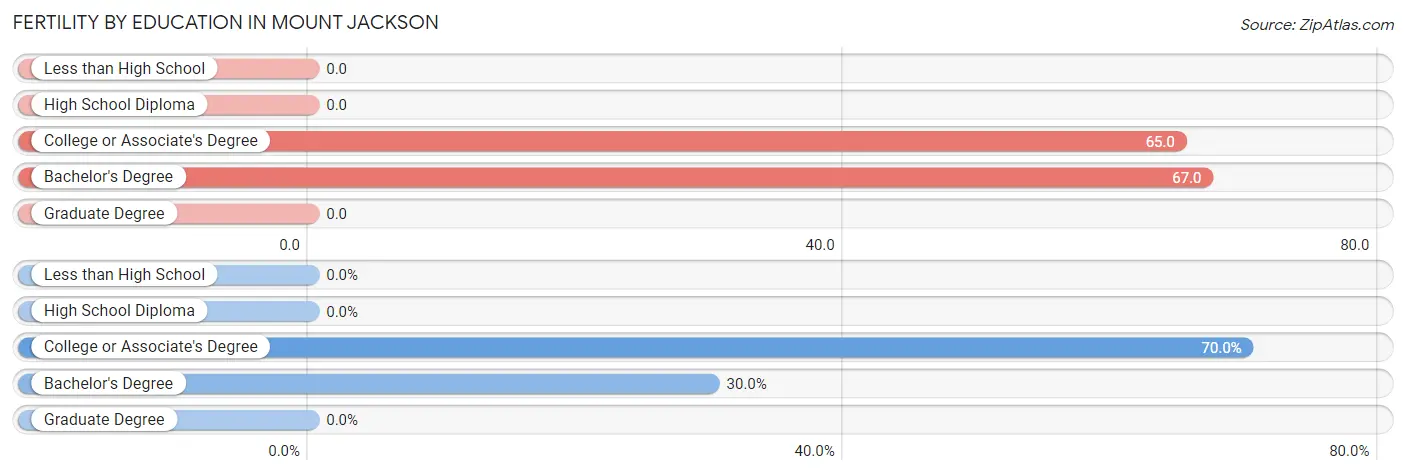
| Educational Attainment | Women with Births | Births / 1,000 Women |
| Less than High School | 0 (0.0%) | 0.0 |
| High School Diploma | 0 (0.0%) | 0.0 |
| College or Associate's Degree | 7 (70.0%) | 65.0 |
| Bachelor's Degree | 3 (30.0%) | 67.0 |
| Graduate Degree | 0 (0.0%) | 0.0 |
| Total | 10 (100.0%) | 24.0 |
Fertility by Education by Marriage Status in Mount Jackson
70.0% of women with births in Mount Jackson are unmarried. Women with the educational attainment of bachelor's degree are most likely to be married with 100.0% of them married at childbirth, while women with the educational attainment of college or associate's degree are least likely to be married with 100.0% of them unmarried at childbirth.
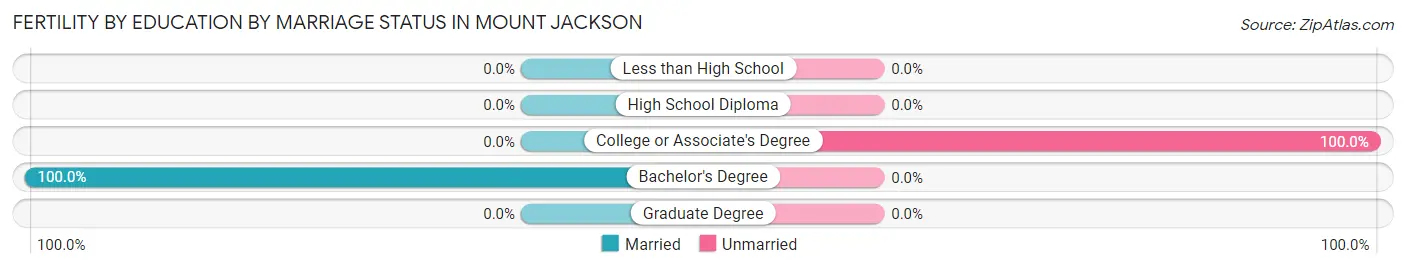
| Educational Attainment | Married | Unmarried |
| Less than High School | 0 (0.0%) | 0 (0.0%) |
| High School Diploma | 0 (0.0%) | 0 (0.0%) |
| College or Associate's Degree | 0 (0.0%) | 7 (100.0%) |
| Bachelor's Degree | 3 (100.0%) | 0 (0.0%) |
| Graduate Degree | 0 (0.0%) | 0 (0.0%) |
| Total | 3 (30.0%) | 7 (70.0%) |
Employment Characteristics in Mount Jackson
Employment by Class of Employer in Mount Jackson
Among the 794 employed individuals in Mount Jackson, private company employees (592 | 74.6%), local government employees (64 | 8.1%), and not-for-profit organizations (59 | 7.4%) make up the most common classes of employment.
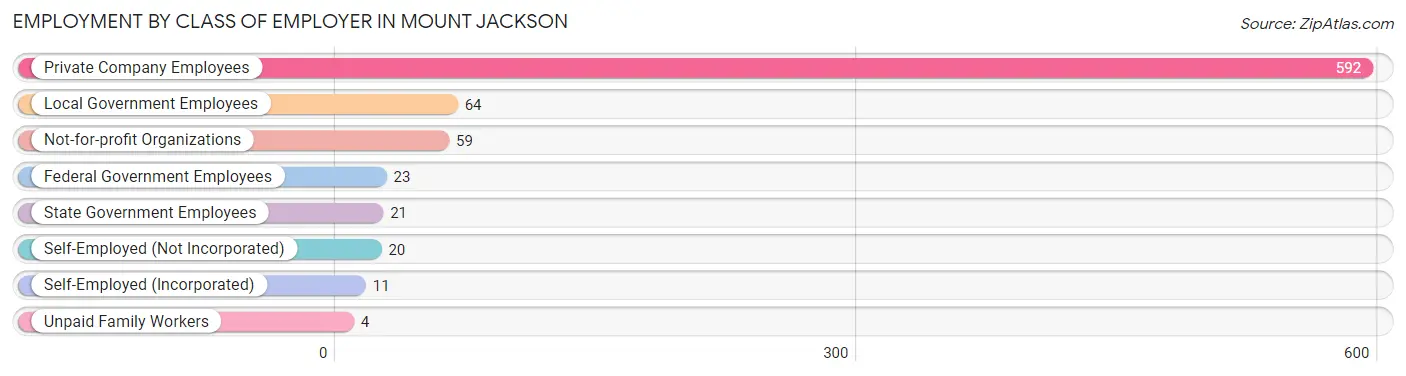
| Employer Class | # Employees | % Employees |
| Private Company Employees | 592 | 74.6% |
| Self-Employed (Incorporated) | 11 | 1.4% |
| Self-Employed (Not Incorporated) | 20 | 2.5% |
| Not-for-profit Organizations | 59 | 7.4% |
| Local Government Employees | 64 | 8.1% |
| State Government Employees | 21 | 2.6% |
| Federal Government Employees | 23 | 2.9% |
| Unpaid Family Workers | 4 | 0.5% |
| Total | 794 | 100.0% |
Employment Status by Age in Mount Jackson
According to the labor force statistics for Mount Jackson, out of the total population over 16 years of age (1,393), 64.4% or 897 individuals are in the labor force, with 10.7% or 96 of them unemployed. The age group with the highest labor force participation rate is 25 to 29 years, with 94.7% or 71 individuals in the labor force. Within the labor force, the 30 to 34 years age range has the highest percentage of unemployed individuals, with 38.6% or 27 of them being unemployed.
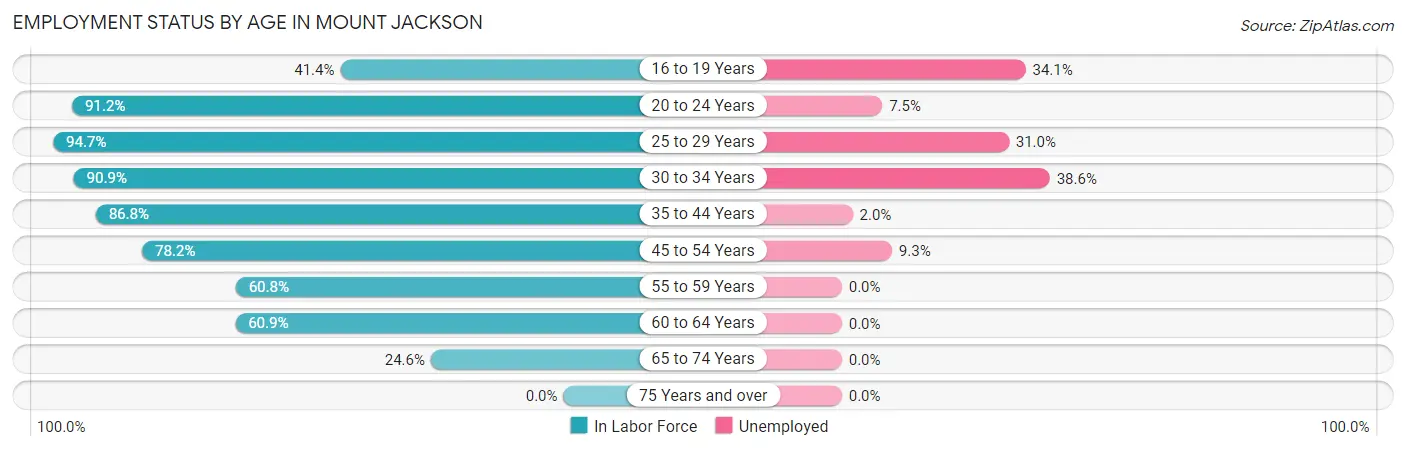
| Age Bracket | In Labor Force | Unemployed |
| 16 to 19 Years | 41 (41.4%) | 14 (34.1%) |
| 20 to 24 Years | 93 (91.2%) | 7 (7.5%) |
| 25 to 29 Years | 71 (94.7%) | 22 (31.0%) |
| 30 to 34 Years | 70 (90.9%) | 27 (38.6%) |
| 35 to 44 Years | 198 (86.8%) | 4 (2.0%) |
| 45 to 54 Years | 237 (78.2%) | 22 (9.3%) |
| 55 to 59 Years | 79 (60.8%) | 0 (0.0%) |
| 60 to 64 Years | 67 (60.9%) | 0 (0.0%) |
| 65 to 74 Years | 41 (24.6%) | 0 (0.0%) |
| 75 Years and over | 0 (0.0%) | 0 (0.0%) |
| Total | 897 (64.4%) | 96 (10.7%) |
Employment Status by Educational Attainment in Mount Jackson
According to labor force statistics for Mount Jackson, 78.2% of individuals (722) out of the total population between 25 and 64 years of age (923) are in the labor force, with 10.4% or 75 of them being unemployed. The group with the highest labor force participation rate are those with the educational attainment of bachelor's degree or higher, with 98.2% or 166 individuals in the labor force. Within the labor force, individuals with high school diploma education have the highest percentage of unemployment, with 19.9% or 42 of them being unemployed.
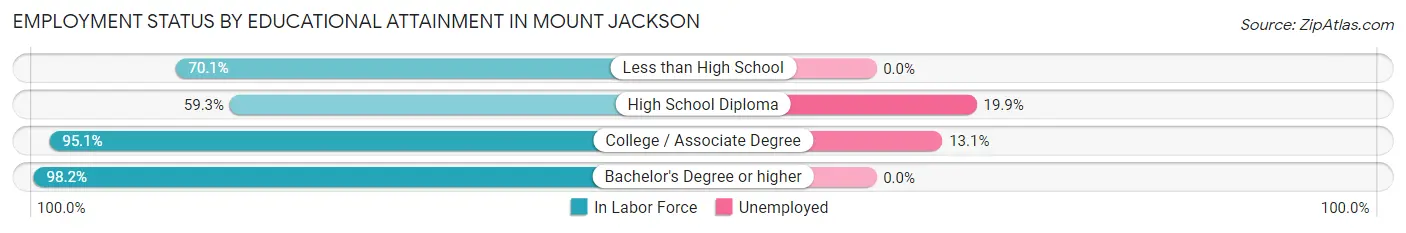
| Educational Attainment | In Labor Force | Unemployed |
| Less than High School | 94 (70.1%) | 0 (0.0%) |
| High School Diploma | 211 (59.3%) | 71 (19.9%) |
| College / Associate Degree | 251 (95.1%) | 35 (13.1%) |
| Bachelor's Degree or higher | 166 (98.2%) | 0 (0.0%) |
| Total | 722 (78.2%) | 96 (10.4%) |
Employment Occupations by Sex in Mount Jackson
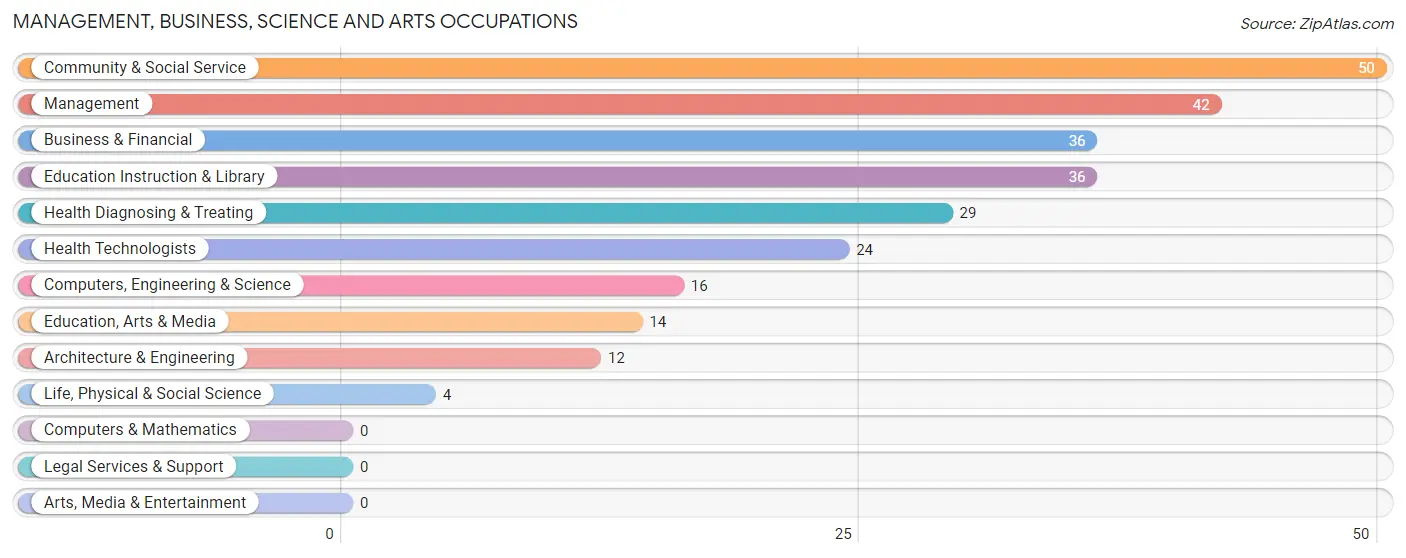
Management, Business, Science and Arts Occupations
The most common Management, Business, Science and Arts occupations in Mount Jackson are Community & Social Service (50 | 6.2%), Management (42 | 5.2%), Business & Financial (36 | 4.5%), Education Instruction & Library (36 | 4.5%), and Health Diagnosing & Treating (29 | 3.6%).
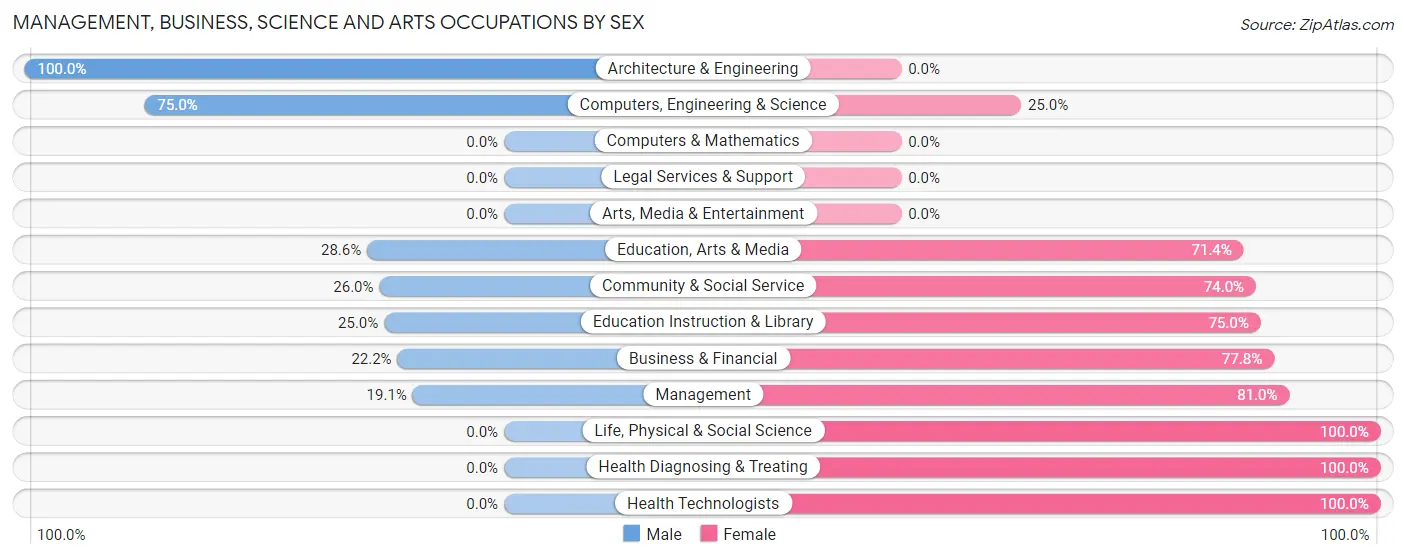
Management, Business, Science and Arts Occupations by Sex
Within the Management, Business, Science and Arts occupations in Mount Jackson, the most male-oriented occupations are Architecture & Engineering (100.0%), Computers, Engineering & Science (75.0%), and Education, Arts & Media (28.6%), while the most female-oriented occupations are Life, Physical & Social Science (100.0%), Health Diagnosing & Treating (100.0%), and Health Technologists (100.0%).
| Occupation | Male | Female |
| Management | 8 (19.1%) | 34 (80.9%) |
| Business & Financial | 8 (22.2%) | 28 (77.8%) |
| Computers, Engineering & Science | 12 (75.0%) | 4 (25.0%) |
| Computers & Mathematics | 0 (0.0%) | 0 (0.0%) |
| Architecture & Engineering | 12 (100.0%) | 0 (0.0%) |
| Life, Physical & Social Science | 0 (0.0%) | 4 (100.0%) |
| Community & Social Service | 13 (26.0%) | 37 (74.0%) |
| Education, Arts & Media | 4 (28.6%) | 10 (71.4%) |
| Legal Services & Support | 0 (0.0%) | 0 (0.0%) |
| Education Instruction & Library | 9 (25.0%) | 27 (75.0%) |
| Arts, Media & Entertainment | 0 (0.0%) | 0 (0.0%) |
| Health Diagnosing & Treating | 0 (0.0%) | 29 (100.0%) |
| Health Technologists | 0 (0.0%) | 24 (100.0%) |
| Total (Category) | 41 (23.7%) | 132 (76.3%) |
| Total (Overall) | 400 (49.9%) | 401 (50.1%) |
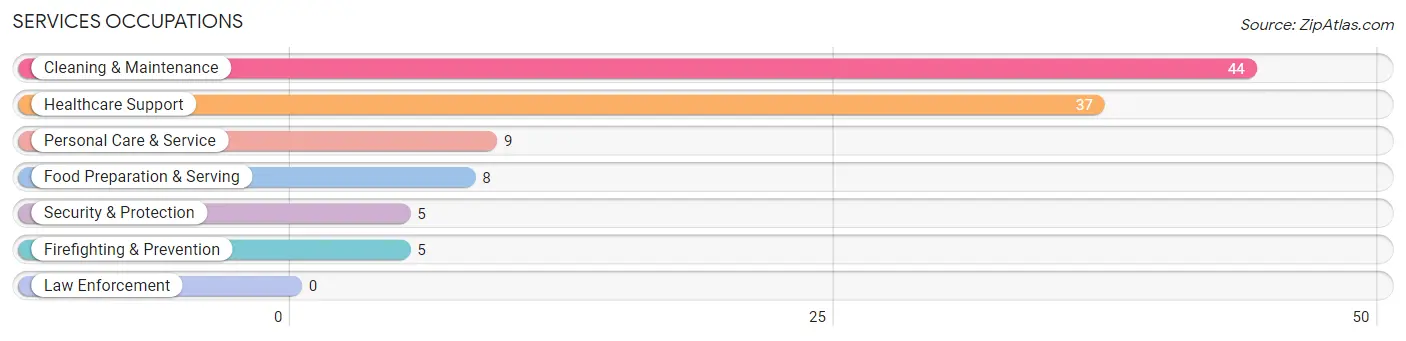
Services Occupations
The most common Services occupations in Mount Jackson are Cleaning & Maintenance (44 | 5.5%), Healthcare Support (37 | 4.6%), Personal Care & Service (9 | 1.1%), Food Preparation & Serving (8 | 1.0%), and Security & Protection (5 | 0.6%).
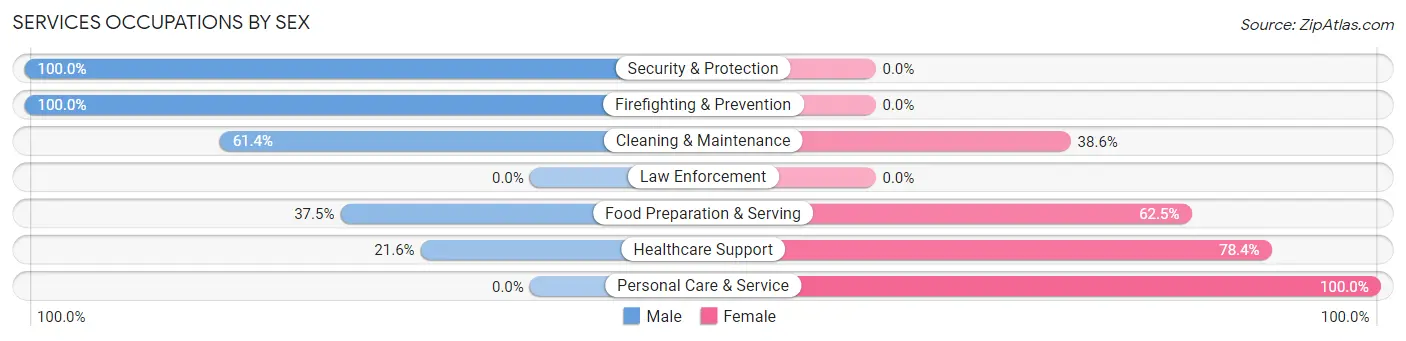
Services Occupations by Sex
Within the Services occupations in Mount Jackson, the most male-oriented occupations are Security & Protection (100.0%), Firefighting & Prevention (100.0%), and Cleaning & Maintenance (61.4%), while the most female-oriented occupations are Personal Care & Service (100.0%), Healthcare Support (78.4%), and Food Preparation & Serving (62.5%).
| Occupation | Male | Female |
| Healthcare Support | 8 (21.6%) | 29 (78.4%) |
| Security & Protection | 5 (100.0%) | 0 (0.0%) |
| Firefighting & Prevention | 5 (100.0%) | 0 (0.0%) |
| Law Enforcement | 0 (0.0%) | 0 (0.0%) |
| Food Preparation & Serving | 3 (37.5%) | 5 (62.5%) |
| Cleaning & Maintenance | 27 (61.4%) | 17 (38.6%) |
| Personal Care & Service | 0 (0.0%) | 9 (100.0%) |
| Total (Category) | 43 (41.7%) | 60 (58.3%) |
| Total (Overall) | 400 (49.9%) | 401 (50.1%) |
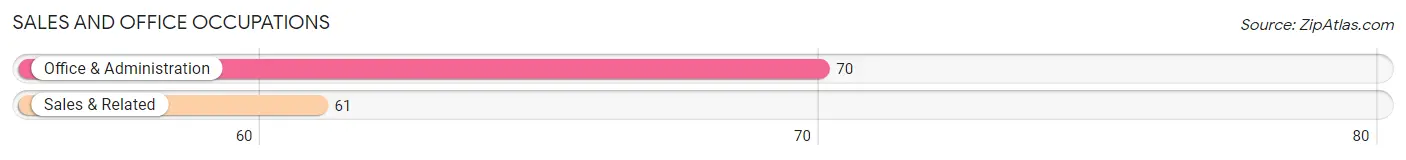
Sales and Office Occupations
The most common Sales and Office occupations in Mount Jackson are Office & Administration (70 | 8.7%), and Sales & Related (61 | 7.6%).
Sales and Office Occupations by Sex
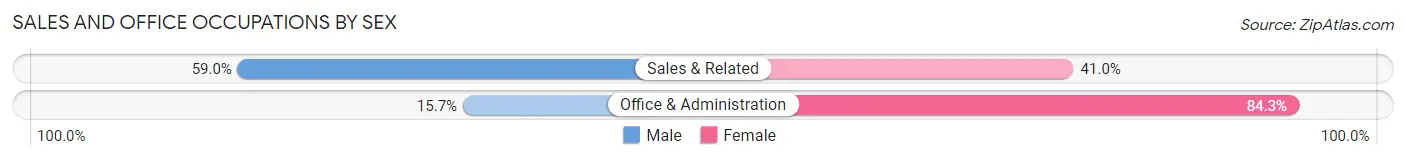
| Occupation | Male | Female |
| Sales & Related | 36 (59.0%) | 25 (41.0%) |
| Office & Administration | 11 (15.7%) | 59 (84.3%) |
| Total (Category) | 47 (35.9%) | 84 (64.1%) |
| Total (Overall) | 400 (49.9%) | 401 (50.1%) |
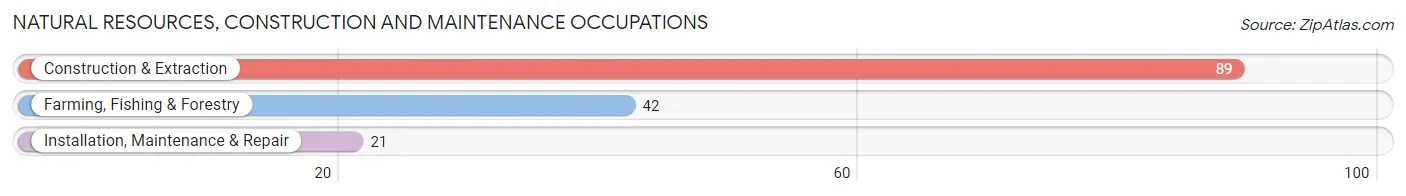
Natural Resources, Construction and Maintenance Occupations
The most common Natural Resources, Construction and Maintenance occupations in Mount Jackson are Construction & Extraction (89 | 11.1%), Farming, Fishing & Forestry (42 | 5.2%), and Installation, Maintenance & Repair (21 | 2.6%).
Natural Resources, Construction and Maintenance Occupations by Sex
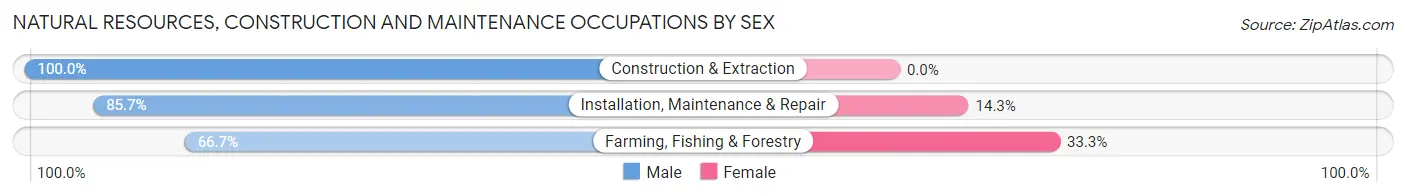
| Occupation | Male | Female |
| Farming, Fishing & Forestry | 28 (66.7%) | 14 (33.3%) |
| Construction & Extraction | 89 (100.0%) | 0 (0.0%) |
| Installation, Maintenance & Repair | 18 (85.7%) | 3 (14.3%) |
| Total (Category) | 135 (88.8%) | 17 (11.2%) |
| Total (Overall) | 400 (49.9%) | 401 (50.1%) |
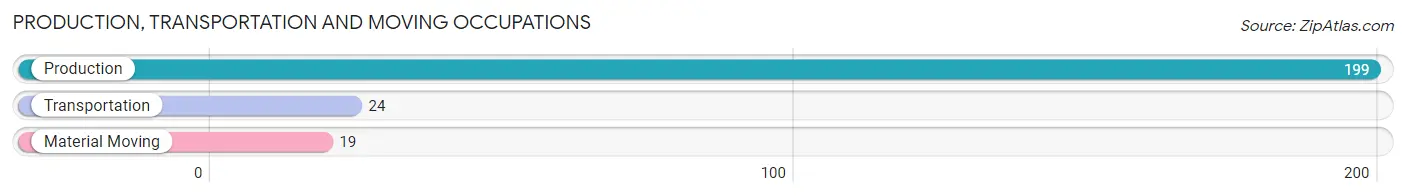
Production, Transportation and Moving Occupations
The most common Production, Transportation and Moving occupations in Mount Jackson are Production (199 | 24.8%), Transportation (24 | 3.0%), and Material Moving (19 | 2.4%).
Production, Transportation and Moving Occupations by Sex
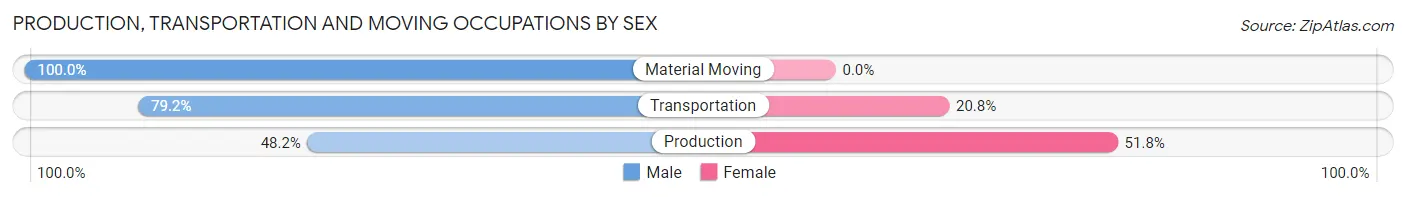
| Occupation | Male | Female |
| Production | 96 (48.2%) | 103 (51.8%) |
| Transportation | 19 (79.2%) | 5 (20.8%) |
| Material Moving | 19 (100.0%) | 0 (0.0%) |
| Total (Category) | 134 (55.4%) | 108 (44.6%) |
| Total (Overall) | 400 (49.9%) | 401 (50.1%) |
Employment Industries by Sex in Mount Jackson
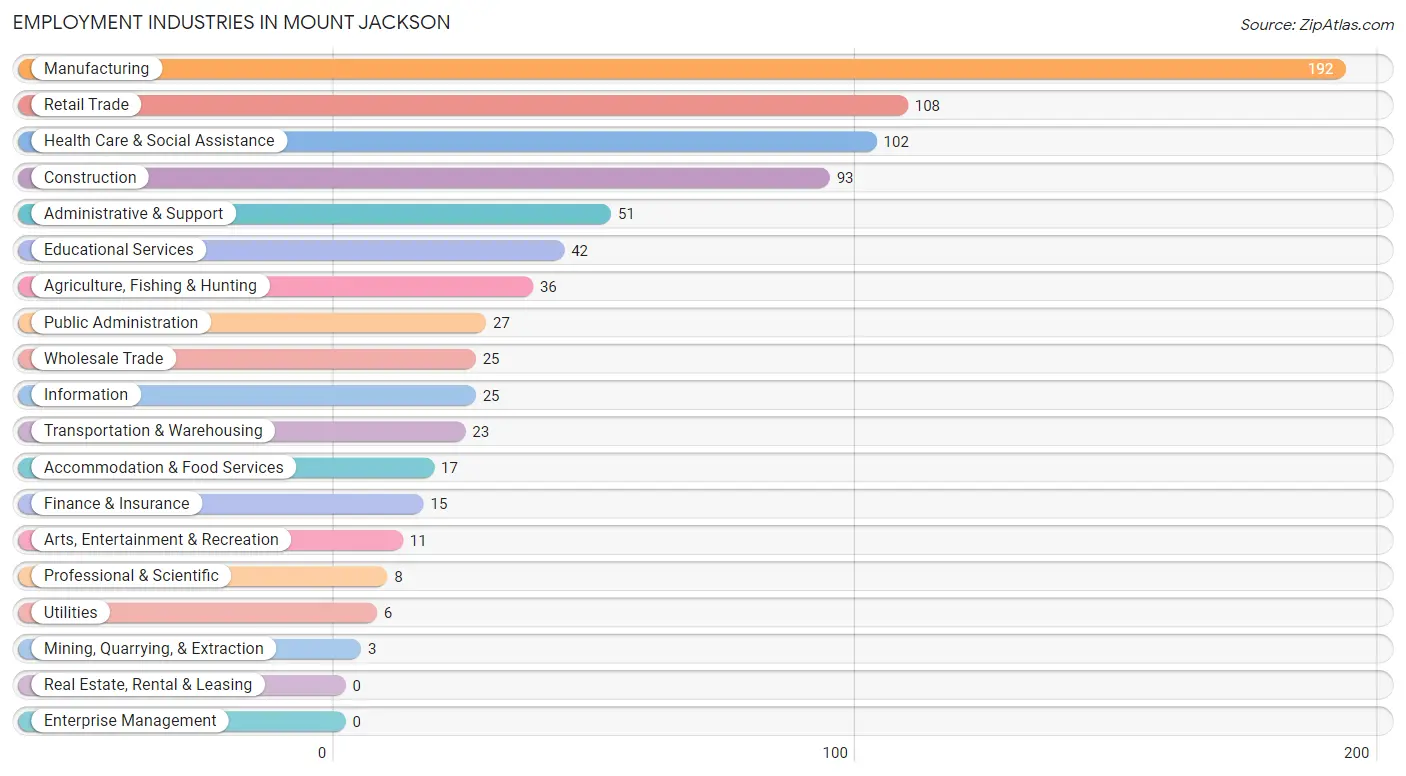
Employment Industries in Mount Jackson
The major employment industries in Mount Jackson include Manufacturing (192 | 24.0%), Retail Trade (108 | 13.5%), Health Care & Social Assistance (102 | 12.7%), Construction (93 | 11.6%), and Administrative & Support (51 | 6.4%).
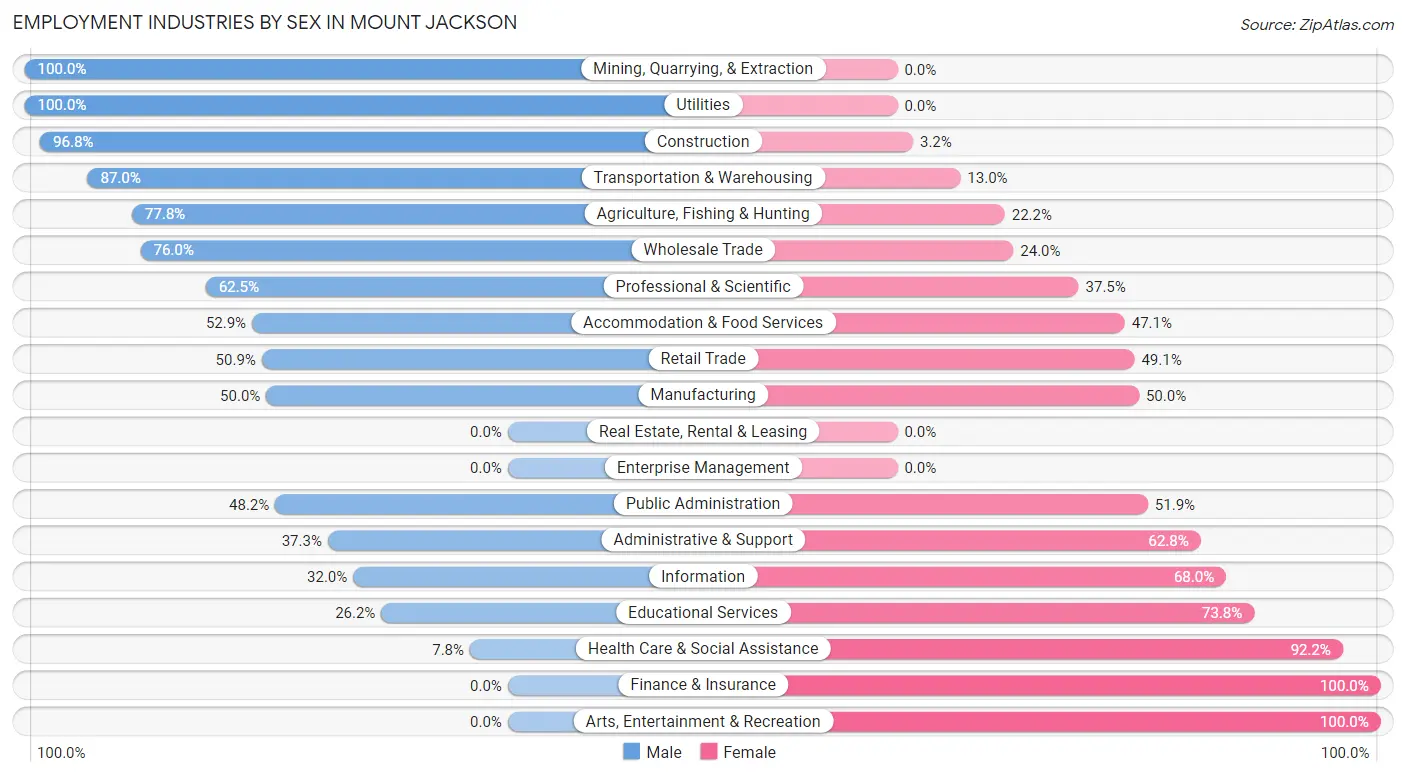
Employment Industries by Sex in Mount Jackson
The Mount Jackson industries that see more men than women are Mining, Quarrying, & Extraction (100.0%), Utilities (100.0%), and Construction (96.8%), whereas the industries that tend to have a higher number of women are Finance & Insurance (100.0%), Arts, Entertainment & Recreation (100.0%), and Health Care & Social Assistance (92.2%).
| Industry | Male | Female |
| Agriculture, Fishing & Hunting | 28 (77.8%) | 8 (22.2%) |
| Mining, Quarrying, & Extraction | 3 (100.0%) | 0 (0.0%) |
| Construction | 90 (96.8%) | 3 (3.2%) |
| Manufacturing | 96 (50.0%) | 96 (50.0%) |
| Wholesale Trade | 19 (76.0%) | 6 (24.0%) |
| Retail Trade | 55 (50.9%) | 53 (49.1%) |
| Transportation & Warehousing | 20 (87.0%) | 3 (13.0%) |
| Utilities | 6 (100.0%) | 0 (0.0%) |
| Information | 8 (32.0%) | 17 (68.0%) |
| Finance & Insurance | 0 (0.0%) | 15 (100.0%) |
| Real Estate, Rental & Leasing | 0 (0.0%) | 0 (0.0%) |
| Professional & Scientific | 5 (62.5%) | 3 (37.5%) |
| Enterprise Management | 0 (0.0%) | 0 (0.0%) |
| Administrative & Support | 19 (37.2%) | 32 (62.7%) |
| Educational Services | 11 (26.2%) | 31 (73.8%) |
| Health Care & Social Assistance | 8 (7.8%) | 94 (92.2%) |
| Arts, Entertainment & Recreation | 0 (0.0%) | 11 (100.0%) |
| Accommodation & Food Services | 9 (52.9%) | 8 (47.1%) |
| Public Administration | 13 (48.1%) | 14 (51.8%) |
| Total | 400 (49.9%) | 401 (50.1%) |
Education in Mount Jackson
School Enrollment in Mount Jackson
The most common levels of schooling among the 397 students in Mount Jackson are elementary school (169 | 42.6%), kindergarten (55 | 13.9%), and high school (50 | 12.6%).
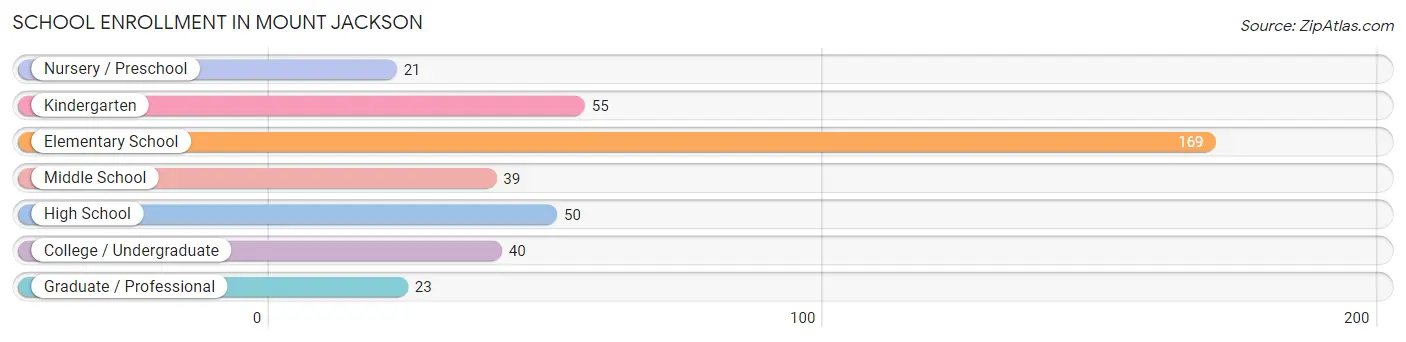
| School Level | # Students | % Students |
| Nursery / Preschool | 21 | 5.3% |
| Kindergarten | 55 | 13.9% |
| Elementary School | 169 | 42.6% |
| Middle School | 39 | 9.8% |
| High School | 50 | 12.6% |
| College / Undergraduate | 40 | 10.1% |
| Graduate / Professional | 23 | 5.8% |
| Total | 397 | 100.0% |
School Enrollment by Age by Funding Source in Mount Jackson
Out of a total of 397 students who are enrolled in schools in Mount Jackson, 29 (7.3%) attend a private institution, while the remaining 368 (92.7%) are enrolled in public schools. The age group of 3 to 4 year olds has the highest likelihood of being enrolled in private schools, with 9 (100.0% in the age bracket) enrolled. Conversely, the age group of 18 to 19 year olds has the lowest likelihood of being enrolled in a private school, with 10 (100.0% in the age bracket) attending a public institution.
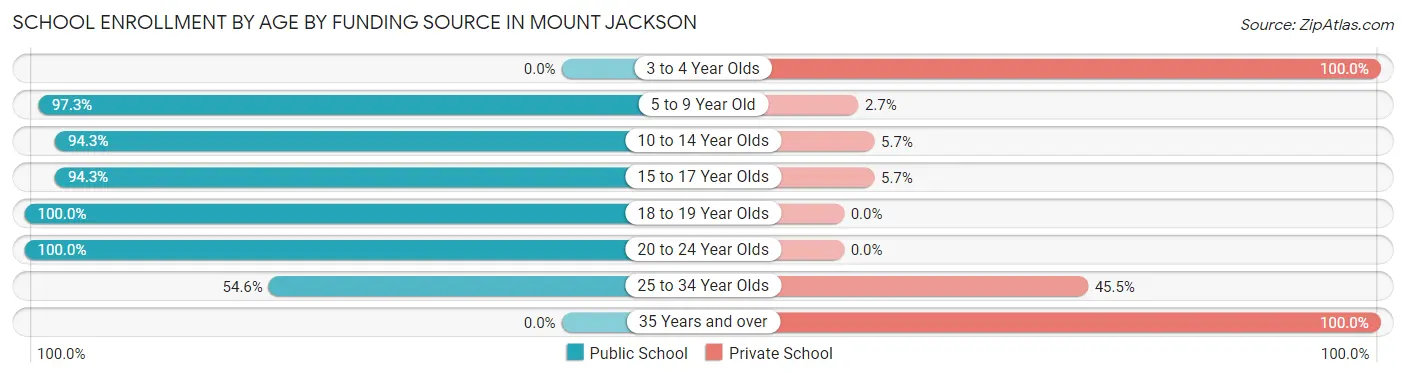
| Age Bracket | Public School | Private School |
| 3 to 4 Year Olds | 0 (0.0%) | 9 (100.0%) |
| 5 to 9 Year Old | 182 (97.3%) | 5 (2.7%) |
| 10 to 14 Year Olds | 83 (94.3%) | 5 (5.7%) |
| 15 to 17 Year Olds | 50 (94.3%) | 3 (5.7%) |
| 18 to 19 Year Olds | 10 (100.0%) | 0 (0.0%) |
| 20 to 24 Year Olds | 37 (100.0%) | 0 (0.0%) |
| 25 to 34 Year Olds | 6 (54.5%) | 5 (45.5%) |
| 35 Years and over | 0 (0.0%) | 2 (100.0%) |
| Total | 368 (92.7%) | 29 (7.3%) |
Educational Attainment by Field of Study in Mount Jackson
Business (49 | 23.2%), education (45 | 21.3%), bio, nature & agricultural (23 | 10.9%), science & technology (18 | 8.5%), and literature & languages (16 | 7.6%) are the most common fields of study among 211 individuals in Mount Jackson who have obtained a bachelor's degree or higher.
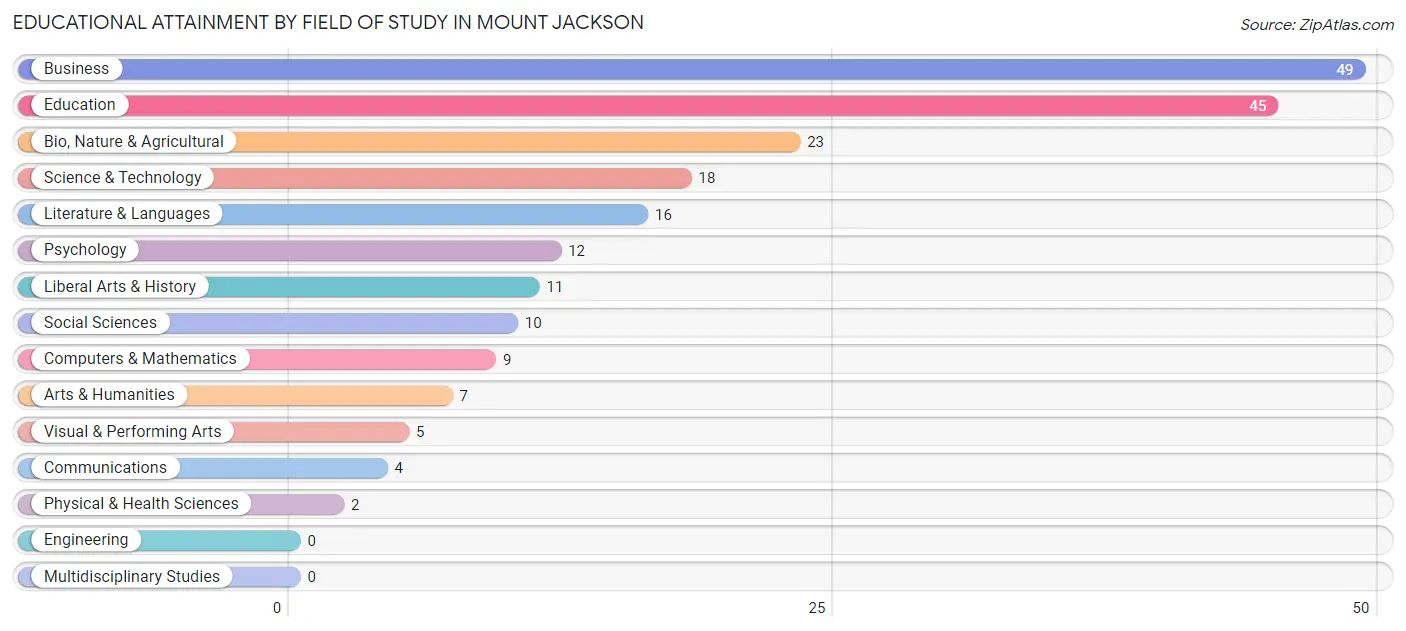
| Field of Study | # Graduates | % Graduates |
| Computers & Mathematics | 9 | 4.3% |
| Bio, Nature & Agricultural | 23 | 10.9% |
| Physical & Health Sciences | 2 | 0.9% |
| Psychology | 12 | 5.7% |
| Social Sciences | 10 | 4.7% |
| Engineering | 0 | 0.0% |
| Multidisciplinary Studies | 0 | 0.0% |
| Science & Technology | 18 | 8.5% |
| Business | 49 | 23.2% |
| Education | 45 | 21.3% |
| Literature & Languages | 16 | 7.6% |
| Liberal Arts & History | 11 | 5.2% |
| Visual & Performing Arts | 5 | 2.4% |
| Communications | 4 | 1.9% |
| Arts & Humanities | 7 | 3.3% |
| Total | 211 | 100.0% |
Transportation & Commute in Mount Jackson
Vehicle Availability by Sex in Mount Jackson
The most prevalent vehicle ownership categories in Mount Jackson are males with 2 vehicles (135, accounting for 33.9%) and females with 2 vehicles (164, making up 34.1%).
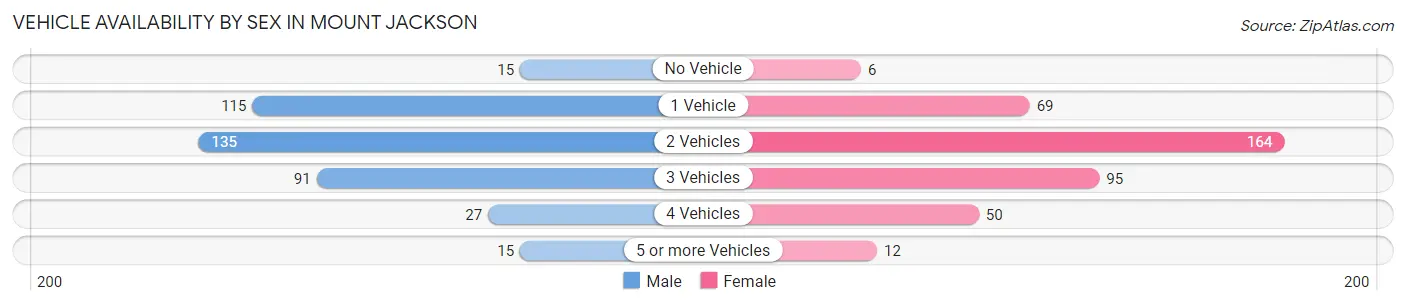
| Vehicles Available | Male | Female |
| No Vehicle | 15 (3.8%) | 6 (1.5%) |
| 1 Vehicle | 115 (28.9%) | 69 (17.4%) |
| 2 Vehicles | 135 (33.9%) | 164 (41.4%) |
| 3 Vehicles | 91 (22.9%) | 95 (24.0%) |
| 4 Vehicles | 27 (6.8%) | 50 (12.6%) |
| 5 or more Vehicles | 15 (3.8%) | 12 (3.0%) |
| Total | 398 (100.0%) | 396 (100.0%) |
Commute Time in Mount Jackson
The most frequently occuring commute durations in Mount Jackson are 20 to 24 minutes (135 commuters, 17.8%), 10 to 14 minutes (124 commuters, 16.3%), and 15 to 19 minutes (91 commuters, 12.0%).
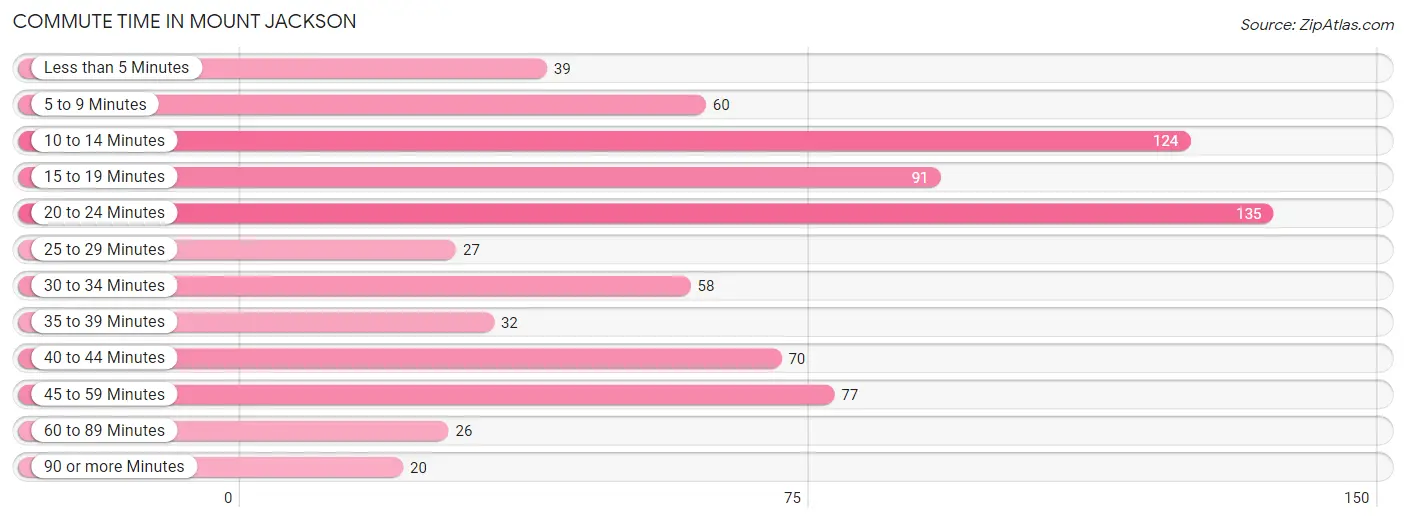
| Commute Time | # Commuters | % Commuters |
| Less than 5 Minutes | 39 | 5.1% |
| 5 to 9 Minutes | 60 | 7.9% |
| 10 to 14 Minutes | 124 | 16.3% |
| 15 to 19 Minutes | 91 | 12.0% |
| 20 to 24 Minutes | 135 | 17.8% |
| 25 to 29 Minutes | 27 | 3.6% |
| 30 to 34 Minutes | 58 | 7.6% |
| 35 to 39 Minutes | 32 | 4.2% |
| 40 to 44 Minutes | 70 | 9.2% |
| 45 to 59 Minutes | 77 | 10.1% |
| 60 to 89 Minutes | 26 | 3.4% |
| 90 or more Minutes | 20 | 2.6% |
Commute Time by Sex in Mount Jackson
The most common commute times in Mount Jackson are 10 to 14 minutes (101 commuters, 26.0%) for males and 20 to 24 minutes (63 commuters, 17.0%) for females.
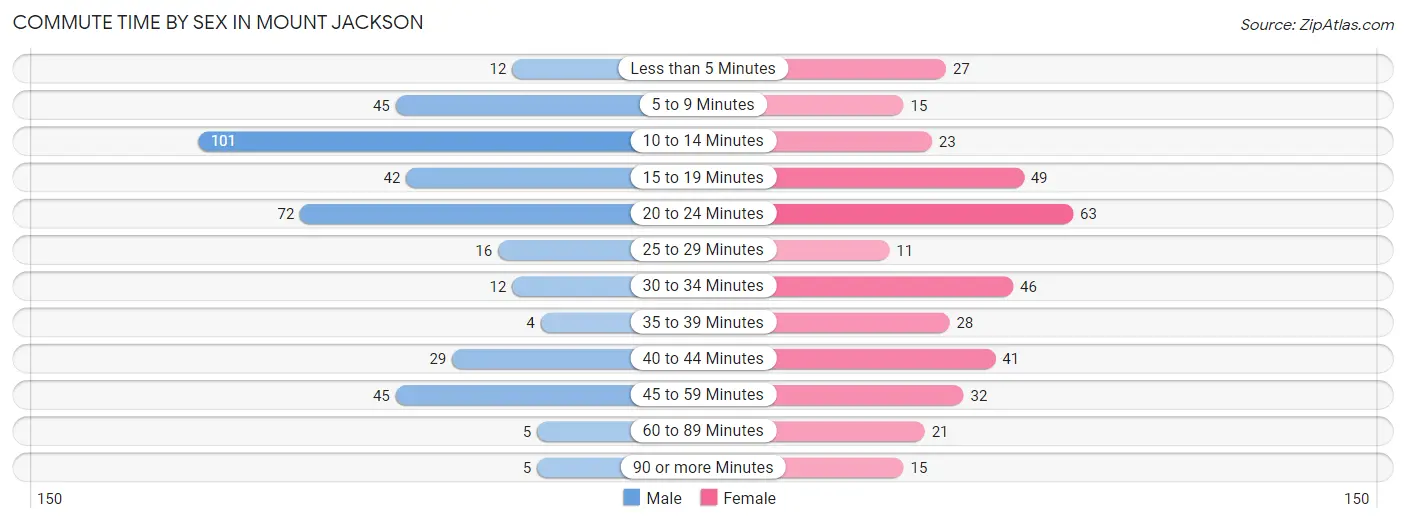
| Commute Time | Male | Female |
| Less than 5 Minutes | 12 (3.1%) | 27 (7.3%) |
| 5 to 9 Minutes | 45 (11.6%) | 15 (4.0%) |
| 10 to 14 Minutes | 101 (26.0%) | 23 (6.2%) |
| 15 to 19 Minutes | 42 (10.8%) | 49 (13.2%) |
| 20 to 24 Minutes | 72 (18.6%) | 63 (17.0%) |
| 25 to 29 Minutes | 16 (4.1%) | 11 (3.0%) |
| 30 to 34 Minutes | 12 (3.1%) | 46 (12.4%) |
| 35 to 39 Minutes | 4 (1.0%) | 28 (7.5%) |
| 40 to 44 Minutes | 29 (7.5%) | 41 (11.1%) |
| 45 to 59 Minutes | 45 (11.6%) | 32 (8.6%) |
| 60 to 89 Minutes | 5 (1.3%) | 21 (5.7%) |
| 90 or more Minutes | 5 (1.3%) | 15 (4.0%) |
Time of Departure to Work by Sex in Mount Jackson
The most frequent times of departure to work in Mount Jackson are 7:00 AM to 7:29 AM (86, 22.2%) for males and 12:00 PM to 3:59 PM (53, 14.3%) for females.
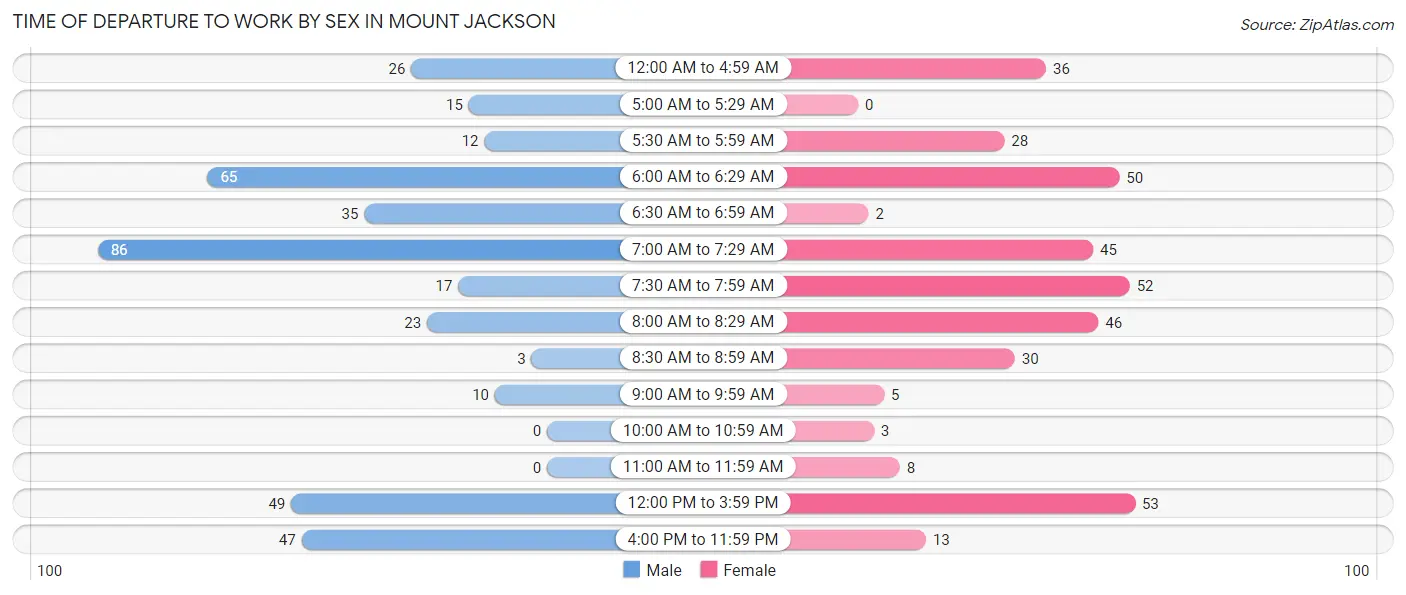
| Time of Departure | Male | Female |
| 12:00 AM to 4:59 AM | 26 (6.7%) | 36 (9.7%) |
| 5:00 AM to 5:29 AM | 15 (3.9%) | 0 (0.0%) |
| 5:30 AM to 5:59 AM | 12 (3.1%) | 28 (7.5%) |
| 6:00 AM to 6:29 AM | 65 (16.8%) | 50 (13.5%) |
| 6:30 AM to 6:59 AM | 35 (9.0%) | 2 (0.5%) |
| 7:00 AM to 7:29 AM | 86 (22.2%) | 45 (12.1%) |
| 7:30 AM to 7:59 AM | 17 (4.4%) | 52 (14.0%) |
| 8:00 AM to 8:29 AM | 23 (5.9%) | 46 (12.4%) |
| 8:30 AM to 8:59 AM | 3 (0.8%) | 30 (8.1%) |
| 9:00 AM to 9:59 AM | 10 (2.6%) | 5 (1.3%) |
| 10:00 AM to 10:59 AM | 0 (0.0%) | 3 (0.8%) |
| 11:00 AM to 11:59 AM | 0 (0.0%) | 8 (2.2%) |
| 12:00 PM to 3:59 PM | 49 (12.6%) | 53 (14.3%) |
| 4:00 PM to 11:59 PM | 47 (12.1%) | 13 (3.5%) |
| Total | 388 (100.0%) | 371 (100.0%) |
Housing Occupancy in Mount Jackson
Occupancy by Ownership in Mount Jackson
Of the total 714 dwellings in Mount Jackson, owner-occupied units account for 429 (60.1%), while renter-occupied units make up 285 (39.9%).
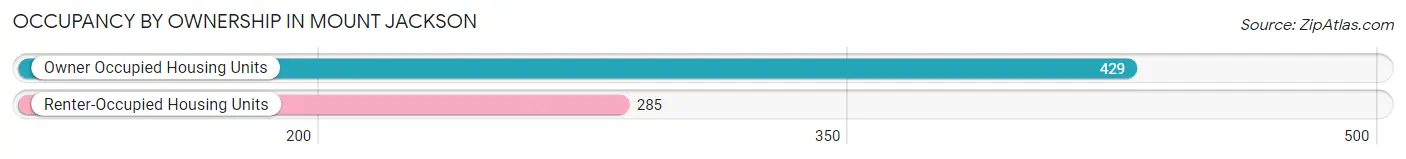
| Occupancy | # Housing Units | % Housing Units |
| Owner Occupied Housing Units | 429 | 60.1% |
| Renter-Occupied Housing Units | 285 | 39.9% |
| Total Occupied Housing Units | 714 | 100.0% |
Occupancy by Household Size in Mount Jackson
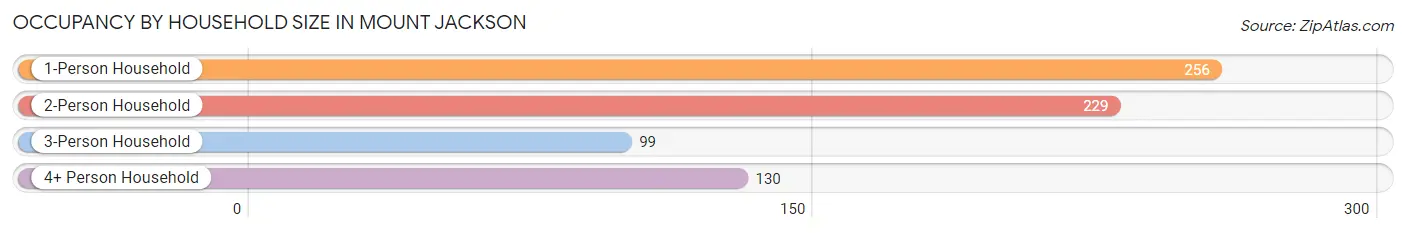
| Household Size | # Housing Units | % Housing Units |
| 1-Person Household | 256 | 35.8% |
| 2-Person Household | 229 | 32.1% |
| 3-Person Household | 99 | 13.9% |
| 4+ Person Household | 130 | 18.2% |
| Total Housing Units | 714 | 100.0% |
Occupancy by Ownership by Household Size in Mount Jackson
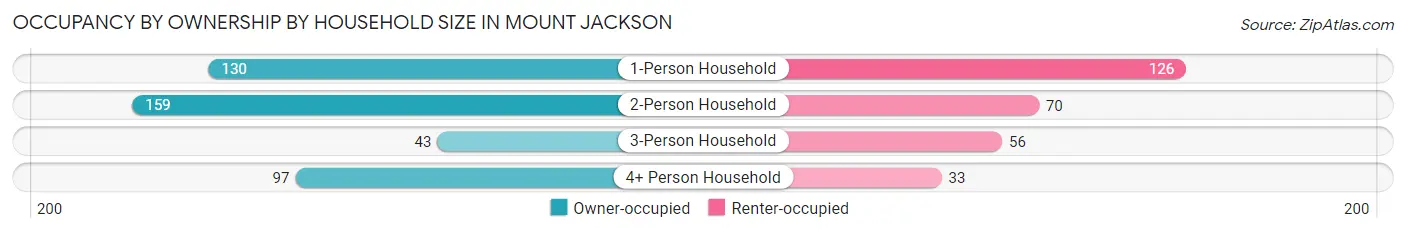
| Household Size | Owner-occupied | Renter-occupied |
| 1-Person Household | 130 (50.8%) | 126 (49.2%) |
| 2-Person Household | 159 (69.4%) | 70 (30.6%) |
| 3-Person Household | 43 (43.4%) | 56 (56.6%) |
| 4+ Person Household | 97 (74.6%) | 33 (25.4%) |
| Total Housing Units | 429 (60.1%) | 285 (39.9%) |
Occupancy by Educational Attainment in Mount Jackson
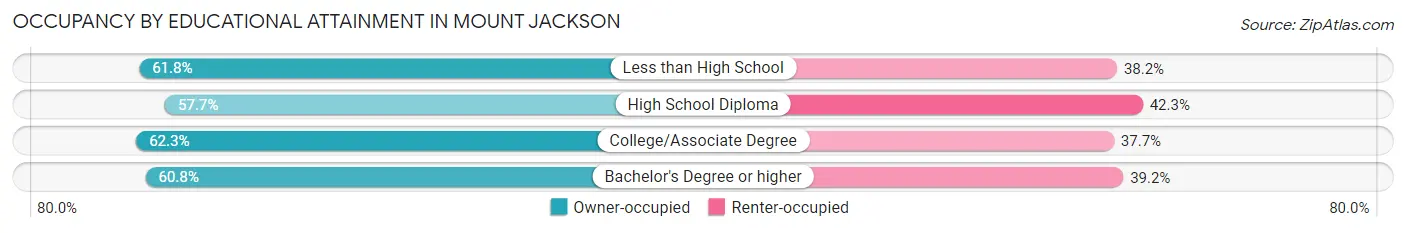
| Household Size | Owner-occupied | Renter-occupied |
| Less than High School | 89 (61.8%) | 55 (38.2%) |
| High School Diploma | 172 (57.7%) | 126 (42.3%) |
| College/Associate Degree | 109 (62.3%) | 66 (37.7%) |
| Bachelor's Degree or higher | 59 (60.8%) | 38 (39.2%) |
Occupancy by Age of Householder in Mount Jackson
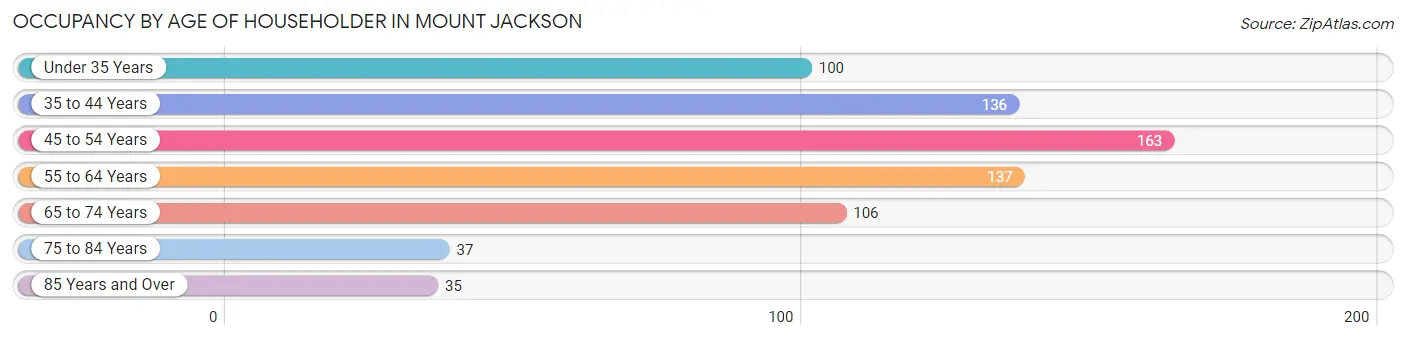
| Age Bracket | # Households | % Households |
| Under 35 Years | 100 | 14.0% |
| 35 to 44 Years | 136 | 19.1% |
| 45 to 54 Years | 163 | 22.8% |
| 55 to 64 Years | 137 | 19.2% |
| 65 to 74 Years | 106 | 14.8% |
| 75 to 84 Years | 37 | 5.2% |
| 85 Years and Over | 35 | 4.9% |
| Total | 714 | 100.0% |
Housing Finances in Mount Jackson
Median Income by Occupancy in Mount Jackson
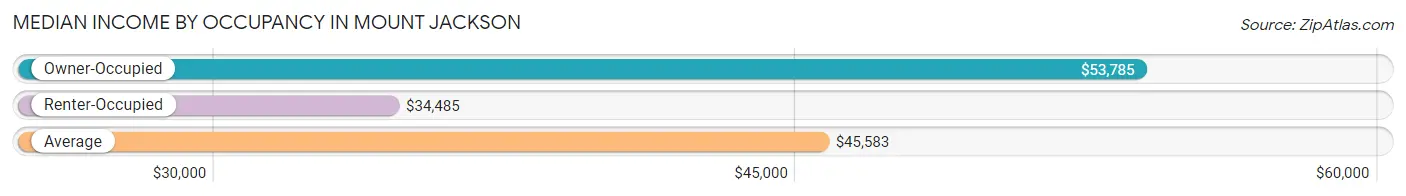
| Occupancy Type | # Households | Median Income |
| Owner-Occupied | 429 (60.1%) | $53,785 |
| Renter-Occupied | 285 (39.9%) | $34,485 |
| Average | 714 (100.0%) | $45,583 |
Occupancy by Householder Income Bracket in Mount Jackson
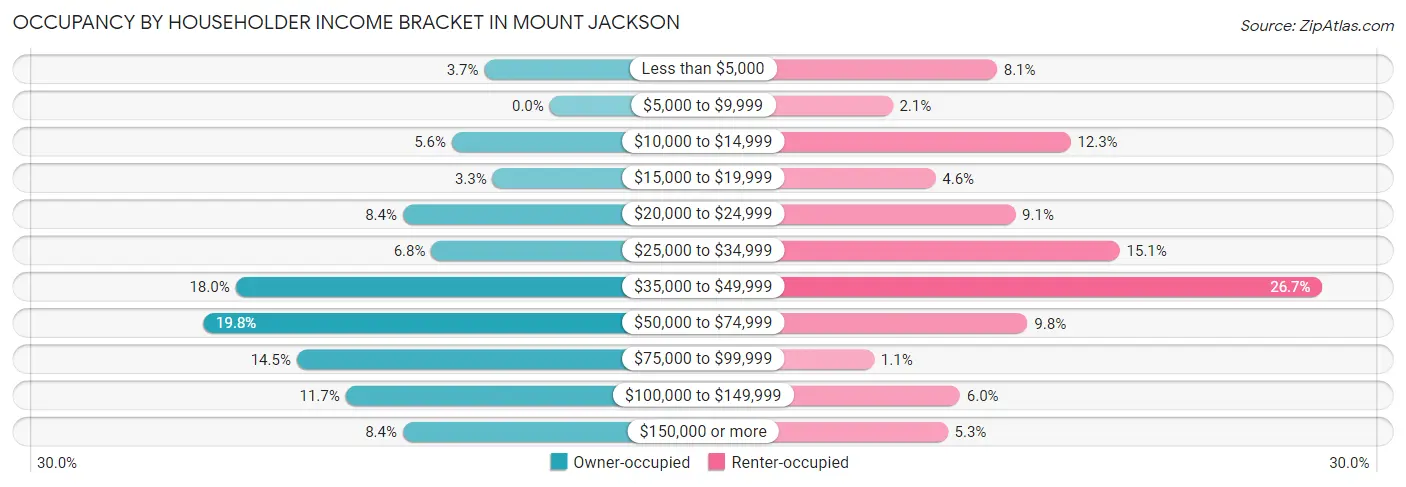
| Income Bracket | Owner-occupied | Renter-occupied |
| Less than $5,000 | 16 (3.7%) | 23 (8.1%) |
| $5,000 to $9,999 | 0 (0.0%) | 6 (2.1%) |
| $10,000 to $14,999 | 24 (5.6%) | 35 (12.3%) |
| $15,000 to $19,999 | 14 (3.3%) | 13 (4.6%) |
| $20,000 to $24,999 | 36 (8.4%) | 26 (9.1%) |
| $25,000 to $34,999 | 29 (6.8%) | 43 (15.1%) |
| $35,000 to $49,999 | 77 (17.9%) | 76 (26.7%) |
| $50,000 to $74,999 | 85 (19.8%) | 28 (9.8%) |
| $75,000 to $99,999 | 62 (14.4%) | 3 (1.1%) |
| $100,000 to $149,999 | 50 (11.7%) | 17 (6.0%) |
| $150,000 or more | 36 (8.4%) | 15 (5.3%) |
| Total | 429 (100.0%) | 285 (100.0%) |
Monthly Housing Cost Tiers in Mount Jackson
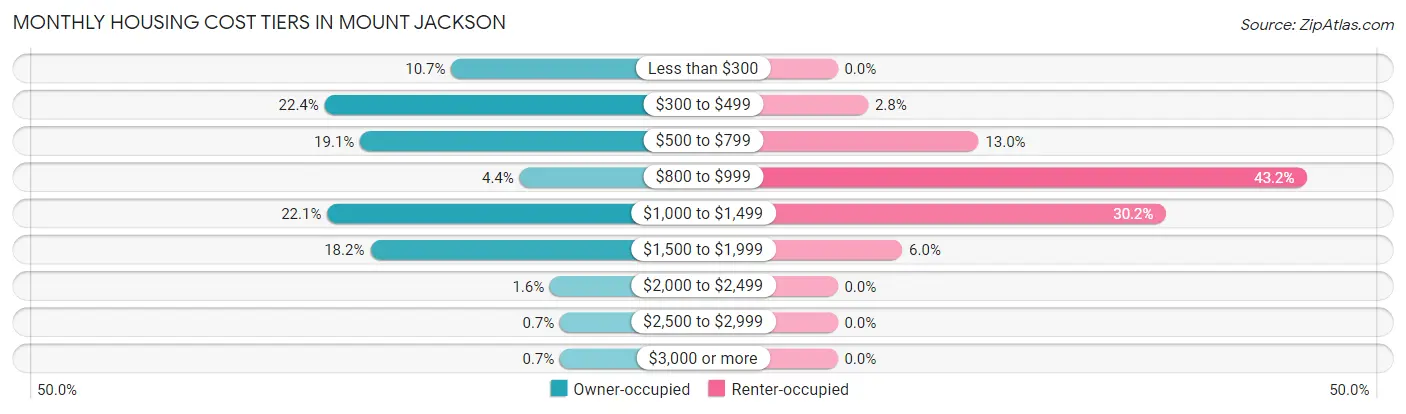
| Monthly Cost | Owner-occupied | Renter-occupied |
| Less than $300 | 46 (10.7%) | 0 (0.0%) |
| $300 to $499 | 96 (22.4%) | 8 (2.8%) |
| $500 to $799 | 82 (19.1%) | 37 (13.0%) |
| $800 to $999 | 19 (4.4%) | 123 (43.2%) |
| $1,000 to $1,499 | 95 (22.1%) | 86 (30.2%) |
| $1,500 to $1,999 | 78 (18.2%) | 17 (6.0%) |
| $2,000 to $2,499 | 7 (1.6%) | 0 (0.0%) |
| $2,500 to $2,999 | 3 (0.7%) | 0 (0.0%) |
| $3,000 or more | 3 (0.7%) | 0 (0.0%) |
| Total | 429 (100.0%) | 285 (100.0%) |
Physical Housing Characteristics in Mount Jackson
Housing Structures in Mount Jackson
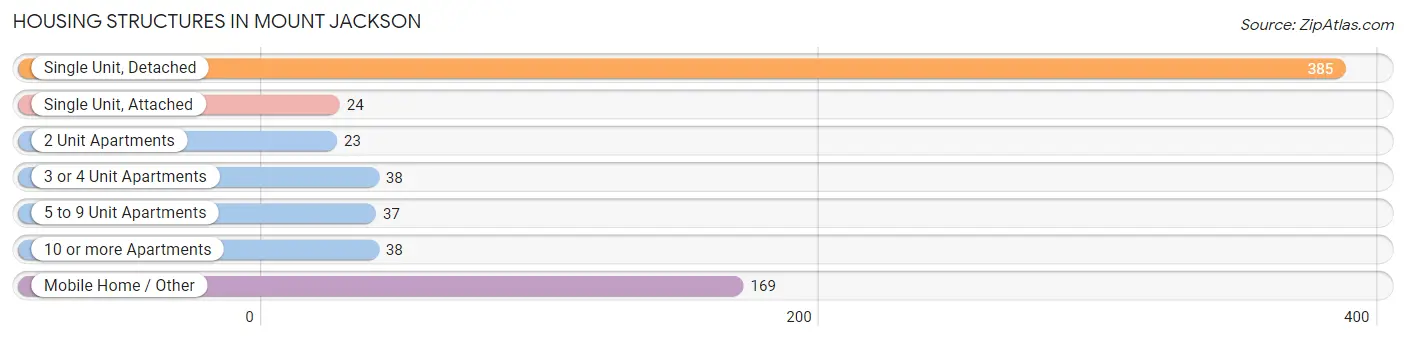
| Structure Type | # Housing Units | % Housing Units |
| Single Unit, Detached | 385 | 53.9% |
| Single Unit, Attached | 24 | 3.4% |
| 2 Unit Apartments | 23 | 3.2% |
| 3 or 4 Unit Apartments | 38 | 5.3% |
| 5 to 9 Unit Apartments | 37 | 5.2% |
| 10 or more Apartments | 38 | 5.3% |
| Mobile Home / Other | 169 | 23.7% |
| Total | 714 | 100.0% |
Housing Structures by Occupancy in Mount Jackson
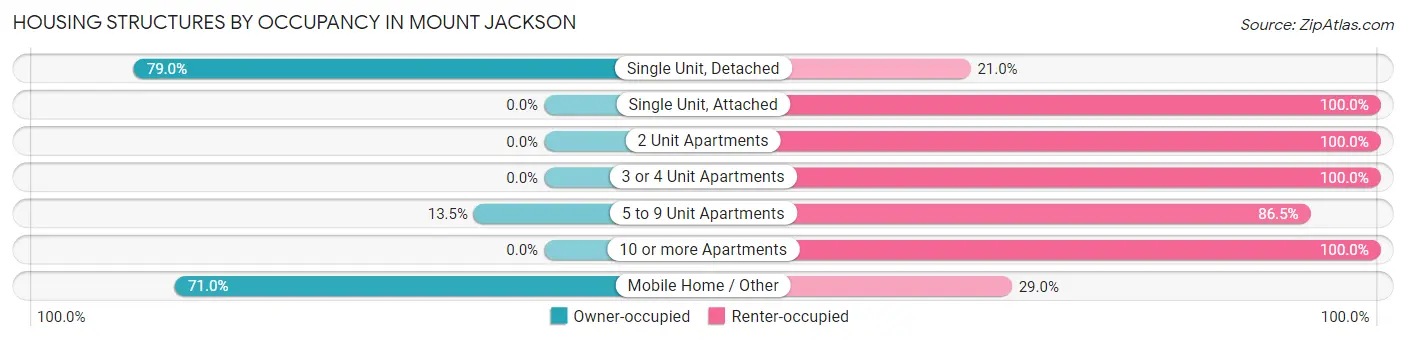
| Structure Type | Owner-occupied | Renter-occupied |
| Single Unit, Detached | 304 (79.0%) | 81 (21.0%) |
| Single Unit, Attached | 0 (0.0%) | 24 (100.0%) |
| 2 Unit Apartments | 0 (0.0%) | 23 (100.0%) |
| 3 or 4 Unit Apartments | 0 (0.0%) | 38 (100.0%) |
| 5 to 9 Unit Apartments | 5 (13.5%) | 32 (86.5%) |
| 10 or more Apartments | 0 (0.0%) | 38 (100.0%) |
| Mobile Home / Other | 120 (71.0%) | 49 (29.0%) |
| Total | 429 (60.1%) | 285 (39.9%) |
Housing Structures by Number of Rooms in Mount Jackson
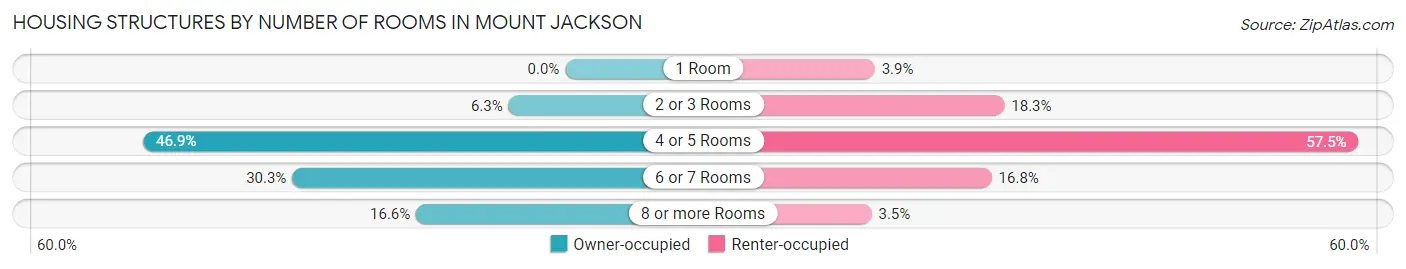
| Number of Rooms | Owner-occupied | Renter-occupied |
| 1 Room | 0 (0.0%) | 11 (3.9%) |
| 2 or 3 Rooms | 27 (6.3%) | 52 (18.2%) |
| 4 or 5 Rooms | 201 (46.9%) | 164 (57.5%) |
| 6 or 7 Rooms | 130 (30.3%) | 48 (16.8%) |
| 8 or more Rooms | 71 (16.6%) | 10 (3.5%) |
| Total | 429 (100.0%) | 285 (100.0%) |
Housing Structure by Heating Type in Mount Jackson
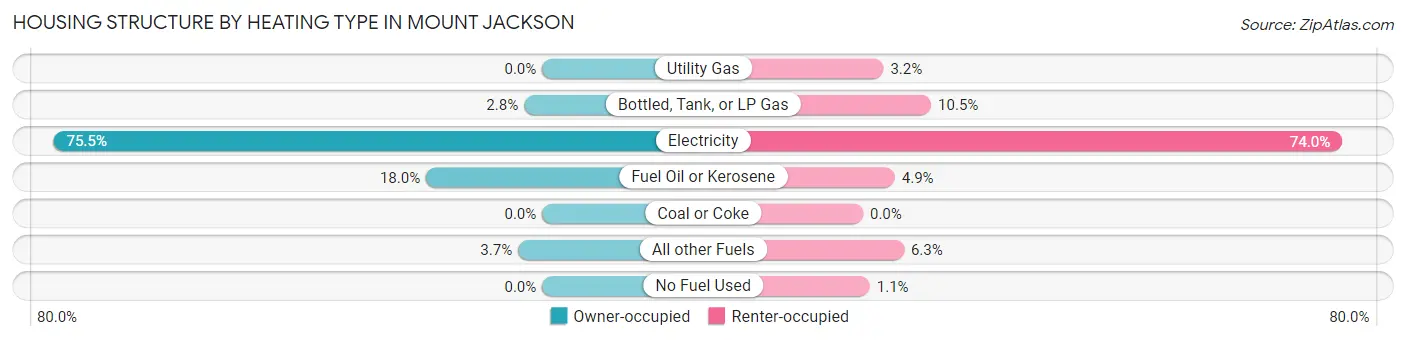
| Heating Type | Owner-occupied | Renter-occupied |
| Utility Gas | 0 (0.0%) | 9 (3.2%) |
| Bottled, Tank, or LP Gas | 12 (2.8%) | 30 (10.5%) |
| Electricity | 324 (75.5%) | 211 (74.0%) |
| Fuel Oil or Kerosene | 77 (17.9%) | 14 (4.9%) |
| Coal or Coke | 0 (0.0%) | 0 (0.0%) |
| All other Fuels | 16 (3.7%) | 18 (6.3%) |
| No Fuel Used | 0 (0.0%) | 3 (1.1%) |
| Total | 429 (100.0%) | 285 (100.0%) |
Household Vehicle Usage in Mount Jackson
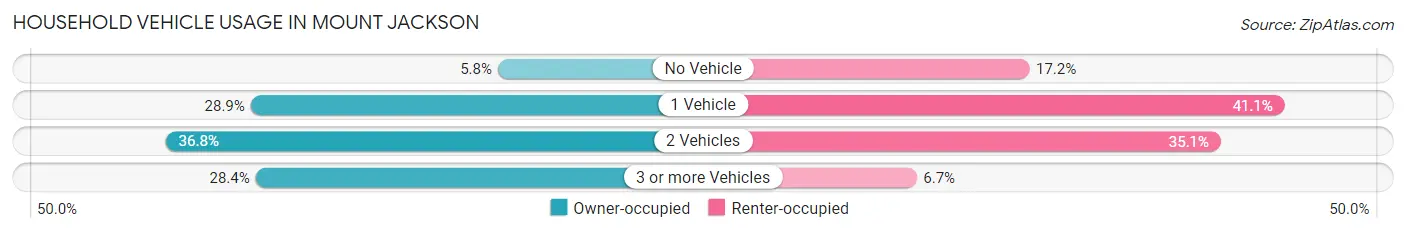
| Vehicles per Household | Owner-occupied | Renter-occupied |
| No Vehicle | 25 (5.8%) | 49 (17.2%) |
| 1 Vehicle | 124 (28.9%) | 117 (41.0%) |
| 2 Vehicles | 158 (36.8%) | 100 (35.1%) |
| 3 or more Vehicles | 122 (28.4%) | 19 (6.7%) |
| Total | 429 (100.0%) | 285 (100.0%) |
Real Estate & Mortgages in Mount Jackson
Real Estate and Mortgage Overview in Mount Jackson
| Characteristic | Without Mortgage | With Mortgage |
| Housing Units | 193 | 236 |
| Median Property Value | $137,500 | $164,400 |
| Median Household Income | $42,589 | $34 |
| Monthly Housing Costs | $420 | $3 |
| Real Estate Taxes | $804 | $24 |
Property Value by Mortgage Status in Mount Jackson
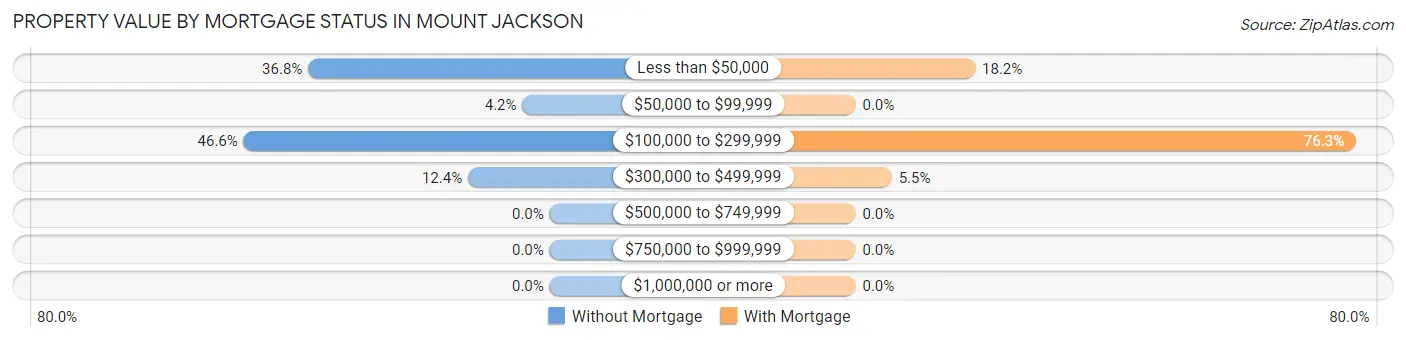
| Property Value | Without Mortgage | With Mortgage |
| Less than $50,000 | 71 (36.8%) | 43 (18.2%) |
| $50,000 to $99,999 | 8 (4.2%) | 0 (0.0%) |
| $100,000 to $299,999 | 90 (46.6%) | 180 (76.3%) |
| $300,000 to $499,999 | 24 (12.4%) | 13 (5.5%) |
| $500,000 to $749,999 | 0 (0.0%) | 0 (0.0%) |
| $750,000 to $999,999 | 0 (0.0%) | 0 (0.0%) |
| $1,000,000 or more | 0 (0.0%) | 0 (0.0%) |
| Total | 193 (100.0%) | 236 (100.0%) |
Household Income by Mortgage Status in Mount Jackson
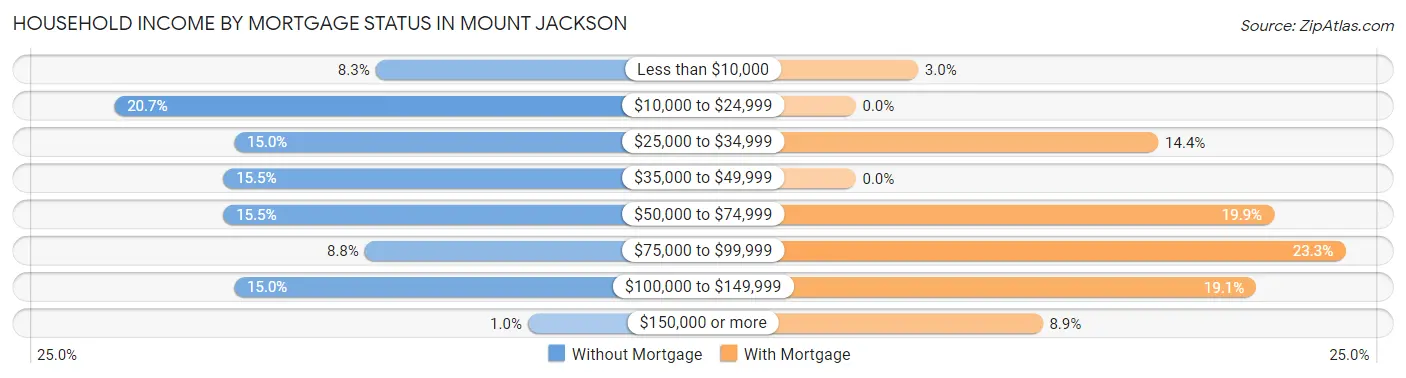
| Household Income | Without Mortgage | With Mortgage |
| Less than $10,000 | 16 (8.3%) | 7 (3.0%) |
| $10,000 to $24,999 | 40 (20.7%) | 0 (0.0%) |
| $25,000 to $34,999 | 29 (15.0%) | 34 (14.4%) |
| $35,000 to $49,999 | 30 (15.5%) | 0 (0.0%) |
| $50,000 to $74,999 | 30 (15.5%) | 47 (19.9%) |
| $75,000 to $99,999 | 17 (8.8%) | 55 (23.3%) |
| $100,000 to $149,999 | 29 (15.0%) | 45 (19.1%) |
| $150,000 or more | 2 (1.0%) | 21 (8.9%) |
| Total | 193 (100.0%) | 236 (100.0%) |
Property Value to Household Income Ratio in Mount Jackson
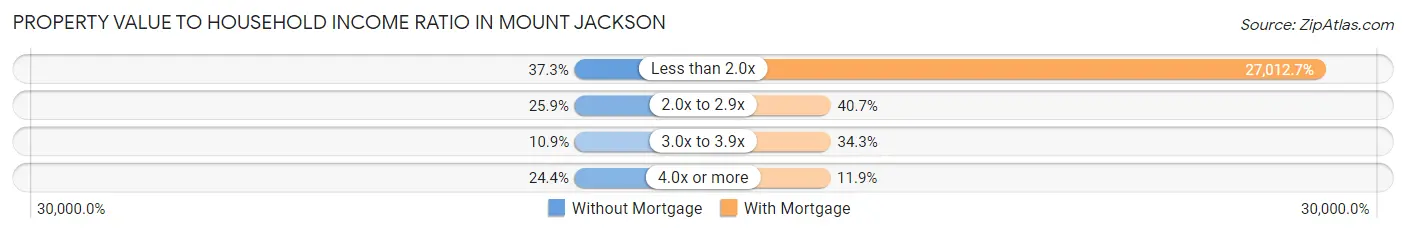
| Value-to-Income Ratio | Without Mortgage | With Mortgage |
| Less than 2.0x | 72 (37.3%) | 63,750 (27,012.7%) |
| 2.0x to 2.9x | 50 (25.9%) | 96 (40.7%) |
| 3.0x to 3.9x | 21 (10.9%) | 81 (34.3%) |
| 4.0x or more | 47 (24.3%) | 28 (11.9%) |
| Total | 193 (100.0%) | 236 (100.0%) |
Real Estate Taxes by Mortgage Status in Mount Jackson
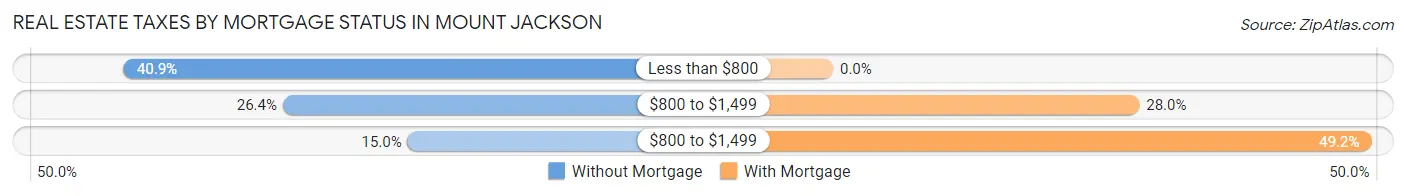
| Property Taxes | Without Mortgage | With Mortgage |
| Less than $800 | 79 (40.9%) | 0 (0.0%) |
| $800 to $1,499 | 51 (26.4%) | 66 (28.0%) |
| $800 to $1,499 | 29 (15.0%) | 116 (49.1%) |
| Total | 193 (100.0%) | 236 (100.0%) |
Health & Disability in Mount Jackson
Health Insurance Coverage by Age in Mount Jackson
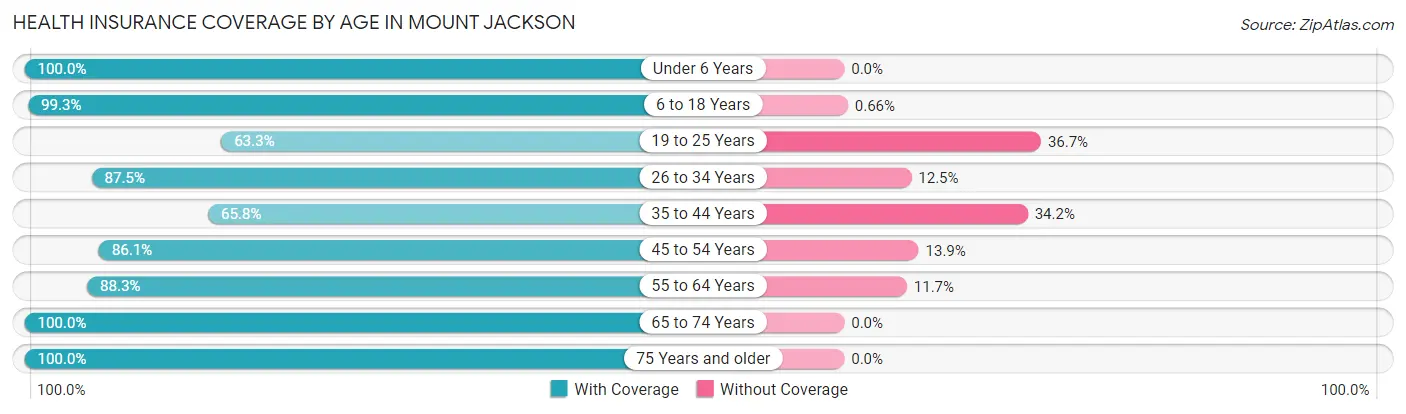
| Age Bracket | With Coverage | Without Coverage |
| Under 6 Years | 174 (100.0%) | 0 (0.0%) |
| 6 to 18 Years | 301 (99.3%) | 2 (0.7%) |
| 19 to 25 Years | 114 (63.3%) | 66 (36.7%) |
| 26 to 34 Years | 119 (87.5%) | 17 (12.5%) |
| 35 to 44 Years | 150 (65.8%) | 78 (34.2%) |
| 45 to 54 Years | 261 (86.1%) | 42 (13.9%) |
| 55 to 64 Years | 212 (88.3%) | 28 (11.7%) |
| 65 to 74 Years | 167 (100.0%) | 0 (0.0%) |
| 75 Years and older | 102 (100.0%) | 0 (0.0%) |
| Total | 1,600 (87.3%) | 233 (12.7%) |
Health Insurance Coverage by Citizenship Status in Mount Jackson
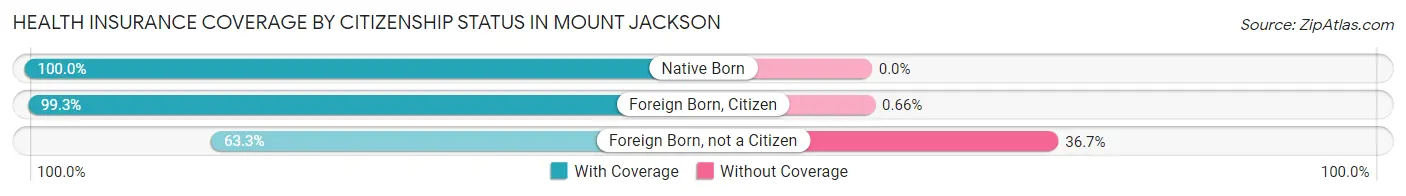
| Citizenship Status | With Coverage | Without Coverage |
| Native Born | 174 (100.0%) | 0 (0.0%) |
| Foreign Born, Citizen | 301 (99.3%) | 2 (0.7%) |
| Foreign Born, not a Citizen | 114 (63.3%) | 66 (36.7%) |
Health Insurance Coverage by Household Income in Mount Jackson
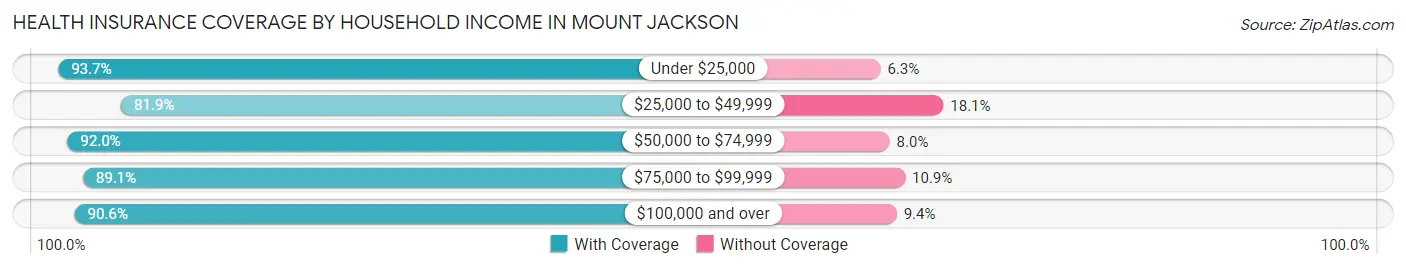
| Household Income | With Coverage | Without Coverage |
| Under $25,000 | 312 (93.7%) | 21 (6.3%) |
| $25,000 to $49,999 | 507 (81.9%) | 112 (18.1%) |
| $50,000 to $74,999 | 252 (92.0%) | 22 (8.0%) |
| $75,000 to $99,999 | 155 (89.1%) | 19 (10.9%) |
| $100,000 and over | 368 (90.6%) | 38 (9.4%) |
Public vs Private Health Insurance Coverage by Age in Mount Jackson
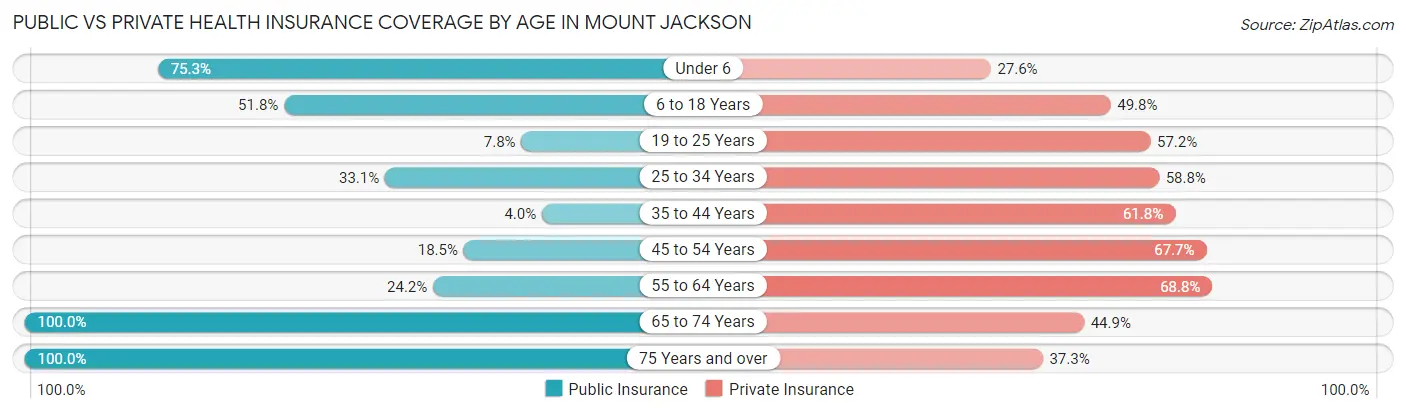
| Age Bracket | Public Insurance | Private Insurance |
| Under 6 | 131 (75.3%) | 48 (27.6%) |
| 6 to 18 Years | 157 (51.8%) | 151 (49.8%) |
| 19 to 25 Years | 14 (7.8%) | 103 (57.2%) |
| 25 to 34 Years | 45 (33.1%) | 80 (58.8%) |
| 35 to 44 Years | 9 (4.0%) | 141 (61.8%) |
| 45 to 54 Years | 56 (18.5%) | 205 (67.7%) |
| 55 to 64 Years | 58 (24.2%) | 165 (68.8%) |
| 65 to 74 Years | 167 (100.0%) | 75 (44.9%) |
| 75 Years and over | 102 (100.0%) | 38 (37.2%) |
| Total | 739 (40.3%) | 1,006 (54.9%) |
Disability Status by Sex by Age in Mount Jackson
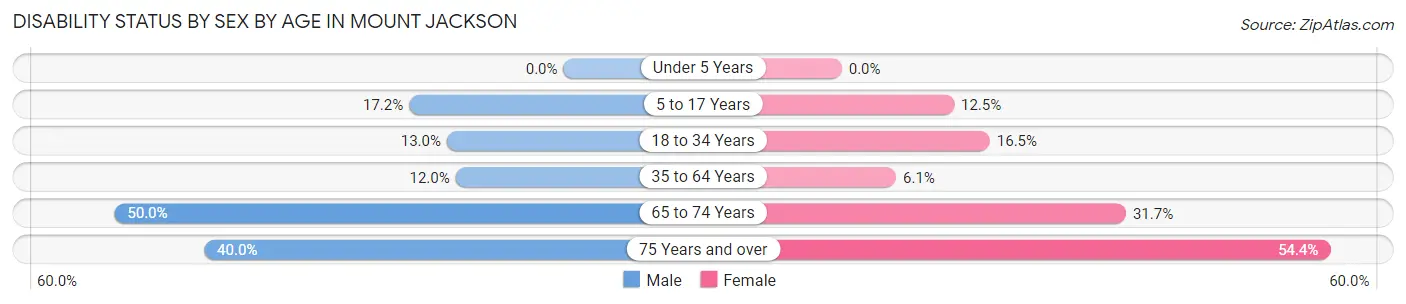
| Age Bracket | Male | Female |
| Under 5 Years | 0 (0.0%) | 0 (0.0%) |
| 5 to 17 Years | 28 (17.2%) | 21 (12.5%) |
| 18 to 34 Years | 17 (13.0%) | 32 (16.5%) |
| 35 to 64 Years | 43 (12.0%) | 25 (6.0%) |
| 65 to 74 Years | 44 (50.0%) | 25 (31.7%) |
| 75 Years and over | 18 (40.0%) | 31 (54.4%) |
Disability Class by Sex by Age in Mount Jackson
Disability Class: Hearing Difficulty
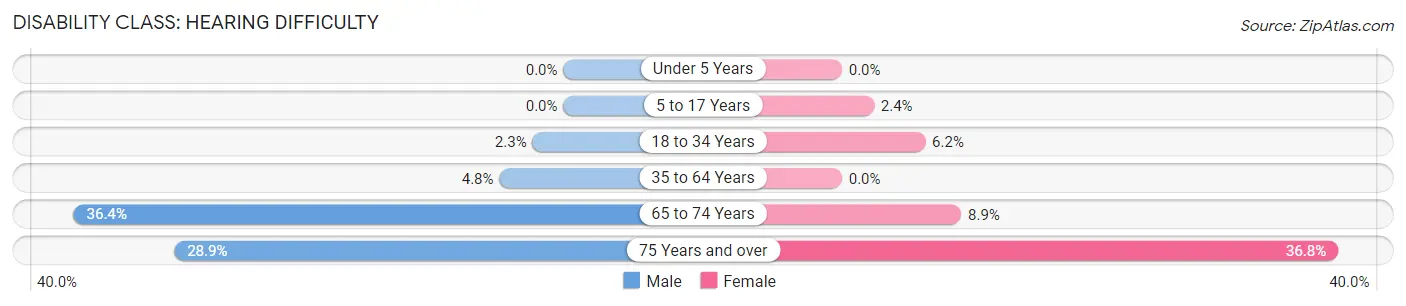
| Age Bracket | Male | Female |
| Under 5 Years | 0 (0.0%) | 0 (0.0%) |
| 5 to 17 Years | 0 (0.0%) | 4 (2.4%) |
| 18 to 34 Years | 3 (2.3%) | 12 (6.2%) |
| 35 to 64 Years | 17 (4.8%) | 0 (0.0%) |
| 65 to 74 Years | 32 (36.4%) | 7 (8.9%) |
| 75 Years and over | 13 (28.9%) | 21 (36.8%) |
Disability Class: Vision Difficulty
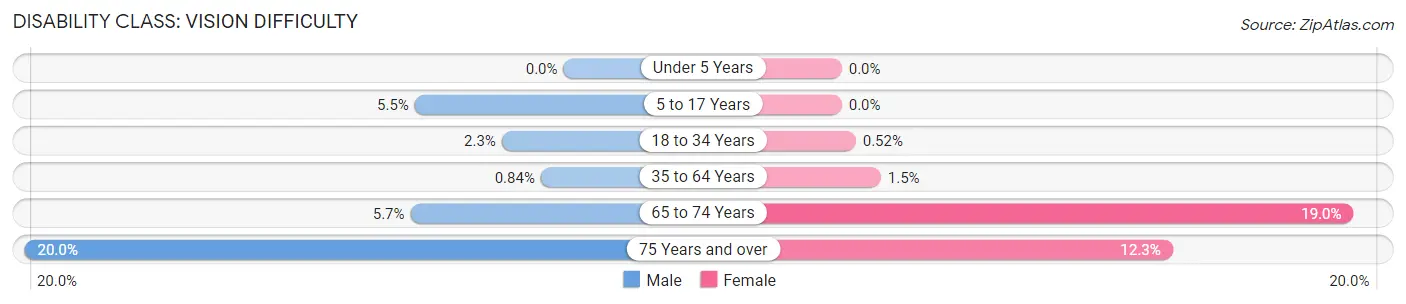
| Age Bracket | Male | Female |
| Under 5 Years | 0 (0.0%) | 0 (0.0%) |
| 5 to 17 Years | 9 (5.5%) | 0 (0.0%) |
| 18 to 34 Years | 3 (2.3%) | 1 (0.5%) |
| 35 to 64 Years | 3 (0.8%) | 6 (1.5%) |
| 65 to 74 Years | 5 (5.7%) | 15 (19.0%) |
| 75 Years and over | 9 (20.0%) | 7 (12.3%) |
Disability Class: Cognitive Difficulty
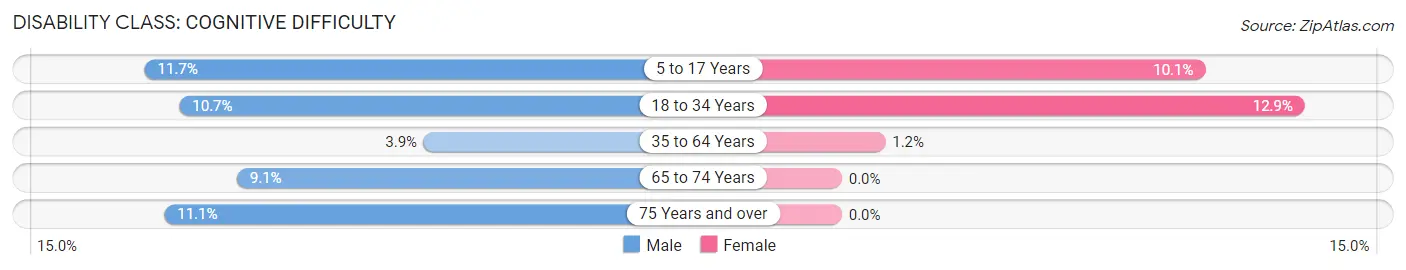
| Age Bracket | Male | Female |
| 5 to 17 Years | 19 (11.7%) | 17 (10.1%) |
| 18 to 34 Years | 14 (10.7%) | 25 (12.9%) |
| 35 to 64 Years | 14 (3.9%) | 5 (1.2%) |
| 65 to 74 Years | 8 (9.1%) | 0 (0.0%) |
| 75 Years and over | 5 (11.1%) | 0 (0.0%) |
Disability Class: Ambulatory Difficulty
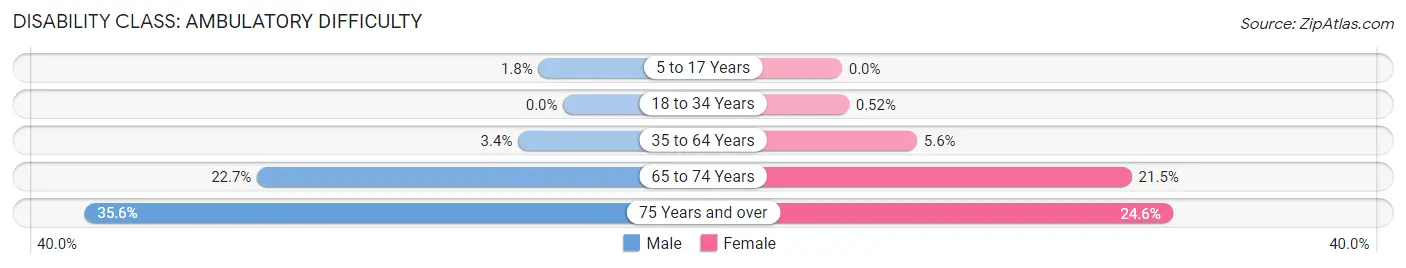
| Age Bracket | Male | Female |
| 5 to 17 Years | 3 (1.8%) | 0 (0.0%) |
| 18 to 34 Years | 0 (0.0%) | 1 (0.5%) |
| 35 to 64 Years | 12 (3.4%) | 23 (5.6%) |
| 65 to 74 Years | 20 (22.7%) | 17 (21.5%) |
| 75 Years and over | 16 (35.6%) | 14 (24.6%) |
Disability Class: Self-Care Difficulty
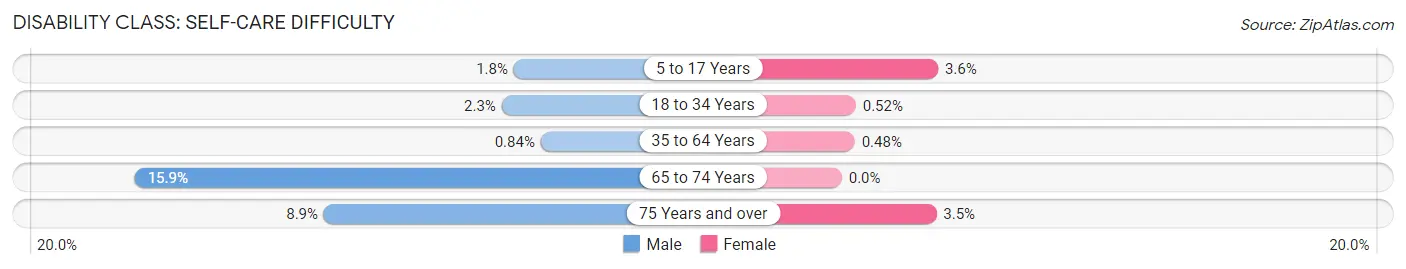
| Age Bracket | Male | Female |
| 5 to 17 Years | 3 (1.8%) | 6 (3.6%) |
| 18 to 34 Years | 3 (2.3%) | 1 (0.5%) |
| 35 to 64 Years | 3 (0.8%) | 2 (0.5%) |
| 65 to 74 Years | 14 (15.9%) | 0 (0.0%) |
| 75 Years and over | 4 (8.9%) | 2 (3.5%) |
Technology Access in Mount Jackson
Computing Device Access in Mount Jackson
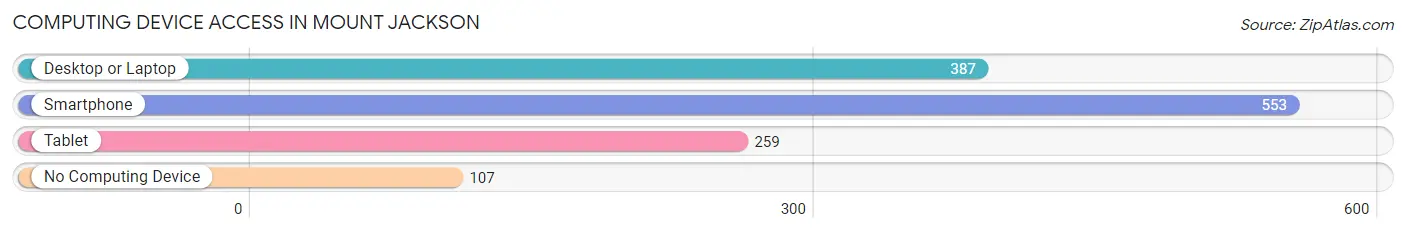
| Device Type | # Households | % Households |
| Desktop or Laptop | 387 | 54.2% |
| Smartphone | 553 | 77.4% |
| Tablet | 259 | 36.3% |
| No Computing Device | 107 | 15.0% |
| Total | 714 | 100.0% |
Internet Access in Mount Jackson
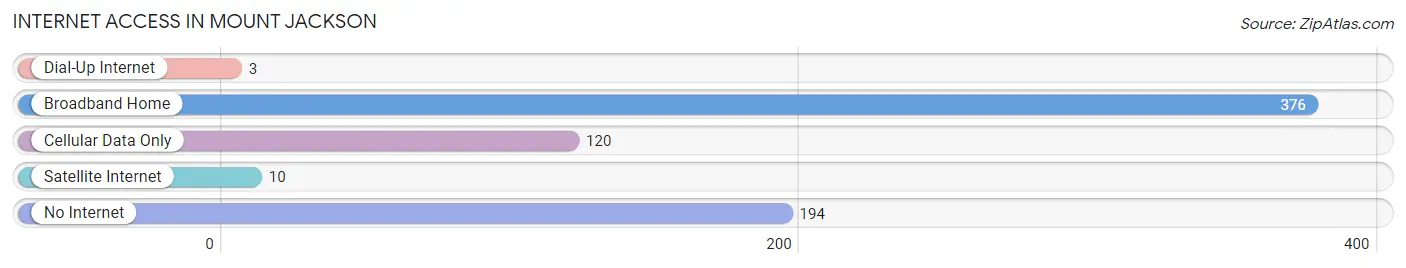
| Internet Type | # Households | % Households |
| Dial-Up Internet | 3 | 0.4% |
| Broadband Home | 376 | 52.7% |
| Cellular Data Only | 120 | 16.8% |
| Satellite Internet | 10 | 1.4% |
| No Internet | 194 | 27.2% |
| Total | 714 | 100.0% |
Mount Jackson Summary
History
Mount Jackson is a town located in Shenandoah County, Virginia. It was founded in 1832 and was named after the nearby mountain, which was named after the first president of the United States, George Washington. The town was originally a small farming community, but it has since grown into a thriving town with a population of over 2,000 people.
The town was originally part of the Shenandoah Valley, which was a major route for settlers heading west. During the Civil War, the town was a major supply center for the Confederate Army. After the war, the town was rebuilt and the economy began to grow. The town was home to several factories, including a woolen mill, a tannery, and a furniture factory.
In the late 19th century, the town was a popular tourist destination. It was home to several resorts, including the Grand Hotel, which was built in 1891. The town also had a thriving music scene, with several bands playing in the local taverns.
In the early 20th century, the town began to decline. The factories closed and the tourist industry declined. The town was hit hard by the Great Depression and World War II. After the war, the town began to recover and the economy began to grow again.
Geography
Mount Jackson is located in the Shenandoah Valley in the northwestern part of Virginia. The town is situated at the base of the Massanutten Mountain range and is surrounded by the Shenandoah National Park. The town is located near the intersection of Interstate 81 and U.S. Route 11.
The town is located in a temperate climate, with hot summers and cold winters. The average temperature in the summer is around 75 degrees Fahrenheit and the average temperature in the winter is around 35 degrees Fahrenheit. The town receives an average of 40 inches of rain per year.
Economy
The economy of Mount Jackson is largely based on tourism and agriculture. The town is home to several tourist attractions, including the Grand Hotel, the Shenandoah National Park, and the Shenandoah Valley Railroad. The town is also home to several wineries and breweries.
Agriculture is also an important part of the economy. The town is home to several farms, which produce a variety of crops, including corn, soybeans, wheat, and hay. The town is also home to several livestock farms, which produce beef, pork, and poultry.
Demographics
As of the 2010 census, the population of Mount Jackson was 2,068. The population is largely white (94.3%), with a small percentage of African Americans (2.2%), Asians (1.2%), and Hispanics (1.3%). The median household income is $41,944 and the median home value is $164,400.
The town is served by the Shenandoah County Public Schools system. The town is home to several churches, including the Mount Jackson United Methodist Church, the Mount Jackson Baptist Church, and the Mount Jackson Presbyterian Church.
Conclusion
Mount Jackson is a small town located in Shenandoah County, Virginia. It was founded in 1832 and was originally a small farming community. The town has since grown into a thriving town with a population of over 2,000 people. The town is largely based on tourism and agriculture, and is home to several tourist attractions, wineries, and breweries. The town is served by the Shenandoah County Public Schools system and is home to several churches.
Common Questions
What is Per Capita Income in Mount Jackson?
Per Capita income in Mount Jackson is $23,804.
What is the Median Family Income in Mount Jackson?
Median Family Income in Mount Jackson is $49,973.
What is the Median Household income in Mount Jackson?
Median Household Income in Mount Jackson is $45,583.
What is Income or Wage Gap in Mount Jackson?
Income or Wage Gap in Mount Jackson is 30.5%.
Women in Mount Jackson earn 69.5 cents for every dollar earned by a man.
What is Family Income Deficit in Mount Jackson?
Family Income Deficit in Mount Jackson is $10,577.
Families that are below poverty line in Mount Jackson earn $10,577 less on average than the poverty threshold level.
What is Inequality or Gini Index in Mount Jackson?
Inequality or Gini Index in Mount Jackson is 0.42.
What is the Total Population of Mount Jackson?
Total Population of Mount Jackson is 1,833.
What is the Total Male Population of Mount Jackson?
Total Male Population of Mount Jackson is 806.
What is the Total Female Population of Mount Jackson?
Total Female Population of Mount Jackson is 1,027.
What is the Ratio of Males per 100 Females in Mount Jackson?
There are 78.48 Males per 100 Females in Mount Jackson.
What is the Ratio of Females per 100 Males in Mount Jackson?
There are 127.42 Females per 100 Males in Mount Jackson.
What is the Median Population Age in Mount Jackson?
Median Population Age in Mount Jackson is 37.9 Years.
What is the Average Family Size in Mount Jackson
Average Family Size in Mount Jackson is 3.3 People.
What is the Average Household Size in Mount Jackson
Average Household Size in Mount Jackson is 2.5 People.
How Large is the Labor Force in Mount Jackson?
There are 897 People in the Labor Forcein in Mount Jackson.
What is the Percentage of People in the Labor Force in Mount Jackson?
64.4% of People are in the Labor Force in Mount Jackson.
What is the Unemployment Rate in Mount Jackson?
Unemployment Rate in Mount Jackson is 10.7%.