Harrisonburg, VA Map & Demographics
Harrisonburg Map
Harrisonburg Overview
$25,881
PER CAPITA INCOME
$70,729
AVG FAMILY INCOME
$56,050
AVG HOUSEHOLD INCOME
51.7%
WAGE / INCOME GAP [ % ]
48.3¢/ $1
WAGE / INCOME GAP [ $ ]
$13,189
FAMILY INCOME DEFICIT
0.48
INEQUALITY / GINI INDEX
51,784
TOTAL POPULATION
25,035
MALE POPULATION
26,749
FEMALE POPULATION
93.59
MALES / 100 FEMALES
106.85
FEMALES / 100 MALES
25.4
MEDIAN AGE
3.0
AVG FAMILY SIZE
2.6
AVG HOUSEHOLD SIZE
26,586
LABOR FORCE [ PEOPLE ]
60.1%
PERCENT IN LABOR FORCE
6.7%
UNEMPLOYMENT RATE
Harrisonburg Area Codes
Income in Harrisonburg
Income Overview in Harrisonburg
Per Capita Income in Harrisonburg is $25,881, while median incomes of families and households are $70,729 and $56,050 respectively.
| Characteristic | Number | Measure |
| Per Capita Income | 51,784 | $25,881 |
| Median Family Income | 8,867 | $70,729 |
| Mean Family Income | 8,867 | $89,094 |
| Median Household Income | 17,142 | $56,050 |
| Mean Household Income | 17,142 | $75,009 |
| Income Deficit | 8,867 | $13,189 |
| Wage / Income Gap (%) | 51,784 | 51.67% |
| Wage / Income Gap ($) | 51,784 | 48.33¢ per $1 |
| Gini / Inequality Index | 51,784 | 0.48 |
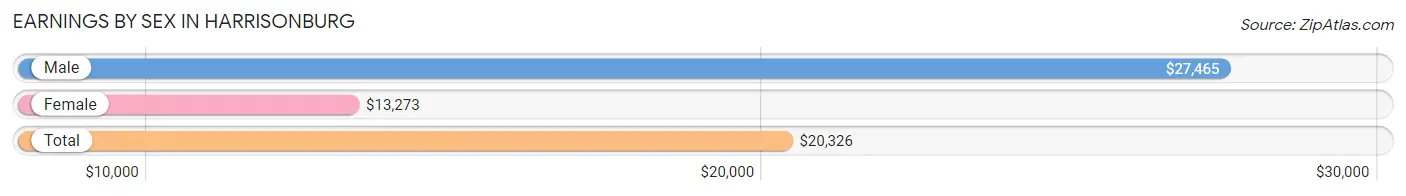
Earnings by Sex in Harrisonburg
Average Earnings in Harrisonburg are $20,326, $27,465 for men and $13,273 for women, a difference of 51.7%.
| Sex | Number | Average Earnings |
| Male | 16,203 (49.7%) | $27,465 |
| Female | 16,388 (50.3%) | $13,273 |
| Total | 32,591 (100.0%) | $20,326 |
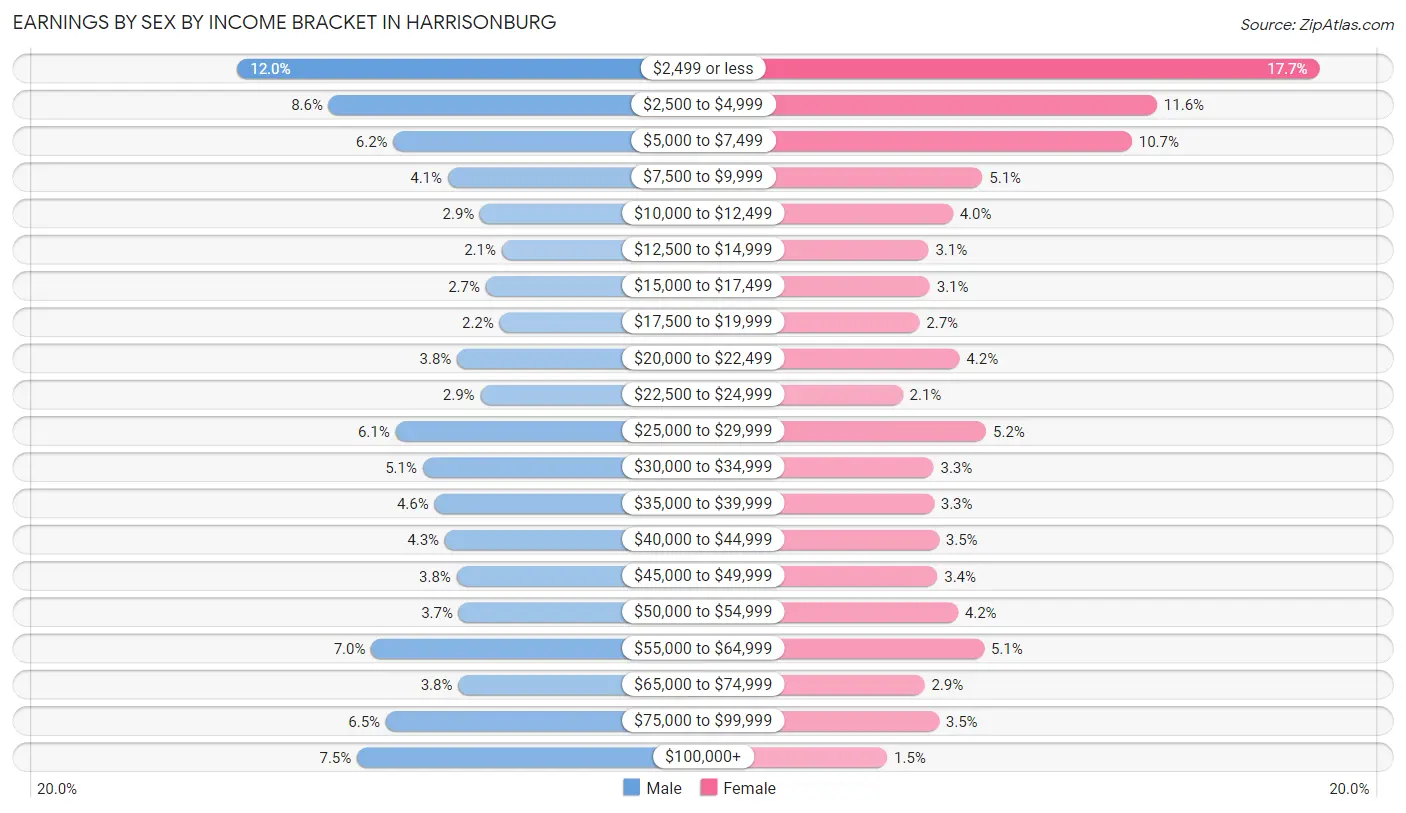
Earnings by Sex by Income Bracket in Harrisonburg
The most common earnings brackets in Harrisonburg are $2,499 or less for men (1,950 | 12.0%) and $2,499 or less for women (2,902 | 17.7%).
| Income | Male | Female |
| $2,499 or less | 1,950 (12.0%) | 2,902 (17.7%) |
| $2,500 to $4,999 | 1,393 (8.6%) | 1,904 (11.6%) |
| $5,000 to $7,499 | 1,001 (6.2%) | 1,750 (10.7%) |
| $7,500 to $9,999 | 670 (4.1%) | 833 (5.1%) |
| $10,000 to $12,499 | 474 (2.9%) | 650 (4.0%) |
| $12,500 to $14,999 | 344 (2.1%) | 501 (3.1%) |
| $15,000 to $17,499 | 441 (2.7%) | 509 (3.1%) |
| $17,500 to $19,999 | 357 (2.2%) | 446 (2.7%) |
| $20,000 to $22,499 | 614 (3.8%) | 692 (4.2%) |
| $22,500 to $24,999 | 473 (2.9%) | 343 (2.1%) |
| $25,000 to $29,999 | 988 (6.1%) | 855 (5.2%) |
| $30,000 to $34,999 | 823 (5.1%) | 533 (3.3%) |
| $35,000 to $39,999 | 752 (4.6%) | 535 (3.3%) |
| $40,000 to $44,999 | 688 (4.3%) | 565 (3.5%) |
| $45,000 to $49,999 | 618 (3.8%) | 556 (3.4%) |
| $50,000 to $54,999 | 605 (3.7%) | 681 (4.2%) |
| $55,000 to $64,999 | 1,136 (7.0%) | 843 (5.1%) |
| $65,000 to $74,999 | 607 (3.7%) | 477 (2.9%) |
| $75,000 to $99,999 | 1,047 (6.5%) | 565 (3.5%) |
| $100,000+ | 1,222 (7.5%) | 248 (1.5%) |
| Total | 16,203 (100.0%) | 16,388 (100.0%) |
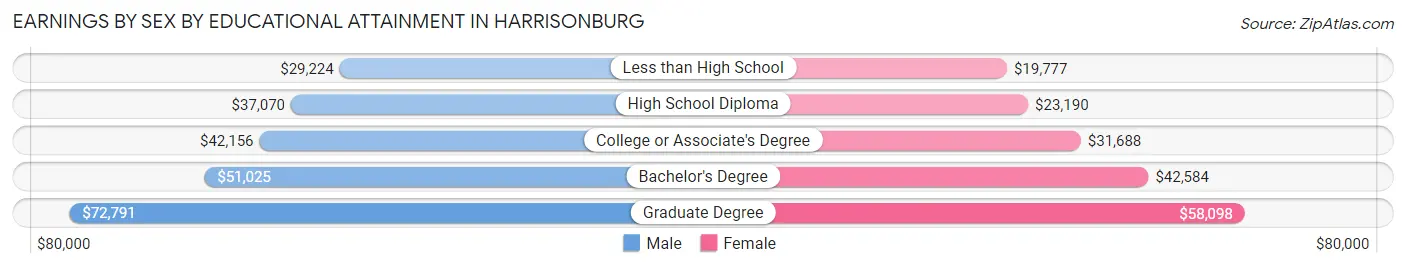
Earnings by Sex by Educational Attainment in Harrisonburg
Average earnings in Harrisonburg are $41,705 for men and $34,331 for women, a difference of 17.7%. Men with an educational attainment of graduate degree enjoy the highest average annual earnings of $72,791, while those with less than high school education earn the least with $29,224. Women with an educational attainment of graduate degree earn the most with the average annual earnings of $58,098, while those with less than high school education have the smallest earnings of $19,777.
| Educational Attainment | Male Income | Female Income |
| Less than High School | $29,224 | $19,777 |
| High School Diploma | $37,070 | $23,190 |
| College or Associate's Degree | $42,156 | $31,688 |
| Bachelor's Degree | $51,025 | $42,584 |
| Graduate Degree | $72,791 | $58,098 |
| Total | $41,705 | $34,331 |
Family Income in Harrisonburg
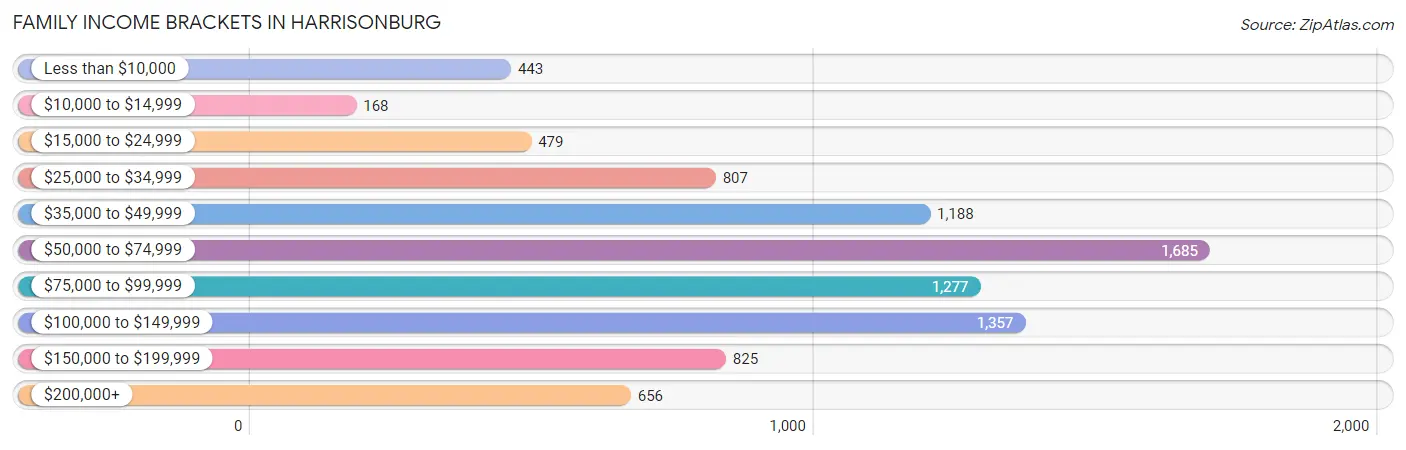
Family Income Brackets in Harrisonburg
According to the Harrisonburg family income data, there are 1,685 families falling into the $50,000 to $74,999 income range, which is the most common income bracket and makes up 19.0% of all families. Conversely, the $10,000 to $14,999 income bracket is the least frequent group with only 168 families (1.9%) belonging to this category.
| Income Bracket | # Families | % Families |
| Less than $10,000 | 443 | 5.0% |
| $10,000 to $14,999 | 168 | 1.9% |
| $15,000 to $24,999 | 479 | 5.4% |
| $25,000 to $34,999 | 807 | 9.1% |
| $35,000 to $49,999 | 1,188 | 13.4% |
| $50,000 to $74,999 | 1,685 | 19.0% |
| $75,000 to $99,999 | 1,277 | 14.4% |
| $100,000 to $149,999 | 1,357 | 15.3% |
| $150,000 to $199,999 | 825 | 9.3% |
| $200,000+ | 656 | 7.4% |
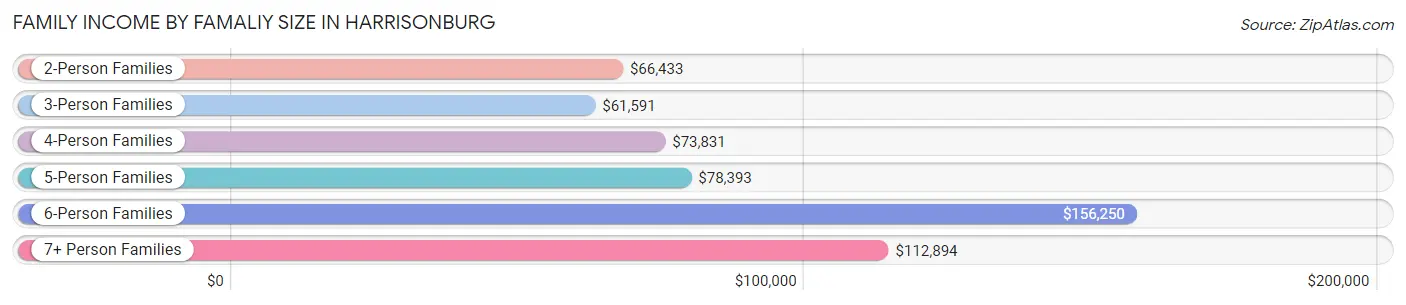
Family Income by Famaliy Size in Harrisonburg
6-person families (196 | 2.2%) account for the highest median family income in Harrisonburg with $156,250 per family, while 2-person families (3,720 | 41.9%) have the highest median income of $33,216 per family member.
| Income Bracket | # Families | Median Income |
| 2-Person Families | 3,720 (41.9%) | $66,433 |
| 3-Person Families | 2,338 (26.4%) | $61,591 |
| 4-Person Families | 1,591 (17.9%) | $73,831 |
| 5-Person Families | 785 (8.8%) | $78,393 |
| 6-Person Families | 196 (2.2%) | $156,250 |
| 7+ Person Families | 237 (2.7%) | $112,894 |
| Total | 8,867 (100.0%) | $70,729 |
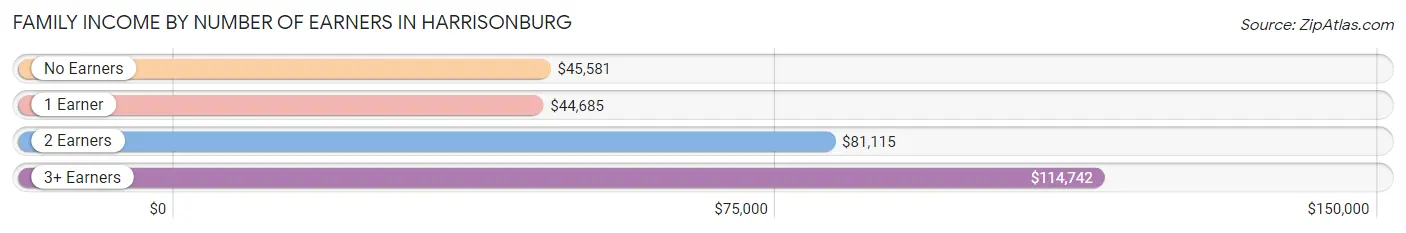
Family Income by Number of Earners in Harrisonburg
The median family income in Harrisonburg is $70,729, with families comprising 3+ earners (1,309) having the highest median family income of $114,742, while families with 1 earner (2,846) have the lowest median family income of $44,685, accounting for 14.8% and 32.1% of families, respectively.
| Number of Earners | # Families | Median Income |
| No Earners | 1,073 (12.1%) | $45,581 |
| 1 Earner | 2,846 (32.1%) | $44,685 |
| 2 Earners | 3,639 (41.0%) | $81,115 |
| 3+ Earners | 1,309 (14.8%) | $114,742 |
| Total | 8,867 (100.0%) | $70,729 |
Household Income in Harrisonburg
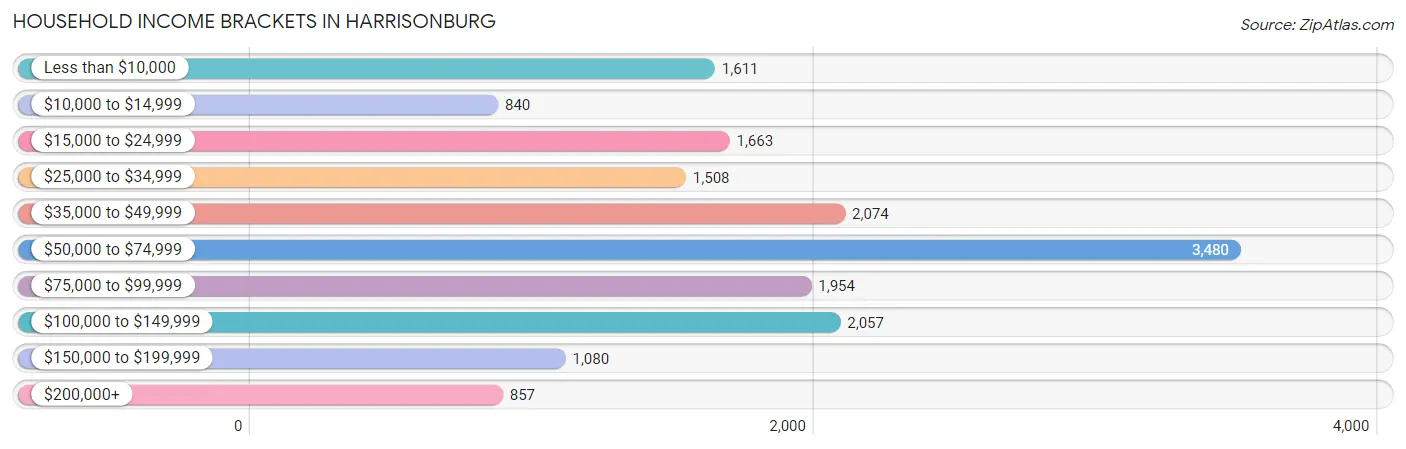
Household Income Brackets in Harrisonburg
With 3,480 households falling in the category, the $50,000 to $74,999 income range is the most frequent in Harrisonburg, accounting for 20.3% of all households. In contrast, only 840 households (4.9%) fall into the $10,000 to $14,999 income bracket, making it the least populous group.
| Income Bracket | # Households | % Households |
| Less than $10,000 | 1,611 | 9.4% |
| $10,000 to $14,999 | 840 | 4.9% |
| $15,000 to $24,999 | 1,663 | 9.7% |
| $25,000 to $34,999 | 1,508 | 8.8% |
| $35,000 to $49,999 | 2,074 | 12.1% |
| $50,000 to $74,999 | 3,480 | 20.3% |
| $75,000 to $99,999 | 1,954 | 11.4% |
| $100,000 to $149,999 | 2,057 | 12.0% |
| $150,000 to $199,999 | 1,080 | 6.3% |
| $200,000+ | 857 | 5.0% |
Household Income by Householder Age in Harrisonburg
The median household income in Harrisonburg is $56,050, with the highest median household income of $62,242 found in the 25 to 44 years age bracket for the primary householder. A total of 6,091 households (35.5%) fall into this category. Meanwhile, the 15 to 24 years age bracket for the primary householder has the lowest median household income of $22,886, with 2,784 households (16.2%) in this group.
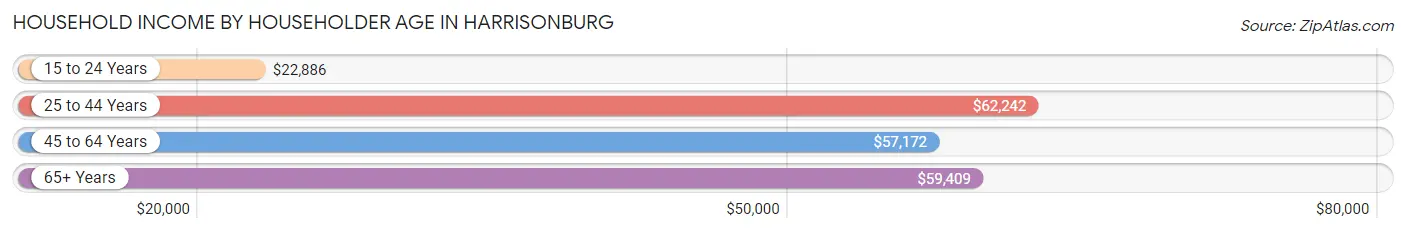
| Income Bracket | # Households | Median Income |
| 15 to 24 Years | 2,784 (16.2%) | $22,886 |
| 25 to 44 Years | 6,091 (35.5%) | $62,242 |
| 45 to 64 Years | 5,117 (29.8%) | $57,172 |
| 65+ Years | 3,150 (18.4%) | $59,409 |
| Total | 17,142 (100.0%) | $56,050 |
Poverty in Harrisonburg
Income Below Poverty by Sex and Age in Harrisonburg
With 25.7% poverty level for males and 28.7% for females among the residents of Harrisonburg, 18 to 24 year old males and 18 to 24 year old females are the most vulnerable to poverty, with 3,013 males (64.7%) and 4,056 females (70.7%) in their respective age groups living below the poverty level.
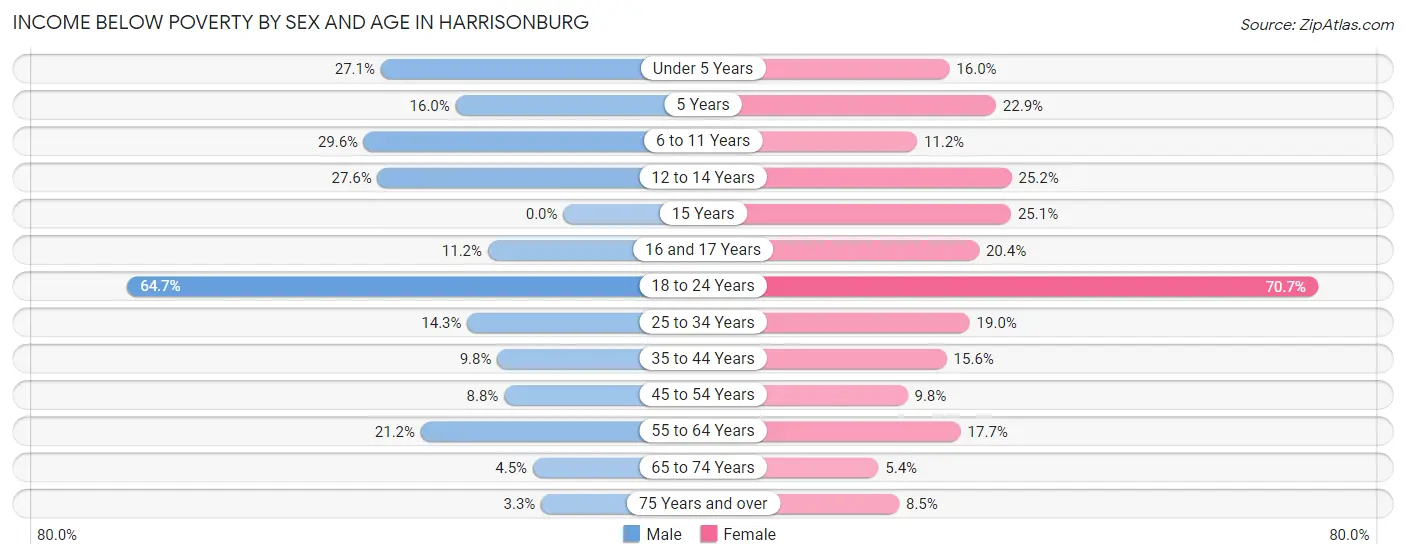
| Age Bracket | Male | Female |
| Under 5 Years | 360 (27.1%) | 175 (16.0%) |
| 5 Years | 36 (16.0%) | 54 (22.9%) |
| 6 to 11 Years | 435 (29.6%) | 174 (11.2%) |
| 12 to 14 Years | 190 (27.6%) | 121 (25.2%) |
| 15 Years | 0 (0.0%) | 52 (25.1%) |
| 16 and 17 Years | 51 (11.2%) | 89 (20.4%) |
| 18 to 24 Years | 3,013 (64.7%) | 4,056 (70.7%) |
| 25 to 34 Years | 502 (14.2%) | 607 (19.0%) |
| 35 to 44 Years | 263 (9.8%) | 437 (15.6%) |
| 45 to 54 Years | 222 (8.8%) | 210 (9.8%) |
| 55 to 64 Years | 448 (21.2%) | 365 (17.6%) |
| 65 to 74 Years | 56 (4.5%) | 86 (5.4%) |
| 75 Years and over | 26 (3.3%) | 95 (8.5%) |
| Total | 5,602 (25.7%) | 6,521 (28.7%) |
Income Above Poverty by Sex and Age in Harrisonburg
According to the poverty statistics in Harrisonburg, males aged 15 years and females aged 65 to 74 years are the age groups that are most secure financially, with 100.0% of males and 94.6% of females in these age groups living above the poverty line.
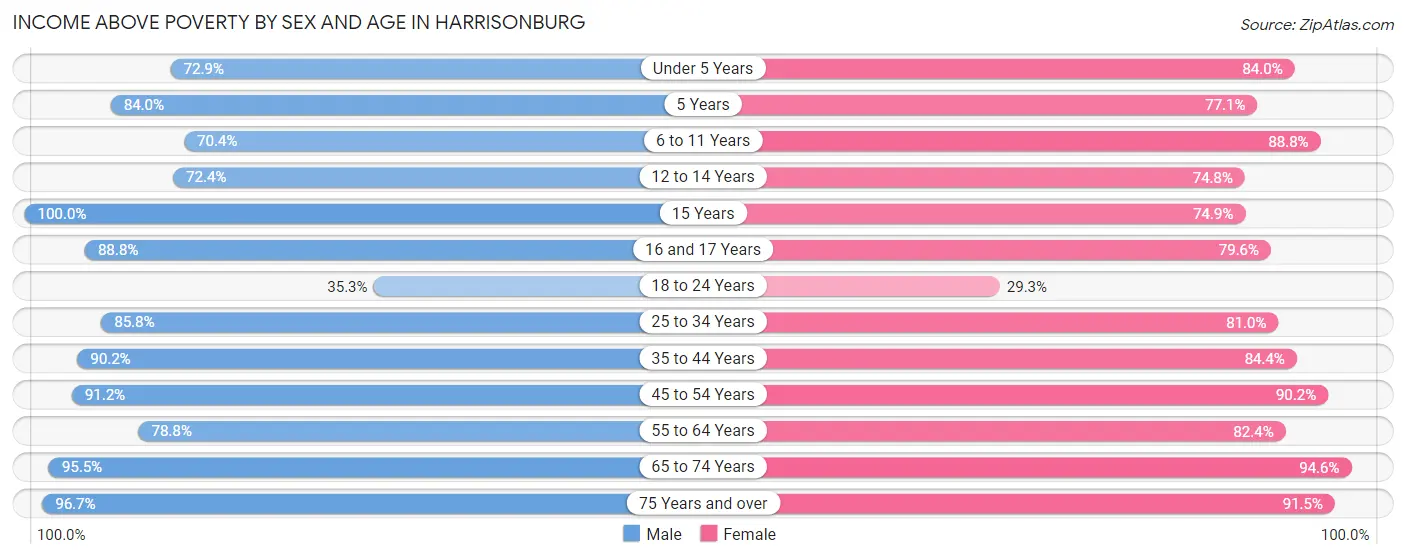
| Age Bracket | Male | Female |
| Under 5 Years | 968 (72.9%) | 920 (84.0%) |
| 5 Years | 189 (84.0%) | 182 (77.1%) |
| 6 to 11 Years | 1,034 (70.4%) | 1,385 (88.8%) |
| 12 to 14 Years | 499 (72.4%) | 359 (74.8%) |
| 15 Years | 141 (100.0%) | 155 (74.9%) |
| 16 and 17 Years | 404 (88.8%) | 348 (79.6%) |
| 18 to 24 Years | 1,641 (35.3%) | 1,684 (29.3%) |
| 25 to 34 Years | 3,022 (85.8%) | 2,589 (81.0%) |
| 35 to 44 Years | 2,417 (90.2%) | 2,370 (84.4%) |
| 45 to 54 Years | 2,304 (91.2%) | 1,942 (90.2%) |
| 55 to 64 Years | 1,669 (78.8%) | 1,703 (82.4%) |
| 65 to 74 Years | 1,182 (95.5%) | 1,499 (94.6%) |
| 75 Years and over | 765 (96.7%) | 1,023 (91.5%) |
| Total | 16,235 (74.4%) | 16,159 (71.3%) |
Income Below Poverty Among Married-Couple Families in Harrisonburg
The poverty statistics for married-couple families in Harrisonburg show that 6.2% or 359 of the total 5,825 families live below the poverty line. Families with 5 or more children have the highest poverty rate of 33.3%, comprising of 24 families. On the other hand, families with no children have the lowest poverty rate of 3.4%, which includes 98 families.
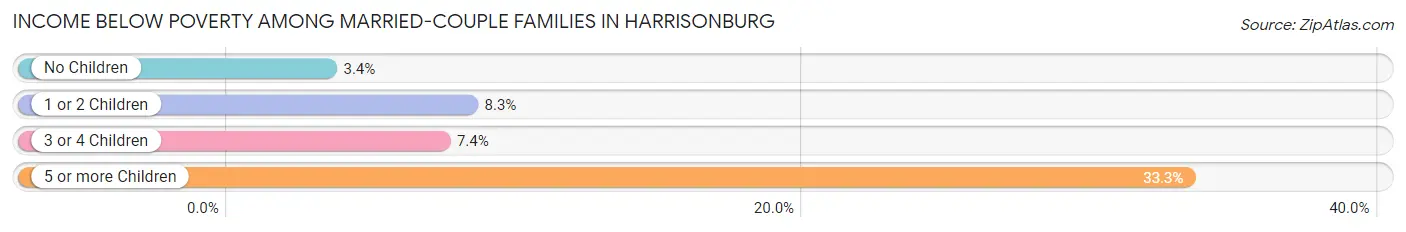
| Children | Above Poverty | Below Poverty |
| No Children | 2,760 (96.6%) | 98 (3.4%) |
| 1 or 2 Children | 2,231 (91.7%) | 203 (8.3%) |
| 3 or 4 Children | 427 (92.6%) | 34 (7.4%) |
| 5 or more Children | 48 (66.7%) | 24 (33.3%) |
| Total | 5,466 (93.8%) | 359 (6.2%) |
Income Below Poverty Among Single-Parent Households in Harrisonburg
According to the poverty data in Harrisonburg, 9.1% or 88 single-father households and 28.4% or 590 single-mother households are living below the poverty line. Among single-father households, those with 3 or 4 children have the highest poverty rate, with 13 households (16.9%) experiencing poverty. Likewise, among single-mother households, those with 5 or more children have the highest poverty rate, with 11 households (100.0%) falling below the poverty line.
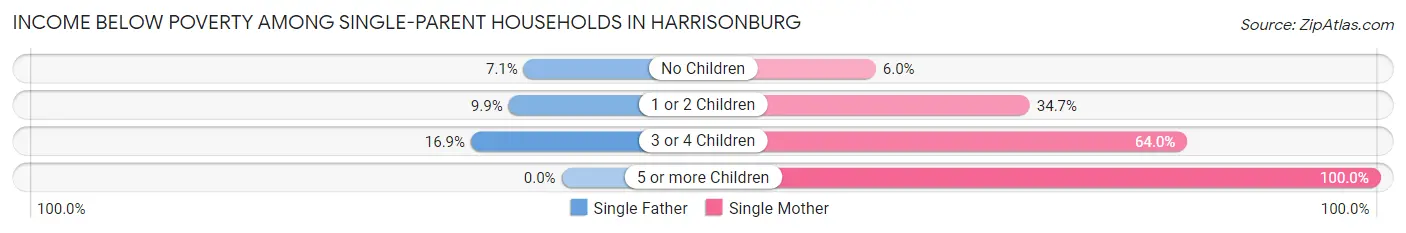
| Children | Single Father | Single Mother |
| No Children | 31 (7.0%) | 44 (6.0%) |
| 1 or 2 Children | 44 (9.9%) | 377 (34.7%) |
| 3 or 4 Children | 13 (16.9%) | 158 (64.0%) |
| 5 or more Children | 0 (0.0%) | 11 (100.0%) |
| Total | 88 (9.1%) | 590 (28.4%) |
Income Below Poverty Among Married-Couple vs Single-Parent Households in Harrisonburg
The poverty data for Harrisonburg shows that 359 of the married-couple family households (6.2%) and 678 of the single-parent households (22.3%) are living below the poverty level. Within the married-couple family households, those with 5 or more children have the highest poverty rate, with 24 households (33.3%) falling below the poverty line. Among the single-parent households, those with 5 or more children have the highest poverty rate, with 11 household (100.0%) living below poverty.
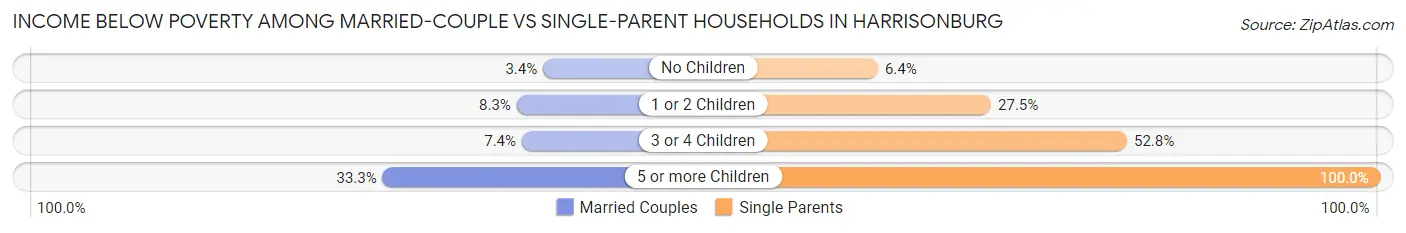
| Children | Married-Couple Families | Single-Parent Households |
| No Children | 98 (3.4%) | 75 (6.4%) |
| 1 or 2 Children | 203 (8.3%) | 421 (27.5%) |
| 3 or 4 Children | 34 (7.4%) | 171 (52.8%) |
| 5 or more Children | 24 (33.3%) | 11 (100.0%) |
| Total | 359 (6.2%) | 678 (22.3%) |
Race in Harrisonburg
The most populous races in Harrisonburg are White / Caucasian (36,781 | 71.0%), Hispanic or Latino (10,762 | 20.8%), and Two or more Races (6,018 | 11.6%).
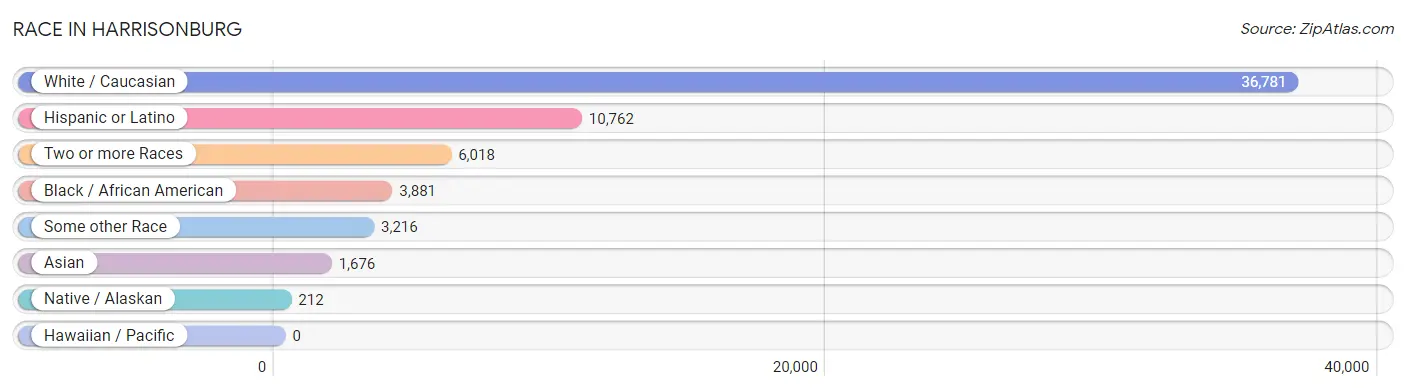
| Race | # Population | % Population |
| Asian | 1,676 | 3.2% |
| Black / African American | 3,881 | 7.5% |
| Hawaiian / Pacific | 0 | 0.0% |
| Hispanic or Latino | 10,762 | 20.8% |
| Native / Alaskan | 212 | 0.4% |
| White / Caucasian | 36,781 | 71.0% |
| Two or more Races | 6,018 | 11.6% |
| Some other Race | 3,216 | 6.2% |
| Total | 51,784 | 100.0% |
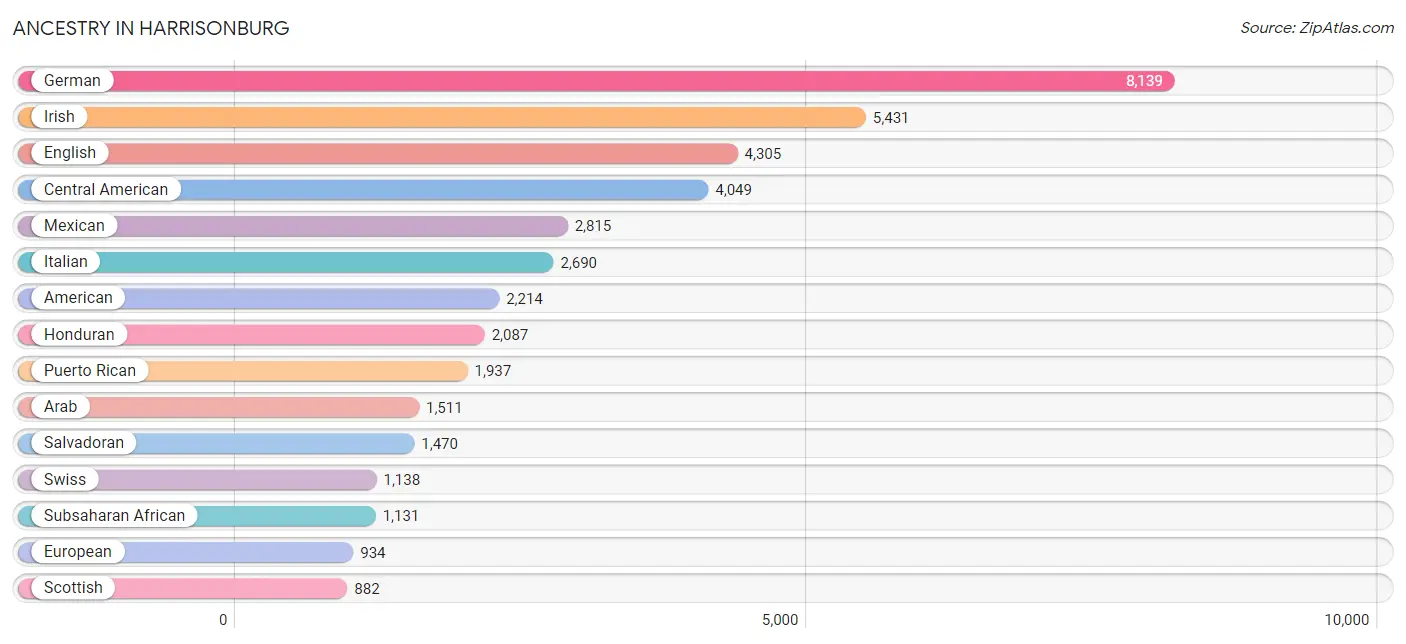
Ancestry in Harrisonburg
The most populous ancestries reported in Harrisonburg are German (8,139 | 15.7%), Irish (5,431 | 10.5%), English (4,305 | 8.3%), Central American (4,049 | 7.8%), and Mexican (2,815 | 5.4%), together accounting for 47.8% of all Harrisonburg residents.
| Ancestry | # Population | % Population |
| Afghan | 11 | 0.0% |
| African | 158 | 0.3% |
| American | 2,214 | 4.3% |
| Apache | 9 | 0.0% |
| Arab | 1,511 | 2.9% |
| Argentinean | 12 | 0.0% |
| Armenian | 26 | 0.1% |
| Australian | 16 | 0.0% |
| Austrian | 41 | 0.1% |
| Barbadian | 15 | 0.0% |
| Bermudan | 41 | 0.1% |
| Bhutanese | 92 | 0.2% |
| Bolivian | 30 | 0.1% |
| Brazilian | 25 | 0.1% |
| British | 269 | 0.5% |
| British West Indian | 10 | 0.0% |
| Burmese | 264 | 0.5% |
| Cajun | 20 | 0.0% |
| Cambodian | 11 | 0.0% |
| Canadian | 124 | 0.2% |
| Central American | 4,049 | 7.8% |
| Cherokee | 116 | 0.2% |
| Chippewa | 17 | 0.0% |
| Choctaw | 16 | 0.0% |
| Colombian | 229 | 0.4% |
| Croatian | 7 | 0.0% |
| Cuban | 458 | 0.9% |
| Czech | 224 | 0.4% |
| Czechoslovakian | 23 | 0.0% |
| Danish | 69 | 0.1% |
| Delaware | 13 | 0.0% |
| Dominican | 556 | 1.1% |
| Dutch | 358 | 0.7% |
| Eastern European | 83 | 0.2% |
| Ecuadorian | 61 | 0.1% |
| Egyptian | 58 | 0.1% |
| English | 4,305 | 8.3% |
| Ethiopian | 234 | 0.4% |
| European | 934 | 1.8% |
| Filipino | 6 | 0.0% |
| Finnish | 5 | 0.0% |
| French | 866 | 1.7% |
| French Canadian | 161 | 0.3% |
| German | 8,139 | 15.7% |
| Ghanaian | 10 | 0.0% |
| Greek | 245 | 0.5% |
| Guatemalan | 477 | 0.9% |
| Guyanese | 5 | 0.0% |
| Haitian | 15 | 0.0% |
| Honduran | 2,087 | 4.0% |
| Hungarian | 117 | 0.2% |
| Indian (Asian) | 501 | 1.0% |
| Indonesian | 95 | 0.2% |
| Iranian | 50 | 0.1% |
| Iraqi | 485 | 0.9% |
| Irish | 5,431 | 10.5% |
| Iroquois | 11 | 0.0% |
| Italian | 2,690 | 5.2% |
| Jamaican | 40 | 0.1% |
| Japanese | 15 | 0.0% |
| Kenyan | 45 | 0.1% |
| Korean | 439 | 0.9% |
| Laotian | 8 | 0.0% |
| Latvian | 10 | 0.0% |
| Lebanese | 43 | 0.1% |
| Lithuanian | 46 | 0.1% |
| Malaysian | 137 | 0.3% |
| Mexican | 2,815 | 5.4% |
| Mexican American Indian | 79 | 0.2% |
| Native Hawaiian | 9 | 0.0% |
| Navajo | 4 | 0.0% |
| Nicaraguan | 9 | 0.0% |
| Nigerian | 66 | 0.1% |
| Northern European | 29 | 0.1% |
| Norwegian | 215 | 0.4% |
| Pakistani | 23 | 0.0% |
| Palestinian | 8 | 0.0% |
| Panamanian | 6 | 0.0% |
| Pennsylvania German | 11 | 0.0% |
| Peruvian | 60 | 0.1% |
| Polish | 877 | 1.7% |
| Portuguese | 81 | 0.2% |
| Puerto Rican | 1,937 | 3.7% |
| Romanian | 12 | 0.0% |
| Russian | 355 | 0.7% |
| Salvadoran | 1,470 | 2.8% |
| Scandinavian | 116 | 0.2% |
| Scotch-Irish | 614 | 1.2% |
| Scottish | 882 | 1.7% |
| Serbian | 11 | 0.0% |
| Sioux | 4 | 0.0% |
| Slavic | 34 | 0.1% |
| Slovak | 56 | 0.1% |
| Slovene | 7 | 0.0% |
| South American | 623 | 1.2% |
| Spaniard | 73 | 0.1% |
| Spanish | 51 | 0.1% |
| Sri Lankan | 297 | 0.6% |
| Subsaharan African | 1,131 | 2.2% |
| Sudanese | 14 | 0.0% |
| Swedish | 491 | 0.9% |
| Swiss | 1,138 | 2.2% |
| Syrian | 26 | 0.1% |
| Thai | 332 | 0.6% |
| Ugandan | 108 | 0.2% |
| Ukrainian | 240 | 0.5% |
| Uruguayan | 222 | 0.4% |
| Venezuelan | 9 | 0.0% |
| Vietnamese | 25 | 0.1% |
| Welsh | 399 | 0.8% |
| West Indian | 5 | 0.0% |
| Yugoslavian | 85 | 0.2% | View All 112 Rows |
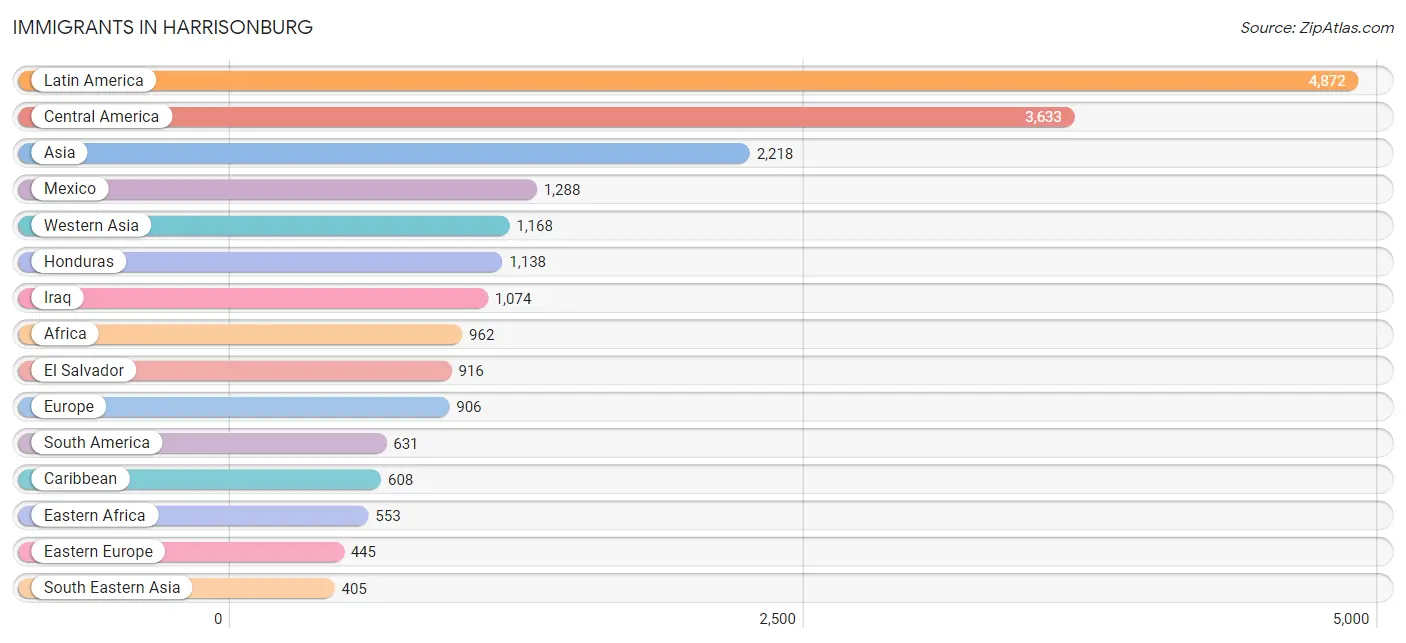
Immigrants in Harrisonburg
The most numerous immigrant groups reported in Harrisonburg came from Latin America (4,872 | 9.4%), Central America (3,633 | 7.0%), Asia (2,218 | 4.3%), Mexico (1,288 | 2.5%), and Western Asia (1,168 | 2.3%), together accounting for 25.5% of all Harrisonburg residents.
| Immigration Origin | # Population | % Population |
| Africa | 962 | 1.9% |
| Argentina | 28 | 0.1% |
| Asia | 2,218 | 4.3% |
| Australia | 6 | 0.0% |
| Bahamas | 12 | 0.0% |
| Bangladesh | 66 | 0.1% |
| Barbados | 10 | 0.0% |
| Bolivia | 17 | 0.0% |
| Bosnia and Herzegovina | 87 | 0.2% |
| Cambodia | 5 | 0.0% |
| Cameroon | 87 | 0.2% |
| Canada | 99 | 0.2% |
| Caribbean | 608 | 1.2% |
| Central America | 3,633 | 7.0% |
| China | 188 | 0.4% |
| Colombia | 149 | 0.3% |
| Congo | 119 | 0.2% |
| Costa Rica | 33 | 0.1% |
| Cuba | 280 | 0.5% |
| Czechoslovakia | 6 | 0.0% |
| Denmark | 13 | 0.0% |
| Dominica | 9 | 0.0% |
| Dominican Republic | 236 | 0.5% |
| Eastern Africa | 553 | 1.1% |
| Eastern Asia | 248 | 0.5% |
| Eastern Europe | 445 | 0.9% |
| Ecuador | 50 | 0.1% |
| Egypt | 35 | 0.1% |
| El Salvador | 916 | 1.8% |
| England | 15 | 0.0% |
| Eritrea | 66 | 0.1% |
| Ethiopia | 210 | 0.4% |
| Europe | 906 | 1.8% |
| France | 36 | 0.1% |
| Germany | 165 | 0.3% |
| Ghana | 10 | 0.0% |
| Greece | 18 | 0.0% |
| Guatemala | 249 | 0.5% |
| Guyana | 5 | 0.0% |
| Honduras | 1,138 | 2.2% |
| Hungary | 6 | 0.0% |
| India | 135 | 0.3% |
| Iran | 64 | 0.1% |
| Iraq | 1,074 | 2.1% |
| Jamaica | 56 | 0.1% |
| Japan | 13 | 0.0% |
| Jordan | 9 | 0.0% |
| Kazakhstan | 9 | 0.0% |
| Kenya | 90 | 0.2% |
| Korea | 34 | 0.1% |
| Laos | 114 | 0.2% |
| Latin America | 4,872 | 9.4% |
| Latvia | 10 | 0.0% |
| Mexico | 1,288 | 2.5% |
| Middle Africa | 300 | 0.6% |
| Netherlands | 2 | 0.0% |
| Nicaragua | 9 | 0.0% |
| Nigeria | 46 | 0.1% |
| Northern Africa | 49 | 0.1% |
| Northern Europe | 96 | 0.2% |
| Oceania | 6 | 0.0% |
| Pakistan | 115 | 0.2% |
| Peru | 35 | 0.1% |
| Philippines | 22 | 0.0% |
| Russia | 164 | 0.3% |
| South America | 631 | 1.2% |
| South Central Asia | 397 | 0.8% |
| South Eastern Asia | 405 | 0.8% |
| Southern Europe | 18 | 0.0% |
| Sudan | 14 | 0.0% |
| Sweden | 23 | 0.0% |
| Switzerland | 144 | 0.3% |
| Syria | 66 | 0.1% |
| Taiwan | 6 | 0.0% |
| Turkey | 7 | 0.0% |
| Uganda | 108 | 0.2% |
| Ukraine | 122 | 0.2% |
| Uruguay | 347 | 0.7% |
| Vietnam | 203 | 0.4% |
| Western Africa | 60 | 0.1% |
| Western Asia | 1,168 | 2.3% |
| Western Europe | 347 | 0.7% |
| Zaire | 94 | 0.2% | View All 83 Rows |
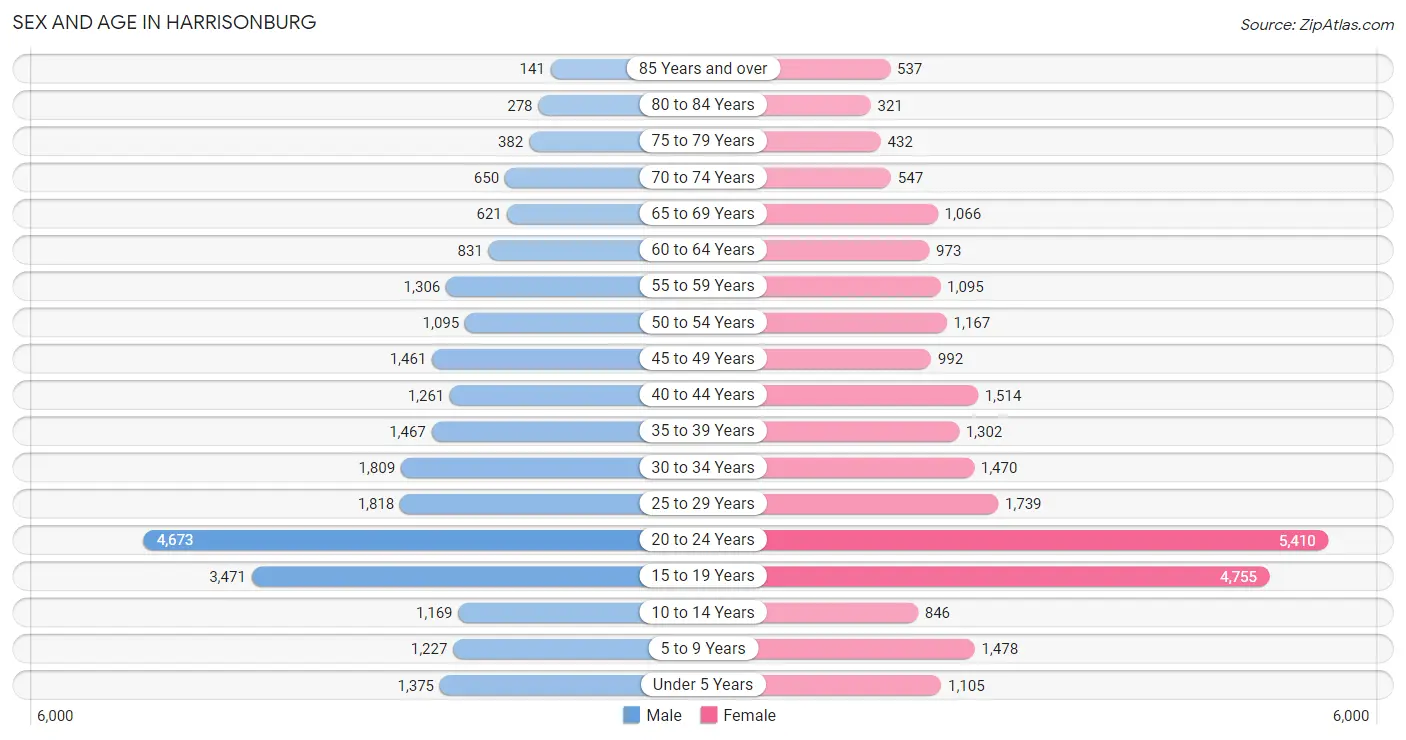
Sex and Age in Harrisonburg
Sex and Age in Harrisonburg
The most populous age groups in Harrisonburg are 20 to 24 Years (4,673 | 18.7%) for men and 20 to 24 Years (5,410 | 20.2%) for women.
| Age Bracket | Male | Female |
| Under 5 Years | 1,375 (5.5%) | 1,105 (4.1%) |
| 5 to 9 Years | 1,227 (4.9%) | 1,478 (5.5%) |
| 10 to 14 Years | 1,169 (4.7%) | 846 (3.2%) |
| 15 to 19 Years | 3,471 (13.9%) | 4,755 (17.8%) |
| 20 to 24 Years | 4,673 (18.7%) | 5,410 (20.2%) |
| 25 to 29 Years | 1,818 (7.3%) | 1,739 (6.5%) |
| 30 to 34 Years | 1,809 (7.2%) | 1,470 (5.5%) |
| 35 to 39 Years | 1,467 (5.9%) | 1,302 (4.9%) |
| 40 to 44 Years | 1,261 (5.0%) | 1,514 (5.7%) |
| 45 to 49 Years | 1,461 (5.8%) | 992 (3.7%) |
| 50 to 54 Years | 1,095 (4.4%) | 1,167 (4.4%) |
| 55 to 59 Years | 1,306 (5.2%) | 1,095 (4.1%) |
| 60 to 64 Years | 831 (3.3%) | 973 (3.6%) |
| 65 to 69 Years | 621 (2.5%) | 1,066 (4.0%) |
| 70 to 74 Years | 650 (2.6%) | 547 (2.0%) |
| 75 to 79 Years | 382 (1.5%) | 432 (1.6%) |
| 80 to 84 Years | 278 (1.1%) | 321 (1.2%) |
| 85 Years and over | 141 (0.6%) | 537 (2.0%) |
| Total | 25,035 (100.0%) | 26,749 (100.0%) |
Families and Households in Harrisonburg
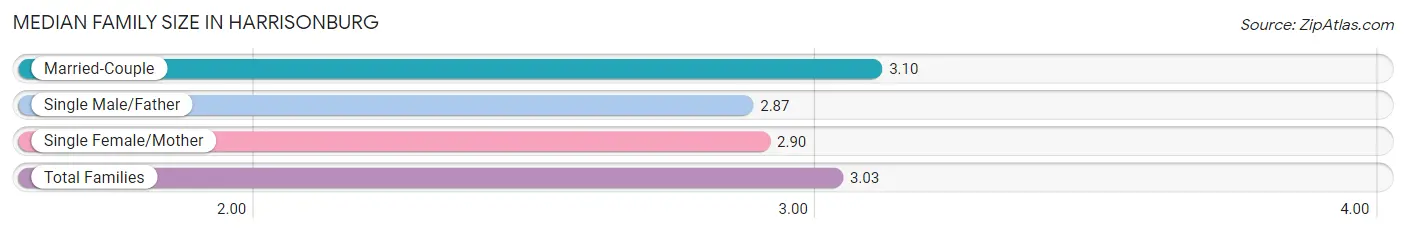
Median Family Size in Harrisonburg
The median family size in Harrisonburg is 3.03 persons per family, with married-couple families (5,825 | 65.7%) accounting for the largest median family size of 3.1 persons per family. On the other hand, single male/father families (963 | 10.9%) represent the smallest median family size with 2.87 persons per family.
| Family Type | # Families | Family Size |
| Married-Couple | 5,825 (65.7%) | 3.10 |
| Single Male/Father | 963 (10.9%) | 2.87 |
| Single Female/Mother | 2,079 (23.4%) | 2.90 |
| Total Families | 8,867 (100.0%) | 3.03 |
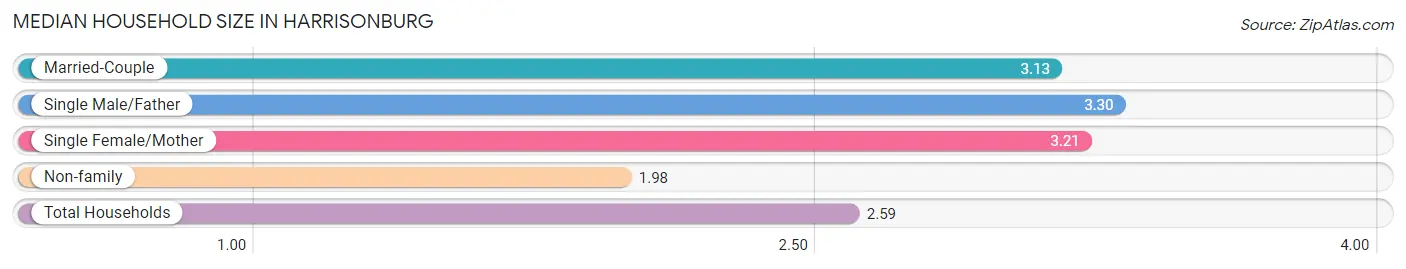
Median Household Size in Harrisonburg
The median household size in Harrisonburg is 2.59 persons per household, with single male/father households (963 | 5.6%) accounting for the largest median household size of 3.3 persons per household. non-family households (8,275 | 48.3%) represent the smallest median household size with 1.98 persons per household.
| Household Type | # Households | Household Size |
| Married-Couple | 5,825 (34.0%) | 3.13 |
| Single Male/Father | 963 (5.6%) | 3.30 |
| Single Female/Mother | 2,079 (12.1%) | 3.21 |
| Non-family | 8,275 (48.3%) | 1.98 |
| Total Households | 17,142 (100.0%) | 2.59 |
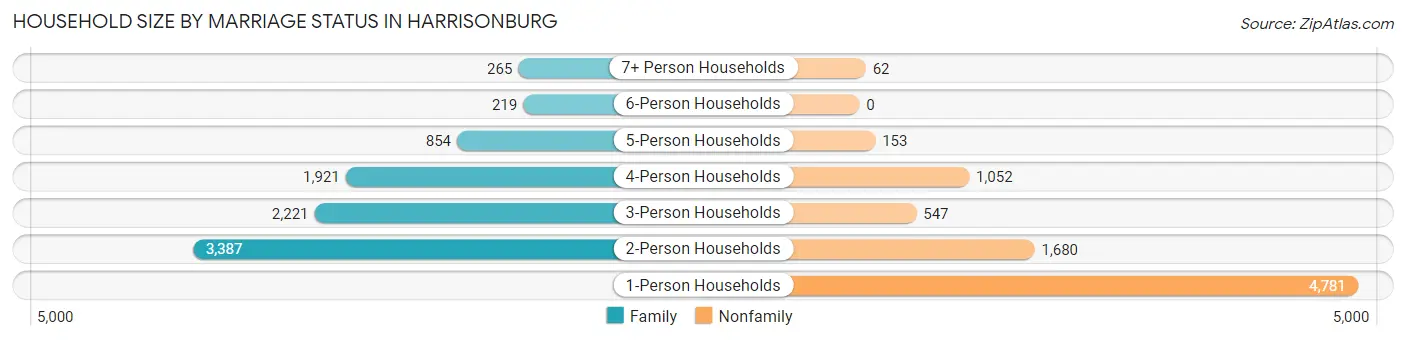
Household Size by Marriage Status in Harrisonburg
Out of a total of 17,142 households in Harrisonburg, 8,867 (51.7%) are family households, while 8,275 (48.3%) are nonfamily households. The most numerous type of family households are 2-person households, comprising 3,387, and the most common type of nonfamily households are 1-person households, comprising 4,781.
| Household Size | Family Households | Nonfamily Households |
| 1-Person Households | - | 4,781 (27.9%) |
| 2-Person Households | 3,387 (19.8%) | 1,680 (9.8%) |
| 3-Person Households | 2,221 (13.0%) | 547 (3.2%) |
| 4-Person Households | 1,921 (11.2%) | 1,052 (6.1%) |
| 5-Person Households | 854 (5.0%) | 153 (0.9%) |
| 6-Person Households | 219 (1.3%) | 0 (0.0%) |
| 7+ Person Households | 265 (1.5%) | 62 (0.4%) |
| Total | 8,867 (51.7%) | 8,275 (48.3%) |
Female Fertility in Harrisonburg
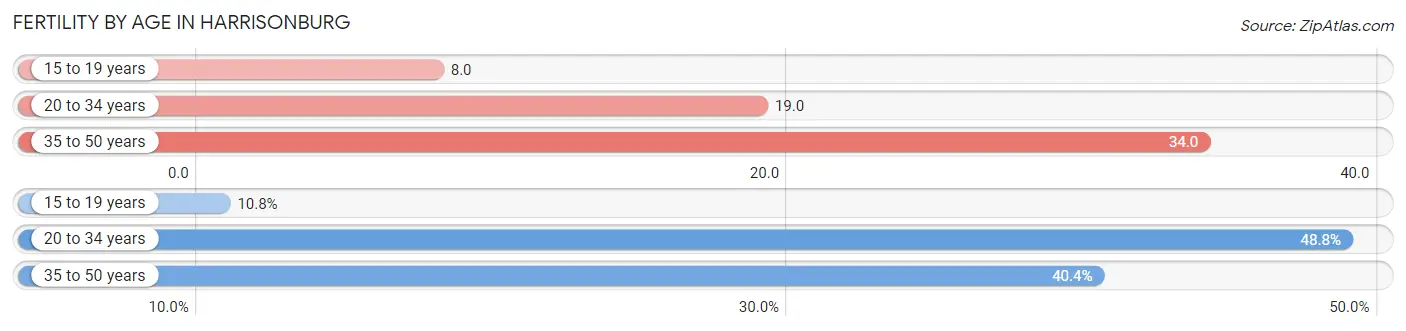
Fertility by Age in Harrisonburg
Average fertility rate in Harrisonburg is 20.0 births per 1,000 women. Women in the age bracket of 35 to 50 years have the highest fertility rate with 34.0 births per 1,000 women. Women in the age bracket of 20 to 34 years acount for 48.8% of all women with births.
| Age Bracket | Women with Births | Births / 1,000 Women |
| 15 to 19 years | 37 (10.8%) | 8.0 |
| 20 to 34 years | 168 (48.8%) | 19.0 |
| 35 to 50 years | 139 (40.4%) | 34.0 |
| Total | 344 (100.0%) | 20.0 |
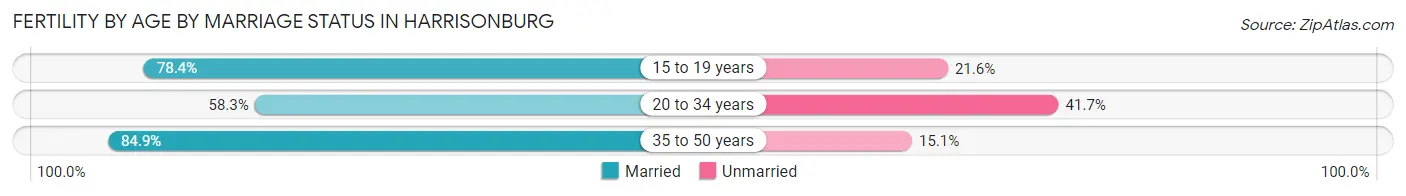
Fertility by Age by Marriage Status in Harrisonburg
71.2% of women with births (344) in Harrisonburg are married. The highest percentage of unmarried women with births falls into 20 to 34 years age bracket with 41.7% of them unmarried at the time of birth, while the lowest percentage of unmarried women with births belong to 35 to 50 years age bracket with 15.1% of them unmarried.
| Age Bracket | Married | Unmarried |
| 15 to 19 years | 29 (78.4%) | 8 (21.6%) |
| 20 to 34 years | 98 (58.3%) | 70 (41.7%) |
| 35 to 50 years | 118 (84.9%) | 21 (15.1%) |
| Total | 245 (71.2%) | 99 (28.8%) |
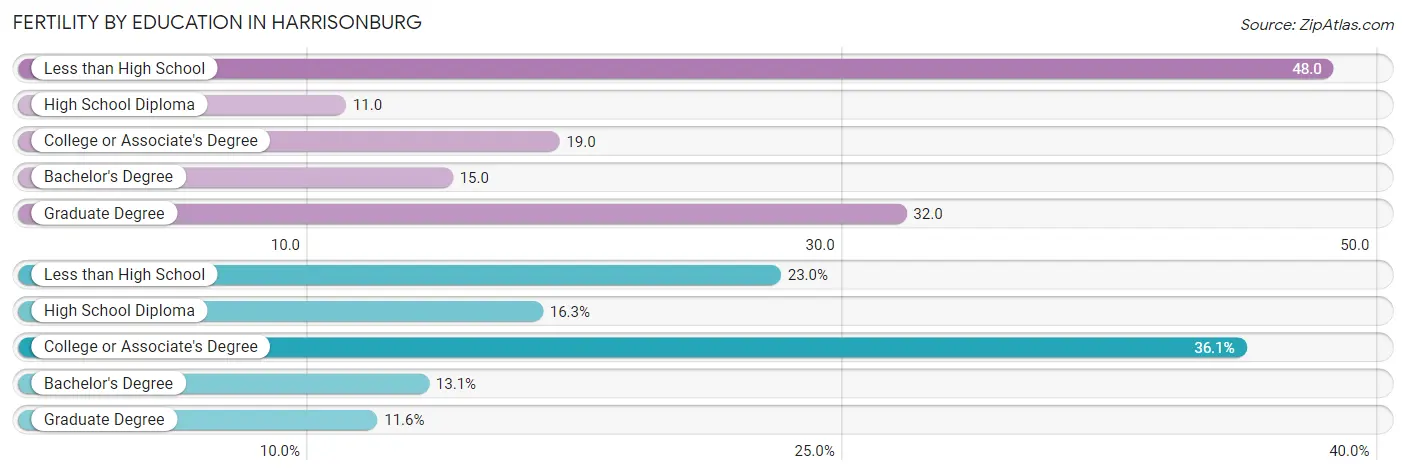
Fertility by Education in Harrisonburg
Average fertility rate in Harrisonburg is 20.0 births per 1,000 women. Women with the education attainment of less than high school have the highest fertility rate of 48.0 births per 1,000 women, while women with the education attainment of high school diploma have the lowest fertility at 11.0 births per 1,000 women. Women with the education attainment of college or associate's degree represent 36.0% of all women with births.
| Educational Attainment | Women with Births | Births / 1,000 Women |
| Less than High School | 79 (23.0%) | 48.0 |
| High School Diploma | 56 (16.3%) | 11.0 |
| College or Associate's Degree | 124 (36.0%) | 19.0 |
| Bachelor's Degree | 45 (13.1%) | 15.0 |
| Graduate Degree | 40 (11.6%) | 32.0 |
| Total | 344 (100.0%) | 20.0 |
Fertility by Education by Marriage Status in Harrisonburg
28.8% of women with births in Harrisonburg are unmarried. Women with the educational attainment of bachelor's degree are most likely to be married with 100.0% of them married at childbirth, while women with the educational attainment of college or associate's degree are least likely to be married with 50.0% of them unmarried at childbirth.
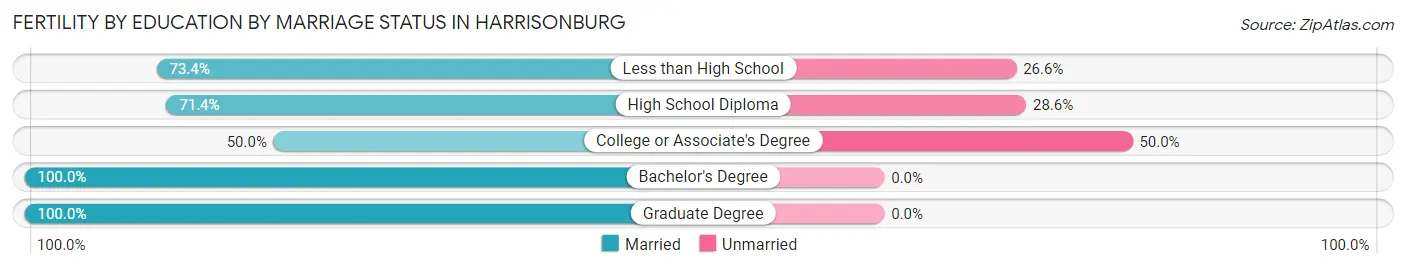
| Educational Attainment | Married | Unmarried |
| Less than High School | 58 (73.4%) | 21 (26.6%) |
| High School Diploma | 40 (71.4%) | 16 (28.6%) |
| College or Associate's Degree | 62 (50.0%) | 62 (50.0%) |
| Bachelor's Degree | 45 (100.0%) | 0 (0.0%) |
| Graduate Degree | 40 (100.0%) | 0 (0.0%) |
| Total | 245 (71.2%) | 99 (28.8%) |
Employment Characteristics in Harrisonburg
Employment by Class of Employer in Harrisonburg
Among the 23,583 employed individuals in Harrisonburg, private company employees (15,870 | 67.3%), state government employees (2,189 | 9.3%), and not-for-profit organizations (1,997 | 8.5%) make up the most common classes of employment.
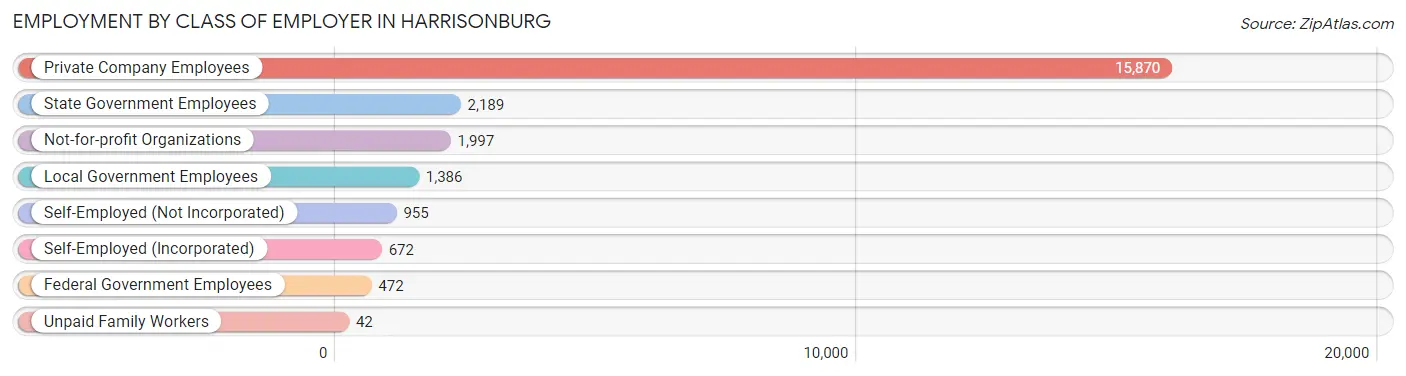
| Employer Class | # Employees | % Employees |
| Private Company Employees | 15,870 | 67.3% |
| Self-Employed (Incorporated) | 672 | 2.9% |
| Self-Employed (Not Incorporated) | 955 | 4.1% |
| Not-for-profit Organizations | 1,997 | 8.5% |
| Local Government Employees | 1,386 | 5.9% |
| State Government Employees | 2,189 | 9.3% |
| Federal Government Employees | 472 | 2.0% |
| Unpaid Family Workers | 42 | 0.2% |
| Total | 23,583 | 100.0% |
Employment Status by Age in Harrisonburg
According to the labor force statistics for Harrisonburg, out of the total population over 16 years of age (44,236), 60.1% or 26,586 individuals are in the labor force, with 6.7% or 1,781 of them unemployed. The age group with the highest labor force participation rate is 25 to 29 years, with 89.2% or 3,173 individuals in the labor force. Within the labor force, the 16 to 19 years age range has the highest percentage of unemployed individuals, with 12.3% or 263 of them being unemployed.
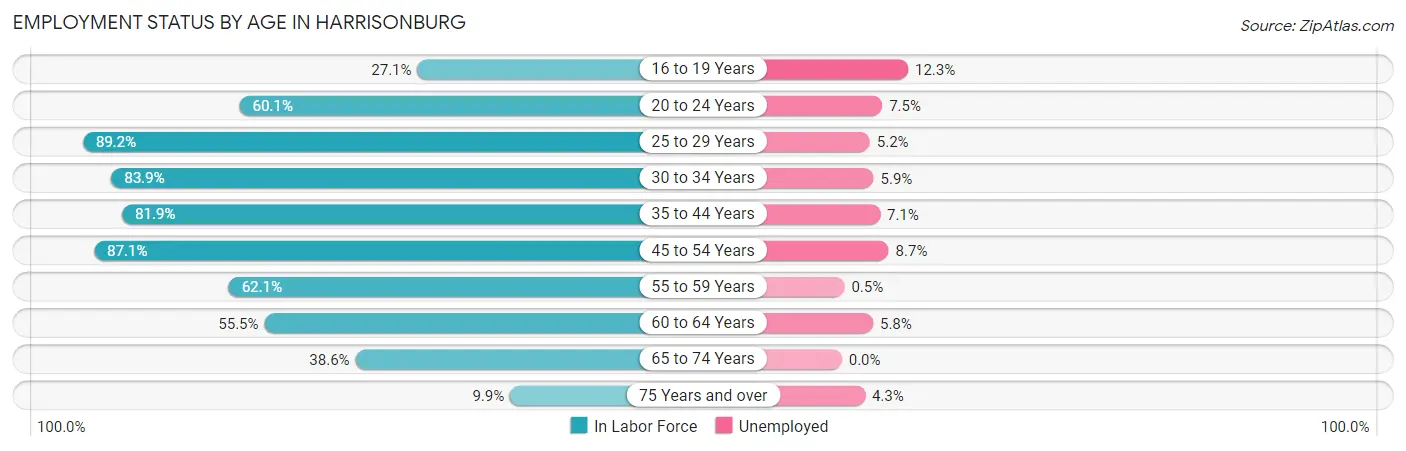
| Age Bracket | In Labor Force | Unemployed |
| 16 to 19 Years | 2,135 (27.1%) | 263 (12.3%) |
| 20 to 24 Years | 6,060 (60.1%) | 454 (7.5%) |
| 25 to 29 Years | 3,173 (89.2%) | 165 (5.2%) |
| 30 to 34 Years | 2,751 (83.9%) | 162 (5.9%) |
| 35 to 44 Years | 4,541 (81.9%) | 322 (7.1%) |
| 45 to 54 Years | 4,107 (87.1%) | 357 (8.7%) |
| 55 to 59 Years | 1,491 (62.1%) | 7 (0.5%) |
| 60 to 64 Years | 1,001 (55.5%) | 58 (5.8%) |
| 65 to 74 Years | 1,113 (38.6%) | 0 (0.0%) |
| 75 Years and over | 207 (9.9%) | 9 (4.3%) |
| Total | 26,586 (60.1%) | 1,781 (6.7%) |
Employment Status by Educational Attainment in Harrisonburg
According to labor force statistics for Harrisonburg, 80.1% of individuals (17,061) out of the total population between 25 and 64 years of age (21,300) are in the labor force, with 6.3% or 1,075 of them being unemployed. The group with the highest labor force participation rate are those with the educational attainment of bachelor's degree or higher, with 89.4% or 6,748 individuals in the labor force. Within the labor force, individuals with less than high school education have the highest percentage of unemployment, with 12.4% or 338 of them being unemployed.
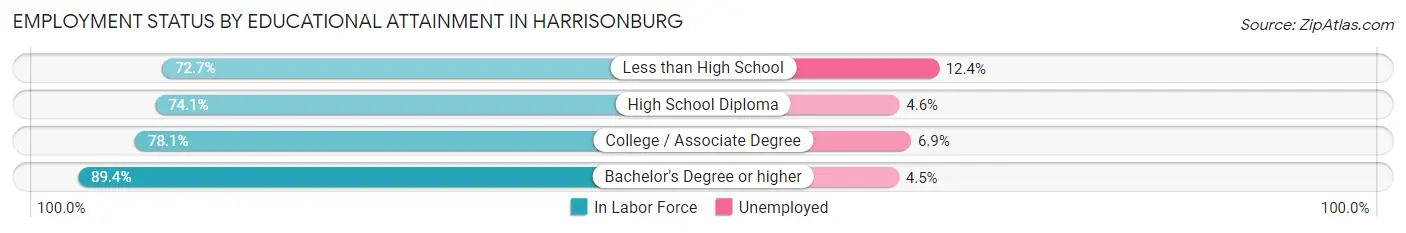
| Educational Attainment | In Labor Force | Unemployed |
| Less than High School | 2,724 (72.7%) | 465 (12.4%) |
| High School Diploma | 4,053 (74.1%) | 252 (4.6%) |
| College / Associate Degree | 3,542 (78.1%) | 313 (6.9%) |
| Bachelor's Degree or higher | 6,748 (89.4%) | 340 (4.5%) |
| Total | 17,061 (80.1%) | 1,342 (6.3%) |
Employment Occupations by Sex in Harrisonburg
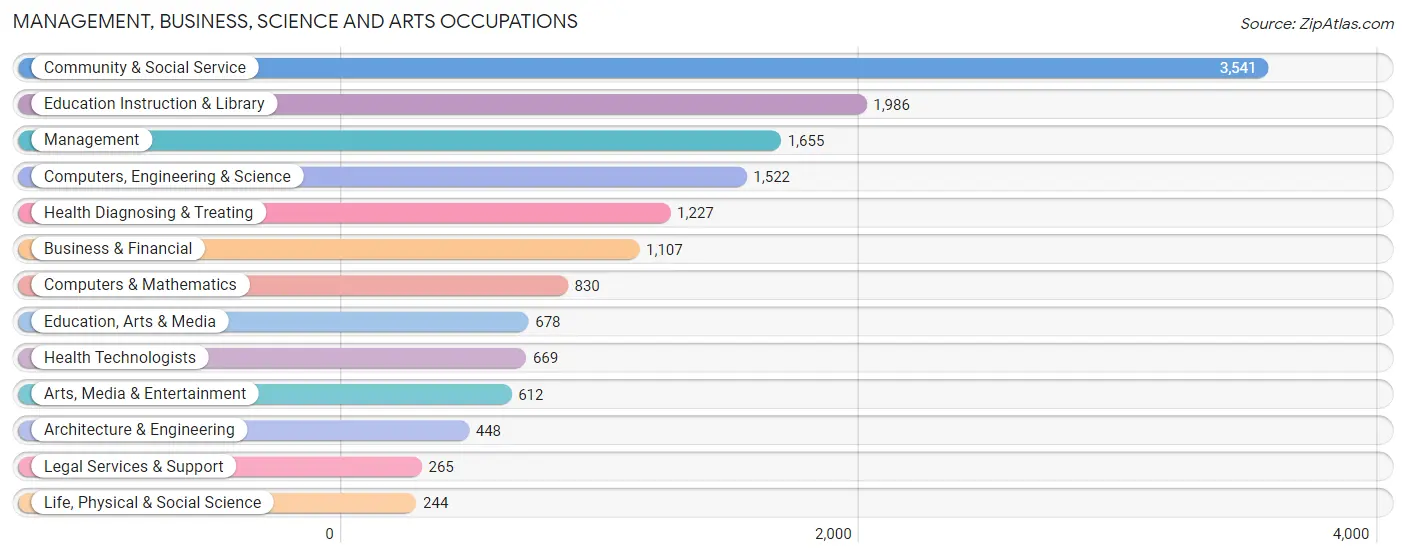
Management, Business, Science and Arts Occupations
The most common Management, Business, Science and Arts occupations in Harrisonburg are Community & Social Service (3,541 | 14.3%), Education Instruction & Library (1,986 | 8.0%), Management (1,655 | 6.7%), Computers, Engineering & Science (1,522 | 6.2%), and Health Diagnosing & Treating (1,227 | 5.0%).
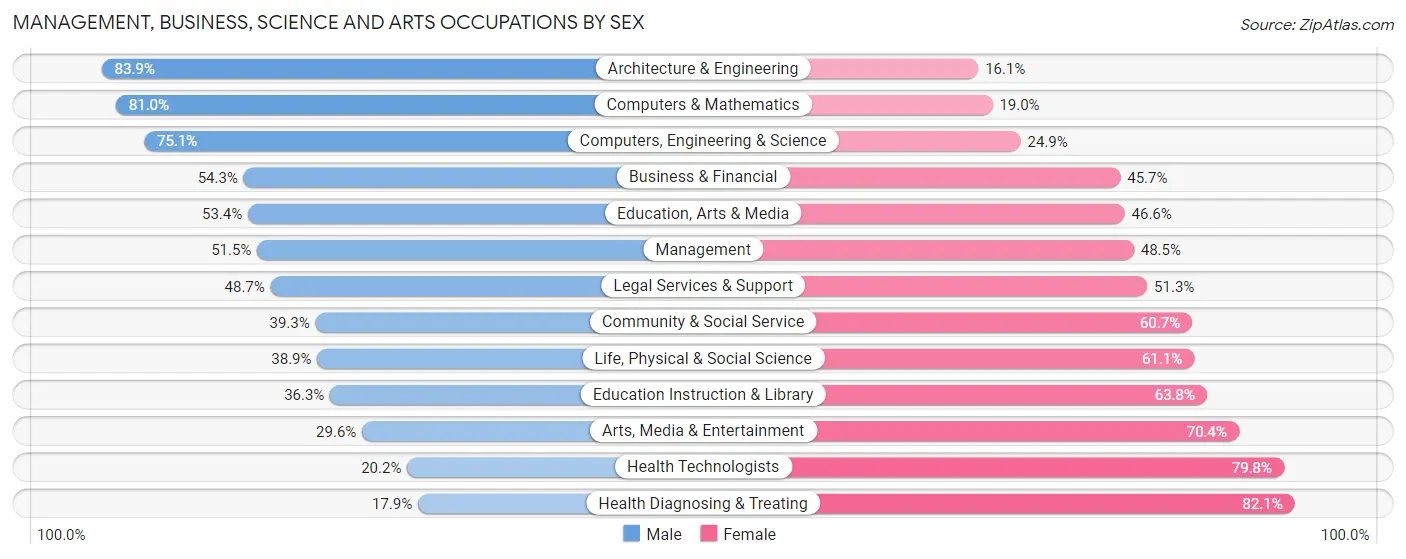
Management, Business, Science and Arts Occupations by Sex
Within the Management, Business, Science and Arts occupations in Harrisonburg, the most male-oriented occupations are Architecture & Engineering (83.9%), Computers & Mathematics (81.0%), and Computers, Engineering & Science (75.1%), while the most female-oriented occupations are Health Diagnosing & Treating (82.1%), Health Technologists (79.8%), and Arts, Media & Entertainment (70.4%).
| Occupation | Male | Female |
| Management | 852 (51.5%) | 803 (48.5%) |
| Business & Financial | 601 (54.3%) | 506 (45.7%) |
| Computers, Engineering & Science | 1,143 (75.1%) | 379 (24.9%) |
| Computers & Mathematics | 672 (81.0%) | 158 (19.0%) |
| Architecture & Engineering | 376 (83.9%) | 72 (16.1%) |
| Life, Physical & Social Science | 95 (38.9%) | 149 (61.1%) |
| Community & Social Service | 1,392 (39.3%) | 2,149 (60.7%) |
| Education, Arts & Media | 362 (53.4%) | 316 (46.6%) |
| Legal Services & Support | 129 (48.7%) | 136 (51.3%) |
| Education Instruction & Library | 720 (36.2%) | 1,266 (63.7%) |
| Arts, Media & Entertainment | 181 (29.6%) | 431 (70.4%) |
| Health Diagnosing & Treating | 220 (17.9%) | 1,007 (82.1%) |
| Health Technologists | 135 (20.2%) | 534 (79.8%) |
| Total (Category) | 4,208 (46.5%) | 4,844 (53.5%) |
| Total (Overall) | 12,493 (50.6%) | 12,201 (49.4%) |
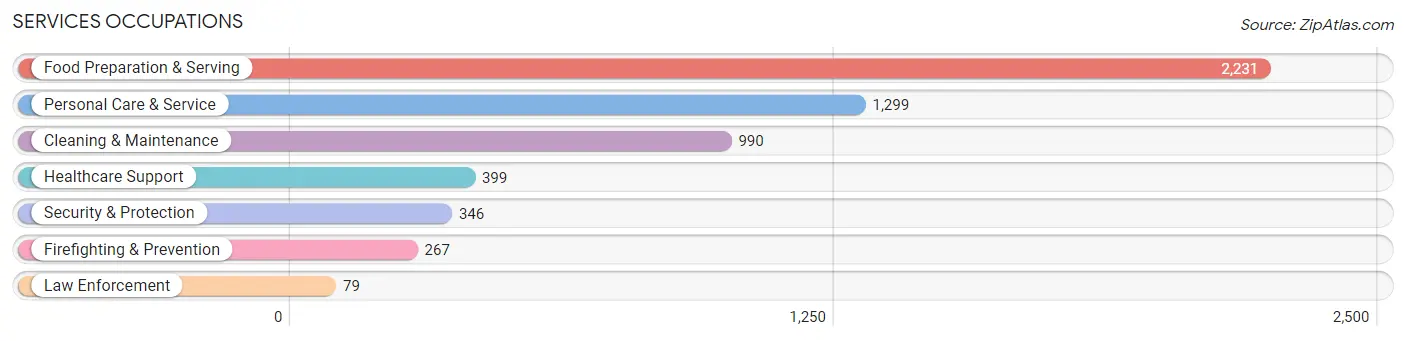
Services Occupations
The most common Services occupations in Harrisonburg are Food Preparation & Serving (2,231 | 9.0%), Personal Care & Service (1,299 | 5.3%), Cleaning & Maintenance (990 | 4.0%), Healthcare Support (399 | 1.6%), and Security & Protection (346 | 1.4%).
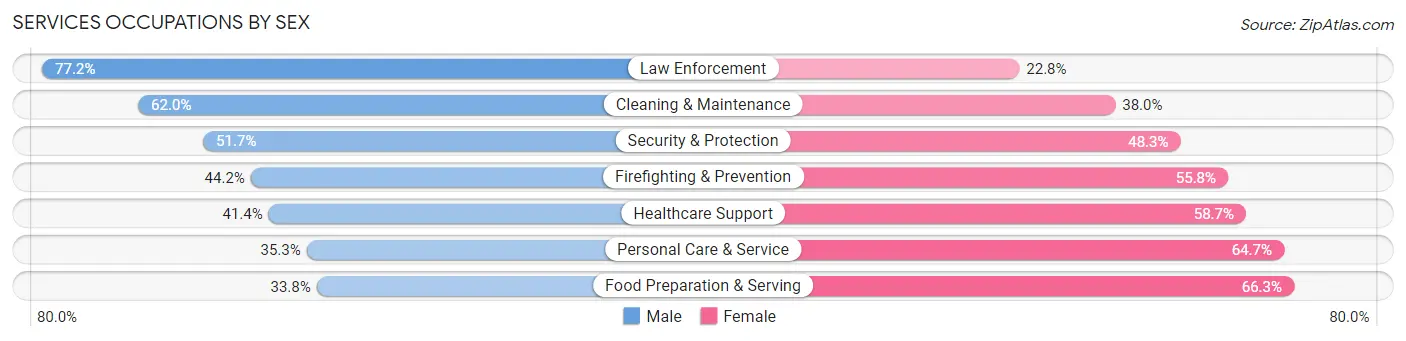
Services Occupations by Sex
Within the Services occupations in Harrisonburg, the most male-oriented occupations are Law Enforcement (77.2%), Cleaning & Maintenance (62.0%), and Security & Protection (51.7%), while the most female-oriented occupations are Food Preparation & Serving (66.2%), Personal Care & Service (64.7%), and Healthcare Support (58.7%).
| Occupation | Male | Female |
| Healthcare Support | 165 (41.3%) | 234 (58.7%) |
| Security & Protection | 179 (51.7%) | 167 (48.3%) |
| Firefighting & Prevention | 118 (44.2%) | 149 (55.8%) |
| Law Enforcement | 61 (77.2%) | 18 (22.8%) |
| Food Preparation & Serving | 753 (33.8%) | 1,478 (66.2%) |
| Cleaning & Maintenance | 614 (62.0%) | 376 (38.0%) |
| Personal Care & Service | 459 (35.3%) | 840 (64.7%) |
| Total (Category) | 2,170 (41.2%) | 3,095 (58.8%) |
| Total (Overall) | 12,493 (50.6%) | 12,201 (49.4%) |
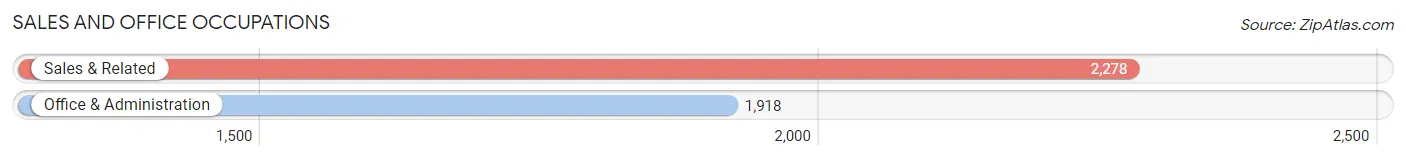
Sales and Office Occupations
The most common Sales and Office occupations in Harrisonburg are Sales & Related (2,278 | 9.2%), and Office & Administration (1,918 | 7.8%).
Sales and Office Occupations by Sex
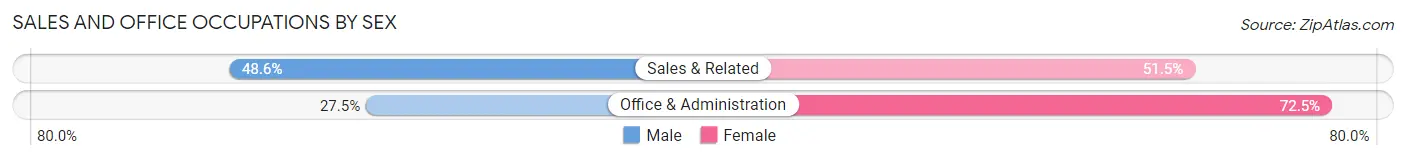
| Occupation | Male | Female |
| Sales & Related | 1,106 (48.5%) | 1,172 (51.4%) |
| Office & Administration | 527 (27.5%) | 1,391 (72.5%) |
| Total (Category) | 1,633 (38.9%) | 2,563 (61.1%) |
| Total (Overall) | 12,493 (50.6%) | 12,201 (49.4%) |
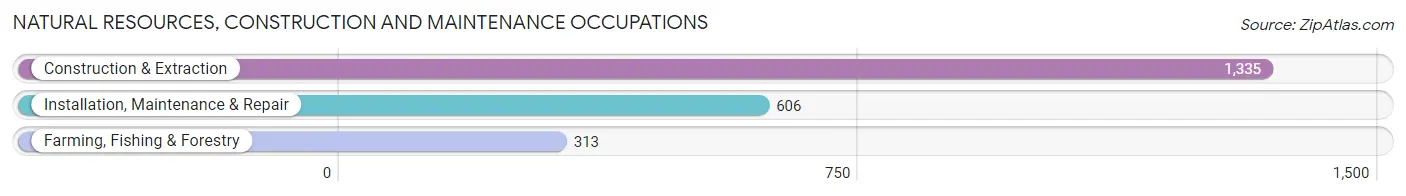
Natural Resources, Construction and Maintenance Occupations
The most common Natural Resources, Construction and Maintenance occupations in Harrisonburg are Construction & Extraction (1,335 | 5.4%), Installation, Maintenance & Repair (606 | 2.5%), and Farming, Fishing & Forestry (313 | 1.3%).
Natural Resources, Construction and Maintenance Occupations by Sex
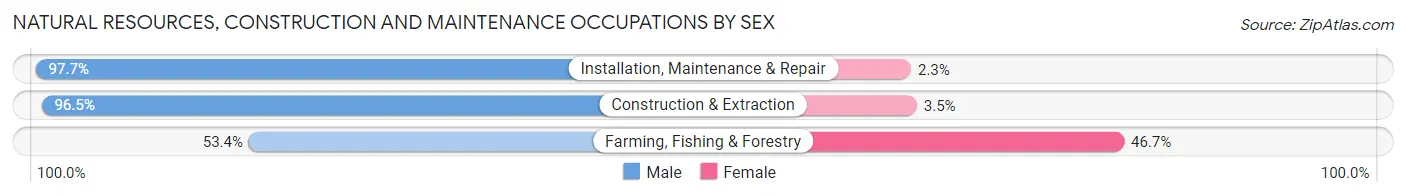
| Occupation | Male | Female |
| Farming, Fishing & Forestry | 167 (53.3%) | 146 (46.7%) |
| Construction & Extraction | 1,288 (96.5%) | 47 (3.5%) |
| Installation, Maintenance & Repair | 592 (97.7%) | 14 (2.3%) |
| Total (Category) | 2,047 (90.8%) | 207 (9.2%) |
| Total (Overall) | 12,493 (50.6%) | 12,201 (49.4%) |
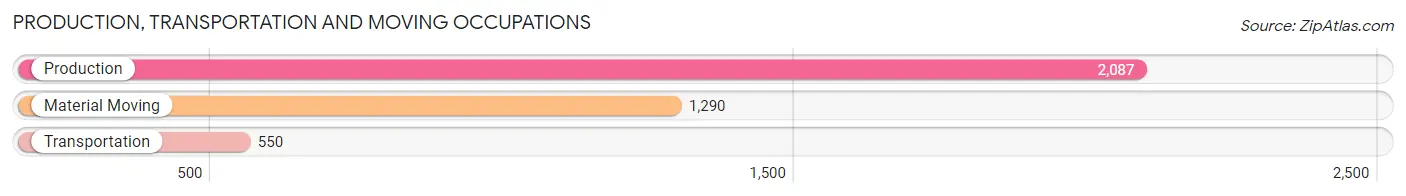
Production, Transportation and Moving Occupations
The most common Production, Transportation and Moving occupations in Harrisonburg are Production (2,087 | 8.5%), Material Moving (1,290 | 5.2%), and Transportation (550 | 2.2%).
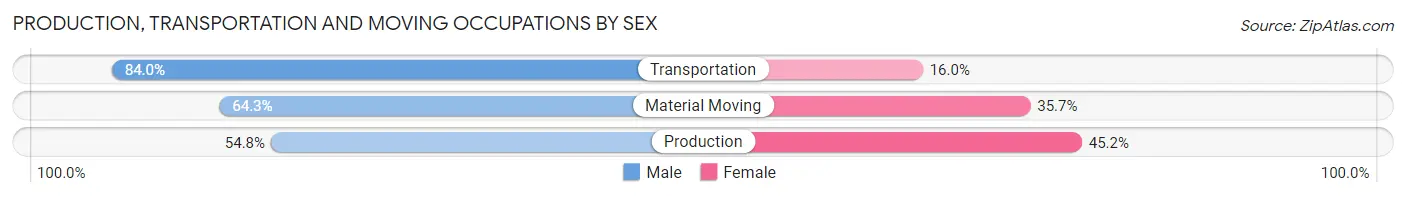
Production, Transportation and Moving Occupations by Sex
| Occupation | Male | Female |
| Production | 1,144 (54.8%) | 943 (45.2%) |
| Transportation | 462 (84.0%) | 88 (16.0%) |
| Material Moving | 829 (64.3%) | 461 (35.7%) |
| Total (Category) | 2,435 (62.0%) | 1,492 (38.0%) |
| Total (Overall) | 12,493 (50.6%) | 12,201 (49.4%) |
Employment Industries by Sex in Harrisonburg
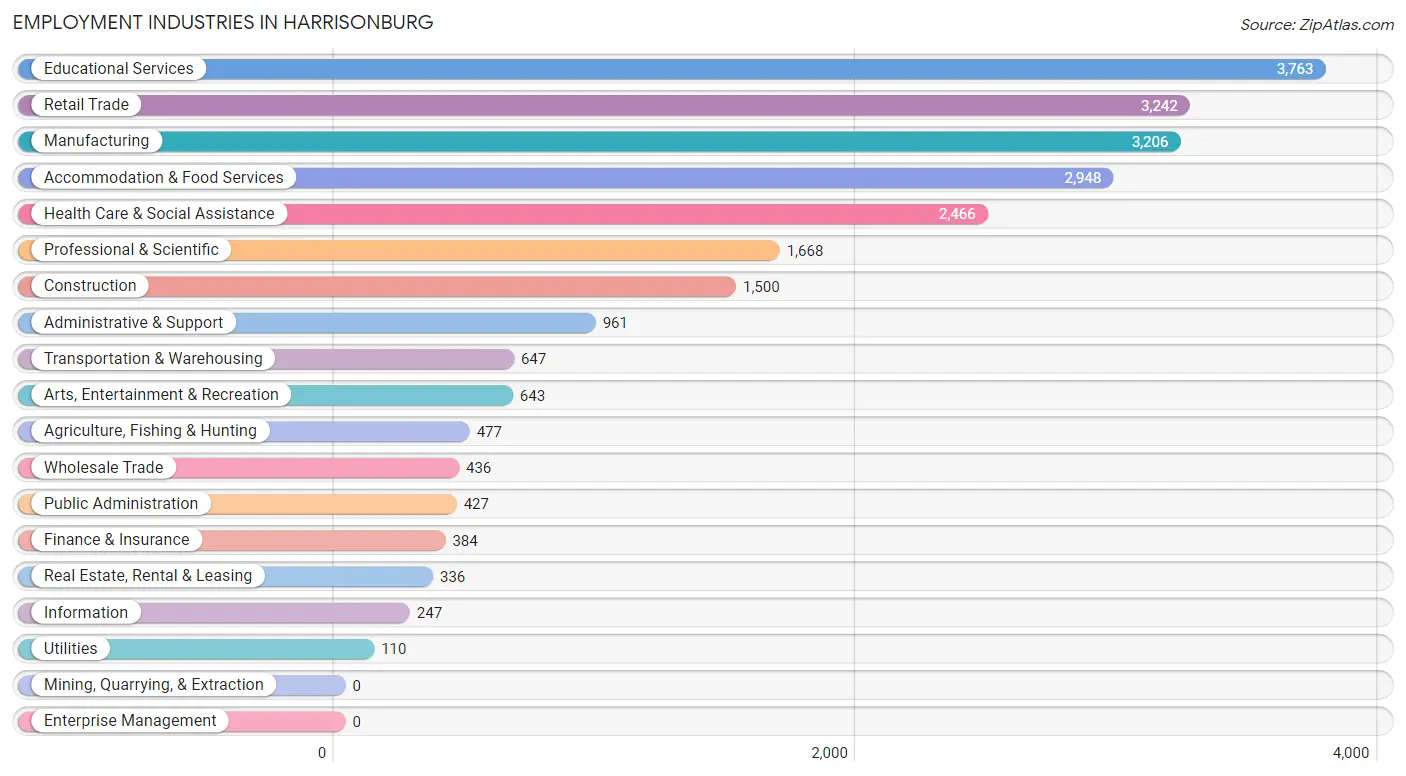
Employment Industries in Harrisonburg
The major employment industries in Harrisonburg include Educational Services (3,763 | 15.2%), Retail Trade (3,242 | 13.1%), Manufacturing (3,206 | 13.0%), Accommodation & Food Services (2,948 | 11.9%), and Health Care & Social Assistance (2,466 | 10.0%).
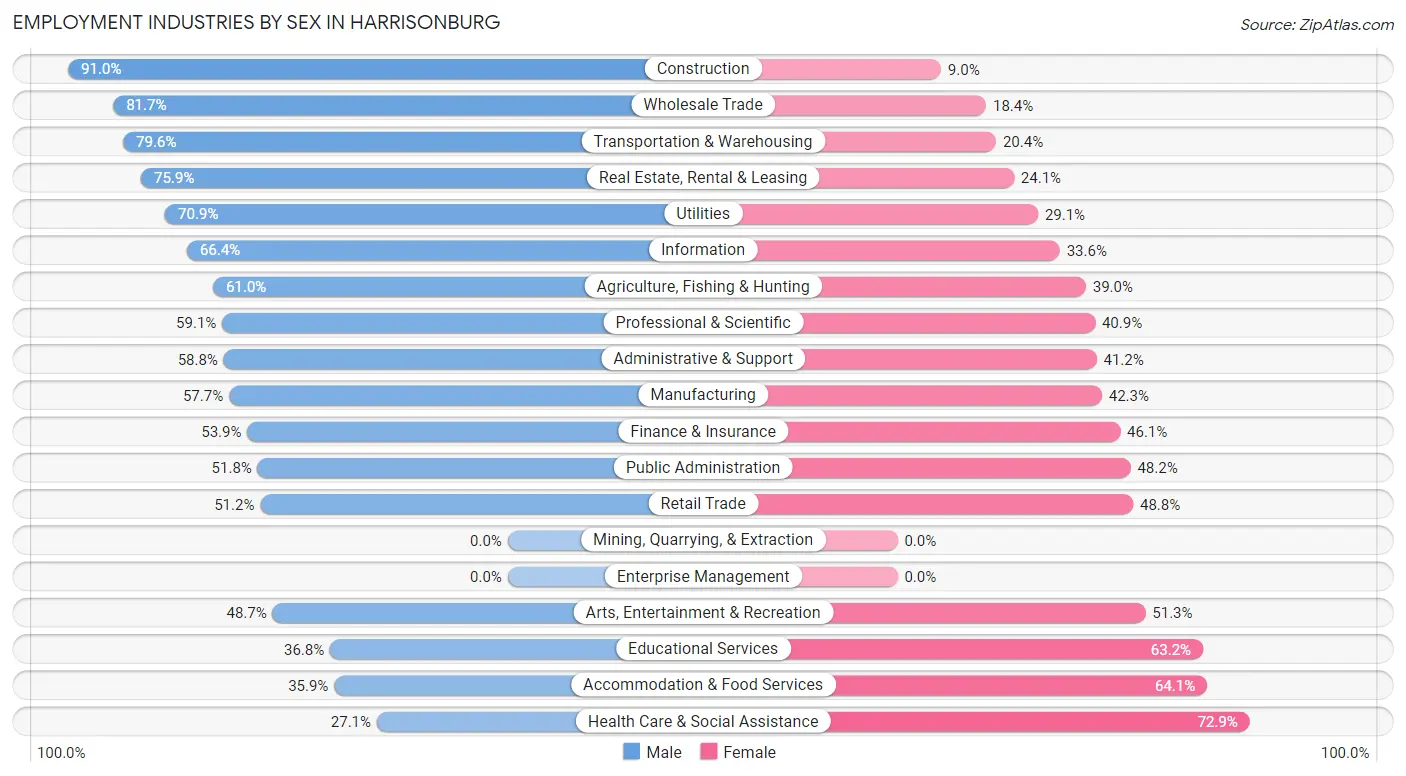
Employment Industries by Sex in Harrisonburg
The Harrisonburg industries that see more men than women are Construction (91.0%), Wholesale Trade (81.7%), and Transportation & Warehousing (79.6%), whereas the industries that tend to have a higher number of women are Health Care & Social Assistance (72.9%), Accommodation & Food Services (64.1%), and Educational Services (63.2%).
| Industry | Male | Female |
| Agriculture, Fishing & Hunting | 291 (61.0%) | 186 (39.0%) |
| Mining, Quarrying, & Extraction | 0 (0.0%) | 0 (0.0%) |
| Construction | 1,365 (91.0%) | 135 (9.0%) |
| Manufacturing | 1,850 (57.7%) | 1,356 (42.3%) |
| Wholesale Trade | 356 (81.7%) | 80 (18.3%) |
| Retail Trade | 1,661 (51.2%) | 1,581 (48.8%) |
| Transportation & Warehousing | 515 (79.6%) | 132 (20.4%) |
| Utilities | 78 (70.9%) | 32 (29.1%) |
| Information | 164 (66.4%) | 83 (33.6%) |
| Finance & Insurance | 207 (53.9%) | 177 (46.1%) |
| Real Estate, Rental & Leasing | 255 (75.9%) | 81 (24.1%) |
| Professional & Scientific | 986 (59.1%) | 682 (40.9%) |
| Enterprise Management | 0 (0.0%) | 0 (0.0%) |
| Administrative & Support | 565 (58.8%) | 396 (41.2%) |
| Educational Services | 1,384 (36.8%) | 2,379 (63.2%) |
| Health Care & Social Assistance | 668 (27.1%) | 1,798 (72.9%) |
| Arts, Entertainment & Recreation | 313 (48.7%) | 330 (51.3%) |
| Accommodation & Food Services | 1,059 (35.9%) | 1,889 (64.1%) |
| Public Administration | 221 (51.8%) | 206 (48.2%) |
| Total | 12,493 (50.6%) | 12,201 (49.4%) |
Education in Harrisonburg
School Enrollment in Harrisonburg
The most common levels of schooling among the 22,154 students in Harrisonburg are college / undergraduate (14,537 | 65.6%), elementary school (2,188 | 9.9%), and middle school (1,647 | 7.4%).
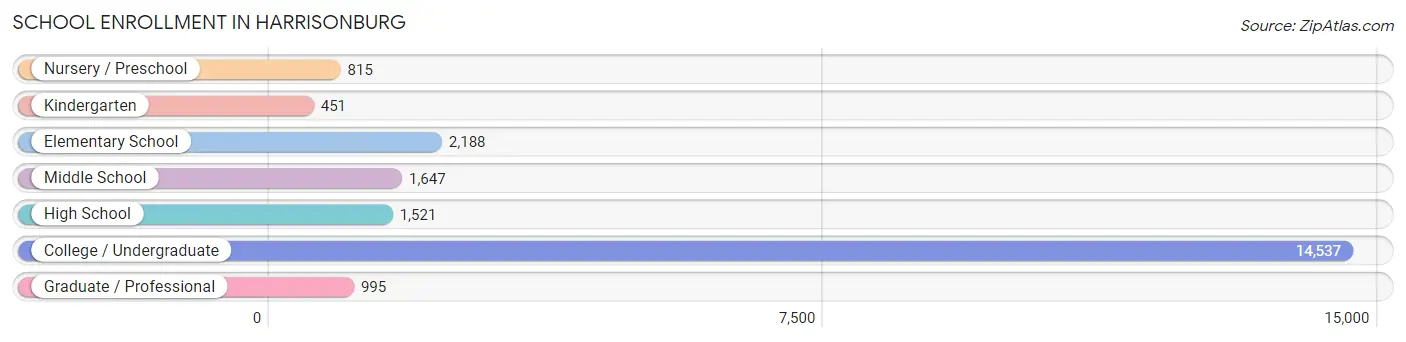
| School Level | # Students | % Students |
| Nursery / Preschool | 815 | 3.7% |
| Kindergarten | 451 | 2.0% |
| Elementary School | 2,188 | 9.9% |
| Middle School | 1,647 | 7.4% |
| High School | 1,521 | 6.9% |
| College / Undergraduate | 14,537 | 65.6% |
| Graduate / Professional | 995 | 4.5% |
| Total | 22,154 | 100.0% |
School Enrollment by Age by Funding Source in Harrisonburg
Out of a total of 22,154 students who are enrolled in schools in Harrisonburg, 1,927 (8.7%) attend a private institution, while the remaining 20,227 (91.3%) are enrolled in public schools. The age group of 3 to 4 year olds has the highest likelihood of being enrolled in private schools, with 357 (55.2% in the age bracket) enrolled. Conversely, the age group of 18 to 19 year olds has the lowest likelihood of being enrolled in a private school, with 6,464 (96.7% in the age bracket) attending a public institution.
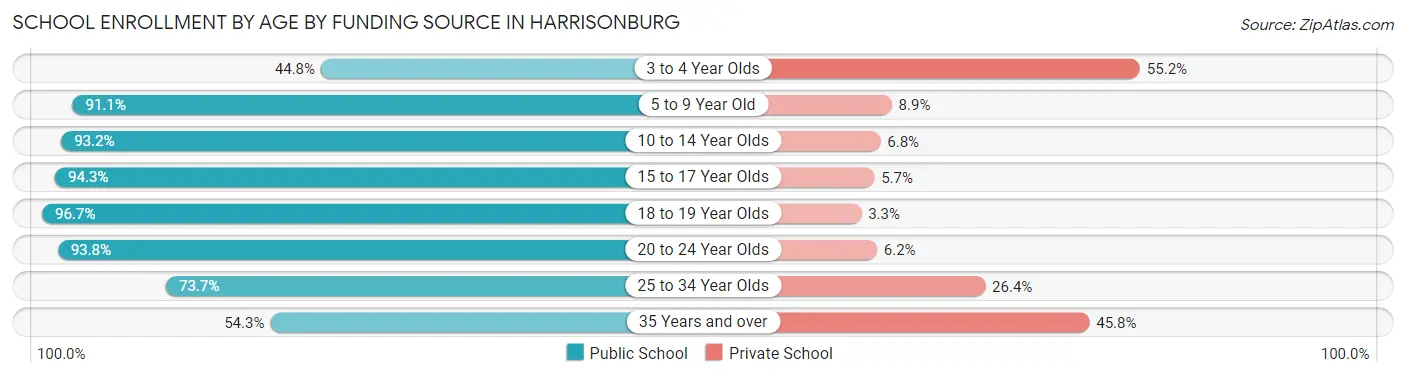
| Age Bracket | Public School | Private School |
| 3 to 4 Year Olds | 290 (44.8%) | 357 (55.2%) |
| 5 to 9 Year Old | 2,343 (91.1%) | 230 (8.9%) |
| 10 to 14 Year Olds | 1,856 (93.2%) | 136 (6.8%) |
| 15 to 17 Year Olds | 1,211 (94.3%) | 73 (5.7%) |
| 18 to 19 Year Olds | 6,464 (96.7%) | 218 (3.3%) |
| 20 to 24 Year Olds | 7,123 (93.8%) | 469 (6.2%) |
| 25 to 34 Year Olds | 707 (73.7%) | 253 (26.4%) |
| 35 Years and over | 230 (54.2%) | 194 (45.8%) |
| Total | 20,227 (91.3%) | 1,927 (8.7%) |
Educational Attainment by Field of Study in Harrisonburg
Business (1,084 | 10.6%), education (1,066 | 10.4%), social sciences (1,002 | 9.8%), science & technology (990 | 9.7%), and liberal arts & history (862 | 8.4%) are the most common fields of study among 10,214 individuals in Harrisonburg who have obtained a bachelor's degree or higher.
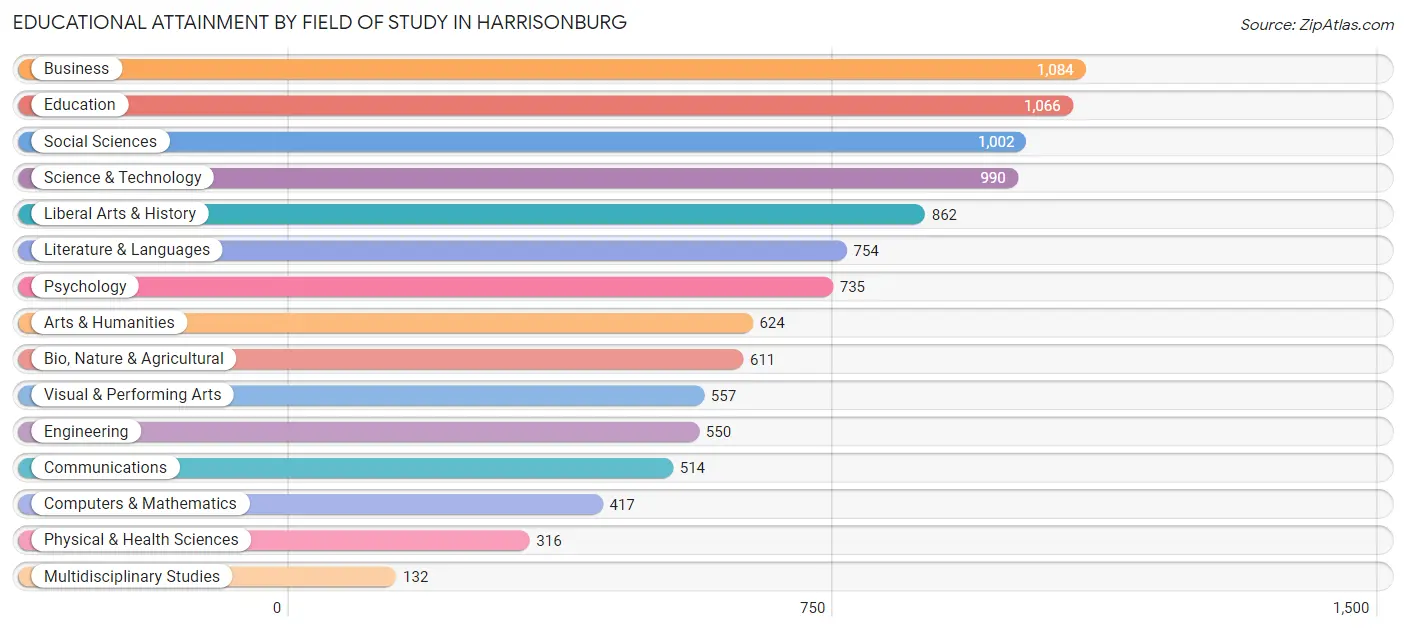
| Field of Study | # Graduates | % Graduates |
| Computers & Mathematics | 417 | 4.1% |
| Bio, Nature & Agricultural | 611 | 6.0% |
| Physical & Health Sciences | 316 | 3.1% |
| Psychology | 735 | 7.2% |
| Social Sciences | 1,002 | 9.8% |
| Engineering | 550 | 5.4% |
| Multidisciplinary Studies | 132 | 1.3% |
| Science & Technology | 990 | 9.7% |
| Business | 1,084 | 10.6% |
| Education | 1,066 | 10.4% |
| Literature & Languages | 754 | 7.4% |
| Liberal Arts & History | 862 | 8.4% |
| Visual & Performing Arts | 557 | 5.4% |
| Communications | 514 | 5.0% |
| Arts & Humanities | 624 | 6.1% |
| Total | 10,214 | 100.0% |
Transportation & Commute in Harrisonburg
Vehicle Availability by Sex in Harrisonburg
The most prevalent vehicle ownership categories in Harrisonburg are males with 2 vehicles (4,974, accounting for 43.0%) and females with 2 vehicles (4,177, making up 47.9%).
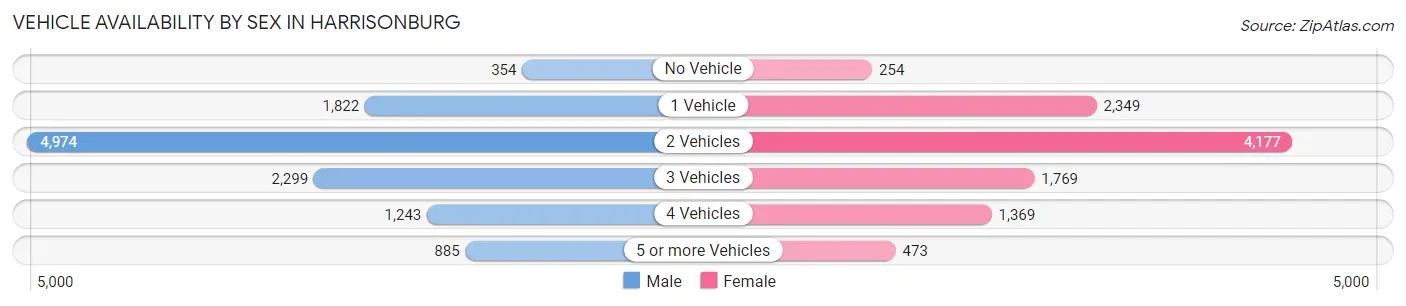
| Vehicles Available | Male | Female |
| No Vehicle | 354 (3.1%) | 254 (2.4%) |
| 1 Vehicle | 1,822 (15.7%) | 2,349 (22.6%) |
| 2 Vehicles | 4,974 (43.0%) | 4,177 (40.2%) |
| 3 Vehicles | 2,299 (19.9%) | 1,769 (17.0%) |
| 4 Vehicles | 1,243 (10.7%) | 1,369 (13.2%) |
| 5 or more Vehicles | 885 (7.6%) | 473 (4.5%) |
| Total | 11,577 (100.0%) | 10,391 (100.0%) |
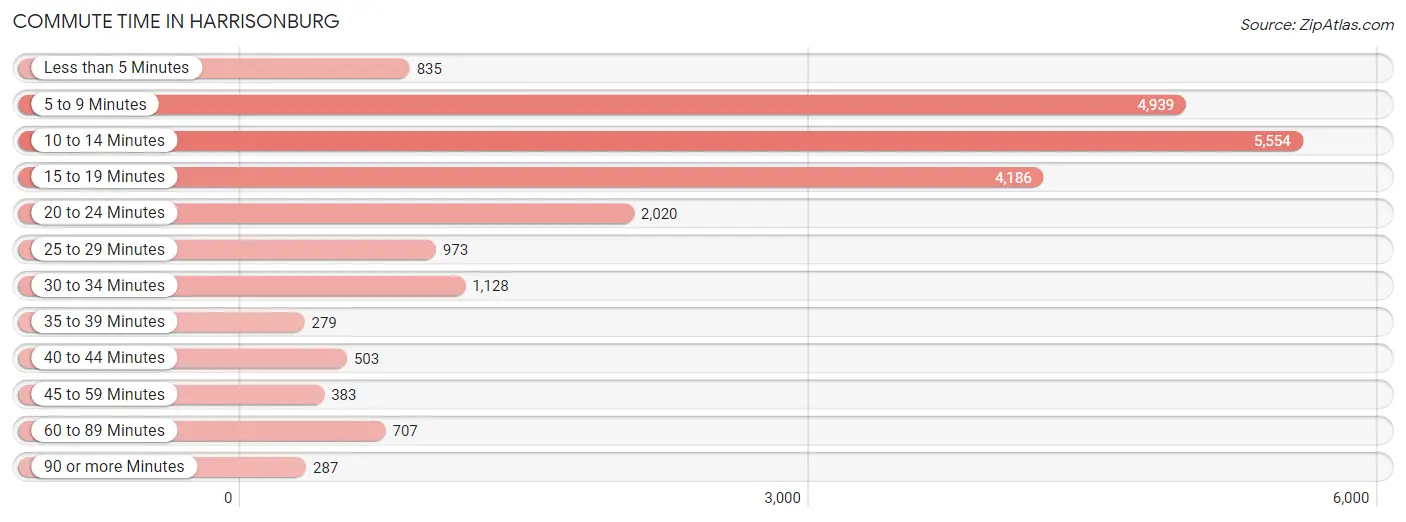
Commute Time in Harrisonburg
The most frequently occuring commute durations in Harrisonburg are 10 to 14 minutes (5,554 commuters, 25.5%), 5 to 9 minutes (4,939 commuters, 22.7%), and 15 to 19 minutes (4,186 commuters, 19.2%).
| Commute Time | # Commuters | % Commuters |
| Less than 5 Minutes | 835 | 3.8% |
| 5 to 9 Minutes | 4,939 | 22.7% |
| 10 to 14 Minutes | 5,554 | 25.5% |
| 15 to 19 Minutes | 4,186 | 19.2% |
| 20 to 24 Minutes | 2,020 | 9.3% |
| 25 to 29 Minutes | 973 | 4.5% |
| 30 to 34 Minutes | 1,128 | 5.2% |
| 35 to 39 Minutes | 279 | 1.3% |
| 40 to 44 Minutes | 503 | 2.3% |
| 45 to 59 Minutes | 383 | 1.8% |
| 60 to 89 Minutes | 707 | 3.2% |
| 90 or more Minutes | 287 | 1.3% |
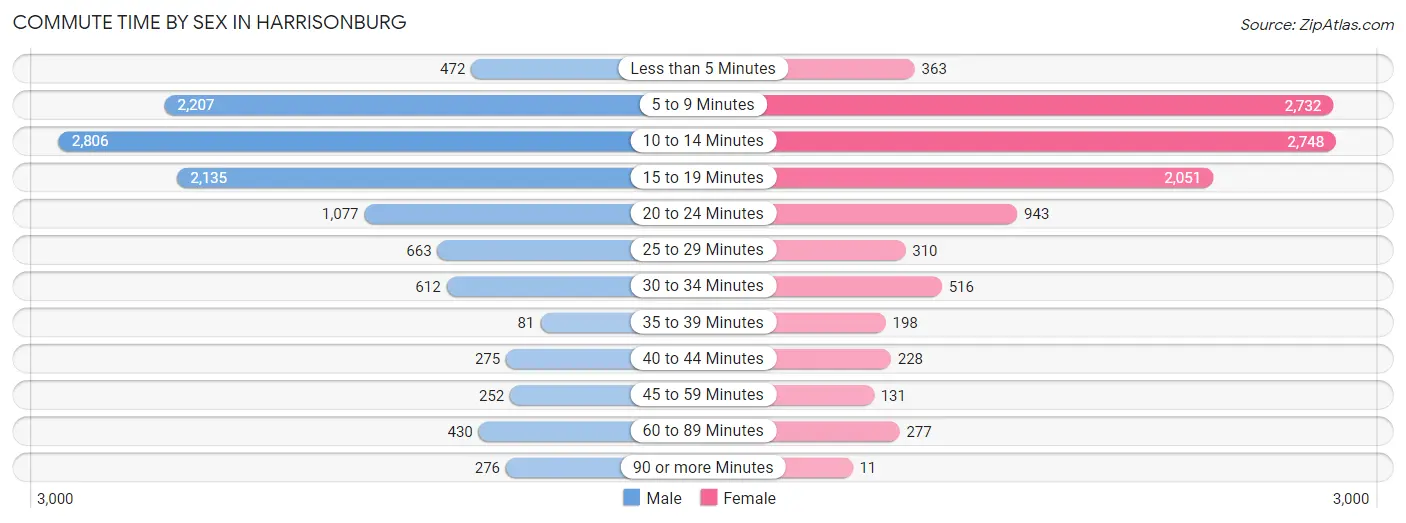
Commute Time by Sex in Harrisonburg
The most common commute times in Harrisonburg are 10 to 14 minutes (2,806 commuters, 24.9%) for males and 10 to 14 minutes (2,748 commuters, 26.2%) for females.
| Commute Time | Male | Female |
| Less than 5 Minutes | 472 (4.2%) | 363 (3.5%) |
| 5 to 9 Minutes | 2,207 (19.6%) | 2,732 (26.0%) |
| 10 to 14 Minutes | 2,806 (24.9%) | 2,748 (26.2%) |
| 15 to 19 Minutes | 2,135 (18.9%) | 2,051 (19.5%) |
| 20 to 24 Minutes | 1,077 (9.5%) | 943 (9.0%) |
| 25 to 29 Minutes | 663 (5.9%) | 310 (2.9%) |
| 30 to 34 Minutes | 612 (5.4%) | 516 (4.9%) |
| 35 to 39 Minutes | 81 (0.7%) | 198 (1.9%) |
| 40 to 44 Minutes | 275 (2.4%) | 228 (2.2%) |
| 45 to 59 Minutes | 252 (2.2%) | 131 (1.3%) |
| 60 to 89 Minutes | 430 (3.8%) | 277 (2.6%) |
| 90 or more Minutes | 276 (2.5%) | 11 (0.1%) |
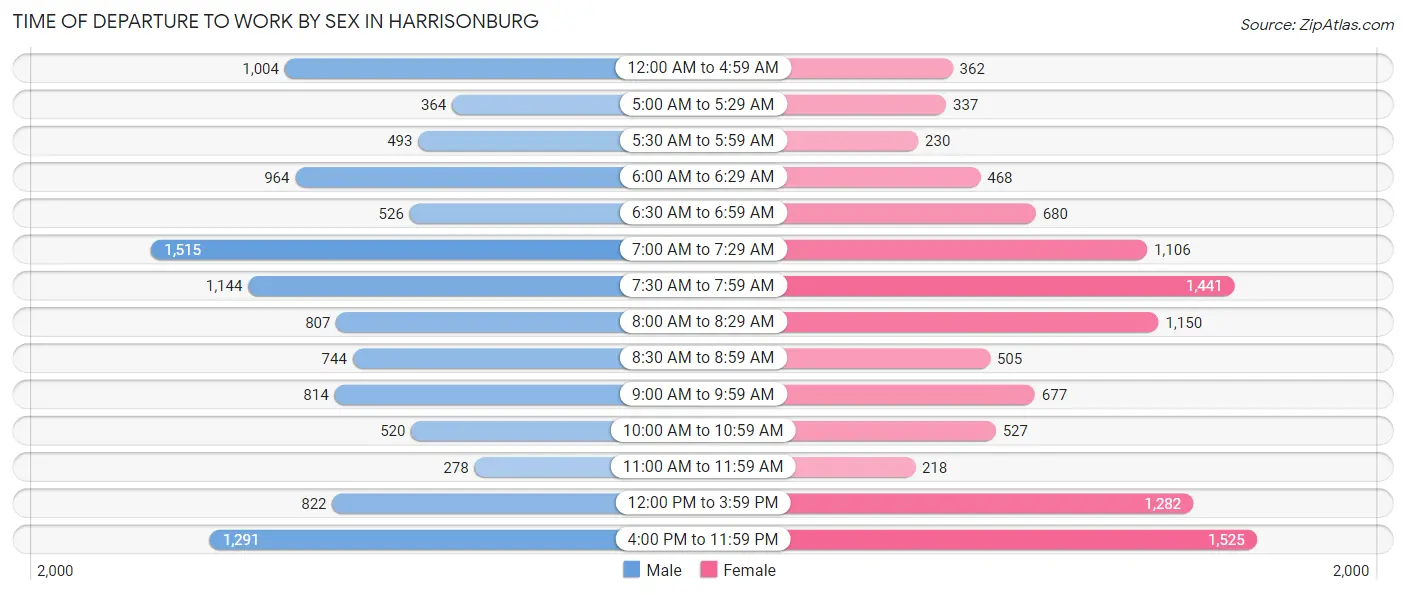
Time of Departure to Work by Sex in Harrisonburg
The most frequent times of departure to work in Harrisonburg are 7:00 AM to 7:29 AM (1,515, 13.4%) for males and 4:00 PM to 11:59 PM (1,525, 14.5%) for females.
| Time of Departure | Male | Female |
| 12:00 AM to 4:59 AM | 1,004 (8.9%) | 362 (3.4%) |
| 5:00 AM to 5:29 AM | 364 (3.2%) | 337 (3.2%) |
| 5:30 AM to 5:59 AM | 493 (4.4%) | 230 (2.2%) |
| 6:00 AM to 6:29 AM | 964 (8.5%) | 468 (4.4%) |
| 6:30 AM to 6:59 AM | 526 (4.7%) | 680 (6.5%) |
| 7:00 AM to 7:29 AM | 1,515 (13.4%) | 1,106 (10.5%) |
| 7:30 AM to 7:59 AM | 1,144 (10.1%) | 1,441 (13.7%) |
| 8:00 AM to 8:29 AM | 807 (7.1%) | 1,150 (10.9%) |
| 8:30 AM to 8:59 AM | 744 (6.6%) | 505 (4.8%) |
| 9:00 AM to 9:59 AM | 814 (7.2%) | 677 (6.4%) |
| 10:00 AM to 10:59 AM | 520 (4.6%) | 527 (5.0%) |
| 11:00 AM to 11:59 AM | 278 (2.5%) | 218 (2.1%) |
| 12:00 PM to 3:59 PM | 822 (7.3%) | 1,282 (12.2%) |
| 4:00 PM to 11:59 PM | 1,291 (11.4%) | 1,525 (14.5%) |
| Total | 11,286 (100.0%) | 10,508 (100.0%) |
Housing Occupancy in Harrisonburg
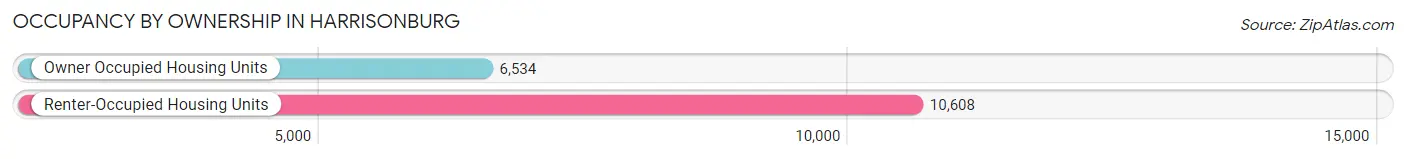
Occupancy by Ownership in Harrisonburg
Of the total 17,142 dwellings in Harrisonburg, owner-occupied units account for 6,534 (38.1%), while renter-occupied units make up 10,608 (61.9%).
| Occupancy | # Housing Units | % Housing Units |
| Owner Occupied Housing Units | 6,534 | 38.1% |
| Renter-Occupied Housing Units | 10,608 | 61.9% |
| Total Occupied Housing Units | 17,142 | 100.0% |
Occupancy by Household Size in Harrisonburg
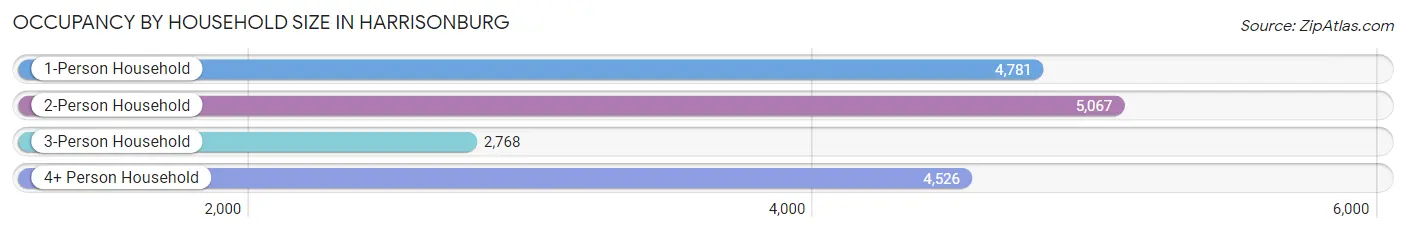
| Household Size | # Housing Units | % Housing Units |
| 1-Person Household | 4,781 | 27.9% |
| 2-Person Household | 5,067 | 29.6% |
| 3-Person Household | 2,768 | 16.2% |
| 4+ Person Household | 4,526 | 26.4% |
| Total Housing Units | 17,142 | 100.0% |
Occupancy by Ownership by Household Size in Harrisonburg
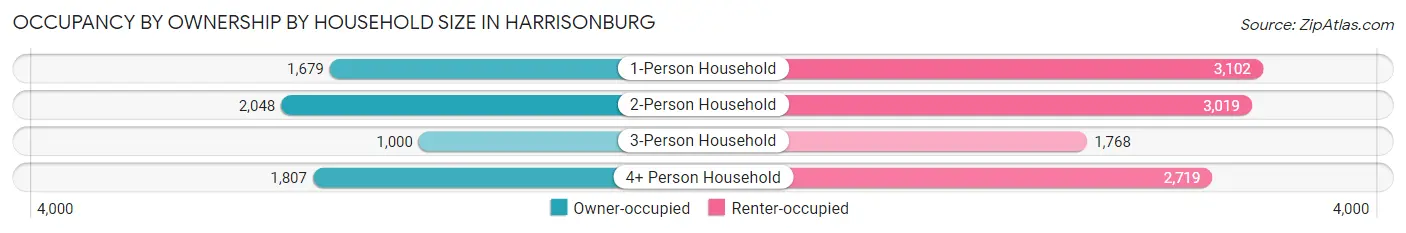
| Household Size | Owner-occupied | Renter-occupied |
| 1-Person Household | 1,679 (35.1%) | 3,102 (64.9%) |
| 2-Person Household | 2,048 (40.4%) | 3,019 (59.6%) |
| 3-Person Household | 1,000 (36.1%) | 1,768 (63.9%) |
| 4+ Person Household | 1,807 (39.9%) | 2,719 (60.1%) |
| Total Housing Units | 6,534 (38.1%) | 10,608 (61.9%) |
Occupancy by Educational Attainment in Harrisonburg
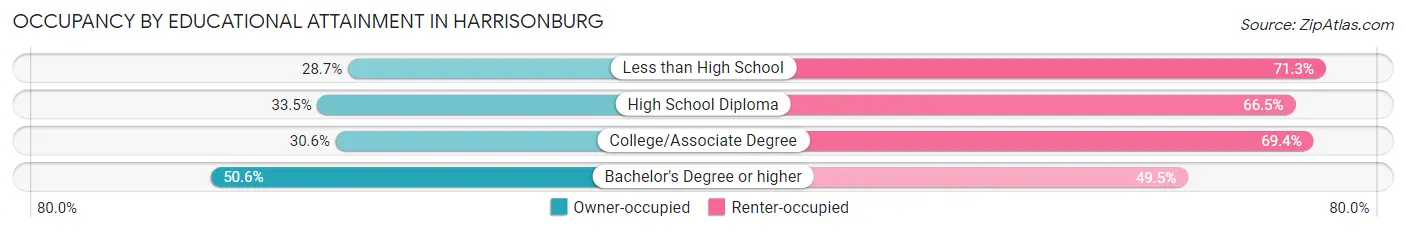
| Household Size | Owner-occupied | Renter-occupied |
| Less than High School | 644 (28.7%) | 1,600 (71.3%) |
| High School Diploma | 1,118 (33.5%) | 2,216 (66.5%) |
| College/Associate Degree | 1,652 (30.6%) | 3,740 (69.4%) |
| Bachelor's Degree or higher | 3,120 (50.5%) | 3,052 (49.4%) |
Occupancy by Age of Householder in Harrisonburg
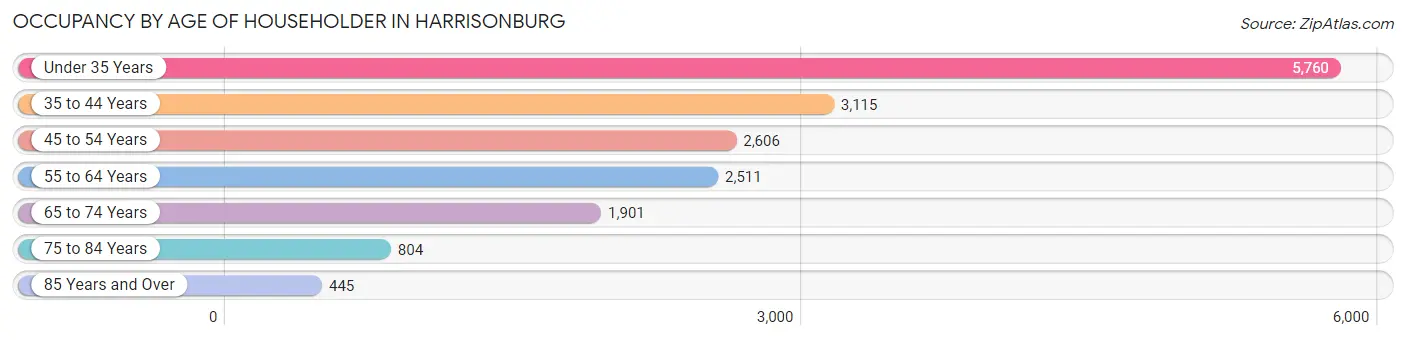
| Age Bracket | # Households | % Households |
| Under 35 Years | 5,760 | 33.6% |
| 35 to 44 Years | 3,115 | 18.2% |
| 45 to 54 Years | 2,606 | 15.2% |
| 55 to 64 Years | 2,511 | 14.6% |
| 65 to 74 Years | 1,901 | 11.1% |
| 75 to 84 Years | 804 | 4.7% |
| 85 Years and Over | 445 | 2.6% |
| Total | 17,142 | 100.0% |
Housing Finances in Harrisonburg
Median Income by Occupancy in Harrisonburg
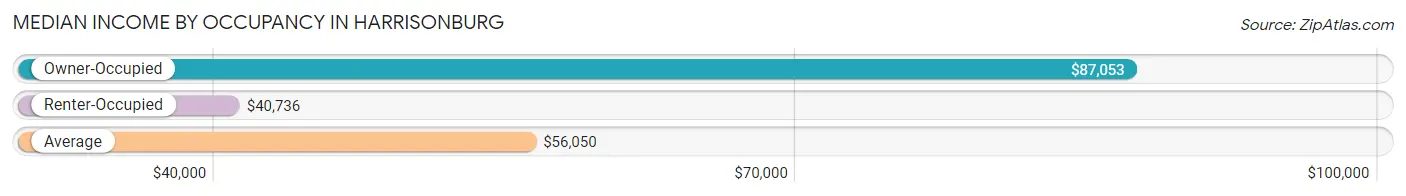
| Occupancy Type | # Households | Median Income |
| Owner-Occupied | 6,534 (38.1%) | $87,053 |
| Renter-Occupied | 10,608 (61.9%) | $40,736 |
| Average | 17,142 (100.0%) | $56,050 |
Occupancy by Householder Income Bracket in Harrisonburg
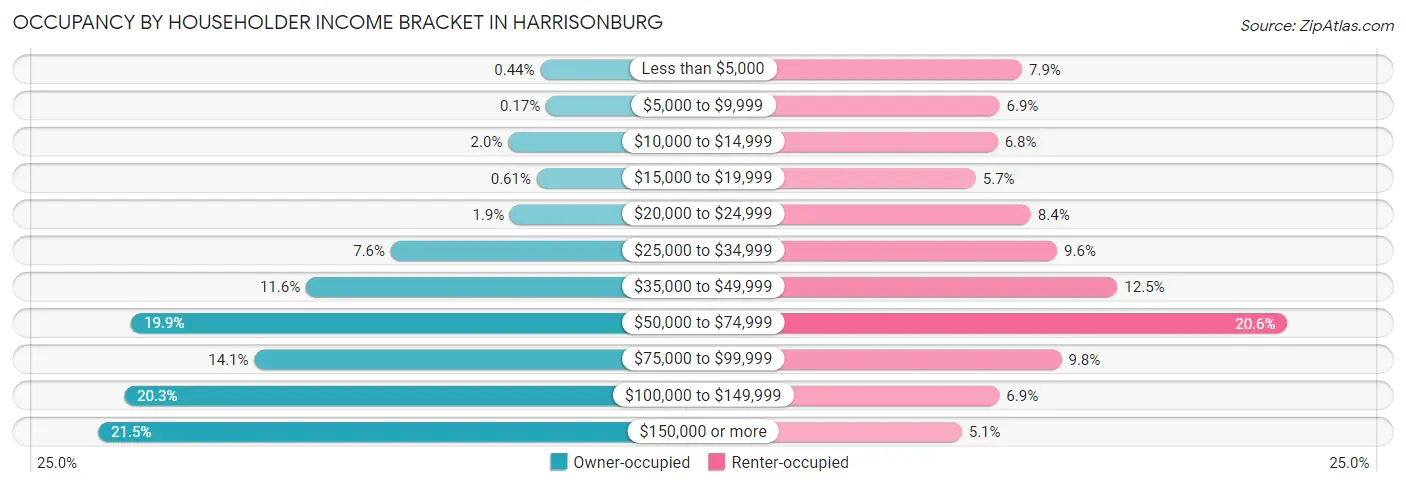
| Income Bracket | Owner-occupied | Renter-occupied |
| Less than $5,000 | 29 (0.4%) | 841 (7.9%) |
| $5,000 to $9,999 | 11 (0.2%) | 728 (6.9%) |
| $10,000 to $14,999 | 129 (2.0%) | 718 (6.8%) |
| $15,000 to $19,999 | 40 (0.6%) | 608 (5.7%) |
| $20,000 to $24,999 | 123 (1.9%) | 886 (8.4%) |
| $25,000 to $34,999 | 494 (7.6%) | 1,018 (9.6%) |
| $35,000 to $49,999 | 758 (11.6%) | 1,323 (12.5%) |
| $50,000 to $74,999 | 1,302 (19.9%) | 2,181 (20.6%) |
| $75,000 to $99,999 | 919 (14.1%) | 1,041 (9.8%) |
| $100,000 to $149,999 | 1,324 (20.3%) | 727 (6.9%) |
| $150,000 or more | 1,405 (21.5%) | 537 (5.1%) |
| Total | 6,534 (100.0%) | 10,608 (100.0%) |
Monthly Housing Cost Tiers in Harrisonburg
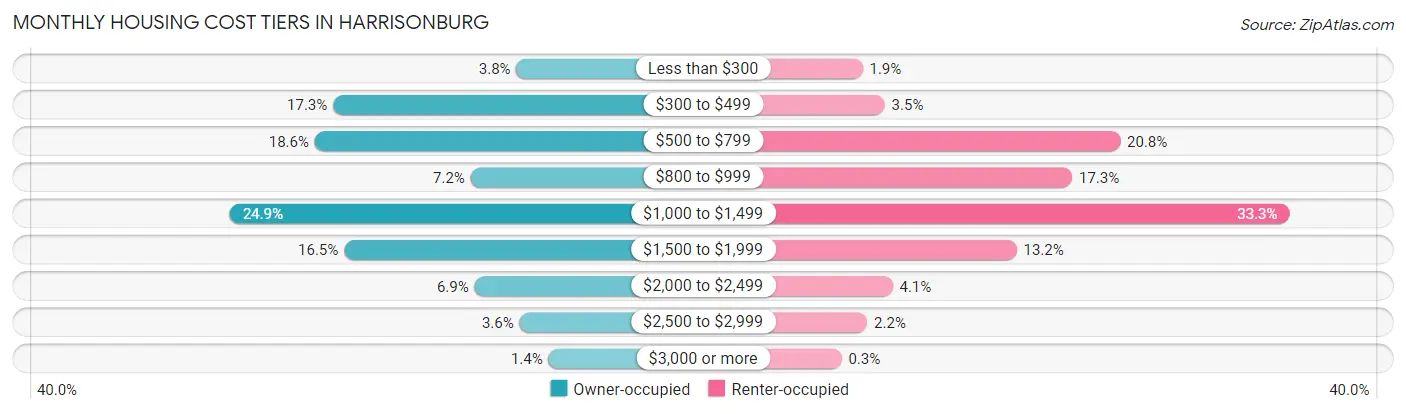
| Monthly Cost | Owner-occupied | Renter-occupied |
| Less than $300 | 247 (3.8%) | 196 (1.8%) |
| $300 to $499 | 1,129 (17.3%) | 369 (3.5%) |
| $500 to $799 | 1,217 (18.6%) | 2,209 (20.8%) |
| $800 to $999 | 467 (7.1%) | 1,833 (17.3%) |
| $1,000 to $1,499 | 1,626 (24.9%) | 3,530 (33.3%) |
| $1,500 to $1,999 | 1,076 (16.5%) | 1,399 (13.2%) |
| $2,000 to $2,499 | 448 (6.9%) | 431 (4.1%) |
| $2,500 to $2,999 | 232 (3.5%) | 232 (2.2%) |
| $3,000 or more | 92 (1.4%) | 32 (0.3%) |
| Total | 6,534 (100.0%) | 10,608 (100.0%) |
Physical Housing Characteristics in Harrisonburg
Housing Structures in Harrisonburg
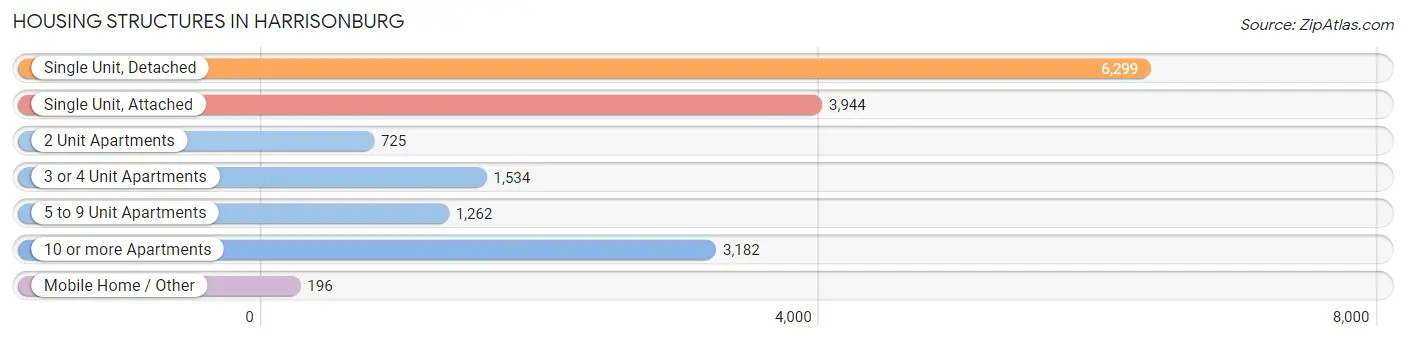
| Structure Type | # Housing Units | % Housing Units |
| Single Unit, Detached | 6,299 | 36.7% |
| Single Unit, Attached | 3,944 | 23.0% |
| 2 Unit Apartments | 725 | 4.2% |
| 3 or 4 Unit Apartments | 1,534 | 8.9% |
| 5 to 9 Unit Apartments | 1,262 | 7.4% |
| 10 or more Apartments | 3,182 | 18.6% |
| Mobile Home / Other | 196 | 1.1% |
| Total | 17,142 | 100.0% |
Housing Structures by Occupancy in Harrisonburg
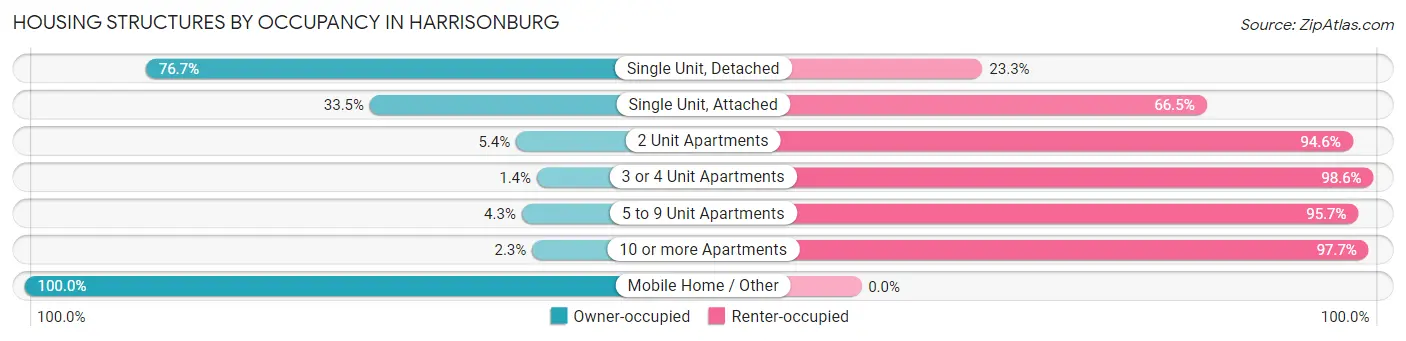
| Structure Type | Owner-occupied | Renter-occupied |
| Single Unit, Detached | 4,829 (76.7%) | 1,470 (23.3%) |
| Single Unit, Attached | 1,322 (33.5%) | 2,622 (66.5%) |
| 2 Unit Apartments | 39 (5.4%) | 686 (94.6%) |
| 3 or 4 Unit Apartments | 21 (1.4%) | 1,513 (98.6%) |
| 5 to 9 Unit Apartments | 54 (4.3%) | 1,208 (95.7%) |
| 10 or more Apartments | 73 (2.3%) | 3,109 (97.7%) |
| Mobile Home / Other | 196 (100.0%) | 0 (0.0%) |
| Total | 6,534 (38.1%) | 10,608 (61.9%) |
Housing Structures by Number of Rooms in Harrisonburg
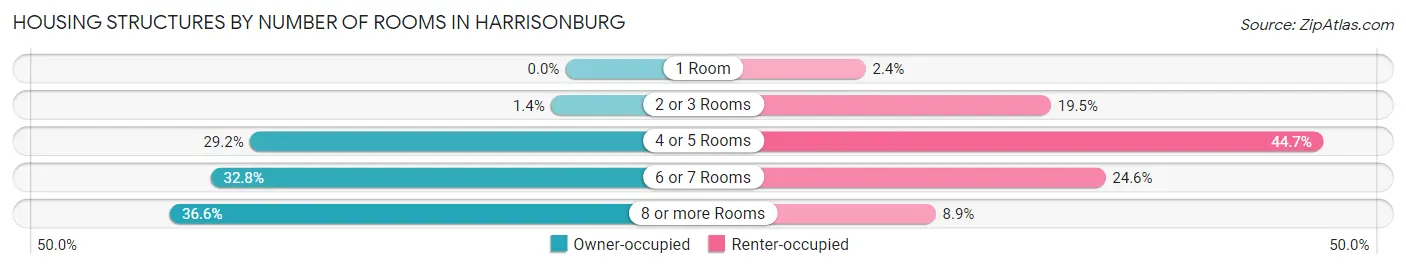
| Number of Rooms | Owner-occupied | Renter-occupied |
| 1 Room | 0 (0.0%) | 251 (2.4%) |
| 2 or 3 Rooms | 89 (1.4%) | 2,069 (19.5%) |
| 4 or 5 Rooms | 1,908 (29.2%) | 4,745 (44.7%) |
| 6 or 7 Rooms | 2,143 (32.8%) | 2,604 (24.5%) |
| 8 or more Rooms | 2,394 (36.6%) | 939 (8.8%) |
| Total | 6,534 (100.0%) | 10,608 (100.0%) |
Housing Structure by Heating Type in Harrisonburg
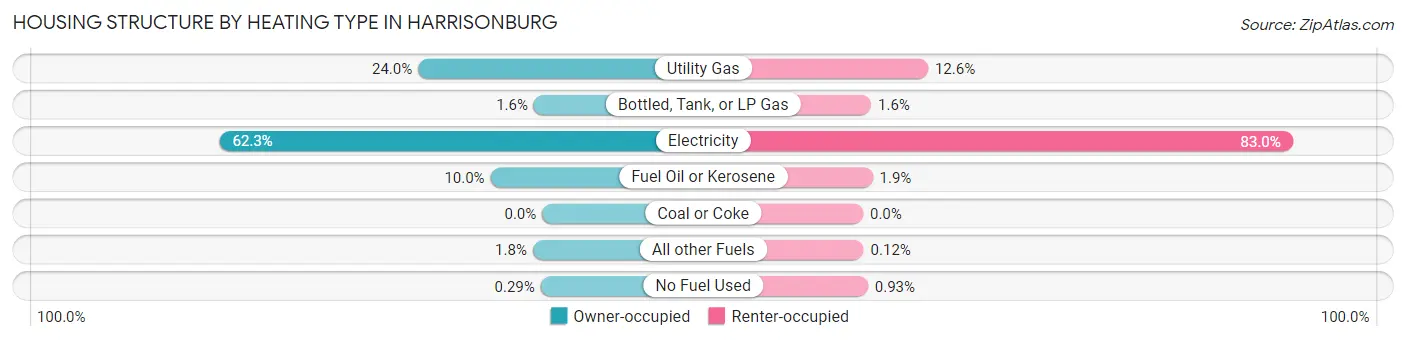
| Heating Type | Owner-occupied | Renter-occupied |
| Utility Gas | 1,567 (24.0%) | 1,331 (12.6%) |
| Bottled, Tank, or LP Gas | 105 (1.6%) | 164 (1.5%) |
| Electricity | 4,073 (62.3%) | 8,805 (83.0%) |
| Fuel Oil or Kerosene | 652 (10.0%) | 196 (1.8%) |
| Coal or Coke | 0 (0.0%) | 0 (0.0%) |
| All other Fuels | 118 (1.8%) | 13 (0.1%) |
| No Fuel Used | 19 (0.3%) | 99 (0.9%) |
| Total | 6,534 (100.0%) | 10,608 (100.0%) |
Household Vehicle Usage in Harrisonburg
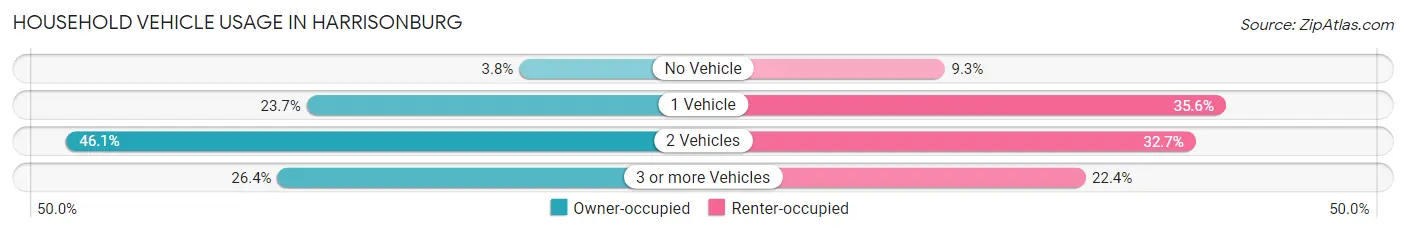
| Vehicles per Household | Owner-occupied | Renter-occupied |
| No Vehicle | 250 (3.8%) | 987 (9.3%) |
| 1 Vehicle | 1,547 (23.7%) | 3,771 (35.5%) |
| 2 Vehicles | 3,012 (46.1%) | 3,472 (32.7%) |
| 3 or more Vehicles | 1,725 (26.4%) | 2,378 (22.4%) |
| Total | 6,534 (100.0%) | 10,608 (100.0%) |
Real Estate & Mortgages in Harrisonburg
Real Estate and Mortgage Overview in Harrisonburg
| Characteristic | Without Mortgage | With Mortgage |
| Housing Units | 2,376 | 4,158 |
| Median Property Value | $273,900 | $257,800 |
| Median Household Income | $80,938 | $1,061 |
| Monthly Housing Costs | $477 | $92 |
| Real Estate Taxes | $2,164 | $236 |
Property Value by Mortgage Status in Harrisonburg
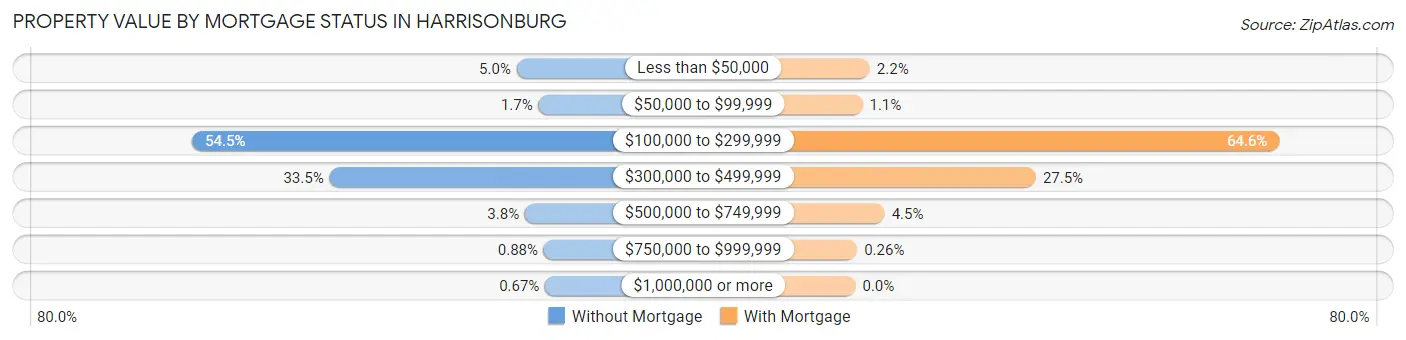
| Property Value | Without Mortgage | With Mortgage |
| Less than $50,000 | 119 (5.0%) | 91 (2.2%) |
| $50,000 to $99,999 | 40 (1.7%) | 44 (1.1%) |
| $100,000 to $299,999 | 1,294 (54.5%) | 2,684 (64.5%) |
| $300,000 to $499,999 | 797 (33.5%) | 1,143 (27.5%) |
| $500,000 to $749,999 | 89 (3.7%) | 185 (4.4%) |
| $750,000 to $999,999 | 21 (0.9%) | 11 (0.3%) |
| $1,000,000 or more | 16 (0.7%) | 0 (0.0%) |
| Total | 2,376 (100.0%) | 4,158 (100.0%) |
Household Income by Mortgage Status in Harrisonburg
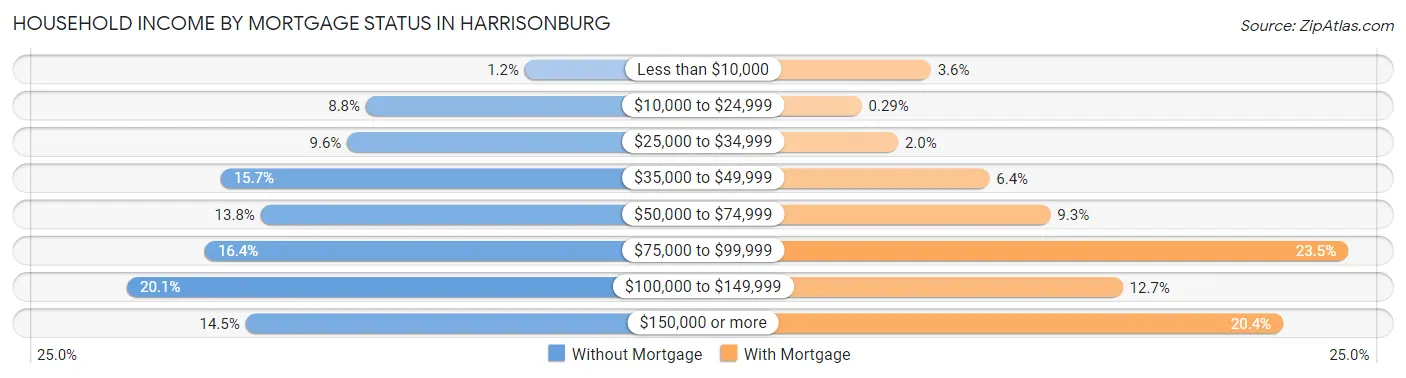
| Household Income | Without Mortgage | With Mortgage |
| Less than $10,000 | 28 (1.2%) | 149 (3.6%) |
| $10,000 to $24,999 | 208 (8.7%) | 12 (0.3%) |
| $25,000 to $34,999 | 229 (9.6%) | 84 (2.0%) |
| $35,000 to $49,999 | 372 (15.7%) | 265 (6.4%) |
| $50,000 to $74,999 | 327 (13.8%) | 386 (9.3%) |
| $75,000 to $99,999 | 390 (16.4%) | 975 (23.4%) |
| $100,000 to $149,999 | 478 (20.1%) | 529 (12.7%) |
| $150,000 or more | 344 (14.5%) | 846 (20.3%) |
| Total | 2,376 (100.0%) | 4,158 (100.0%) |
Property Value to Household Income Ratio in Harrisonburg
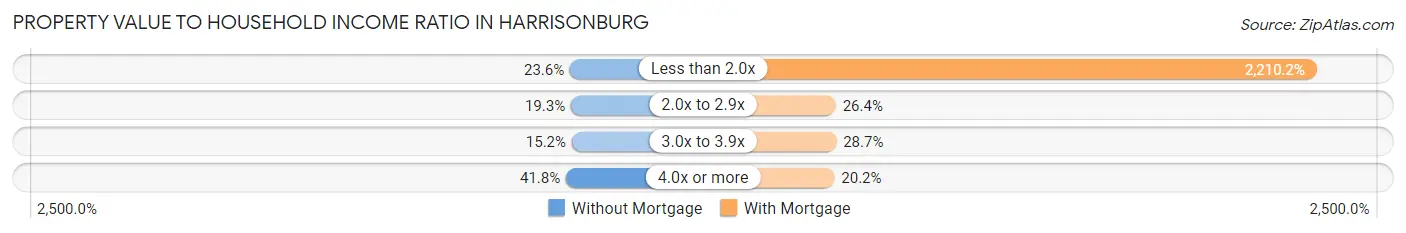
| Value-to-Income Ratio | Without Mortgage | With Mortgage |
| Less than 2.0x | 561 (23.6%) | 91,901 (2,210.2%) |
| 2.0x to 2.9x | 459 (19.3%) | 1,098 (26.4%) |
| 3.0x to 3.9x | 362 (15.2%) | 1,192 (28.7%) |
| 4.0x or more | 994 (41.8%) | 838 (20.2%) |
| Total | 2,376 (100.0%) | 4,158 (100.0%) |
Real Estate Taxes by Mortgage Status in Harrisonburg
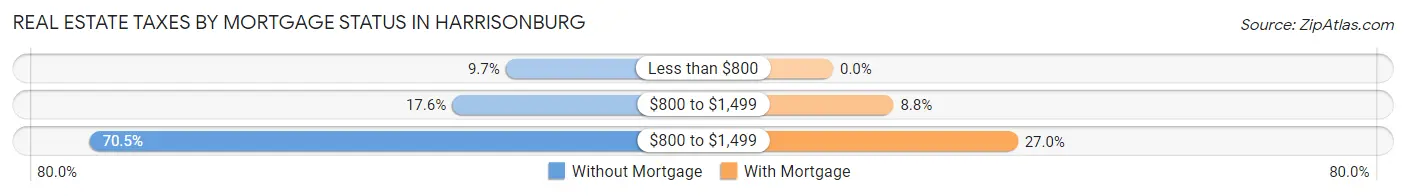
| Property Taxes | Without Mortgage | With Mortgage |
| Less than $800 | 231 (9.7%) | 0 (0.0%) |
| $800 to $1,499 | 417 (17.5%) | 367 (8.8%) |
| $800 to $1,499 | 1,675 (70.5%) | 1,122 (27.0%) |
| Total | 2,376 (100.0%) | 4,158 (100.0%) |
Health & Disability in Harrisonburg
Health Insurance Coverage by Age in Harrisonburg
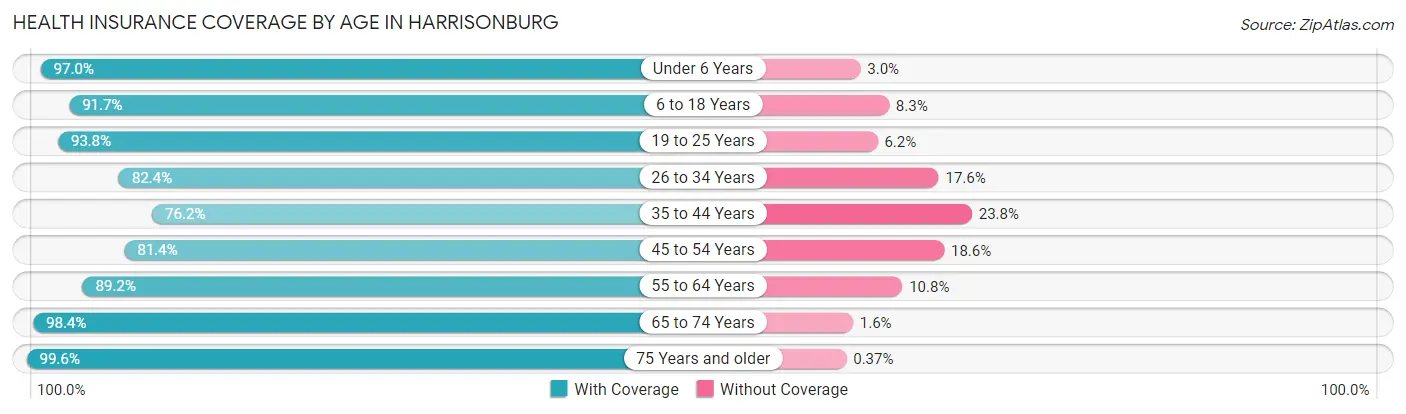
| Age Bracket | With Coverage | Without Coverage |
| Under 6 Years | 2,853 (97.0%) | 88 (3.0%) |
| 6 to 18 Years | 8,592 (91.7%) | 780 (8.3%) |
| 19 to 25 Years | 13,179 (93.8%) | 869 (6.2%) |
| 26 to 34 Years | 4,731 (82.4%) | 1,009 (17.6%) |
| 35 to 44 Years | 4,168 (76.2%) | 1,300 (23.8%) |
| 45 to 54 Years | 3,808 (81.4%) | 870 (18.6%) |
| 55 to 64 Years | 3,733 (89.2%) | 452 (10.8%) |
| 65 to 74 Years | 2,778 (98.4%) | 45 (1.6%) |
| 75 Years and older | 1,902 (99.6%) | 7 (0.4%) |
| Total | 45,744 (89.4%) | 5,420 (10.6%) |
Health Insurance Coverage by Citizenship Status in Harrisonburg
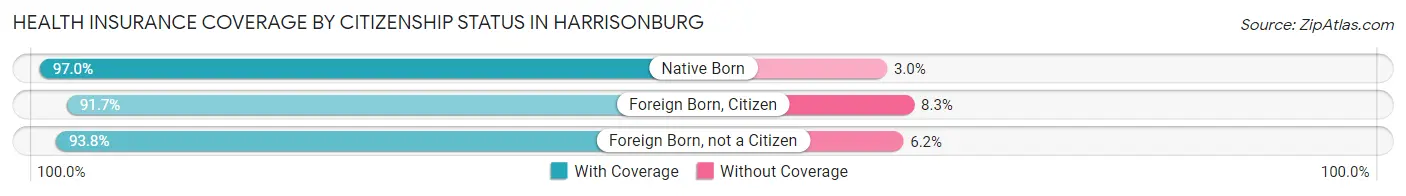
| Citizenship Status | With Coverage | Without Coverage |
| Native Born | 2,853 (97.0%) | 88 (3.0%) |
| Foreign Born, Citizen | 8,592 (91.7%) | 780 (8.3%) |
| Foreign Born, not a Citizen | 13,179 (93.8%) | 869 (6.2%) |
Health Insurance Coverage by Household Income in Harrisonburg
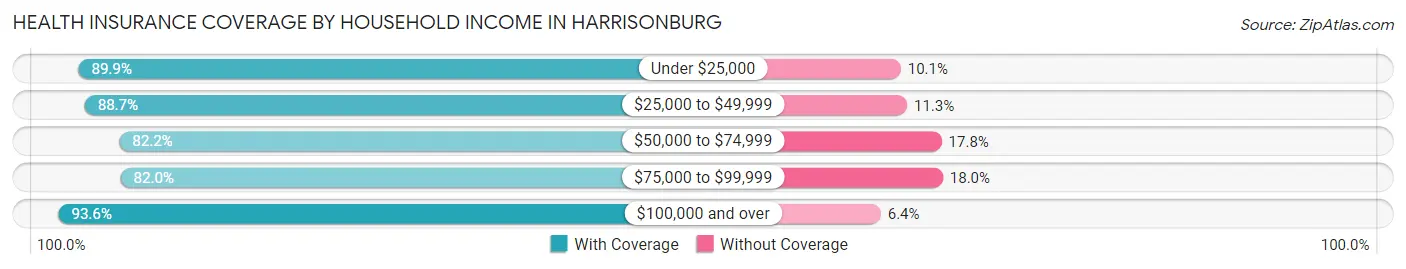
| Household Income | With Coverage | Without Coverage |
| Under $25,000 | 8,642 (89.9%) | 973 (10.1%) |
| $25,000 to $49,999 | 7,494 (88.7%) | 954 (11.3%) |
| $50,000 to $74,999 | 7,126 (82.2%) | 1,540 (17.8%) |
| $75,000 to $99,999 | 4,146 (82.0%) | 910 (18.0%) |
| $100,000 and over | 11,753 (93.6%) | 800 (6.4%) |
Public vs Private Health Insurance Coverage by Age in Harrisonburg
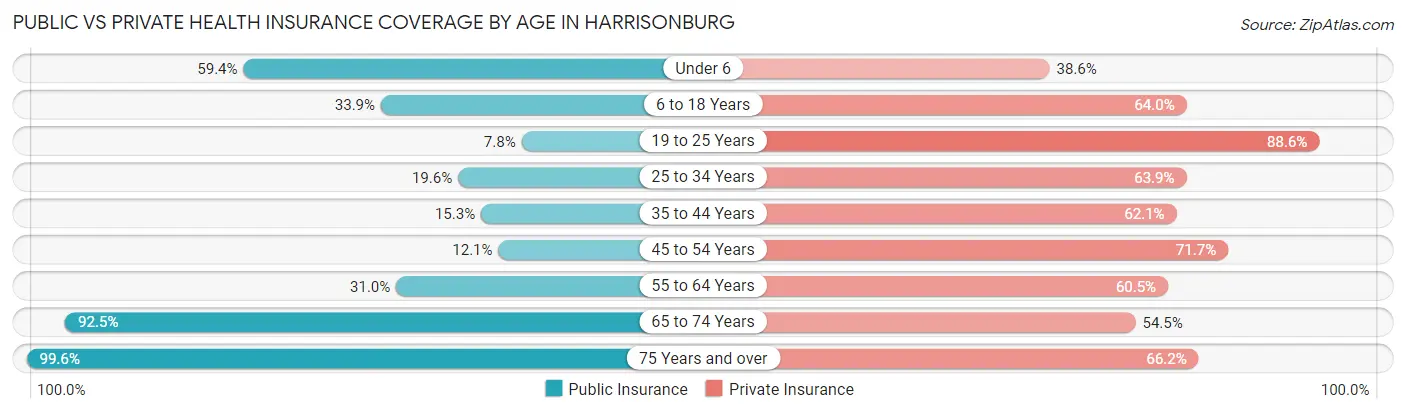
| Age Bracket | Public Insurance | Private Insurance |
| Under 6 | 1,747 (59.4%) | 1,134 (38.6%) |
| 6 to 18 Years | 3,174 (33.9%) | 5,995 (64.0%) |
| 19 to 25 Years | 1,091 (7.8%) | 12,447 (88.6%) |
| 25 to 34 Years | 1,123 (19.6%) | 3,670 (63.9%) |
| 35 to 44 Years | 836 (15.3%) | 3,396 (62.1%) |
| 45 to 54 Years | 564 (12.1%) | 3,353 (71.7%) |
| 55 to 64 Years | 1,299 (31.0%) | 2,533 (60.5%) |
| 65 to 74 Years | 2,611 (92.5%) | 1,539 (54.5%) |
| 75 Years and over | 1,902 (99.6%) | 1,264 (66.2%) |
| Total | 14,347 (28.0%) | 35,331 (69.1%) |
Disability Status by Sex by Age in Harrisonburg
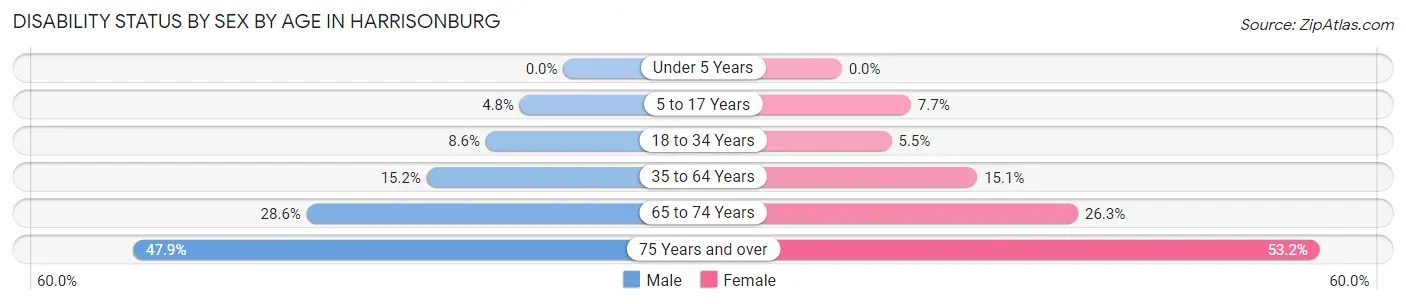
| Age Bracket | Male | Female |
| Under 5 Years | 0 (0.0%) | 0 (0.0%) |
| 5 to 17 Years | 146 (4.8%) | 231 (7.7%) |
| 18 to 34 Years | 942 (8.6%) | 703 (5.5%) |
| 35 to 64 Years | 1,112 (15.2%) | 1,060 (15.1%) |
| 65 to 74 Years | 354 (28.6%) | 417 (26.3%) |
| 75 Years and over | 379 (47.9%) | 595 (53.2%) |
Disability Class by Sex by Age in Harrisonburg
Disability Class: Hearing Difficulty
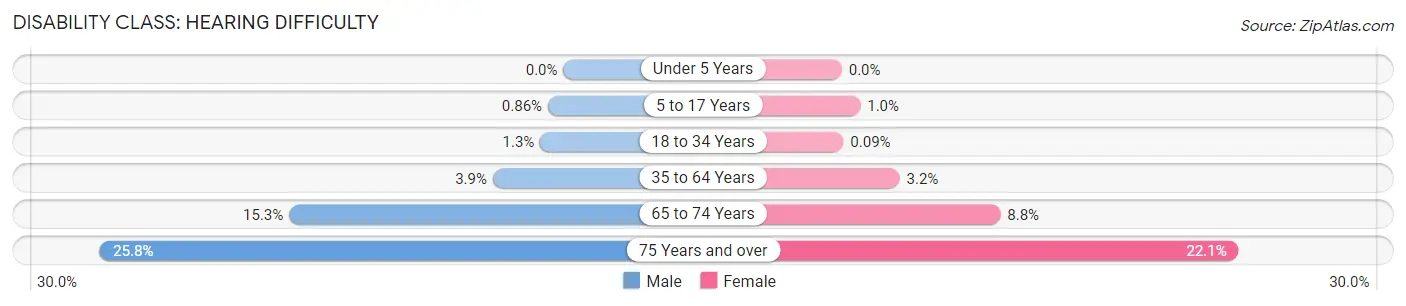
| Age Bracket | Male | Female |
| Under 5 Years | 0 (0.0%) | 0 (0.0%) |
| 5 to 17 Years | 26 (0.9%) | 31 (1.0%) |
| 18 to 34 Years | 141 (1.3%) | 12 (0.1%) |
| 35 to 64 Years | 287 (3.9%) | 226 (3.2%) |
| 65 to 74 Years | 189 (15.3%) | 140 (8.8%) |
| 75 Years and over | 204 (25.8%) | 247 (22.1%) |
Disability Class: Vision Difficulty
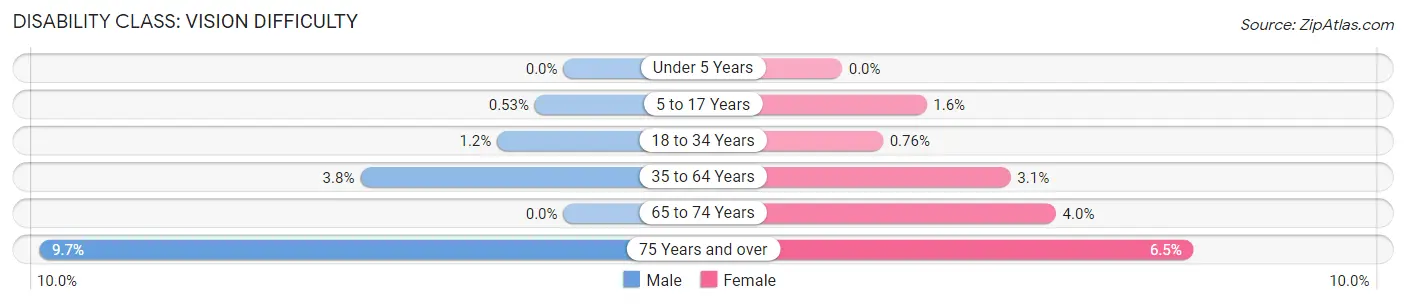
| Age Bracket | Male | Female |
| Under 5 Years | 0 (0.0%) | 0 (0.0%) |
| 5 to 17 Years | 16 (0.5%) | 47 (1.6%) |
| 18 to 34 Years | 134 (1.2%) | 96 (0.8%) |
| 35 to 64 Years | 275 (3.8%) | 220 (3.1%) |
| 65 to 74 Years | 0 (0.0%) | 63 (4.0%) |
| 75 Years and over | 77 (9.7%) | 73 (6.5%) |
Disability Class: Cognitive Difficulty
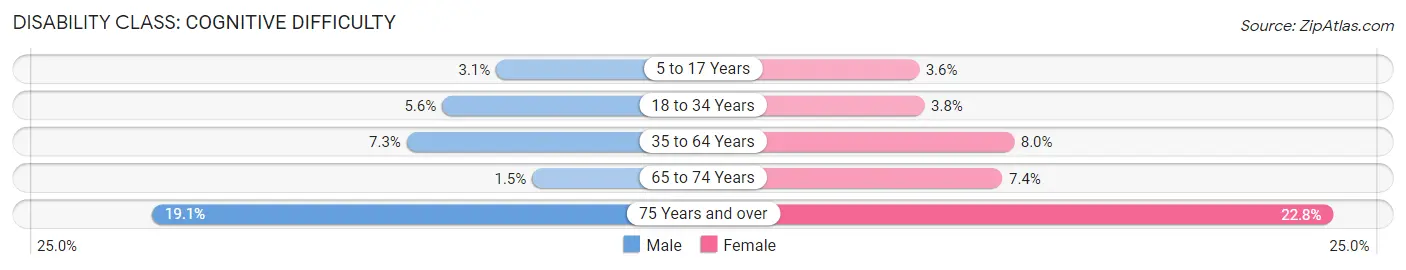
| Age Bracket | Male | Female |
| 5 to 17 Years | 94 (3.1%) | 107 (3.6%) |
| 18 to 34 Years | 615 (5.6%) | 485 (3.8%) |
| 35 to 64 Years | 531 (7.3%) | 561 (8.0%) |
| 65 to 74 Years | 18 (1.5%) | 118 (7.4%) |
| 75 Years and over | 151 (19.1%) | 255 (22.8%) |
Disability Class: Ambulatory Difficulty
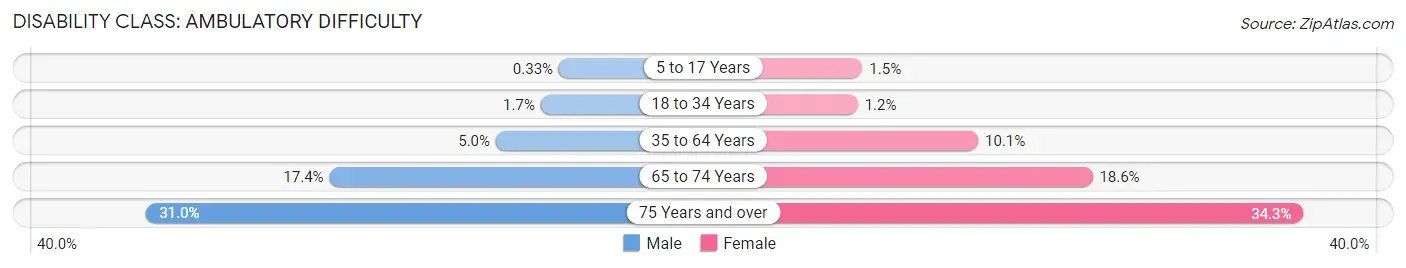
| Age Bracket | Male | Female |
| 5 to 17 Years | 10 (0.3%) | 46 (1.5%) |
| 18 to 34 Years | 184 (1.7%) | 150 (1.2%) |
| 35 to 64 Years | 366 (5.0%) | 711 (10.1%) |
| 65 to 74 Years | 215 (17.4%) | 295 (18.6%) |
| 75 Years and over | 245 (31.0%) | 383 (34.3%) |
Disability Class: Self-Care Difficulty
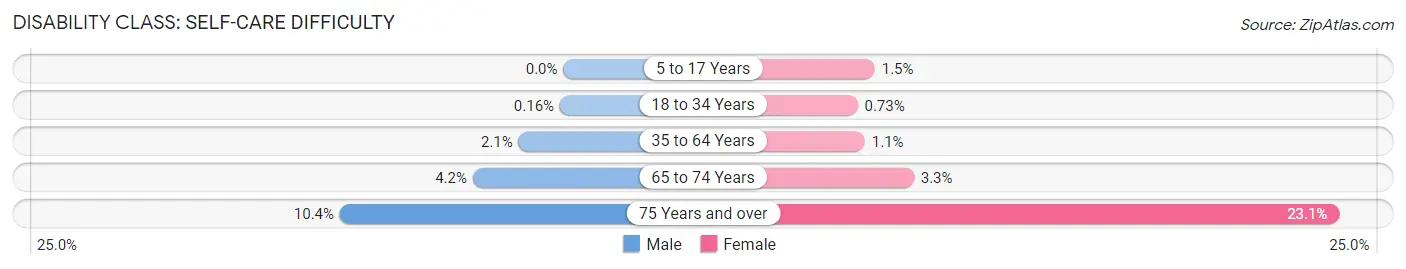
| Age Bracket | Male | Female |
| 5 to 17 Years | 0 (0.0%) | 46 (1.5%) |
| 18 to 34 Years | 17 (0.2%) | 93 (0.7%) |
| 35 to 64 Years | 152 (2.1%) | 75 (1.1%) |
| 65 to 74 Years | 52 (4.2%) | 53 (3.3%) |
| 75 Years and over | 82 (10.4%) | 258 (23.1%) |
Technology Access in Harrisonburg
Computing Device Access in Harrisonburg
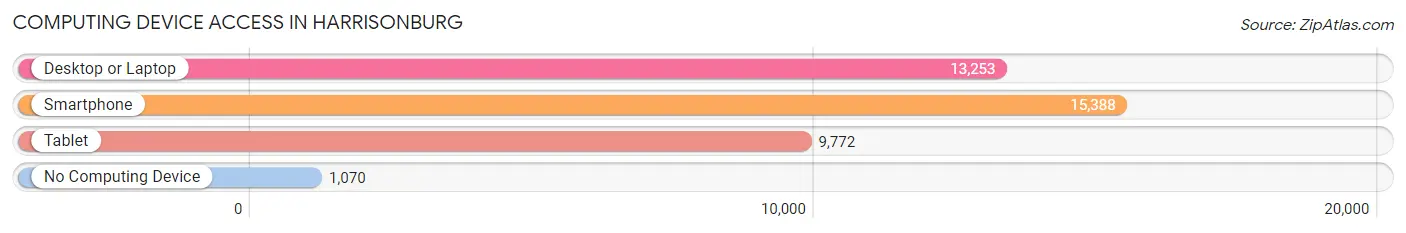
| Device Type | # Households | % Households |
| Desktop or Laptop | 13,253 | 77.3% |
| Smartphone | 15,388 | 89.8% |
| Tablet | 9,772 | 57.0% |
| No Computing Device | 1,070 | 6.2% |
| Total | 17,142 | 100.0% |
Internet Access in Harrisonburg
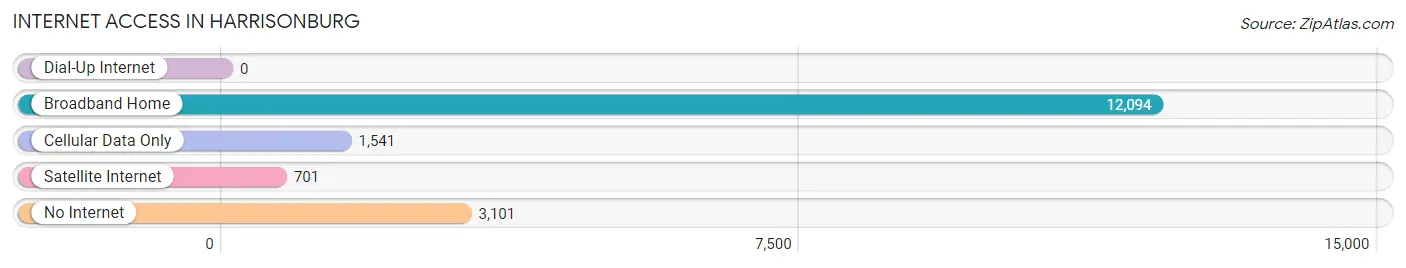
| Internet Type | # Households | % Households |
| Dial-Up Internet | 0 | 0.0% |
| Broadband Home | 12,094 | 70.6% |
| Cellular Data Only | 1,541 | 9.0% |
| Satellite Internet | 701 | 4.1% |
| No Internet | 3,101 | 18.1% |
| Total | 17,142 | 100.0% |
Harrisonburg Summary
Harrisonburg, Virginia is a city located in the Shenandoah Valley of the Commonwealth of Virginia. It is the county seat of Rockingham County and is the principal city of the Harrisonburg Metropolitan Statistical Area. The city has a population of 53,073 as of the 2020 census, making it the largest city in the Shenandoah Valley and the second largest city in the state of Virginia.
History
Harrisonburg was founded in 1779 by Thomas Harrison, a Revolutionary War veteran and surveyor. The city was named after him and was originally known as "Rocktown". The city was incorporated in 1780 and became the county seat of Rockingham County in 1782.
During the Civil War, Harrisonburg was a major supply center for the Confederate Army. The city was the site of several battles, including the Battle of Harrisonburg in 1862. After the war, the city experienced a period of growth and prosperity, becoming a major railroad hub and a center for manufacturing.
In the early 20th century, Harrisonburg was a major center for the poultry industry. The city was also home to several colleges, including James Madison University, Eastern Mennonite University, and Bridgewater College.
Geography
Harrisonburg is located in the Shenandoah Valley of Virginia, approximately 78 miles (125 km) northwest of Richmond and 90 miles (145 km) southwest of Washington, D.C. The city is situated in the foothills of the Blue Ridge Mountains and is surrounded by the George Washington National Forest.
The city is located at the intersection of Interstate 81 and U.S. Route 11. The city is also served by the Shenandoah Valley Regional Airport.
Economy
Harrisonburg is a major economic center in the Shenandoah Valley. The city is home to several major employers, including James Madison University, Rockingham Memorial Hospital, and the City of Harrisonburg.
The city is also home to several major industries, including poultry processing, manufacturing, and tourism. The city is also a major center for agriculture, with several large farms located in the surrounding area.
Demographics
As of the 2020 census, the population of Harrisonburg was 53,073. The city has a population density of 1,845 people per square mile (715/km2). The racial makeup of the city was 79.2% White, 11.3% African American, 0.3% Native American, 3.2% Asian, 0.1% Pacific Islander, 3.2% from other races, and 2.9% from two or more races. Hispanic or Latino of any race were 6.7% of the population.
The median income for a household in the city was $41,945, and the median income for a family was $51,945. The per capita income for the city was $21,945. About 11.3% of families and 16.2% of the population were below the poverty line, including 22.2% of those under age 18 and 8.2% of those age 65 or over.
Common Questions
What is Per Capita Income in Harrisonburg?
Per Capita income in Harrisonburg is $25,881.
What is the Median Family Income in Harrisonburg?
Median Family Income in Harrisonburg is $70,729.
What is the Median Household income in Harrisonburg?
Median Household Income in Harrisonburg is $56,050.
What is Income or Wage Gap in Harrisonburg?
Income or Wage Gap in Harrisonburg is 51.7%.
Women in Harrisonburg earn 48.3 cents for every dollar earned by a man.
What is Family Income Deficit in Harrisonburg?
Family Income Deficit in Harrisonburg is $13,189.
Families that are below poverty line in Harrisonburg earn $13,189 less on average than the poverty threshold level.
What is Inequality or Gini Index in Harrisonburg?
Inequality or Gini Index in Harrisonburg is 0.48.
What is the Total Population of Harrisonburg?
Total Population of Harrisonburg is 51,784.
What is the Total Male Population of Harrisonburg?
Total Male Population of Harrisonburg is 25,035.
What is the Total Female Population of Harrisonburg?
Total Female Population of Harrisonburg is 26,749.
What is the Ratio of Males per 100 Females in Harrisonburg?
There are 93.59 Males per 100 Females in Harrisonburg.
What is the Ratio of Females per 100 Males in Harrisonburg?
There are 106.85 Females per 100 Males in Harrisonburg.
What is the Median Population Age in Harrisonburg?
Median Population Age in Harrisonburg is 25.4 Years.
What is the Average Family Size in Harrisonburg
Average Family Size in Harrisonburg is 3.0 People.
What is the Average Household Size in Harrisonburg
Average Household Size in Harrisonburg is 2.6 People.
How Large is the Labor Force in Harrisonburg?
There are 26,586 People in the Labor Forcein in Harrisonburg.
What is the Percentage of People in the Labor Force in Harrisonburg?
60.1% of People are in the Labor Force in Harrisonburg.
What is the Unemployment Rate in Harrisonburg?
Unemployment Rate in Harrisonburg is 6.7%.