Atkins, VA Map & Demographics
Atkins Map
Atkins Overview
$28,349
PER CAPITA INCOME
$44,602
AVG FAMILY INCOME
$43,318
AVG HOUSEHOLD INCOME
24.8%
WAGE / INCOME GAP [ % ]
75.2¢/ $1
WAGE / INCOME GAP [ $ ]
0.40
INEQUALITY / GINI INDEX
1,028
TOTAL POPULATION
551
MALE POPULATION
477
FEMALE POPULATION
115.51
MALES / 100 FEMALES
86.57
FEMALES / 100 MALES
47.5
MEDIAN AGE
2.5
AVG FAMILY SIZE
2.1
AVG HOUSEHOLD SIZE
550
LABOR FORCE [ PEOPLE ]
61.9%
PERCENT IN LABOR FORCE
1.6%
UNEMPLOYMENT RATE
Atkins Zip Codes
Atkins Area Codes
Income in Atkins
Income Overview in Atkins
Per Capita Income in Atkins is $28,349, while median incomes of families and households are $44,602 and $43,318 respectively.
| Characteristic | Number | Measure |
| Per Capita Income | 1,028 | $28,349 |
| Median Family Income | 300 | $44,602 |
| Mean Family Income | 300 | $68,992 |
| Median Household Income | 498 | $43,318 |
| Mean Household Income | 498 | $57,070 |
| Income Deficit | 300 | $0 |
| Wage / Income Gap (%) | 1,028 | 24.75% |
| Wage / Income Gap ($) | 1,028 | 75.25¢ per $1 |
| Gini / Inequality Index | 1,028 | 0.40 |
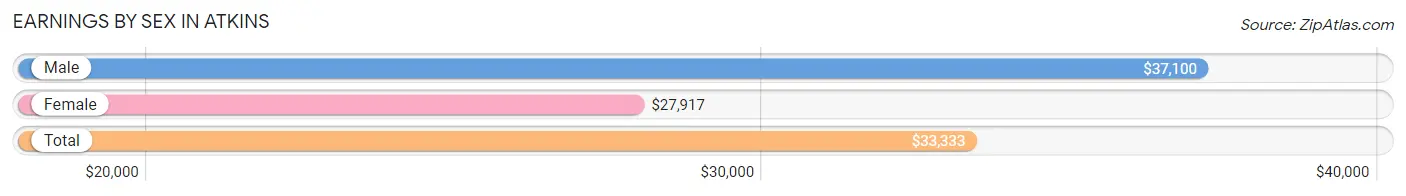
Earnings by Sex in Atkins
Average Earnings in Atkins are $33,333, $37,100 for men and $27,917 for women, a difference of 24.7%.
| Sex | Number | Average Earnings |
| Male | 320 (56.7%) | $37,100 |
| Female | 244 (43.3%) | $27,917 |
| Total | 564 (100.0%) | $33,333 |
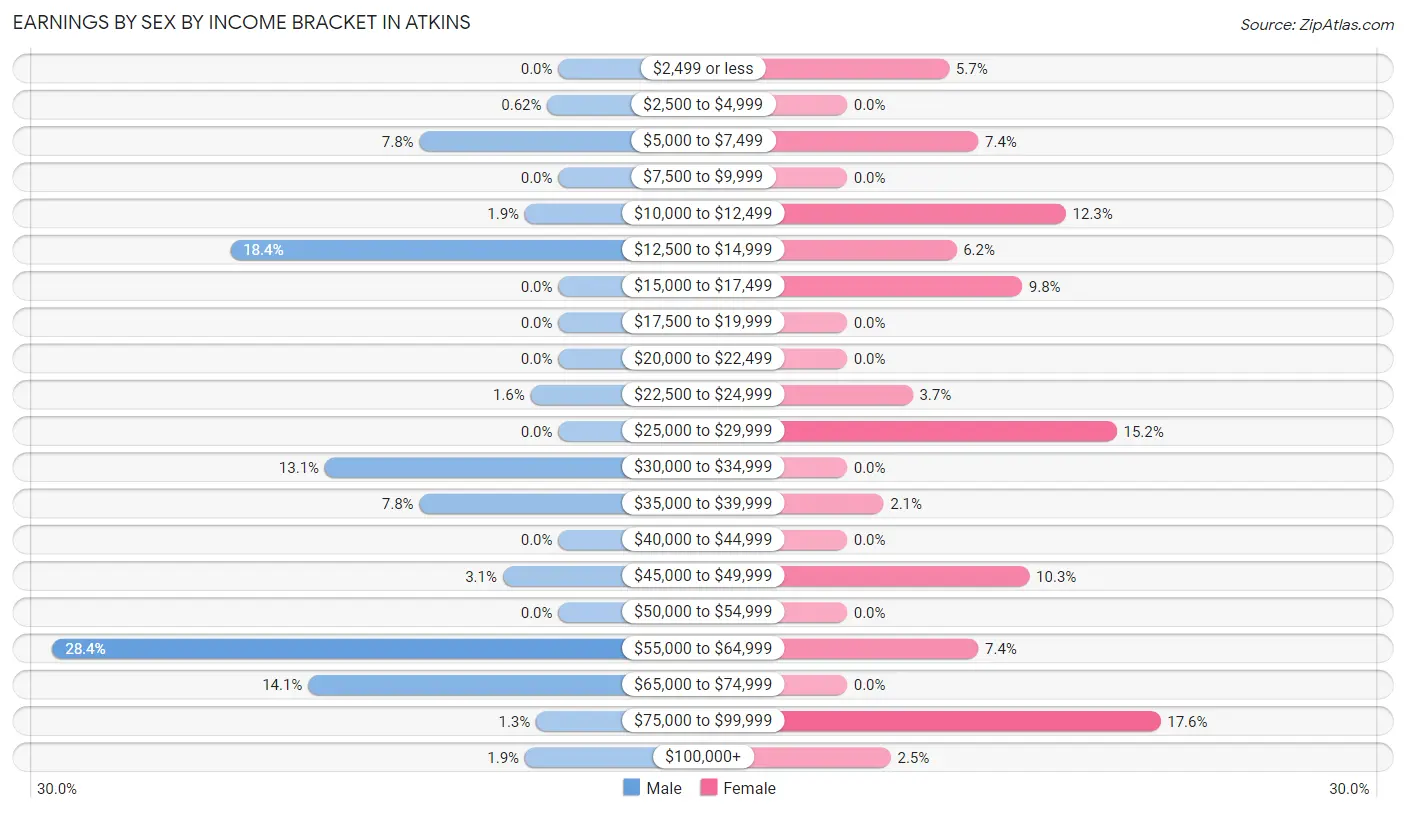
Earnings by Sex by Income Bracket in Atkins
The most common earnings brackets in Atkins are $55,000 to $64,999 for men (91 | 28.4%) and $75,000 to $99,999 for women (43 | 17.6%).
| Income | Male | Female |
| $2,499 or less | 0 (0.0%) | 14 (5.7%) |
| $2,500 to $4,999 | 2 (0.6%) | 0 (0.0%) |
| $5,000 to $7,499 | 25 (7.8%) | 18 (7.4%) |
| $7,500 to $9,999 | 0 (0.0%) | 0 (0.0%) |
| $10,000 to $12,499 | 6 (1.9%) | 30 (12.3%) |
| $12,500 to $14,999 | 59 (18.4%) | 15 (6.1%) |
| $15,000 to $17,499 | 0 (0.0%) | 24 (9.8%) |
| $17,500 to $19,999 | 0 (0.0%) | 0 (0.0%) |
| $20,000 to $22,499 | 0 (0.0%) | 0 (0.0%) |
| $22,500 to $24,999 | 5 (1.6%) | 9 (3.7%) |
| $25,000 to $29,999 | 0 (0.0%) | 37 (15.2%) |
| $30,000 to $34,999 | 42 (13.1%) | 0 (0.0%) |
| $35,000 to $39,999 | 25 (7.8%) | 5 (2.1%) |
| $40,000 to $44,999 | 0 (0.0%) | 0 (0.0%) |
| $45,000 to $49,999 | 10 (3.1%) | 25 (10.2%) |
| $50,000 to $54,999 | 0 (0.0%) | 0 (0.0%) |
| $55,000 to $64,999 | 91 (28.4%) | 18 (7.4%) |
| $65,000 to $74,999 | 45 (14.1%) | 0 (0.0%) |
| $75,000 to $99,999 | 4 (1.3%) | 43 (17.6%) |
| $100,000+ | 6 (1.9%) | 6 (2.5%) |
| Total | 320 (100.0%) | 244 (100.0%) |
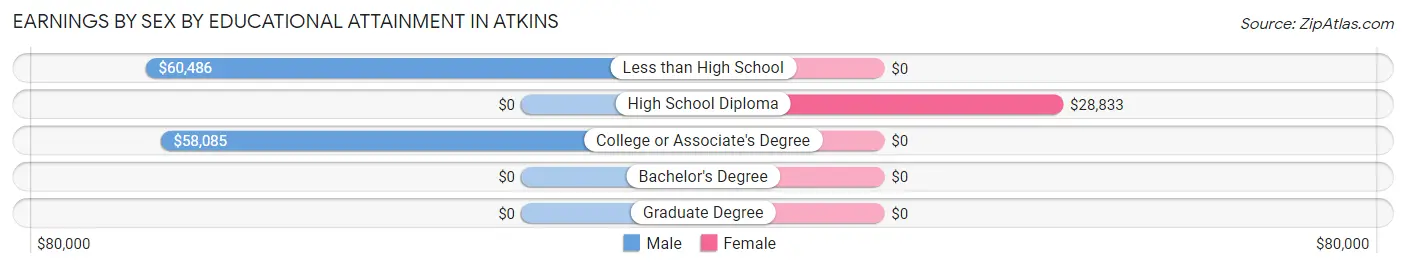
Earnings by Sex by Educational Attainment in Atkins
Average earnings in Atkins are $57,926 for men and $28,208 for women, a difference of 51.3%. Men with an educational attainment of less than high school enjoy the highest average annual earnings of $60,486, while those with college or associate's degree education earn the least with $58,085. Women with an educational attainment of high school diploma earn the most with the average annual earnings of $28,833, while those with high school diploma education have the smallest earnings of $28,833.
| Educational Attainment | Male Income | Female Income |
| Less than High School | $60,486 | $0 |
| High School Diploma | - | - |
| College or Associate's Degree | $58,085 | $0 |
| Bachelor's Degree | - | - |
| Graduate Degree | - | - |
| Total | $57,926 | $28,208 |
Family Income in Atkins
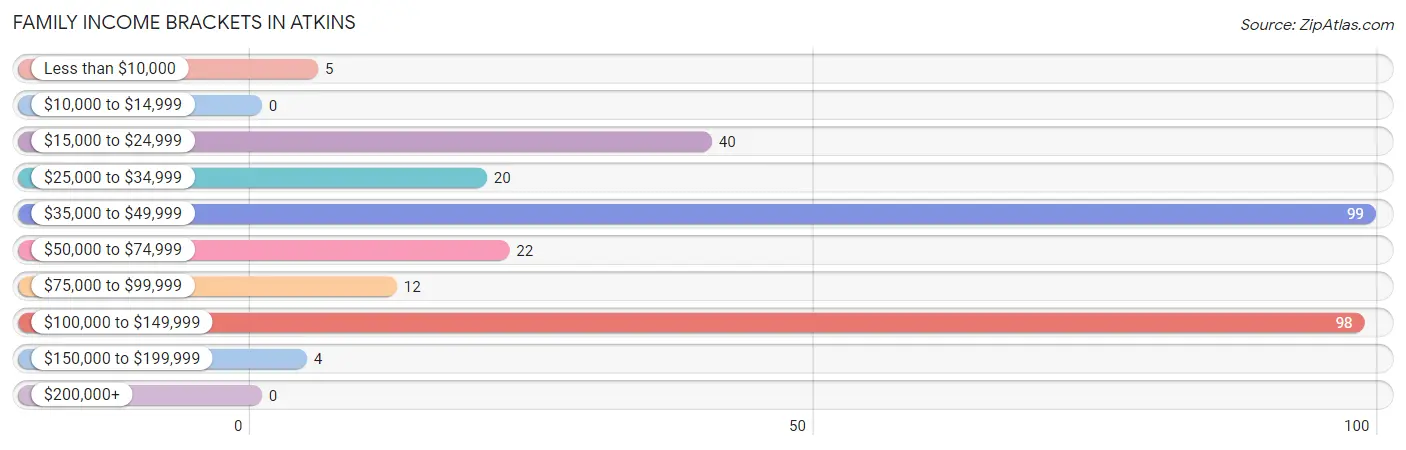
Family Income Brackets in Atkins
According to the Atkins family income data, there are 99 families falling into the $35,000 to $49,999 income range, which is the most common income bracket and makes up 33.0% of all families.
| Income Bracket | # Families | % Families |
| Less than $10,000 | 5 | 1.7% |
| $10,000 to $14,999 | 0 | 0.0% |
| $15,000 to $24,999 | 40 | 13.3% |
| $25,000 to $34,999 | 20 | 6.7% |
| $35,000 to $49,999 | 99 | 33.0% |
| $50,000 to $74,999 | 22 | 7.3% |
| $75,000 to $99,999 | 12 | 4.0% |
| $100,000 to $149,999 | 98 | 32.7% |
| $150,000 to $199,999 | 4 | 1.3% |
| $200,000+ | 0 | 0.0% |
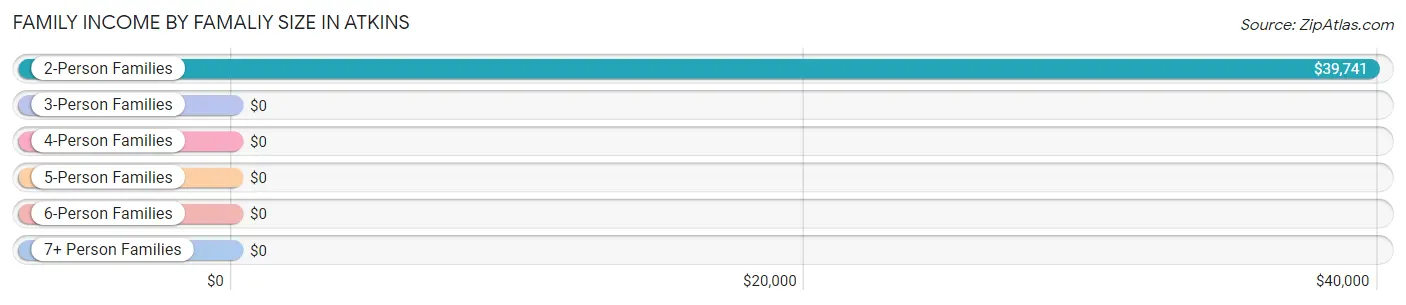
Family Income by Famaliy Size in Atkins
2-person families (220 | 73.3%) account for the highest median family income in Atkins with $39,741 per family, while 2-person families (220 | 73.3%) have the highest median income of $19,870 per family member.
| Income Bracket | # Families | Median Income |
| 2-Person Families | 220 (73.3%) | $39,741 |
| 3-Person Families | 5 (1.7%) | $0 |
| 4-Person Families | 20 (6.7%) | $0 |
| 5-Person Families | 50 (16.7%) | $0 |
| 6-Person Families | 0 (0.0%) | $0 |
| 7+ Person Families | 5 (1.7%) | $0 |
| Total | 300 (100.0%) | $44,602 |
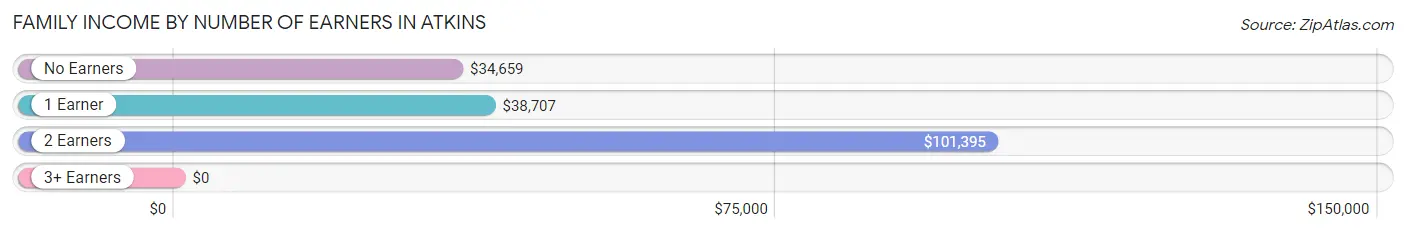
Family Income by Number of Earners in Atkins
| Number of Earners | # Families | Median Income |
| No Earners | 81 (27.0%) | $34,659 |
| 1 Earner | 56 (18.7%) | $38,707 |
| 2 Earners | 156 (52.0%) | $101,395 |
| 3+ Earners | 7 (2.3%) | $0 |
| Total | 300 (100.0%) | $44,602 |
Household Income in Atkins
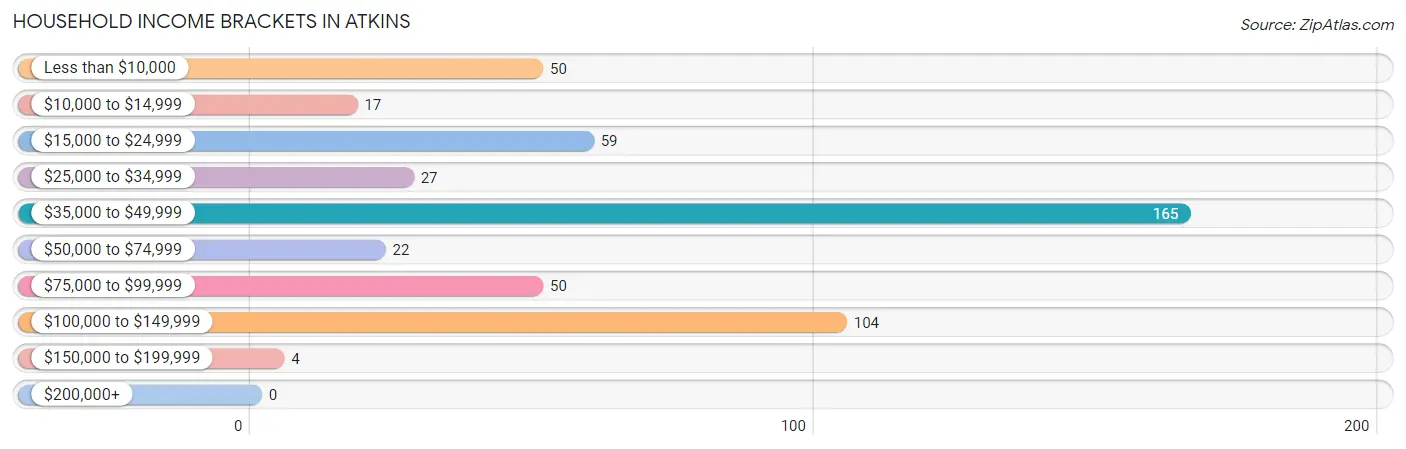
Household Income Brackets in Atkins
With 165 households falling in the category, the $35,000 to $49,999 income range is the most frequent in Atkins, accounting for 33.1% of all households.
| Income Bracket | # Households | % Households |
| Less than $10,000 | 50 | 10.0% |
| $10,000 to $14,999 | 17 | 3.4% |
| $15,000 to $24,999 | 59 | 11.8% |
| $25,000 to $34,999 | 27 | 5.4% |
| $35,000 to $49,999 | 165 | 33.1% |
| $50,000 to $74,999 | 22 | 4.4% |
| $75,000 to $99,999 | 50 | 10.0% |
| $100,000 to $149,999 | 104 | 20.9% |
| $150,000 to $199,999 | 4 | 0.8% |
| $200,000+ | 0 | 0.0% |
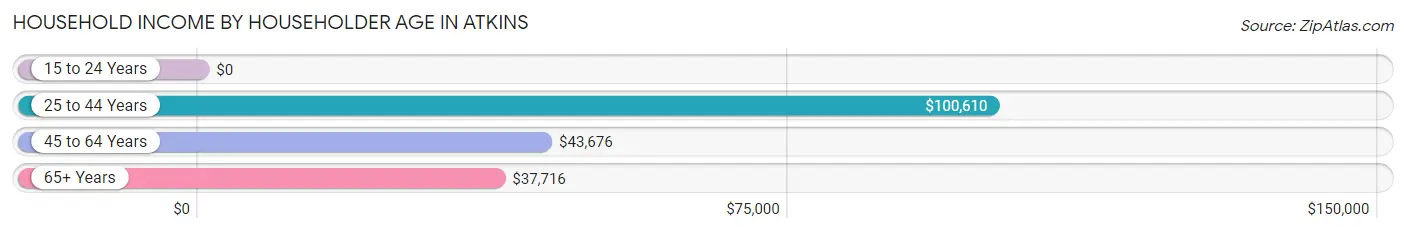
Household Income by Householder Age in Atkins
The median household income in Atkins is $43,318, with the highest median household income of $100,610 found in the 25 to 44 years age bracket for the primary householder. A total of 101 households (20.3%) fall into this category. Meanwhile, the 15 to 24 years age bracket for the primary householder has the lowest median household income of $0, with 50 households (10.0%) in this group.
| Income Bracket | # Households | Median Income |
| 15 to 24 Years | 50 (10.0%) | $0 |
| 25 to 44 Years | 101 (20.3%) | $100,610 |
| 45 to 64 Years | 194 (39.0%) | $43,676 |
| 65+ Years | 153 (30.7%) | $37,716 |
| Total | 498 (100.0%) | $43,318 |
Poverty in Atkins
Income Below Poverty by Sex and Age in Atkins
With 10.3% poverty level for males and 16.1% for females among the residents of Atkins, 55 to 64 year old males and 18 to 24 year old females are the most vulnerable to poverty, with 20 males (74.1%) and 7 females (100.0%) in their respective age groups living below the poverty level.
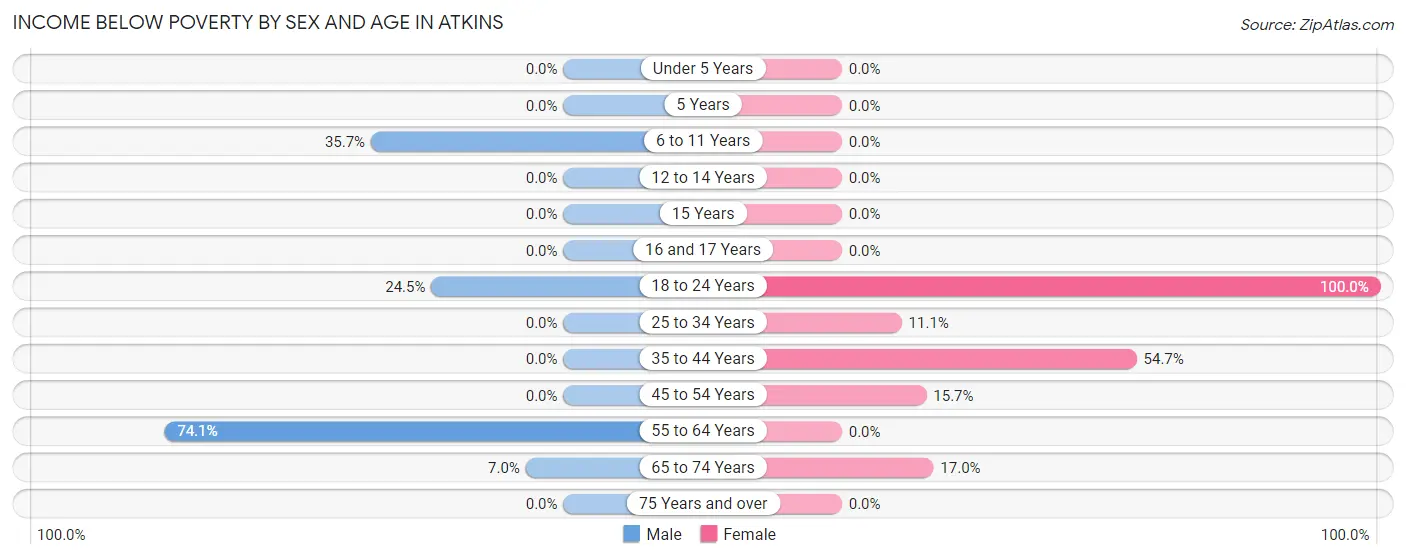
| Age Bracket | Male | Female |
| Under 5 Years | 0 (0.0%) | 0 (0.0%) |
| 5 Years | 0 (0.0%) | 0 (0.0%) |
| 6 to 11 Years | 5 (35.7%) | 0 (0.0%) |
| 12 to 14 Years | 0 (0.0%) | 0 (0.0%) |
| 15 Years | 0 (0.0%) | 0 (0.0%) |
| 16 and 17 Years | 0 (0.0%) | 0 (0.0%) |
| 18 to 24 Years | 25 (24.5%) | 7 (100.0%) |
| 25 to 34 Years | 0 (0.0%) | 5 (11.1%) |
| 35 to 44 Years | 0 (0.0%) | 29 (54.7%) |
| 45 to 54 Years | 0 (0.0%) | 19 (15.7%) |
| 55 to 64 Years | 20 (74.1%) | 0 (0.0%) |
| 65 to 74 Years | 7 (7.0%) | 17 (17.0%) |
| 75 Years and over | 0 (0.0%) | 0 (0.0%) |
| Total | 57 (10.3%) | 77 (16.1%) |
Income Above Poverty by Sex and Age in Atkins
According to the poverty statistics in Atkins, males aged under 5 years and females aged under 5 years are the age groups that are most secure financially, with 100.0% of males and 100.0% of females in these age groups living above the poverty line.
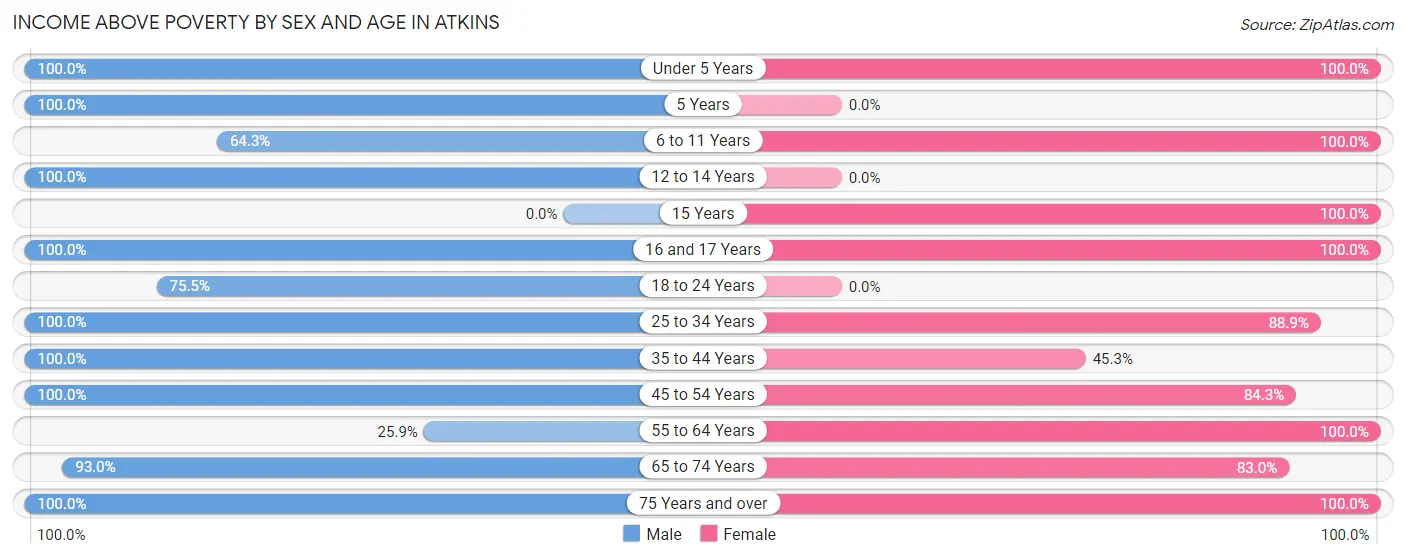
| Age Bracket | Male | Female |
| Under 5 Years | 34 (100.0%) | 5 (100.0%) |
| 5 Years | 12 (100.0%) | 0 (0.0%) |
| 6 to 11 Years | 9 (64.3%) | 36 (100.0%) |
| 12 to 14 Years | 32 (100.0%) | 0 (0.0%) |
| 15 Years | 0 (0.0%) | 6 (100.0%) |
| 16 and 17 Years | 2 (100.0%) | 7 (100.0%) |
| 18 to 24 Years | 77 (75.5%) | 0 (0.0%) |
| 25 to 34 Years | 47 (100.0%) | 40 (88.9%) |
| 35 to 44 Years | 66 (100.0%) | 24 (45.3%) |
| 45 to 54 Years | 109 (100.0%) | 102 (84.3%) |
| 55 to 64 Years | 7 (25.9%) | 60 (100.0%) |
| 65 to 74 Years | 93 (93.0%) | 83 (83.0%) |
| 75 Years and over | 6 (100.0%) | 37 (100.0%) |
| Total | 494 (89.7%) | 400 (83.9%) |
Income Below Poverty Among Married-Couple Families in Atkins
The poverty statistics for married-couple families in Atkins show that 3.1% or 7 of the total 223 families live below the poverty line. Families with no children have the highest poverty rate of 3.7%, comprising of 7 families. On the other hand, families with 1 or 2 children have the lowest poverty rate of 0.0%, which includes 0 families.
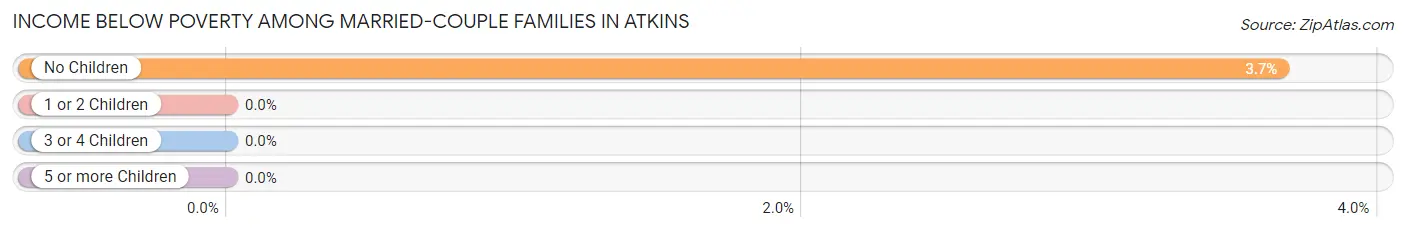
| Children | Above Poverty | Below Poverty |
| No Children | 184 (96.3%) | 7 (3.7%) |
| 1 or 2 Children | 27 (100.0%) | 0 (0.0%) |
| 3 or 4 Children | 5 (100.0%) | 0 (0.0%) |
| 5 or more Children | 0 (0.0%) | 0 (0.0%) |
| Total | 216 (96.9%) | 7 (3.1%) |
Income Below Poverty Among Single-Parent Households in Atkins
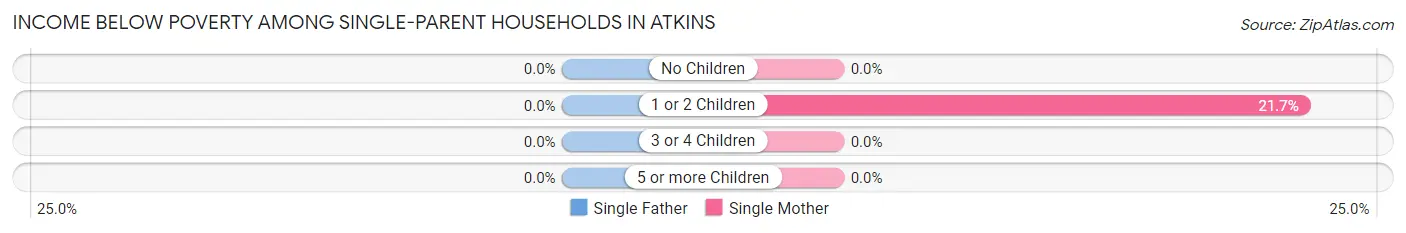
| Children | Single Father | Single Mother |
| No Children | 0 (0.0%) | 0 (0.0%) |
| 1 or 2 Children | 0 (0.0%) | 5 (21.7%) |
| 3 or 4 Children | 0 (0.0%) | 0 (0.0%) |
| 5 or more Children | 0 (0.0%) | 0 (0.0%) |
| Total | 0 (0.0%) | 5 (17.9%) |
Income Below Poverty Among Married-Couple vs Single-Parent Households in Atkins
The poverty data for Atkins shows that 7 of the married-couple family households (3.1%) and 5 of the single-parent households (6.5%) are living below the poverty level. Within the married-couple family households, those with no children have the highest poverty rate, with 7 households (3.7%) falling below the poverty line. Among the single-parent households, those with 1 or 2 children have the highest poverty rate, with 5 household (21.7%) living below poverty.
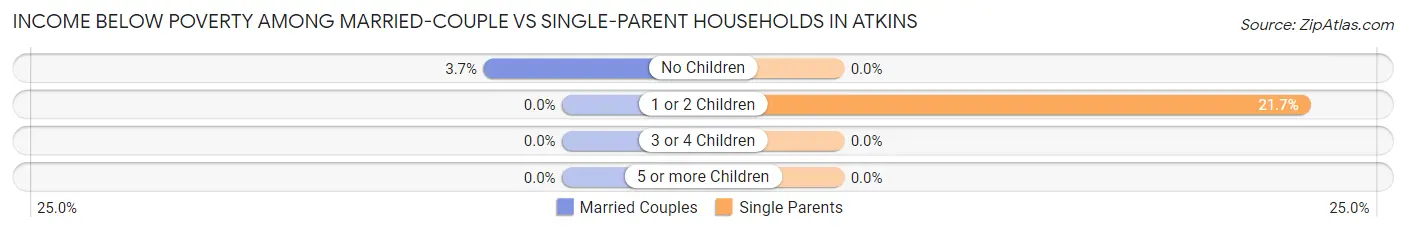
| Children | Married-Couple Families | Single-Parent Households |
| No Children | 7 (3.7%) | 0 (0.0%) |
| 1 or 2 Children | 0 (0.0%) | 5 (21.7%) |
| 3 or 4 Children | 0 (0.0%) | 0 (0.0%) |
| 5 or more Children | 0 (0.0%) | 0 (0.0%) |
| Total | 7 (3.1%) | 5 (6.5%) |
Race in Atkins
The most populous races in Atkins are White / Caucasian (982 | 95.5%), Hispanic or Latino (194 | 18.9%), and Some other Race (25 | 2.4%).
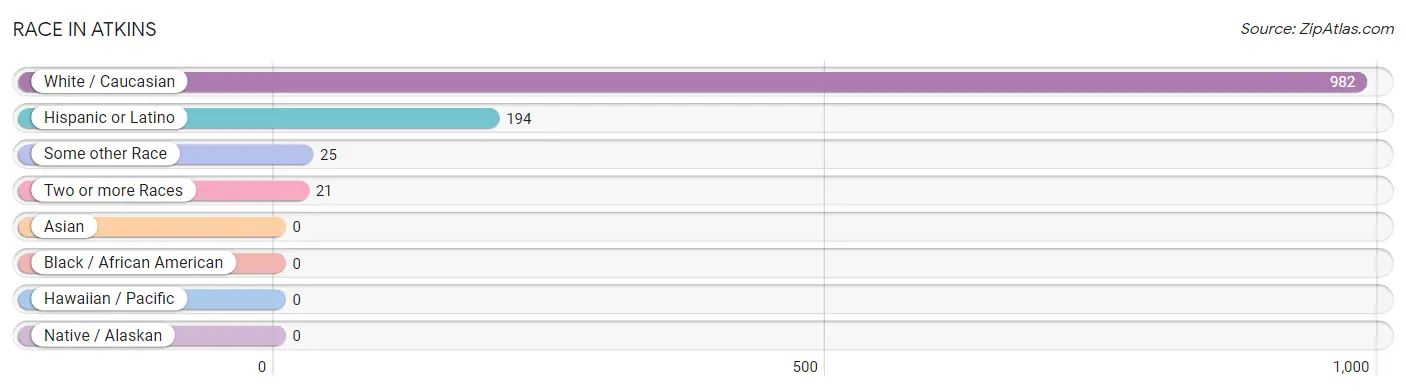
| Race | # Population | % Population |
| Asian | 0 | 0.0% |
| Black / African American | 0 | 0.0% |
| Hawaiian / Pacific | 0 | 0.0% |
| Hispanic or Latino | 194 | 18.9% |
| Native / Alaskan | 0 | 0.0% |
| White / Caucasian | 982 | 95.5% |
| Two or more Races | 21 | 2.0% |
| Some other Race | 25 | 2.4% |
| Total | 1,028 | 100.0% |
Ancestry in Atkins
The most populous ancestries reported in Atkins are American (265 | 25.8%), Mexican (169 | 16.4%), English (78 | 7.6%), German (40 | 3.9%), and Scottish (40 | 3.9%), together accounting for 57.6% of all Atkins residents.
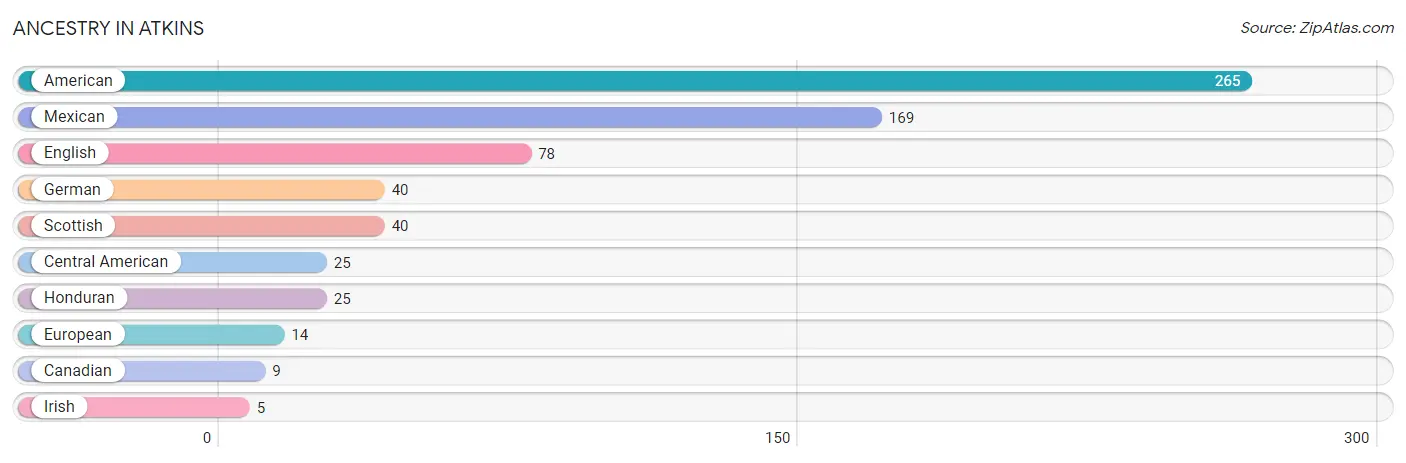
| Ancestry | # Population | % Population |
| American | 265 | 25.8% |
| Canadian | 9 | 0.9% |
| Central American | 25 | 2.4% |
| English | 78 | 7.6% |
| European | 14 | 1.4% |
| German | 40 | 3.9% |
| Honduran | 25 | 2.4% |
| Irish | 5 | 0.5% |
| Mexican | 169 | 16.4% |
| Scottish | 40 | 3.9% | View All 10 Rows |
Immigrants in Atkins
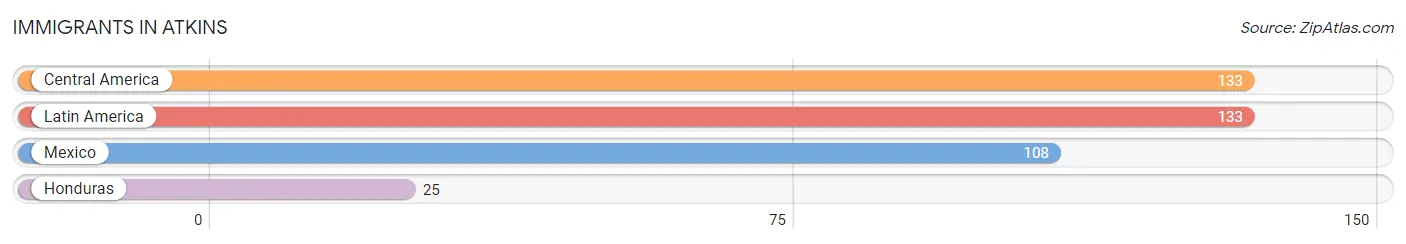
The most numerous immigrant groups reported in Atkins came from Central America (133 | 12.9%), Latin America (133 | 12.9%), Mexico (108 | 10.5%), and Honduras (25 | 2.4%), together accounting for 38.8% of all Atkins residents.
| Immigration Origin | # Population | % Population |
| Central America | 133 | 12.9% |
| Honduras | 25 | 2.4% |
| Latin America | 133 | 12.9% |
| Mexico | 108 | 10.5% | View All 4 Rows |
Sex and Age in Atkins
Sex and Age in Atkins
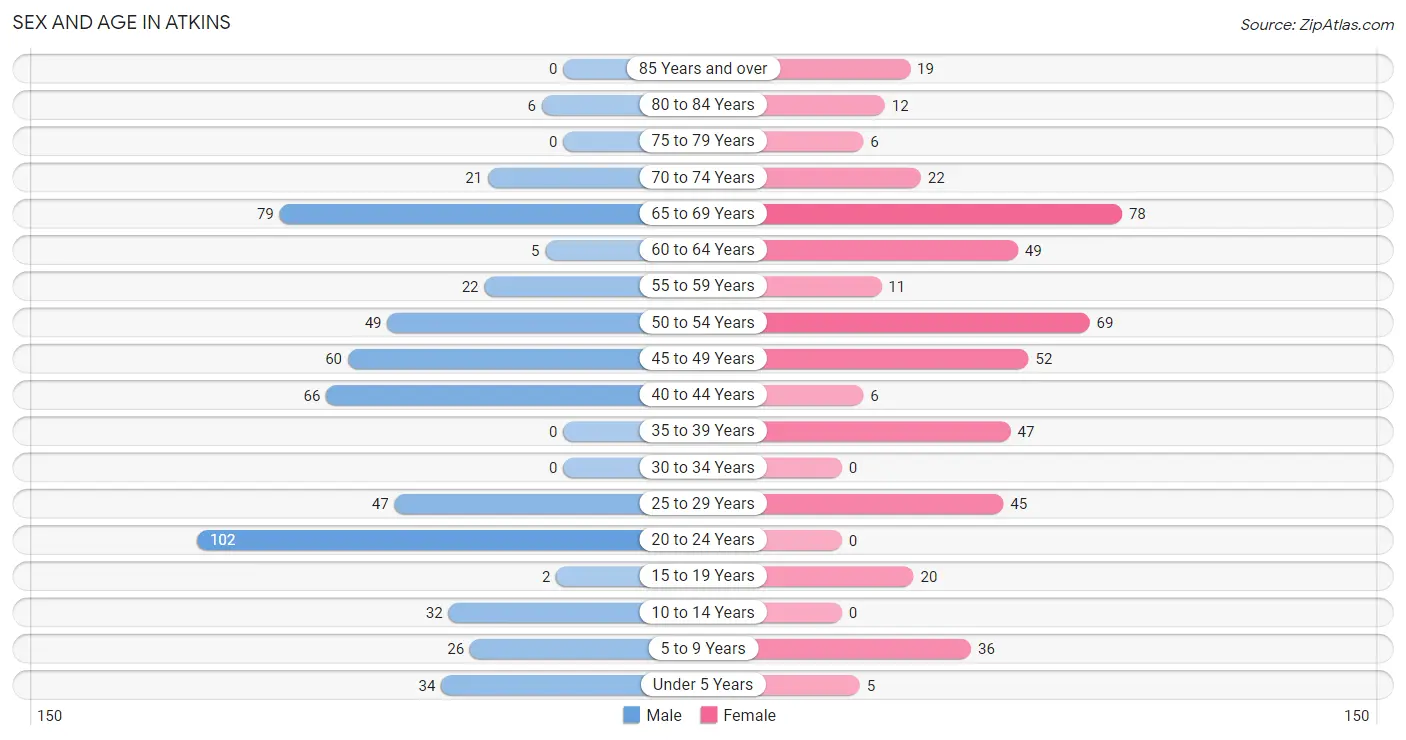
The most populous age groups in Atkins are 20 to 24 Years (102 | 18.5%) for men and 65 to 69 Years (78 | 16.4%) for women.
| Age Bracket | Male | Female |
| Under 5 Years | 34 (6.2%) | 5 (1.1%) |
| 5 to 9 Years | 26 (4.7%) | 36 (7.5%) |
| 10 to 14 Years | 32 (5.8%) | 0 (0.0%) |
| 15 to 19 Years | 2 (0.4%) | 20 (4.2%) |
| 20 to 24 Years | 102 (18.5%) | 0 (0.0%) |
| 25 to 29 Years | 47 (8.5%) | 45 (9.4%) |
| 30 to 34 Years | 0 (0.0%) | 0 (0.0%) |
| 35 to 39 Years | 0 (0.0%) | 47 (9.9%) |
| 40 to 44 Years | 66 (12.0%) | 6 (1.3%) |
| 45 to 49 Years | 60 (10.9%) | 52 (10.9%) |
| 50 to 54 Years | 49 (8.9%) | 69 (14.5%) |
| 55 to 59 Years | 22 (4.0%) | 11 (2.3%) |
| 60 to 64 Years | 5 (0.9%) | 49 (10.3%) |
| 65 to 69 Years | 79 (14.3%) | 78 (16.4%) |
| 70 to 74 Years | 21 (3.8%) | 22 (4.6%) |
| 75 to 79 Years | 0 (0.0%) | 6 (1.3%) |
| 80 to 84 Years | 6 (1.1%) | 12 (2.5%) |
| 85 Years and over | 0 (0.0%) | 19 (4.0%) |
| Total | 551 (100.0%) | 477 (100.0%) |
Families and Households in Atkins
Median Family Size in Atkins
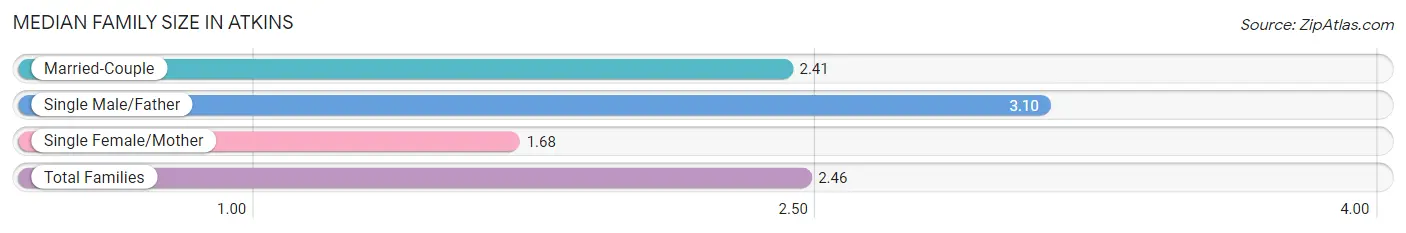
The median family size in Atkins is 2.46 persons per family, with single male/father families (49 | 16.3%) accounting for the largest median family size of 3.1 persons per family. On the other hand, single female/mother families (28 | 9.3%) represent the smallest median family size with 1.68 persons per family.
| Family Type | # Families | Family Size |
| Married-Couple | 223 (74.3%) | 2.41 |
| Single Male/Father | 49 (16.3%) | 3.10 |
| Single Female/Mother | 28 (9.3%) | 1.68 |
| Total Families | 300 (100.0%) | 2.46 |
Median Household Size in Atkins
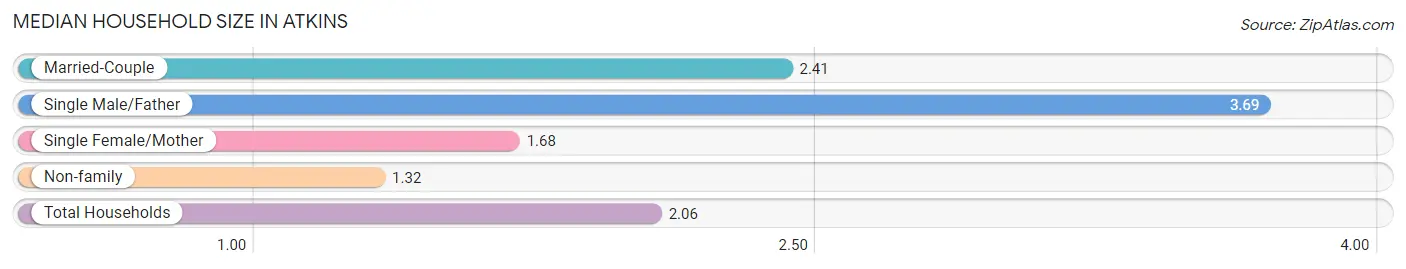
The median household size in Atkins is 2.06 persons per household, with single male/father households (49 | 9.8%) accounting for the largest median household size of 3.69 persons per household. non-family households (198 | 39.8%) represent the smallest median household size with 1.32 persons per household.
| Household Type | # Households | Household Size |
| Married-Couple | 223 (44.8%) | 2.41 |
| Single Male/Father | 49 (9.8%) | 3.69 |
| Single Female/Mother | 28 (5.6%) | 1.68 |
| Non-family | 198 (39.8%) | 1.32 |
| Total Households | 498 (100.0%) | 2.06 |
Household Size by Marriage Status in Atkins
Out of a total of 498 households in Atkins, 300 (60.2%) are family households, while 198 (39.8%) are nonfamily households. The most numerous type of family households are 2-person households, comprising 220, and the most common type of nonfamily households are 1-person households, comprising 157.
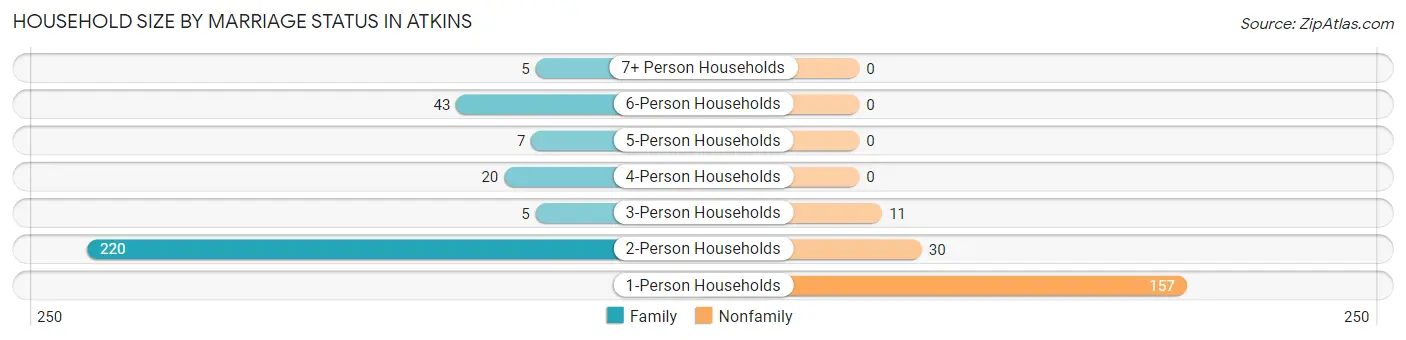
| Household Size | Family Households | Nonfamily Households |
| 1-Person Households | - | 157 (31.5%) |
| 2-Person Households | 220 (44.2%) | 30 (6.0%) |
| 3-Person Households | 5 (1.0%) | 11 (2.2%) |
| 4-Person Households | 20 (4.0%) | 0 (0.0%) |
| 5-Person Households | 7 (1.4%) | 0 (0.0%) |
| 6-Person Households | 43 (8.6%) | 0 (0.0%) |
| 7+ Person Households | 5 (1.0%) | 0 (0.0%) |
| Total | 300 (60.2%) | 198 (39.8%) |
Female Fertility in Atkins
Fertility by Age in Atkins
| Age Bracket | Women with Births | Births / 1,000 Women |
| 15 to 19 years | 0 (0.0%) | 0.0 |
| 20 to 34 years | 0 (0.0%) | 0.0 |
| 35 to 50 years | 0 (0.0%) | 0.0 |
| Total | 0 (0.0%) | 0.0 |
Fertility by Age by Marriage Status in Atkins
| Age Bracket | Married | Unmarried |
| 15 to 19 years | 0 (0.0%) | 0 (0.0%) |
| 20 to 34 years | 0 (0.0%) | 0 (0.0%) |
| 35 to 50 years | 0 (0.0%) | 0 (0.0%) |
| Total | 0 (0.0%) | 0 (0.0%) |
Fertility by Education in Atkins
| Educational Attainment | Women with Births | Births / 1,000 Women |
| Less than High School | 0 (0.0%) | 0.0 |
| High School Diploma | 0 (0.0%) | 0.0 |
| College or Associate's Degree | 0 (0.0%) | 0.0 |
| Bachelor's Degree | 0 (0.0%) | 0.0 |
| Graduate Degree | 0 (0.0%) | 0.0 |
| Total | 0 (0.0%) | 0.0 |
Fertility by Education by Marriage Status in Atkins
| Educational Attainment | Married | Unmarried |
| Less than High School | 0 (0.0%) | 0 (0.0%) |
| High School Diploma | 0 (0.0%) | 0 (0.0%) |
| College or Associate's Degree | 0 (0.0%) | 0 (0.0%) |
| Bachelor's Degree | 0 (0.0%) | 0 (0.0%) |
| Graduate Degree | 0 (0.0%) | 0 (0.0%) |
| Total | 0 (0.0%) | 0 (0.0%) |
Employment Characteristics in Atkins
Employment by Class of Employer in Atkins
Among the 516 employed individuals in Atkins, private company employees (369 | 71.5%), not-for-profit organizations (84 | 16.3%), and self-employed (not incorporated) (39 | 7.6%) make up the most common classes of employment.
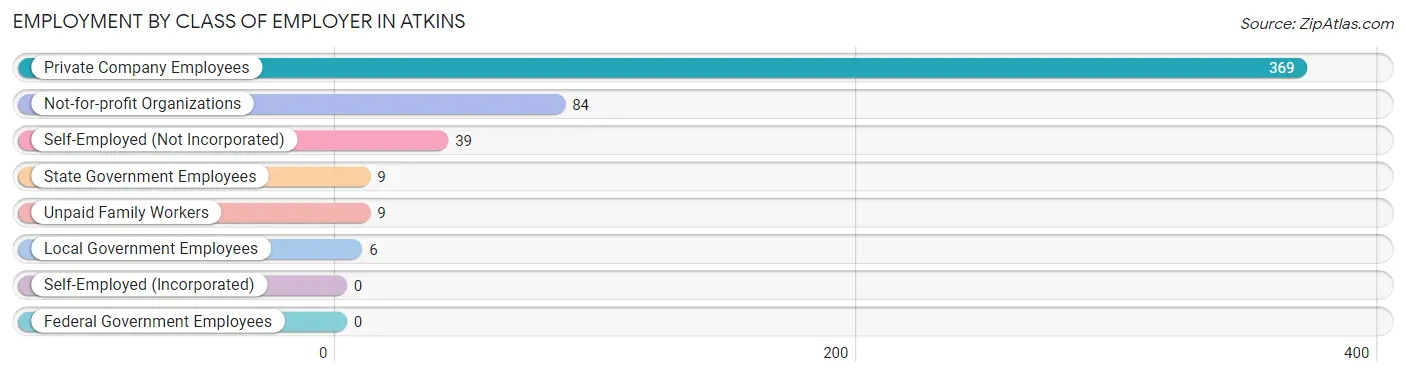
| Employer Class | # Employees | % Employees |
| Private Company Employees | 369 | 71.5% |
| Self-Employed (Incorporated) | 0 | 0.0% |
| Self-Employed (Not Incorporated) | 39 | 7.6% |
| Not-for-profit Organizations | 84 | 16.3% |
| Local Government Employees | 6 | 1.2% |
| State Government Employees | 9 | 1.7% |
| Federal Government Employees | 0 | 0.0% |
| Unpaid Family Workers | 9 | 1.7% |
| Total | 516 | 100.0% |
Employment Status by Age in Atkins
According to the labor force statistics for Atkins, out of the total population over 16 years of age (889), 61.9% or 550 individuals are in the labor force, with 1.6% or 9 of them unemployed. The age group with the highest labor force participation rate is 25 to 29 years, with 100.0% or 92 individuals in the labor force. Within the labor force, the 45 to 54 years age range has the highest percentage of unemployed individuals, with 4.7% or 9 of them being unemployed.
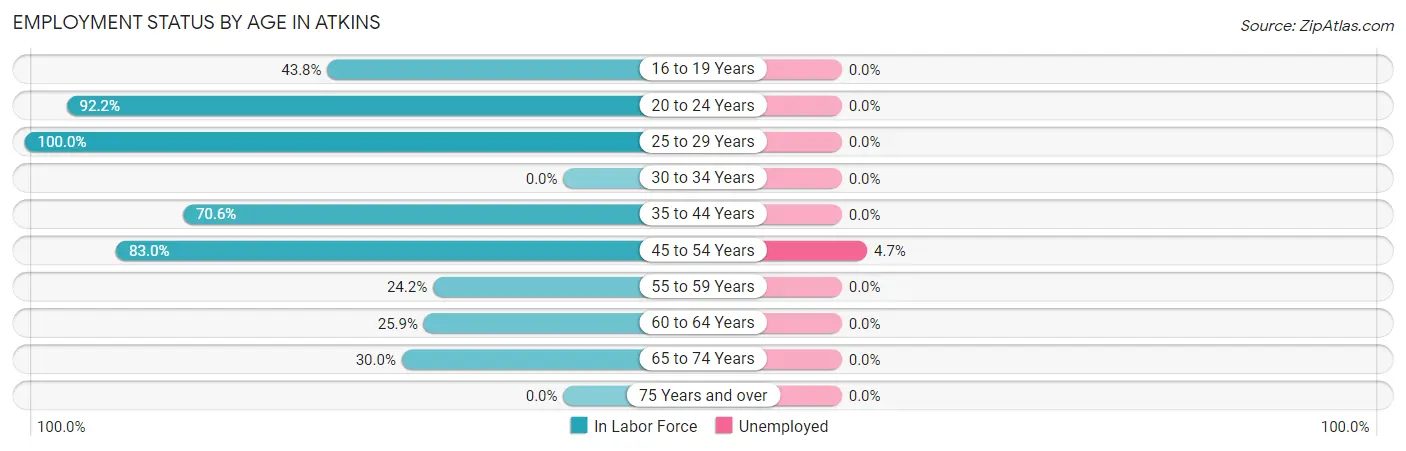
| Age Bracket | In Labor Force | Unemployed |
| 16 to 19 Years | 7 (43.8%) | 0 (0.0%) |
| 20 to 24 Years | 94 (92.2%) | 0 (0.0%) |
| 25 to 29 Years | 92 (100.0%) | 0 (0.0%) |
| 30 to 34 Years | 0 (0.0%) | 0 (0.0%) |
| 35 to 44 Years | 84 (70.6%) | 0 (0.0%) |
| 45 to 54 Years | 191 (83.0%) | 9 (4.7%) |
| 55 to 59 Years | 8 (24.2%) | 0 (0.0%) |
| 60 to 64 Years | 14 (25.9%) | 0 (0.0%) |
| 65 to 74 Years | 60 (30.0%) | 0 (0.0%) |
| 75 Years and over | 0 (0.0%) | 0 (0.0%) |
| Total | 550 (61.9%) | 9 (1.6%) |
Employment Status by Educational Attainment in Atkins
According to labor force statistics for Atkins, 73.7% of individuals (389) out of the total population between 25 and 64 years of age (528) are in the labor force, with 2.3% or 9 of them being unemployed. The group with the highest labor force participation rate are those with the educational attainment of college / associate degree, with 81.7% or 183 individuals in the labor force. Within the labor force, individuals with college / associate degree education have the highest percentage of unemployment, with 4.9% or 9 of them being unemployed.
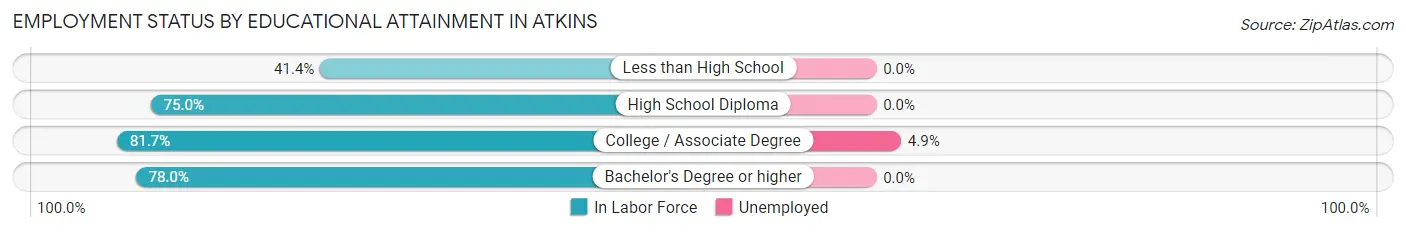
| Educational Attainment | In Labor Force | Unemployed |
| Less than High School | 29 (41.4%) | 0 (0.0%) |
| High School Diploma | 138 (75.0%) | 0 (0.0%) |
| College / Associate Degree | 183 (81.7%) | 11 (4.9%) |
| Bachelor's Degree or higher | 39 (78.0%) | 0 (0.0%) |
| Total | 389 (73.7%) | 12 (2.3%) |
Employment Occupations by Sex in Atkins
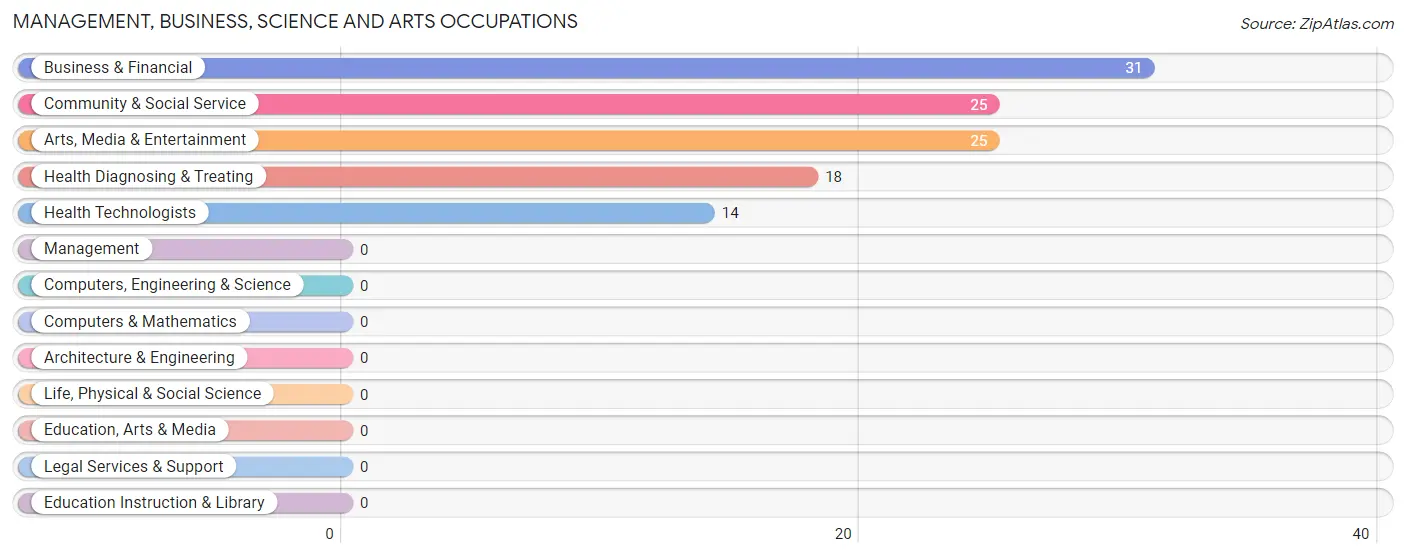
Management, Business, Science and Arts Occupations
The most common Management, Business, Science and Arts occupations in Atkins are Business & Financial (31 | 5.7%), Community & Social Service (25 | 4.6%), Arts, Media & Entertainment (25 | 4.6%), Health Diagnosing & Treating (18 | 3.3%), and Health Technologists (14 | 2.6%).
Management, Business, Science and Arts Occupations by Sex
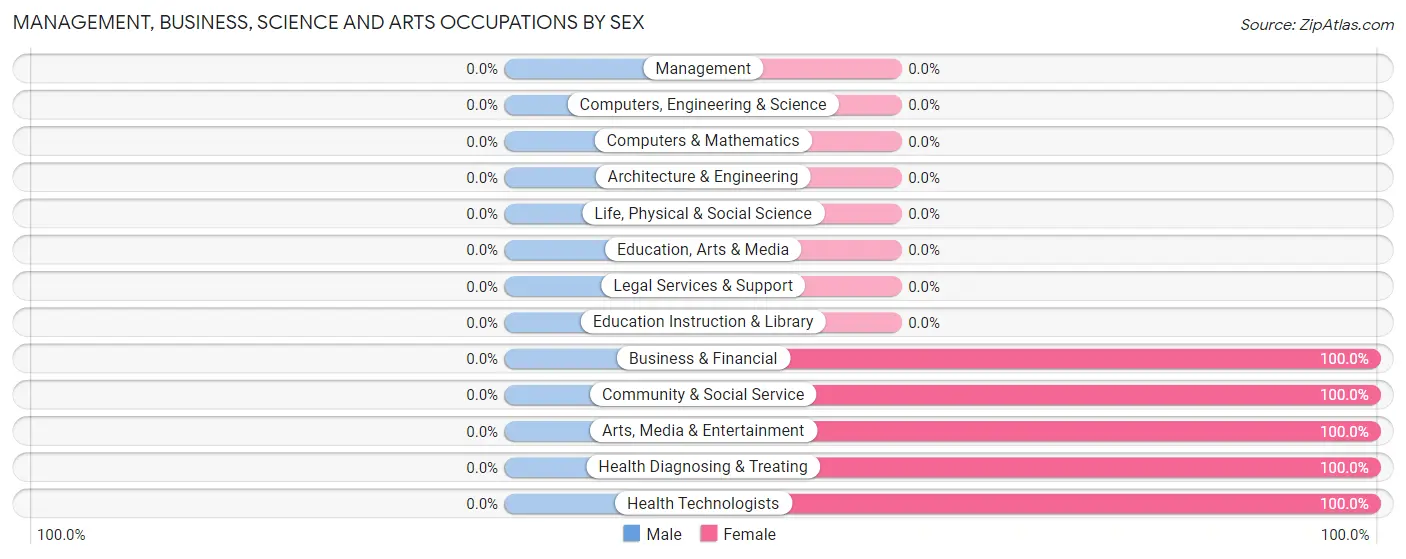
| Occupation | Male | Female |
| Management | 0 (0.0%) | 0 (0.0%) |
| Business & Financial | 0 (0.0%) | 31 (100.0%) |
| Computers, Engineering & Science | 0 (0.0%) | 0 (0.0%) |
| Computers & Mathematics | 0 (0.0%) | 0 (0.0%) |
| Architecture & Engineering | 0 (0.0%) | 0 (0.0%) |
| Life, Physical & Social Science | 0 (0.0%) | 0 (0.0%) |
| Community & Social Service | 0 (0.0%) | 25 (100.0%) |
| Education, Arts & Media | 0 (0.0%) | 0 (0.0%) |
| Legal Services & Support | 0 (0.0%) | 0 (0.0%) |
| Education Instruction & Library | 0 (0.0%) | 0 (0.0%) |
| Arts, Media & Entertainment | 0 (0.0%) | 25 (100.0%) |
| Health Diagnosing & Treating | 0 (0.0%) | 18 (100.0%) |
| Health Technologists | 0 (0.0%) | 14 (100.0%) |
| Total (Category) | 0 (0.0%) | 74 (100.0%) |
| Total (Overall) | 313 (57.9%) | 228 (42.1%) |
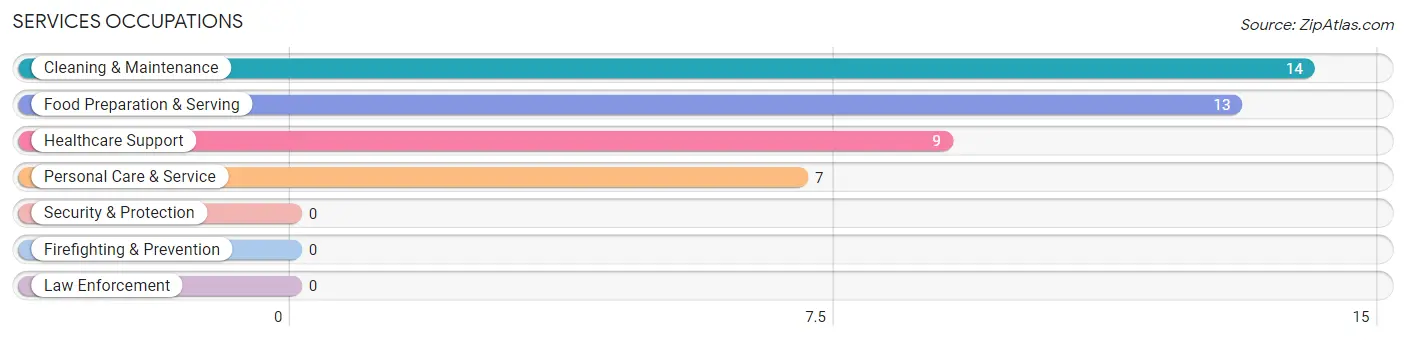
Services Occupations
The most common Services occupations in Atkins are Cleaning & Maintenance (14 | 2.6%), Food Preparation & Serving (13 | 2.4%), Healthcare Support (9 | 1.7%), and Personal Care & Service (7 | 1.3%).
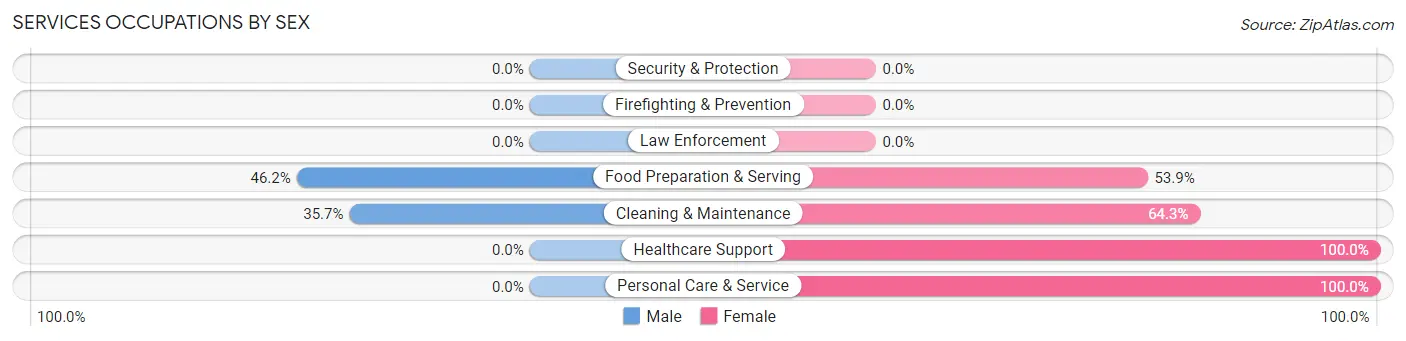
Services Occupations by Sex
Within the Services occupations in Atkins, the most male-oriented occupations are Food Preparation & Serving (46.2%), and Cleaning & Maintenance (35.7%), while the most female-oriented occupations are Healthcare Support (100.0%), Personal Care & Service (100.0%), and Cleaning & Maintenance (64.3%).
| Occupation | Male | Female |
| Healthcare Support | 0 (0.0%) | 9 (100.0%) |
| Security & Protection | 0 (0.0%) | 0 (0.0%) |
| Firefighting & Prevention | 0 (0.0%) | 0 (0.0%) |
| Law Enforcement | 0 (0.0%) | 0 (0.0%) |
| Food Preparation & Serving | 6 (46.2%) | 7 (53.8%) |
| Cleaning & Maintenance | 5 (35.7%) | 9 (64.3%) |
| Personal Care & Service | 0 (0.0%) | 7 (100.0%) |
| Total (Category) | 11 (25.6%) | 32 (74.4%) |
| Total (Overall) | 313 (57.9%) | 228 (42.1%) |
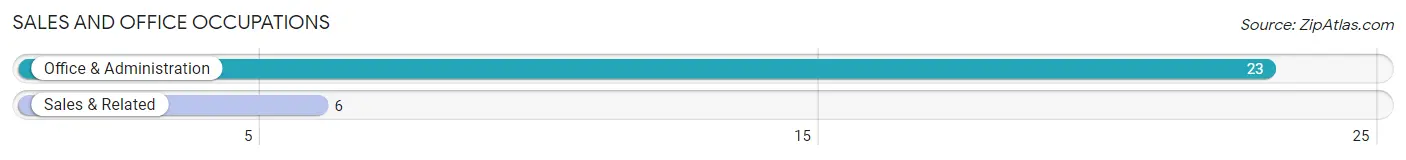
Sales and Office Occupations
The most common Sales and Office occupations in Atkins are Office & Administration (23 | 4.3%), and Sales & Related (6 | 1.1%).
Sales and Office Occupations by Sex
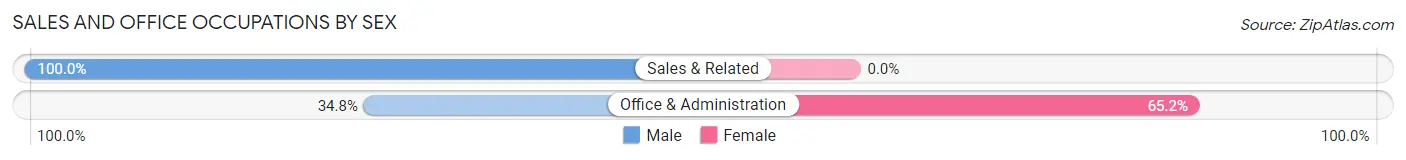
| Occupation | Male | Female |
| Sales & Related | 6 (100.0%) | 0 (0.0%) |
| Office & Administration | 8 (34.8%) | 15 (65.2%) |
| Total (Category) | 14 (48.3%) | 15 (51.7%) |
| Total (Overall) | 313 (57.9%) | 228 (42.1%) |
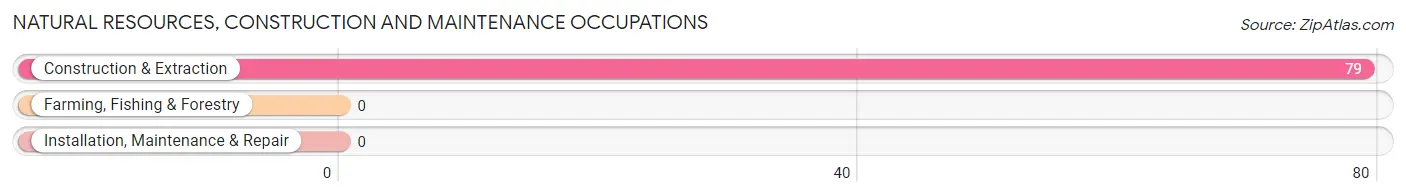
Natural Resources, Construction and Maintenance Occupations
The most common Natural Resources, Construction and Maintenance occupations in Atkins are , and Construction & Extraction (79 | 14.6%).
Natural Resources, Construction and Maintenance Occupations by Sex
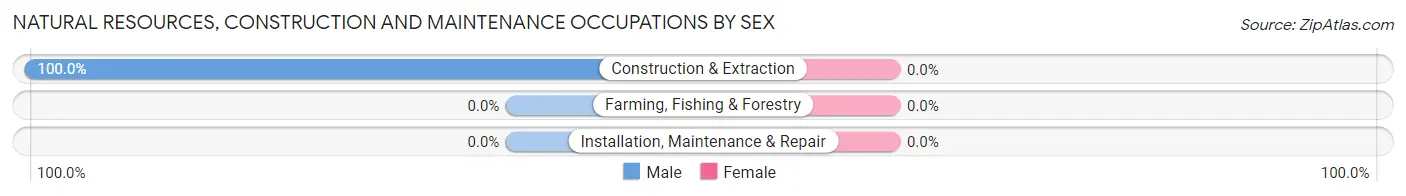
| Occupation | Male | Female |
| Farming, Fishing & Forestry | 0 (0.0%) | 0 (0.0%) |
| Construction & Extraction | 79 (100.0%) | 0 (0.0%) |
| Installation, Maintenance & Repair | 0 (0.0%) | 0 (0.0%) |
| Total (Category) | 79 (100.0%) | 0 (0.0%) |
| Total (Overall) | 313 (57.9%) | 228 (42.1%) |
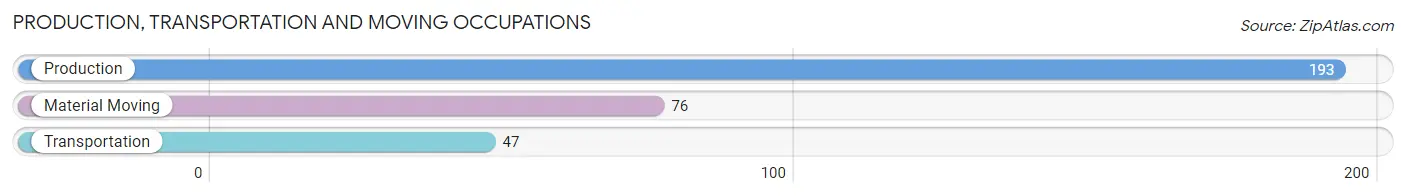
Production, Transportation and Moving Occupations
The most common Production, Transportation and Moving occupations in Atkins are Production (193 | 35.7%), Material Moving (76 | 14.1%), and Transportation (47 | 8.7%).
Production, Transportation and Moving Occupations by Sex
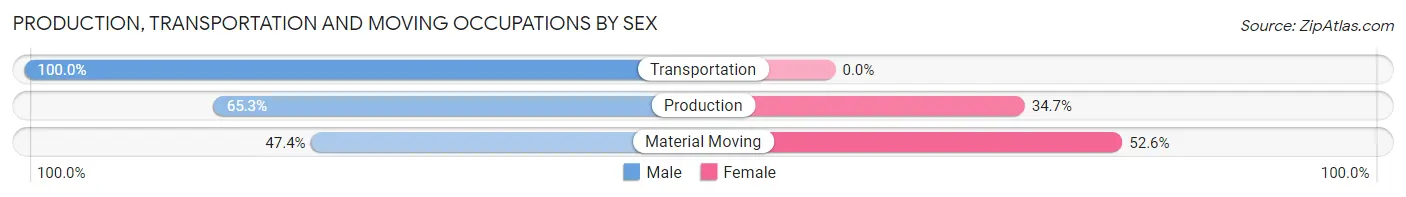
| Occupation | Male | Female |
| Production | 126 (65.3%) | 67 (34.7%) |
| Transportation | 47 (100.0%) | 0 (0.0%) |
| Material Moving | 36 (47.4%) | 40 (52.6%) |
| Total (Category) | 209 (66.1%) | 107 (33.9%) |
| Total (Overall) | 313 (57.9%) | 228 (42.1%) |
Employment Industries by Sex in Atkins
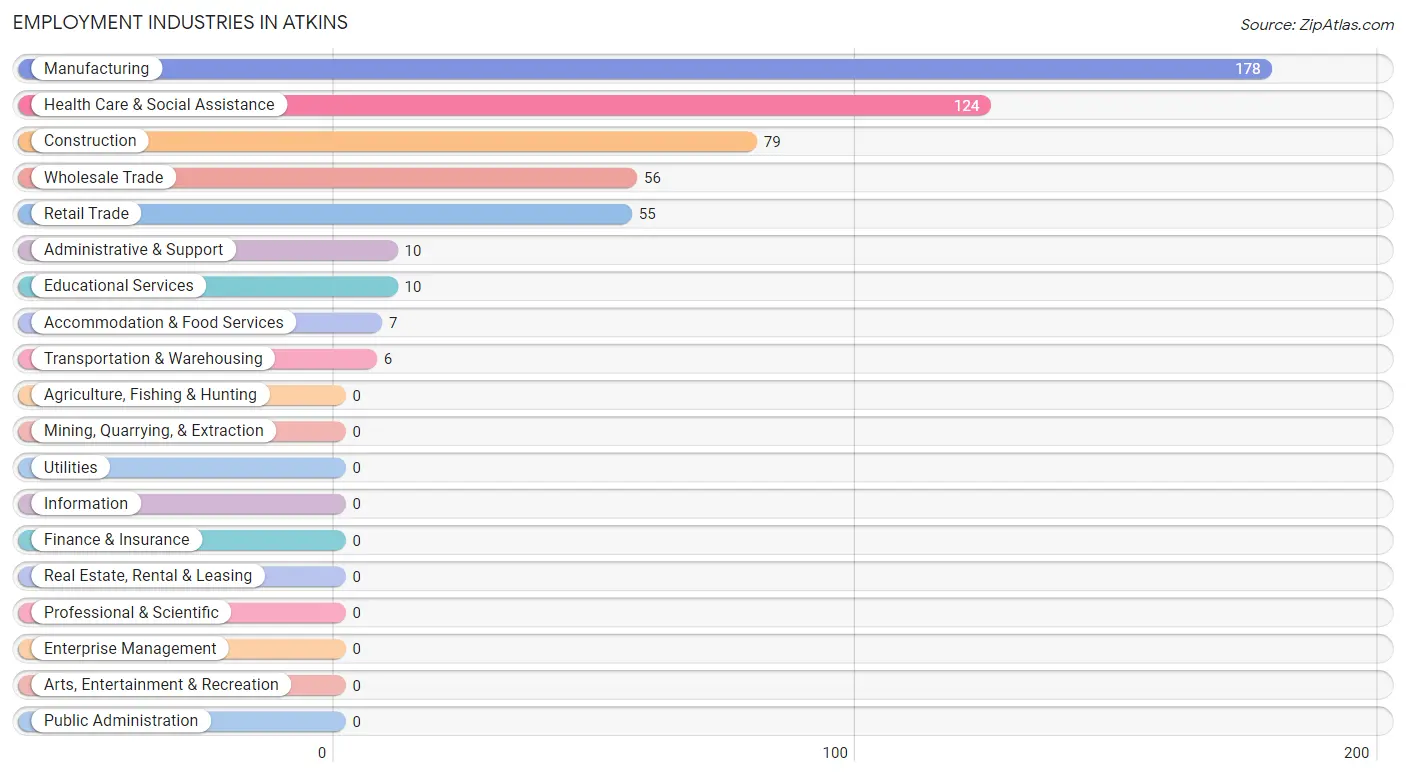
Employment Industries in Atkins
The major employment industries in Atkins include Manufacturing (178 | 32.9%), Health Care & Social Assistance (124 | 22.9%), Construction (79 | 14.6%), Wholesale Trade (56 | 10.3%), and Retail Trade (55 | 10.2%).
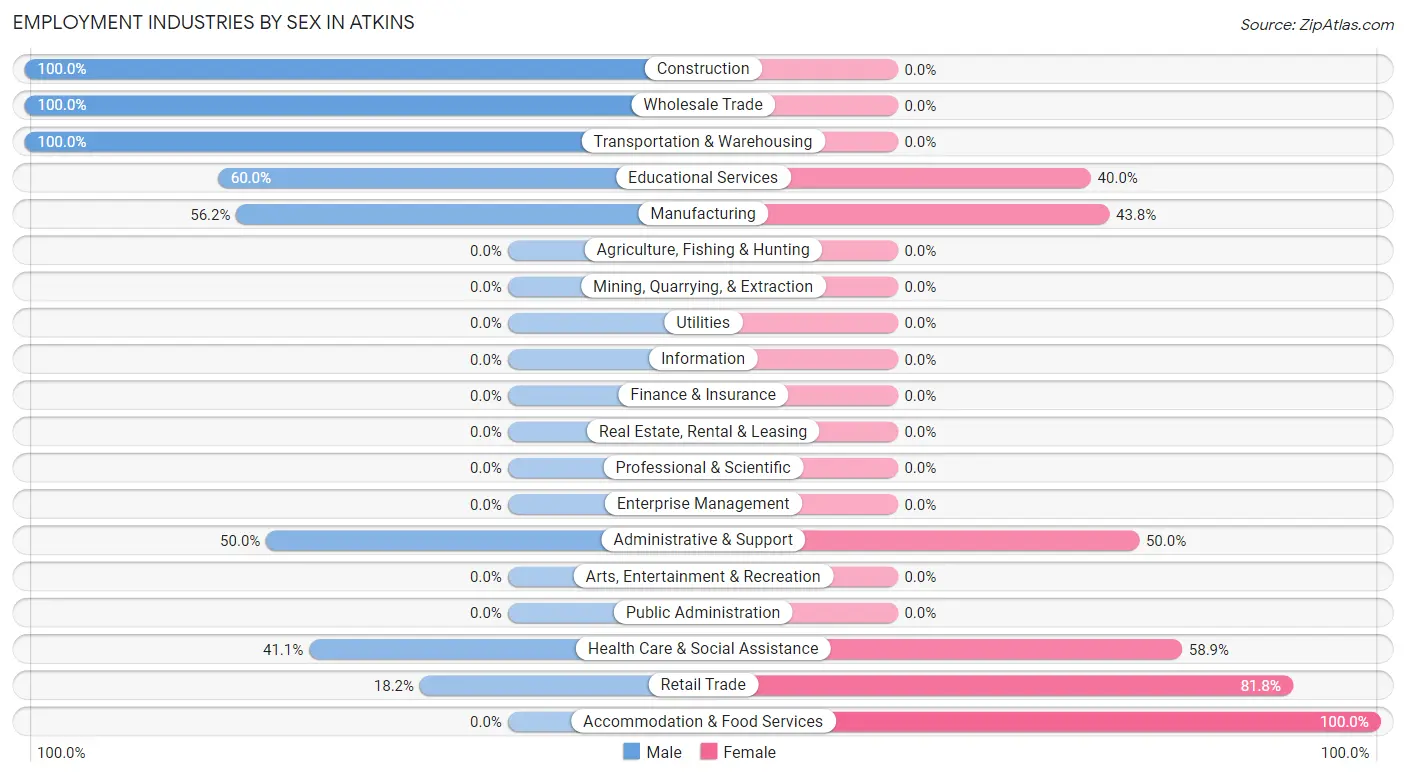
Employment Industries by Sex in Atkins
The Atkins industries that see more men than women are Construction (100.0%), Wholesale Trade (100.0%), and Transportation & Warehousing (100.0%), whereas the industries that tend to have a higher number of women are Accommodation & Food Services (100.0%), Retail Trade (81.8%), and Health Care & Social Assistance (58.9%).
| Industry | Male | Female |
| Agriculture, Fishing & Hunting | 0 (0.0%) | 0 (0.0%) |
| Mining, Quarrying, & Extraction | 0 (0.0%) | 0 (0.0%) |
| Construction | 79 (100.0%) | 0 (0.0%) |
| Manufacturing | 100 (56.2%) | 78 (43.8%) |
| Wholesale Trade | 56 (100.0%) | 0 (0.0%) |
| Retail Trade | 10 (18.2%) | 45 (81.8%) |
| Transportation & Warehousing | 6 (100.0%) | 0 (0.0%) |
| Utilities | 0 (0.0%) | 0 (0.0%) |
| Information | 0 (0.0%) | 0 (0.0%) |
| Finance & Insurance | 0 (0.0%) | 0 (0.0%) |
| Real Estate, Rental & Leasing | 0 (0.0%) | 0 (0.0%) |
| Professional & Scientific | 0 (0.0%) | 0 (0.0%) |
| Enterprise Management | 0 (0.0%) | 0 (0.0%) |
| Administrative & Support | 5 (50.0%) | 5 (50.0%) |
| Educational Services | 6 (60.0%) | 4 (40.0%) |
| Health Care & Social Assistance | 51 (41.1%) | 73 (58.9%) |
| Arts, Entertainment & Recreation | 0 (0.0%) | 0 (0.0%) |
| Accommodation & Food Services | 0 (0.0%) | 7 (100.0%) |
| Public Administration | 0 (0.0%) | 0 (0.0%) |
| Total | 313 (57.9%) | 228 (42.1%) |
Education in Atkins
School Enrollment in Atkins
The most common levels of schooling among the 117 students in Atkins are elementary school (46 | 39.3%), middle school (32 | 27.4%), and college / undergraduate (24 | 20.5%).
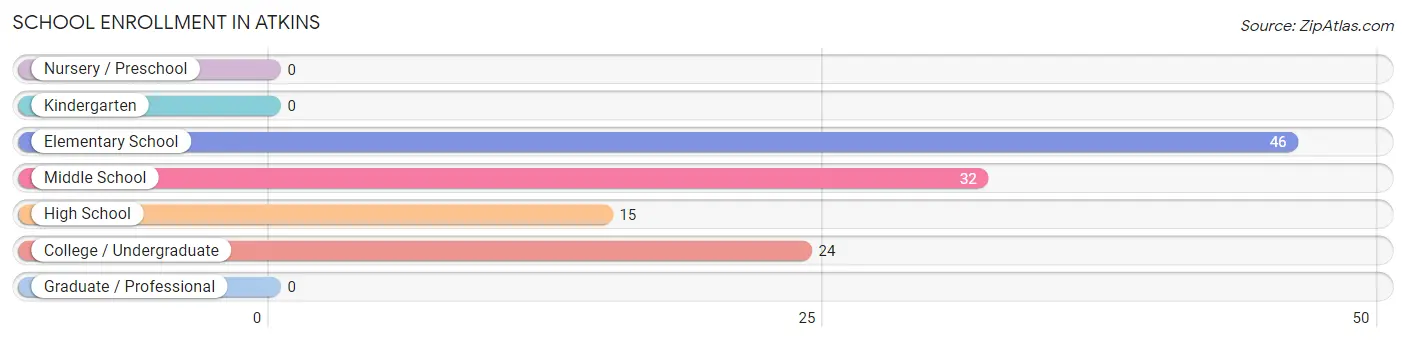
| School Level | # Students | % Students |
| Nursery / Preschool | 0 | 0.0% |
| Kindergarten | 0 | 0.0% |
| Elementary School | 46 | 39.3% |
| Middle School | 32 | 27.4% |
| High School | 15 | 12.8% |
| College / Undergraduate | 24 | 20.5% |
| Graduate / Professional | 0 | 0.0% |
| Total | 117 | 100.0% |
School Enrollment by Age by Funding Source in Atkins
Out of a total of 117 students who are enrolled in schools in Atkins, 6 (5.1%) attend a private institution, while the remaining 111 (94.9%) are enrolled in public schools. The age group of 15 to 17 year olds has the highest likelihood of being enrolled in private schools, with 6 (40.0% in the age bracket) enrolled. Conversely, the age group of 5 to 9 year old has the lowest likelihood of being enrolled in a private school, with 46 (100.0% in the age bracket) attending a public institution.
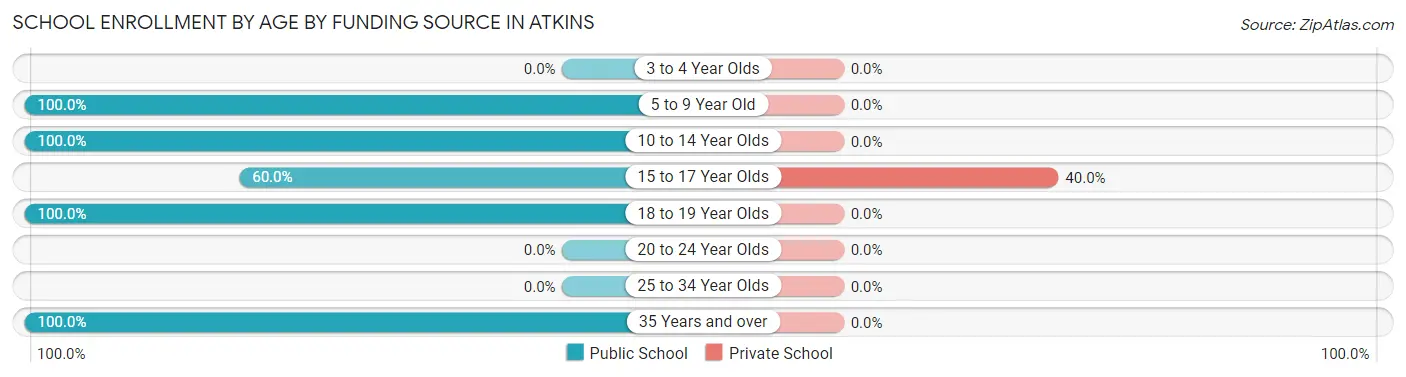
| Age Bracket | Public School | Private School |
| 3 to 4 Year Olds | 0 (0.0%) | 0 (0.0%) |
| 5 to 9 Year Old | 46 (100.0%) | 0 (0.0%) |
| 10 to 14 Year Olds | 32 (100.0%) | 0 (0.0%) |
| 15 to 17 Year Olds | 9 (60.0%) | 6 (40.0%) |
| 18 to 19 Year Olds | 7 (100.0%) | 0 (0.0%) |
| 20 to 24 Year Olds | 0 (0.0%) | 0 (0.0%) |
| 25 to 34 Year Olds | 0 (0.0%) | 0 (0.0%) |
| 35 Years and over | 17 (100.0%) | 0 (0.0%) |
| Total | 111 (94.9%) | 6 (5.1%) |
Educational Attainment by Field of Study in Atkins
Business (17 | 22.1%), psychology (16 | 20.8%), arts & humanities (10 | 13.0%), engineering (9 | 11.7%), and science & technology (6 | 7.8%) are the most common fields of study among 77 individuals in Atkins who have obtained a bachelor's degree or higher.
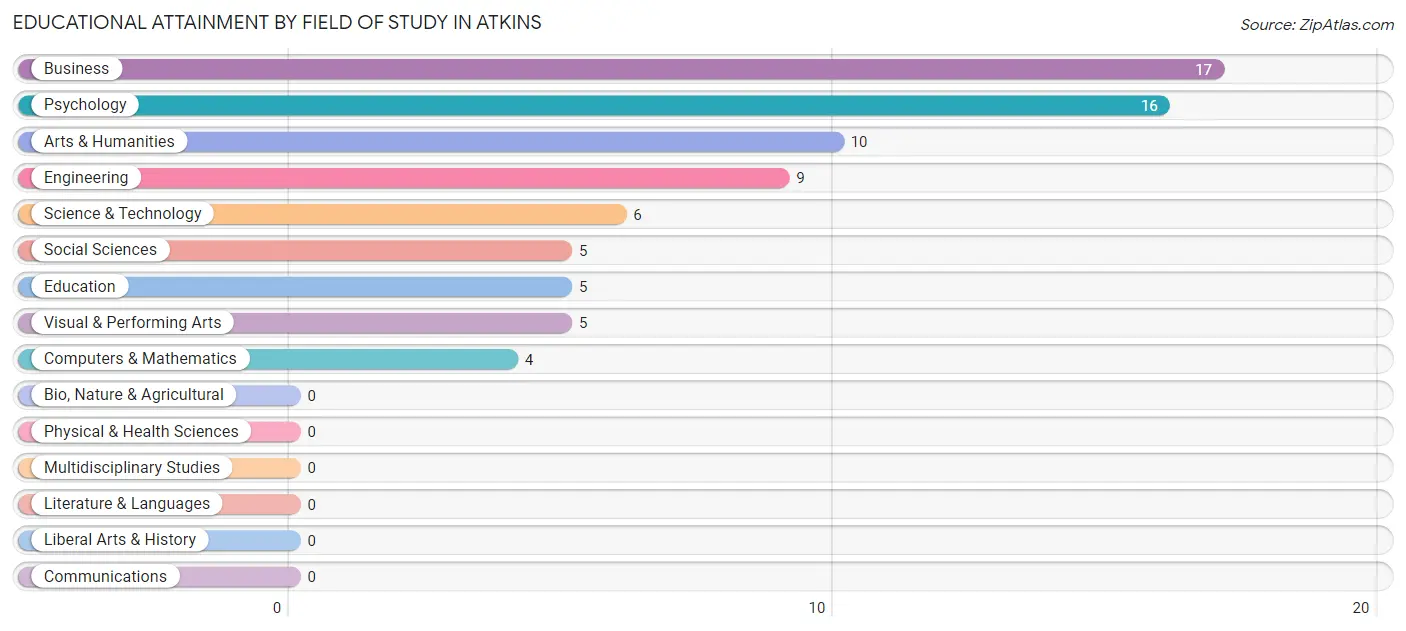
| Field of Study | # Graduates | % Graduates |
| Computers & Mathematics | 4 | 5.2% |
| Bio, Nature & Agricultural | 0 | 0.0% |
| Physical & Health Sciences | 0 | 0.0% |
| Psychology | 16 | 20.8% |
| Social Sciences | 5 | 6.5% |
| Engineering | 9 | 11.7% |
| Multidisciplinary Studies | 0 | 0.0% |
| Science & Technology | 6 | 7.8% |
| Business | 17 | 22.1% |
| Education | 5 | 6.5% |
| Literature & Languages | 0 | 0.0% |
| Liberal Arts & History | 0 | 0.0% |
| Visual & Performing Arts | 5 | 6.5% |
| Communications | 0 | 0.0% |
| Arts & Humanities | 10 | 13.0% |
| Total | 77 | 100.0% |
Transportation & Commute in Atkins
Vehicle Availability by Sex in Atkins
The most prevalent vehicle ownership categories in Atkins are males with 5 or more vehicles (93, accounting for 32.3%) and females with 5 or more vehicles (14, making up 40.8%).
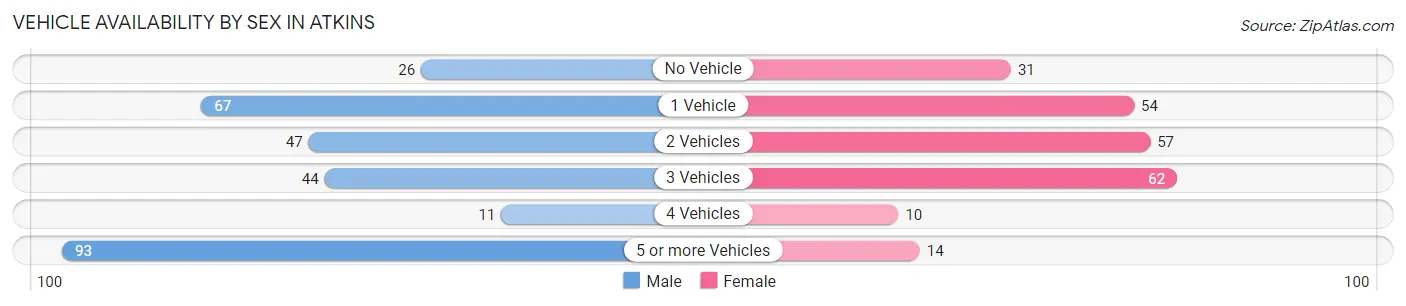
| Vehicles Available | Male | Female |
| No Vehicle | 26 (9.0%) | 31 (13.6%) |
| 1 Vehicle | 67 (23.3%) | 54 (23.7%) |
| 2 Vehicles | 47 (16.3%) | 57 (25.0%) |
| 3 Vehicles | 44 (15.3%) | 62 (27.2%) |
| 4 Vehicles | 11 (3.8%) | 10 (4.4%) |
| 5 or more Vehicles | 93 (32.3%) | 14 (6.1%) |
| Total | 288 (100.0%) | 228 (100.0%) |
Commute Time in Atkins
The most frequently occuring commute durations in Atkins are 5 to 9 minutes (141 commuters, 27.3%), 10 to 14 minutes (109 commuters, 21.1%), and 30 to 34 minutes (63 commuters, 12.2%).
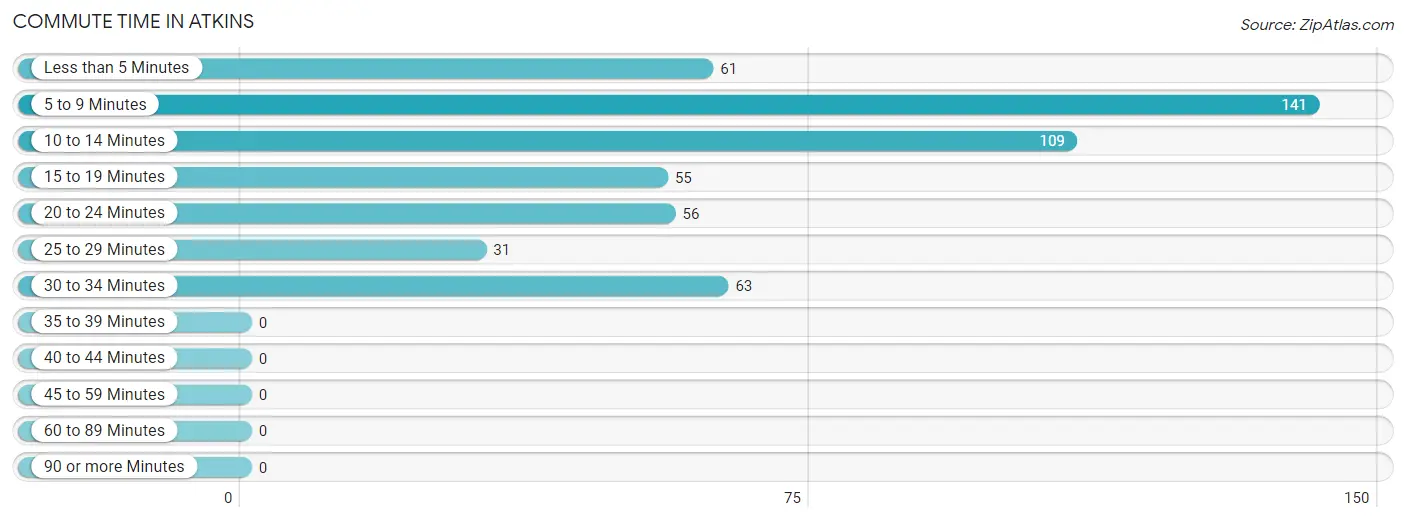
| Commute Time | # Commuters | % Commuters |
| Less than 5 Minutes | 61 | 11.8% |
| 5 to 9 Minutes | 141 | 27.3% |
| 10 to 14 Minutes | 109 | 21.1% |
| 15 to 19 Minutes | 55 | 10.7% |
| 20 to 24 Minutes | 56 | 10.8% |
| 25 to 29 Minutes | 31 | 6.0% |
| 30 to 34 Minutes | 63 | 12.2% |
| 35 to 39 Minutes | 0 | 0.0% |
| 40 to 44 Minutes | 0 | 0.0% |
| 45 to 59 Minutes | 0 | 0.0% |
| 60 to 89 Minutes | 0 | 0.0% |
| 90 or more Minutes | 0 | 0.0% |
Commute Time by Sex in Atkins
The most common commute times in Atkins are 5 to 9 minutes (102 commuters, 35.4%) for males and 10 to 14 minutes (60 commuters, 26.3%) for females.
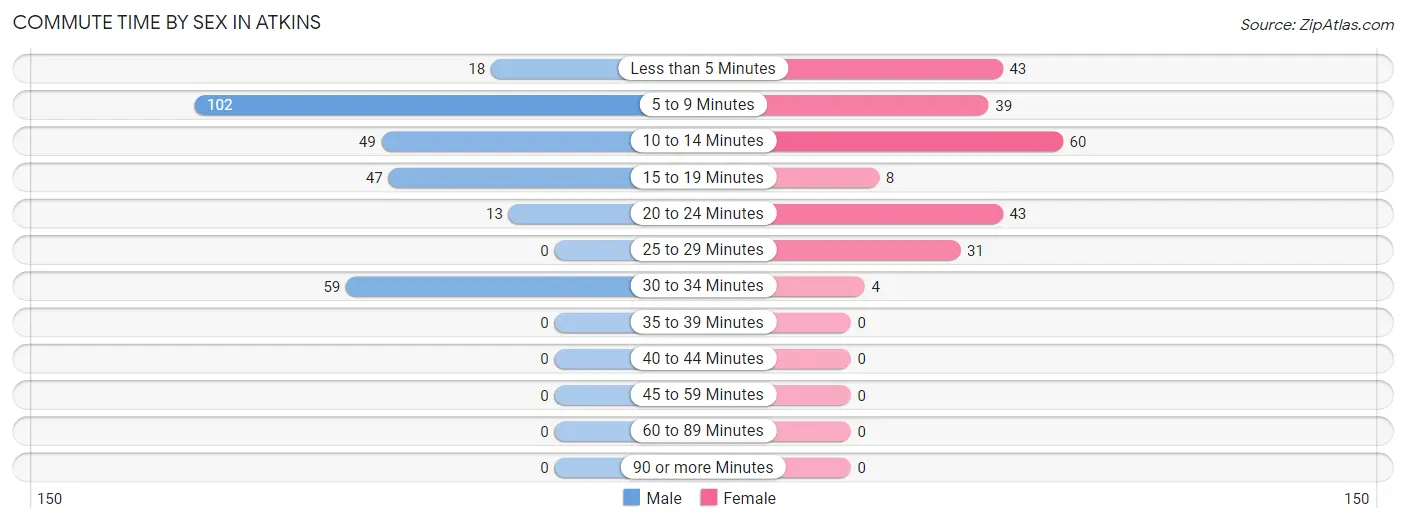
| Commute Time | Male | Female |
| Less than 5 Minutes | 18 (6.2%) | 43 (18.9%) |
| 5 to 9 Minutes | 102 (35.4%) | 39 (17.1%) |
| 10 to 14 Minutes | 49 (17.0%) | 60 (26.3%) |
| 15 to 19 Minutes | 47 (16.3%) | 8 (3.5%) |
| 20 to 24 Minutes | 13 (4.5%) | 43 (18.9%) |
| 25 to 29 Minutes | 0 (0.0%) | 31 (13.6%) |
| 30 to 34 Minutes | 59 (20.5%) | 4 (1.8%) |
| 35 to 39 Minutes | 0 (0.0%) | 0 (0.0%) |
| 40 to 44 Minutes | 0 (0.0%) | 0 (0.0%) |
| 45 to 59 Minutes | 0 (0.0%) | 0 (0.0%) |
| 60 to 89 Minutes | 0 (0.0%) | 0 (0.0%) |
| 90 or more Minutes | 0 (0.0%) | 0 (0.0%) |
Time of Departure to Work by Sex in Atkins
The most frequent times of departure to work in Atkins are 7:00 AM to 7:29 AM (52, 18.1%) for males and 8:00 AM to 8:29 AM (73, 32.0%) for females.
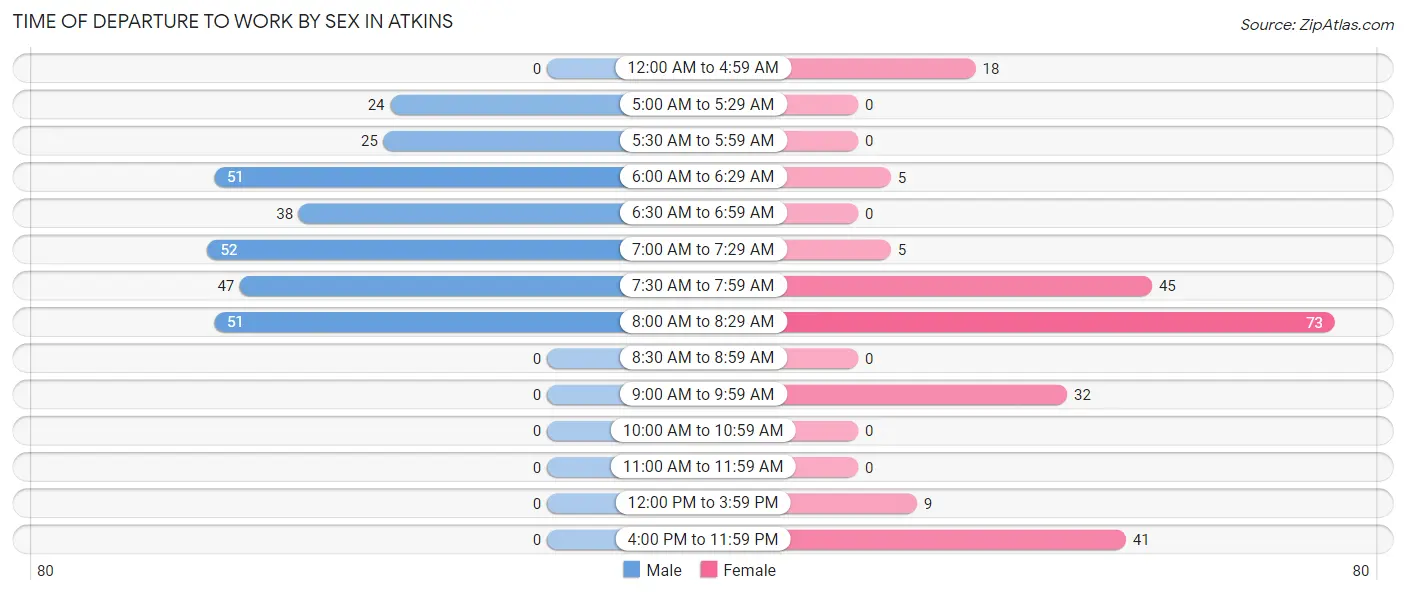
| Time of Departure | Male | Female |
| 12:00 AM to 4:59 AM | 0 (0.0%) | 18 (7.9%) |
| 5:00 AM to 5:29 AM | 24 (8.3%) | 0 (0.0%) |
| 5:30 AM to 5:59 AM | 25 (8.7%) | 0 (0.0%) |
| 6:00 AM to 6:29 AM | 51 (17.7%) | 5 (2.2%) |
| 6:30 AM to 6:59 AM | 38 (13.2%) | 0 (0.0%) |
| 7:00 AM to 7:29 AM | 52 (18.1%) | 5 (2.2%) |
| 7:30 AM to 7:59 AM | 47 (16.3%) | 45 (19.7%) |
| 8:00 AM to 8:29 AM | 51 (17.7%) | 73 (32.0%) |
| 8:30 AM to 8:59 AM | 0 (0.0%) | 0 (0.0%) |
| 9:00 AM to 9:59 AM | 0 (0.0%) | 32 (14.0%) |
| 10:00 AM to 10:59 AM | 0 (0.0%) | 0 (0.0%) |
| 11:00 AM to 11:59 AM | 0 (0.0%) | 0 (0.0%) |
| 12:00 PM to 3:59 PM | 0 (0.0%) | 9 (4.0%) |
| 4:00 PM to 11:59 PM | 0 (0.0%) | 41 (18.0%) |
| Total | 288 (100.0%) | 228 (100.0%) |
Housing Occupancy in Atkins
Occupancy by Ownership in Atkins
Of the total 498 dwellings in Atkins, owner-occupied units account for 323 (64.9%), while renter-occupied units make up 175 (35.1%).
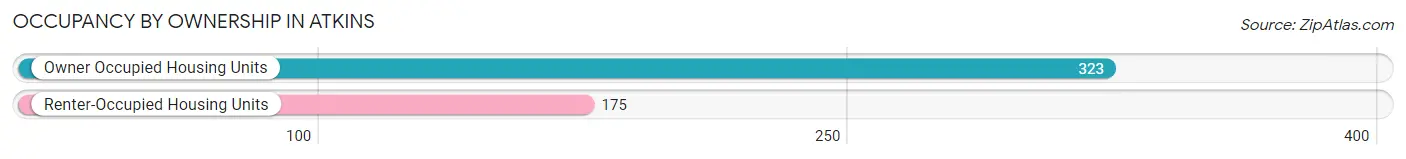
| Occupancy | # Housing Units | % Housing Units |
| Owner Occupied Housing Units | 323 | 64.9% |
| Renter-Occupied Housing Units | 175 | 35.1% |
| Total Occupied Housing Units | 498 | 100.0% |
Occupancy by Household Size in Atkins
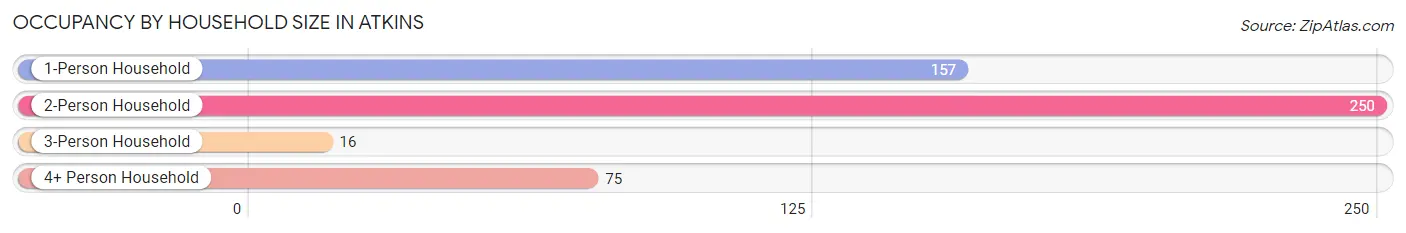
| Household Size | # Housing Units | % Housing Units |
| 1-Person Household | 157 | 31.5% |
| 2-Person Household | 250 | 50.2% |
| 3-Person Household | 16 | 3.2% |
| 4+ Person Household | 75 | 15.1% |
| Total Housing Units | 498 | 100.0% |
Occupancy by Ownership by Household Size in Atkins
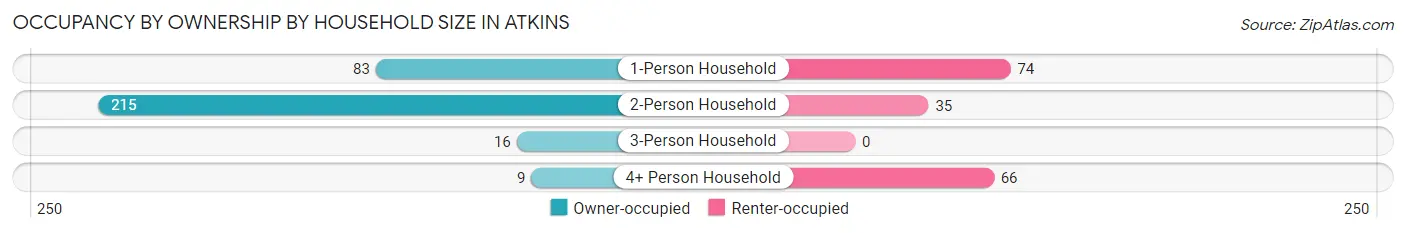
| Household Size | Owner-occupied | Renter-occupied |
| 1-Person Household | 83 (52.9%) | 74 (47.1%) |
| 2-Person Household | 215 (86.0%) | 35 (14.0%) |
| 3-Person Household | 16 (100.0%) | 0 (0.0%) |
| 4+ Person Household | 9 (12.0%) | 66 (88.0%) |
| Total Housing Units | 323 (64.9%) | 175 (35.1%) |
Occupancy by Educational Attainment in Atkins
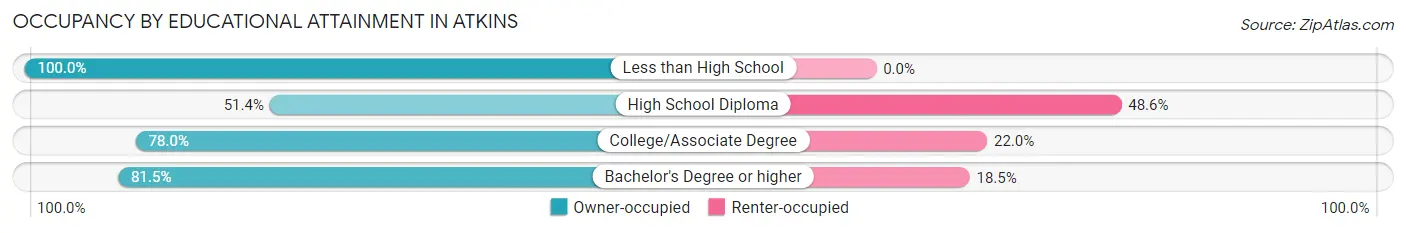
| Household Size | Owner-occupied | Renter-occupied |
| Less than High School | 44 (100.0%) | 0 (0.0%) |
| High School Diploma | 147 (51.4%) | 139 (48.6%) |
| College/Associate Degree | 110 (78.0%) | 31 (22.0%) |
| Bachelor's Degree or higher | 22 (81.5%) | 5 (18.5%) |
Occupancy by Age of Householder in Atkins
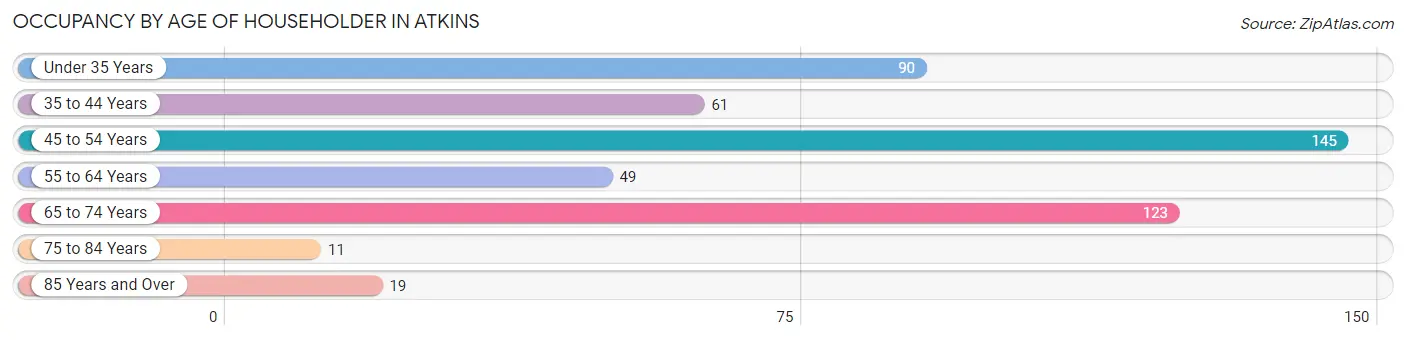
| Age Bracket | # Households | % Households |
| Under 35 Years | 90 | 18.1% |
| 35 to 44 Years | 61 | 12.2% |
| 45 to 54 Years | 145 | 29.1% |
| 55 to 64 Years | 49 | 9.8% |
| 65 to 74 Years | 123 | 24.7% |
| 75 to 84 Years | 11 | 2.2% |
| 85 Years and Over | 19 | 3.8% |
| Total | 498 | 100.0% |
Housing Finances in Atkins
Median Income by Occupancy in Atkins
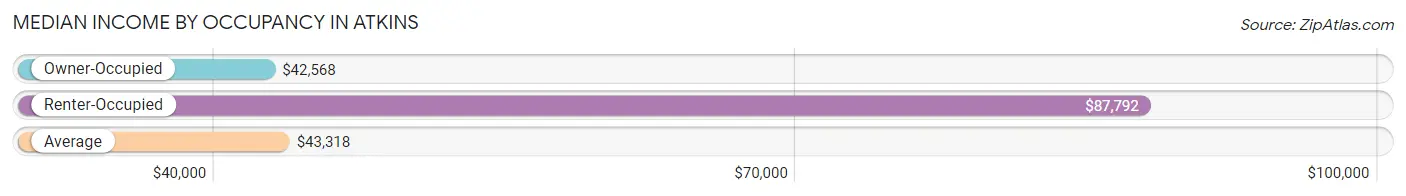
| Occupancy Type | # Households | Median Income |
| Owner-Occupied | 323 (64.9%) | $42,568 |
| Renter-Occupied | 175 (35.1%) | $87,792 |
| Average | 498 (100.0%) | $43,318 |
Occupancy by Householder Income Bracket in Atkins
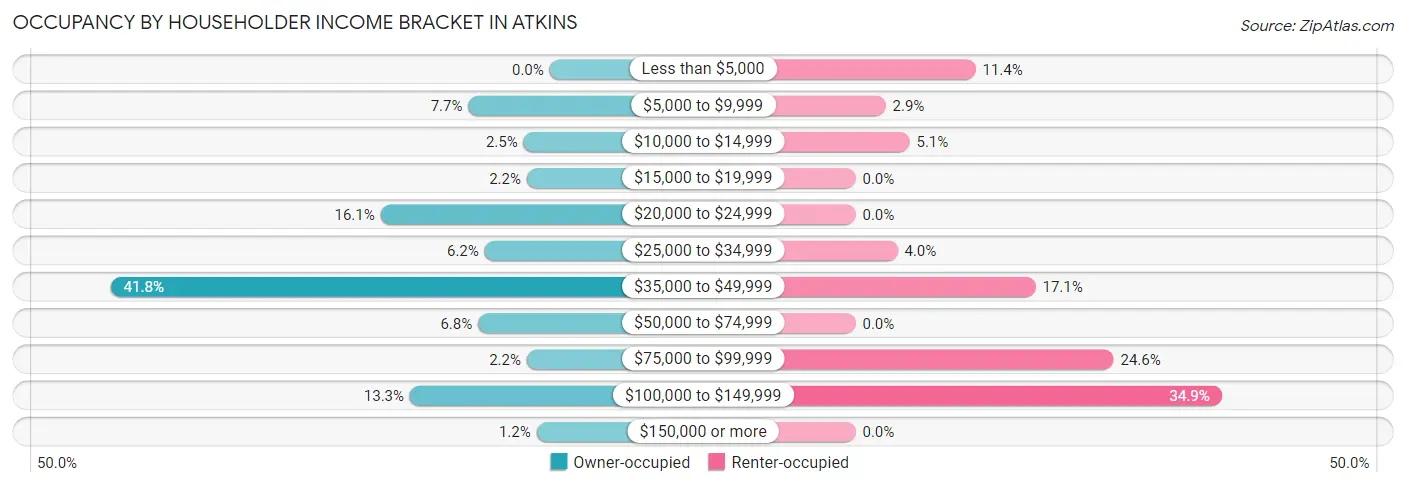
| Income Bracket | Owner-occupied | Renter-occupied |
| Less than $5,000 | 0 (0.0%) | 20 (11.4%) |
| $5,000 to $9,999 | 25 (7.7%) | 5 (2.9%) |
| $10,000 to $14,999 | 8 (2.5%) | 9 (5.1%) |
| $15,000 to $19,999 | 7 (2.2%) | 0 (0.0%) |
| $20,000 to $24,999 | 52 (16.1%) | 0 (0.0%) |
| $25,000 to $34,999 | 20 (6.2%) | 7 (4.0%) |
| $35,000 to $49,999 | 135 (41.8%) | 30 (17.1%) |
| $50,000 to $74,999 | 22 (6.8%) | 0 (0.0%) |
| $75,000 to $99,999 | 7 (2.2%) | 43 (24.6%) |
| $100,000 to $149,999 | 43 (13.3%) | 61 (34.9%) |
| $150,000 or more | 4 (1.2%) | 0 (0.0%) |
| Total | 323 (100.0%) | 175 (100.0%) |
Monthly Housing Cost Tiers in Atkins
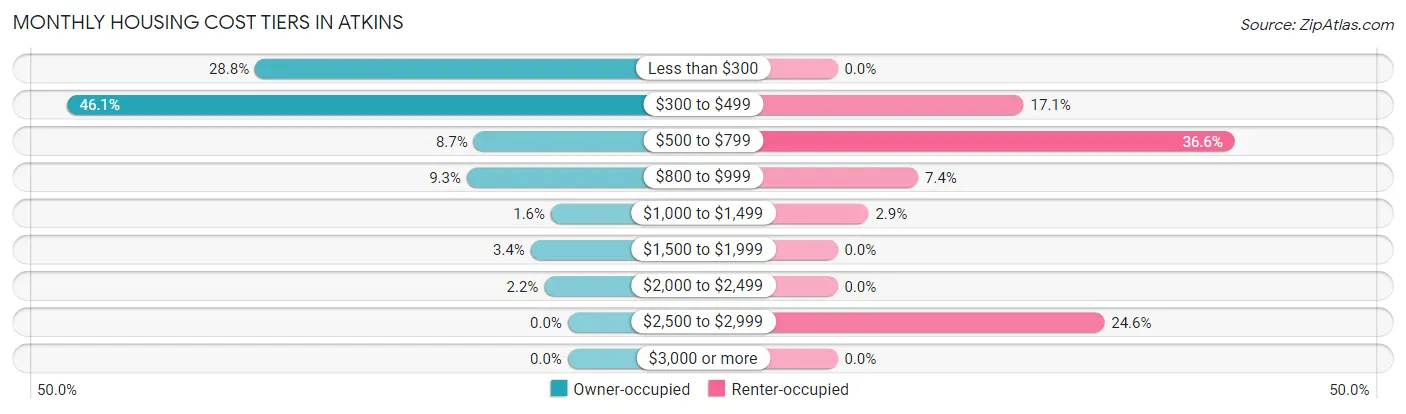
| Monthly Cost | Owner-occupied | Renter-occupied |
| Less than $300 | 93 (28.8%) | 0 (0.0%) |
| $300 to $499 | 149 (46.1%) | 30 (17.1%) |
| $500 to $799 | 28 (8.7%) | 64 (36.6%) |
| $800 to $999 | 30 (9.3%) | 13 (7.4%) |
| $1,000 to $1,499 | 5 (1.5%) | 5 (2.9%) |
| $1,500 to $1,999 | 11 (3.4%) | 0 (0.0%) |
| $2,000 to $2,499 | 7 (2.2%) | 0 (0.0%) |
| $2,500 to $2,999 | 0 (0.0%) | 43 (24.6%) |
| $3,000 or more | 0 (0.0%) | 0 (0.0%) |
| Total | 323 (100.0%) | 175 (100.0%) |
Physical Housing Characteristics in Atkins
Housing Structures in Atkins
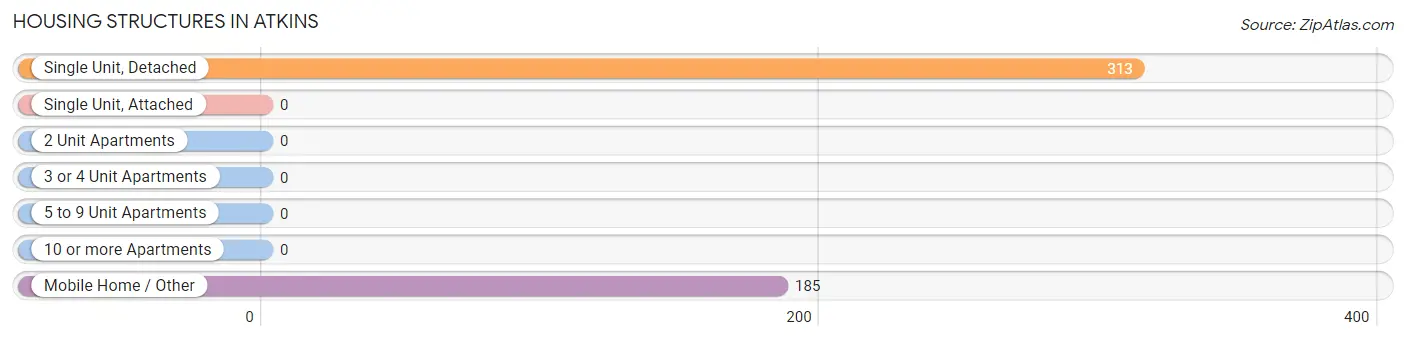
| Structure Type | # Housing Units | % Housing Units |
| Single Unit, Detached | 313 | 62.8% |
| Single Unit, Attached | 0 | 0.0% |
| 2 Unit Apartments | 0 | 0.0% |
| 3 or 4 Unit Apartments | 0 | 0.0% |
| 5 to 9 Unit Apartments | 0 | 0.0% |
| 10 or more Apartments | 0 | 0.0% |
| Mobile Home / Other | 185 | 37.1% |
| Total | 498 | 100.0% |
Housing Structures by Occupancy in Atkins
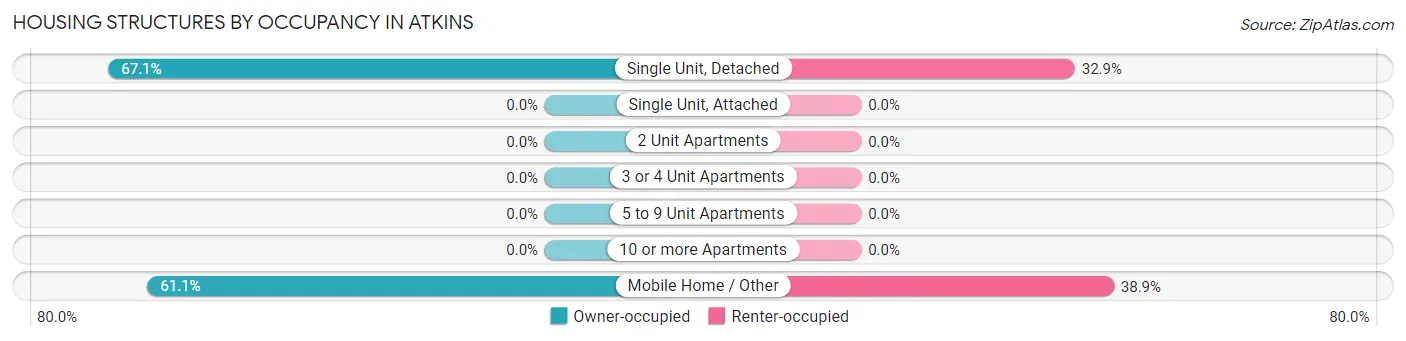
| Structure Type | Owner-occupied | Renter-occupied |
| Single Unit, Detached | 210 (67.1%) | 103 (32.9%) |
| Single Unit, Attached | 0 (0.0%) | 0 (0.0%) |
| 2 Unit Apartments | 0 (0.0%) | 0 (0.0%) |
| 3 or 4 Unit Apartments | 0 (0.0%) | 0 (0.0%) |
| 5 to 9 Unit Apartments | 0 (0.0%) | 0 (0.0%) |
| 10 or more Apartments | 0 (0.0%) | 0 (0.0%) |
| Mobile Home / Other | 113 (61.1%) | 72 (38.9%) |
| Total | 323 (64.9%) | 175 (35.1%) |
Housing Structures by Number of Rooms in Atkins
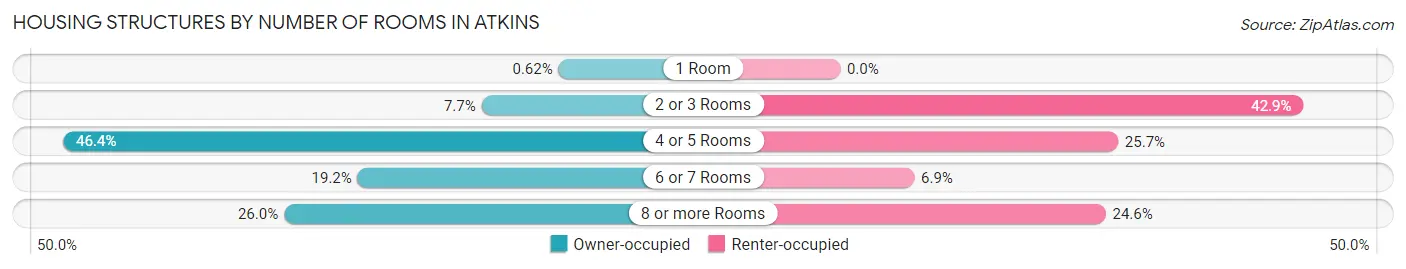
| Number of Rooms | Owner-occupied | Renter-occupied |
| 1 Room | 2 (0.6%) | 0 (0.0%) |
| 2 or 3 Rooms | 25 (7.7%) | 75 (42.9%) |
| 4 or 5 Rooms | 150 (46.4%) | 45 (25.7%) |
| 6 or 7 Rooms | 62 (19.2%) | 12 (6.9%) |
| 8 or more Rooms | 84 (26.0%) | 43 (24.6%) |
| Total | 323 (100.0%) | 175 (100.0%) |
Housing Structure by Heating Type in Atkins
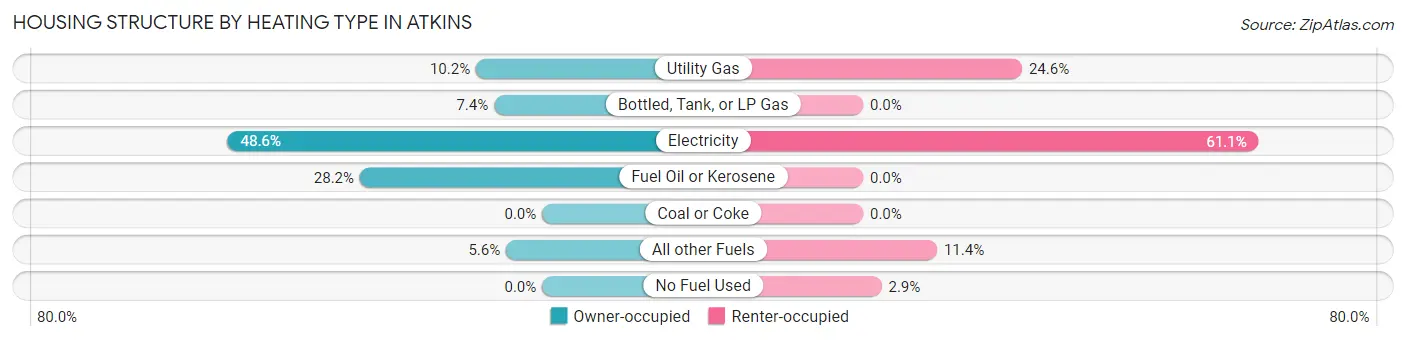
| Heating Type | Owner-occupied | Renter-occupied |
| Utility Gas | 33 (10.2%) | 43 (24.6%) |
| Bottled, Tank, or LP Gas | 24 (7.4%) | 0 (0.0%) |
| Electricity | 157 (48.6%) | 107 (61.1%) |
| Fuel Oil or Kerosene | 91 (28.2%) | 0 (0.0%) |
| Coal or Coke | 0 (0.0%) | 0 (0.0%) |
| All other Fuels | 18 (5.6%) | 20 (11.4%) |
| No Fuel Used | 0 (0.0%) | 5 (2.9%) |
| Total | 323 (100.0%) | 175 (100.0%) |
Household Vehicle Usage in Atkins
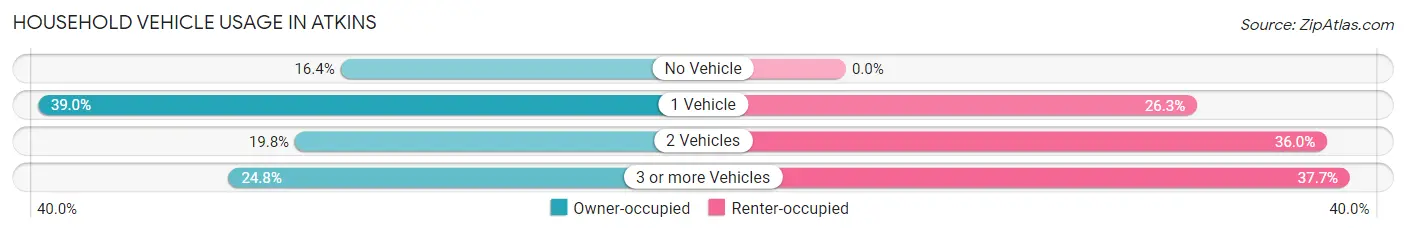
| Vehicles per Household | Owner-occupied | Renter-occupied |
| No Vehicle | 53 (16.4%) | 0 (0.0%) |
| 1 Vehicle | 126 (39.0%) | 46 (26.3%) |
| 2 Vehicles | 64 (19.8%) | 63 (36.0%) |
| 3 or more Vehicles | 80 (24.8%) | 66 (37.7%) |
| Total | 323 (100.0%) | 175 (100.0%) |
Real Estate & Mortgages in Atkins
Real Estate and Mortgage Overview in Atkins
| Characteristic | Without Mortgage | With Mortgage |
| Housing Units | 232 | 91 |
| Median Property Value | $37,800 | $0 |
| Median Household Income | $39,100 | $0 |
| Monthly Housing Costs | $314 | $0 |
| Real Estate Taxes | $485 | $0 |
Property Value by Mortgage Status in Atkins
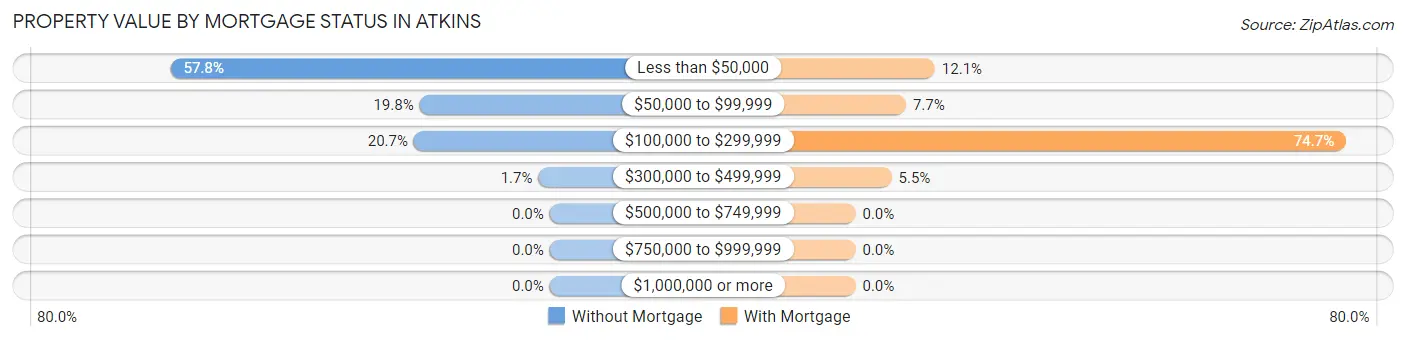
| Property Value | Without Mortgage | With Mortgage |
| Less than $50,000 | 134 (57.8%) | 11 (12.1%) |
| $50,000 to $99,999 | 46 (19.8%) | 7 (7.7%) |
| $100,000 to $299,999 | 48 (20.7%) | 68 (74.7%) |
| $300,000 to $499,999 | 4 (1.7%) | 5 (5.5%) |
| $500,000 to $749,999 | 0 (0.0%) | 0 (0.0%) |
| $750,000 to $999,999 | 0 (0.0%) | 0 (0.0%) |
| $1,000,000 or more | 0 (0.0%) | 0 (0.0%) |
| Total | 232 (100.0%) | 91 (100.0%) |
Household Income by Mortgage Status in Atkins
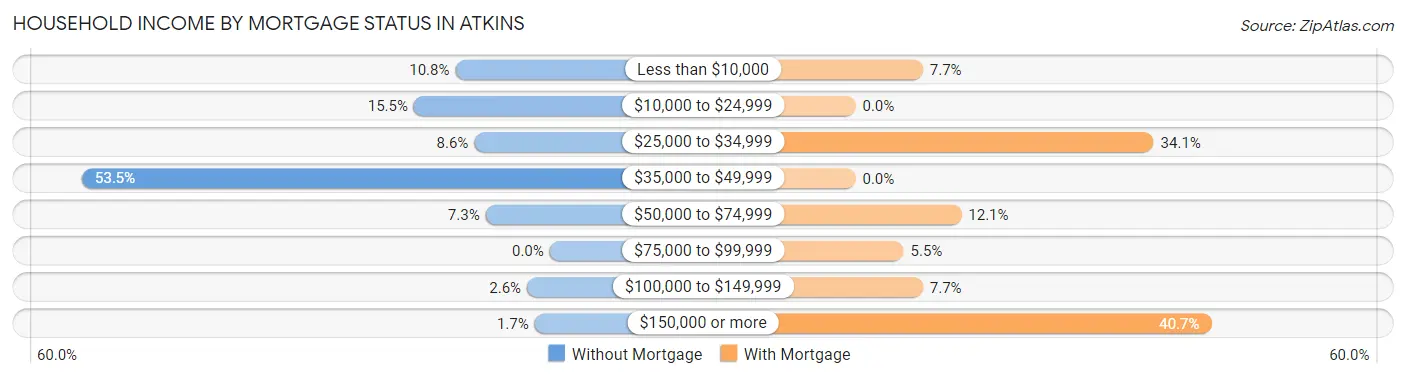
| Household Income | Without Mortgage | With Mortgage |
| Less than $10,000 | 25 (10.8%) | 7 (7.7%) |
| $10,000 to $24,999 | 36 (15.5%) | 0 (0.0%) |
| $25,000 to $34,999 | 20 (8.6%) | 31 (34.1%) |
| $35,000 to $49,999 | 124 (53.4%) | 0 (0.0%) |
| $50,000 to $74,999 | 17 (7.3%) | 11 (12.1%) |
| $75,000 to $99,999 | 0 (0.0%) | 5 (5.5%) |
| $100,000 to $149,999 | 6 (2.6%) | 7 (7.7%) |
| $150,000 or more | 4 (1.7%) | 37 (40.7%) |
| Total | 232 (100.0%) | 91 (100.0%) |
Property Value to Household Income Ratio in Atkins
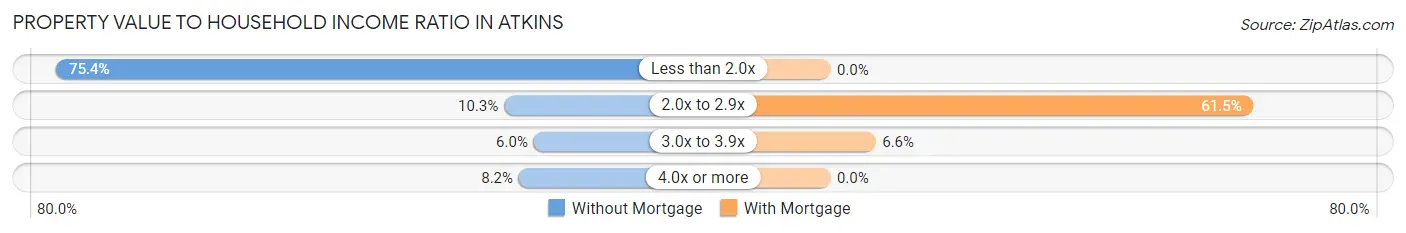
| Value-to-Income Ratio | Without Mortgage | With Mortgage |
| Less than 2.0x | 175 (75.4%) | 0 (0.0%) |
| 2.0x to 2.9x | 24 (10.3%) | 56 (61.5%) |
| 3.0x to 3.9x | 14 (6.0%) | 6 (6.6%) |
| 4.0x or more | 19 (8.2%) | 0 (0.0%) |
| Total | 232 (100.0%) | 91 (100.0%) |
Real Estate Taxes by Mortgage Status in Atkins
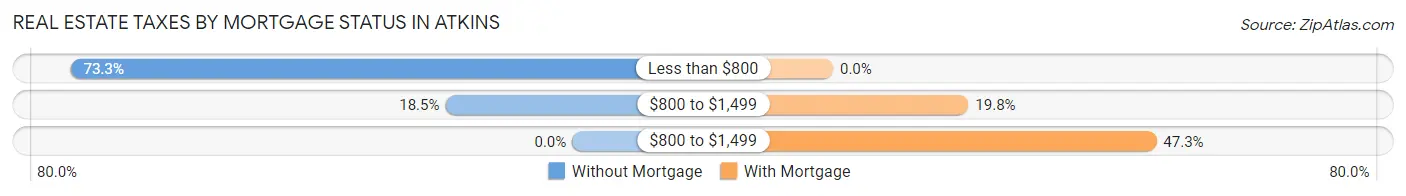
| Property Taxes | Without Mortgage | With Mortgage |
| Less than $800 | 170 (73.3%) | 0 (0.0%) |
| $800 to $1,499 | 43 (18.5%) | 18 (19.8%) |
| $800 to $1,499 | 0 (0.0%) | 43 (47.2%) |
| Total | 232 (100.0%) | 91 (100.0%) |
Health & Disability in Atkins
Health Insurance Coverage by Age in Atkins
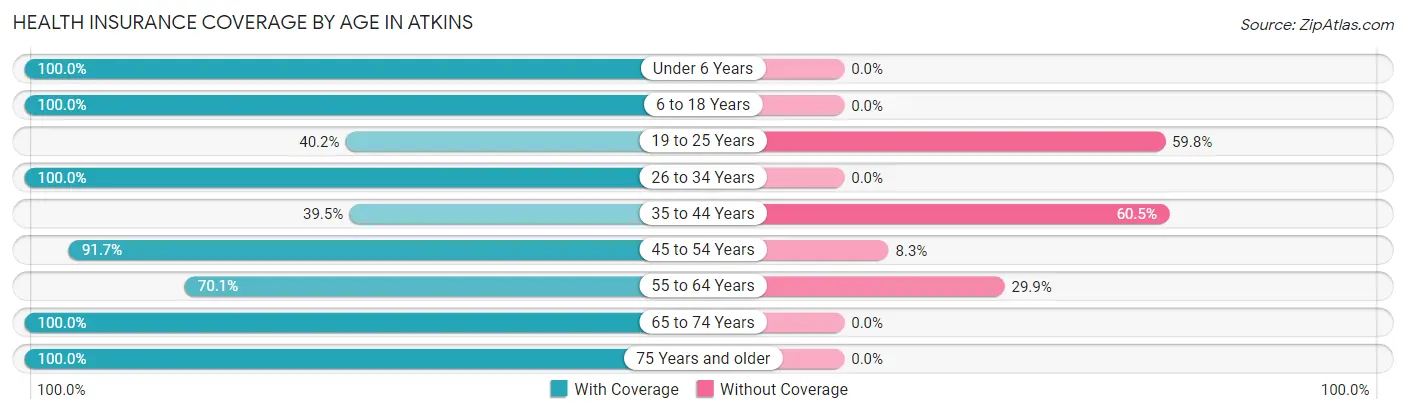
| Age Bracket | With Coverage | Without Coverage |
| Under 6 Years | 51 (100.0%) | 0 (0.0%) |
| 6 to 18 Years | 104 (100.0%) | 0 (0.0%) |
| 19 to 25 Years | 41 (40.2%) | 61 (59.8%) |
| 26 to 34 Years | 92 (100.0%) | 0 (0.0%) |
| 35 to 44 Years | 47 (39.5%) | 72 (60.5%) |
| 45 to 54 Years | 211 (91.7%) | 19 (8.3%) |
| 55 to 64 Years | 61 (70.1%) | 26 (29.9%) |
| 65 to 74 Years | 200 (100.0%) | 0 (0.0%) |
| 75 Years and older | 43 (100.0%) | 0 (0.0%) |
| Total | 850 (82.7%) | 178 (17.3%) |
Health Insurance Coverage by Citizenship Status in Atkins
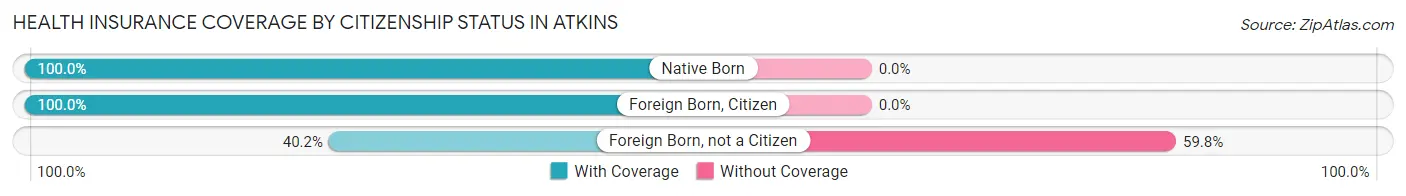
| Citizenship Status | With Coverage | Without Coverage |
| Native Born | 51 (100.0%) | 0 (0.0%) |
| Foreign Born, Citizen | 104 (100.0%) | 0 (0.0%) |
| Foreign Born, not a Citizen | 41 (40.2%) | 61 (59.8%) |
Health Insurance Coverage by Household Income in Atkins
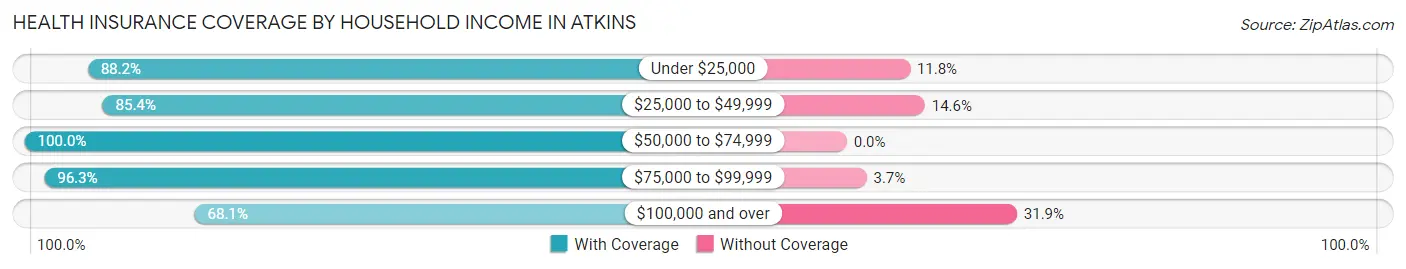
| Household Income | With Coverage | Without Coverage |
| Under $25,000 | 149 (88.2%) | 20 (11.8%) |
| $25,000 to $49,999 | 257 (85.4%) | 44 (14.6%) |
| $50,000 to $74,999 | 57 (100.0%) | 0 (0.0%) |
| $75,000 to $99,999 | 156 (96.3%) | 6 (3.7%) |
| $100,000 and over | 231 (68.1%) | 108 (31.9%) |
Public vs Private Health Insurance Coverage by Age in Atkins
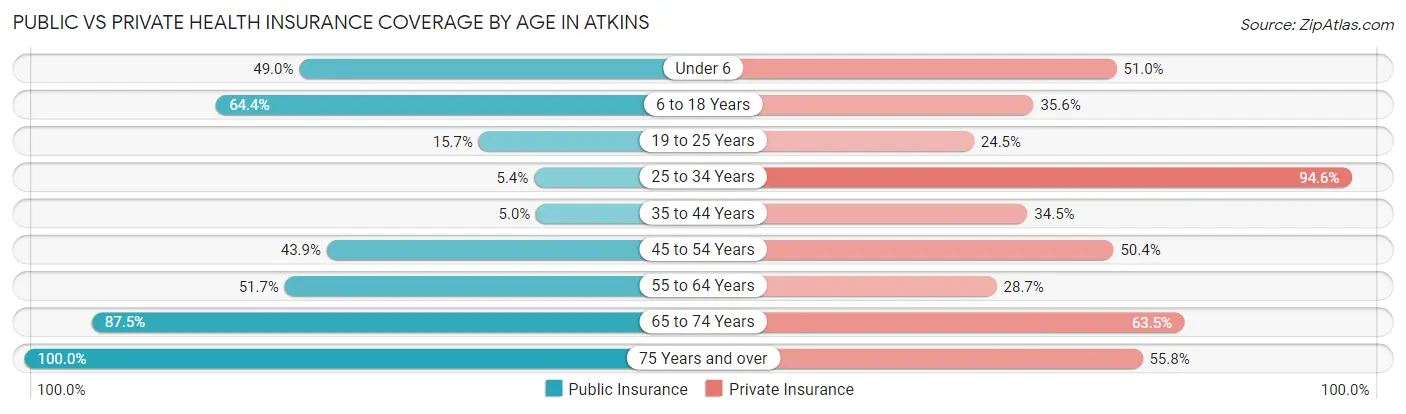
| Age Bracket | Public Insurance | Private Insurance |
| Under 6 | 25 (49.0%) | 26 (51.0%) |
| 6 to 18 Years | 67 (64.4%) | 37 (35.6%) |
| 19 to 25 Years | 16 (15.7%) | 25 (24.5%) |
| 25 to 34 Years | 5 (5.4%) | 87 (94.6%) |
| 35 to 44 Years | 6 (5.0%) | 41 (34.4%) |
| 45 to 54 Years | 101 (43.9%) | 116 (50.4%) |
| 55 to 64 Years | 45 (51.7%) | 25 (28.7%) |
| 65 to 74 Years | 175 (87.5%) | 127 (63.5%) |
| 75 Years and over | 43 (100.0%) | 24 (55.8%) |
| Total | 483 (47.0%) | 508 (49.4%) |
Disability Status by Sex by Age in Atkins
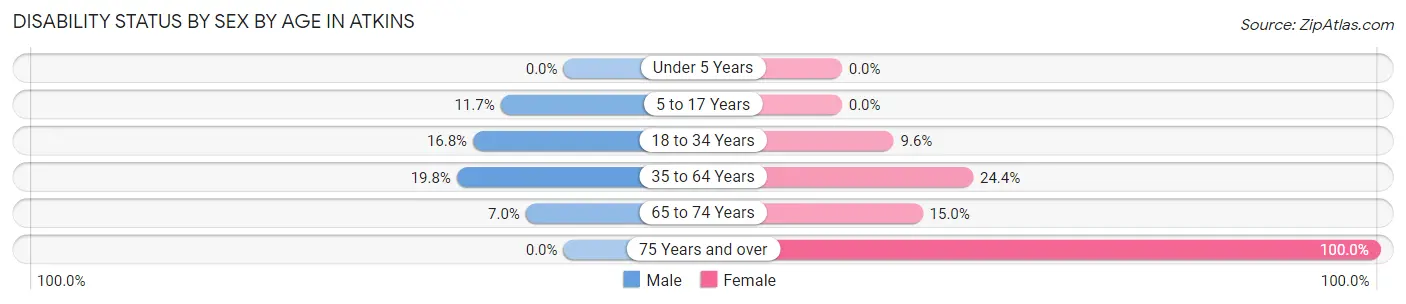
| Age Bracket | Male | Female |
| Under 5 Years | 0 (0.0%) | 0 (0.0%) |
| 5 to 17 Years | 7 (11.7%) | 0 (0.0%) |
| 18 to 34 Years | 25 (16.8%) | 5 (9.6%) |
| 35 to 64 Years | 40 (19.8%) | 57 (24.4%) |
| 65 to 74 Years | 7 (7.0%) | 15 (15.0%) |
| 75 Years and over | 0 (0.0%) | 37 (100.0%) |
Disability Class by Sex by Age in Atkins
Disability Class: Hearing Difficulty
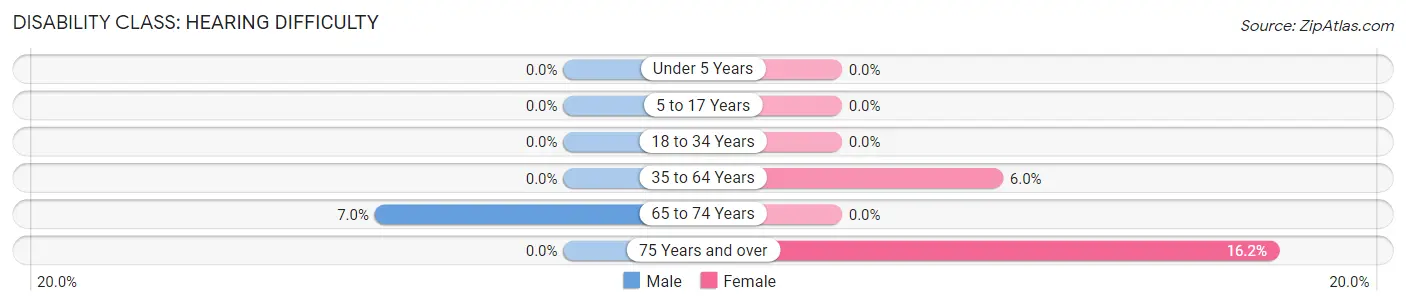
| Age Bracket | Male | Female |
| Under 5 Years | 0 (0.0%) | 0 (0.0%) |
| 5 to 17 Years | 0 (0.0%) | 0 (0.0%) |
| 18 to 34 Years | 0 (0.0%) | 0 (0.0%) |
| 35 to 64 Years | 0 (0.0%) | 14 (6.0%) |
| 65 to 74 Years | 7 (7.0%) | 0 (0.0%) |
| 75 Years and over | 0 (0.0%) | 6 (16.2%) |
Disability Class: Vision Difficulty
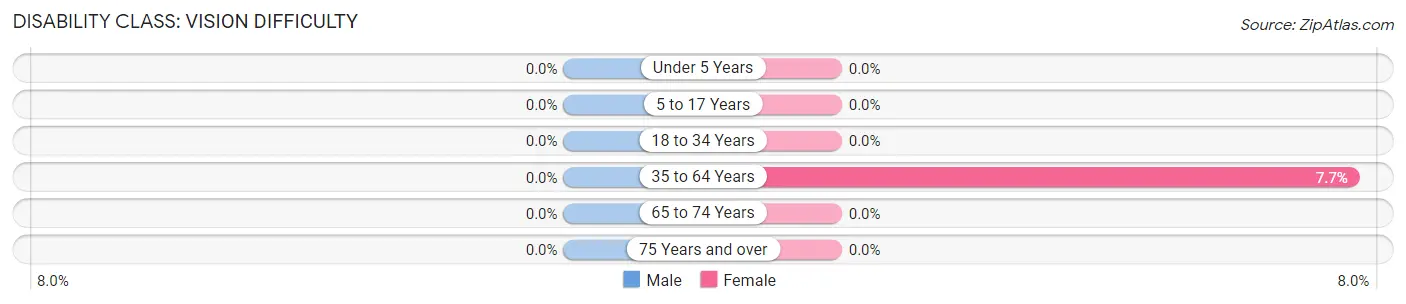
| Age Bracket | Male | Female |
| Under 5 Years | 0 (0.0%) | 0 (0.0%) |
| 5 to 17 Years | 0 (0.0%) | 0 (0.0%) |
| 18 to 34 Years | 0 (0.0%) | 0 (0.0%) |
| 35 to 64 Years | 0 (0.0%) | 18 (7.7%) |
| 65 to 74 Years | 0 (0.0%) | 0 (0.0%) |
| 75 Years and over | 0 (0.0%) | 0 (0.0%) |
Disability Class: Cognitive Difficulty
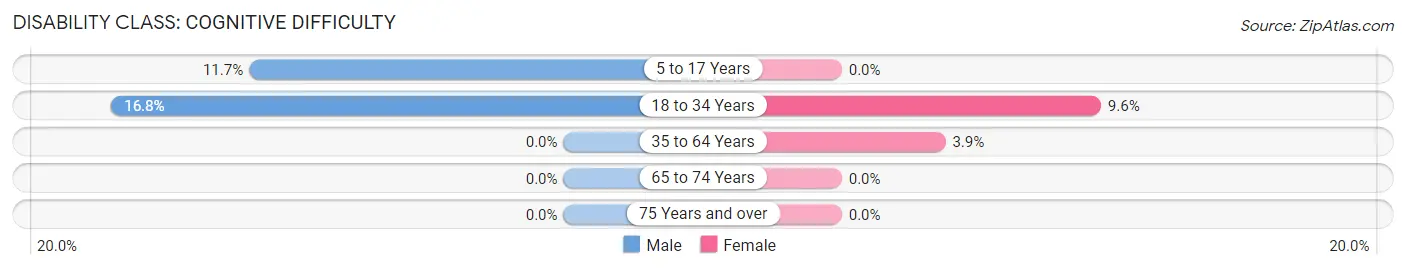
| Age Bracket | Male | Female |
| 5 to 17 Years | 7 (11.7%) | 0 (0.0%) |
| 18 to 34 Years | 25 (16.8%) | 5 (9.6%) |
| 35 to 64 Years | 0 (0.0%) | 9 (3.8%) |
| 65 to 74 Years | 0 (0.0%) | 0 (0.0%) |
| 75 Years and over | 0 (0.0%) | 0 (0.0%) |
Disability Class: Ambulatory Difficulty
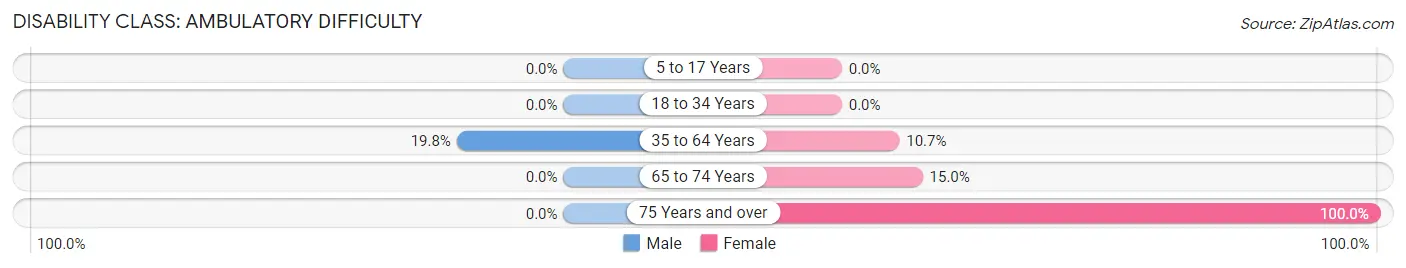
| Age Bracket | Male | Female |
| 5 to 17 Years | 0 (0.0%) | 0 (0.0%) |
| 18 to 34 Years | 0 (0.0%) | 0 (0.0%) |
| 35 to 64 Years | 40 (19.8%) | 25 (10.7%) |
| 65 to 74 Years | 0 (0.0%) | 15 (15.0%) |
| 75 Years and over | 0 (0.0%) | 37 (100.0%) |
Disability Class: Self-Care Difficulty
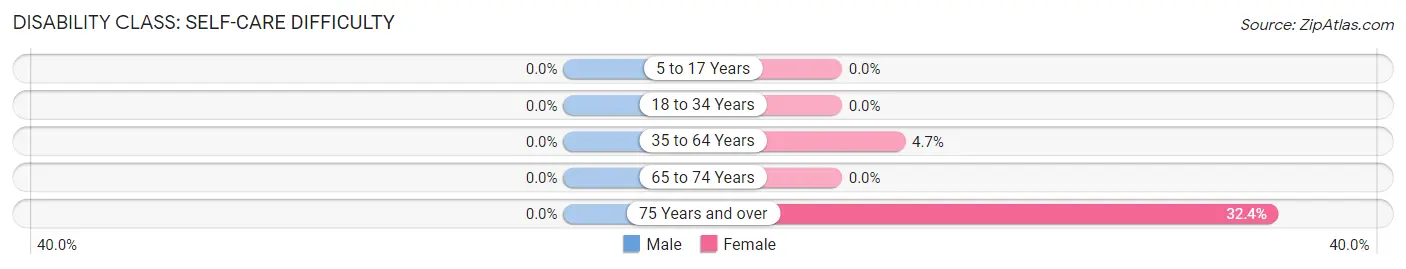
| Age Bracket | Male | Female |
| 5 to 17 Years | 0 (0.0%) | 0 (0.0%) |
| 18 to 34 Years | 0 (0.0%) | 0 (0.0%) |
| 35 to 64 Years | 0 (0.0%) | 11 (4.7%) |
| 65 to 74 Years | 0 (0.0%) | 0 (0.0%) |
| 75 Years and over | 0 (0.0%) | 12 (32.4%) |
Technology Access in Atkins
Computing Device Access in Atkins
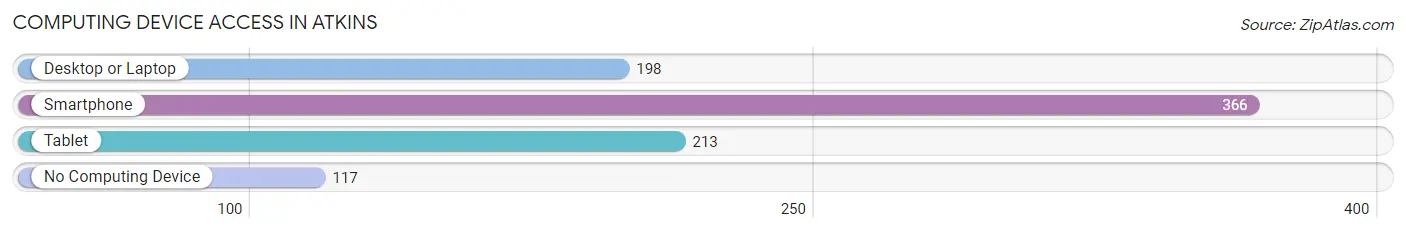
| Device Type | # Households | % Households |
| Desktop or Laptop | 198 | 39.8% |
| Smartphone | 366 | 73.5% |
| Tablet | 213 | 42.8% |
| No Computing Device | 117 | 23.5% |
| Total | 498 | 100.0% |
Internet Access in Atkins
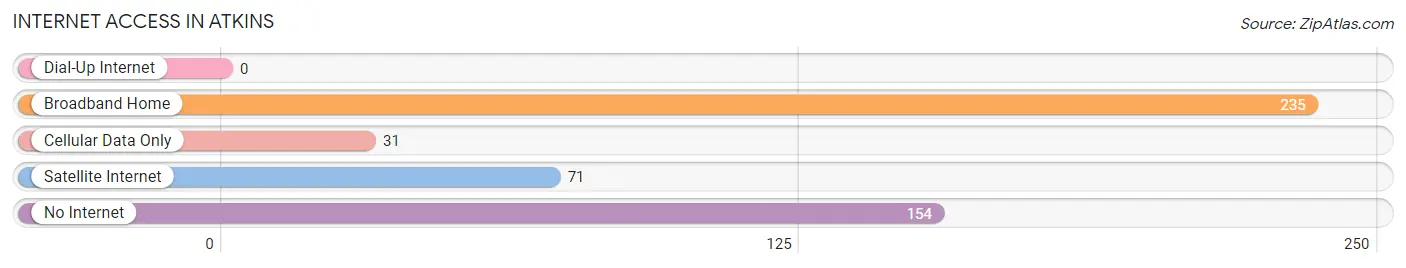
| Internet Type | # Households | % Households |
| Dial-Up Internet | 0 | 0.0% |
| Broadband Home | 235 | 47.2% |
| Cellular Data Only | 31 | 6.2% |
| Satellite Internet | 71 | 14.3% |
| No Internet | 154 | 30.9% |
| Total | 498 | 100.0% |
Atkins Summary
Atkins is a small town located in the Appalachian Mountains of Virginia. It is situated in the western part of the state, in Smyth County, and is part of the Marion-Smyth-Wythe Metropolitan Statistical Area. The town has a population of 1,845 people, according to the 2010 census.
History
Atkins was founded in 1820 by William Atkins, a Revolutionary War veteran. He purchased the land from the local Native Americans and named the town after himself. The town was originally known as Atkinsville, but the name was changed to Atkins in 1891.
Atkins was an important stop on the Virginia and Tennessee Railroad, which ran from Abingdon to Bristol. The railroad was completed in 1856 and was a major factor in the growth of the town. The railroad brought in new businesses and industries, and the town quickly grew.
Atkins was also an important stop on the Virginia Creeper Trail, a popular hiking and biking trail that runs from Abingdon to Damascus. The trail was completed in 1977 and has become a popular tourist attraction.
Geography
Atkins is located in the Appalachian Mountains of Virginia. It is situated in the western part of the state, in Smyth County. The town is located at the intersection of US Route 11 and Virginia State Route 16.
The town is surrounded by the Blue Ridge Mountains to the east and the Allegheny Mountains to the west. The town is located in a valley, with the North Fork of the Holston River running through it.
The climate in Atkins is humid subtropical, with hot summers and mild winters. The average annual temperature is 57°F (14°C). The average annual precipitation is 43 inches (109 cm).
Economy
Atkins is a small town with a limited economy. The main industries in the town are agriculture and tourism.
Agriculture is the main industry in Atkins. The town is home to several farms, which produce a variety of crops, including corn, soybeans, hay, and tobacco.
Tourism is also an important part of the economy. The town is home to several popular attractions, including the Virginia Creeper Trail, the Appalachian Trail, and the North Fork of the Holston River. The town also hosts several festivals throughout the year, including the Atkins Apple Festival and the Atkins Music Festival.
Demographics
Atkins has a population of 1,845 people, according to the 2010 census. The town has a median age of 41.7 years, with 48.3% of the population being male and 51.7% being female.
The racial makeup of the town is 97.2% White, 0.9% African American, 0.2% Native American, 0.2% Asian, 0.1% Pacific Islander, 0.3% from other races, and 1.1% from two or more races. The median household income is $30,938, and the median family income is $37,813.
Atkins is served by the Smyth County Public Schools system. The town is home to two schools: Atkins Elementary School and Atkins High School. The town also has several churches, including the Atkins United Methodist Church, the Atkins Baptist Church, and the Atkins Presbyterian Church.
Common Questions
What is Per Capita Income in Atkins?
Per Capita income in Atkins is $28,349.
What is the Median Family Income in Atkins?
Median Family Income in Atkins is $44,602.
What is the Median Household income in Atkins?
Median Household Income in Atkins is $43,318.
What is Income or Wage Gap in Atkins?
Income or Wage Gap in Atkins is 24.8%.
Women in Atkins earn 75.2 cents for every dollar earned by a man.
What is Inequality or Gini Index in Atkins?
Inequality or Gini Index in Atkins is 0.40.
What is the Total Population of Atkins?
Total Population of Atkins is 1,028.
What is the Total Male Population of Atkins?
Total Male Population of Atkins is 551.
What is the Total Female Population of Atkins?
Total Female Population of Atkins is 477.
What is the Ratio of Males per 100 Females in Atkins?
There are 115.51 Males per 100 Females in Atkins.
What is the Ratio of Females per 100 Males in Atkins?
There are 86.57 Females per 100 Males in Atkins.
What is the Median Population Age in Atkins?
Median Population Age in Atkins is 47.5 Years.
What is the Average Family Size in Atkins
Average Family Size in Atkins is 2.5 People.
What is the Average Household Size in Atkins
Average Household Size in Atkins is 2.1 People.
How Large is the Labor Force in Atkins?
There are 550 People in the Labor Forcein in Atkins.
What is the Percentage of People in the Labor Force in Atkins?
61.9% of People are in the Labor Force in Atkins.
What is the Unemployment Rate in Atkins?
Unemployment Rate in Atkins is 1.6%.