Laurel Park, VA Map & Demographics
Laurel Park Map
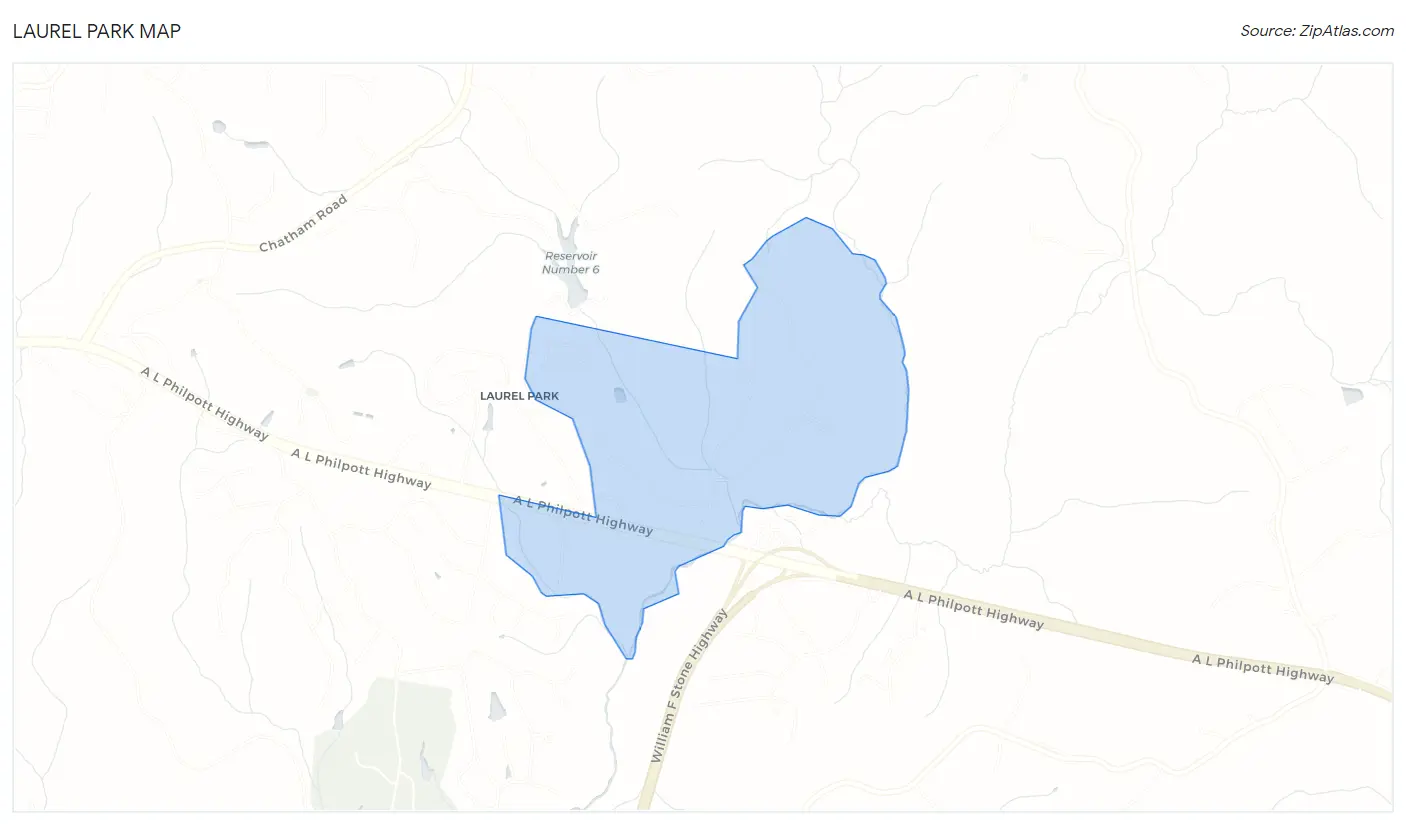
Laurel Park Overview
$17,054
PER CAPITA INCOME
$56,327
AVG FAMILY INCOME
$39,032
AVG HOUSEHOLD INCOME
36.3%
WAGE / INCOME GAP [ % ]
63.7¢/ $1
WAGE / INCOME GAP [ $ ]
0.21
INEQUALITY / GINI INDEX
1,114
TOTAL POPULATION
592
MALE POPULATION
522
FEMALE POPULATION
113.41
MALES / 100 FEMALES
88.18
FEMALES / 100 MALES
44.3
MEDIAN AGE
4.1
AVG FAMILY SIZE
2.7
AVG HOUSEHOLD SIZE
421
LABOR FORCE [ PEOPLE ]
52.6%
PERCENT IN LABOR FORCE
Income in Laurel Park
Income Overview in Laurel Park
Per Capita Income in Laurel Park is $17,054, while median incomes of families and households are $56,327 and $39,032 respectively.
| Characteristic | Number | Measure |
| Per Capita Income | 1,114 | $17,054 |
| Median Family Income | 222 | $56,327 |
| Mean Family Income | 222 | $49,970 |
| Median Household Income | 414 | $39,032 |
| Mean Household Income | 414 | $42,127 |
| Income Deficit | 222 | $0 |
| Wage / Income Gap (%) | 1,114 | 36.30% |
| Wage / Income Gap ($) | 1,114 | 63.70¢ per $1 |
| Gini / Inequality Index | 1,114 | 0.21 |
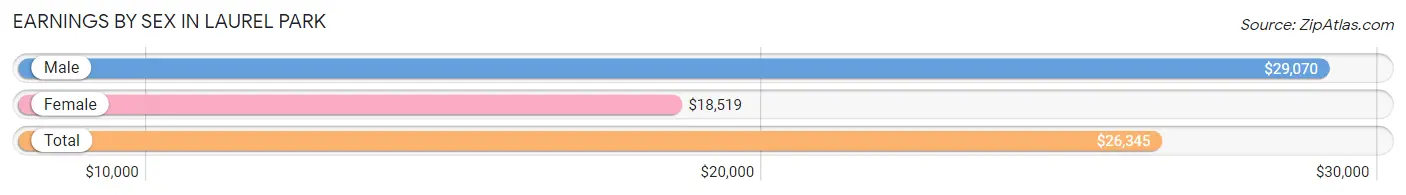
Earnings by Sex in Laurel Park
Average Earnings in Laurel Park are $26,345, $29,070 for men and $18,519 for women, a difference of 36.3%.
| Sex | Number | Average Earnings |
| Male | 195 (46.3%) | $29,070 |
| Female | 226 (53.7%) | $18,519 |
| Total | 421 (100.0%) | $26,345 |
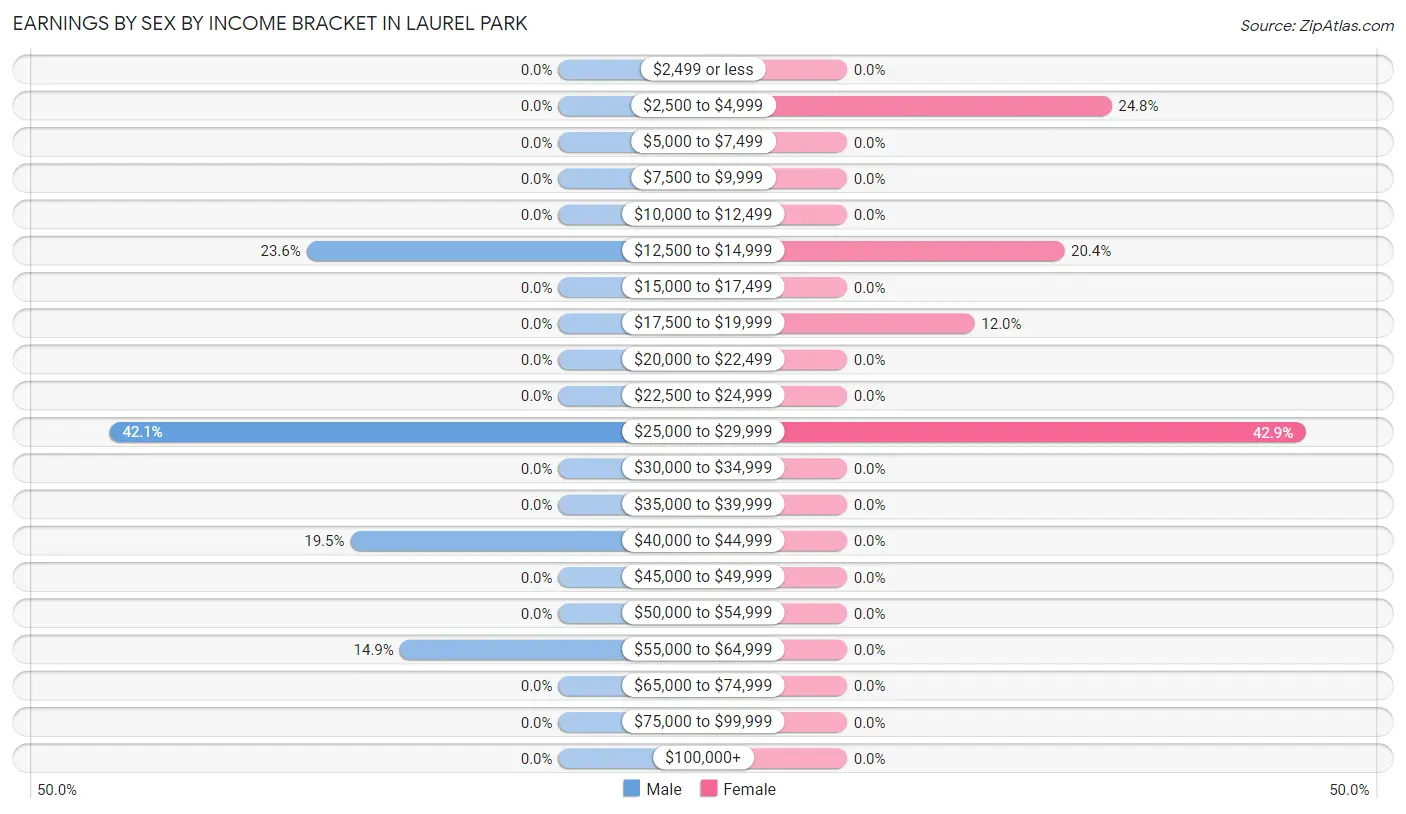
Earnings by Sex by Income Bracket in Laurel Park
The most common earnings brackets in Laurel Park are $25,000 to $29,999 for men (82 | 42.0%) and $25,000 to $29,999 for women (97 | 42.9%).
| Income | Male | Female |
| $2,499 or less | 0 (0.0%) | 0 (0.0%) |
| $2,500 to $4,999 | 0 (0.0%) | 56 (24.8%) |
| $5,000 to $7,499 | 0 (0.0%) | 0 (0.0%) |
| $7,500 to $9,999 | 0 (0.0%) | 0 (0.0%) |
| $10,000 to $12,499 | 0 (0.0%) | 0 (0.0%) |
| $12,500 to $14,999 | 46 (23.6%) | 46 (20.3%) |
| $15,000 to $17,499 | 0 (0.0%) | 0 (0.0%) |
| $17,500 to $19,999 | 0 (0.0%) | 27 (11.9%) |
| $20,000 to $22,499 | 0 (0.0%) | 0 (0.0%) |
| $22,500 to $24,999 | 0 (0.0%) | 0 (0.0%) |
| $25,000 to $29,999 | 82 (42.0%) | 97 (42.9%) |
| $30,000 to $34,999 | 0 (0.0%) | 0 (0.0%) |
| $35,000 to $39,999 | 0 (0.0%) | 0 (0.0%) |
| $40,000 to $44,999 | 38 (19.5%) | 0 (0.0%) |
| $45,000 to $49,999 | 0 (0.0%) | 0 (0.0%) |
| $50,000 to $54,999 | 0 (0.0%) | 0 (0.0%) |
| $55,000 to $64,999 | 29 (14.9%) | 0 (0.0%) |
| $65,000 to $74,999 | 0 (0.0%) | 0 (0.0%) |
| $75,000 to $99,999 | 0 (0.0%) | 0 (0.0%) |
| $100,000+ | 0 (0.0%) | 0 (0.0%) |
| Total | 195 (100.0%) | 226 (100.0%) |
Earnings by Sex by Educational Attainment in Laurel Park
| Educational Attainment | Male Income | Female Income |
| Less than High School | - | - |
| High School Diploma | - | - |
| College or Associate's Degree | - | - |
| Bachelor's Degree | - | - |
| Graduate Degree | - | - |
| Total | $29,070 | $18,519 |
Family Income in Laurel Park
Family Income Brackets in Laurel Park
According to the Laurel Park family income data, there are 154 families falling into the $50,000 to $74,999 income range, which is the most common income bracket and makes up 69.4% of all families.
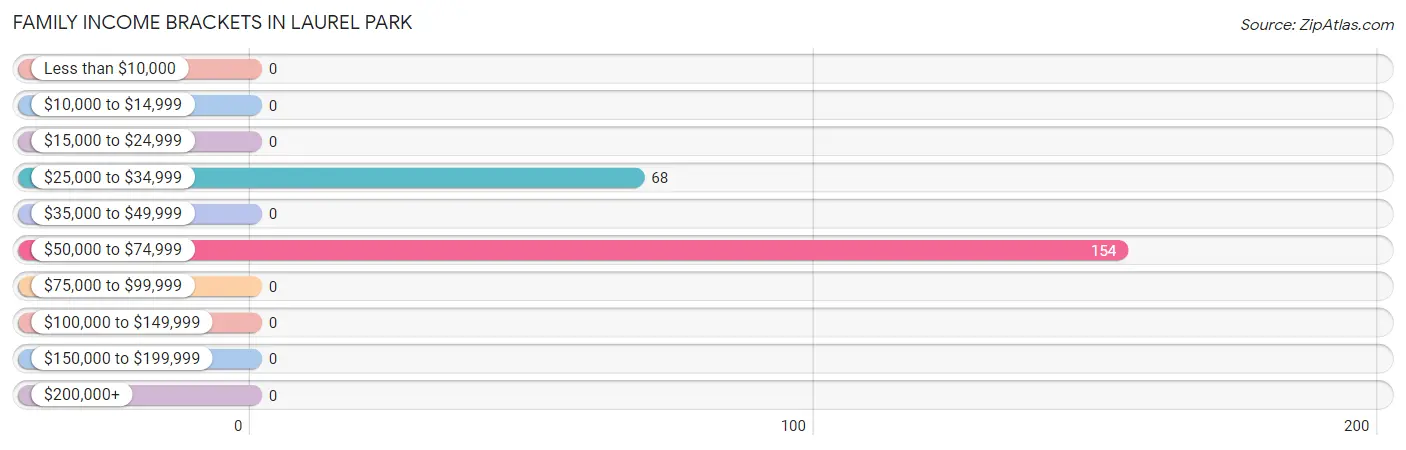
| Income Bracket | # Families | % Families |
| Less than $10,000 | 0 | 0.0% |
| $10,000 to $14,999 | 0 | 0.0% |
| $15,000 to $24,999 | 0 | 0.0% |
| $25,000 to $34,999 | 68 | 30.6% |
| $35,000 to $49,999 | 0 | 0.0% |
| $50,000 to $74,999 | 154 | 69.4% |
| $75,000 to $99,999 | 0 | 0.0% |
| $100,000 to $149,999 | 0 | 0.0% |
| $150,000 to $199,999 | 0 | 0.0% |
| $200,000+ | 0 | 0.0% |
Family Income by Famaliy Size in Laurel Park
| Income Bracket | # Families | Median Income |
| 2-Person Families | 114 (51.3%) | $0 |
| 3-Person Families | 0 (0.0%) | $0 |
| 4-Person Families | 81 (36.5%) | $0 |
| 5-Person Families | 27 (12.2%) | $0 |
| 6-Person Families | 0 (0.0%) | $0 |
| 7+ Person Families | 0 (0.0%) | $0 |
| Total | 222 (100.0%) | $56,327 |
Family Income by Number of Earners in Laurel Park
| Number of Earners | # Families | Median Income |
| No Earners | 68 (30.6%) | $0 |
| 1 Earner | 61 (27.5%) | $0 |
| 2 Earners | 66 (29.7%) | $0 |
| 3+ Earners | 27 (12.2%) | $0 |
| Total | 222 (100.0%) | $56,327 |
Household Income in Laurel Park
Household Income Brackets in Laurel Park
With 183 households falling in the category, the $50,000 to $74,999 income range is the most frequent in Laurel Park, accounting for 44.2% of all households.
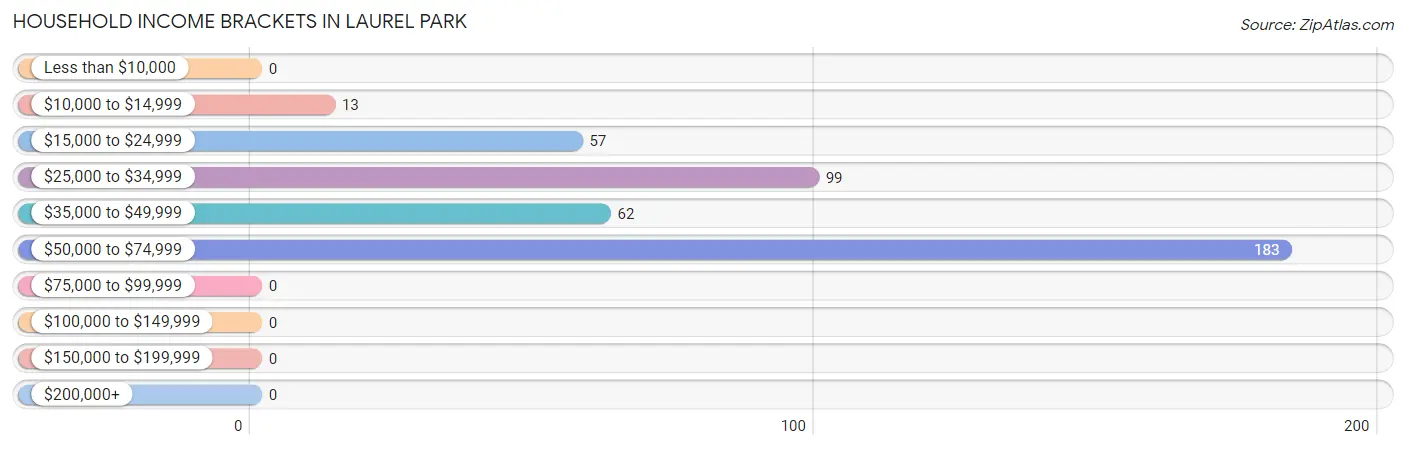
| Income Bracket | # Households | % Households |
| Less than $10,000 | 0 | 0.0% |
| $10,000 to $14,999 | 13 | 3.1% |
| $15,000 to $24,999 | 57 | 13.8% |
| $25,000 to $34,999 | 99 | 23.9% |
| $35,000 to $49,999 | 62 | 15.0% |
| $50,000 to $74,999 | 183 | 44.2% |
| $75,000 to $99,999 | 0 | 0.0% |
| $100,000 to $149,999 | 0 | 0.0% |
| $150,000 to $199,999 | 0 | 0.0% |
| $200,000+ | 0 | 0.0% |
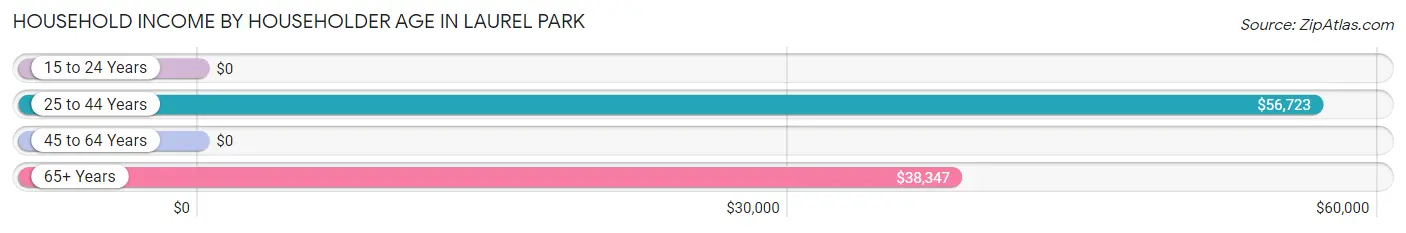
Household Income by Householder Age in Laurel Park
The median household income in Laurel Park is $39,032, with the highest median household income of $56,723 found in the 25 to 44 years age bracket for the primary householder. A total of 153 households (37.0%) fall into this category.
| Income Bracket | # Households | Median Income |
| 15 to 24 Years | 0 (0.0%) | $0 |
| 25 to 44 Years | 153 (37.0%) | $56,723 |
| 45 to 64 Years | 57 (13.8%) | $0 |
| 65+ Years | 204 (49.3%) | $38,347 |
| Total | 414 (100.0%) | $39,032 |
Poverty in Laurel Park
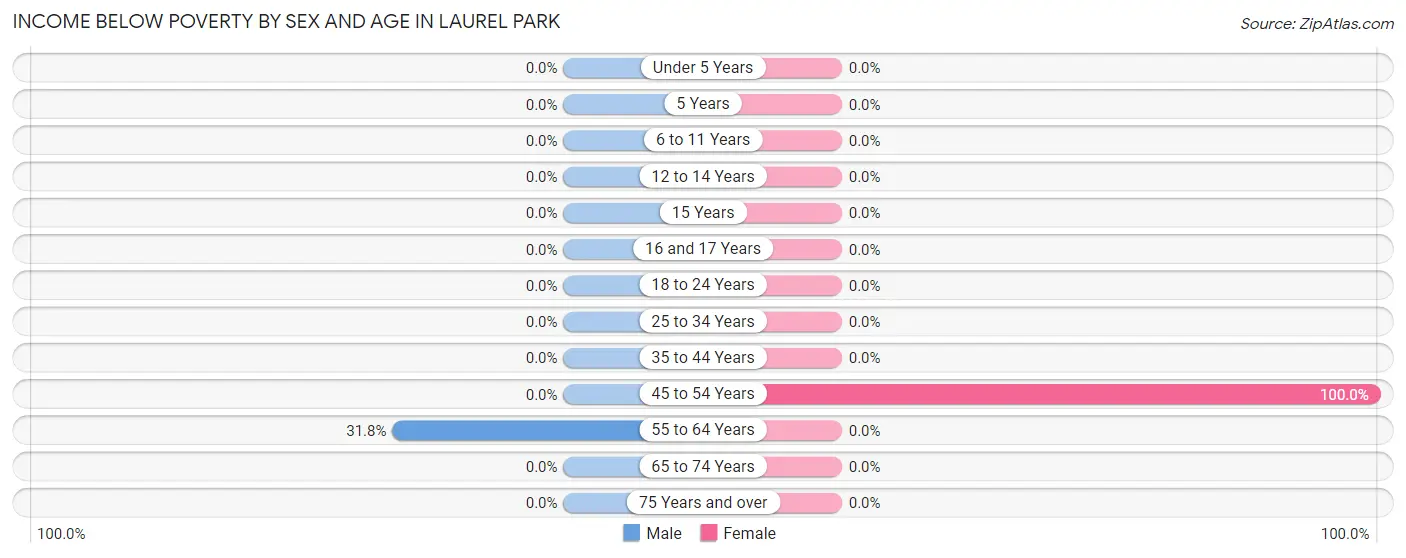
Income Below Poverty by Sex and Age in Laurel Park
With 3.4% poverty level for males and 2.7% for females among the residents of Laurel Park, 55 to 64 year old males and 45 to 54 year old females are the most vulnerable to poverty, with 20 males (31.8%) and 14 females (100.0%) in their respective age groups living below the poverty level.
| Age Bracket | Male | Female |
| Under 5 Years | 0 (0.0%) | 0 (0.0%) |
| 5 Years | 0 (0.0%) | 0 (0.0%) |
| 6 to 11 Years | 0 (0.0%) | 0 (0.0%) |
| 12 to 14 Years | 0 (0.0%) | 0 (0.0%) |
| 15 Years | 0 (0.0%) | 0 (0.0%) |
| 16 and 17 Years | 0 (0.0%) | 0 (0.0%) |
| 18 to 24 Years | 0 (0.0%) | 0 (0.0%) |
| 25 to 34 Years | 0 (0.0%) | 0 (0.0%) |
| 35 to 44 Years | 0 (0.0%) | 0 (0.0%) |
| 45 to 54 Years | 0 (0.0%) | 14 (100.0%) |
| 55 to 64 Years | 20 (31.8%) | 0 (0.0%) |
| 65 to 74 Years | 0 (0.0%) | 0 (0.0%) |
| 75 Years and over | 0 (0.0%) | 0 (0.0%) |
| Total | 20 (3.4%) | 14 (2.7%) |
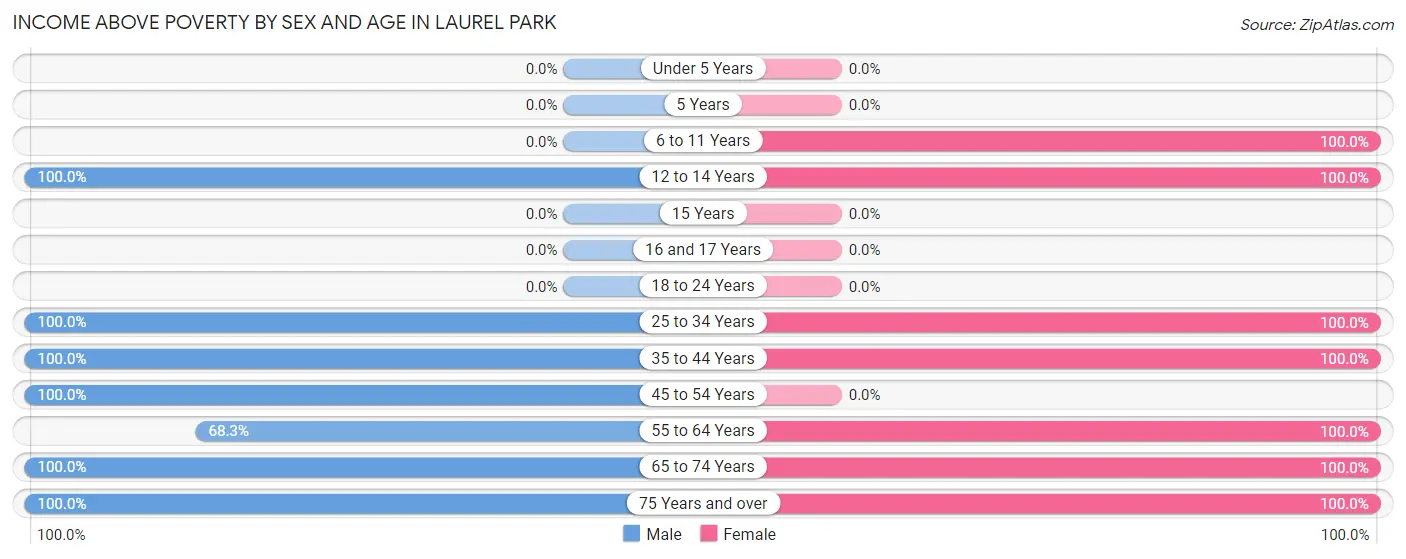
Income Above Poverty by Sex and Age in Laurel Park
According to the poverty statistics in Laurel Park, males aged 12 to 14 years and females aged 6 to 11 years are the age groups that are most secure financially, with 100.0% of males and 100.0% of females in these age groups living above the poverty line.
| Age Bracket | Male | Female |
| Under 5 Years | 0 (0.0%) | 0 (0.0%) |
| 5 Years | 0 (0.0%) | 0 (0.0%) |
| 6 to 11 Years | 0 (0.0%) | 73 (100.0%) |
| 12 to 14 Years | 195 (100.0%) | 46 (100.0%) |
| 15 Years | 0 (0.0%) | 0 (0.0%) |
| 16 and 17 Years | 0 (0.0%) | 0 (0.0%) |
| 18 to 24 Years | 0 (0.0%) | 0 (0.0%) |
| 25 to 34 Years | 82 (100.0%) | 97 (100.0%) |
| 35 to 44 Years | 29 (100.0%) | 73 (100.0%) |
| 45 to 54 Years | 38 (100.0%) | 0 (0.0%) |
| 55 to 64 Years | 43 (68.2%) | 18 (100.0%) |
| 65 to 74 Years | 133 (100.0%) | 173 (100.0%) |
| 75 Years and over | 52 (100.0%) | 28 (100.0%) |
| Total | 572 (96.6%) | 508 (97.3%) |
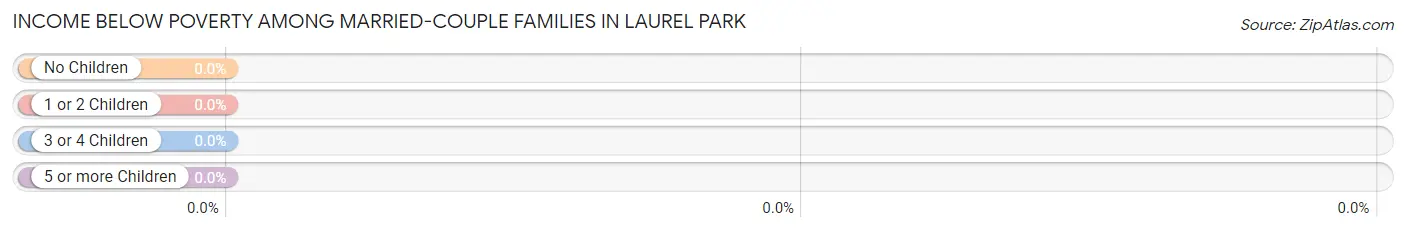
Income Below Poverty Among Married-Couple Families in Laurel Park
| Children | Above Poverty | Below Poverty |
| No Children | 62 (100.0%) | 0 (0.0%) |
| 1 or 2 Children | 108 (100.0%) | 0 (0.0%) |
| 3 or 4 Children | 0 (0.0%) | 0 (0.0%) |
| 5 or more Children | 0 (0.0%) | 0 (0.0%) |
| Total | 170 (100.0%) | 0 (0.0%) |
Income Below Poverty Among Single-Parent Households in Laurel Park
| Children | Single Father | Single Mother |
| No Children | 0 (0.0%) | 0 (0.0%) |
| 1 or 2 Children | 0 (0.0%) | 0 (0.0%) |
| 3 or 4 Children | 0 (0.0%) | 0 (0.0%) |
| 5 or more Children | 0 (0.0%) | 0 (0.0%) |
| Total | 0 (0.0%) | 0 (0.0%) |
Income Below Poverty Among Married-Couple vs Single-Parent Households in Laurel Park
| Children | Married-Couple Families | Single-Parent Households |
| No Children | 0 (0.0%) | 0 (0.0%) |
| 1 or 2 Children | 0 (0.0%) | 0 (0.0%) |
| 3 or 4 Children | 0 (0.0%) | 0 (0.0%) |
| 5 or more Children | 0 (0.0%) | 0 (0.0%) |
| Total | 0 (0.0%) | 0 (0.0%) |
Race in Laurel Park
The most populous races in Laurel Park are Hispanic or Latino (554 | 49.7%), Black / African American (513 | 46.1%), and Some other Race (323 | 29.0%).
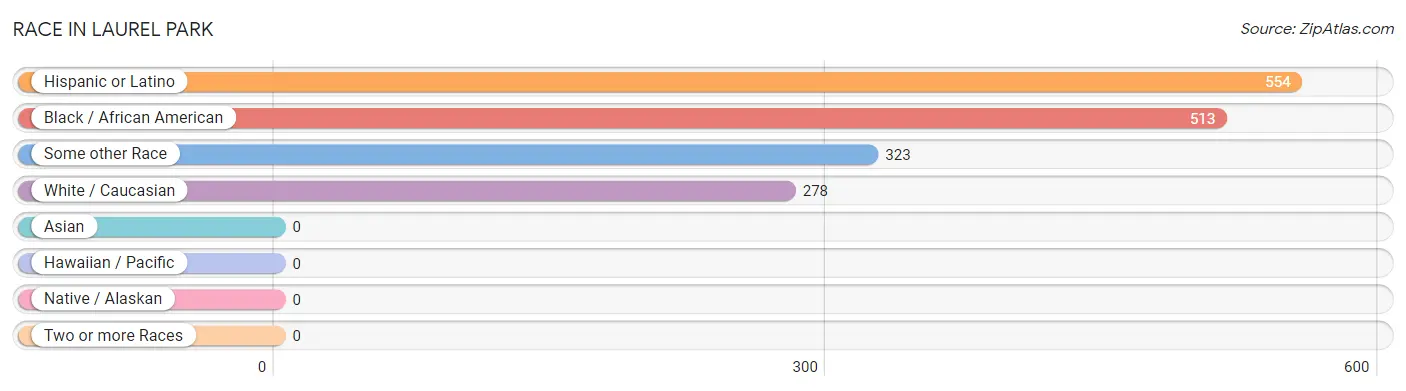
| Race | # Population | % Population |
| Asian | 0 | 0.0% |
| Black / African American | 513 | 46.1% |
| Hawaiian / Pacific | 0 | 0.0% |
| Hispanic or Latino | 554 | 49.7% |
| Native / Alaskan | 0 | 0.0% |
| White / Caucasian | 278 | 25.0% |
| Two or more Races | 0 | 0.0% |
| Some other Race | 323 | 29.0% |
| Total | 1,114 | 100.0% |
Ancestry in Laurel Park
The most populous ancestries reported in Laurel Park are Central American (323 | 29.0%), Salvadoran (323 | 29.0%), Mexican (231 | 20.7%), American (62 | 5.6%), and African (18 | 1.6%), together accounting for 85.9% of all Laurel Park residents.
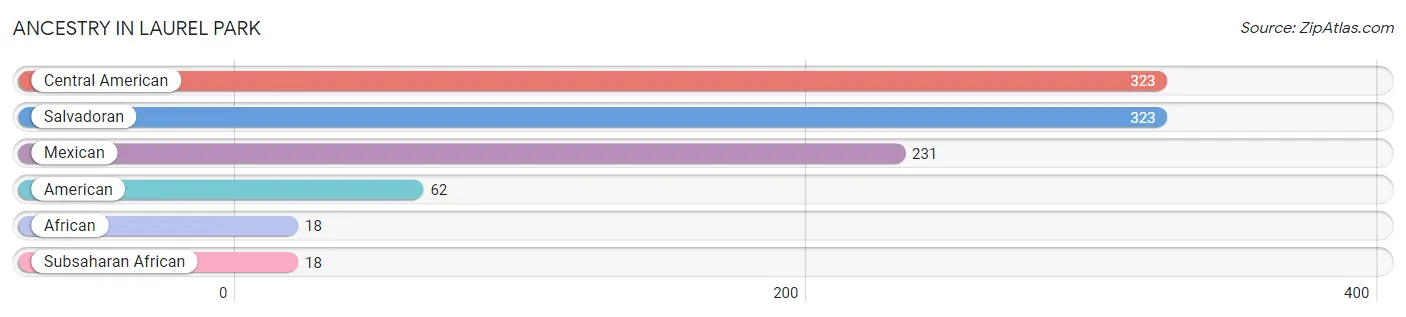
| Ancestry | # Population | % Population |
| African | 18 | 1.6% |
| American | 62 | 5.6% |
| Central American | 323 | 29.0% |
| Mexican | 231 | 20.7% |
| Salvadoran | 323 | 29.0% |
| Subsaharan African | 18 | 1.6% | View All 6 Rows |
Immigrants in Laurel Park
The most numerous immigrant groups reported in Laurel Park came from Central America (269 | 24.1%), Latin America (269 | 24.1%), El Salvador (148 | 13.3%), and Mexico (121 | 10.9%), together accounting for 72.5% of all Laurel Park residents.
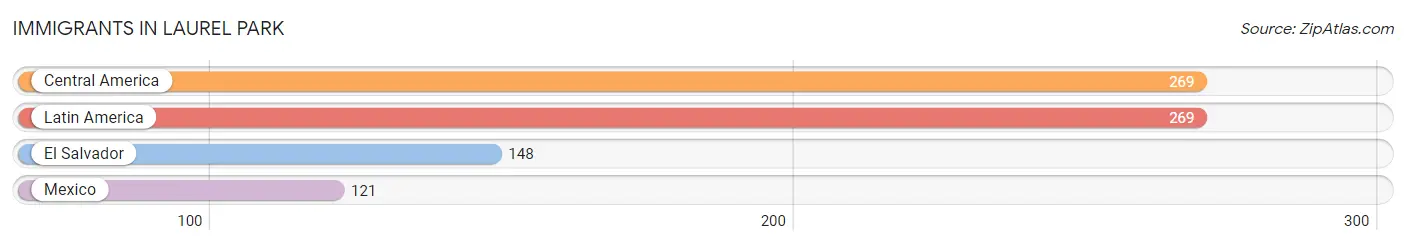
| Immigration Origin | # Population | % Population |
| Central America | 269 | 24.1% |
| El Salvador | 148 | 13.3% |
| Latin America | 269 | 24.1% |
| Mexico | 121 | 10.9% | View All 4 Rows |
Sex and Age in Laurel Park
Sex and Age in Laurel Park
The most populous age groups in Laurel Park are 10 to 14 Years (195 | 32.9%) for men and 65 to 69 Years (111 | 21.3%) for women.
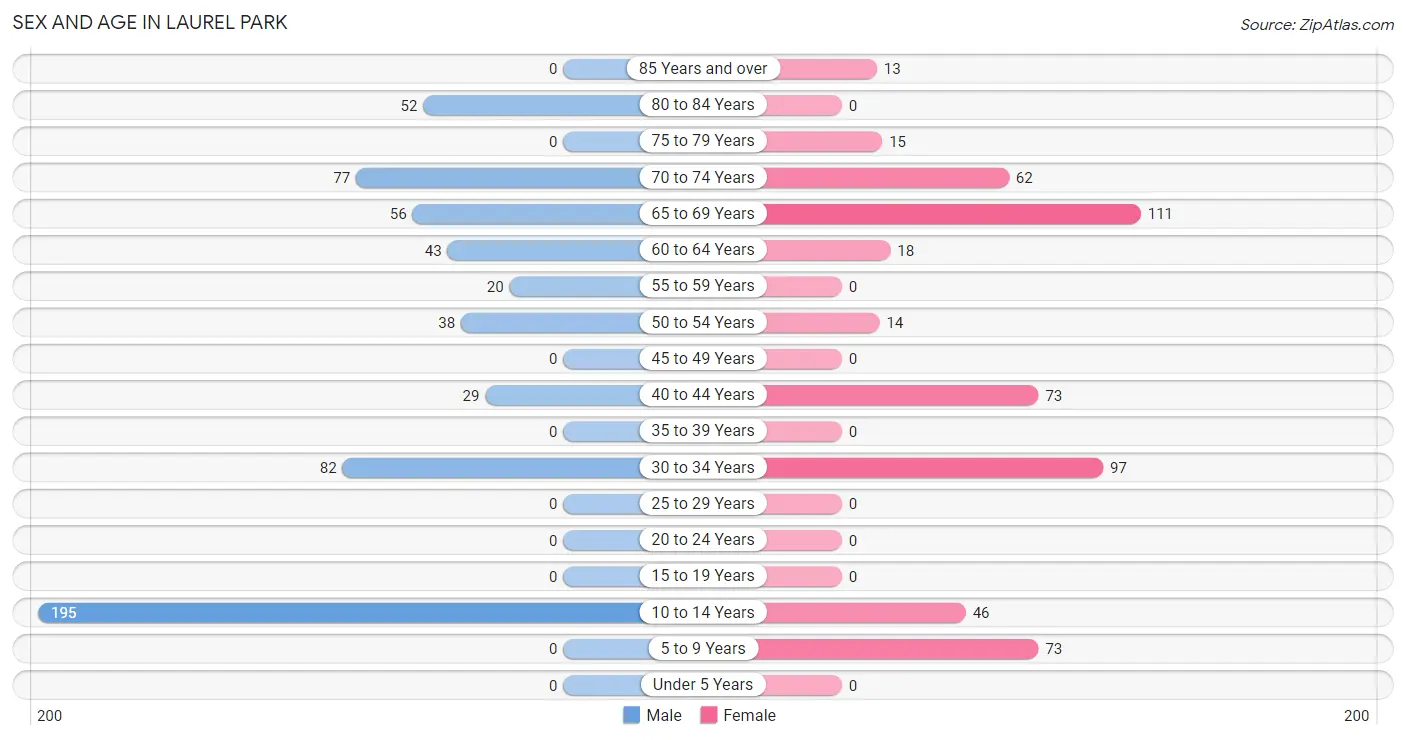
| Age Bracket | Male | Female |
| Under 5 Years | 0 (0.0%) | 0 (0.0%) |
| 5 to 9 Years | 0 (0.0%) | 73 (14.0%) |
| 10 to 14 Years | 195 (32.9%) | 46 (8.8%) |
| 15 to 19 Years | 0 (0.0%) | 0 (0.0%) |
| 20 to 24 Years | 0 (0.0%) | 0 (0.0%) |
| 25 to 29 Years | 0 (0.0%) | 0 (0.0%) |
| 30 to 34 Years | 82 (13.9%) | 97 (18.6%) |
| 35 to 39 Years | 0 (0.0%) | 0 (0.0%) |
| 40 to 44 Years | 29 (4.9%) | 73 (14.0%) |
| 45 to 49 Years | 0 (0.0%) | 0 (0.0%) |
| 50 to 54 Years | 38 (6.4%) | 14 (2.7%) |
| 55 to 59 Years | 20 (3.4%) | 0 (0.0%) |
| 60 to 64 Years | 43 (7.3%) | 18 (3.5%) |
| 65 to 69 Years | 56 (9.5%) | 111 (21.3%) |
| 70 to 74 Years | 77 (13.0%) | 62 (11.9%) |
| 75 to 79 Years | 0 (0.0%) | 15 (2.9%) |
| 80 to 84 Years | 52 (8.8%) | 0 (0.0%) |
| 85 Years and over | 0 (0.0%) | 13 (2.5%) |
| Total | 592 (100.0%) | 522 (100.0%) |
Families and Households in Laurel Park
Median Family Size in Laurel Park
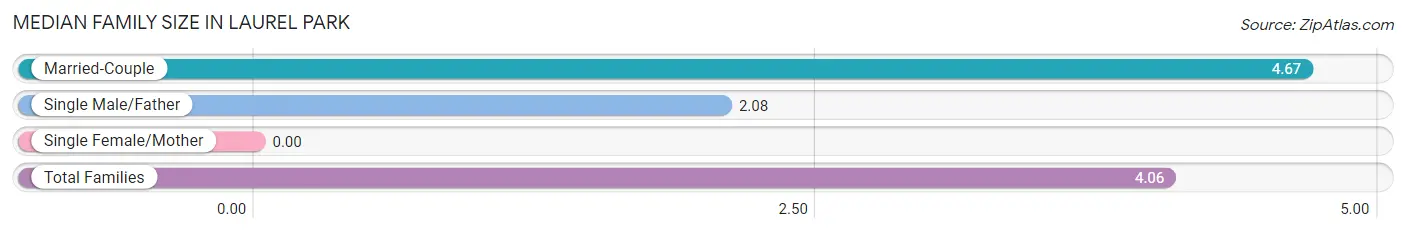
| Family Type | # Families | Family Size |
| Married-Couple | 170 (76.6%) | 4.67 |
| Single Male/Father | 52 (23.4%) | 2.08 |
| Single Female/Mother | 0 (0.0%) | - |
| Total Families | 222 (100.0%) | 4.06 |
Median Household Size in Laurel Park
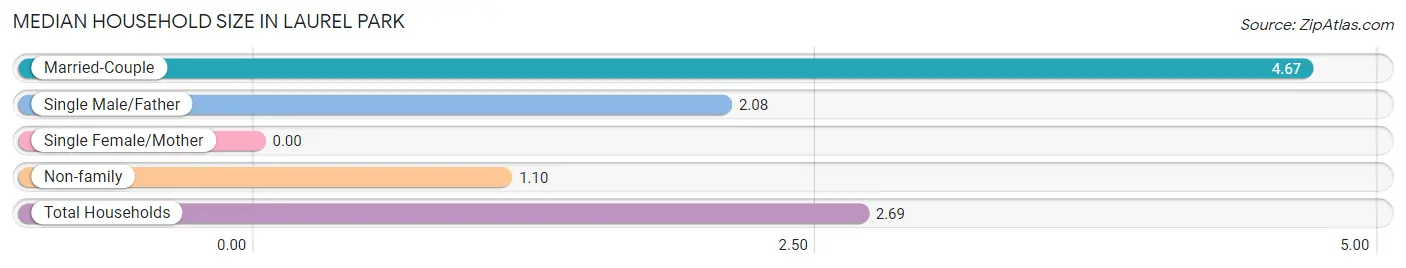
| Household Type | # Households | Household Size |
| Married-Couple | 170 (41.1%) | 4.67 |
| Single Male/Father | 52 (12.6%) | 2.08 |
| Single Female/Mother | 0 (0.0%) | - |
| Non-family | 192 (46.4%) | 1.10 |
| Total Households | 414 (100.0%) | 2.69 |
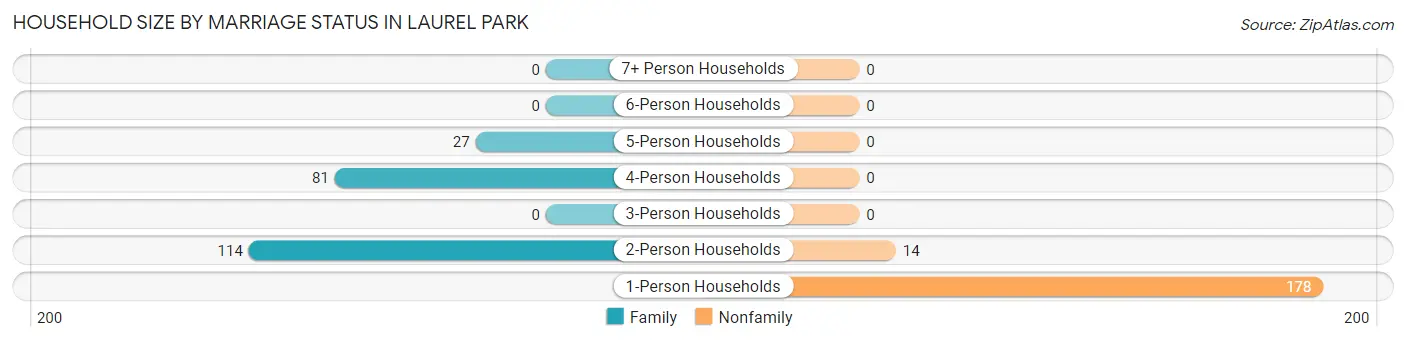
Household Size by Marriage Status in Laurel Park
Out of a total of 414 households in Laurel Park, 222 (53.6%) are family households, while 192 (46.4%) are nonfamily households. The most numerous type of family households are 2-person households, comprising 114, and the most common type of nonfamily households are 1-person households, comprising 178.
| Household Size | Family Households | Nonfamily Households |
| 1-Person Households | - | 178 (43.0%) |
| 2-Person Households | 114 (27.5%) | 14 (3.4%) |
| 3-Person Households | 0 (0.0%) | 0 (0.0%) |
| 4-Person Households | 81 (19.6%) | 0 (0.0%) |
| 5-Person Households | 27 (6.5%) | 0 (0.0%) |
| 6-Person Households | 0 (0.0%) | 0 (0.0%) |
| 7+ Person Households | 0 (0.0%) | 0 (0.0%) |
| Total | 222 (53.6%) | 192 (46.4%) |
Female Fertility in Laurel Park
Fertility by Age in Laurel Park
| Age Bracket | Women with Births | Births / 1,000 Women |
| 15 to 19 years | 0 (0.0%) | 0.0 |
| 20 to 34 years | 0 (0.0%) | 0.0 |
| 35 to 50 years | 0 (0.0%) | 0.0 |
| Total | 0 (0.0%) | 0.0 |
Fertility by Age by Marriage Status in Laurel Park
| Age Bracket | Married | Unmarried |
| 15 to 19 years | 0 (0.0%) | 0 (0.0%) |
| 20 to 34 years | 0 (0.0%) | 0 (0.0%) |
| 35 to 50 years | 0 (0.0%) | 0 (0.0%) |
| Total | 0 (0.0%) | 0 (0.0%) |
Fertility by Education in Laurel Park
| Educational Attainment | Women with Births | Births / 1,000 Women |
| Less than High School | 0 (0.0%) | 0.0 |
| High School Diploma | 0 (0.0%) | 0.0 |
| College or Associate's Degree | 0 (0.0%) | 0.0 |
| Bachelor's Degree | 0 (0.0%) | 0.0 |
| Graduate Degree | 0 (0.0%) | 0.0 |
| Total | 0 (0.0%) | 0.0 |
Fertility by Education by Marriage Status in Laurel Park
| Educational Attainment | Married | Unmarried |
| Less than High School | 0 (0.0%) | 0 (0.0%) |
| High School Diploma | 0 (0.0%) | 0 (0.0%) |
| College or Associate's Degree | 0 (0.0%) | 0 (0.0%) |
| Bachelor's Degree | 0 (0.0%) | 0 (0.0%) |
| Graduate Degree | 0 (0.0%) | 0 (0.0%) |
| Total | 0 (0.0%) | 0 (0.0%) |
Employment Characteristics in Laurel Park
Employment by Class of Employer in Laurel Park
Among the 421 employed individuals in Laurel Park, private company employees (190 | 45.1%), self-employed (not incorporated) (138 | 32.8%), and local government employees (66 | 15.7%) make up the most common classes of employment.
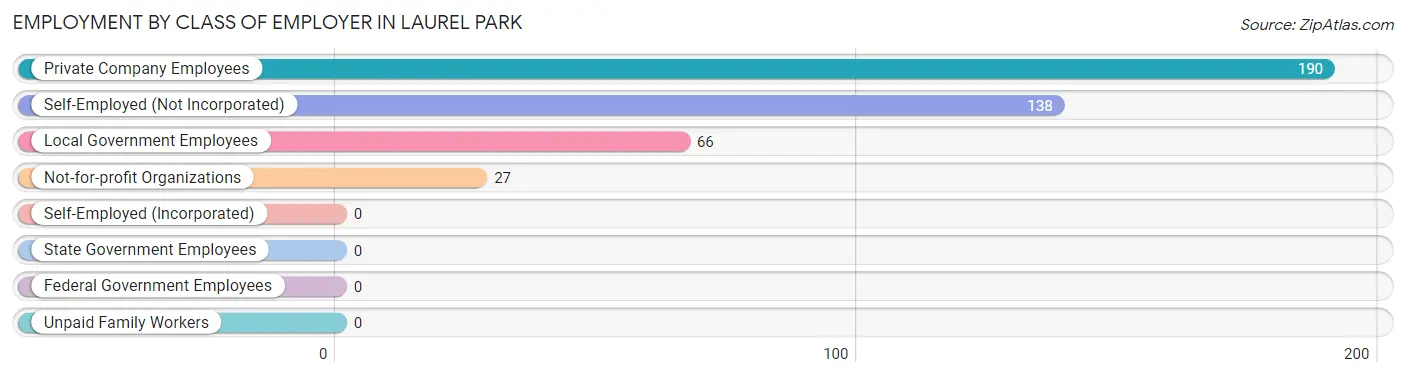
| Employer Class | # Employees | % Employees |
| Private Company Employees | 190 | 45.1% |
| Self-Employed (Incorporated) | 0 | 0.0% |
| Self-Employed (Not Incorporated) | 138 | 32.8% |
| Not-for-profit Organizations | 27 | 6.4% |
| Local Government Employees | 66 | 15.7% |
| State Government Employees | 0 | 0.0% |
| Federal Government Employees | 0 | 0.0% |
| Unpaid Family Workers | 0 | 0.0% |
| Total | 421 | 100.0% |
Employment Status by Age in Laurel Park
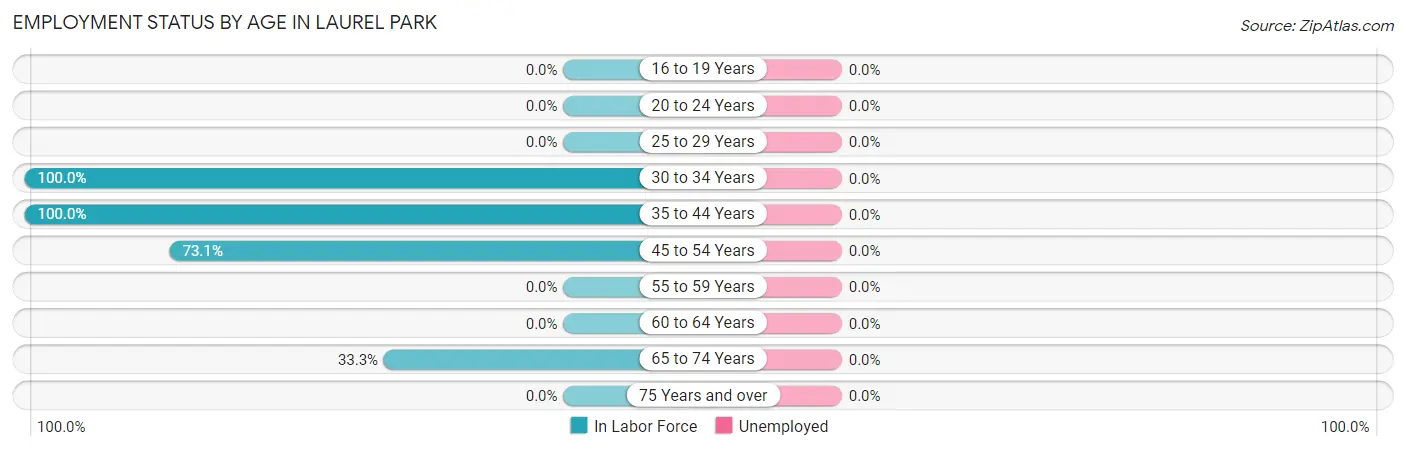
| Age Bracket | In Labor Force | Unemployed |
| 16 to 19 Years | 0 (0.0%) | 0 (0.0%) |
| 20 to 24 Years | 0 (0.0%) | 0 (0.0%) |
| 25 to 29 Years | 0 (0.0%) | 0 (0.0%) |
| 30 to 34 Years | 179 (100.0%) | 0 (0.0%) |
| 35 to 44 Years | 102 (100.0%) | 0 (0.0%) |
| 45 to 54 Years | 38 (73.1%) | 0 (0.0%) |
| 55 to 59 Years | 0 (0.0%) | 0 (0.0%) |
| 60 to 64 Years | 0 (0.0%) | 0 (0.0%) |
| 65 to 74 Years | 102 (33.3%) | 0 (0.0%) |
| 75 Years and over | 0 (0.0%) | 0 (0.0%) |
| Total | 421 (52.6%) | 0 (0.0%) |
Employment Status by Educational Attainment in Laurel Park
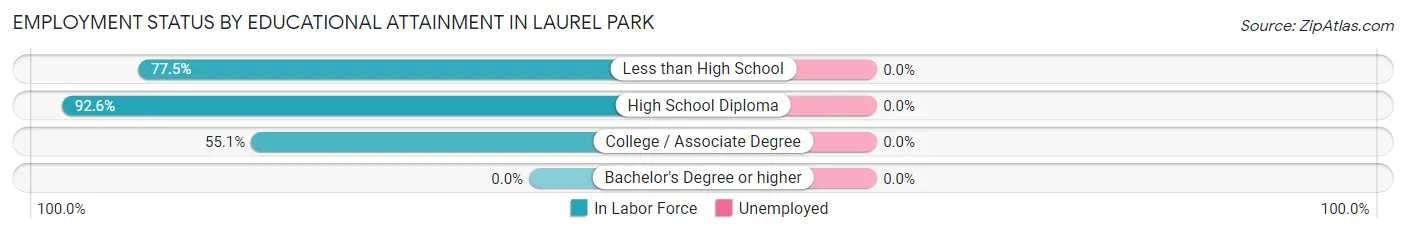
| Educational Attainment | In Labor Force | Unemployed |
| Less than High School | 69 (77.5%) | 0 (0.0%) |
| High School Diploma | 175 (92.6%) | 0 (0.0%) |
| College / Associate Degree | 75 (55.1%) | 0 (0.0%) |
| Bachelor's Degree or higher | 0 (0.0%) | 0 (0.0%) |
| Total | 319 (77.1%) | 0 (0.0%) |
Employment Occupations by Sex in Laurel Park
Management, Business, Science and Arts Occupations
Management, Business, Science and Arts Occupations by Sex
| Occupation | Male | Female |
| Management | 0 (0.0%) | 0 (0.0%) |
| Business & Financial | 0 (0.0%) | 0 (0.0%) |
| Computers, Engineering & Science | 0 (0.0%) | 0 (0.0%) |
| Computers & Mathematics | 0 (0.0%) | 0 (0.0%) |
| Architecture & Engineering | 0 (0.0%) | 0 (0.0%) |
| Life, Physical & Social Science | 0 (0.0%) | 0 (0.0%) |
| Community & Social Service | 0 (0.0%) | 0 (0.0%) |
| Education, Arts & Media | 0 (0.0%) | 0 (0.0%) |
| Legal Services & Support | 0 (0.0%) | 0 (0.0%) |
| Education Instruction & Library | 0 (0.0%) | 0 (0.0%) |
| Arts, Media & Entertainment | 0 (0.0%) | 0 (0.0%) |
| Health Diagnosing & Treating | 0 (0.0%) | 0 (0.0%) |
| Health Technologists | 0 (0.0%) | 0 (0.0%) |
| Total (Category) | 0 (0.0%) | 0 (0.0%) |
| Total (Overall) | 195 (46.3%) | 226 (53.7%) |
Services Occupations
The most common Services occupations in Laurel Park are , and Cleaning & Maintenance (56 | 13.3%).
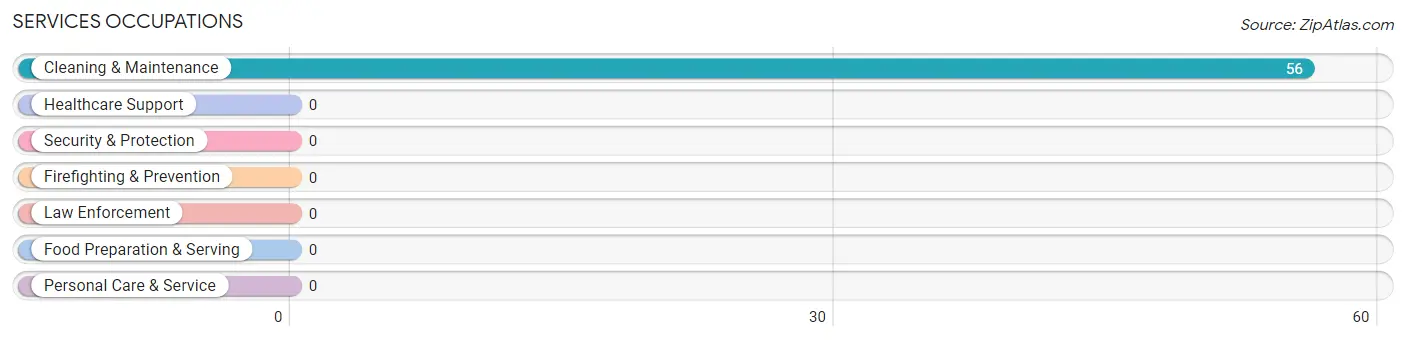
Services Occupations by Sex
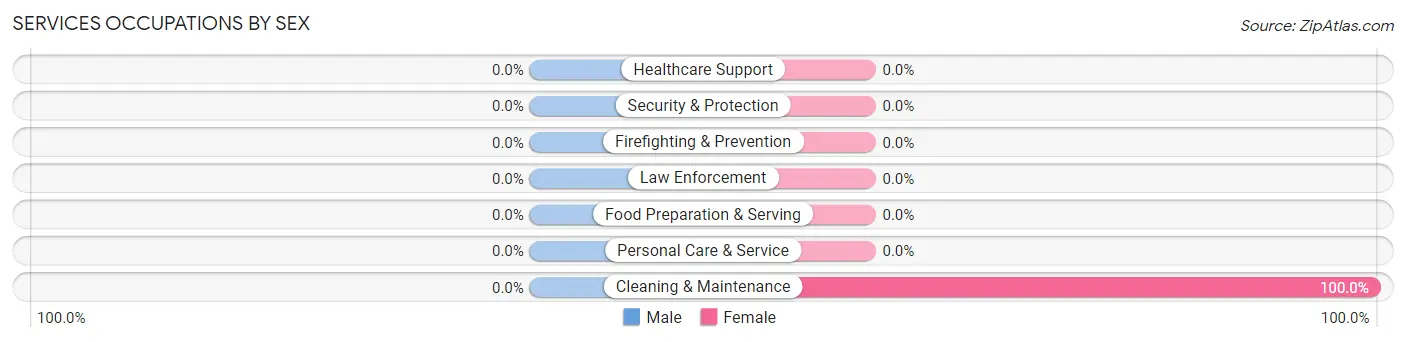
| Occupation | Male | Female |
| Healthcare Support | 0 (0.0%) | 0 (0.0%) |
| Security & Protection | 0 (0.0%) | 0 (0.0%) |
| Firefighting & Prevention | 0 (0.0%) | 0 (0.0%) |
| Law Enforcement | 0 (0.0%) | 0 (0.0%) |
| Food Preparation & Serving | 0 (0.0%) | 0 (0.0%) |
| Cleaning & Maintenance | 0 (0.0%) | 56 (100.0%) |
| Personal Care & Service | 0 (0.0%) | 0 (0.0%) |
| Total (Category) | 0 (0.0%) | 56 (100.0%) |
| Total (Overall) | 195 (46.3%) | 226 (53.7%) |
Sales and Office Occupations
The most common Sales and Office occupations in Laurel Park are Sales & Related (82 | 19.5%), and Office & Administration (73 | 17.3%).
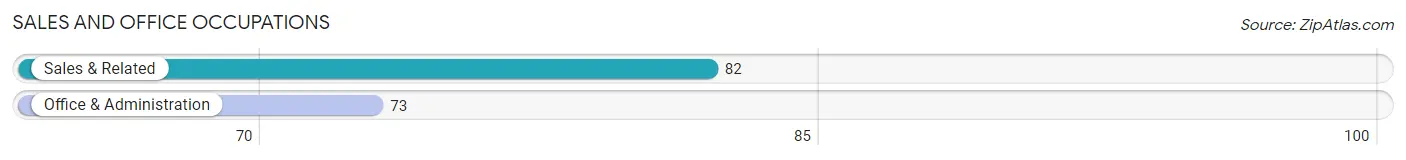
Sales and Office Occupations by Sex

| Occupation | Male | Female |
| Sales & Related | 82 (100.0%) | 0 (0.0%) |
| Office & Administration | 0 (0.0%) | 73 (100.0%) |
| Total (Category) | 82 (52.9%) | 73 (47.1%) |
| Total (Overall) | 195 (46.3%) | 226 (53.7%) |
Natural Resources, Construction and Maintenance Occupations

Natural Resources, Construction and Maintenance Occupations by Sex
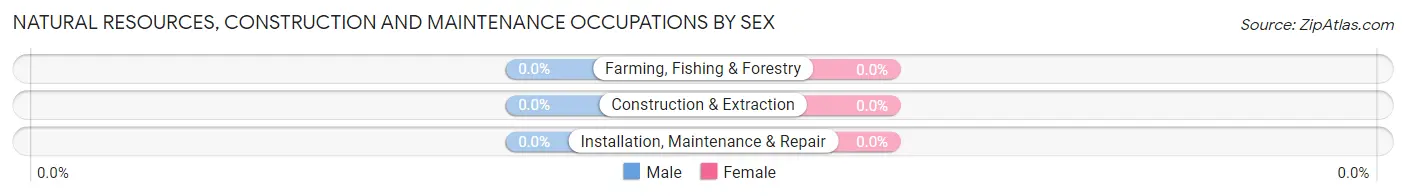
| Occupation | Male | Female |
| Farming, Fishing & Forestry | 0 (0.0%) | 0 (0.0%) |
| Construction & Extraction | 0 (0.0%) | 0 (0.0%) |
| Installation, Maintenance & Repair | 0 (0.0%) | 0 (0.0%) |
| Total (Category) | 0 (0.0%) | 0 (0.0%) |
| Total (Overall) | 195 (46.3%) | 226 (53.7%) |
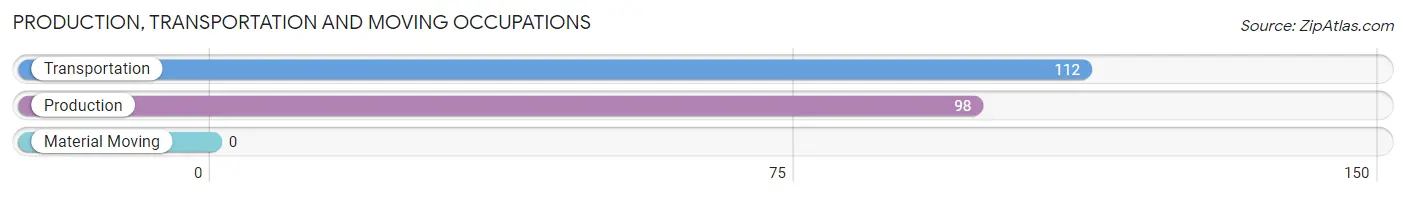
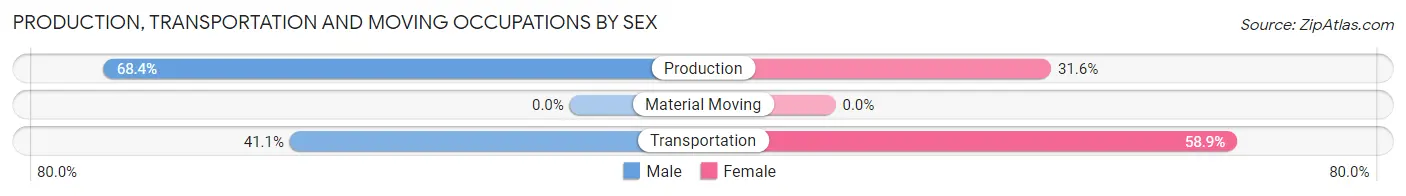
Production, Transportation and Moving Occupations
The most common Production, Transportation and Moving occupations in Laurel Park are Transportation (112 | 26.6%), and Production (98 | 23.3%).
Production, Transportation and Moving Occupations by Sex
| Occupation | Male | Female |
| Production | 67 (68.4%) | 31 (31.6%) |
| Transportation | 46 (41.1%) | 66 (58.9%) |
| Material Moving | 0 (0.0%) | 0 (0.0%) |
| Total (Category) | 113 (53.8%) | 97 (46.2%) |
| Total (Overall) | 195 (46.3%) | 226 (53.7%) |
Employment Industries by Sex in Laurel Park
Employment Industries in Laurel Park
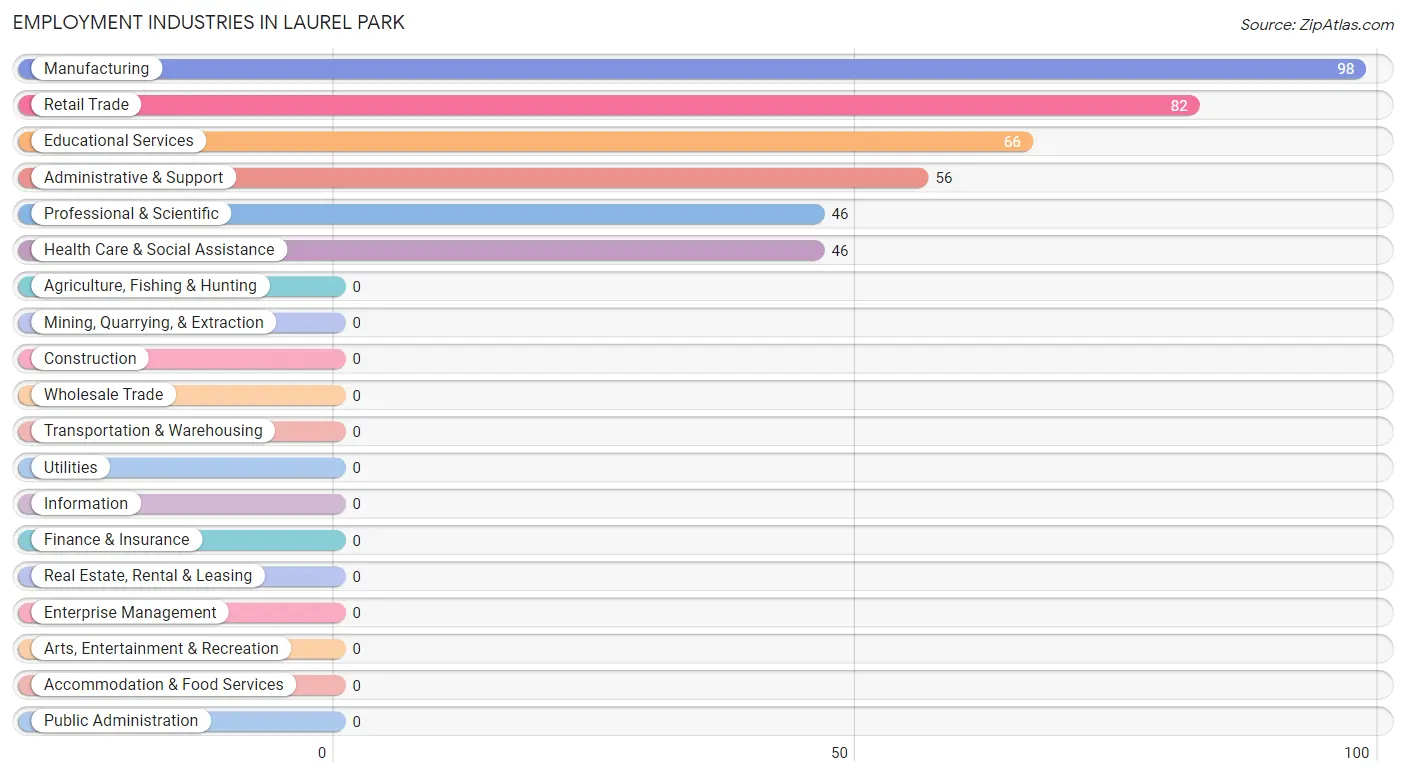
The major employment industries in Laurel Park include Manufacturing (98 | 23.3%), Retail Trade (82 | 19.5%), Educational Services (66 | 15.7%), Administrative & Support (56 | 13.3%), and Professional & Scientific (46 | 10.9%).
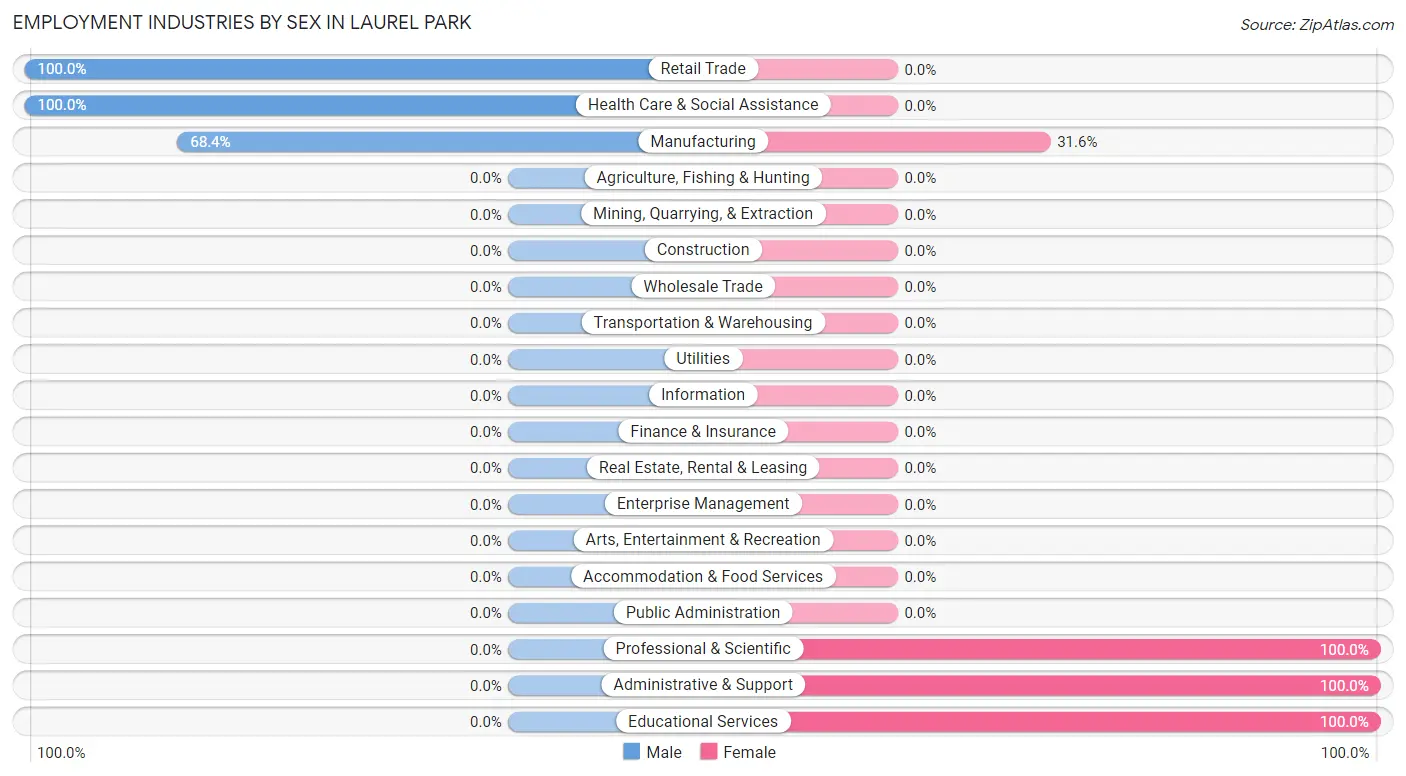
Employment Industries by Sex in Laurel Park
The Laurel Park industries that see more men than women are Retail Trade (100.0%), Health Care & Social Assistance (100.0%), and Manufacturing (68.4%), whereas the industries that tend to have a higher number of women are Professional & Scientific (100.0%), Administrative & Support (100.0%), and Educational Services (100.0%).
| Industry | Male | Female |
| Agriculture, Fishing & Hunting | 0 (0.0%) | 0 (0.0%) |
| Mining, Quarrying, & Extraction | 0 (0.0%) | 0 (0.0%) |
| Construction | 0 (0.0%) | 0 (0.0%) |
| Manufacturing | 67 (68.4%) | 31 (31.6%) |
| Wholesale Trade | 0 (0.0%) | 0 (0.0%) |
| Retail Trade | 82 (100.0%) | 0 (0.0%) |
| Transportation & Warehousing | 0 (0.0%) | 0 (0.0%) |
| Utilities | 0 (0.0%) | 0 (0.0%) |
| Information | 0 (0.0%) | 0 (0.0%) |
| Finance & Insurance | 0 (0.0%) | 0 (0.0%) |
| Real Estate, Rental & Leasing | 0 (0.0%) | 0 (0.0%) |
| Professional & Scientific | 0 (0.0%) | 46 (100.0%) |
| Enterprise Management | 0 (0.0%) | 0 (0.0%) |
| Administrative & Support | 0 (0.0%) | 56 (100.0%) |
| Educational Services | 0 (0.0%) | 66 (100.0%) |
| Health Care & Social Assistance | 46 (100.0%) | 0 (0.0%) |
| Arts, Entertainment & Recreation | 0 (0.0%) | 0 (0.0%) |
| Accommodation & Food Services | 0 (0.0%) | 0 (0.0%) |
| Public Administration | 0 (0.0%) | 0 (0.0%) |
| Total | 195 (46.3%) | 226 (53.7%) |
Education in Laurel Park
School Enrollment in Laurel Park
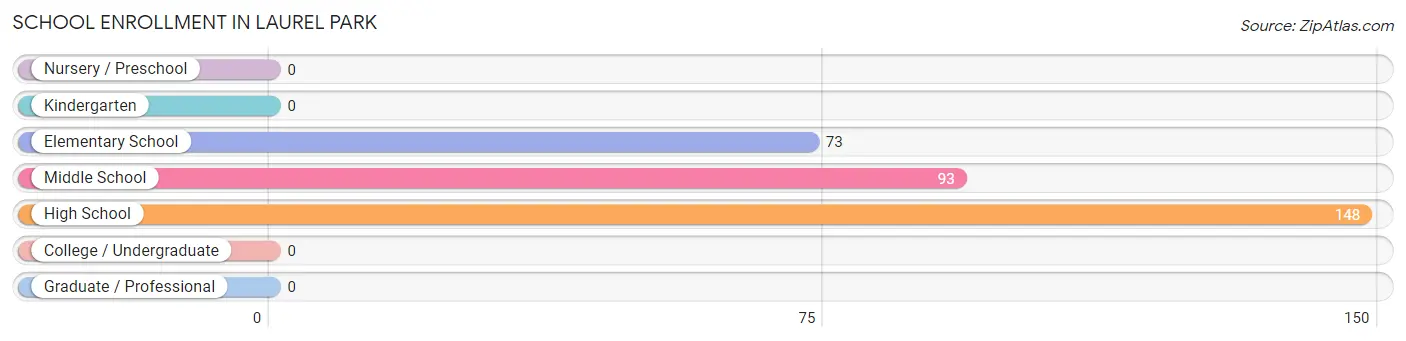
The most common levels of schooling among the 314 students in Laurel Park are high school (148 | 47.1%), middle school (93 | 29.6%), and elementary school (73 | 23.3%).
| School Level | # Students | % Students |
| Nursery / Preschool | 0 | 0.0% |
| Kindergarten | 0 | 0.0% |
| Elementary School | 73 | 23.3% |
| Middle School | 93 | 29.6% |
| High School | 148 | 47.1% |
| College / Undergraduate | 0 | 0.0% |
| Graduate / Professional | 0 | 0.0% |
| Total | 314 | 100.0% |
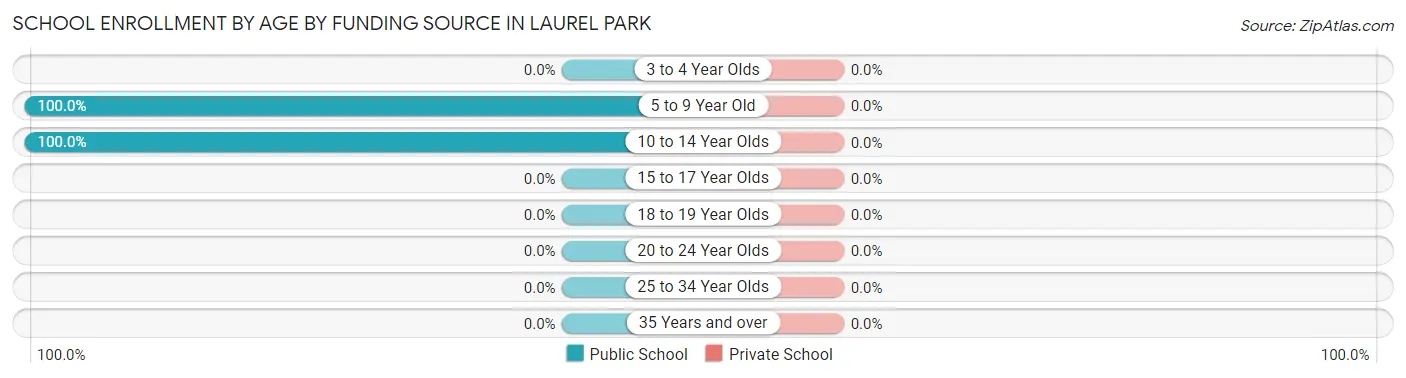
School Enrollment by Age by Funding Source in Laurel Park
| Age Bracket | Public School | Private School |
| 3 to 4 Year Olds | 0 (0.0%) | 0 (0.0%) |
| 5 to 9 Year Old | 73 (100.0%) | 0 (0.0%) |
| 10 to 14 Year Olds | 241 (100.0%) | 0 (0.0%) |
| 15 to 17 Year Olds | 0 (0.0%) | 0 (0.0%) |
| 18 to 19 Year Olds | 0 (0.0%) | 0 (0.0%) |
| 20 to 24 Year Olds | 0 (0.0%) | 0 (0.0%) |
| 25 to 34 Year Olds | 0 (0.0%) | 0 (0.0%) |
| 35 Years and over | 0 (0.0%) | 0 (0.0%) |
| Total | 314 (100.0%) | 0 (0.0%) |
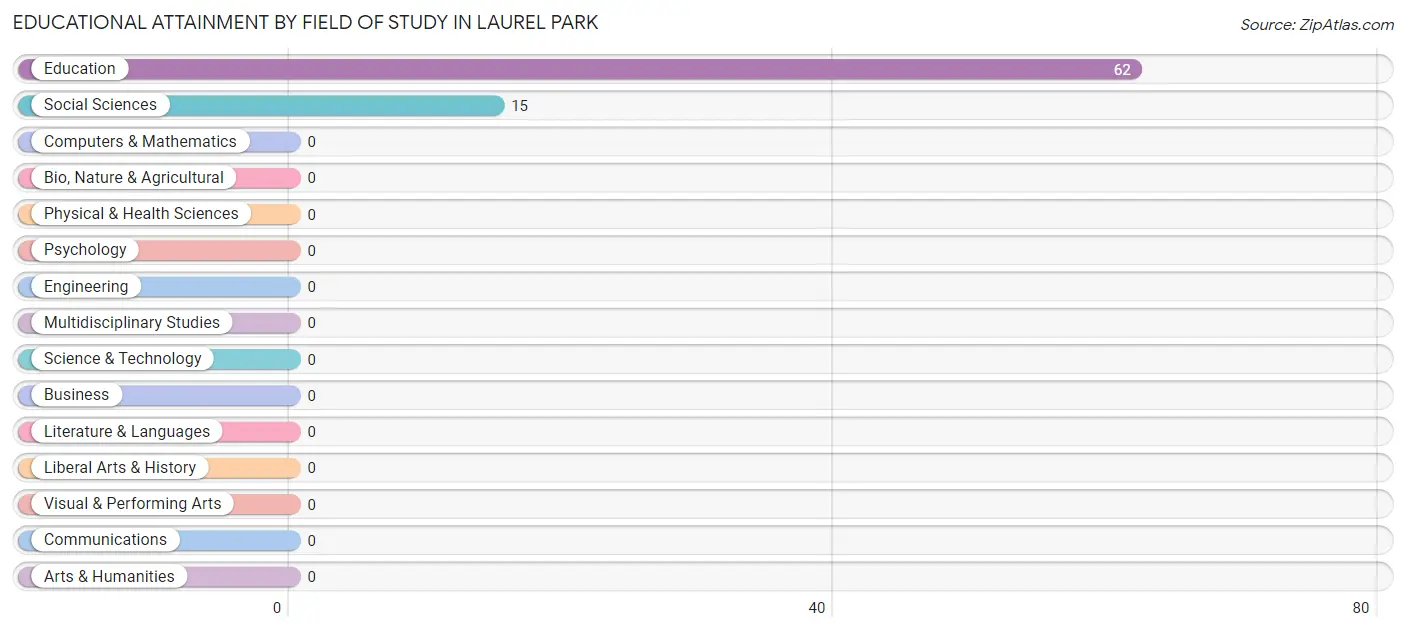
Educational Attainment by Field of Study in Laurel Park
Education (62 | 80.5%), and social sciences (15 | 19.5%) are the most common fields of study among 77 individuals in Laurel Park who have obtained a bachelor's degree or higher.
| Field of Study | # Graduates | % Graduates |
| Computers & Mathematics | 0 | 0.0% |
| Bio, Nature & Agricultural | 0 | 0.0% |
| Physical & Health Sciences | 0 | 0.0% |
| Psychology | 0 | 0.0% |
| Social Sciences | 15 | 19.5% |
| Engineering | 0 | 0.0% |
| Multidisciplinary Studies | 0 | 0.0% |
| Science & Technology | 0 | 0.0% |
| Business | 0 | 0.0% |
| Education | 62 | 80.5% |
| Literature & Languages | 0 | 0.0% |
| Liberal Arts & History | 0 | 0.0% |
| Visual & Performing Arts | 0 | 0.0% |
| Communications | 0 | 0.0% |
| Arts & Humanities | 0 | 0.0% |
| Total | 77 | 100.0% |
Transportation & Commute in Laurel Park
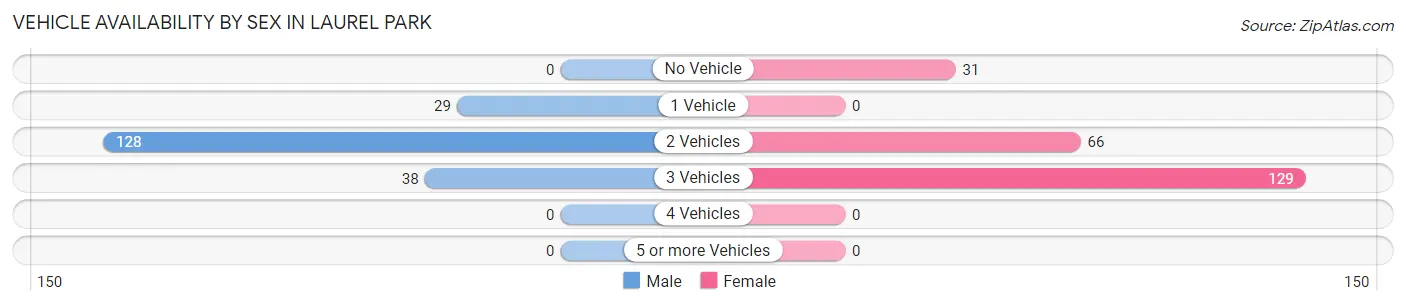
Vehicle Availability by Sex in Laurel Park
The most prevalent vehicle ownership categories in Laurel Park are males with 2 vehicles (128, accounting for 65.6%) and females with 2 vehicles (66, making up 56.6%).
| Vehicles Available | Male | Female |
| No Vehicle | 0 (0.0%) | 31 (13.7%) |
| 1 Vehicle | 29 (14.9%) | 0 (0.0%) |
| 2 Vehicles | 128 (65.6%) | 66 (29.2%) |
| 3 Vehicles | 38 (19.5%) | 129 (57.1%) |
| 4 Vehicles | 0 (0.0%) | 0 (0.0%) |
| 5 or more Vehicles | 0 (0.0%) | 0 (0.0%) |
| Total | 195 (100.0%) | 226 (100.0%) |
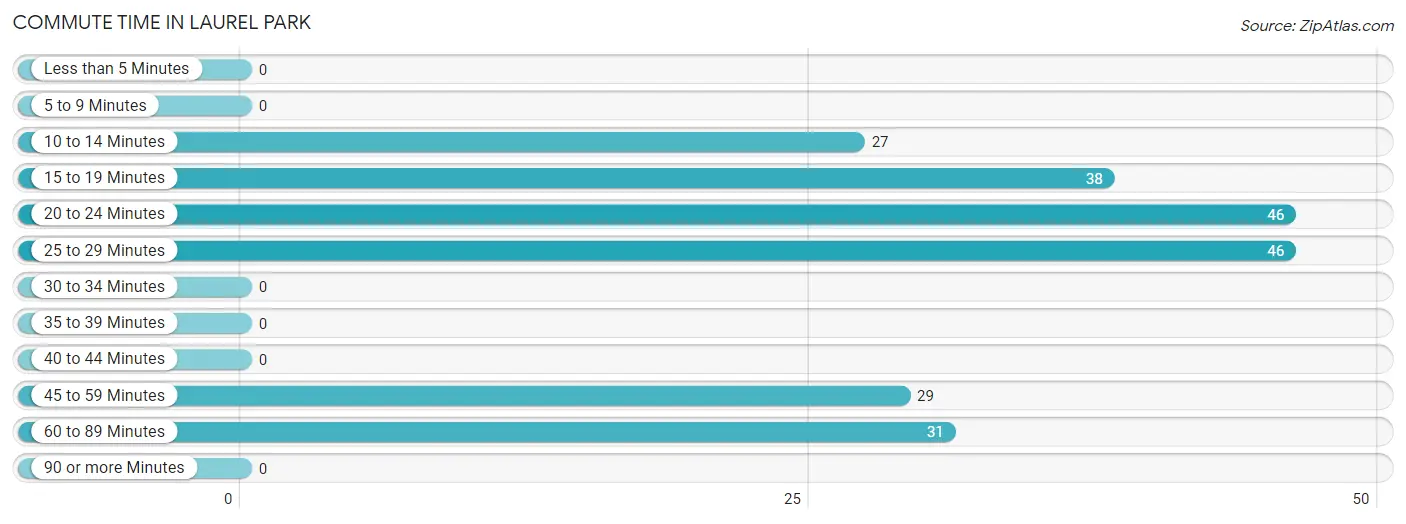
Commute Time in Laurel Park
The most frequently occuring commute durations in Laurel Park are 20 to 24 minutes (46 commuters, 21.2%), 25 to 29 minutes (46 commuters, 21.2%), and 15 to 19 minutes (38 commuters, 17.5%).
| Commute Time | # Commuters | % Commuters |
| Less than 5 Minutes | 0 | 0.0% |
| 5 to 9 Minutes | 0 | 0.0% |
| 10 to 14 Minutes | 27 | 12.4% |
| 15 to 19 Minutes | 38 | 17.5% |
| 20 to 24 Minutes | 46 | 21.2% |
| 25 to 29 Minutes | 46 | 21.2% |
| 30 to 34 Minutes | 0 | 0.0% |
| 35 to 39 Minutes | 0 | 0.0% |
| 40 to 44 Minutes | 0 | 0.0% |
| 45 to 59 Minutes | 29 | 13.4% |
| 60 to 89 Minutes | 31 | 14.3% |
| 90 or more Minutes | 0 | 0.0% |
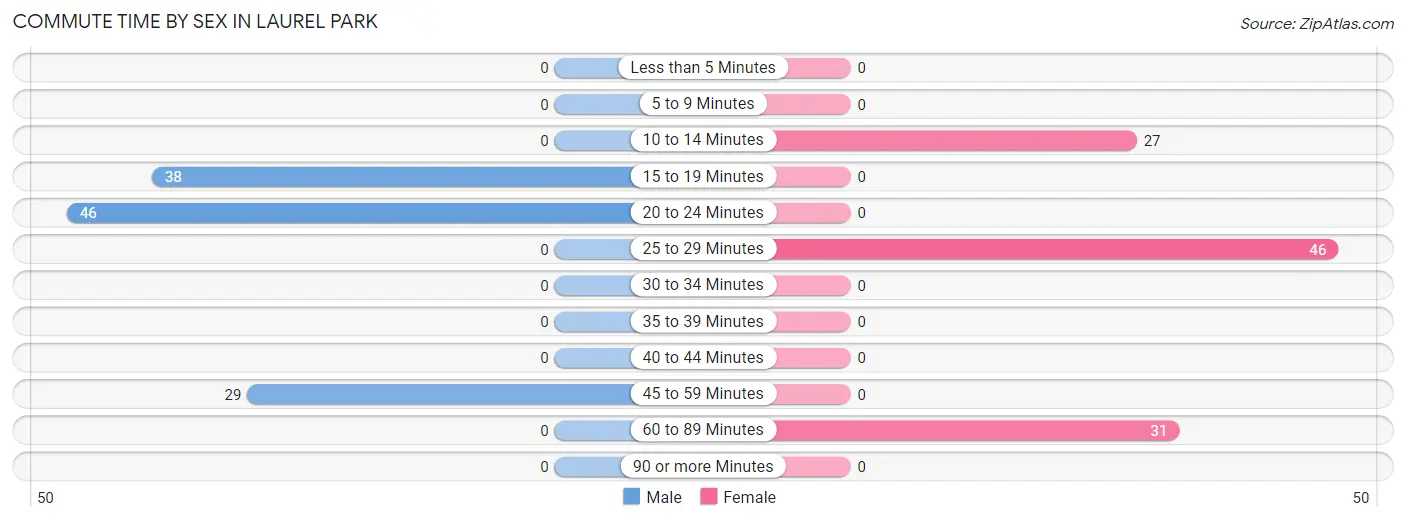
Commute Time by Sex in Laurel Park
The most common commute times in Laurel Park are 20 to 24 minutes (46 commuters, 40.7%) for males and 25 to 29 minutes (46 commuters, 44.2%) for females.
| Commute Time | Male | Female |
| Less than 5 Minutes | 0 (0.0%) | 0 (0.0%) |
| 5 to 9 Minutes | 0 (0.0%) | 0 (0.0%) |
| 10 to 14 Minutes | 0 (0.0%) | 27 (26.0%) |
| 15 to 19 Minutes | 38 (33.6%) | 0 (0.0%) |
| 20 to 24 Minutes | 46 (40.7%) | 0 (0.0%) |
| 25 to 29 Minutes | 0 (0.0%) | 46 (44.2%) |
| 30 to 34 Minutes | 0 (0.0%) | 0 (0.0%) |
| 35 to 39 Minutes | 0 (0.0%) | 0 (0.0%) |
| 40 to 44 Minutes | 0 (0.0%) | 0 (0.0%) |
| 45 to 59 Minutes | 29 (25.7%) | 0 (0.0%) |
| 60 to 89 Minutes | 0 (0.0%) | 31 (29.8%) |
| 90 or more Minutes | 0 (0.0%) | 0 (0.0%) |
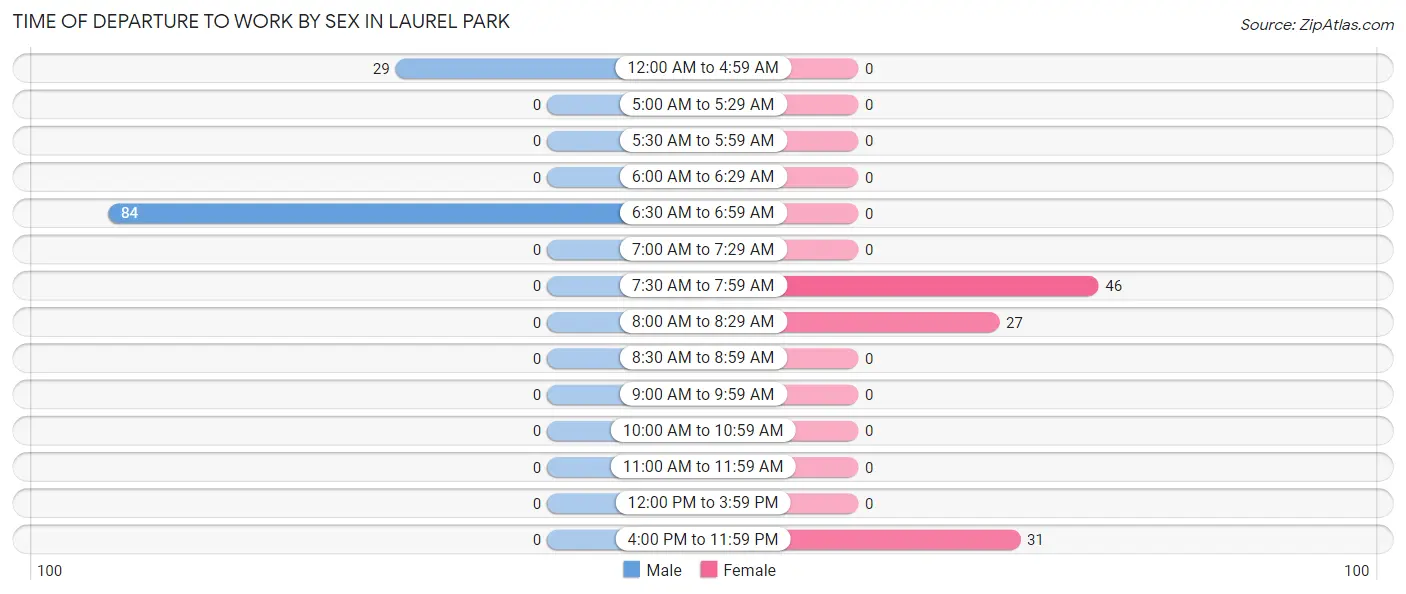
Time of Departure to Work by Sex in Laurel Park
The most frequent times of departure to work in Laurel Park are 6:30 AM to 6:59 AM (84, 74.3%) for males and 7:30 AM to 7:59 AM (46, 44.2%) for females.
| Time of Departure | Male | Female |
| 12:00 AM to 4:59 AM | 29 (25.7%) | 0 (0.0%) |
| 5:00 AM to 5:29 AM | 0 (0.0%) | 0 (0.0%) |
| 5:30 AM to 5:59 AM | 0 (0.0%) | 0 (0.0%) |
| 6:00 AM to 6:29 AM | 0 (0.0%) | 0 (0.0%) |
| 6:30 AM to 6:59 AM | 84 (74.3%) | 0 (0.0%) |
| 7:00 AM to 7:29 AM | 0 (0.0%) | 0 (0.0%) |
| 7:30 AM to 7:59 AM | 0 (0.0%) | 46 (44.2%) |
| 8:00 AM to 8:29 AM | 0 (0.0%) | 27 (26.0%) |
| 8:30 AM to 8:59 AM | 0 (0.0%) | 0 (0.0%) |
| 9:00 AM to 9:59 AM | 0 (0.0%) | 0 (0.0%) |
| 10:00 AM to 10:59 AM | 0 (0.0%) | 0 (0.0%) |
| 11:00 AM to 11:59 AM | 0 (0.0%) | 0 (0.0%) |
| 12:00 PM to 3:59 PM | 0 (0.0%) | 0 (0.0%) |
| 4:00 PM to 11:59 PM | 0 (0.0%) | 31 (29.8%) |
| Total | 113 (100.0%) | 104 (100.0%) |
Housing Occupancy in Laurel Park
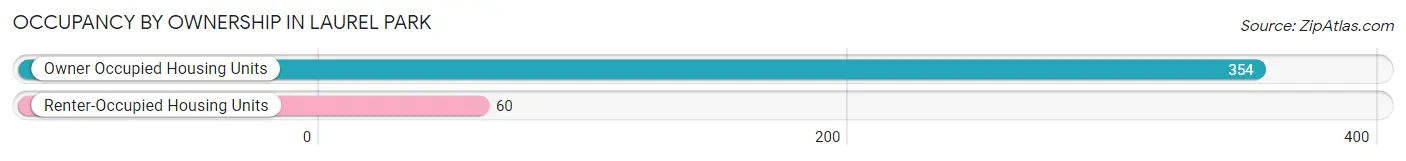
Occupancy by Ownership in Laurel Park
Of the total 414 dwellings in Laurel Park, owner-occupied units account for 354 (85.5%), while renter-occupied units make up 60 (14.5%).
| Occupancy | # Housing Units | % Housing Units |
| Owner Occupied Housing Units | 354 | 85.5% |
| Renter-Occupied Housing Units | 60 | 14.5% |
| Total Occupied Housing Units | 414 | 100.0% |
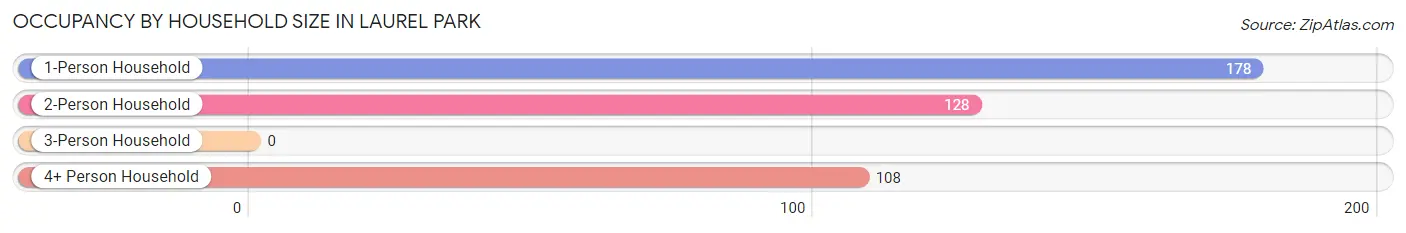
Occupancy by Household Size in Laurel Park
| Household Size | # Housing Units | % Housing Units |
| 1-Person Household | 178 | 43.0% |
| 2-Person Household | 128 | 30.9% |
| 3-Person Household | 0 | 0.0% |
| 4+ Person Household | 108 | 26.1% |
| Total Housing Units | 414 | 100.0% |
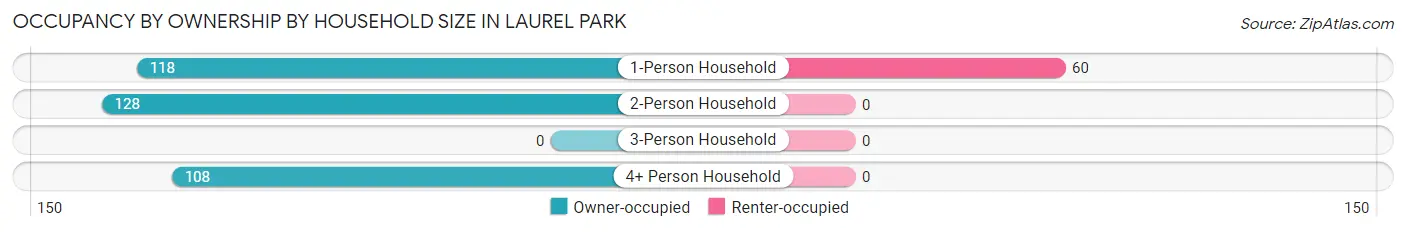
Occupancy by Ownership by Household Size in Laurel Park
| Household Size | Owner-occupied | Renter-occupied |
| 1-Person Household | 118 (66.3%) | 60 (33.7%) |
| 2-Person Household | 128 (100.0%) | 0 (0.0%) |
| 3-Person Household | 0 (0.0%) | 0 (0.0%) |
| 4+ Person Household | 108 (100.0%) | 0 (0.0%) |
| Total Housing Units | 354 (85.5%) | 60 (14.5%) |
Occupancy by Educational Attainment in Laurel Park
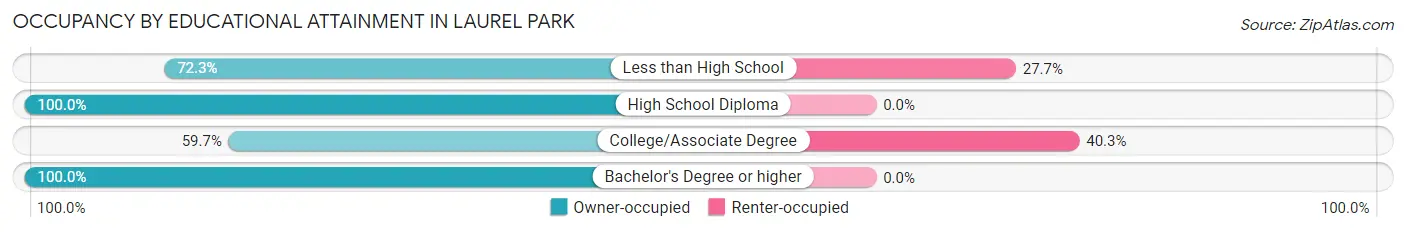
| Household Size | Owner-occupied | Renter-occupied |
| Less than High School | 81 (72.3%) | 31 (27.7%) |
| High School Diploma | 153 (100.0%) | 0 (0.0%) |
| College/Associate Degree | 43 (59.7%) | 29 (40.3%) |
| Bachelor's Degree or higher | 77 (100.0%) | 0 (0.0%) |
Occupancy by Age of Householder in Laurel Park
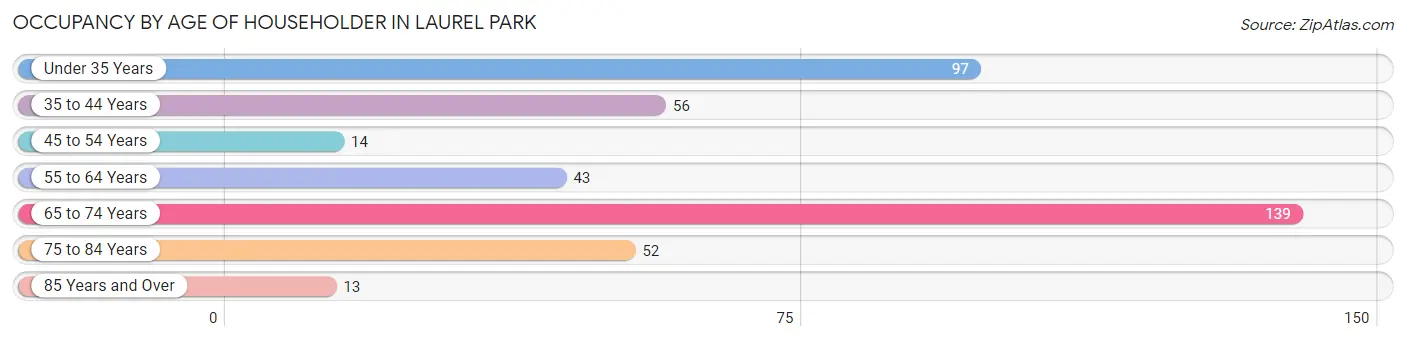
| Age Bracket | # Households | % Households |
| Under 35 Years | 97 | 23.4% |
| 35 to 44 Years | 56 | 13.5% |
| 45 to 54 Years | 14 | 3.4% |
| 55 to 64 Years | 43 | 10.4% |
| 65 to 74 Years | 139 | 33.6% |
| 75 to 84 Years | 52 | 12.6% |
| 85 Years and Over | 13 | 3.1% |
| Total | 414 | 100.0% |
Housing Finances in Laurel Park
Median Income by Occupancy in Laurel Park
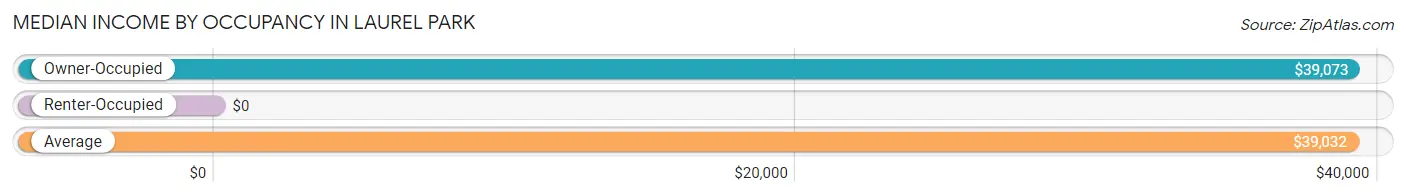
| Occupancy Type | # Households | Median Income |
| Owner-Occupied | 354 (85.5%) | $39,073 |
| Renter-Occupied | 60 (14.5%) | $0 |
| Average | 414 (100.0%) | $39,032 |
Occupancy by Householder Income Bracket in Laurel Park
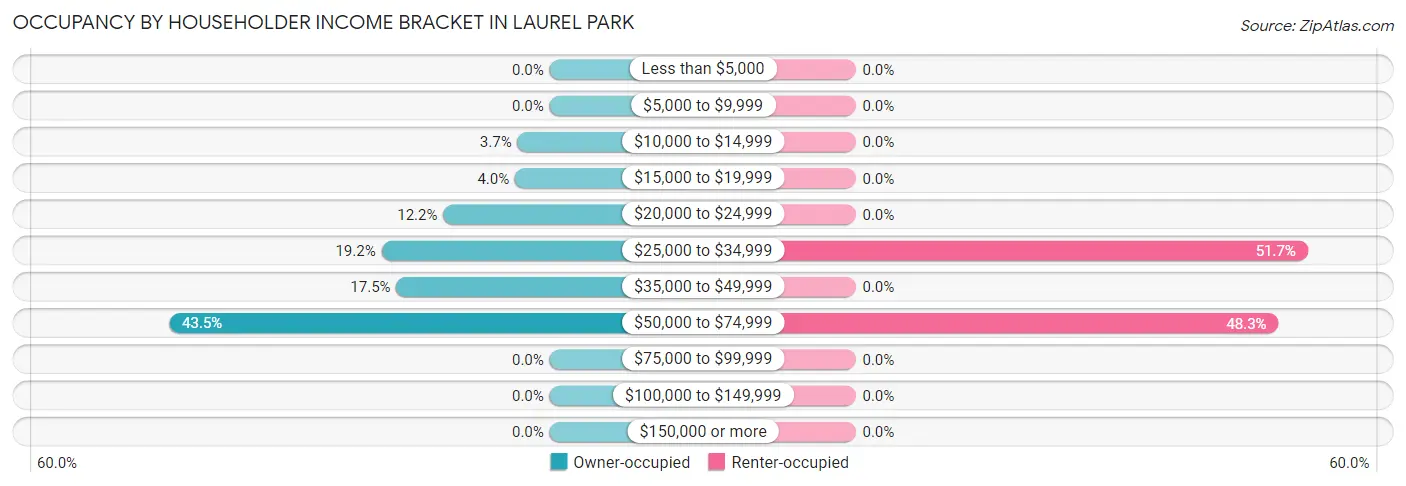
| Income Bracket | Owner-occupied | Renter-occupied |
| Less than $5,000 | 0 (0.0%) | 0 (0.0%) |
| $5,000 to $9,999 | 0 (0.0%) | 0 (0.0%) |
| $10,000 to $14,999 | 13 (3.7%) | 0 (0.0%) |
| $15,000 to $19,999 | 14 (4.0%) | 0 (0.0%) |
| $20,000 to $24,999 | 43 (12.1%) | 0 (0.0%) |
| $25,000 to $34,999 | 68 (19.2%) | 31 (51.7%) |
| $35,000 to $49,999 | 62 (17.5%) | 0 (0.0%) |
| $50,000 to $74,999 | 154 (43.5%) | 29 (48.3%) |
| $75,000 to $99,999 | 0 (0.0%) | 0 (0.0%) |
| $100,000 to $149,999 | 0 (0.0%) | 0 (0.0%) |
| $150,000 or more | 0 (0.0%) | 0 (0.0%) |
| Total | 354 (100.0%) | 60 (100.0%) |
Monthly Housing Cost Tiers in Laurel Park
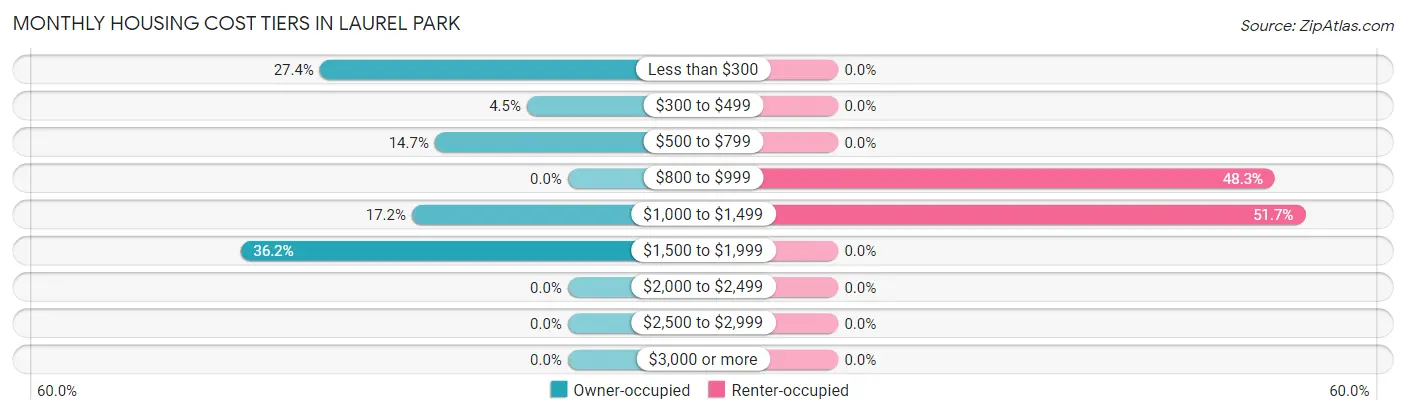
| Monthly Cost | Owner-occupied | Renter-occupied |
| Less than $300 | 97 (27.4%) | 0 (0.0%) |
| $300 to $499 | 16 (4.5%) | 0 (0.0%) |
| $500 to $799 | 52 (14.7%) | 0 (0.0%) |
| $800 to $999 | 0 (0.0%) | 29 (48.3%) |
| $1,000 to $1,499 | 61 (17.2%) | 31 (51.7%) |
| $1,500 to $1,999 | 128 (36.2%) | 0 (0.0%) |
| $2,000 to $2,499 | 0 (0.0%) | 0 (0.0%) |
| $2,500 to $2,999 | 0 (0.0%) | 0 (0.0%) |
| $3,000 or more | 0 (0.0%) | 0 (0.0%) |
| Total | 354 (100.0%) | 60 (100.0%) |
Physical Housing Characteristics in Laurel Park
Housing Structures in Laurel Park
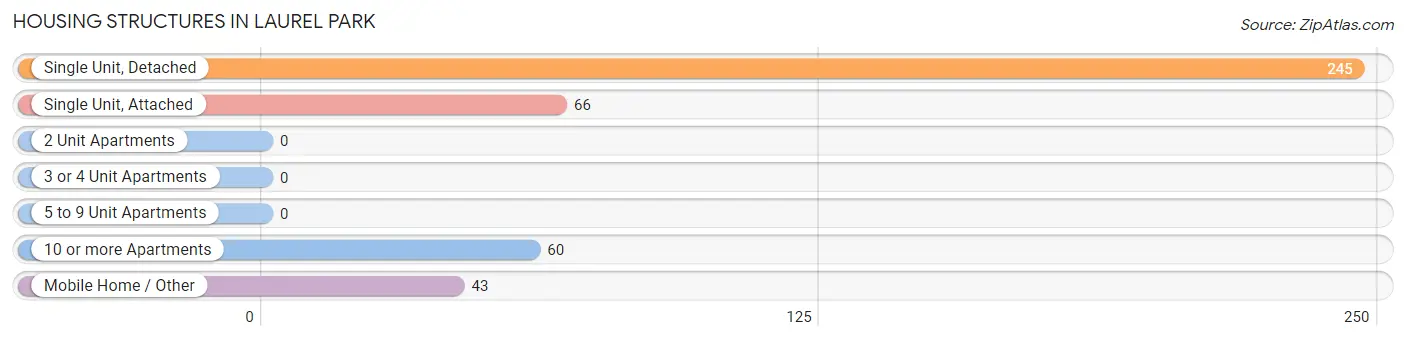
| Structure Type | # Housing Units | % Housing Units |
| Single Unit, Detached | 245 | 59.2% |
| Single Unit, Attached | 66 | 15.9% |
| 2 Unit Apartments | 0 | 0.0% |
| 3 or 4 Unit Apartments | 0 | 0.0% |
| 5 to 9 Unit Apartments | 0 | 0.0% |
| 10 or more Apartments | 60 | 14.5% |
| Mobile Home / Other | 43 | 10.4% |
| Total | 414 | 100.0% |
Housing Structures by Occupancy in Laurel Park

| Structure Type | Owner-occupied | Renter-occupied |
| Single Unit, Detached | 245 (100.0%) | 0 (0.0%) |
| Single Unit, Attached | 66 (100.0%) | 0 (0.0%) |
| 2 Unit Apartments | 0 (0.0%) | 0 (0.0%) |
| 3 or 4 Unit Apartments | 0 (0.0%) | 0 (0.0%) |
| 5 to 9 Unit Apartments | 0 (0.0%) | 0 (0.0%) |
| 10 or more Apartments | 0 (0.0%) | 60 (100.0%) |
| Mobile Home / Other | 43 (100.0%) | 0 (0.0%) |
| Total | 354 (85.5%) | 60 (14.5%) |
Housing Structures by Number of Rooms in Laurel Park
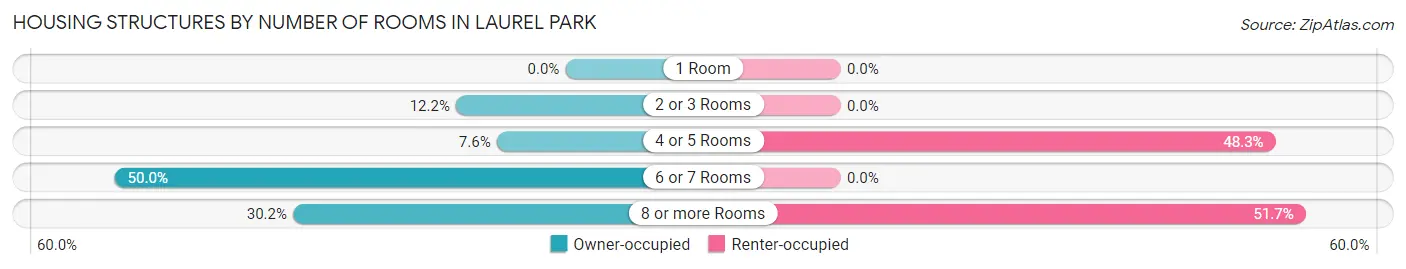
| Number of Rooms | Owner-occupied | Renter-occupied |
| 1 Room | 0 (0.0%) | 0 (0.0%) |
| 2 or 3 Rooms | 43 (12.1%) | 0 (0.0%) |
| 4 or 5 Rooms | 27 (7.6%) | 29 (48.3%) |
| 6 or 7 Rooms | 177 (50.0%) | 0 (0.0%) |
| 8 or more Rooms | 107 (30.2%) | 31 (51.7%) |
| Total | 354 (100.0%) | 60 (100.0%) |
Housing Structure by Heating Type in Laurel Park
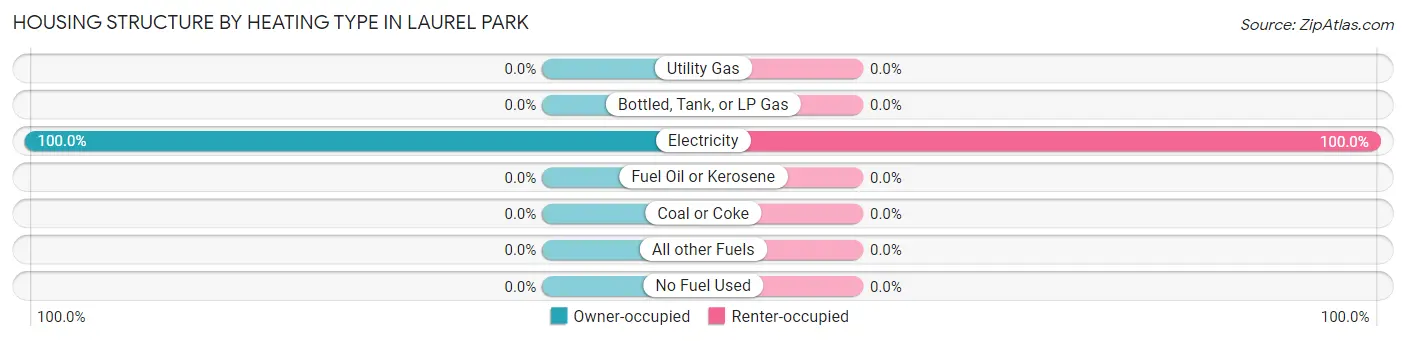
| Heating Type | Owner-occupied | Renter-occupied |
| Utility Gas | 0 (0.0%) | 0 (0.0%) |
| Bottled, Tank, or LP Gas | 0 (0.0%) | 0 (0.0%) |
| Electricity | 354 (100.0%) | 60 (100.0%) |
| Fuel Oil or Kerosene | 0 (0.0%) | 0 (0.0%) |
| Coal or Coke | 0 (0.0%) | 0 (0.0%) |
| All other Fuels | 0 (0.0%) | 0 (0.0%) |
| No Fuel Used | 0 (0.0%) | 0 (0.0%) |
| Total | 354 (100.0%) | 60 (100.0%) |
Household Vehicle Usage in Laurel Park
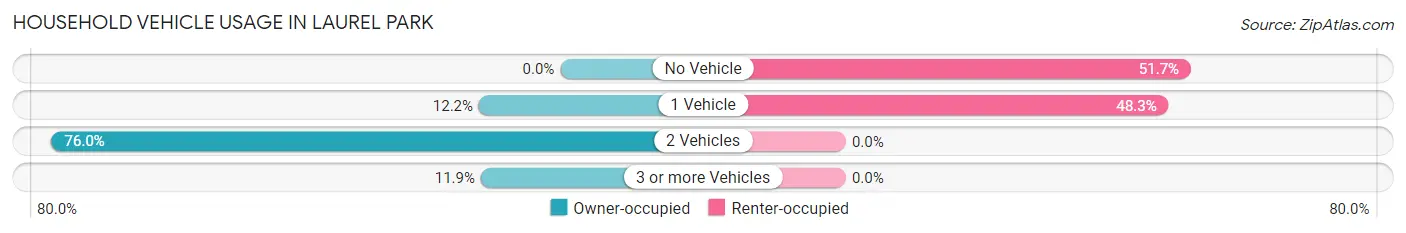
| Vehicles per Household | Owner-occupied | Renter-occupied |
| No Vehicle | 0 (0.0%) | 31 (51.7%) |
| 1 Vehicle | 43 (12.1%) | 29 (48.3%) |
| 2 Vehicles | 269 (76.0%) | 0 (0.0%) |
| 3 or more Vehicles | 42 (11.9%) | 0 (0.0%) |
| Total | 354 (100.0%) | 60 (100.0%) |
Real Estate & Mortgages in Laurel Park
Real Estate and Mortgage Overview in Laurel Park
| Characteristic | Without Mortgage | With Mortgage |
| Housing Units | 165 | 189 |
| Median Property Value | $124,700 | $140,700 |
| Median Household Income | $27,960 | $0 |
| Monthly Housing Costs | $290 | $0 |
| Real Estate Taxes | - | - |
Property Value by Mortgage Status in Laurel Park
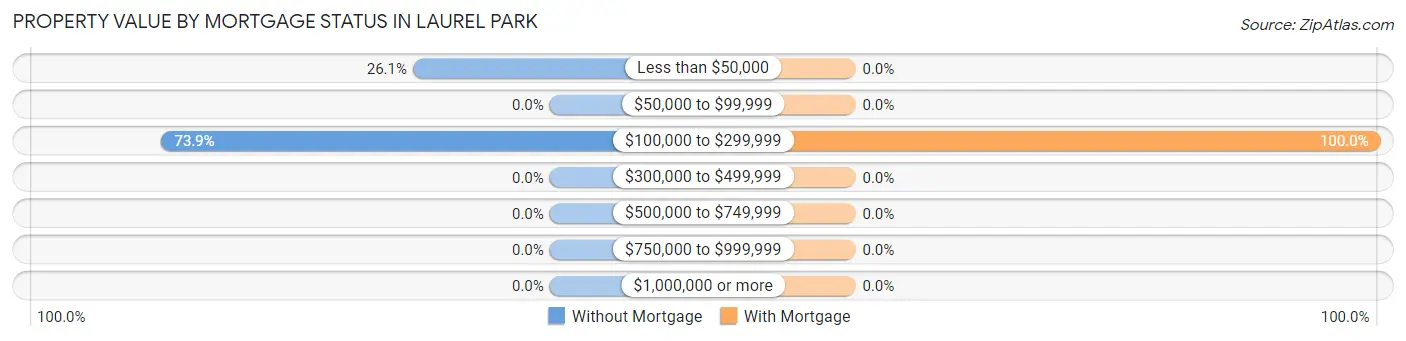
| Property Value | Without Mortgage | With Mortgage |
| Less than $50,000 | 43 (26.1%) | 0 (0.0%) |
| $50,000 to $99,999 | 0 (0.0%) | 0 (0.0%) |
| $100,000 to $299,999 | 122 (73.9%) | 189 (100.0%) |
| $300,000 to $499,999 | 0 (0.0%) | 0 (0.0%) |
| $500,000 to $749,999 | 0 (0.0%) | 0 (0.0%) |
| $750,000 to $999,999 | 0 (0.0%) | 0 (0.0%) |
| $1,000,000 or more | 0 (0.0%) | 0 (0.0%) |
| Total | 165 (100.0%) | 189 (100.0%) |
Household Income by Mortgage Status in Laurel Park
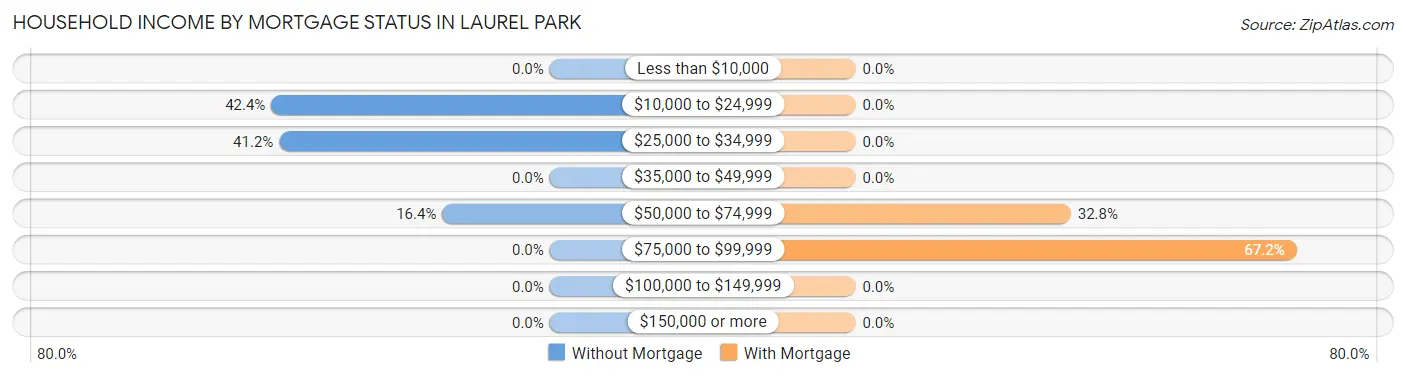
| Household Income | Without Mortgage | With Mortgage |
| Less than $10,000 | 0 (0.0%) | 0 (0.0%) |
| $10,000 to $24,999 | 70 (42.4%) | 0 (0.0%) |
| $25,000 to $34,999 | 68 (41.2%) | 0 (0.0%) |
| $35,000 to $49,999 | 0 (0.0%) | 0 (0.0%) |
| $50,000 to $74,999 | 27 (16.4%) | 62 (32.8%) |
| $75,000 to $99,999 | 0 (0.0%) | 127 (67.2%) |
| $100,000 to $149,999 | 0 (0.0%) | 0 (0.0%) |
| $150,000 or more | 0 (0.0%) | 0 (0.0%) |
| Total | 165 (100.0%) | 189 (100.0%) |
Property Value to Household Income Ratio in Laurel Park
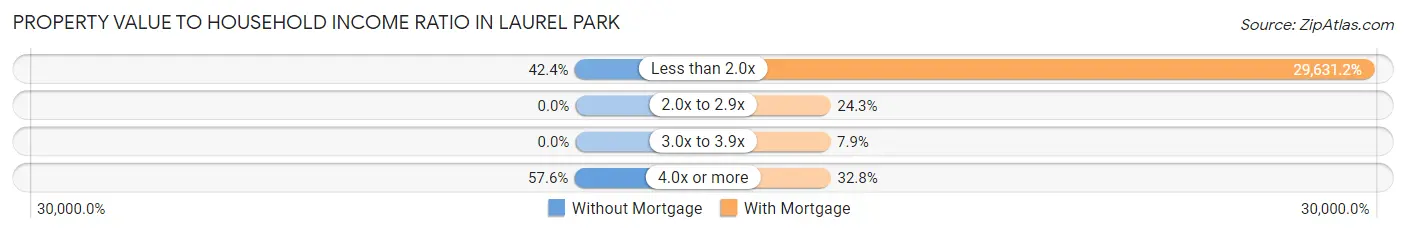
| Value-to-Income Ratio | Without Mortgage | With Mortgage |
| Less than 2.0x | 70 (42.4%) | 56,003 (29,631.2%) |
| 2.0x to 2.9x | 0 (0.0%) | 46 (24.3%) |
| 3.0x to 3.9x | 0 (0.0%) | 15 (7.9%) |
| 4.0x or more | 95 (57.6%) | 62 (32.8%) |
| Total | 165 (100.0%) | 189 (100.0%) |
Real Estate Taxes by Mortgage Status in Laurel Park
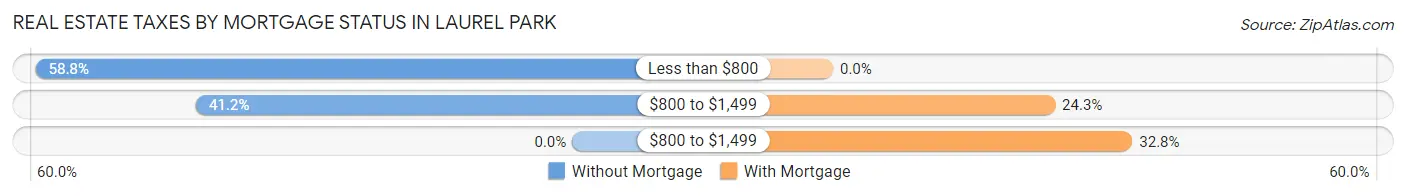
| Property Taxes | Without Mortgage | With Mortgage |
| Less than $800 | 97 (58.8%) | 0 (0.0%) |
| $800 to $1,499 | 68 (41.2%) | 46 (24.3%) |
| $800 to $1,499 | 0 (0.0%) | 62 (32.8%) |
| Total | 165 (100.0%) | 189 (100.0%) |
Health & Disability in Laurel Park
Health Insurance Coverage by Age in Laurel Park
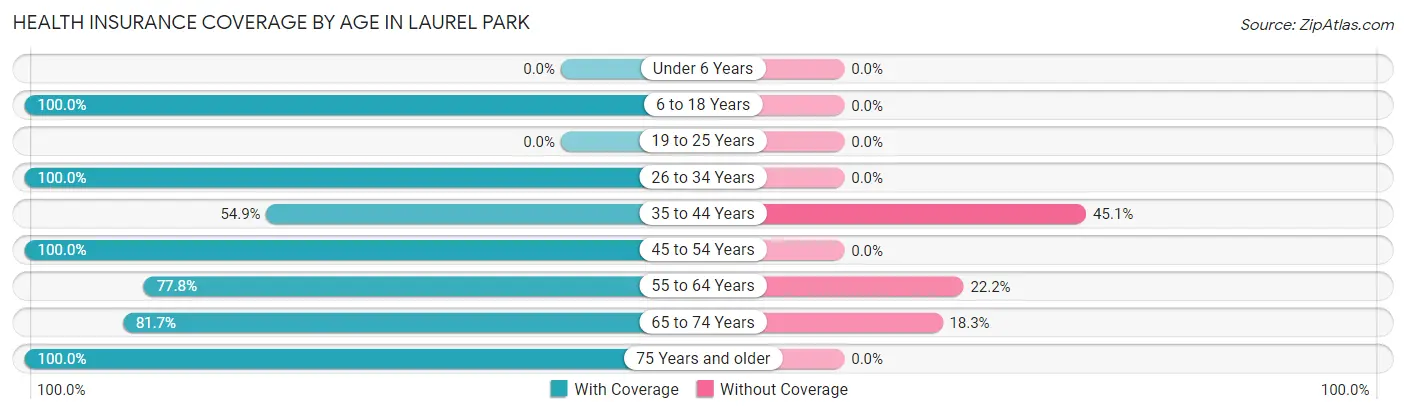
| Age Bracket | With Coverage | Without Coverage |
| Under 6 Years | 0 (0.0%) | 0 (0.0%) |
| 6 to 18 Years | 314 (100.0%) | 0 (0.0%) |
| 19 to 25 Years | 0 (0.0%) | 0 (0.0%) |
| 26 to 34 Years | 179 (100.0%) | 0 (0.0%) |
| 35 to 44 Years | 56 (54.9%) | 46 (45.1%) |
| 45 to 54 Years | 52 (100.0%) | 0 (0.0%) |
| 55 to 64 Years | 63 (77.8%) | 18 (22.2%) |
| 65 to 74 Years | 250 (81.7%) | 56 (18.3%) |
| 75 Years and older | 80 (100.0%) | 0 (0.0%) |
| Total | 994 (89.2%) | 120 (10.8%) |
Health Insurance Coverage by Citizenship Status in Laurel Park

| Citizenship Status | With Coverage | Without Coverage |
| Native Born | 0 (0.0%) | 0 (0.0%) |
| Foreign Born, Citizen | 314 (100.0%) | 0 (0.0%) |
| Foreign Born, not a Citizen | 0 (0.0%) | 0 (0.0%) |
Health Insurance Coverage by Household Income in Laurel Park
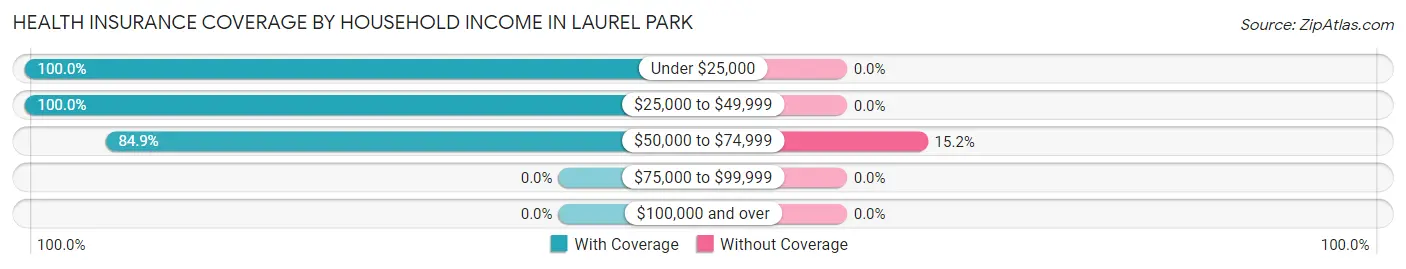
| Household Income | With Coverage | Without Coverage |
| Under $25,000 | 90 (100.0%) | 0 (0.0%) |
| $25,000 to $49,999 | 232 (100.0%) | 0 (0.0%) |
| $50,000 to $74,999 | 672 (84.9%) | 120 (15.1%) |
| $75,000 to $99,999 | 0 (0.0%) | 0 (0.0%) |
| $100,000 and over | 0 (0.0%) | 0 (0.0%) |
Public vs Private Health Insurance Coverage by Age in Laurel Park
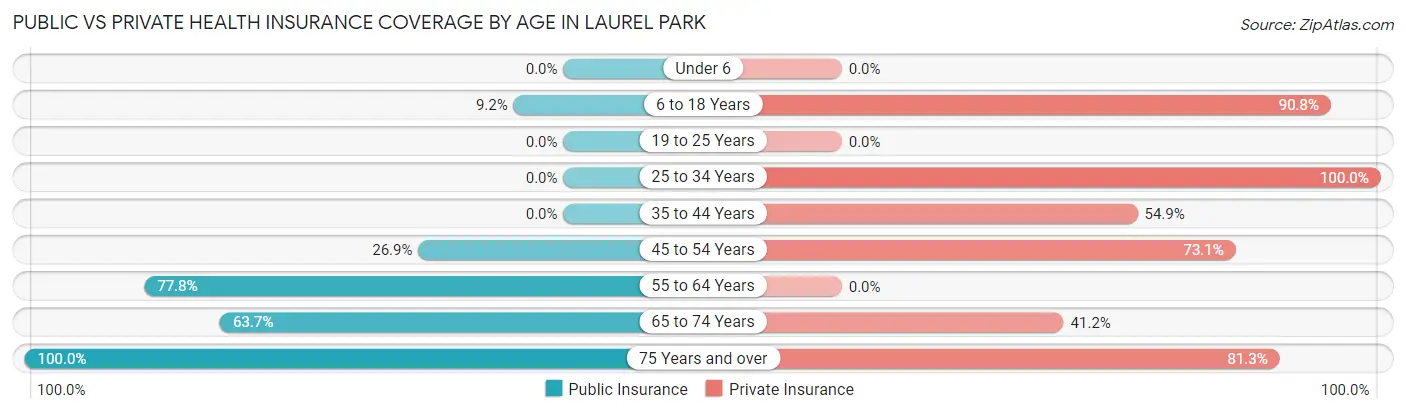
| Age Bracket | Public Insurance | Private Insurance |
| Under 6 | 0 (0.0%) | 0 (0.0%) |
| 6 to 18 Years | 29 (9.2%) | 285 (90.8%) |
| 19 to 25 Years | 0 (0.0%) | 0 (0.0%) |
| 25 to 34 Years | 0 (0.0%) | 179 (100.0%) |
| 35 to 44 Years | 0 (0.0%) | 56 (54.9%) |
| 45 to 54 Years | 14 (26.9%) | 38 (73.1%) |
| 55 to 64 Years | 63 (77.8%) | 0 (0.0%) |
| 65 to 74 Years | 195 (63.7%) | 126 (41.2%) |
| 75 Years and over | 80 (100.0%) | 65 (81.2%) |
| Total | 381 (34.2%) | 749 (67.2%) |
Disability Status by Sex by Age in Laurel Park
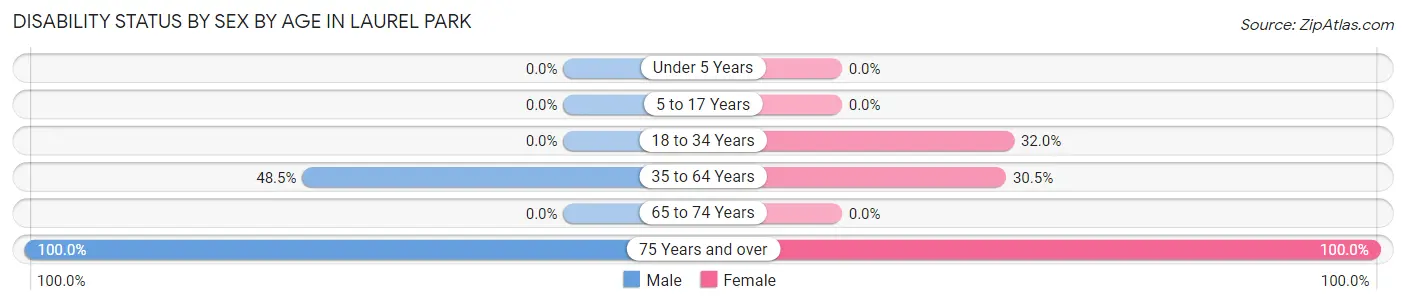
| Age Bracket | Male | Female |
| Under 5 Years | 0 (0.0%) | 0 (0.0%) |
| 5 to 17 Years | 0 (0.0%) | 0 (0.0%) |
| 18 to 34 Years | 0 (0.0%) | 31 (32.0%) |
| 35 to 64 Years | 63 (48.5%) | 32 (30.5%) |
| 65 to 74 Years | 0 (0.0%) | 0 (0.0%) |
| 75 Years and over | 52 (100.0%) | 28 (100.0%) |
Disability Class by Sex by Age in Laurel Park
Disability Class: Hearing Difficulty
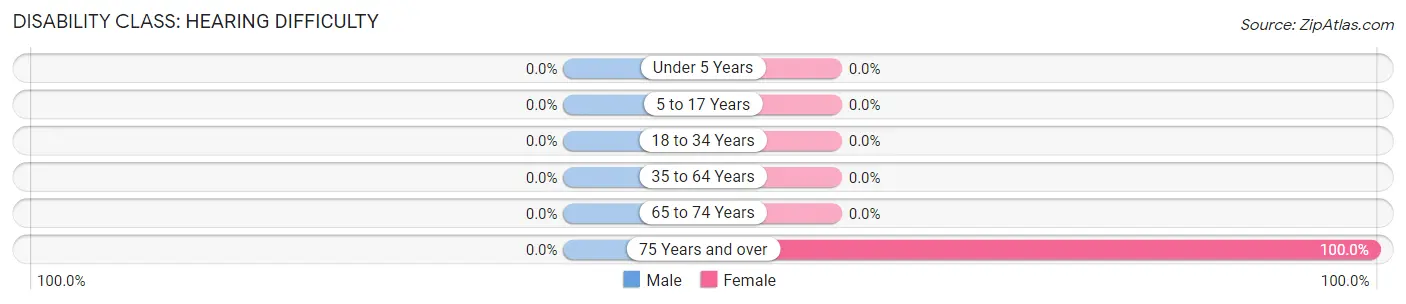
| Age Bracket | Male | Female |
| Under 5 Years | 0 (0.0%) | 0 (0.0%) |
| 5 to 17 Years | 0 (0.0%) | 0 (0.0%) |
| 18 to 34 Years | 0 (0.0%) | 0 (0.0%) |
| 35 to 64 Years | 0 (0.0%) | 0 (0.0%) |
| 65 to 74 Years | 0 (0.0%) | 0 (0.0%) |
| 75 Years and over | 0 (0.0%) | 28 (100.0%) |
Disability Class: Vision Difficulty
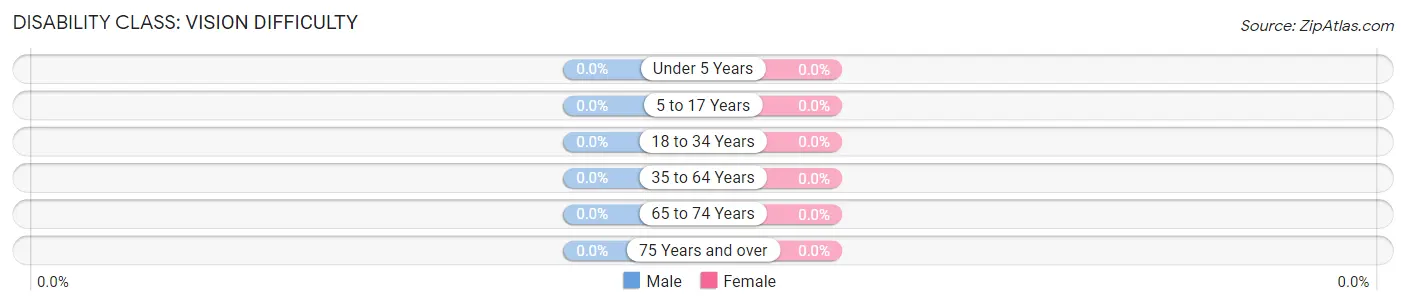
| Age Bracket | Male | Female |
| Under 5 Years | 0 (0.0%) | 0 (0.0%) |
| 5 to 17 Years | 0 (0.0%) | 0 (0.0%) |
| 18 to 34 Years | 0 (0.0%) | 0 (0.0%) |
| 35 to 64 Years | 0 (0.0%) | 0 (0.0%) |
| 65 to 74 Years | 0 (0.0%) | 0 (0.0%) |
| 75 Years and over | 0 (0.0%) | 0 (0.0%) |
Disability Class: Cognitive Difficulty
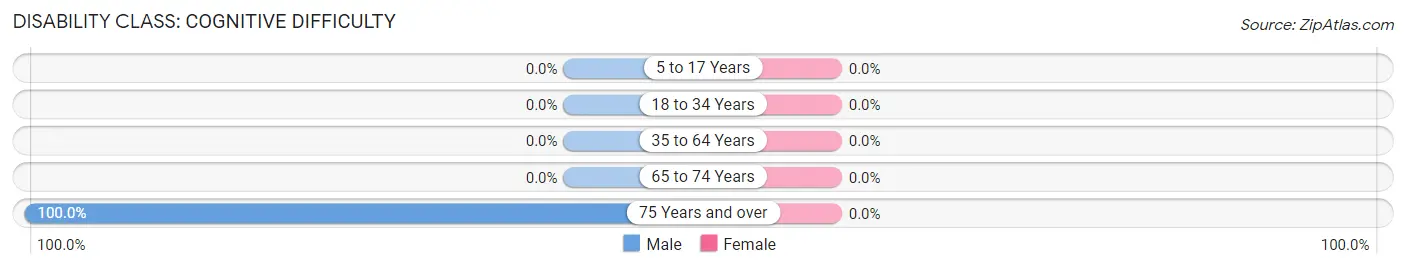
| Age Bracket | Male | Female |
| 5 to 17 Years | 0 (0.0%) | 0 (0.0%) |
| 18 to 34 Years | 0 (0.0%) | 0 (0.0%) |
| 35 to 64 Years | 0 (0.0%) | 0 (0.0%) |
| 65 to 74 Years | 0 (0.0%) | 0 (0.0%) |
| 75 Years and over | 52 (100.0%) | 0 (0.0%) |
Disability Class: Ambulatory Difficulty
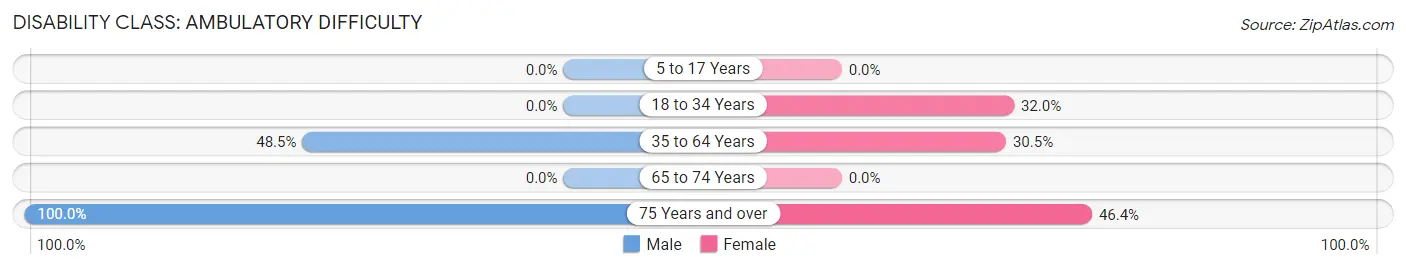
| Age Bracket | Male | Female |
| 5 to 17 Years | 0 (0.0%) | 0 (0.0%) |
| 18 to 34 Years | 0 (0.0%) | 31 (32.0%) |
| 35 to 64 Years | 63 (48.5%) | 32 (30.5%) |
| 65 to 74 Years | 0 (0.0%) | 0 (0.0%) |
| 75 Years and over | 52 (100.0%) | 13 (46.4%) |
Disability Class: Self-Care Difficulty
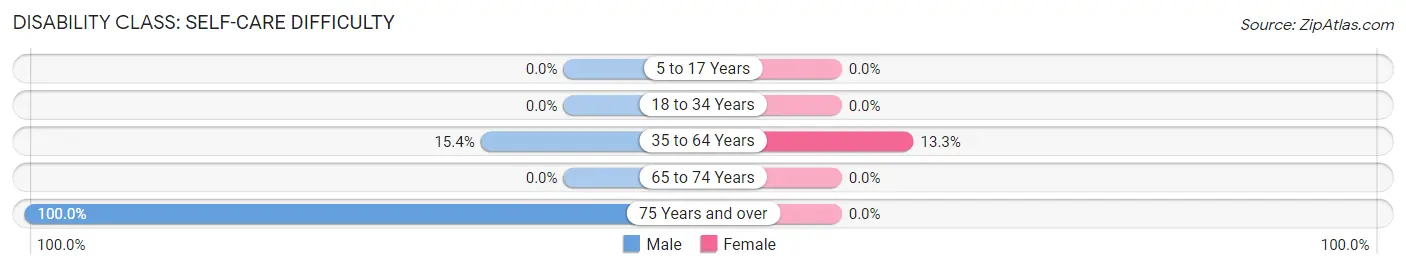
| Age Bracket | Male | Female |
| 5 to 17 Years | 0 (0.0%) | 0 (0.0%) |
| 18 to 34 Years | 0 (0.0%) | 0 (0.0%) |
| 35 to 64 Years | 20 (15.4%) | 14 (13.3%) |
| 65 to 74 Years | 0 (0.0%) | 0 (0.0%) |
| 75 Years and over | 52 (100.0%) | 0 (0.0%) |
Technology Access in Laurel Park
Computing Device Access in Laurel Park
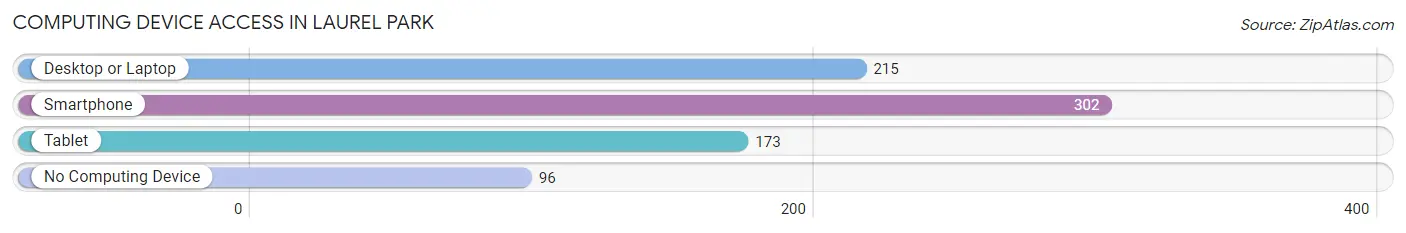
| Device Type | # Households | % Households |
| Desktop or Laptop | 215 | 51.9% |
| Smartphone | 302 | 73.0% |
| Tablet | 173 | 41.8% |
| No Computing Device | 96 | 23.2% |
| Total | 414 | 100.0% |
Internet Access in Laurel Park
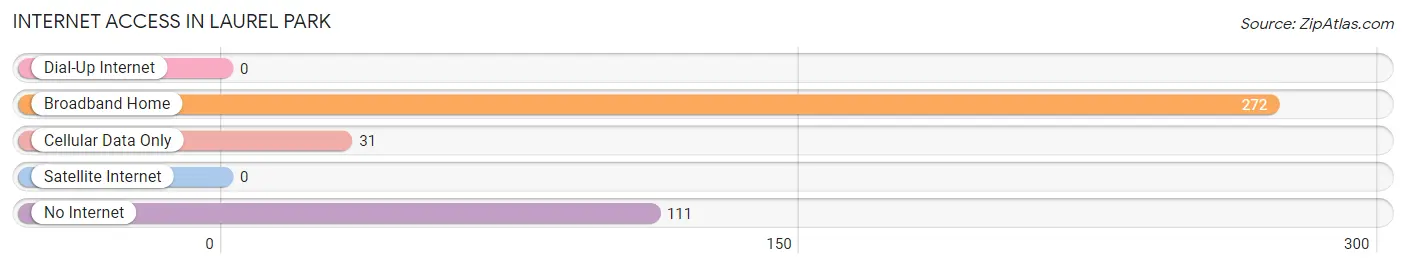
| Internet Type | # Households | % Households |
| Dial-Up Internet | 0 | 0.0% |
| Broadband Home | 272 | 65.7% |
| Cellular Data Only | 31 | 7.5% |
| Satellite Internet | 0 | 0.0% |
| No Internet | 111 | 26.8% |
| Total | 414 | 100.0% |
Laurel Park Summary
Laurel Park is a small town located in the Blue Ridge Mountains of Virginia. It is situated in the western part of the state, about 25 miles from the state capital of Richmond. The town is part of the larger Lynchburg metropolitan area, and is home to a population of just over 1,000 people.
History
Laurel Park was first settled in the late 1700s by a group of settlers from Pennsylvania. The town was originally known as “Laurel Hill”, and was named after the laurel trees that grew in abundance in the area. The town was officially incorporated in 1891, and was named after the nearby Laurel Hill Plantation.
The town was a popular destination for tourists in the late 19th and early 20th centuries, due to its proximity to the Blue Ridge Mountains and its scenic views. The town was also home to a number of resorts and hotels, which attracted visitors from all over the country.
Geography
Laurel Park is located in the western part of Virginia, in the foothills of the Blue Ridge Mountains. The town is situated at an elevation of 1,400 feet, and is surrounded by rolling hills and forests. The town is located about 25 miles from the state capital of Richmond, and is part of the larger Lynchburg metropolitan area.
The town is located in the Appalachian region of the United States, and is home to a variety of wildlife, including deer, black bears, and wild turkeys. The town is also home to a number of parks and recreational areas, including the George Washington National Forest and the Appalachian Trail.
Economy
The economy of Laurel Park is largely based on tourism and agriculture. The town is home to a number of resorts and hotels, which attract visitors from all over the country. The town is also home to a number of farms, which produce a variety of crops, including corn, soybeans, and hay.
The town is also home to a number of small businesses, including restaurants, shops, and other services. The town is also home to a number of manufacturing companies, which produce a variety of products, including furniture, clothing, and electronics.
Demographics
As of the 2010 census, the population of Laurel Park was 1,072. The town is predominantly white, with a population that is 94.3% white, 2.2% African American, 0.7% Asian, and 0.7% Hispanic or Latino. The median household income in the town is $45,000, and the median home value is $150,000.
The town is home to a number of churches, including the Laurel Park United Methodist Church, the Laurel Park Baptist Church, and the Laurel Park Presbyterian Church. The town is also home to a number of schools, including the Laurel Park Elementary School, the Laurel Park Middle School, and the Laurel Park High School.
Conclusion
Laurel Park is a small town located in the Blue Ridge Mountains of Virginia. The town is home to a population of just over 1,000 people, and is largely based on tourism and agriculture. The town is predominantly white, with a median household income of $45,000 and a median home value of $150,000. The town is home to a number of churches, schools, and businesses, and is a popular destination for tourists due to its proximity to the Blue Ridge Mountains and its scenic views.
Common Questions
What is Per Capita Income in Laurel Park?
Per Capita income in Laurel Park is $17,054.
What is the Median Family Income in Laurel Park?
Median Family Income in Laurel Park is $56,327.
What is the Median Household income in Laurel Park?
Median Household Income in Laurel Park is $39,032.
What is Income or Wage Gap in Laurel Park?
Income or Wage Gap in Laurel Park is 36.3%.
Women in Laurel Park earn 63.7 cents for every dollar earned by a man.
What is Inequality or Gini Index in Laurel Park?
Inequality or Gini Index in Laurel Park is 0.21.
What is the Total Population of Laurel Park?
Total Population of Laurel Park is 1,114.
What is the Total Male Population of Laurel Park?
Total Male Population of Laurel Park is 592.
What is the Total Female Population of Laurel Park?
Total Female Population of Laurel Park is 522.
What is the Ratio of Males per 100 Females in Laurel Park?
There are 113.41 Males per 100 Females in Laurel Park.
What is the Ratio of Females per 100 Males in Laurel Park?
There are 88.18 Females per 100 Males in Laurel Park.
What is the Median Population Age in Laurel Park?
Median Population Age in Laurel Park is 44.3 Years.
What is the Average Family Size in Laurel Park
Average Family Size in Laurel Park is 4.1 People.
What is the Average Household Size in Laurel Park
Average Household Size in Laurel Park is 2.7 People.
How Large is the Labor Force in Laurel Park?
There are 421 People in the Labor Forcein in Laurel Park.
What is the Percentage of People in the Labor Force in Laurel Park?
52.6% of People are in the Labor Force in Laurel Park.