Dumfries, VA Map & Demographics
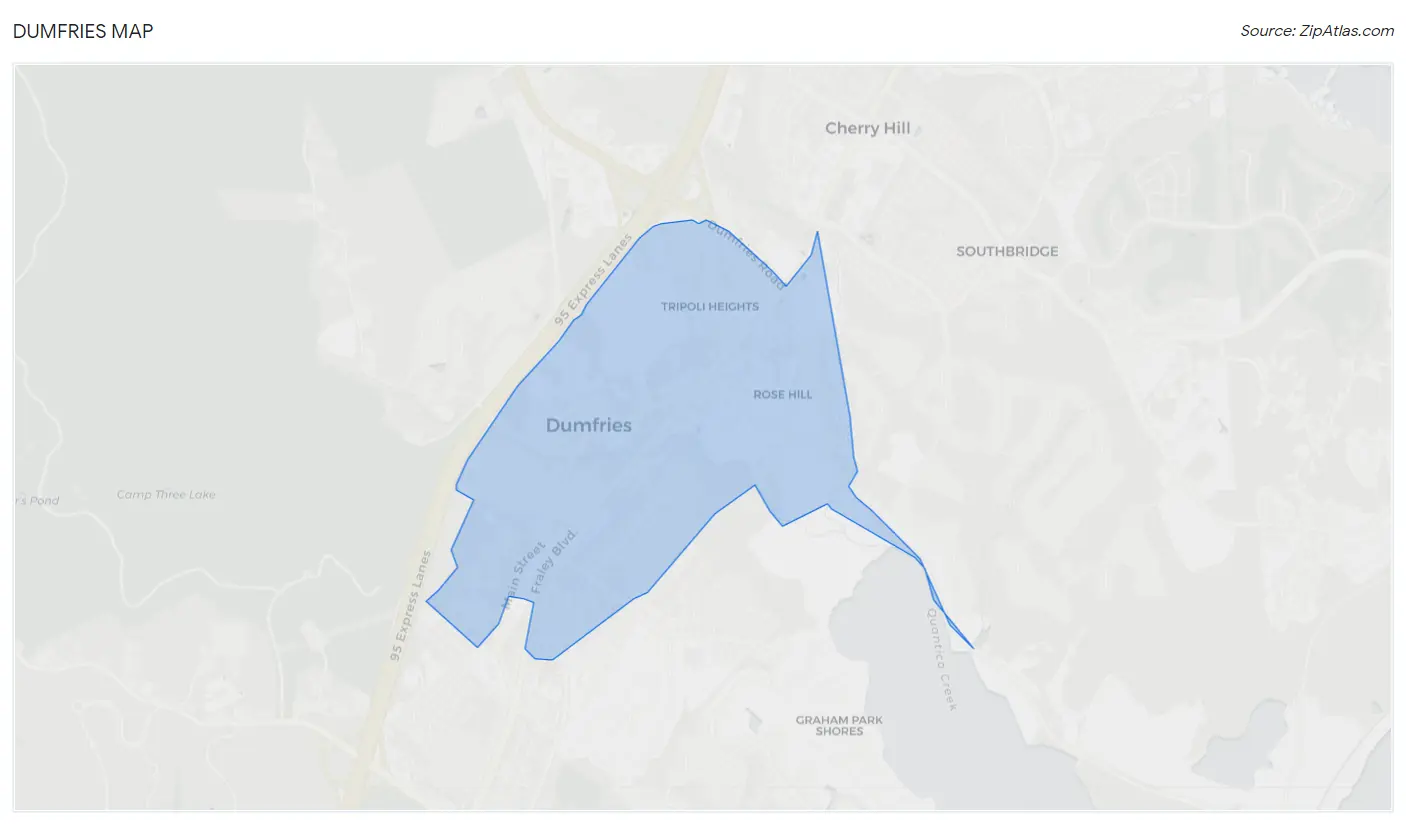
Dumfries Map
Dumfries Overview
$27,134
PER CAPITA INCOME
$77,059
AVG FAMILY INCOME
$75,629
AVG HOUSEHOLD INCOME
28.6%
WAGE / INCOME GAP [ % ]
71.4¢/ $1
WAGE / INCOME GAP [ $ ]
0.41
INEQUALITY / GINI INDEX
5,697
TOTAL POPULATION
2,660
MALE POPULATION
3,037
FEMALE POPULATION
87.59
MALES / 100 FEMALES
114.17
FEMALES / 100 MALES
29.9
MEDIAN AGE
4.0
AVG FAMILY SIZE
3.4
AVG HOUSEHOLD SIZE
2,917
LABOR FORCE [ PEOPLE ]
72.1%
PERCENT IN LABOR FORCE
5.0%
UNEMPLOYMENT RATE
Income in Dumfries
Income Overview in Dumfries
Per Capita Income in Dumfries is $27,134, while median incomes of families and households are $77,059 and $75,629 respectively.
| Characteristic | Number | Measure |
| Per Capita Income | 5,697 | $27,134 |
| Median Family Income | 1,300 | $77,059 |
| Mean Family Income | 1,300 | $92,486 |
| Median Household Income | 1,660 | $75,629 |
| Mean Household Income | 1,660 | $87,166 |
| Income Deficit | 1,300 | $0 |
| Wage / Income Gap (%) | 5,697 | 28.62% |
| Wage / Income Gap ($) | 5,697 | 71.38¢ per $1 |
| Gini / Inequality Index | 5,697 | 0.41 |
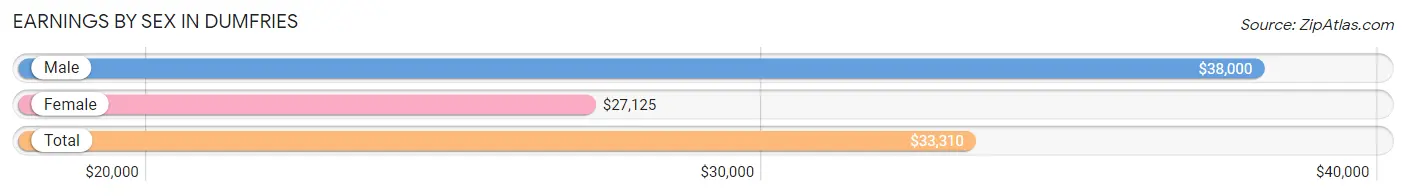
Earnings by Sex in Dumfries
Average Earnings in Dumfries are $33,310, $38,000 for men and $27,125 for women, a difference of 28.6%.
| Sex | Number | Average Earnings |
| Male | 1,292 (46.2%) | $38,000 |
| Female | 1,502 (53.8%) | $27,125 |
| Total | 2,794 (100.0%) | $33,310 |
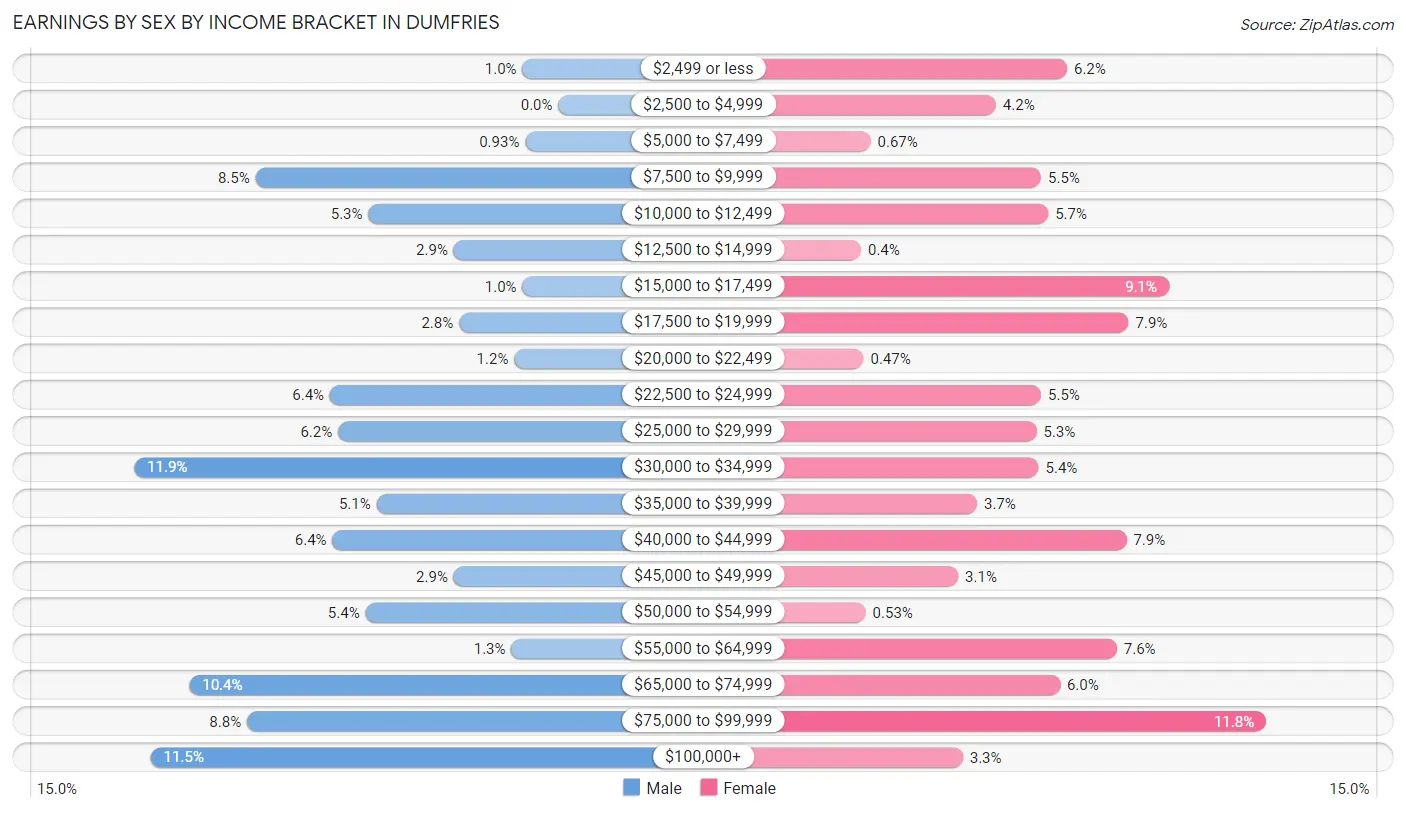
Earnings by Sex by Income Bracket in Dumfries
The most common earnings brackets in Dumfries are $30,000 to $34,999 for men (154 | 11.9%) and $75,000 to $99,999 for women (177 | 11.8%).
| Income | Male | Female |
| $2,499 or less | 13 (1.0%) | 93 (6.2%) |
| $2,500 to $4,999 | 0 (0.0%) | 63 (4.2%) |
| $5,000 to $7,499 | 12 (0.9%) | 10 (0.7%) |
| $7,500 to $9,999 | 110 (8.5%) | 82 (5.5%) |
| $10,000 to $12,499 | 69 (5.3%) | 85 (5.7%) |
| $12,500 to $14,999 | 38 (2.9%) | 6 (0.4%) |
| $15,000 to $17,499 | 13 (1.0%) | 136 (9.0%) |
| $17,500 to $19,999 | 36 (2.8%) | 119 (7.9%) |
| $20,000 to $22,499 | 16 (1.2%) | 7 (0.5%) |
| $22,500 to $24,999 | 83 (6.4%) | 82 (5.5%) |
| $25,000 to $29,999 | 80 (6.2%) | 80 (5.3%) |
| $30,000 to $34,999 | 154 (11.9%) | 81 (5.4%) |
| $35,000 to $39,999 | 66 (5.1%) | 55 (3.7%) |
| $40,000 to $44,999 | 82 (6.4%) | 118 (7.9%) |
| $45,000 to $49,999 | 38 (2.9%) | 47 (3.1%) |
| $50,000 to $54,999 | 70 (5.4%) | 8 (0.5%) |
| $55,000 to $64,999 | 17 (1.3%) | 114 (7.6%) |
| $65,000 to $74,999 | 134 (10.4%) | 90 (6.0%) |
| $75,000 to $99,999 | 113 (8.7%) | 177 (11.8%) |
| $100,000+ | 148 (11.5%) | 49 (3.3%) |
| Total | 1,292 (100.0%) | 1,502 (100.0%) |
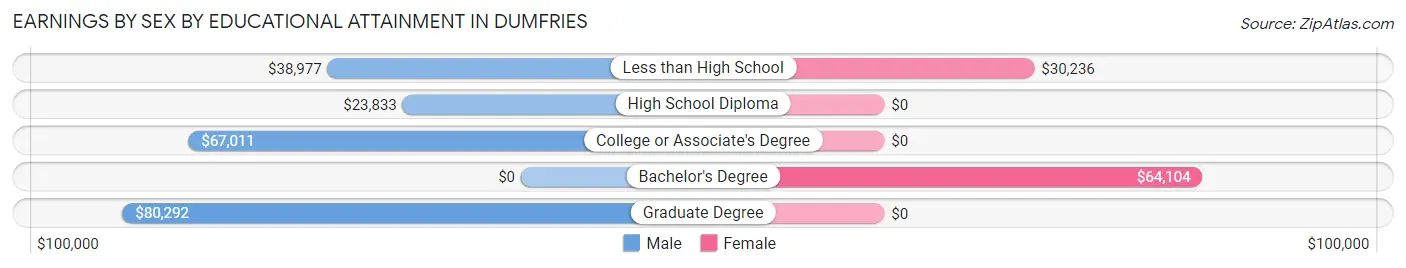
Earnings by Sex by Educational Attainment in Dumfries
Average earnings in Dumfries are $40,000 for men and $38,750 for women, a difference of 3.1%. Men with an educational attainment of graduate degree enjoy the highest average annual earnings of $80,292, while those with high school diploma education earn the least with $23,833. Women with an educational attainment of bachelor's degree earn the most with the average annual earnings of $64,104, while those with less than high school education have the smallest earnings of $30,236.
| Educational Attainment | Male Income | Female Income |
| Less than High School | $38,977 | $30,236 |
| High School Diploma | $23,833 | $0 |
| College or Associate's Degree | $67,011 | $0 |
| Bachelor's Degree | - | - |
| Graduate Degree | $80,292 | $0 |
| Total | $40,000 | $38,750 |
Family Income in Dumfries
Family Income Brackets in Dumfries
According to the Dumfries family income data, there are 283 families falling into the $75,000 to $99,999 income range, which is the most common income bracket and makes up 21.8% of all families. Conversely, the $15,000 to $24,999 income bracket is the least frequent group with only 60 families (4.6%) belonging to this category.
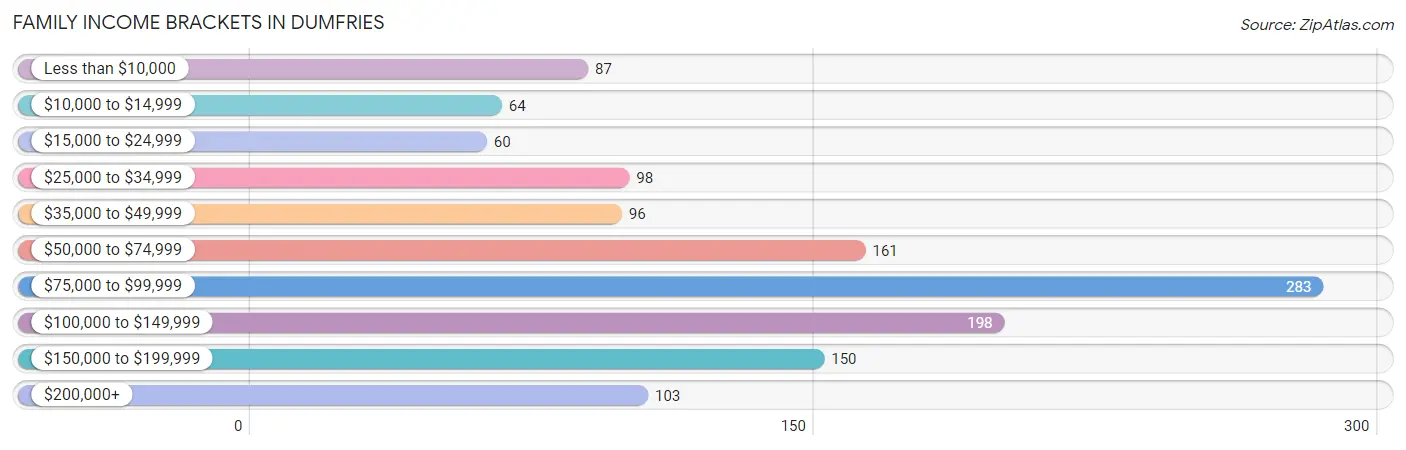
| Income Bracket | # Families | % Families |
| Less than $10,000 | 87 | 6.7% |
| $10,000 to $14,999 | 64 | 4.9% |
| $15,000 to $24,999 | 60 | 4.6% |
| $25,000 to $34,999 | 98 | 7.5% |
| $35,000 to $49,999 | 96 | 7.4% |
| $50,000 to $74,999 | 161 | 12.4% |
| $75,000 to $99,999 | 283 | 21.8% |
| $100,000 to $149,999 | 198 | 15.2% |
| $150,000 to $199,999 | 150 | 11.5% |
| $200,000+ | 103 | 7.9% |
Family Income by Famaliy Size in Dumfries
5-person families (305 | 23.5%) account for the highest median family income in Dumfries with $79,498 per family, while 2-person families (385 | 29.6%) have the highest median income of $31,356 per family member.
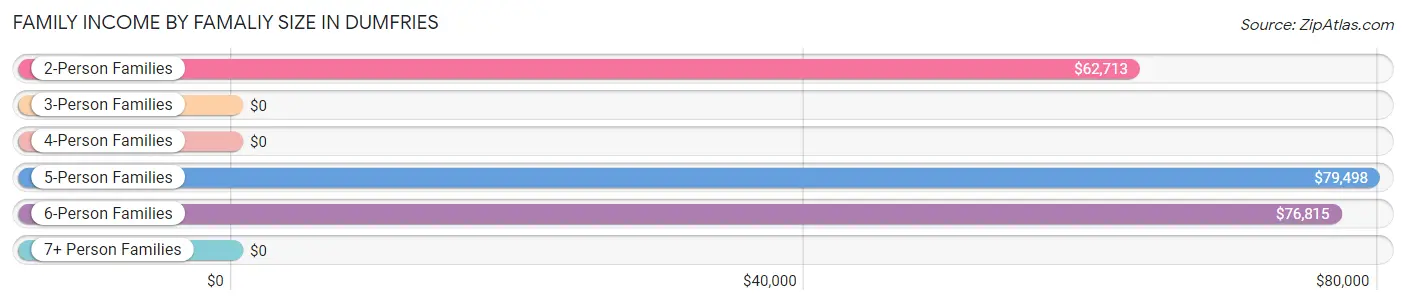
| Income Bracket | # Families | Median Income |
| 2-Person Families | 385 (29.6%) | $62,713 |
| 3-Person Families | 199 (15.3%) | $0 |
| 4-Person Families | 295 (22.7%) | $0 |
| 5-Person Families | 305 (23.5%) | $79,498 |
| 6-Person Families | 61 (4.7%) | $76,815 |
| 7+ Person Families | 55 (4.2%) | $0 |
| Total | 1,300 (100.0%) | $77,059 |
Family Income by Number of Earners in Dumfries
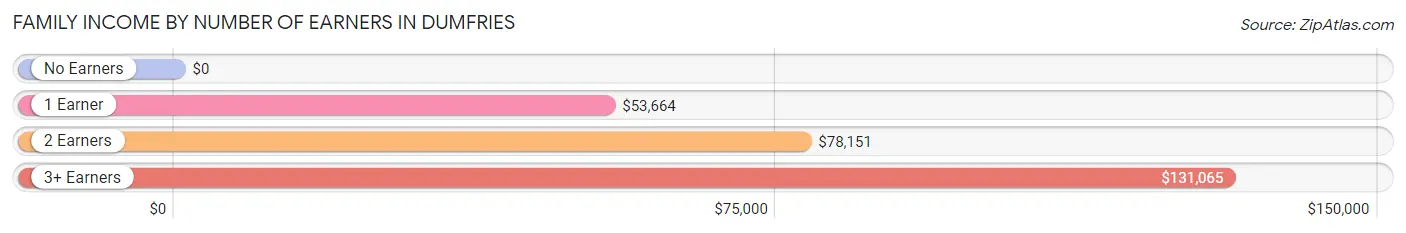
| Number of Earners | # Families | Median Income |
| No Earners | 146 (11.2%) | $0 |
| 1 Earner | 477 (36.7%) | $53,664 |
| 2 Earners | 365 (28.1%) | $78,151 |
| 3+ Earners | 312 (24.0%) | $131,065 |
| Total | 1,300 (100.0%) | $77,059 |
Household Income in Dumfries
Household Income Brackets in Dumfries
With 329 households falling in the category, the $75,000 to $99,999 income range is the most frequent in Dumfries, accounting for 19.8% of all households. In contrast, only 65 households (3.9%) fall into the $35,000 to $49,999 income bracket, making it the least populous group.
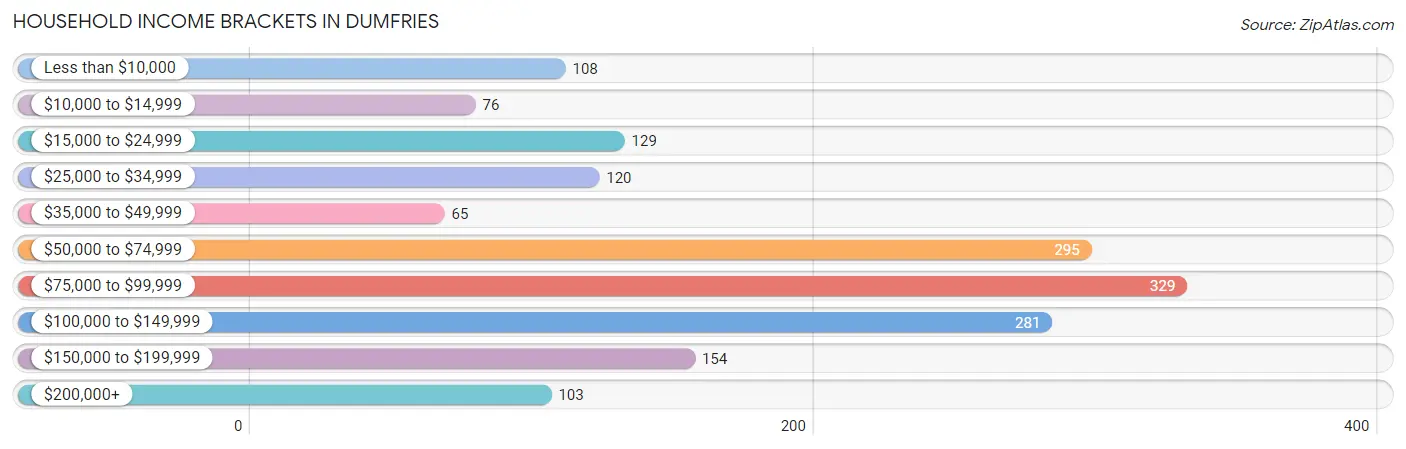
| Income Bracket | # Households | % Households |
| Less than $10,000 | 108 | 6.5% |
| $10,000 to $14,999 | 76 | 4.6% |
| $15,000 to $24,999 | 129 | 7.8% |
| $25,000 to $34,999 | 120 | 7.2% |
| $35,000 to $49,999 | 65 | 3.9% |
| $50,000 to $74,999 | 295 | 17.8% |
| $75,000 to $99,999 | 329 | 19.8% |
| $100,000 to $149,999 | 281 | 16.9% |
| $150,000 to $199,999 | 154 | 9.3% |
| $200,000+ | 103 | 6.2% |
Household Income by Householder Age in Dumfries
The median household income in Dumfries is $75,629, with the highest median household income of $76,720 found in the 45 to 64 years age bracket for the primary householder. A total of 628 households (37.8%) fall into this category. Meanwhile, the 15 to 24 years age bracket for the primary householder has the lowest median household income of $0, with 71 households (4.3%) in this group.
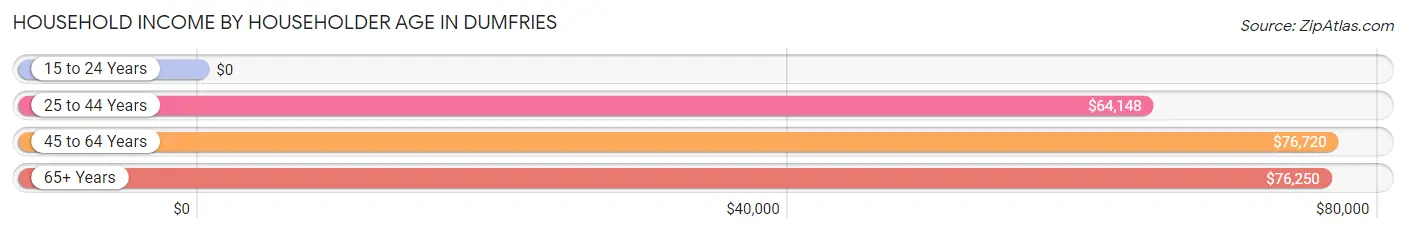
| Income Bracket | # Households | Median Income |
| 15 to 24 Years | 71 (4.3%) | $0 |
| 25 to 44 Years | 531 (32.0%) | $64,148 |
| 45 to 64 Years | 628 (37.8%) | $76,720 |
| 65+ Years | 430 (25.9%) | $76,250 |
| Total | 1,660 (100.0%) | $75,629 |
Poverty in Dumfries
Income Below Poverty by Sex and Age in Dumfries
With 10.4% poverty level for males and 15.0% for females among the residents of Dumfries, 5 year old males and 6 to 11 year old females are the most vulnerable to poverty, with 11 males (30.6%) and 179 females (56.7%) in their respective age groups living below the poverty level.
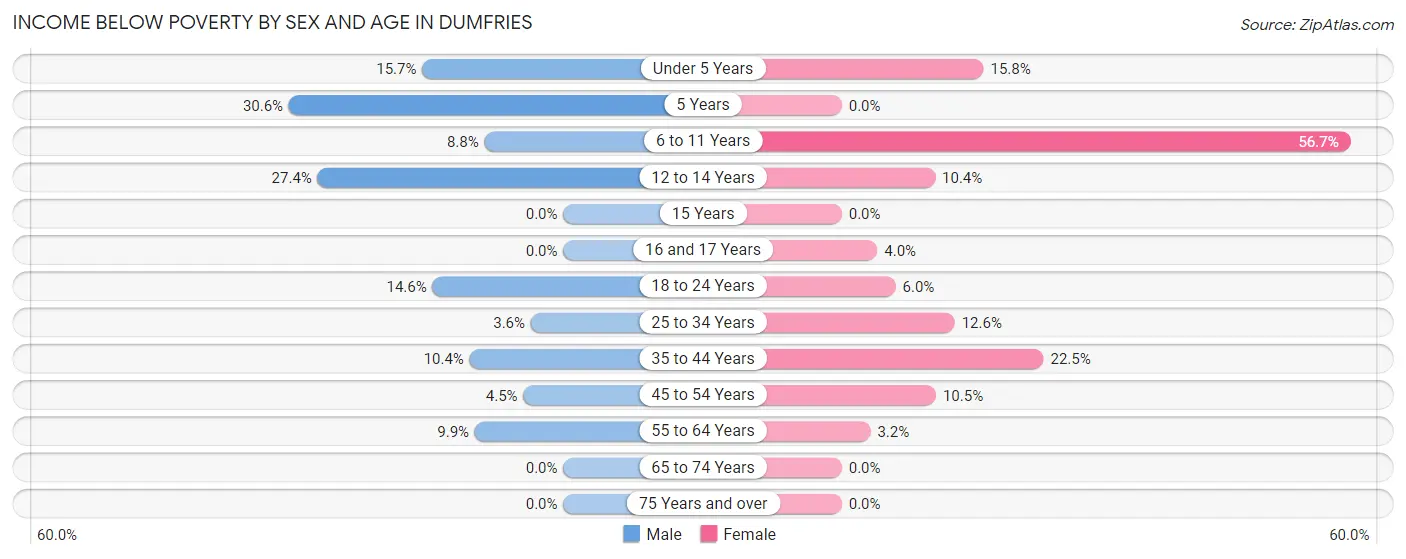
| Age Bracket | Male | Female |
| Under 5 Years | 33 (15.7%) | 18 (15.8%) |
| 5 Years | 11 (30.6%) | 0 (0.0%) |
| 6 to 11 Years | 33 (8.8%) | 179 (56.7%) |
| 12 to 14 Years | 81 (27.4%) | 16 (10.4%) |
| 15 Years | 0 (0.0%) | 0 (0.0%) |
| 16 and 17 Years | 0 (0.0%) | 8 (4.0%) |
| 18 to 24 Years | 52 (14.6%) | 13 (6.0%) |
| 25 to 34 Years | 10 (3.6%) | 41 (12.6%) |
| 35 to 44 Years | 24 (10.4%) | 120 (22.5%) |
| 45 to 54 Years | 13 (4.4%) | 51 (10.5%) |
| 55 to 64 Years | 20 (9.9%) | 8 (3.2%) |
| 65 to 74 Years | 0 (0.0%) | 0 (0.0%) |
| 75 Years and over | 0 (0.0%) | 0 (0.0%) |
| Total | 277 (10.4%) | 454 (15.0%) |
Income Above Poverty by Sex and Age in Dumfries
According to the poverty statistics in Dumfries, males aged 15 years and females aged 15 years are the age groups that are most secure financially, with 100.0% of males and 100.0% of females in these age groups living above the poverty line.
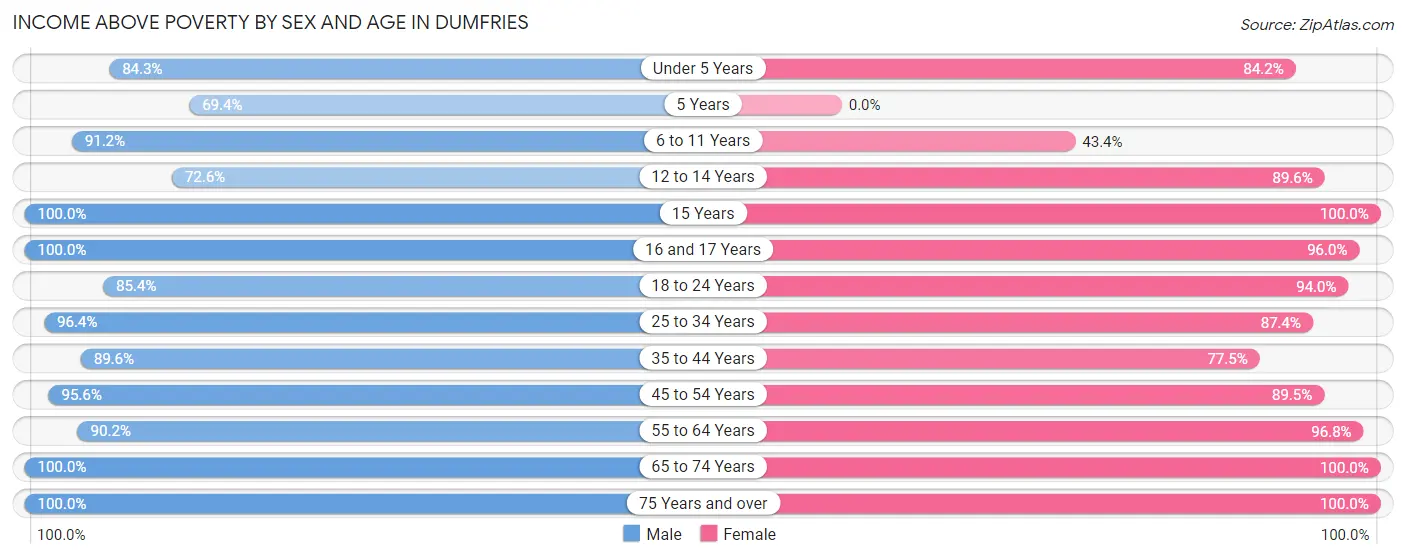
| Age Bracket | Male | Female |
| Under 5 Years | 177 (84.3%) | 96 (84.2%) |
| 5 Years | 25 (69.4%) | 0 (0.0%) |
| 6 to 11 Years | 343 (91.2%) | 137 (43.3%) |
| 12 to 14 Years | 215 (72.6%) | 138 (89.6%) |
| 15 Years | 72 (100.0%) | 73 (100.0%) |
| 16 and 17 Years | 55 (100.0%) | 194 (96.0%) |
| 18 to 24 Years | 305 (85.4%) | 204 (94.0%) |
| 25 to 34 Years | 266 (96.4%) | 285 (87.4%) |
| 35 to 44 Years | 206 (89.6%) | 414 (77.5%) |
| 45 to 54 Years | 279 (95.6%) | 435 (89.5%) |
| 55 to 64 Years | 183 (90.1%) | 243 (96.8%) |
| 65 to 74 Years | 170 (100.0%) | 290 (100.0%) |
| 75 Years and over | 86 (100.0%) | 71 (100.0%) |
| Total | 2,382 (89.6%) | 2,580 (85.0%) |
Income Below Poverty Among Married-Couple Families in Dumfries
The poverty statistics for married-couple families in Dumfries show that 3.6% or 23 of the total 633 families live below the poverty line. Families with 1 or 2 children have the highest poverty rate of 8.2%, comprising of 23 families. On the other hand, families with no children have the lowest poverty rate of 0.0%, which includes 0 families.
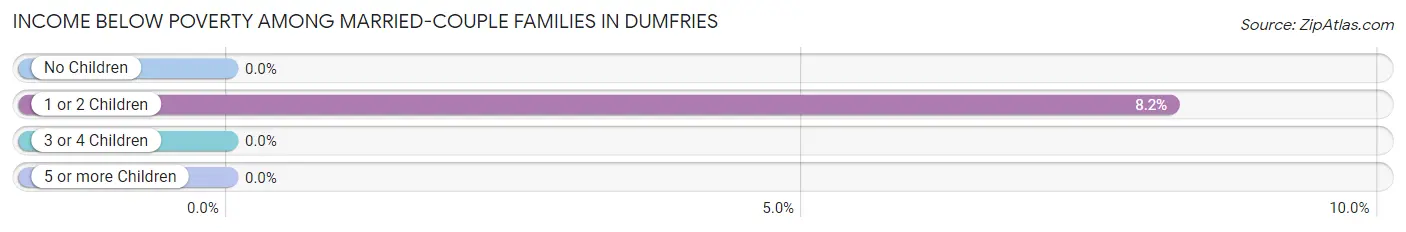
| Children | Above Poverty | Below Poverty |
| No Children | 227 (100.0%) | 0 (0.0%) |
| 1 or 2 Children | 258 (91.8%) | 23 (8.2%) |
| 3 or 4 Children | 113 (100.0%) | 0 (0.0%) |
| 5 or more Children | 12 (100.0%) | 0 (0.0%) |
| Total | 610 (96.4%) | 23 (3.6%) |
Income Below Poverty Among Single-Parent Households in Dumfries
According to the poverty data in Dumfries, 6.2% or 9 single-father households and 26.1% or 136 single-mother households are living below the poverty line. Among single-father households, those with 3 or 4 children have the highest poverty rate, with 9 households (26.5%) experiencing poverty. Likewise, among single-mother households, those with 5 or more children have the highest poverty rate, with 15 households (100.0%) falling below the poverty line.
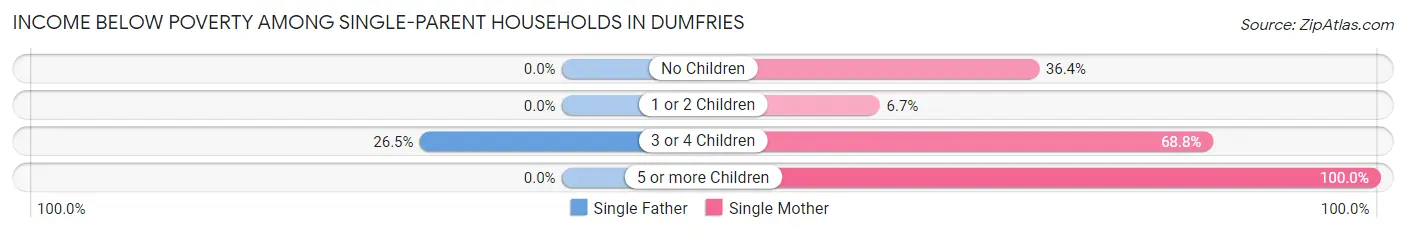
| Children | Single Father | Single Mother |
| No Children | 0 (0.0%) | 36 (36.4%) |
| 1 or 2 Children | 0 (0.0%) | 21 (6.7%) |
| 3 or 4 Children | 9 (26.5%) | 64 (68.8%) |
| 5 or more Children | 0 (0.0%) | 15 (100.0%) |
| Total | 9 (6.2%) | 136 (26.1%) |
Income Below Poverty Among Married-Couple vs Single-Parent Households in Dumfries
The poverty data for Dumfries shows that 23 of the married-couple family households (3.6%) and 145 of the single-parent households (21.7%) are living below the poverty level. Within the married-couple family households, those with 1 or 2 children have the highest poverty rate, with 23 households (8.2%) falling below the poverty line. Among the single-parent households, those with 5 or more children have the highest poverty rate, with 15 household (100.0%) living below poverty.
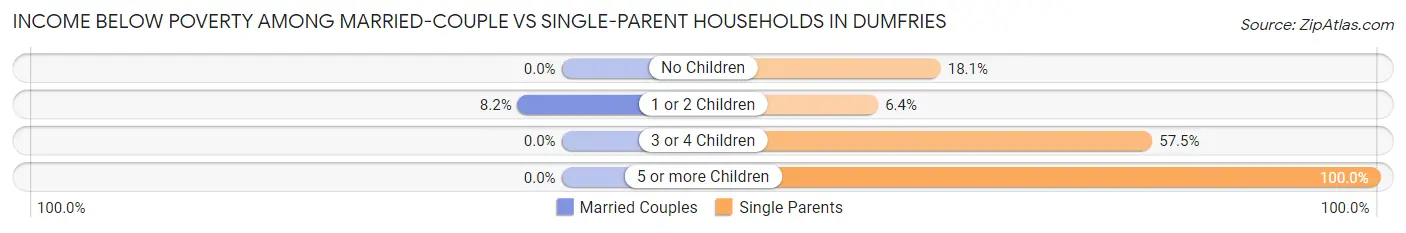
| Children | Married-Couple Families | Single-Parent Households |
| No Children | 0 (0.0%) | 36 (18.1%) |
| 1 or 2 Children | 23 (8.2%) | 21 (6.4%) |
| 3 or 4 Children | 0 (0.0%) | 73 (57.5%) |
| 5 or more Children | 0 (0.0%) | 15 (100.0%) |
| Total | 23 (3.6%) | 145 (21.7%) |
Race in Dumfries
The most populous races in Dumfries are White / Caucasian (2,554 | 44.8%), Hispanic or Latino (2,230 | 39.1%), and Black / African American (1,626 | 28.5%).
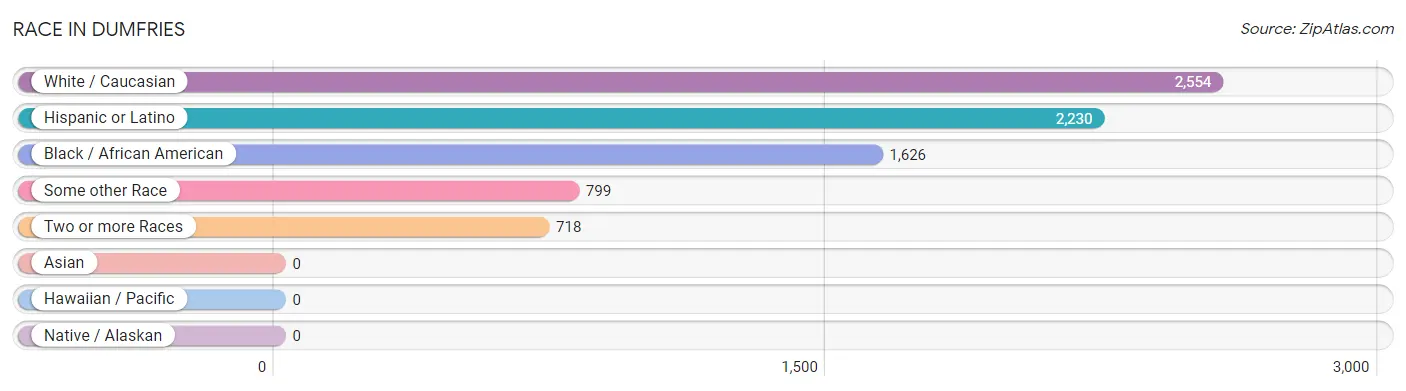
| Race | # Population | % Population |
| Asian | 0 | 0.0% |
| Black / African American | 1,626 | 28.5% |
| Hawaiian / Pacific | 0 | 0.0% |
| Hispanic or Latino | 2,230 | 39.1% |
| Native / Alaskan | 0 | 0.0% |
| White / Caucasian | 2,554 | 44.8% |
| Two or more Races | 718 | 12.6% |
| Some other Race | 799 | 14.0% |
| Total | 5,697 | 100.0% |
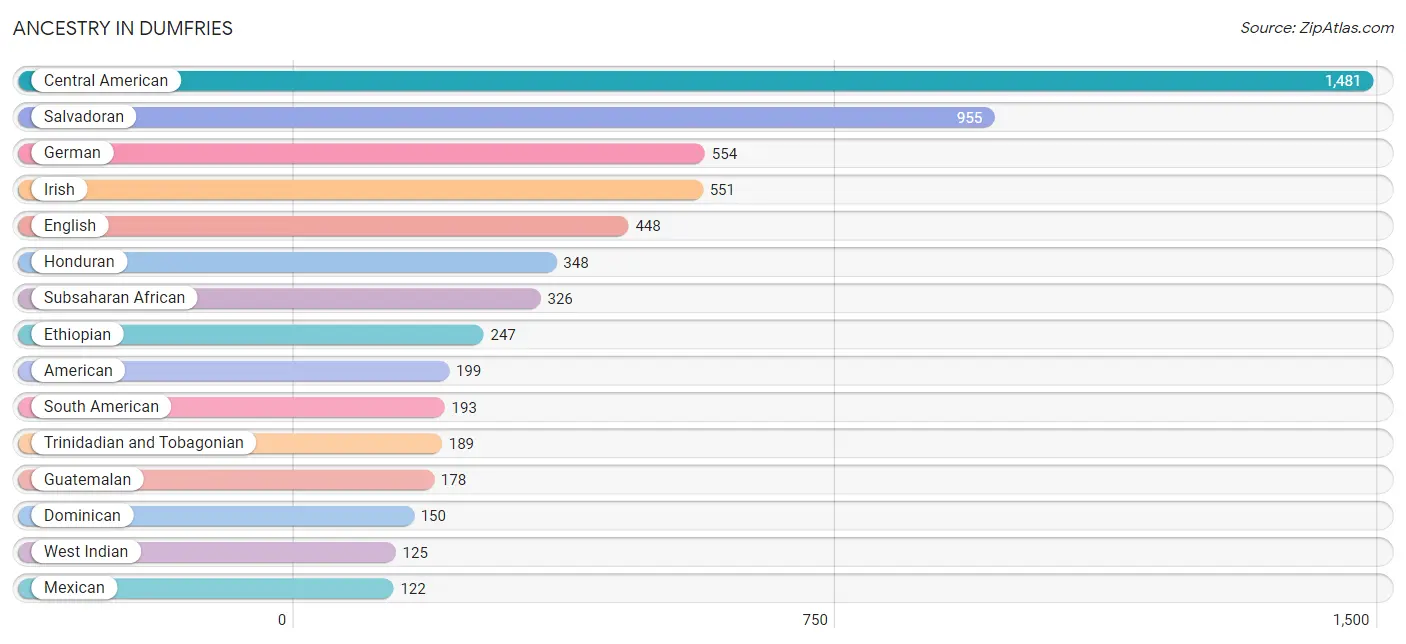
Ancestry in Dumfries
The most populous ancestries reported in Dumfries are Central American (1,481 | 26.0%), Salvadoran (955 | 16.8%), German (554 | 9.7%), Irish (551 | 9.7%), and English (448 | 7.9%), together accounting for 70.0% of all Dumfries residents.
| Ancestry | # Population | % Population |
| African | 30 | 0.5% |
| American | 199 | 3.5% |
| Austrian | 14 | 0.3% |
| Bolivian | 59 | 1.0% |
| British | 52 | 0.9% |
| Central American | 1,481 | 26.0% |
| Cherokee | 86 | 1.5% |
| Czech | 98 | 1.7% |
| Dominican | 150 | 2.6% |
| English | 448 | 7.9% |
| Ethiopian | 247 | 4.3% |
| European | 1 | 0.0% |
| French | 16 | 0.3% |
| German | 554 | 9.7% |
| Ghanaian | 35 | 0.6% |
| Greek | 5 | 0.1% |
| Guatemalan | 178 | 3.1% |
| Honduran | 348 | 6.1% |
| Irish | 551 | 9.7% |
| Italian | 48 | 0.8% |
| Korean | 39 | 0.7% |
| Mexican | 122 | 2.1% |
| Nigerian | 14 | 0.3% |
| Norwegian | 80 | 1.4% |
| Peruvian | 119 | 2.1% |
| Polish | 42 | 0.7% |
| Puerto Rican | 48 | 0.8% |
| Salvadoran | 955 | 16.8% |
| Scotch-Irish | 85 | 1.5% |
| Sierra Leonean | 14 | 0.3% |
| South American | 193 | 3.4% |
| Spanish American Indian | 98 | 1.7% |
| Subsaharan African | 326 | 5.7% |
| Swiss | 22 | 0.4% |
| Trinidadian and Tobagonian | 189 | 3.3% |
| Venezuelan | 15 | 0.3% |
| Welsh | 42 | 0.7% |
| West Indian | 125 | 2.2% | View All 38 Rows |
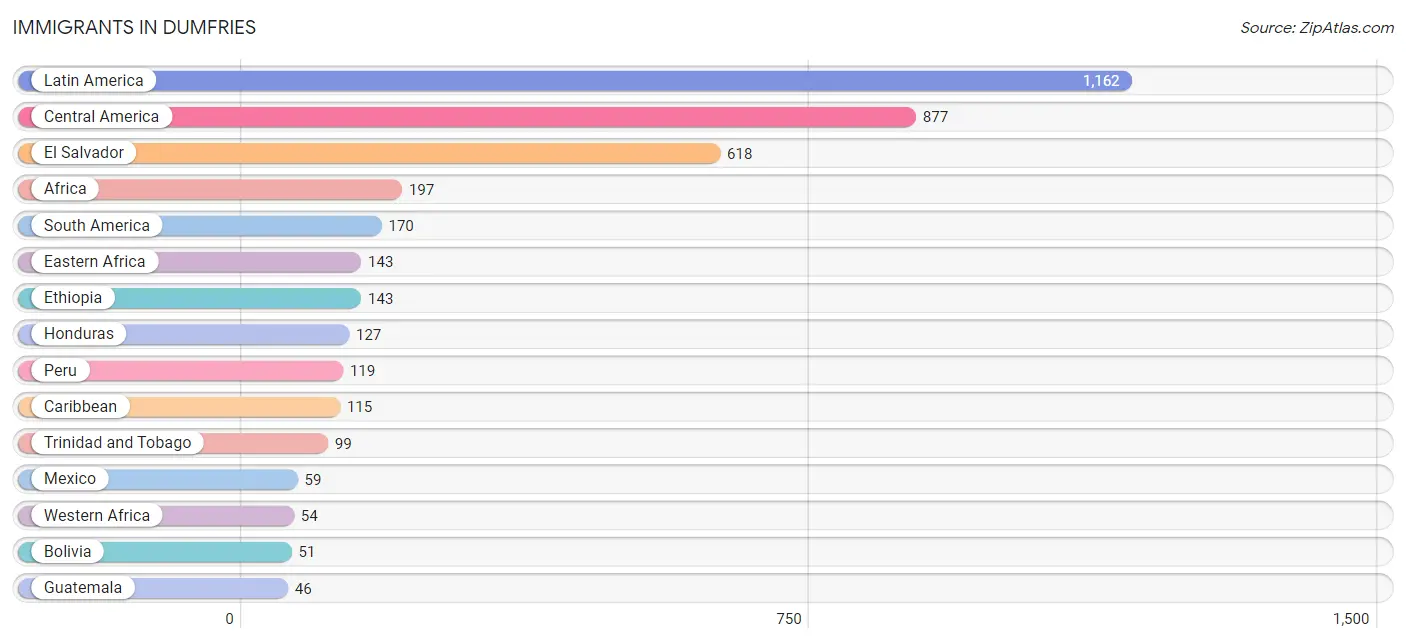
Immigrants in Dumfries
The most numerous immigrant groups reported in Dumfries came from Latin America (1,162 | 20.4%), Central America (877 | 15.4%), El Salvador (618 | 10.8%), Africa (197 | 3.5%), and South America (170 | 3.0%), together accounting for 53.1% of all Dumfries residents.
| Immigration Origin | # Population | % Population |
| Africa | 197 | 3.5% |
| Bolivia | 51 | 0.9% |
| Caribbean | 115 | 2.0% |
| Central America | 877 | 15.4% |
| Eastern Africa | 143 | 2.5% |
| El Salvador | 618 | 10.8% |
| Ethiopia | 143 | 2.5% |
| Ghana | 17 | 0.3% |
| Guatemala | 46 | 0.8% |
| Honduras | 127 | 2.2% |
| Jamaica | 16 | 0.3% |
| Latin America | 1,162 | 20.4% |
| Mexico | 59 | 1.0% |
| Nicaragua | 27 | 0.5% |
| Peru | 119 | 2.1% |
| Sierra Leone | 37 | 0.6% |
| South America | 170 | 3.0% |
| Trinidad and Tobago | 99 | 1.7% |
| Western Africa | 54 | 0.9% | View All 19 Rows |
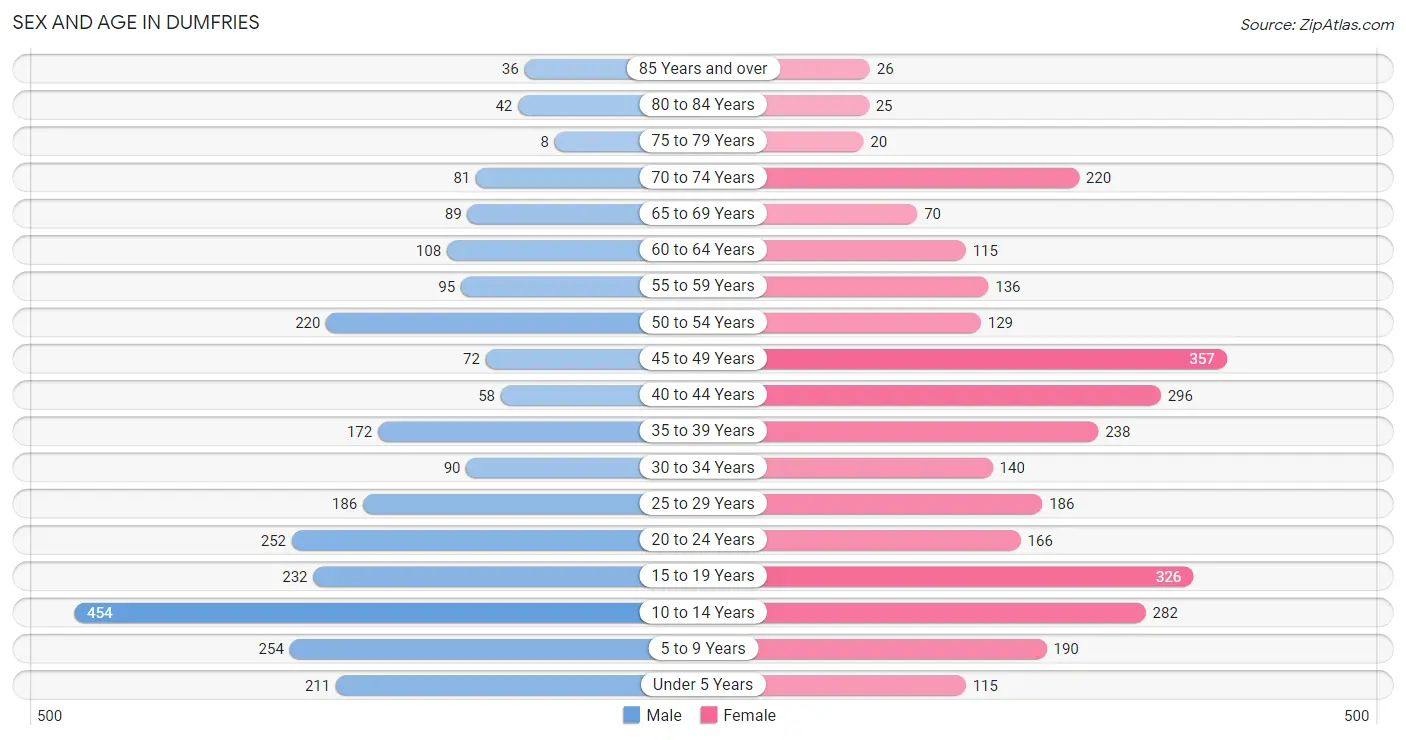
Sex and Age in Dumfries
Sex and Age in Dumfries
The most populous age groups in Dumfries are 10 to 14 Years (454 | 17.1%) for men and 45 to 49 Years (357 | 11.8%) for women.
| Age Bracket | Male | Female |
| Under 5 Years | 211 (7.9%) | 115 (3.8%) |
| 5 to 9 Years | 254 (9.6%) | 190 (6.3%) |
| 10 to 14 Years | 454 (17.1%) | 282 (9.3%) |
| 15 to 19 Years | 232 (8.7%) | 326 (10.7%) |
| 20 to 24 Years | 252 (9.5%) | 166 (5.5%) |
| 25 to 29 Years | 186 (7.0%) | 186 (6.1%) |
| 30 to 34 Years | 90 (3.4%) | 140 (4.6%) |
| 35 to 39 Years | 172 (6.5%) | 238 (7.8%) |
| 40 to 44 Years | 58 (2.2%) | 296 (9.8%) |
| 45 to 49 Years | 72 (2.7%) | 357 (11.8%) |
| 50 to 54 Years | 220 (8.3%) | 129 (4.3%) |
| 55 to 59 Years | 95 (3.6%) | 136 (4.5%) |
| 60 to 64 Years | 108 (4.1%) | 115 (3.8%) |
| 65 to 69 Years | 89 (3.4%) | 70 (2.3%) |
| 70 to 74 Years | 81 (3.0%) | 220 (7.2%) |
| 75 to 79 Years | 8 (0.3%) | 20 (0.7%) |
| 80 to 84 Years | 42 (1.6%) | 25 (0.8%) |
| 85 Years and over | 36 (1.3%) | 26 (0.9%) |
| Total | 2,660 (100.0%) | 3,037 (100.0%) |
Families and Households in Dumfries
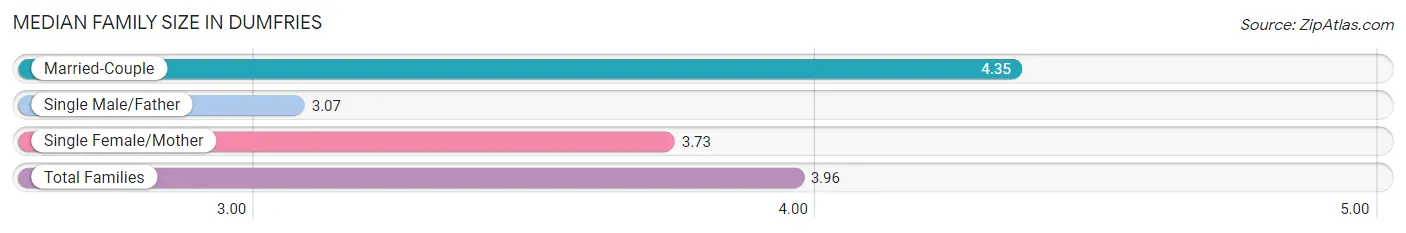
Median Family Size in Dumfries
The median family size in Dumfries is 3.96 persons per family, with married-couple families (633 | 48.7%) accounting for the largest median family size of 4.35 persons per family. On the other hand, single male/father families (146 | 11.2%) represent the smallest median family size with 3.07 persons per family.
| Family Type | # Families | Family Size |
| Married-Couple | 633 (48.7%) | 4.35 |
| Single Male/Father | 146 (11.2%) | 3.07 |
| Single Female/Mother | 521 (40.1%) | 3.73 |
| Total Families | 1,300 (100.0%) | 3.96 |
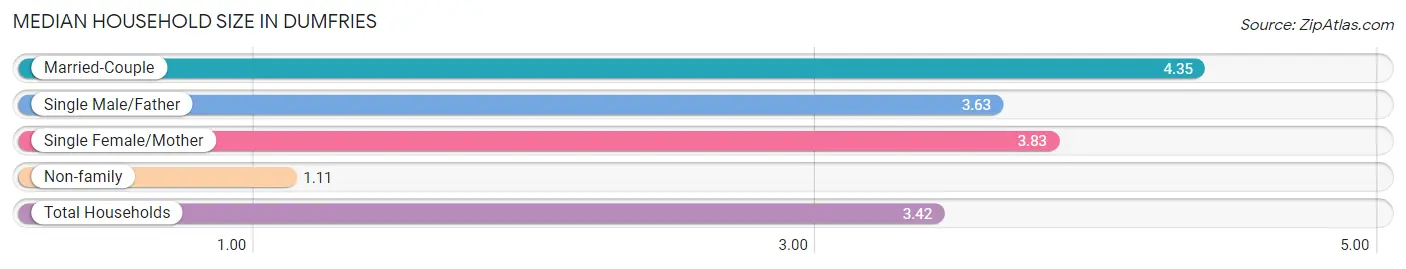
Median Household Size in Dumfries
The median household size in Dumfries is 3.42 persons per household, with married-couple households (633 | 38.1%) accounting for the largest median household size of 4.35 persons per household. non-family households (360 | 21.7%) represent the smallest median household size with 1.11 persons per household.
| Household Type | # Households | Household Size |
| Married-Couple | 633 (38.1%) | 4.35 |
| Single Male/Father | 146 (8.8%) | 3.63 |
| Single Female/Mother | 521 (31.4%) | 3.83 |
| Non-family | 360 (21.7%) | 1.11 |
| Total Households | 1,660 (100.0%) | 3.42 |
Household Size by Marriage Status in Dumfries
Out of a total of 1,660 households in Dumfries, 1,300 (78.3%) are family households, while 360 (21.7%) are nonfamily households. The most numerous type of family households are 2-person households, comprising 312, and the most common type of nonfamily households are 1-person households, comprising 329.
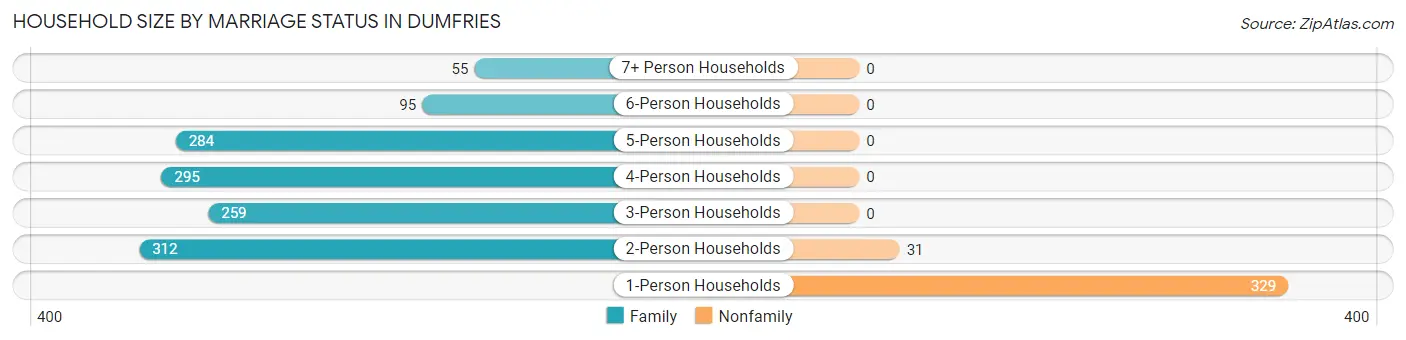
| Household Size | Family Households | Nonfamily Households |
| 1-Person Households | - | 329 (19.8%) |
| 2-Person Households | 312 (18.8%) | 31 (1.9%) |
| 3-Person Households | 259 (15.6%) | 0 (0.0%) |
| 4-Person Households | 295 (17.8%) | 0 (0.0%) |
| 5-Person Households | 284 (17.1%) | 0 (0.0%) |
| 6-Person Households | 95 (5.7%) | 0 (0.0%) |
| 7+ Person Households | 55 (3.3%) | 0 (0.0%) |
| Total | 1,300 (78.3%) | 360 (21.7%) |
Female Fertility in Dumfries
Fertility by Age in Dumfries
Average fertility rate in Dumfries is 79.0 births per 1,000 women. Women in the age bracket of 35 to 50 years have the highest fertility rate with 99.0 births per 1,000 women. Women in the age bracket of 35 to 50 years acount for 66.9% of all women with births.
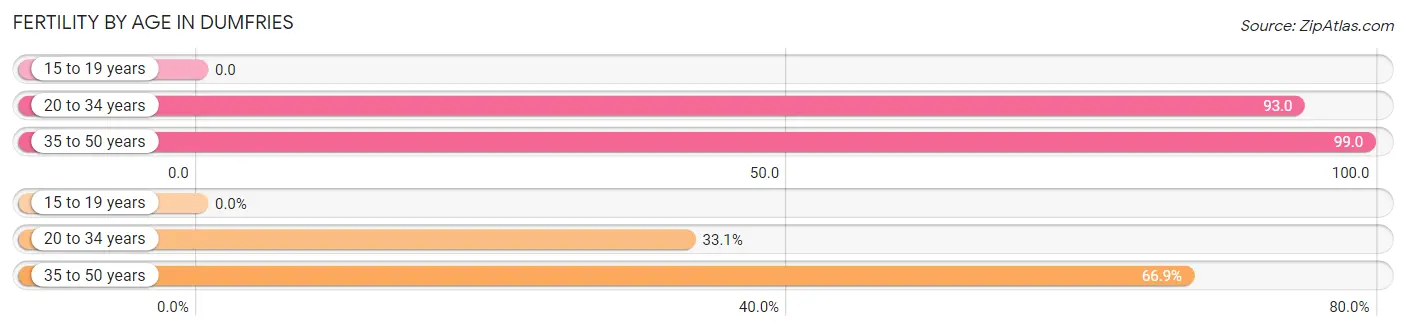
| Age Bracket | Women with Births | Births / 1,000 Women |
| 15 to 19 years | 0 (0.0%) | 0.0 |
| 20 to 34 years | 46 (33.1%) | 93.0 |
| 35 to 50 years | 93 (66.9%) | 99.0 |
| Total | 139 (100.0%) | 79.0 |
Fertility by Age by Marriage Status in Dumfries
79.1% of women with births (139) in Dumfries are married. The highest percentage of unmarried women with births falls into 35 to 50 years age bracket with 31.2% of them unmarried at the time of birth, while the lowest percentage of unmarried women with births belong to 20 to 34 years age bracket with 0.0% of them unmarried.
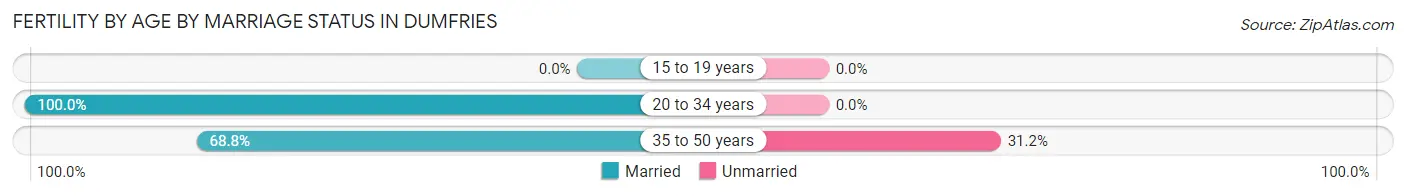
| Age Bracket | Married | Unmarried |
| 15 to 19 years | 0 (0.0%) | 0 (0.0%) |
| 20 to 34 years | 46 (100.0%) | 0 (0.0%) |
| 35 to 50 years | 64 (68.8%) | 29 (31.2%) |
| Total | 110 (79.1%) | 29 (20.9%) |
Fertility by Education in Dumfries
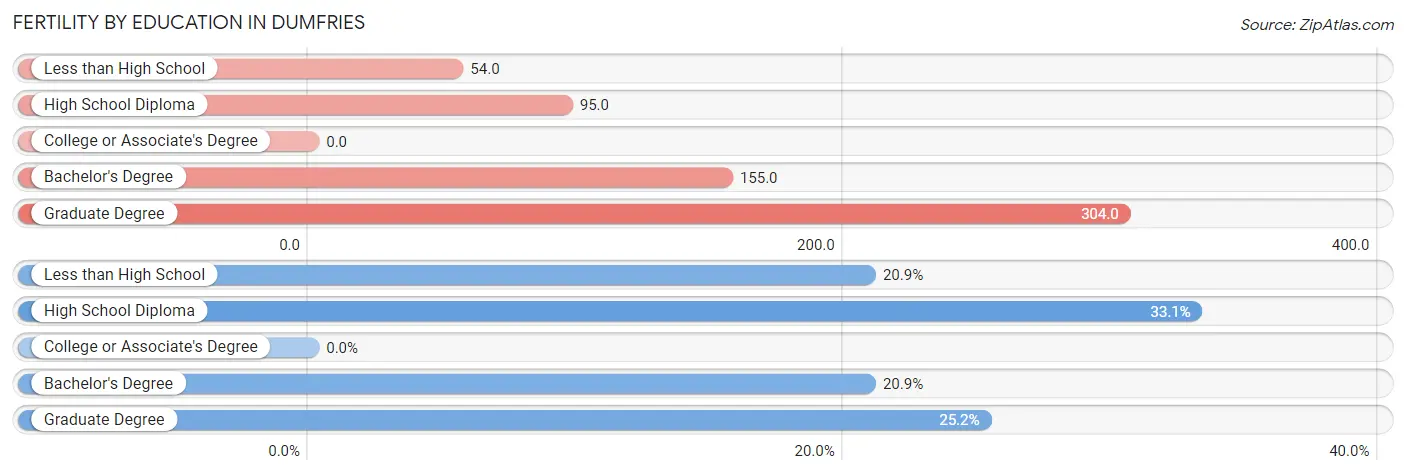
| Educational Attainment | Women with Births | Births / 1,000 Women |
| Less than High School | 29 (20.9%) | 54.0 |
| High School Diploma | 46 (33.1%) | 95.0 |
| College or Associate's Degree | 0 (0.0%) | 0.0 |
| Bachelor's Degree | 29 (20.9%) | 155.0 |
| Graduate Degree | 35 (25.2%) | 304.0 |
| Total | 139 (100.0%) | 79.0 |
Fertility by Education by Marriage Status in Dumfries
20.9% of women with births in Dumfries are unmarried. Women with the educational attainment of high school diploma are most likely to be married with 100.0% of them married at childbirth, while women with the educational attainment of less than high school are least likely to be married with 100.0% of them unmarried at childbirth.
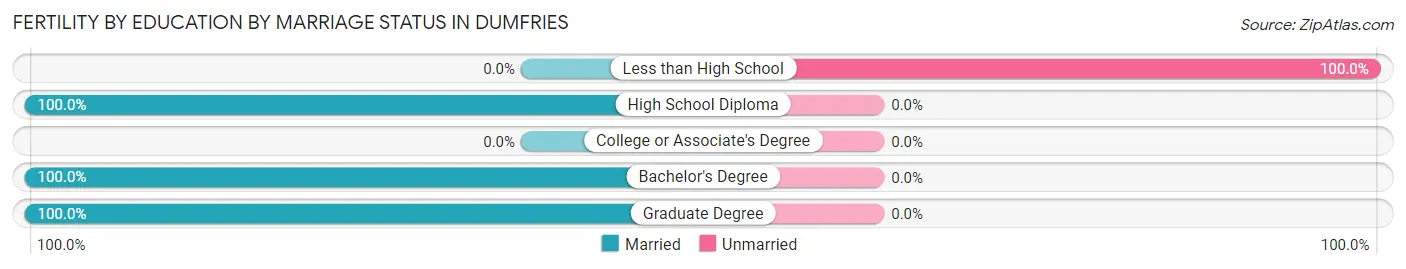
| Educational Attainment | Married | Unmarried |
| Less than High School | 0 (0.0%) | 29 (100.0%) |
| High School Diploma | 46 (100.0%) | 0 (0.0%) |
| College or Associate's Degree | 0 (0.0%) | 0 (0.0%) |
| Bachelor's Degree | 29 (100.0%) | 0 (0.0%) |
| Graduate Degree | 35 (100.0%) | 0 (0.0%) |
| Total | 110 (79.1%) | 29 (20.9%) |
Employment Characteristics in Dumfries
Employment by Class of Employer in Dumfries
Among the 2,701 employed individuals in Dumfries, private company employees (1,950 | 72.2%), federal government employees (268 | 9.9%), and local government employees (244 | 9.0%) make up the most common classes of employment.
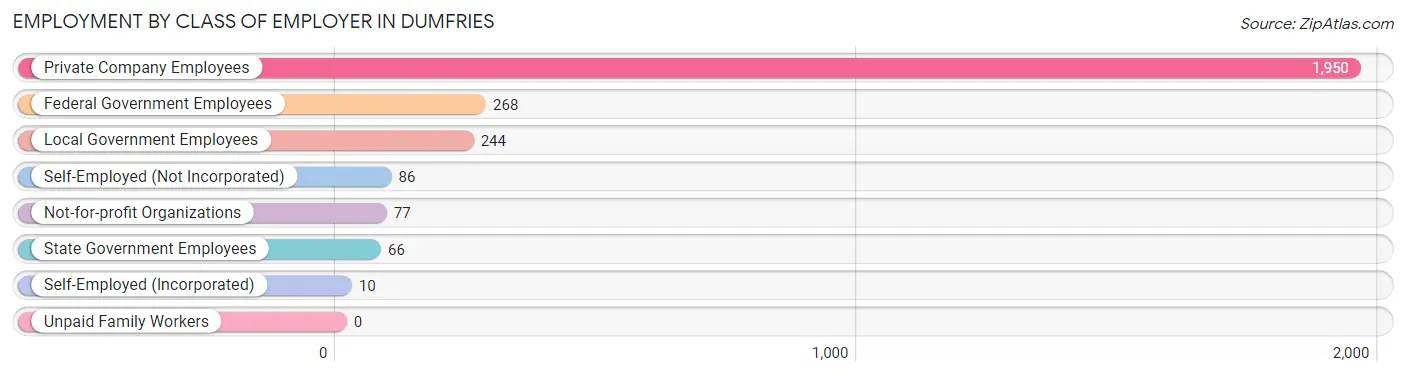
| Employer Class | # Employees | % Employees |
| Private Company Employees | 1,950 | 72.2% |
| Self-Employed (Incorporated) | 10 | 0.4% |
| Self-Employed (Not Incorporated) | 86 | 3.2% |
| Not-for-profit Organizations | 77 | 2.9% |
| Local Government Employees | 244 | 9.0% |
| State Government Employees | 66 | 2.4% |
| Federal Government Employees | 268 | 9.9% |
| Unpaid Family Workers | 0 | 0.0% |
| Total | 2,701 | 100.0% |
Employment Status by Age in Dumfries
According to the labor force statistics for Dumfries, out of the total population over 16 years of age (4,046), 72.1% or 2,917 individuals are in the labor force, with 5.0% or 146 of them unemployed. The age group with the highest labor force participation rate is 25 to 29 years, with 100.0% or 372 individuals in the labor force. Within the labor force, the 30 to 34 years age range has the highest percentage of unemployed individuals, with 11.7% or 25 of them being unemployed.
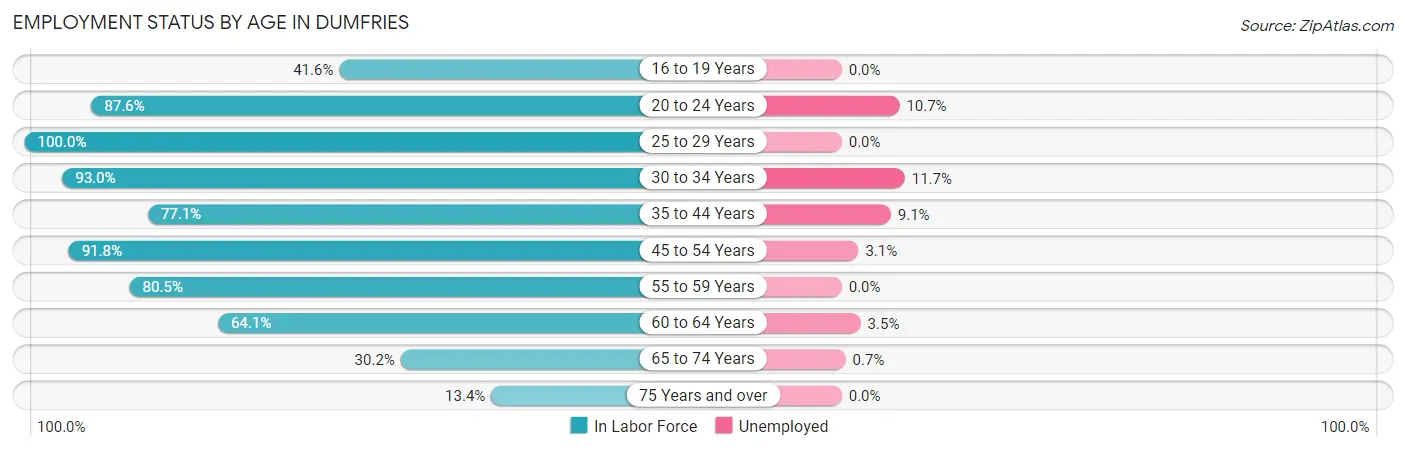
| Age Bracket | In Labor Force | Unemployed |
| 16 to 19 Years | 172 (41.6%) | 0 (0.0%) |
| 20 to 24 Years | 366 (87.6%) | 39 (10.7%) |
| 25 to 29 Years | 372 (100.0%) | 0 (0.0%) |
| 30 to 34 Years | 214 (93.0%) | 25 (11.7%) |
| 35 to 44 Years | 589 (77.1%) | 54 (9.1%) |
| 45 to 54 Years | 714 (91.8%) | 22 (3.1%) |
| 55 to 59 Years | 186 (80.5%) | 0 (0.0%) |
| 60 to 64 Years | 143 (64.1%) | 5 (3.5%) |
| 65 to 74 Years | 139 (30.2%) | 1 (0.7%) |
| 75 Years and over | 21 (13.4%) | 0 (0.0%) |
| Total | 2,917 (72.1%) | 146 (5.0%) |
Employment Status by Educational Attainment in Dumfries
According to labor force statistics for Dumfries, 85.4% of individuals (2,219) out of the total population between 25 and 64 years of age (2,598) are in the labor force, with 4.7% or 104 of them being unemployed. The group with the highest labor force participation rate are those with the educational attainment of less than high school, with 87.6% or 631 individuals in the labor force. Within the labor force, individuals with bachelor's degree or higher education have the highest percentage of unemployment, with 7.6% or 35 of them being unemployed.
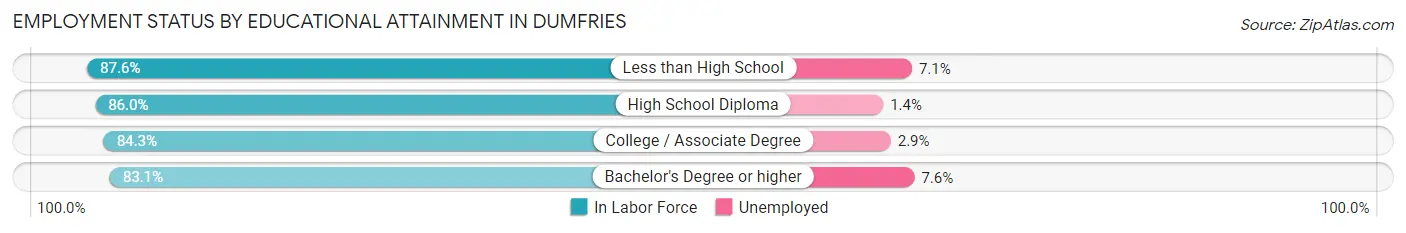
| Educational Attainment | In Labor Force | Unemployed |
| Less than High School | 631 (87.6%) | 51 (7.1%) |
| High School Diploma | 518 (86.0%) | 8 (1.4%) |
| College / Associate Degree | 607 (84.3%) | 21 (2.9%) |
| Bachelor's Degree or higher | 462 (83.1%) | 42 (7.6%) |
| Total | 2,219 (85.4%) | 122 (4.7%) |
Employment Occupations by Sex in Dumfries
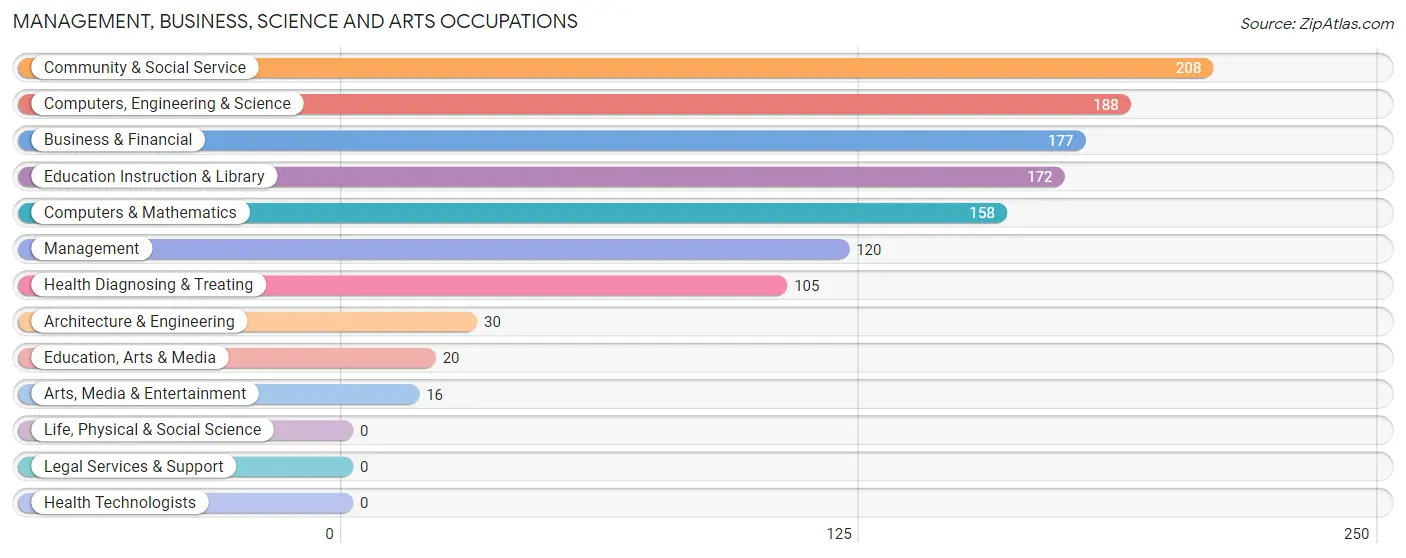
Management, Business, Science and Arts Occupations
The most common Management, Business, Science and Arts occupations in Dumfries are Community & Social Service (208 | 7.5%), Computers, Engineering & Science (188 | 6.8%), Business & Financial (177 | 6.4%), Education Instruction & Library (172 | 6.2%), and Computers & Mathematics (158 | 5.7%).
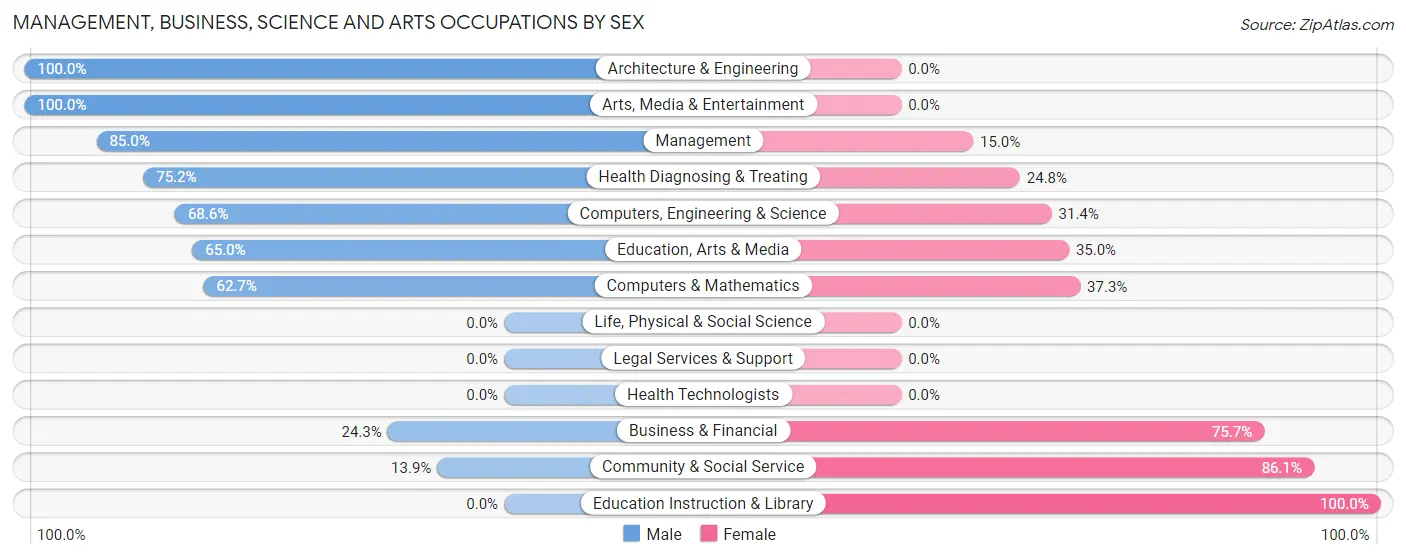
Management, Business, Science and Arts Occupations by Sex
Within the Management, Business, Science and Arts occupations in Dumfries, the most male-oriented occupations are Architecture & Engineering (100.0%), Arts, Media & Entertainment (100.0%), and Management (85.0%), while the most female-oriented occupations are Education Instruction & Library (100.0%), Community & Social Service (86.1%), and Business & Financial (75.7%).
| Occupation | Male | Female |
| Management | 102 (85.0%) | 18 (15.0%) |
| Business & Financial | 43 (24.3%) | 134 (75.7%) |
| Computers, Engineering & Science | 129 (68.6%) | 59 (31.4%) |
| Computers & Mathematics | 99 (62.7%) | 59 (37.3%) |
| Architecture & Engineering | 30 (100.0%) | 0 (0.0%) |
| Life, Physical & Social Science | 0 (0.0%) | 0 (0.0%) |
| Community & Social Service | 29 (13.9%) | 179 (86.1%) |
| Education, Arts & Media | 13 (65.0%) | 7 (35.0%) |
| Legal Services & Support | 0 (0.0%) | 0 (0.0%) |
| Education Instruction & Library | 0 (0.0%) | 172 (100.0%) |
| Arts, Media & Entertainment | 16 (100.0%) | 0 (0.0%) |
| Health Diagnosing & Treating | 79 (75.2%) | 26 (24.8%) |
| Health Technologists | 0 (0.0%) | 0 (0.0%) |
| Total (Category) | 382 (47.9%) | 416 (52.1%) |
| Total (Overall) | 1,261 (45.8%) | 1,495 (54.2%) |
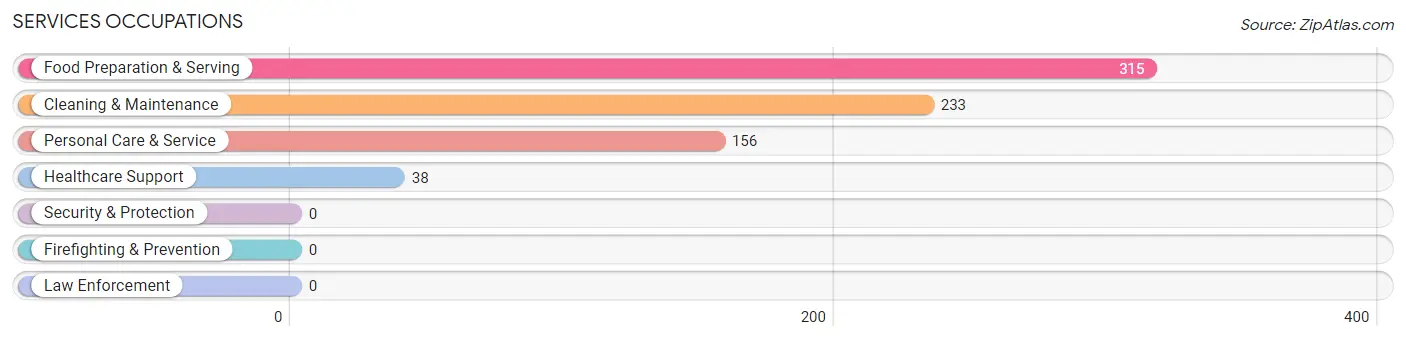
Services Occupations
The most common Services occupations in Dumfries are Food Preparation & Serving (315 | 11.4%), Cleaning & Maintenance (233 | 8.5%), Personal Care & Service (156 | 5.7%), and Healthcare Support (38 | 1.4%).
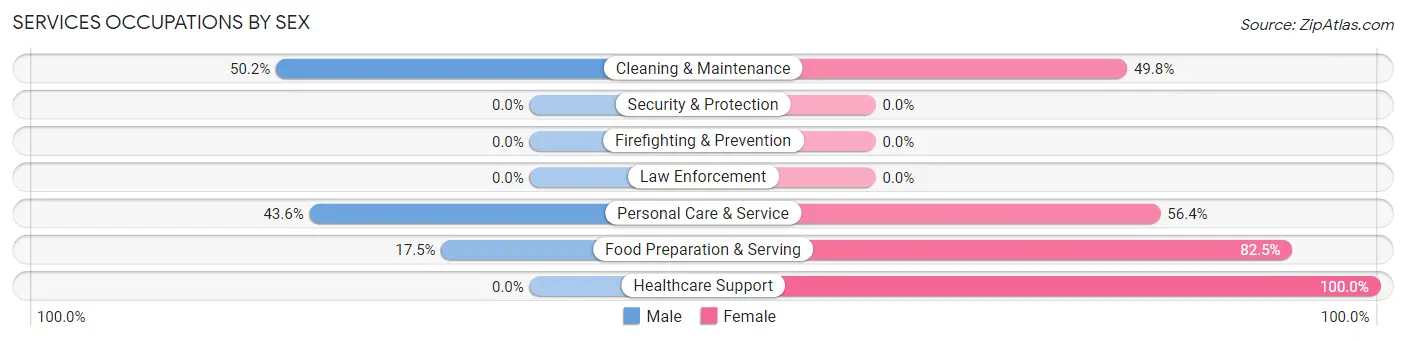
Services Occupations by Sex
Within the Services occupations in Dumfries, the most male-oriented occupations are Cleaning & Maintenance (50.2%), Personal Care & Service (43.6%), and Food Preparation & Serving (17.5%), while the most female-oriented occupations are Healthcare Support (100.0%), Food Preparation & Serving (82.5%), and Personal Care & Service (56.4%).
| Occupation | Male | Female |
| Healthcare Support | 0 (0.0%) | 38 (100.0%) |
| Security & Protection | 0 (0.0%) | 0 (0.0%) |
| Firefighting & Prevention | 0 (0.0%) | 0 (0.0%) |
| Law Enforcement | 0 (0.0%) | 0 (0.0%) |
| Food Preparation & Serving | 55 (17.5%) | 260 (82.5%) |
| Cleaning & Maintenance | 117 (50.2%) | 116 (49.8%) |
| Personal Care & Service | 68 (43.6%) | 88 (56.4%) |
| Total (Category) | 240 (32.4%) | 502 (67.6%) |
| Total (Overall) | 1,261 (45.8%) | 1,495 (54.2%) |
Sales and Office Occupations
The most common Sales and Office occupations in Dumfries are Office & Administration (434 | 15.8%), and Sales & Related (163 | 5.9%).

Sales and Office Occupations by Sex

| Occupation | Male | Female |
| Sales & Related | 83 (50.9%) | 80 (49.1%) |
| Office & Administration | 53 (12.2%) | 381 (87.8%) |
| Total (Category) | 136 (22.8%) | 461 (77.2%) |
| Total (Overall) | 1,261 (45.8%) | 1,495 (54.2%) |
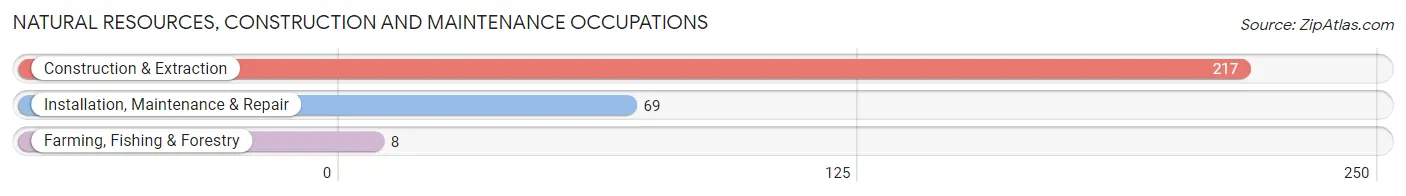
Natural Resources, Construction and Maintenance Occupations
The most common Natural Resources, Construction and Maintenance occupations in Dumfries are Construction & Extraction (217 | 7.9%), Installation, Maintenance & Repair (69 | 2.5%), and Farming, Fishing & Forestry (8 | 0.3%).
Natural Resources, Construction and Maintenance Occupations by Sex
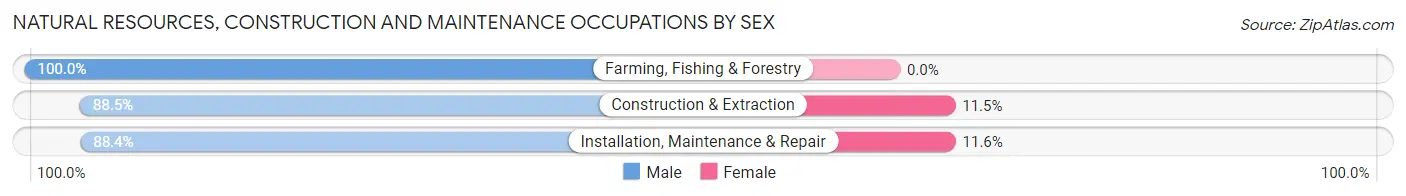
| Occupation | Male | Female |
| Farming, Fishing & Forestry | 8 (100.0%) | 0 (0.0%) |
| Construction & Extraction | 192 (88.5%) | 25 (11.5%) |
| Installation, Maintenance & Repair | 61 (88.4%) | 8 (11.6%) |
| Total (Category) | 261 (88.8%) | 33 (11.2%) |
| Total (Overall) | 1,261 (45.8%) | 1,495 (54.2%) |
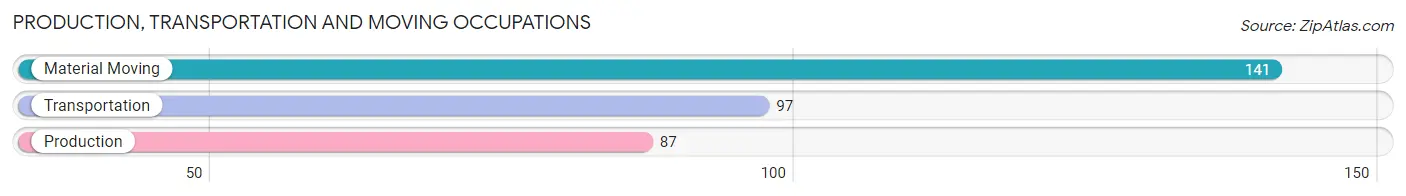
Production, Transportation and Moving Occupations
The most common Production, Transportation and Moving occupations in Dumfries are Material Moving (141 | 5.1%), Transportation (97 | 3.5%), and Production (87 | 3.2%).
Production, Transportation and Moving Occupations by Sex
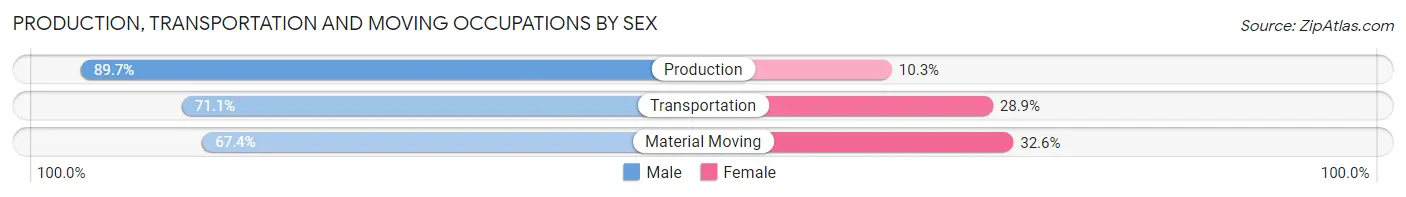
| Occupation | Male | Female |
| Production | 78 (89.7%) | 9 (10.3%) |
| Transportation | 69 (71.1%) | 28 (28.9%) |
| Material Moving | 95 (67.4%) | 46 (32.6%) |
| Total (Category) | 242 (74.5%) | 83 (25.5%) |
| Total (Overall) | 1,261 (45.8%) | 1,495 (54.2%) |
Employment Industries by Sex in Dumfries
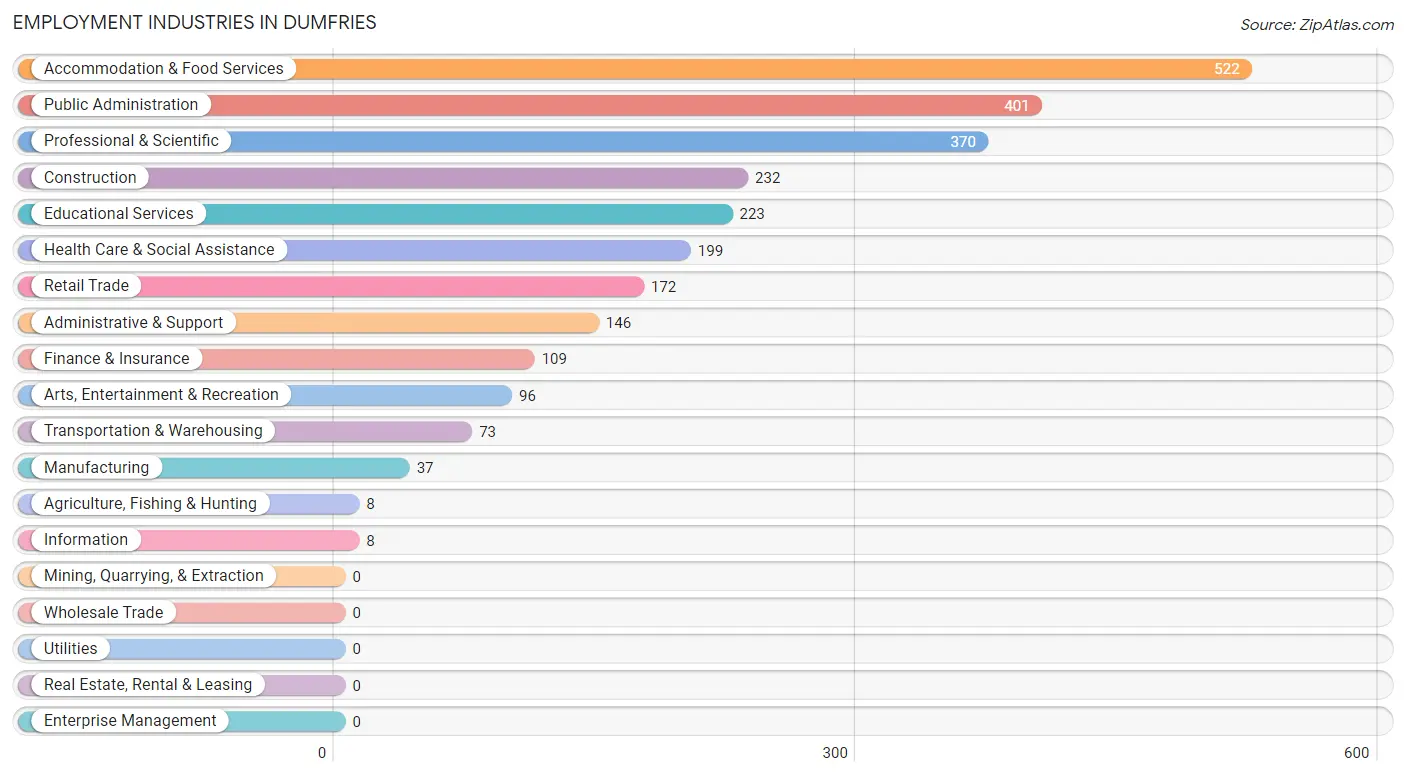
Employment Industries in Dumfries
The major employment industries in Dumfries include Accommodation & Food Services (522 | 18.9%), Public Administration (401 | 14.5%), Professional & Scientific (370 | 13.4%), Construction (232 | 8.4%), and Educational Services (223 | 8.1%).
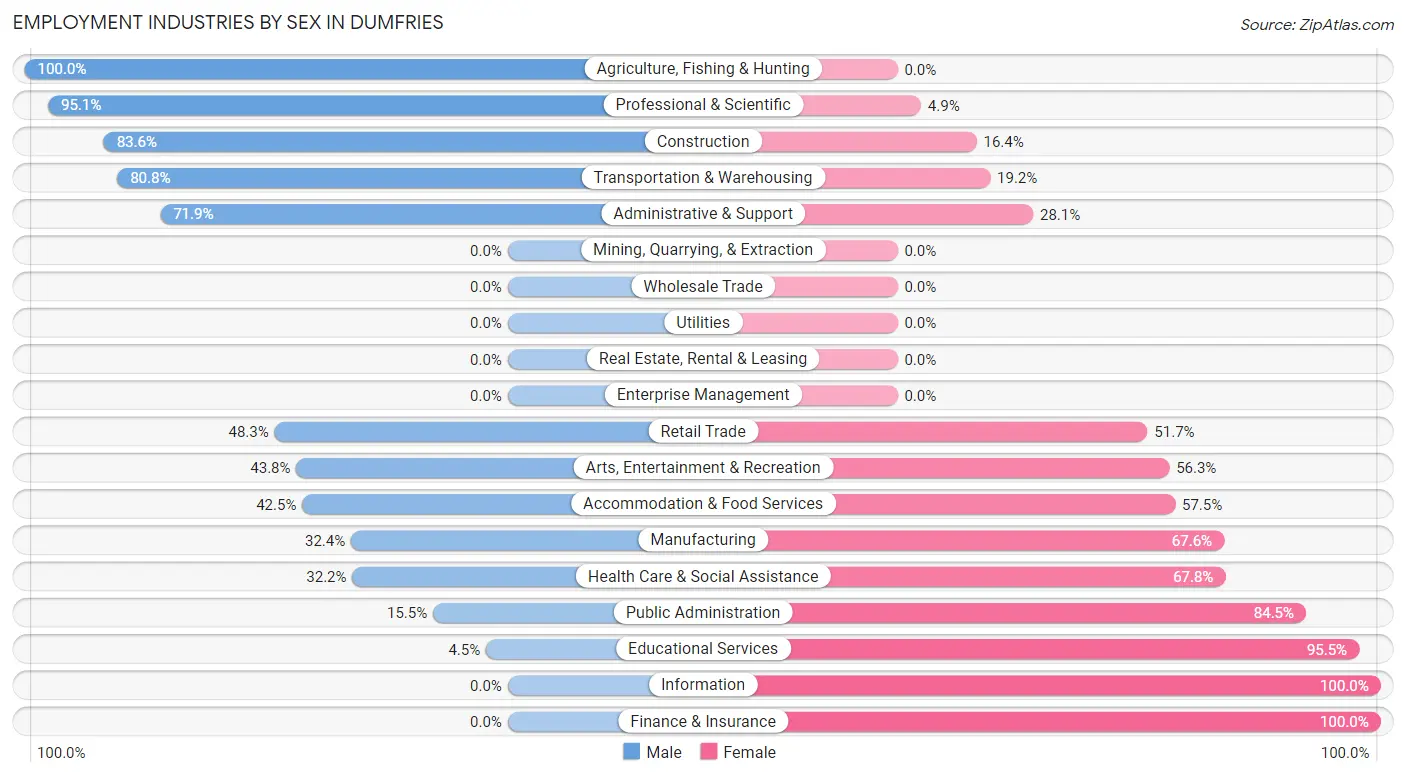
Employment Industries by Sex in Dumfries
The Dumfries industries that see more men than women are Agriculture, Fishing & Hunting (100.0%), Professional & Scientific (95.1%), and Construction (83.6%), whereas the industries that tend to have a higher number of women are Information (100.0%), Finance & Insurance (100.0%), and Educational Services (95.5%).
| Industry | Male | Female |
| Agriculture, Fishing & Hunting | 8 (100.0%) | 0 (0.0%) |
| Mining, Quarrying, & Extraction | 0 (0.0%) | 0 (0.0%) |
| Construction | 194 (83.6%) | 38 (16.4%) |
| Manufacturing | 12 (32.4%) | 25 (67.6%) |
| Wholesale Trade | 0 (0.0%) | 0 (0.0%) |
| Retail Trade | 83 (48.3%) | 89 (51.7%) |
| Transportation & Warehousing | 59 (80.8%) | 14 (19.2%) |
| Utilities | 0 (0.0%) | 0 (0.0%) |
| Information | 0 (0.0%) | 8 (100.0%) |
| Finance & Insurance | 0 (0.0%) | 109 (100.0%) |
| Real Estate, Rental & Leasing | 0 (0.0%) | 0 (0.0%) |
| Professional & Scientific | 352 (95.1%) | 18 (4.9%) |
| Enterprise Management | 0 (0.0%) | 0 (0.0%) |
| Administrative & Support | 105 (71.9%) | 41 (28.1%) |
| Educational Services | 10 (4.5%) | 213 (95.5%) |
| Health Care & Social Assistance | 64 (32.2%) | 135 (67.8%) |
| Arts, Entertainment & Recreation | 42 (43.8%) | 54 (56.2%) |
| Accommodation & Food Services | 222 (42.5%) | 300 (57.5%) |
| Public Administration | 62 (15.5%) | 339 (84.5%) |
| Total | 1,261 (45.8%) | 1,495 (54.2%) |
Education in Dumfries
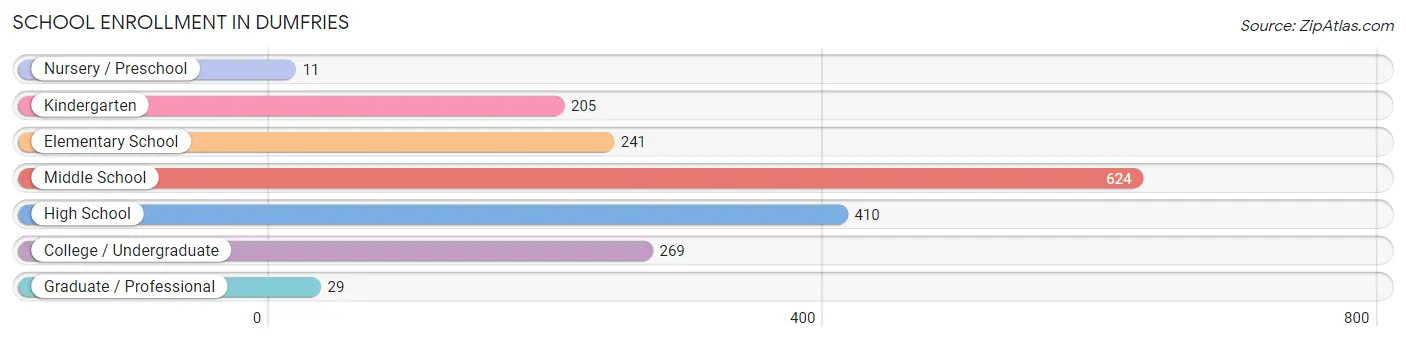
School Enrollment in Dumfries
The most common levels of schooling among the 1,789 students in Dumfries are middle school (624 | 34.9%), high school (410 | 22.9%), and college / undergraduate (269 | 15.0%).
| School Level | # Students | % Students |
| Nursery / Preschool | 11 | 0.6% |
| Kindergarten | 205 | 11.5% |
| Elementary School | 241 | 13.5% |
| Middle School | 624 | 34.9% |
| High School | 410 | 22.9% |
| College / Undergraduate | 269 | 15.0% |
| Graduate / Professional | 29 | 1.6% |
| Total | 1,789 | 100.0% |
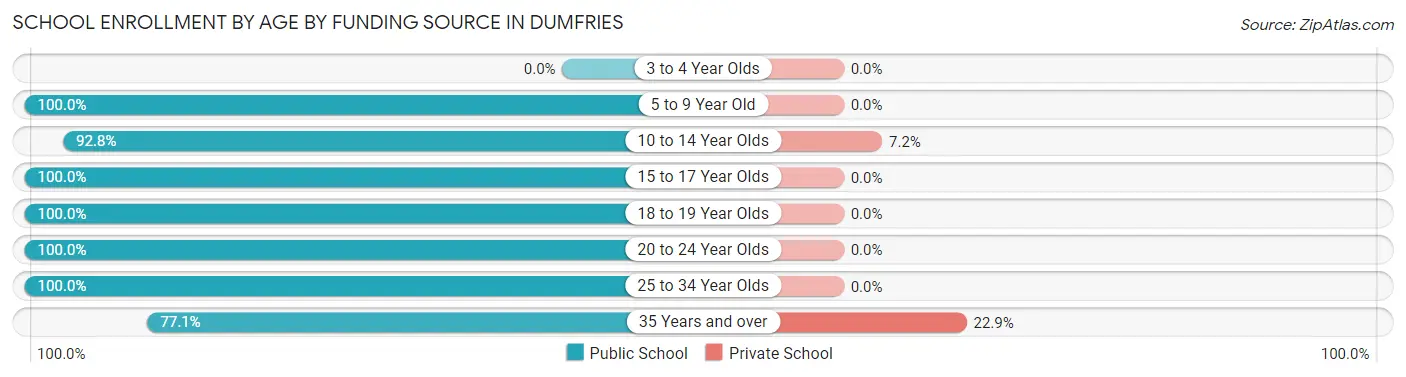
School Enrollment by Age by Funding Source in Dumfries
Out of a total of 1,789 students who are enrolled in schools in Dumfries, 82 (4.6%) attend a private institution, while the remaining 1,707 (95.4%) are enrolled in public schools. The age group of 35 years and over has the highest likelihood of being enrolled in private schools, with 35 (22.9% in the age bracket) enrolled. Conversely, the age group of 5 to 9 year old has the lowest likelihood of being enrolled in a private school, with 444 (100.0% in the age bracket) attending a public institution.
| Age Bracket | Public School | Private School |
| 3 to 4 Year Olds | 0 (0.0%) | 0 (0.0%) |
| 5 to 9 Year Old | 444 (100.0%) | 0 (0.0%) |
| 10 to 14 Year Olds | 622 (92.8%) | 48 (7.2%) |
| 15 to 17 Year Olds | 365 (100.0%) | 0 (0.0%) |
| 18 to 19 Year Olds | 105 (100.0%) | 0 (0.0%) |
| 20 to 24 Year Olds | 40 (100.0%) | 0 (0.0%) |
| 25 to 34 Year Olds | 12 (100.0%) | 0 (0.0%) |
| 35 Years and over | 118 (77.1%) | 35 (22.9%) |
| Total | 1,707 (95.4%) | 82 (4.6%) |
Educational Attainment by Field of Study in Dumfries
Business (193 | 27.7%), computers & mathematics (134 | 19.3%), education (85 | 12.2%), psychology (72 | 10.3%), and arts & humanities (68 | 9.8%) are the most common fields of study among 696 individuals in Dumfries who have obtained a bachelor's degree or higher.
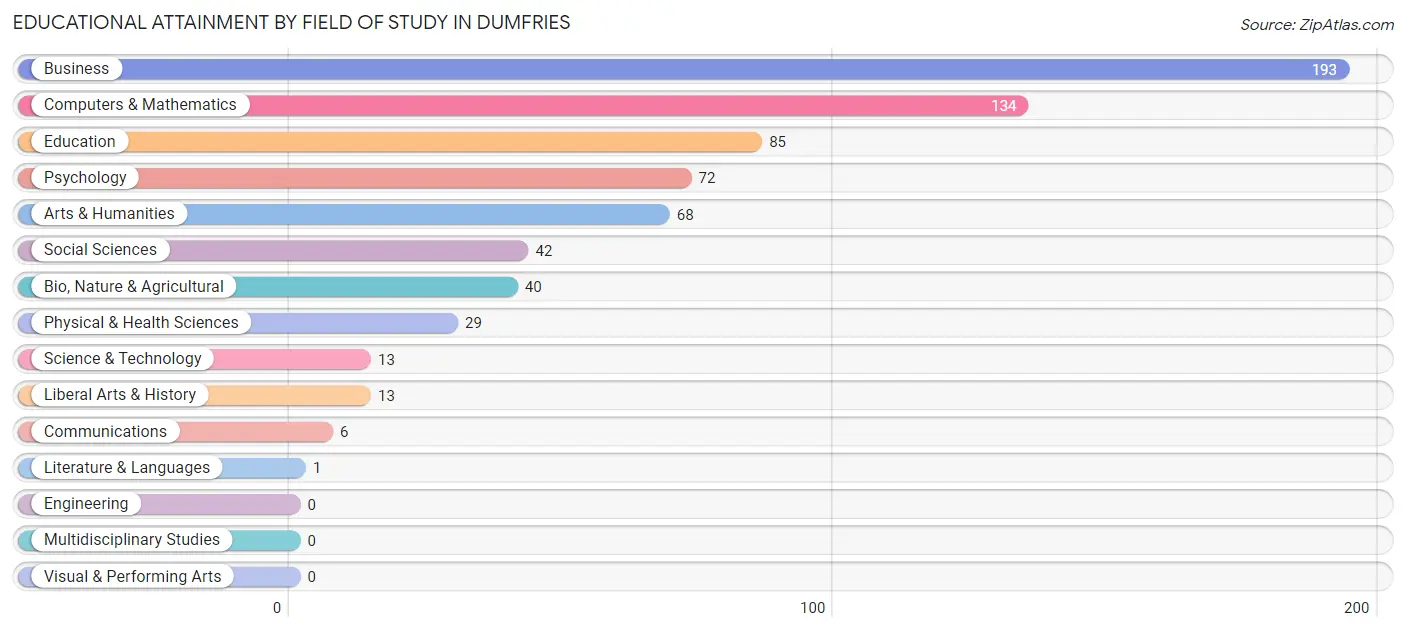
| Field of Study | # Graduates | % Graduates |
| Computers & Mathematics | 134 | 19.3% |
| Bio, Nature & Agricultural | 40 | 5.8% |
| Physical & Health Sciences | 29 | 4.2% |
| Psychology | 72 | 10.3% |
| Social Sciences | 42 | 6.0% |
| Engineering | 0 | 0.0% |
| Multidisciplinary Studies | 0 | 0.0% |
| Science & Technology | 13 | 1.9% |
| Business | 193 | 27.7% |
| Education | 85 | 12.2% |
| Literature & Languages | 1 | 0.1% |
| Liberal Arts & History | 13 | 1.9% |
| Visual & Performing Arts | 0 | 0.0% |
| Communications | 6 | 0.9% |
| Arts & Humanities | 68 | 9.8% |
| Total | 696 | 100.0% |
Transportation & Commute in Dumfries
Vehicle Availability by Sex in Dumfries
The most prevalent vehicle ownership categories in Dumfries are males with 3 vehicles (500, accounting for 39.2%) and females with 3 vehicles (358, making up 35.1%).
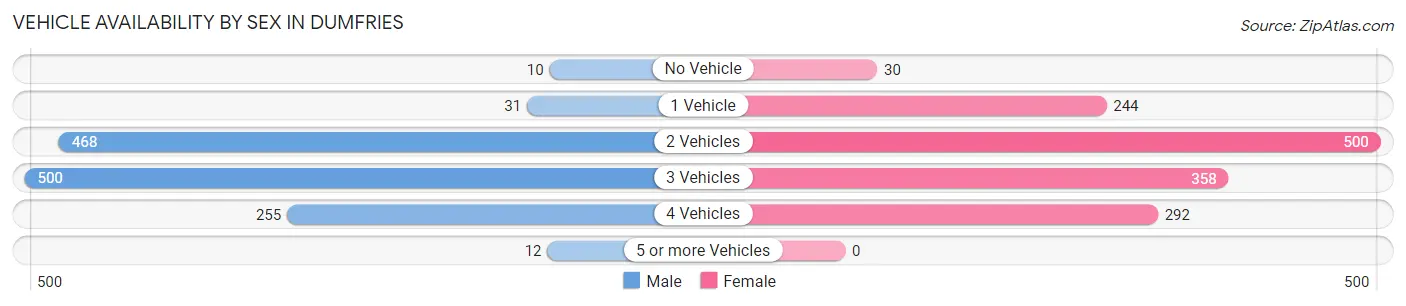
| Vehicles Available | Male | Female |
| No Vehicle | 10 (0.8%) | 30 (2.1%) |
| 1 Vehicle | 31 (2.4%) | 244 (17.1%) |
| 2 Vehicles | 468 (36.7%) | 500 (35.1%) |
| 3 Vehicles | 500 (39.2%) | 358 (25.1%) |
| 4 Vehicles | 255 (20.0%) | 292 (20.5%) |
| 5 or more Vehicles | 12 (0.9%) | 0 (0.0%) |
| Total | 1,276 (100.0%) | 1,424 (100.0%) |
Commute Time in Dumfries
The most frequently occuring commute durations in Dumfries are 60 to 89 minutes (487 commuters, 19.9%), 15 to 19 minutes (417 commuters, 17.1%), and 45 to 59 minutes (388 commuters, 15.9%).
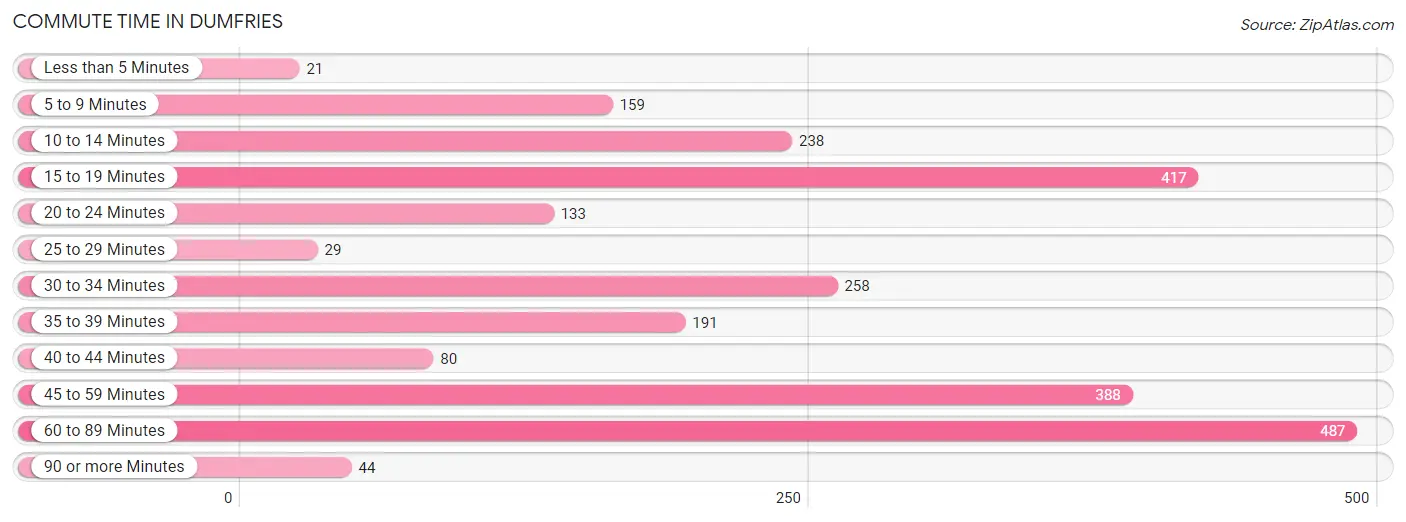
| Commute Time | # Commuters | % Commuters |
| Less than 5 Minutes | 21 | 0.9% |
| 5 to 9 Minutes | 159 | 6.5% |
| 10 to 14 Minutes | 238 | 9.7% |
| 15 to 19 Minutes | 417 | 17.1% |
| 20 to 24 Minutes | 133 | 5.4% |
| 25 to 29 Minutes | 29 | 1.2% |
| 30 to 34 Minutes | 258 | 10.5% |
| 35 to 39 Minutes | 191 | 7.8% |
| 40 to 44 Minutes | 80 | 3.3% |
| 45 to 59 Minutes | 388 | 15.9% |
| 60 to 89 Minutes | 487 | 19.9% |
| 90 or more Minutes | 44 | 1.8% |
Commute Time by Sex in Dumfries
The most common commute times in Dumfries are 60 to 89 minutes (335 commuters, 28.5%) for males and 15 to 19 minutes (316 commuters, 24.9%) for females.
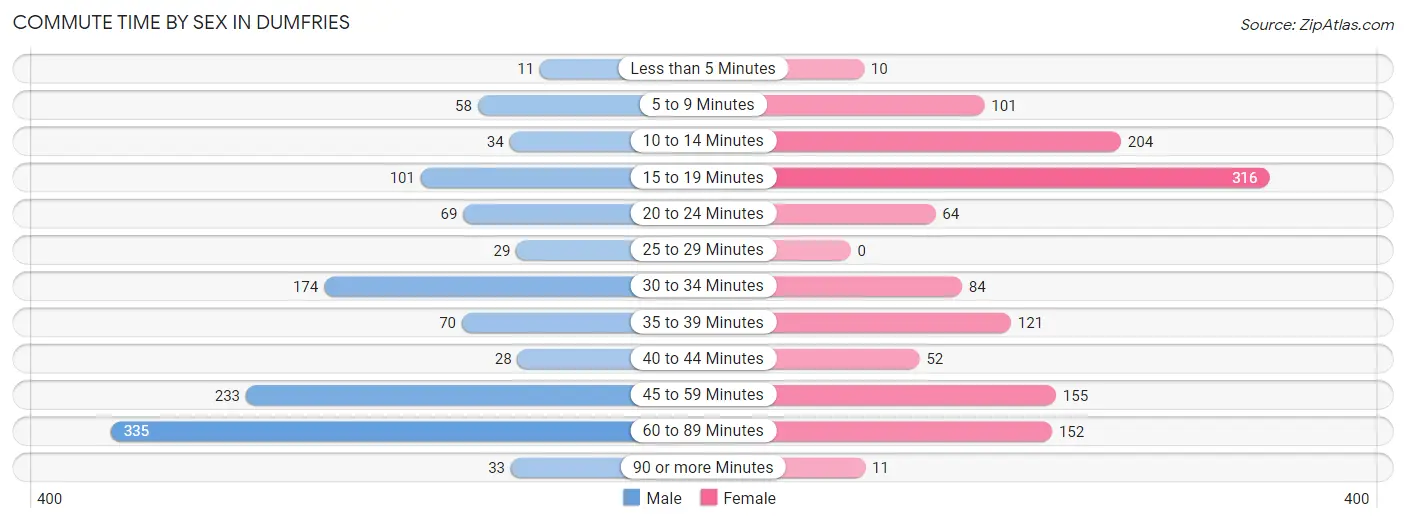
| Commute Time | Male | Female |
| Less than 5 Minutes | 11 (0.9%) | 10 (0.8%) |
| 5 to 9 Minutes | 58 (4.9%) | 101 (8.0%) |
| 10 to 14 Minutes | 34 (2.9%) | 204 (16.1%) |
| 15 to 19 Minutes | 101 (8.6%) | 316 (24.9%) |
| 20 to 24 Minutes | 69 (5.9%) | 64 (5.0%) |
| 25 to 29 Minutes | 29 (2.5%) | 0 (0.0%) |
| 30 to 34 Minutes | 174 (14.8%) | 84 (6.6%) |
| 35 to 39 Minutes | 70 (6.0%) | 121 (9.5%) |
| 40 to 44 Minutes | 28 (2.4%) | 52 (4.1%) |
| 45 to 59 Minutes | 233 (19.8%) | 155 (12.2%) |
| 60 to 89 Minutes | 335 (28.5%) | 152 (12.0%) |
| 90 or more Minutes | 33 (2.8%) | 11 (0.9%) |
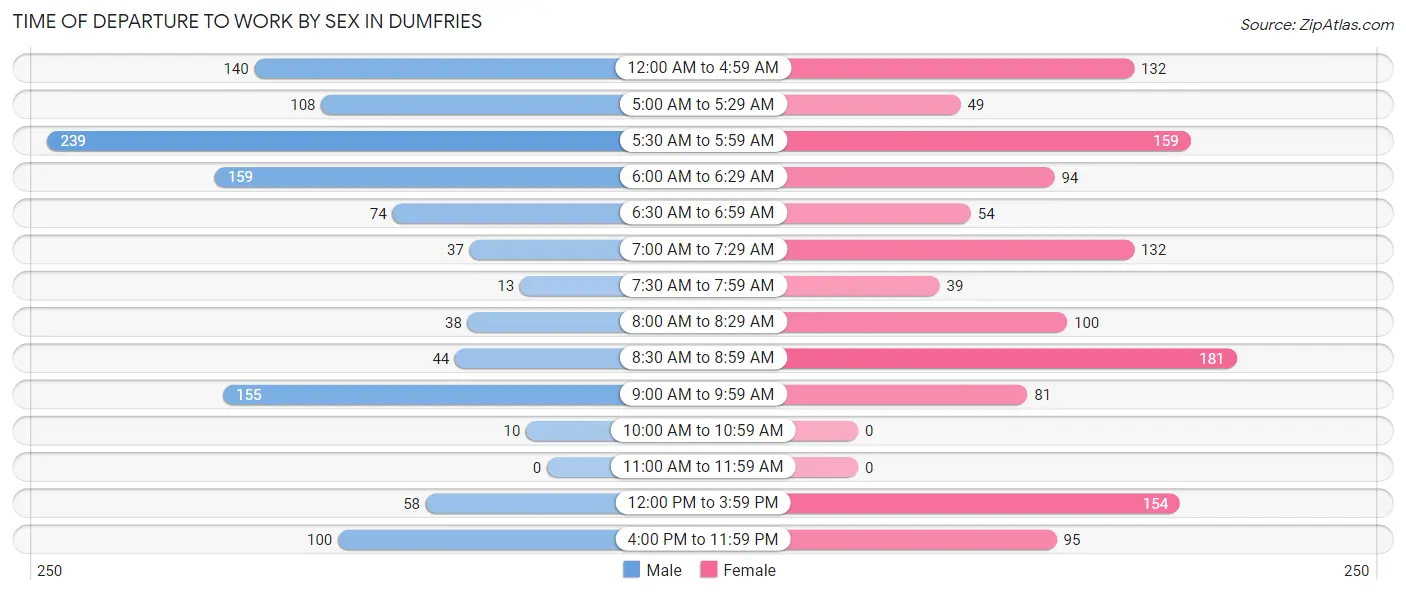
Time of Departure to Work by Sex in Dumfries
The most frequent times of departure to work in Dumfries are 5:30 AM to 5:59 AM (239, 20.3%) for males and 8:30 AM to 8:59 AM (181, 14.2%) for females.
| Time of Departure | Male | Female |
| 12:00 AM to 4:59 AM | 140 (11.9%) | 132 (10.4%) |
| 5:00 AM to 5:29 AM | 108 (9.2%) | 49 (3.9%) |
| 5:30 AM to 5:59 AM | 239 (20.3%) | 159 (12.5%) |
| 6:00 AM to 6:29 AM | 159 (13.5%) | 94 (7.4%) |
| 6:30 AM to 6:59 AM | 74 (6.3%) | 54 (4.3%) |
| 7:00 AM to 7:29 AM | 37 (3.2%) | 132 (10.4%) |
| 7:30 AM to 7:59 AM | 13 (1.1%) | 39 (3.1%) |
| 8:00 AM to 8:29 AM | 38 (3.2%) | 100 (7.9%) |
| 8:30 AM to 8:59 AM | 44 (3.7%) | 181 (14.2%) |
| 9:00 AM to 9:59 AM | 155 (13.2%) | 81 (6.4%) |
| 10:00 AM to 10:59 AM | 10 (0.9%) | 0 (0.0%) |
| 11:00 AM to 11:59 AM | 0 (0.0%) | 0 (0.0%) |
| 12:00 PM to 3:59 PM | 58 (4.9%) | 154 (12.1%) |
| 4:00 PM to 11:59 PM | 100 (8.5%) | 95 (7.5%) |
| Total | 1,175 (100.0%) | 1,270 (100.0%) |
Housing Occupancy in Dumfries
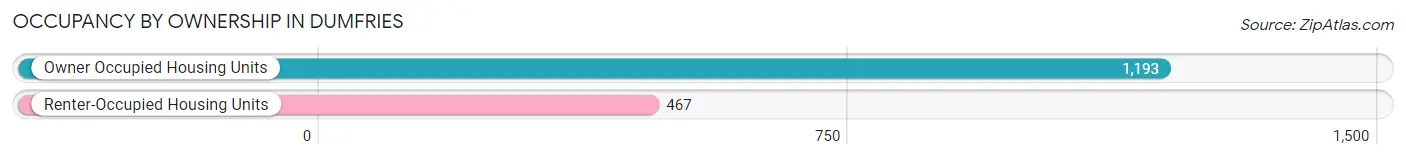
Occupancy by Ownership in Dumfries
Of the total 1,660 dwellings in Dumfries, owner-occupied units account for 1,193 (71.9%), while renter-occupied units make up 467 (28.1%).
| Occupancy | # Housing Units | % Housing Units |
| Owner Occupied Housing Units | 1,193 | 71.9% |
| Renter-Occupied Housing Units | 467 | 28.1% |
| Total Occupied Housing Units | 1,660 | 100.0% |
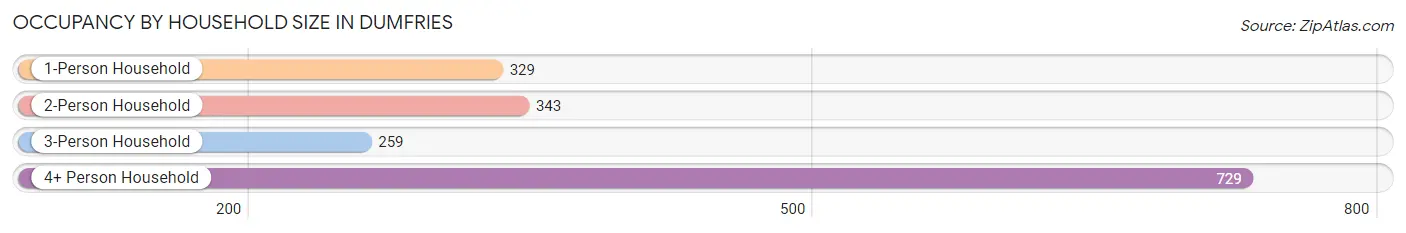
Occupancy by Household Size in Dumfries
| Household Size | # Housing Units | % Housing Units |
| 1-Person Household | 329 | 19.8% |
| 2-Person Household | 343 | 20.7% |
| 3-Person Household | 259 | 15.6% |
| 4+ Person Household | 729 | 43.9% |
| Total Housing Units | 1,660 | 100.0% |
Occupancy by Ownership by Household Size in Dumfries
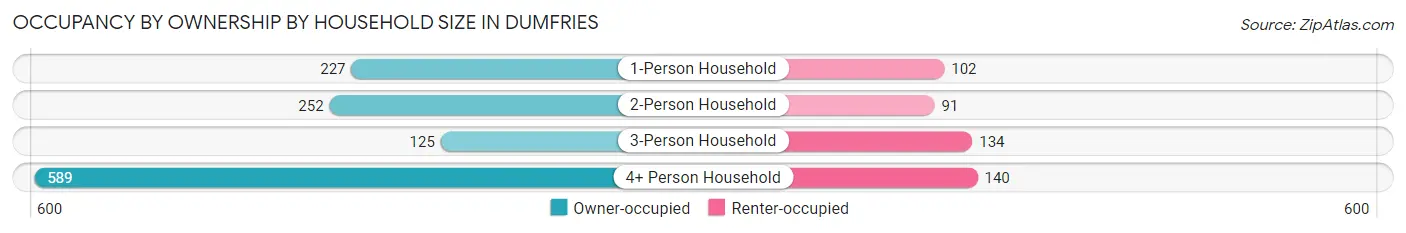
| Household Size | Owner-occupied | Renter-occupied |
| 1-Person Household | 227 (69.0%) | 102 (31.0%) |
| 2-Person Household | 252 (73.5%) | 91 (26.5%) |
| 3-Person Household | 125 (48.3%) | 134 (51.7%) |
| 4+ Person Household | 589 (80.8%) | 140 (19.2%) |
| Total Housing Units | 1,193 (71.9%) | 467 (28.1%) |
Occupancy by Educational Attainment in Dumfries
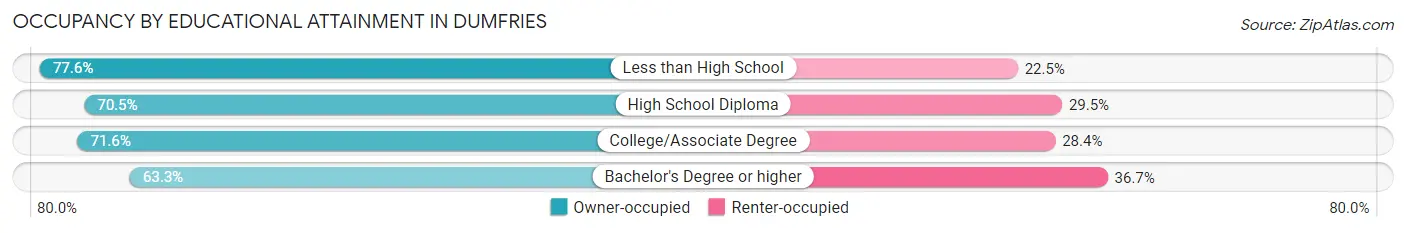
| Household Size | Owner-occupied | Renter-occupied |
| Less than High School | 342 (77.5%) | 99 (22.5%) |
| High School Diploma | 304 (70.5%) | 127 (29.5%) |
| College/Associate Degree | 416 (71.6%) | 165 (28.4%) |
| Bachelor's Degree or higher | 131 (63.3%) | 76 (36.7%) |
Occupancy by Age of Householder in Dumfries
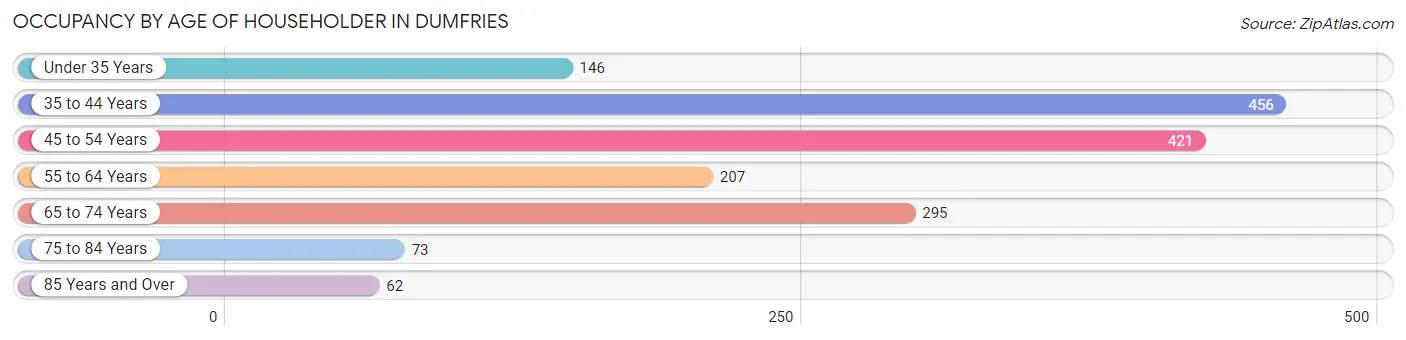
| Age Bracket | # Households | % Households |
| Under 35 Years | 146 | 8.8% |
| 35 to 44 Years | 456 | 27.5% |
| 45 to 54 Years | 421 | 25.4% |
| 55 to 64 Years | 207 | 12.5% |
| 65 to 74 Years | 295 | 17.8% |
| 75 to 84 Years | 73 | 4.4% |
| 85 Years and Over | 62 | 3.7% |
| Total | 1,660 | 100.0% |
Housing Finances in Dumfries
Median Income by Occupancy in Dumfries
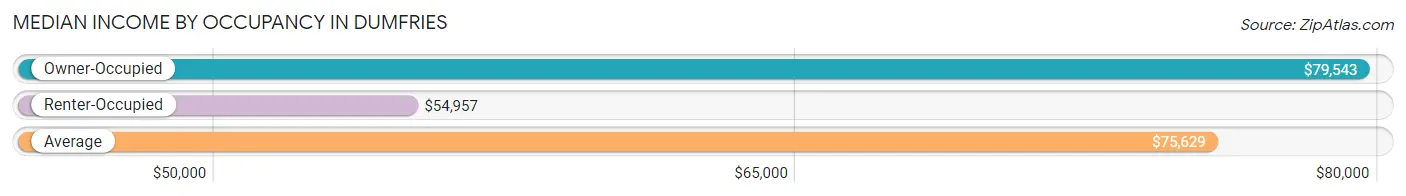
| Occupancy Type | # Households | Median Income |
| Owner-Occupied | 1,193 (71.9%) | $79,543 |
| Renter-Occupied | 467 (28.1%) | $54,957 |
| Average | 1,660 (100.0%) | $75,629 |
Occupancy by Householder Income Bracket in Dumfries
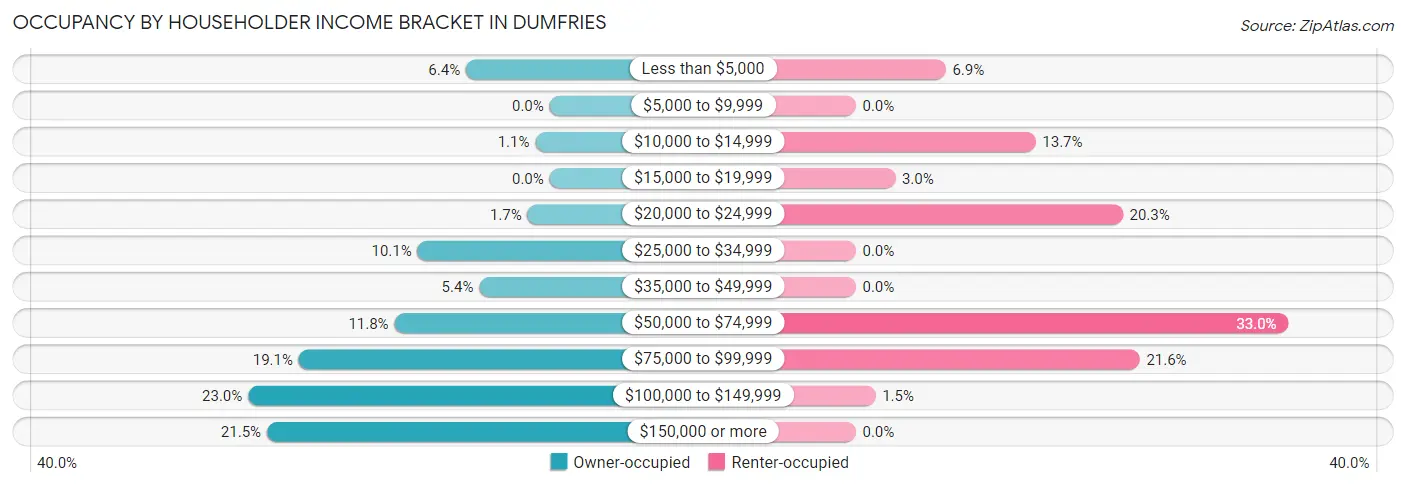
| Income Bracket | Owner-occupied | Renter-occupied |
| Less than $5,000 | 76 (6.4%) | 32 (6.9%) |
| $5,000 to $9,999 | 0 (0.0%) | 0 (0.0%) |
| $10,000 to $14,999 | 13 (1.1%) | 64 (13.7%) |
| $15,000 to $19,999 | 0 (0.0%) | 14 (3.0%) |
| $20,000 to $24,999 | 20 (1.7%) | 95 (20.3%) |
| $25,000 to $34,999 | 120 (10.1%) | 0 (0.0%) |
| $35,000 to $49,999 | 64 (5.4%) | 0 (0.0%) |
| $50,000 to $74,999 | 141 (11.8%) | 154 (33.0%) |
| $75,000 to $99,999 | 228 (19.1%) | 101 (21.6%) |
| $100,000 to $149,999 | 274 (23.0%) | 7 (1.5%) |
| $150,000 or more | 257 (21.5%) | 0 (0.0%) |
| Total | 1,193 (100.0%) | 467 (100.0%) |
Monthly Housing Cost Tiers in Dumfries
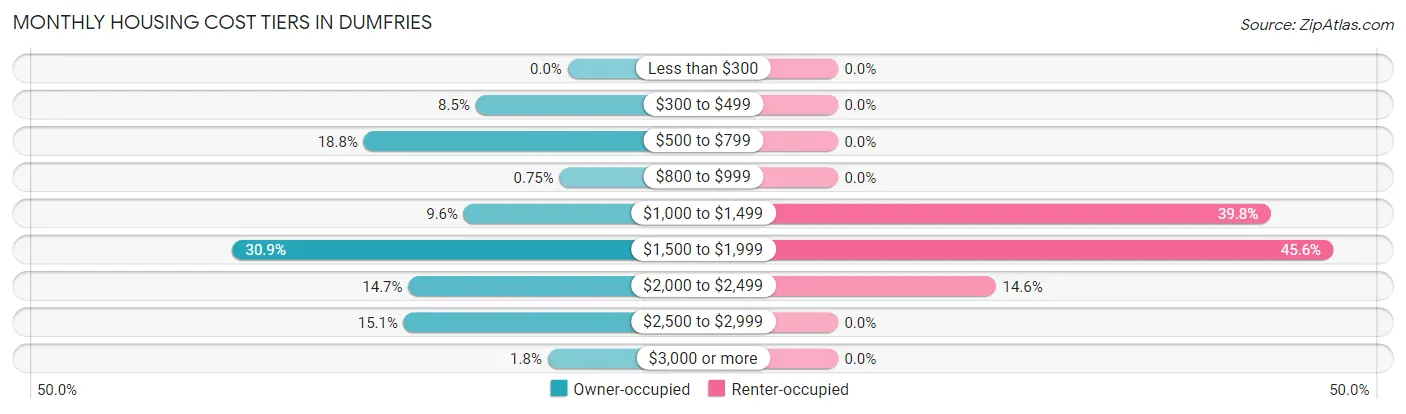
| Monthly Cost | Owner-occupied | Renter-occupied |
| Less than $300 | 0 (0.0%) | 0 (0.0%) |
| $300 to $499 | 101 (8.5%) | 0 (0.0%) |
| $500 to $799 | 224 (18.8%) | 0 (0.0%) |
| $800 to $999 | 9 (0.7%) | 0 (0.0%) |
| $1,000 to $1,499 | 114 (9.6%) | 186 (39.8%) |
| $1,500 to $1,999 | 368 (30.8%) | 213 (45.6%) |
| $2,000 to $2,499 | 175 (14.7%) | 68 (14.6%) |
| $2,500 to $2,999 | 180 (15.1%) | 0 (0.0%) |
| $3,000 or more | 22 (1.8%) | 0 (0.0%) |
| Total | 1,193 (100.0%) | 467 (100.0%) |
Physical Housing Characteristics in Dumfries
Housing Structures in Dumfries
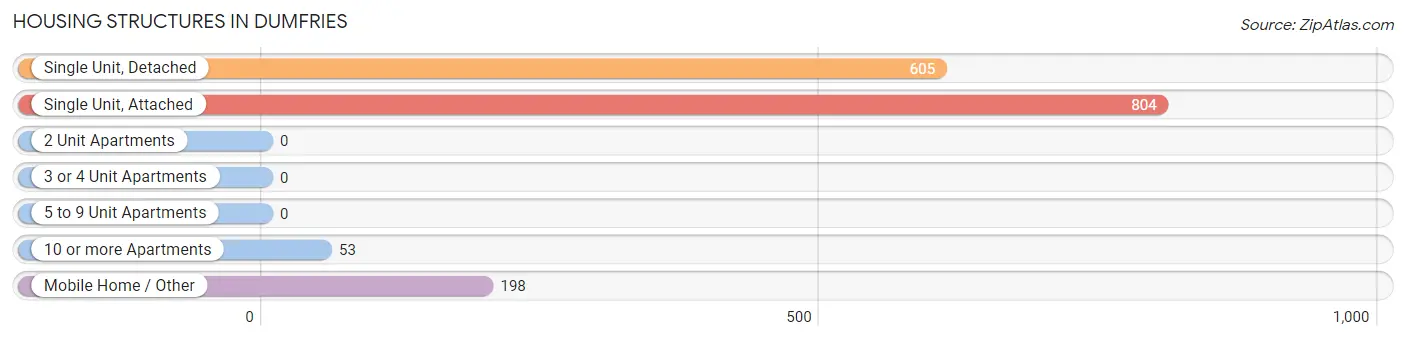
| Structure Type | # Housing Units | % Housing Units |
| Single Unit, Detached | 605 | 36.4% |
| Single Unit, Attached | 804 | 48.4% |
| 2 Unit Apartments | 0 | 0.0% |
| 3 or 4 Unit Apartments | 0 | 0.0% |
| 5 to 9 Unit Apartments | 0 | 0.0% |
| 10 or more Apartments | 53 | 3.2% |
| Mobile Home / Other | 198 | 11.9% |
| Total | 1,660 | 100.0% |
Housing Structures by Occupancy in Dumfries
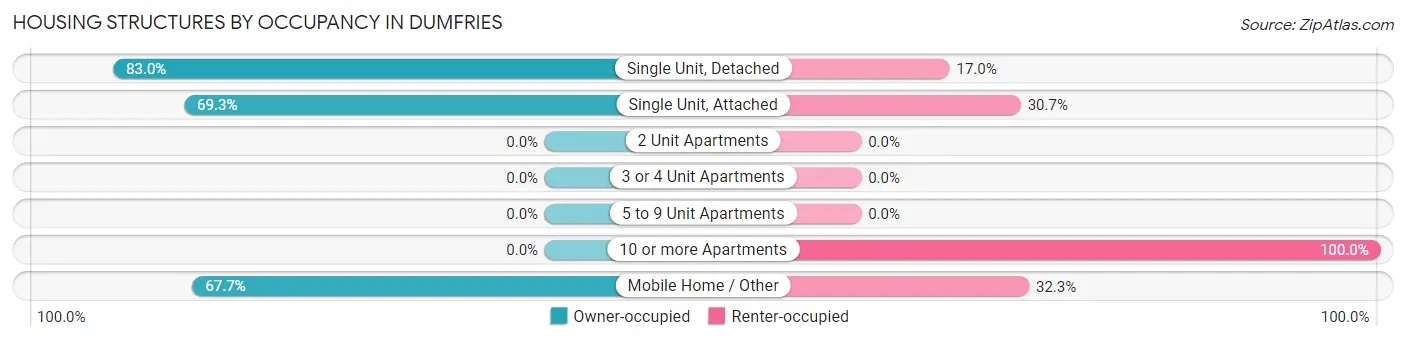
| Structure Type | Owner-occupied | Renter-occupied |
| Single Unit, Detached | 502 (83.0%) | 103 (17.0%) |
| Single Unit, Attached | 557 (69.3%) | 247 (30.7%) |
| 2 Unit Apartments | 0 (0.0%) | 0 (0.0%) |
| 3 or 4 Unit Apartments | 0 (0.0%) | 0 (0.0%) |
| 5 to 9 Unit Apartments | 0 (0.0%) | 0 (0.0%) |
| 10 or more Apartments | 0 (0.0%) | 53 (100.0%) |
| Mobile Home / Other | 134 (67.7%) | 64 (32.3%) |
| Total | 1,193 (71.9%) | 467 (28.1%) |
Housing Structures by Number of Rooms in Dumfries
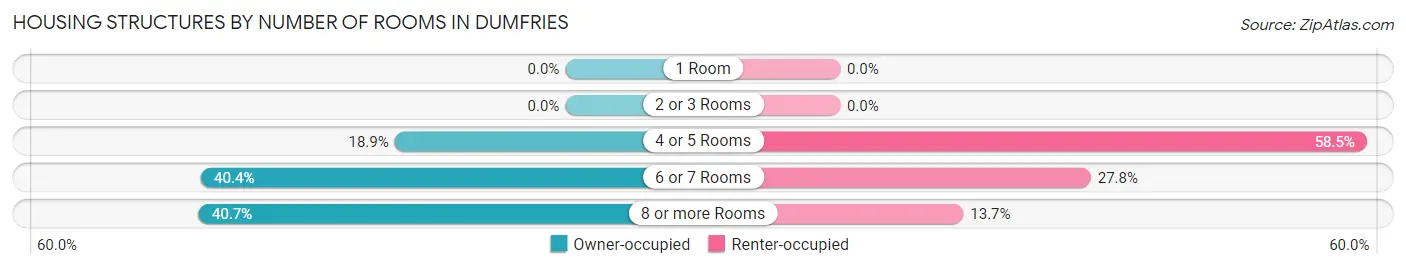
| Number of Rooms | Owner-occupied | Renter-occupied |
| 1 Room | 0 (0.0%) | 0 (0.0%) |
| 2 or 3 Rooms | 0 (0.0%) | 0 (0.0%) |
| 4 or 5 Rooms | 226 (18.9%) | 273 (58.5%) |
| 6 or 7 Rooms | 482 (40.4%) | 130 (27.8%) |
| 8 or more Rooms | 485 (40.6%) | 64 (13.7%) |
| Total | 1,193 (100.0%) | 467 (100.0%) |
Housing Structure by Heating Type in Dumfries
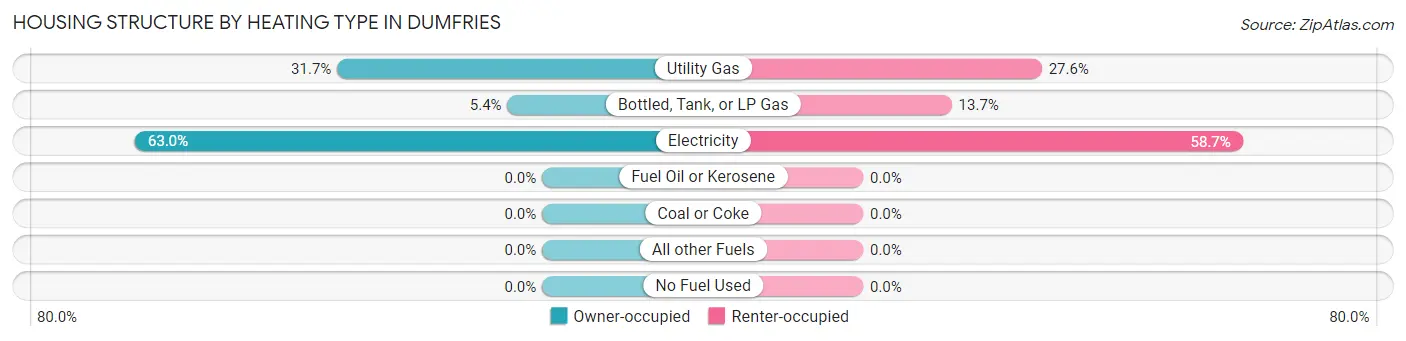
| Heating Type | Owner-occupied | Renter-occupied |
| Utility Gas | 378 (31.7%) | 129 (27.6%) |
| Bottled, Tank, or LP Gas | 64 (5.4%) | 64 (13.7%) |
| Electricity | 751 (62.9%) | 274 (58.7%) |
| Fuel Oil or Kerosene | 0 (0.0%) | 0 (0.0%) |
| Coal or Coke | 0 (0.0%) | 0 (0.0%) |
| All other Fuels | 0 (0.0%) | 0 (0.0%) |
| No Fuel Used | 0 (0.0%) | 0 (0.0%) |
| Total | 1,193 (100.0%) | 467 (100.0%) |
Household Vehicle Usage in Dumfries
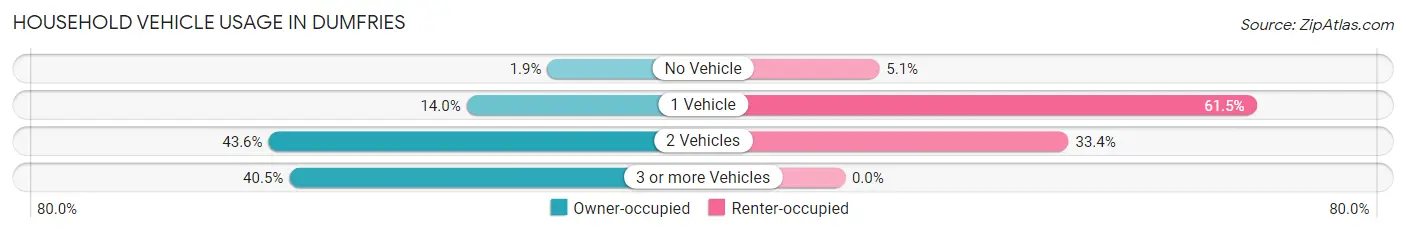
| Vehicles per Household | Owner-occupied | Renter-occupied |
| No Vehicle | 23 (1.9%) | 24 (5.1%) |
| 1 Vehicle | 167 (14.0%) | 287 (61.5%) |
| 2 Vehicles | 520 (43.6%) | 156 (33.4%) |
| 3 or more Vehicles | 483 (40.5%) | 0 (0.0%) |
| Total | 1,193 (100.0%) | 467 (100.0%) |
Real Estate & Mortgages in Dumfries
Real Estate and Mortgage Overview in Dumfries
| Characteristic | Without Mortgage | With Mortgage |
| Housing Units | 235 | 958 |
| Median Property Value | - | - |
| Median Household Income | $75,521 | $215 |
| Monthly Housing Costs | $618 | $22 |
| Real Estate Taxes | $3,049 | $167 |
Property Value by Mortgage Status in Dumfries
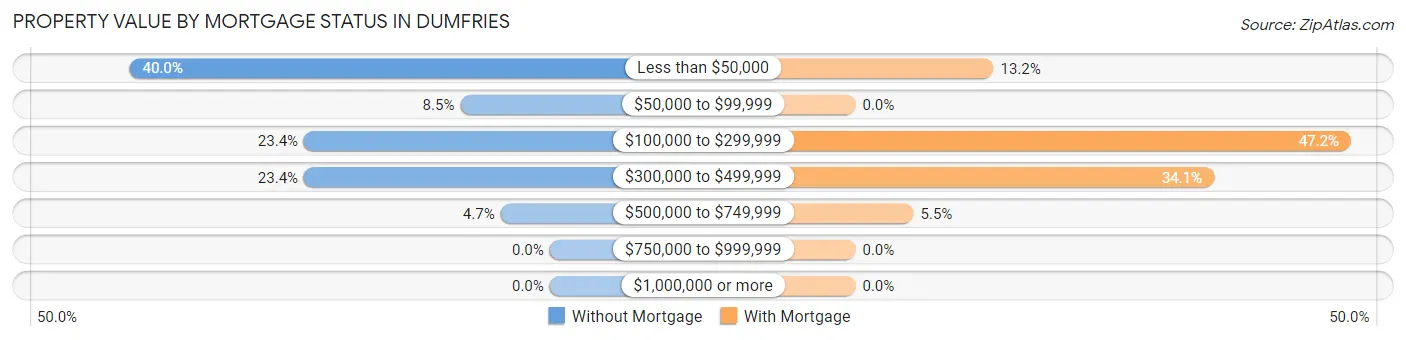
| Property Value | Without Mortgage | With Mortgage |
| Less than $50,000 | 94 (40.0%) | 126 (13.2%) |
| $50,000 to $99,999 | 20 (8.5%) | 0 (0.0%) |
| $100,000 to $299,999 | 55 (23.4%) | 452 (47.2%) |
| $300,000 to $499,999 | 55 (23.4%) | 327 (34.1%) |
| $500,000 to $749,999 | 11 (4.7%) | 53 (5.5%) |
| $750,000 to $999,999 | 0 (0.0%) | 0 (0.0%) |
| $1,000,000 or more | 0 (0.0%) | 0 (0.0%) |
| Total | 235 (100.0%) | 958 (100.0%) |
Household Income by Mortgage Status in Dumfries
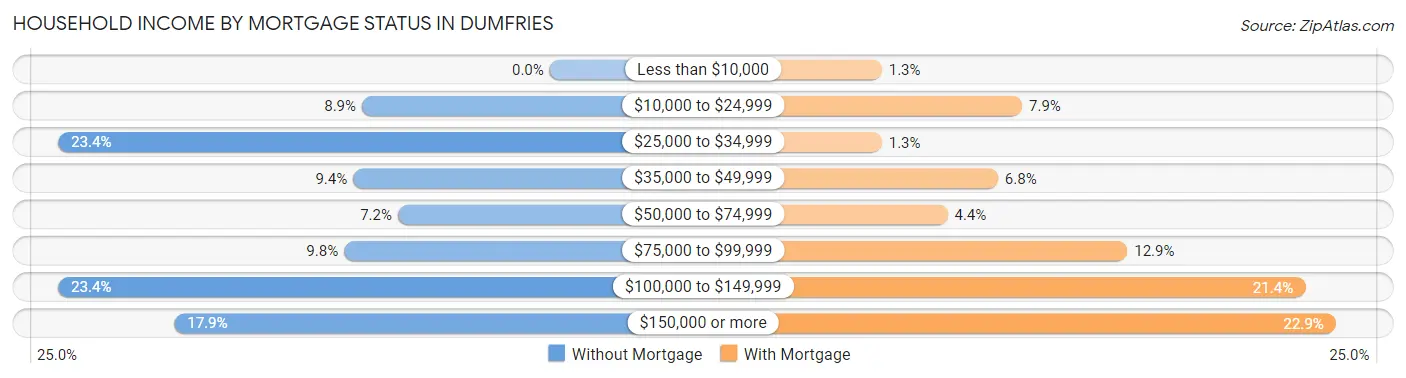
| Household Income | Without Mortgage | With Mortgage |
| Less than $10,000 | 0 (0.0%) | 12 (1.3%) |
| $10,000 to $24,999 | 21 (8.9%) | 76 (7.9%) |
| $25,000 to $34,999 | 55 (23.4%) | 12 (1.3%) |
| $35,000 to $49,999 | 22 (9.4%) | 65 (6.8%) |
| $50,000 to $74,999 | 17 (7.2%) | 42 (4.4%) |
| $75,000 to $99,999 | 23 (9.8%) | 124 (12.9%) |
| $100,000 to $149,999 | 55 (23.4%) | 205 (21.4%) |
| $150,000 or more | 42 (17.9%) | 219 (22.9%) |
| Total | 235 (100.0%) | 958 (100.0%) |
Property Value to Household Income Ratio in Dumfries
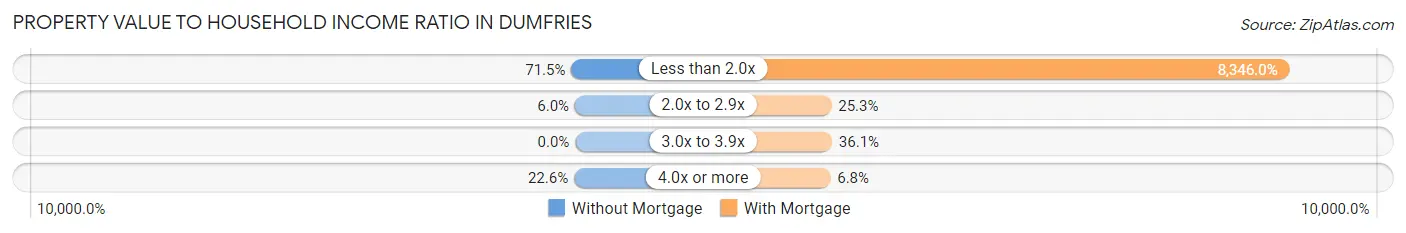
| Value-to-Income Ratio | Without Mortgage | With Mortgage |
| Less than 2.0x | 168 (71.5%) | 79,955 (8,346.0%) |
| 2.0x to 2.9x | 14 (6.0%) | 242 (25.3%) |
| 3.0x to 3.9x | 0 (0.0%) | 346 (36.1%) |
| 4.0x or more | 53 (22.6%) | 65 (6.8%) |
| Total | 235 (100.0%) | 958 (100.0%) |
Real Estate Taxes by Mortgage Status in Dumfries
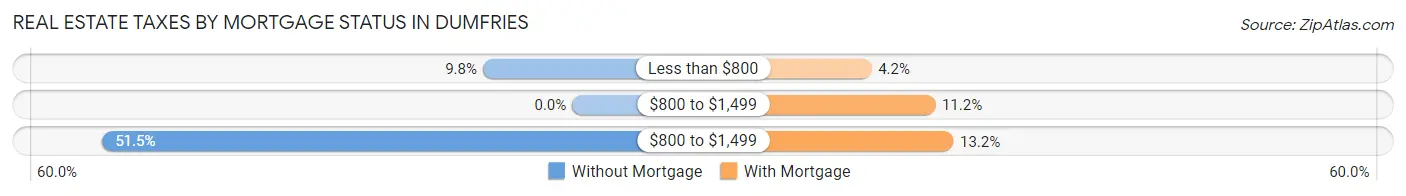
| Property Taxes | Without Mortgage | With Mortgage |
| Less than $800 | 23 (9.8%) | 40 (4.2%) |
| $800 to $1,499 | 0 (0.0%) | 107 (11.2%) |
| $800 to $1,499 | 121 (51.5%) | 126 (13.2%) |
| Total | 235 (100.0%) | 958 (100.0%) |
Health & Disability in Dumfries
Health Insurance Coverage by Age in Dumfries
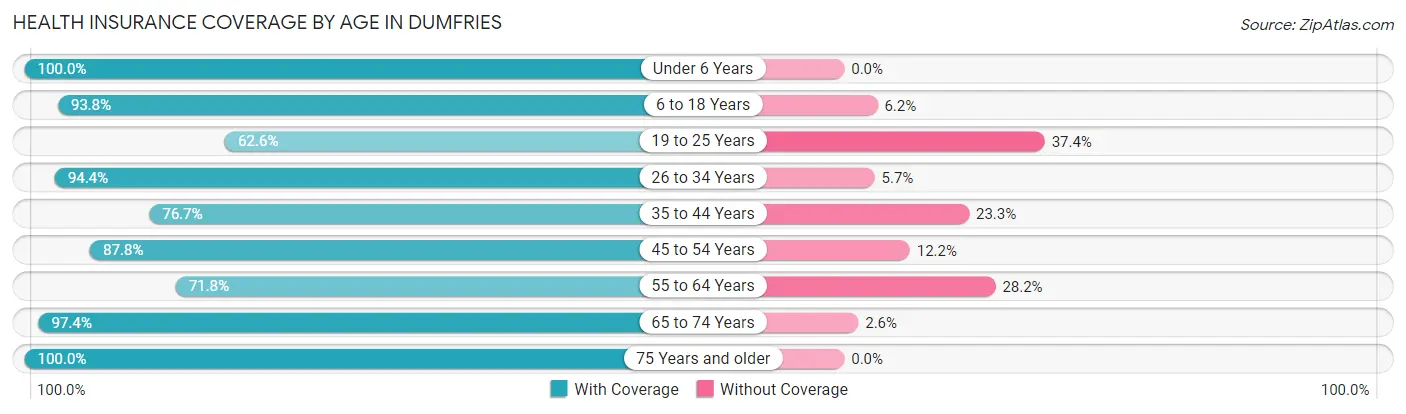
| Age Bracket | With Coverage | Without Coverage |
| Under 6 Years | 362 (100.0%) | 0 (0.0%) |
| 6 to 18 Years | 1,547 (93.8%) | 102 (6.2%) |
| 19 to 25 Years | 295 (62.6%) | 176 (37.4%) |
| 26 to 34 Years | 568 (94.4%) | 34 (5.7%) |
| 35 to 44 Years | 574 (76.7%) | 174 (23.3%) |
| 45 to 54 Years | 683 (87.8%) | 95 (12.2%) |
| 55 to 64 Years | 326 (71.8%) | 128 (28.2%) |
| 65 to 74 Years | 448 (97.4%) | 12 (2.6%) |
| 75 Years and older | 157 (100.0%) | 0 (0.0%) |
| Total | 4,960 (87.3%) | 721 (12.7%) |
Health Insurance Coverage by Citizenship Status in Dumfries

| Citizenship Status | With Coverage | Without Coverage |
| Native Born | 362 (100.0%) | 0 (0.0%) |
| Foreign Born, Citizen | 1,547 (93.8%) | 102 (6.2%) |
| Foreign Born, not a Citizen | 295 (62.6%) | 176 (37.4%) |
Health Insurance Coverage by Household Income in Dumfries
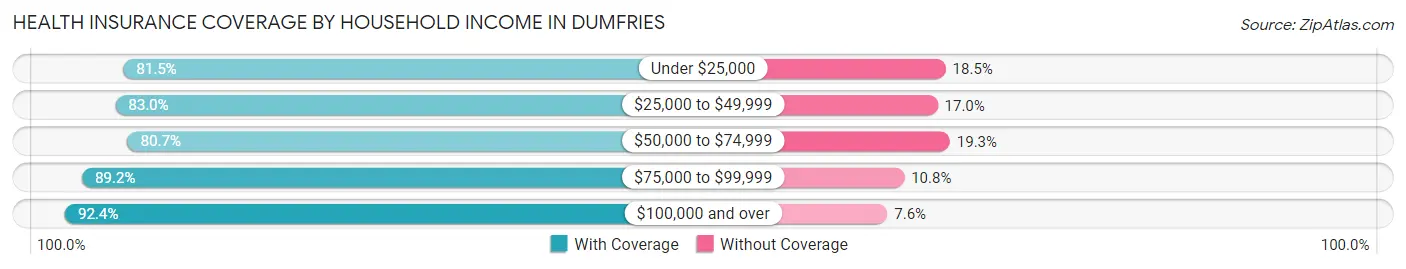
| Household Income | With Coverage | Without Coverage |
| Under $25,000 | 673 (81.5%) | 153 (18.5%) |
| $25,000 to $49,999 | 439 (83.0%) | 90 (17.0%) |
| $50,000 to $74,999 | 773 (80.7%) | 185 (19.3%) |
| $75,000 to $99,999 | 1,095 (89.2%) | 132 (10.8%) |
| $100,000 and over | 1,959 (92.4%) | 161 (7.6%) |
Public vs Private Health Insurance Coverage by Age in Dumfries
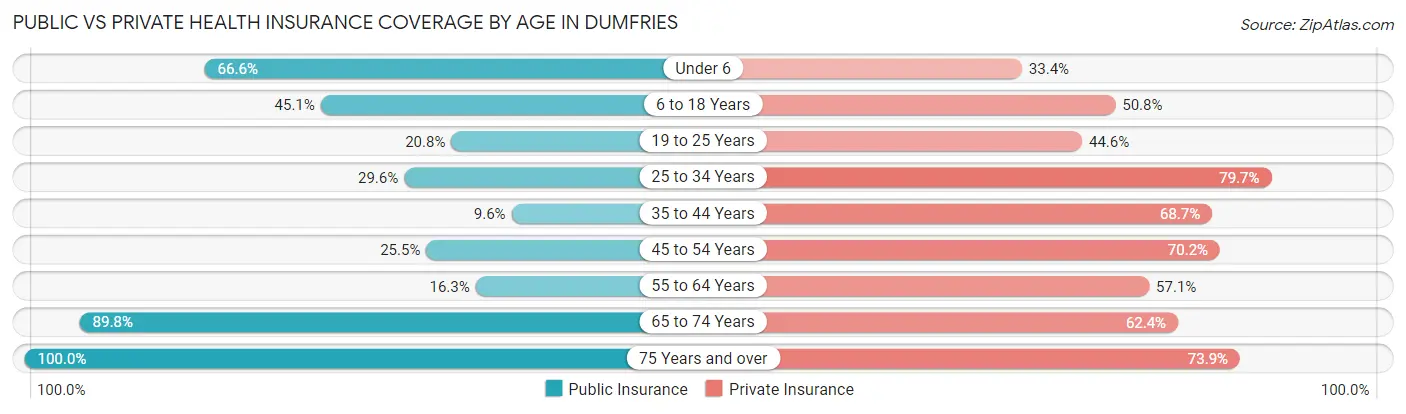
| Age Bracket | Public Insurance | Private Insurance |
| Under 6 | 241 (66.6%) | 121 (33.4%) |
| 6 to 18 Years | 743 (45.1%) | 837 (50.8%) |
| 19 to 25 Years | 98 (20.8%) | 210 (44.6%) |
| 25 to 34 Years | 178 (29.6%) | 480 (79.7%) |
| 35 to 44 Years | 72 (9.6%) | 514 (68.7%) |
| 45 to 54 Years | 198 (25.5%) | 546 (70.2%) |
| 55 to 64 Years | 74 (16.3%) | 259 (57.1%) |
| 65 to 74 Years | 413 (89.8%) | 287 (62.4%) |
| 75 Years and over | 157 (100.0%) | 116 (73.9%) |
| Total | 2,174 (38.3%) | 3,370 (59.3%) |
Disability Status by Sex by Age in Dumfries
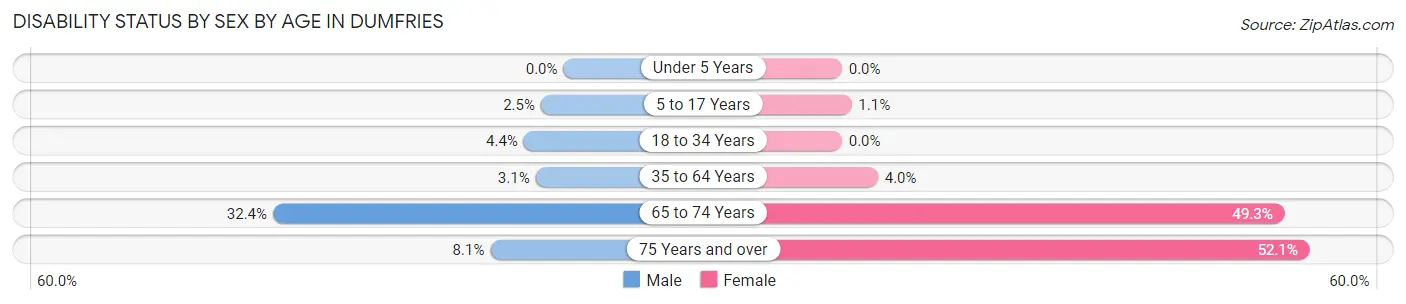
| Age Bracket | Male | Female |
| Under 5 Years | 0 (0.0%) | 0 (0.0%) |
| 5 to 17 Years | 21 (2.5%) | 8 (1.1%) |
| 18 to 34 Years | 28 (4.4%) | 0 (0.0%) |
| 35 to 64 Years | 22 (3.1%) | 51 (4.0%) |
| 65 to 74 Years | 55 (32.4%) | 143 (49.3%) |
| 75 Years and over | 7 (8.1%) | 37 (52.1%) |
Disability Class by Sex by Age in Dumfries
Disability Class: Hearing Difficulty
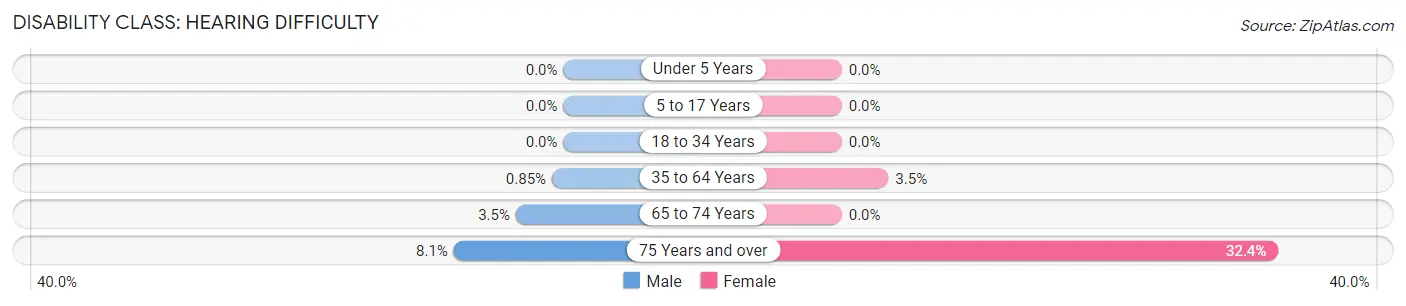
| Age Bracket | Male | Female |
| Under 5 Years | 0 (0.0%) | 0 (0.0%) |
| 5 to 17 Years | 0 (0.0%) | 0 (0.0%) |
| 18 to 34 Years | 0 (0.0%) | 0 (0.0%) |
| 35 to 64 Years | 6 (0.9%) | 44 (3.5%) |
| 65 to 74 Years | 6 (3.5%) | 0 (0.0%) |
| 75 Years and over | 7 (8.1%) | 23 (32.4%) |
Disability Class: Vision Difficulty
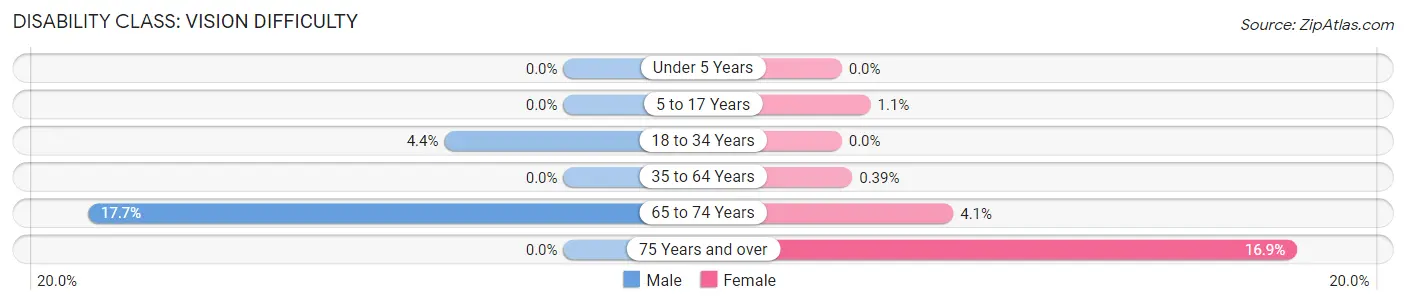
| Age Bracket | Male | Female |
| Under 5 Years | 0 (0.0%) | 0 (0.0%) |
| 5 to 17 Years | 0 (0.0%) | 8 (1.1%) |
| 18 to 34 Years | 28 (4.4%) | 0 (0.0%) |
| 35 to 64 Years | 0 (0.0%) | 5 (0.4%) |
| 65 to 74 Years | 30 (17.6%) | 12 (4.1%) |
| 75 Years and over | 0 (0.0%) | 12 (16.9%) |
Disability Class: Cognitive Difficulty
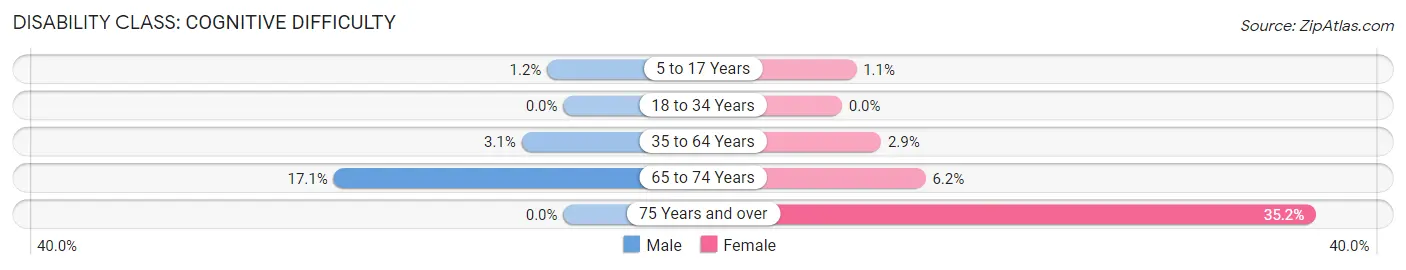
| Age Bracket | Male | Female |
| 5 to 17 Years | 10 (1.2%) | 8 (1.1%) |
| 18 to 34 Years | 0 (0.0%) | 0 (0.0%) |
| 35 to 64 Years | 22 (3.1%) | 37 (2.9%) |
| 65 to 74 Years | 29 (17.1%) | 18 (6.2%) |
| 75 Years and over | 0 (0.0%) | 25 (35.2%) |
Disability Class: Ambulatory Difficulty
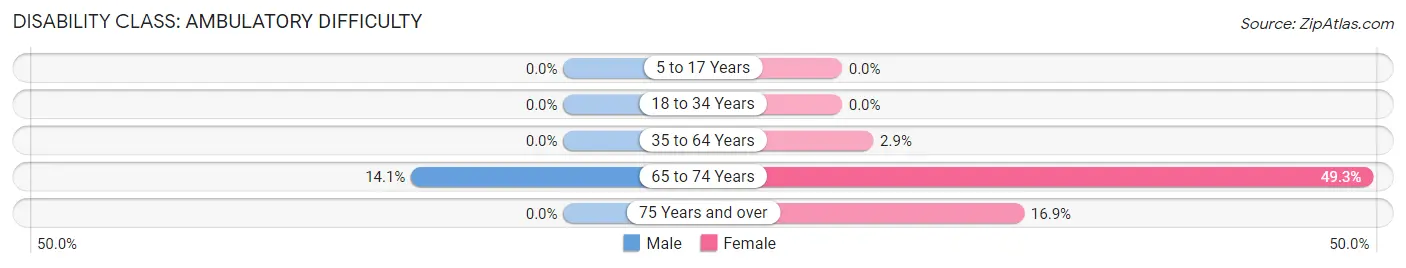
| Age Bracket | Male | Female |
| 5 to 17 Years | 0 (0.0%) | 0 (0.0%) |
| 18 to 34 Years | 0 (0.0%) | 0 (0.0%) |
| 35 to 64 Years | 0 (0.0%) | 37 (2.9%) |
| 65 to 74 Years | 24 (14.1%) | 143 (49.3%) |
| 75 Years and over | 0 (0.0%) | 12 (16.9%) |
Disability Class: Self-Care Difficulty
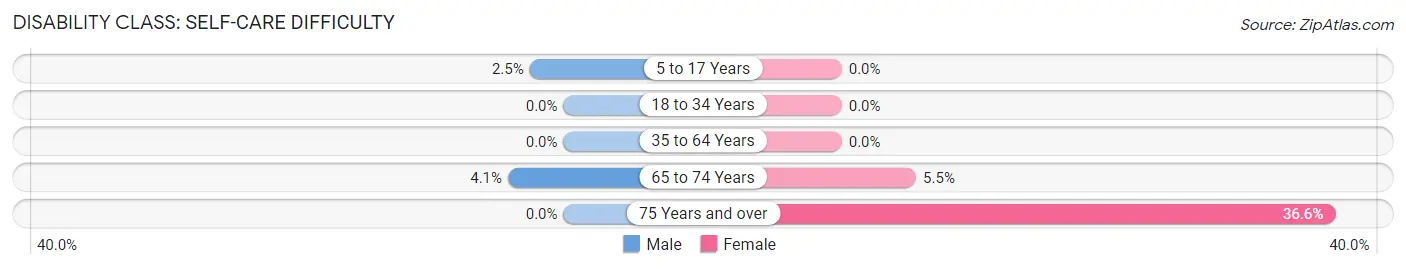
| Age Bracket | Male | Female |
| 5 to 17 Years | 21 (2.5%) | 0 (0.0%) |
| 18 to 34 Years | 0 (0.0%) | 0 (0.0%) |
| 35 to 64 Years | 0 (0.0%) | 0 (0.0%) |
| 65 to 74 Years | 7 (4.1%) | 16 (5.5%) |
| 75 Years and over | 0 (0.0%) | 26 (36.6%) |
Technology Access in Dumfries
Computing Device Access in Dumfries
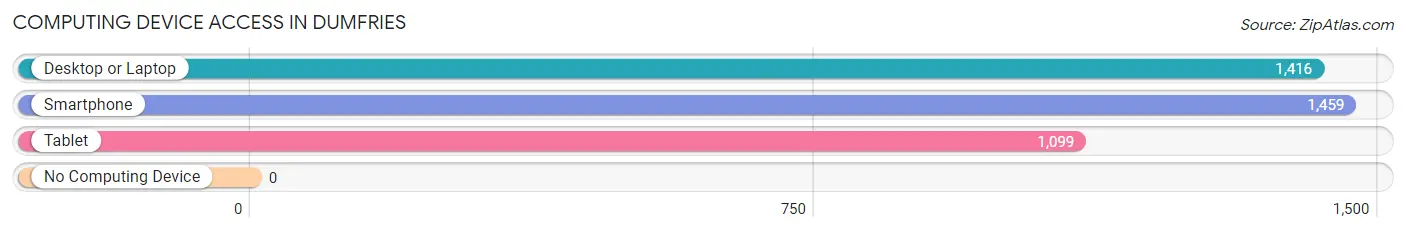
| Device Type | # Households | % Households |
| Desktop or Laptop | 1,416 | 85.3% |
| Smartphone | 1,459 | 87.9% |
| Tablet | 1,099 | 66.2% |
| No Computing Device | 0 | 0.0% |
| Total | 1,660 | 100.0% |
Internet Access in Dumfries
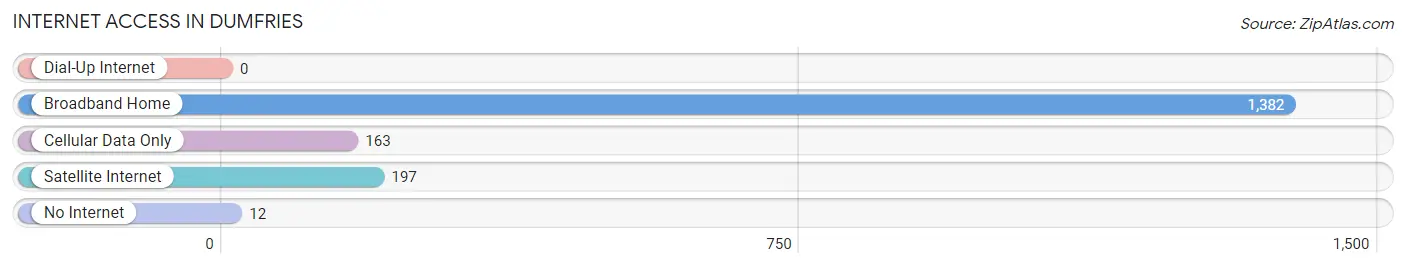
| Internet Type | # Households | % Households |
| Dial-Up Internet | 0 | 0.0% |
| Broadband Home | 1,382 | 83.3% |
| Cellular Data Only | 163 | 9.8% |
| Satellite Internet | 197 | 11.9% |
| No Internet | 12 | 0.7% |
| Total | 1,660 | 100.0% |
Dumfries Summary
Dumfries, Virginia is a town located in Prince William County, Virginia, United States. The town is situated on the banks of the Potomac River, approximately 25 miles south of Washington, D.C. Dumfries is the oldest continuously inhabited town in the Commonwealth of Virginia, having been founded in 1749. The town has a population of 4,961 as of the 2010 census.
History
Dumfries was founded in 1749 by John Graham, a Scottish immigrant who had been granted a land patent by King George II. The town was named after the town of Dumfries in Scotland. The town was originally a port town, and was a major trading center for tobacco and other goods. The town was also a major stop on the Underground Railroad, with many slaves escaping to freedom in the North.
During the American Civil War, the town was occupied by Union forces in 1862. The town was the site of several battles, including the Battle of Dumfries in 1862 and the Battle of Kettle Run in 1863.
Geography
Dumfries is located in Prince William County, Virginia, at the confluence of the Potomac River and Quantico Creek. The town is situated on the banks of the Potomac River, approximately 25 miles south of Washington, D.C. The town has a total area of 2.2 square miles, all of which is land.
Economy
Dumfries is a small town with a limited economy. The town is home to several small businesses, including restaurants, retail stores, and professional services. The town is also home to several industrial and manufacturing businesses, including a paper mill and a concrete plant.
Demographics
As of the 2010 census, there were 4,961 people, 1,845 households, and 1,288 families residing in the town. The population density was 2,241.3 people per square mile. The racial makeup of the town was 63.2% White, 28.3% African American, 0.3% Native American, 2.2% Asian, 0.1% Pacific Islander, 3.2% from other races, and 2.9% from two or more races. Hispanic or Latino of any race were 8.2% of the population.
The median income for a household in the town was $60,938, and the median income for a family was $71,912. The per capita income for the town was $27,945. About 5.2% of families and 7.2% of the population were below the poverty line, including 8.3% of those under age 18 and 5.2% of those age 65 or over.
Common Questions
What is Per Capita Income in Dumfries?
Per Capita income in Dumfries is $27,134.
What is the Median Family Income in Dumfries?
Median Family Income in Dumfries is $77,059.
What is the Median Household income in Dumfries?
Median Household Income in Dumfries is $75,629.
What is Income or Wage Gap in Dumfries?
Income or Wage Gap in Dumfries is 28.6%.
Women in Dumfries earn 71.4 cents for every dollar earned by a man.
What is Inequality or Gini Index in Dumfries?
Inequality or Gini Index in Dumfries is 0.41.
What is the Total Population of Dumfries?
Total Population of Dumfries is 5,697.
What is the Total Male Population of Dumfries?
Total Male Population of Dumfries is 2,660.
What is the Total Female Population of Dumfries?
Total Female Population of Dumfries is 3,037.
What is the Ratio of Males per 100 Females in Dumfries?
There are 87.59 Males per 100 Females in Dumfries.
What is the Ratio of Females per 100 Males in Dumfries?
There are 114.17 Females per 100 Males in Dumfries.
What is the Median Population Age in Dumfries?
Median Population Age in Dumfries is 29.9 Years.
What is the Average Family Size in Dumfries
Average Family Size in Dumfries is 4.0 People.
What is the Average Household Size in Dumfries
Average Household Size in Dumfries is 3.4 People.
How Large is the Labor Force in Dumfries?
There are 2,917 People in the Labor Forcein in Dumfries.
What is the Percentage of People in the Labor Force in Dumfries?
72.1% of People are in the Labor Force in Dumfries.
What is the Unemployment Rate in Dumfries?
Unemployment Rate in Dumfries is 5.0%.