Cities with the Highest Percentage of Scotch-Irish Population in Delaware
RELATED REPORTS & OPTIONS
Scotch-Irish
Delaware
Compare Cities
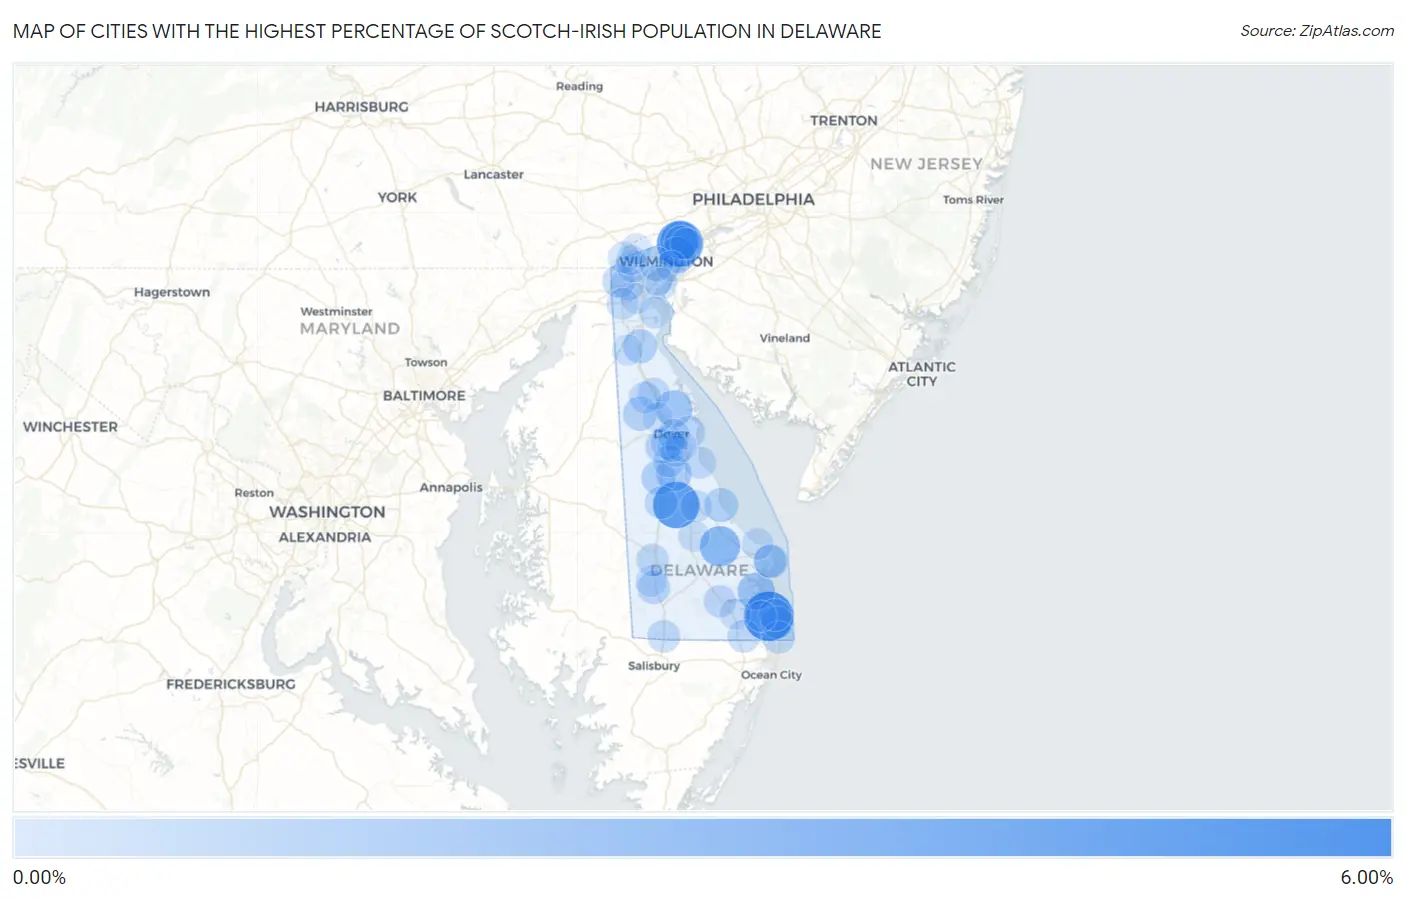
Map of Cities with the Highest Percentage of Scotch-Irish Population in Delaware
0.00%
6.00%
Cities with the Highest Percentage of Scotch-Irish Population in Delaware
| City | Scotch-Irish | vs State | vs National | |
| 1. | Ocean View | 5.08% | 0.58%(+4.49)#1 | 0.82%(+4.26)#910 |
| 2. | Houston | 4.23% | 0.58%(+3.64)#2 | 0.82%(+3.41)#1,237 |
| 3. | Ardencroft | 4.21% | 0.58%(+3.63)#3 | 0.82%(+3.39)#1,246 |
| 4. | Milton | 2.63% | 0.58%(+2.05)#4 | 0.82%(+1.81)#2,673 |
| 5. | Arden | 2.45% | 0.58%(+1.87)#5 | 0.82%(+1.64)#2,960 |
| 6. | Long Neck | 1.84% | 0.58%(+1.26)#6 | 0.82%(+1.03)#4,380 |
| 7. | Leipsic | 1.75% | 0.58%(+1.17)#7 | 0.82%(+0.937)#4,671 |
| 8. | Bellefonte | 1.57% | 0.58%(+0.991)#8 | 0.82%(+0.755)#5,349 |
| 9. | Riverview | 1.37% | 0.58%(+0.784)#9 | 0.82%(+0.548)#6,268 |
| 10. | Felton | 1.14% | 0.58%(+0.563)#10 | 0.82%(+0.327)#7,517 |
| 11. | Elsmere | 1.11% | 0.58%(+0.533)#11 | 0.82%(+0.296)#7,696 |
| 12. | Henlopen Acres | 1.04% | 0.58%(+0.455)#12 | 0.82%(+0.218)#8,242 |
| 13. | Odessa | 1.03% | 0.58%(+0.447)#13 | 0.82%(+0.210)#8,304 |
| 14. | Slaughter Beach | 1.02% | 0.58%(+0.436)#14 | 0.82%(+0.200)#8,387 |
| 15. | Wyoming | 1.01% | 0.58%(+0.425)#15 | 0.82%(+0.188)#8,505 |
| 16. | Kenton | 1.00% | 0.58%(+0.419)#16 | 0.82%(+0.182)#8,564 |
| 17. | Rodney Village | 0.92% | 0.58%(+0.339)#17 | 0.82%(+0.102)#9,180 |
| 18. | Ardentown | 0.90% | 0.58%(+0.315)#18 | 0.82%(+0.079)#9,371 |
| 19. | Blades | 0.83% | 0.58%(+0.252)#19 | 0.82%(+0.015)#9,935 |
| 20. | Brookside | 0.80% | 0.58%(+0.221)#20 | 0.82%(-0.015)#10,199 |
| 21. | Little Creek | 0.74% | 0.58%(+0.154)#21 | 0.82%(-0.083)#10,828 |
| 22. | Newark | 0.72% | 0.58%(+0.140)#22 | 0.82%(-0.097)#10,977 |
| 23. | Harrington | 0.69% | 0.58%(+0.108)#23 | 0.82%(-0.128)#11,301 |
| 24. | Delmar | 0.67% | 0.58%(+0.086)#24 | 0.82%(-0.151)#11,536 |
| 25. | Rehoboth Beach | 0.66% | 0.58%(+0.082)#25 | 0.82%(-0.155)#11,588 |
| 26. | Bridgeville | 0.66% | 0.58%(+0.075)#26 | 0.82%(-0.161)#11,661 |
| 27. | Selbyville | 0.65% | 0.58%(+0.072)#27 | 0.82%(-0.164)#11,687 |
| 28. | South Bethany | 0.61% | 0.58%(+0.031)#28 | 0.82%(-0.206)#12,123 |
| 29. | Millsboro | 0.61% | 0.58%(+0.029)#29 | 0.82%(-0.207)#12,138 |
| 30. | Bowers | 0.60% | 0.58%(+0.014)#30 | 0.82%(-0.223)#12,317 |
| 31. | Fenwick Island | 0.57% | 0.58%(-0.010)#31 | 0.82%(-0.246)#12,544 |
| 32. | Bethany Beach | 0.56% | 0.58%(-0.017)#32 | 0.82%(-0.254)#12,630 |
| 33. | Smyrna | 0.56% | 0.58%(-0.022)#33 | 0.82%(-0.258)#12,691 |
| 34. | Dover | 0.54% | 0.58%(-0.041)#34 | 0.82%(-0.278)#12,910 |
| 35. | Pike Creek Valley | 0.53% | 0.58%(-0.049)#35 | 0.82%(-0.285)#13,003 |
| 36. | Clayton | 0.53% | 0.58%(-0.053)#36 | 0.82%(-0.290)#13,073 |
| 37. | Woodside East | 0.50% | 0.58%(-0.082)#37 | 0.82%(-0.318)#13,391 |
| 38. | Milford | 0.46% | 0.58%(-0.120)#38 | 0.82%(-0.357)#13,842 |
| 39. | Glasgow | 0.45% | 0.58%(-0.127)#39 | 0.82%(-0.363)#13,908 |
| 40. | New Castle | 0.45% | 0.58%(-0.129)#40 | 0.82%(-0.365)#13,927 |
| 41. | Lewes | 0.42% | 0.58%(-0.162)#41 | 0.82%(-0.399)#14,350 |
| 42. | Seaford | 0.41% | 0.58%(-0.172)#42 | 0.82%(-0.408)#14,465 |
| 43. | North Star | 0.37% | 0.58%(-0.211)#43 | 0.82%(-0.447)#14,949 |
| 44. | Delaware City | 0.36% | 0.58%(-0.219)#44 | 0.82%(-0.456)#15,051 |
| 45. | Rising Sun Lebanon | 0.34% | 0.58%(-0.237)#45 | 0.82%(-0.473)#15,264 |
| 46. | Claymont | 0.33% | 0.58%(-0.248)#46 | 0.82%(-0.484)#15,406 |
| 47. | Ellendale | 0.33% | 0.58%(-0.253)#47 | 0.82%(-0.489)#15,464 |
| 48. | Dover Base Housing | 0.31% | 0.58%(-0.275)#48 | 0.82%(-0.511)#15,722 |
| 49. | Dagsboro | 0.30% | 0.58%(-0.282)#49 | 0.82%(-0.519)#15,819 |
| 50. | Highland Acres | 0.28% | 0.58%(-0.299)#50 | 0.82%(-0.535)#16,061 |
| 51. | Hockessin | 0.27% | 0.58%(-0.315)#51 | 0.82%(-0.551)#16,264 |
| 52. | Millville | 0.24% | 0.58%(-0.338)#52 | 0.82%(-0.574)#16,574 |
| 53. | Bear | 0.24% | 0.58%(-0.343)#53 | 0.82%(-0.579)#16,645 |
| 54. | Middletown | 0.23% | 0.58%(-0.348)#54 | 0.82%(-0.585)#16,723 |
| 55. | Wilmington | 0.23% | 0.58%(-0.351)#55 | 0.82%(-0.587)#16,753 |
| 56. | Wilmington Manor | 0.22% | 0.58%(-0.363)#56 | 0.82%(-0.600)#16,908 |
| 57. | Cheswold | 0.18% | 0.58%(-0.398)#57 | 0.82%(-0.635)#17,360 |
| 58. | Pike Creek | 0.14% | 0.58%(-0.438)#58 | 0.82%(-0.674)#17,796 |
1
Common Questions
What are the Top 10 Cities with the Highest Percentage of Scotch-Irish Population in Delaware?
Top 10 Cities with the Highest Percentage of Scotch-Irish Population in Delaware are:
#1
5.08%
#2
4.23%
#3
4.21%
#4
2.63%
#5
2.45%
#6
1.84%
#7
1.75%
#8
1.57%
#9
1.37%
#10
1.14%
What city has the Highest Percentage of Scotch-Irish Population in Delaware?
Ocean View has the Highest Percentage of Scotch-Irish Population in Delaware with 5.08%.
What is the Percentage of Scotch-Irish Population in the State of Delaware?
Percentage of Scotch-Irish Population in Delaware is 0.58%.
What is the Percentage of Scotch-Irish Population in the United States?
Percentage of Scotch-Irish Population in the United States is 0.82%.