Cities with the Highest Percentage of Scotch-Irish Population in Kentucky
RELATED REPORTS & OPTIONS
Scotch-Irish
Kentucky
Compare Cities
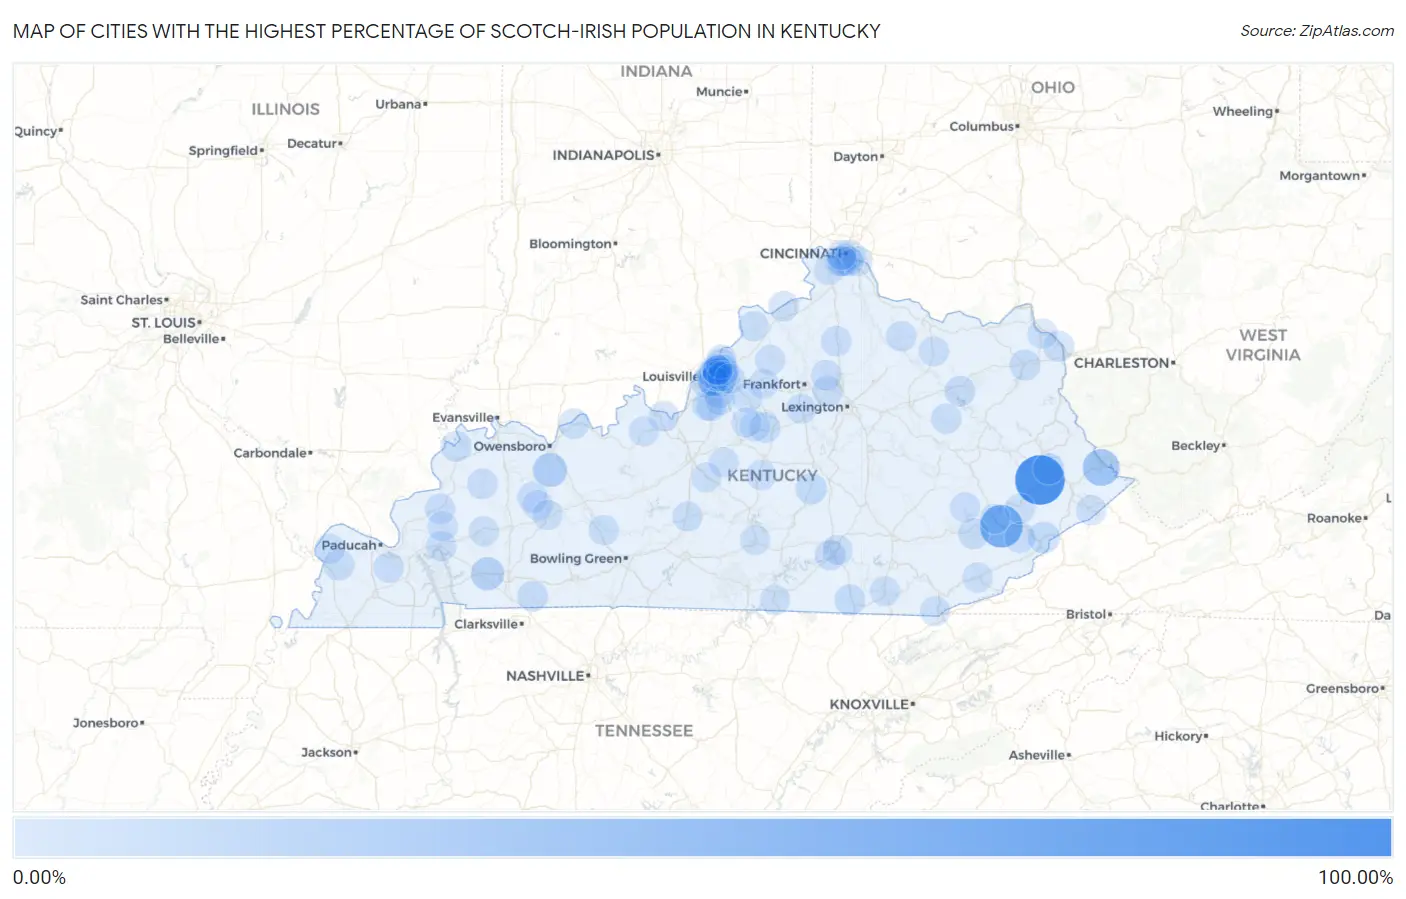
Map of Cities with the Highest Percentage of Scotch-Irish Population in Kentucky
0.00%
100.00%
Cities with the Highest Percentage of Scotch-Irish Population in Kentucky
| City | Scotch-Irish | vs State | vs National | |
| 1. | Maytown | 100.00% | 1.27%(+98.7)#1 | 0.82%(+99.2)#2 |
| 2. | Jeff | 64.00% | 1.27%(+62.7)#2 | 0.82%(+63.2)#9 |
| 3. | Belfry | 34.33% | 1.27%(+33.1)#3 | 0.82%(+33.5)#30 |
| 4. | Utica | 20.90% | 1.27%(+19.6)#4 | 0.82%(+20.1)#72 |
| 5. | Gracey | 16.88% | 1.27%(+15.6)#5 | 0.82%(+16.1)#119 |
| 6. | Mayking | 9.11% | 1.27%(+7.83)#6 | 0.82%(+8.29)#334 |
| 7. | Allen | 8.45% | 1.27%(+7.18)#7 | 0.82%(+7.63)#372 |
| 8. | Hustonville | 7.35% | 1.27%(+6.08)#8 | 0.82%(+6.54)#479 |
| 9. | Kenton Vale | 6.99% | 1.27%(+5.72)#9 | 0.82%(+6.18)#540 |
| 10. | Brooks | 6.52% | 1.27%(+5.25)#10 | 0.82%(+5.71)#596 |
| 11. | Stearns | 6.13% | 1.27%(+4.85)#11 | 0.82%(+5.31)#668 |
| 12. | Hyden | 6.03% | 1.27%(+4.76)#12 | 0.82%(+5.22)#689 |
| 13. | Wildwood | 5.88% | 1.27%(+4.61)#13 | 0.82%(+5.06)#712 |
| 14. | Pleasant Ridge | 5.73% | 1.27%(+4.46)#14 | 0.82%(+4.91)#737 |
| 15. | Blackey | 5.71% | 1.27%(+4.44)#15 | 0.82%(+4.90)#740 |
| 16. | Grayson | 5.68% | 1.27%(+4.40)#16 | 0.82%(+4.86)#749 |
| 17. | Chaplin | 5.31% | 1.27%(+4.03)#17 | 0.82%(+4.49)#832 |
| 18. | Brownsboro Village | 5.21% | 1.27%(+3.94)#18 | 0.82%(+4.40)#861 |
| 19. | Uniontown | 5.19% | 1.27%(+3.92)#19 | 0.82%(+4.37)#870 |
| 20. | Blandville | 5.08% | 1.27%(+3.81)#20 | 0.82%(+4.27)#905 |
| 21. | Ashland | 5.05% | 1.27%(+3.78)#21 | 0.82%(+4.23)#919 |
| 22. | Barbourmeade | 4.95% | 1.27%(+3.67)#22 | 0.82%(+4.13)#953 |
| 23. | Trenton | 4.90% | 1.27%(+3.62)#23 | 0.82%(+4.08)#971 |
| 24. | Lakeview Heights | 4.49% | 1.27%(+3.22)#24 | 0.82%(+3.68)#1,125 |
| 25. | Corinth | 4.33% | 1.27%(+3.06)#25 | 0.82%(+3.51)#1,181 |
| 26. | Midway | 4.12% | 1.27%(+2.85)#26 | 0.82%(+3.30)#1,291 |
| 27. | Stamping Ground | 3.85% | 1.27%(+2.58)#27 | 0.82%(+3.04)#1,425 |
| 28. | Doe Valley | 3.85% | 1.27%(+2.57)#28 | 0.82%(+3.03)#1,431 |
| 29. | Bellewood | 3.83% | 1.27%(+2.56)#29 | 0.82%(+3.01)#1,445 |
| 30. | Lincolnshire | 3.81% | 1.27%(+2.54)#30 | 0.82%(+2.99)#1,453 |
| 31. | Mockingbird Valley | 3.73% | 1.27%(+2.45)#31 | 0.82%(+2.91)#1,513 |
| 32. | Burnside | 3.70% | 1.27%(+2.43)#32 | 0.82%(+2.88)#1,542 |
| 33. | Spring Mill | 3.69% | 1.27%(+2.42)#33 | 0.82%(+2.87)#1,548 |
| 34. | Seneca Gardens | 3.68% | 1.27%(+2.41)#34 | 0.82%(+2.87)#1,555 |
| 35. | Symsonia | 3.66% | 1.27%(+2.39)#35 | 0.82%(+2.85)#1,572 |
| 36. | River Bluff | 3.43% | 1.27%(+2.15)#36 | 0.82%(+2.61)#1,750 |
| 37. | Mount Olivet | 3.40% | 1.27%(+2.13)#37 | 0.82%(+2.58)#1,769 |
| 38. | Indian Hills | 3.36% | 1.27%(+2.08)#38 | 0.82%(+2.54)#1,809 |
| 39. | Dixon | 3.35% | 1.27%(+2.08)#39 | 0.82%(+2.53)#1,816 |
| 40. | Eddyville | 3.34% | 1.27%(+2.07)#40 | 0.82%(+2.52)#1,826 |
| 41. | Fort Mitchell | 3.29% | 1.27%(+2.02)#41 | 0.82%(+2.47)#1,882 |
| 42. | Ghent | 3.19% | 1.27%(+1.92)#42 | 0.82%(+2.38)#1,963 |
| 43. | Sacramento | 3.15% | 1.27%(+1.87)#43 | 0.82%(+2.33)#2,017 |
| 44. | Plantation | 3.15% | 1.27%(+1.87)#44 | 0.82%(+2.33)#2,020 |
| 45. | Hills And Dales | 3.12% | 1.27%(+1.85)#45 | 0.82%(+2.31)#2,046 |
| 46. | Strathmoor Manor | 3.09% | 1.27%(+1.81)#46 | 0.82%(+2.27)#2,085 |
| 47. | Lewisport | 3.03% | 1.27%(+1.75)#47 | 0.82%(+2.21)#2,160 |
| 48. | Woodbury | 2.99% | 1.27%(+1.71)#48 | 0.82%(+2.17)#2,209 |
| 49. | Bedford | 2.97% | 1.27%(+1.70)#49 | 0.82%(+2.15)#2,226 |
| 50. | Buckhorn | 2.94% | 1.27%(+1.67)#50 | 0.82%(+2.12)#2,257 |
| 51. | Marion | 2.93% | 1.27%(+1.65)#51 | 0.82%(+2.11)#2,271 |
| 52. | Rolling Fields | 2.91% | 1.27%(+1.63)#52 | 0.82%(+2.09)#2,286 |
| 53. | Frenchburg | 2.91% | 1.27%(+1.63)#53 | 0.82%(+2.09)#2,290 |
| 54. | Woodlawn | 2.79% | 1.27%(+1.52)#54 | 0.82%(+1.98)#2,434 |
| 55. | Ten Broeck | 2.74% | 1.27%(+1.47)#55 | 0.82%(+1.92)#2,511 |
| 56. | Fredonia | 2.74% | 1.27%(+1.46)#56 | 0.82%(+1.92)#2,516 |
| 57. | Parkway Village | 2.73% | 1.27%(+1.46)#57 | 0.82%(+1.92)#2,522 |
| 58. | Hindman | 2.63% | 1.27%(+1.35)#58 | 0.82%(+1.81)#2,675 |
| 59. | Eminence | 2.62% | 1.27%(+1.35)#59 | 0.82%(+1.81)#2,679 |
| 60. | Loyall | 2.61% | 1.27%(+1.33)#60 | 0.82%(+1.79)#2,702 |
| 61. | Lawrenceburg | 2.59% | 1.27%(+1.31)#61 | 0.82%(+1.77)#2,728 |
| 62. | Kingsley | 2.57% | 1.27%(+1.30)#62 | 0.82%(+1.75)#2,749 |
| 63. | Albany | 2.56% | 1.27%(+1.29)#63 | 0.82%(+1.74)#2,769 |
| 64. | Middlesborough | 2.56% | 1.27%(+1.28)#64 | 0.82%(+1.74)#2,777 |
| 65. | New Haven | 2.53% | 1.27%(+1.26)#65 | 0.82%(+1.72)#2,810 |
| 66. | Shelbyville | 2.53% | 1.27%(+1.26)#66 | 0.82%(+1.71)#2,822 |
| 67. | Heritage Creek | 2.52% | 1.27%(+1.25)#67 | 0.82%(+1.71)#2,829 |
| 68. | Moseleyville | 2.50% | 1.27%(+1.23)#68 | 0.82%(+1.68)#2,886 |
| 69. | Dawson Springs | 2.47% | 1.27%(+1.19)#69 | 0.82%(+1.65)#2,932 |
| 70. | Windy Hills | 2.46% | 1.27%(+1.19)#70 | 0.82%(+1.64)#2,947 |
| 71. | Glenview | 2.44% | 1.27%(+1.17)#71 | 0.82%(+1.62)#2,981 |
| 72. | Williamsburg | 2.43% | 1.27%(+1.16)#72 | 0.82%(+1.61)#3,001 |
| 73. | Glenview Manor | 2.43% | 1.27%(+1.15)#73 | 0.82%(+1.61)#3,005 |
| 74. | Wurtland | 2.38% | 1.27%(+1.11)#74 | 0.82%(+1.57)#3,070 |
| 75. | Hodgenville | 2.37% | 1.27%(+1.10)#75 | 0.82%(+1.56)#3,082 |
| 76. | Bremen | 2.35% | 1.27%(+1.08)#76 | 0.82%(+1.53)#3,119 |
| 77. | Irvington | 2.31% | 1.27%(+1.03)#77 | 0.82%(+1.49)#3,194 |
| 78. | Hazard | 2.29% | 1.27%(+1.02)#78 | 0.82%(+1.47)#3,221 |
| 79. | Lebanon | 2.28% | 1.27%(+1.01)#79 | 0.82%(+1.46)#3,246 |
| 80. | Bloomfield | 2.27% | 1.27%(+0.997)#81 | 0.82%(+1.45)#3,269 |
| 81. | Elkhorn City | 2.27% | 1.27%(+0.997)#82 | 0.82%(+1.45)#3,270 |
| 82. | Silver Grove | 2.25% | 1.27%(+0.974)#83 | 0.82%(+1.43)#3,317 |
| 83. | Flemingsburg | 2.23% | 1.27%(+0.960)#84 | 0.82%(+1.42)#3,350 |
| 84. | Fox Chase | 2.22% | 1.27%(+0.945)#85 | 0.82%(+1.40)#3,382 |
| 85. | Richlawn | 2.22% | 1.27%(+0.943)#86 | 0.82%(+1.40)#3,388 |
| 86. | Prospect | 2.21% | 1.27%(+0.933)#87 | 0.82%(+1.39)#3,410 |
| 87. | Barlow | 2.21% | 1.27%(+0.933)#88 | 0.82%(+1.39)#3,411 |
| 88. | Wilder | 2.19% | 1.27%(+0.916)#89 | 0.82%(+1.37)#3,443 |
| 89. | Columbia | 2.18% | 1.27%(+0.909)#90 | 0.82%(+1.36)#3,457 |
| 90. | Central City | 2.16% | 1.27%(+0.887)#91 | 0.82%(+1.34)#3,510 |
| 91. | Fort Wright | 2.16% | 1.27%(+0.884)#92 | 0.82%(+1.34)#3,522 |
| 92. | Florence | 2.12% | 1.27%(+0.848)#93 | 0.82%(+1.30)#3,604 |
| 93. | Bellemeade | 2.12% | 1.27%(+0.845)#94 | 0.82%(+1.30)#3,608 |
| 94. | Ludlow | 2.10% | 1.27%(+0.825)#95 | 0.82%(+1.28)#3,666 |
| 95. | Woodland Hills | 2.09% | 1.27%(+0.820)#96 | 0.82%(+1.28)#3,678 |
| 96. | Munfordville | 2.06% | 1.27%(+0.789)#97 | 0.82%(+1.24)#3,754 |
| 97. | Ferguson | 2.06% | 1.27%(+0.782)#98 | 0.82%(+1.24)#3,771 |
| 98. | Elk Creek | 2.05% | 1.27%(+0.775)#99 | 0.82%(+1.23)#3,791 |
| 99. | Fairfield | 2.04% | 1.27%(+0.768)#100 | 0.82%(+1.22)#3,810 |
| 100. | Glenview Hills | 2.03% | 1.27%(+0.756)#101 | 0.82%(+1.21)#3,844 |
Common Questions
What are the Top 10 Cities with the Highest Percentage of Scotch-Irish Population in Kentucky?
Top 10 Cities with the Highest Percentage of Scotch-Irish Population in Kentucky are:
#1
100.00%
#2
64.00%
#3
34.33%
#4
20.90%
#5
16.88%
#6
9.11%
#7
8.45%
#8
7.35%
#9
6.99%
#10
6.52%
What city has the Highest Percentage of Scotch-Irish Population in Kentucky?
Maytown has the Highest Percentage of Scotch-Irish Population in Kentucky with 100.00%.
What is the Percentage of Scotch-Irish Population in the State of Kentucky?
Percentage of Scotch-Irish Population in Kentucky is 1.27%.
What is the Percentage of Scotch-Irish Population in the United States?
Percentage of Scotch-Irish Population in the United States is 0.82%.