Cities with the Highest Percentage of Scotch-Irish Population in New Hampshire
RELATED REPORTS & OPTIONS
Scotch-Irish
New Hampshire
Compare Cities
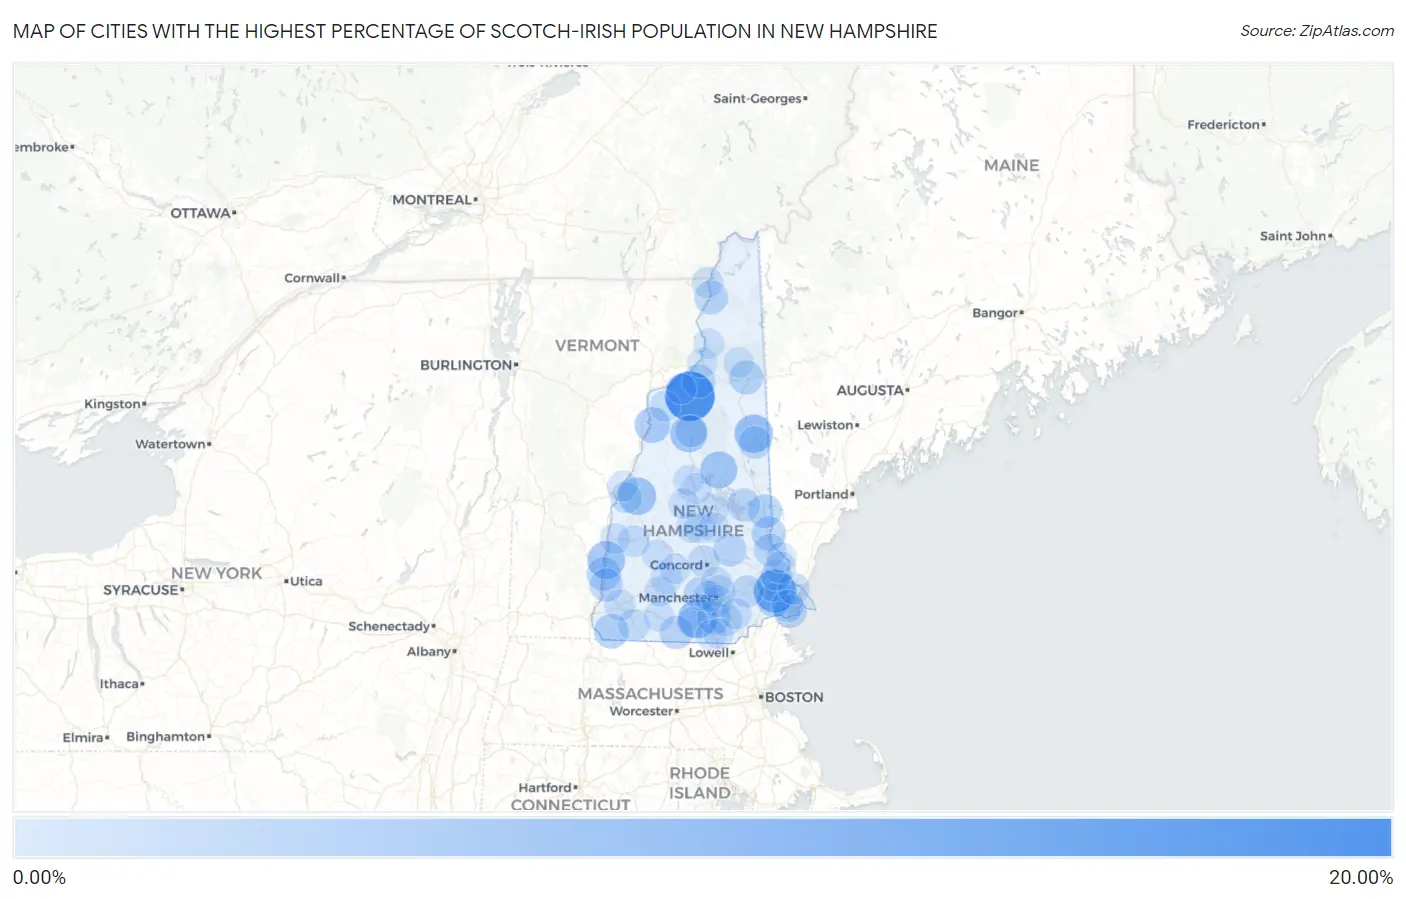
Map of Cities with the Highest Percentage of Scotch-Irish Population in New Hampshire
0.00%
20.00%
Cities with the Highest Percentage of Scotch-Irish Population in New Hampshire
| City | Scotch-Irish | vs State | vs National | |
| 1. | Bethlehem | 16.82% | 1.17%(+15.7)#1 | 0.82%(+16.0)#120 |
| 2. | Newfields | 10.65% | 1.17%(+9.48)#2 | 0.82%(+9.84)#252 |
| 3. | Amherst | 7.33% | 1.17%(+6.16)#3 | 0.82%(+6.51)#485 |
| 4. | North Conway | 6.93% | 1.17%(+5.75)#4 | 0.82%(+6.11)#550 |
| 5. | Charlestown | 6.32% | 1.17%(+5.14)#5 | 0.82%(+5.50)#641 |
| 6. | Enfield | 6.16% | 1.17%(+4.98)#6 | 0.82%(+5.34)#661 |
| 7. | North Woodstock | 5.83% | 1.17%(+4.65)#7 | 0.82%(+5.01)#723 |
| 8. | Center Sandwich | 5.81% | 1.17%(+4.64)#8 | 0.82%(+5.00)#725 |
| 9. | North Haverhill | 4.64% | 1.17%(+3.47)#9 | 0.82%(+3.82)#1,059 |
| 10. | Winchester | 3.73% | 1.17%(+2.55)#10 | 0.82%(+2.91)#1,515 |
| 11. | Milton | 3.44% | 1.17%(+2.27)#11 | 0.82%(+2.62)#1,738 |
| 12. | Gorham | 3.33% | 1.17%(+2.16)#12 | 0.82%(+2.51)#1,848 |
| 13. | Exeter | 3.26% | 1.17%(+2.08)#13 | 0.82%(+2.44)#1,902 |
| 14. | North Walpole | 3.23% | 1.17%(+2.05)#14 | 0.82%(+2.41)#1,932 |
| 15. | Sanbornville | 3.16% | 1.17%(+1.98)#15 | 0.82%(+2.34)#2,002 |
| 16. | Colebrook | 3.00% | 1.17%(+1.83)#16 | 0.82%(+2.18)#2,183 |
| 17. | Walpole | 2.80% | 1.17%(+1.62)#17 | 0.82%(+1.98)#2,428 |
| 18. | Greenville | 2.73% | 1.17%(+1.56)#18 | 0.82%(+1.92)#2,521 |
| 19. | East Merrimack | 2.71% | 1.17%(+1.54)#19 | 0.82%(+1.90)#2,554 |
| 20. | Whitefield | 2.63% | 1.17%(+1.45)#20 | 0.82%(+1.81)#2,674 |
| 21. | Hampton Beach | 2.60% | 1.17%(+1.43)#21 | 0.82%(+1.79)#2,706 |
| 22. | Wolfeboro | 2.56% | 1.17%(+1.39)#22 | 0.82%(+1.74)#2,772 |
| 23. | Newmarket | 2.47% | 1.17%(+1.30)#23 | 0.82%(+1.65)#2,922 |
| 24. | Pittsfield | 2.47% | 1.17%(+1.29)#24 | 0.82%(+1.65)#2,933 |
| 25. | Goffstown | 2.34% | 1.17%(+1.17)#25 | 0.82%(+1.53)#3,129 |
| 26. | Conway | 2.18% | 1.17%(+1.01)#26 | 0.82%(+1.37)#3,454 |
| 27. | Rochester | 2.15% | 1.17%(+0.973)#27 | 0.82%(+1.33)#3,549 |
| 28. | Hampton | 1.96% | 1.17%(+0.787)#28 | 0.82%(+1.14)#4,051 |
| 29. | Raymond | 1.85% | 1.17%(+0.674)#29 | 0.82%(+1.03)#4,369 |
| 30. | Lincoln | 1.77% | 1.17%(+0.597)#30 | 0.82%(+0.952)#4,615 |
| 31. | Londonderry | 1.59% | 1.17%(+0.417)#31 | 0.82%(+0.772)#5,265 |
| 32. | Portsmouth | 1.59% | 1.17%(+0.413)#32 | 0.82%(+0.768)#5,283 |
| 33. | Concord | 1.58% | 1.17%(+0.405)#33 | 0.82%(+0.760)#5,316 |
| 34. | Dover | 1.43% | 1.17%(+0.261)#34 | 0.82%(+0.616)#5,933 |
| 35. | Troy | 1.41% | 1.17%(+0.240)#35 | 0.82%(+0.595)#6,035 |
| 36. | Newport | 1.26% | 1.17%(+0.090)#36 | 0.82%(+0.445)#6,796 |
| 37. | Lebanon | 1.22% | 1.17%(+0.047)#37 | 0.82%(+0.402)#7,054 |
| 38. | South Hooksett | 1.21% | 1.17%(+0.032)#38 | 0.82%(+0.387)#7,141 |
| 39. | Manchester | 1.10% | 1.17%(-0.069)#39 | 0.82%(+0.286)#7,776 |
| 40. | Keene | 1.10% | 1.17%(-0.077)#40 | 0.82%(+0.278)#7,827 |
| 41. | West Stewartstown | 1.08% | 1.17%(-0.098)#41 | 0.82%(+0.257)#7,967 |
| 42. | Pinardville | 1.03% | 1.17%(-0.142)#42 | 0.82%(+0.213)#8,295 |
| 43. | Hillsborough | 1.02% | 1.17%(-0.152)#43 | 0.82%(+0.203)#8,353 |
| 44. | Derry | 0.96% | 1.17%(-0.209)#44 | 0.82%(+0.146)#8,825 |
| 45. | Tilton Northfield | 0.96% | 1.17%(-0.217)#45 | 0.82%(+0.138)#8,894 |
| 46. | Milford | 0.89% | 1.17%(-0.282)#46 | 0.82%(+0.073)#9,417 |
| 47. | Durham | 0.87% | 1.17%(-0.302)#47 | 0.82%(+0.053)#9,593 |
| 48. | Hooksett | 0.85% | 1.17%(-0.319)#48 | 0.82%(+0.036)#9,748 |
| 49. | Bradford | 0.78% | 1.17%(-0.398)#49 | 0.82%(-0.043)#10,453 |
| 50. | Laconia | 0.76% | 1.17%(-0.409)#50 | 0.82%(-0.054)#10,563 |
| 51. | Hanover | 0.72% | 1.17%(-0.456)#51 | 0.82%(-0.101)#11,027 |
| 52. | Lisbon | 0.69% | 1.17%(-0.485)#52 | 0.82%(-0.130)#11,323 |
| 53. | Franklin | 0.69% | 1.17%(-0.487)#53 | 0.82%(-0.132)#11,342 |
| 54. | Nashua | 0.65% | 1.17%(-0.525)#54 | 0.82%(-0.170)#11,742 |
| 55. | Peterborough | 0.62% | 1.17%(-0.550)#55 | 0.82%(-0.195)#11,995 |
| 56. | Groveton | 0.60% | 1.17%(-0.577)#56 | 0.82%(-0.222)#12,313 |
| 57. | Littleton | 0.59% | 1.17%(-0.584)#57 | 0.82%(-0.229)#12,389 |
| 58. | Claremont | 0.58% | 1.17%(-0.597)#58 | 0.82%(-0.242)#12,498 |
| 59. | Belmont | 0.56% | 1.17%(-0.614)#59 | 0.82%(-0.259)#12,695 |
| 60. | Ashland | 0.53% | 1.17%(-0.646)#60 | 0.82%(-0.292)#13,088 |
| 61. | Antrim | 0.45% | 1.17%(-0.718)#61 | 0.82%(-0.363)#13,902 |
| 62. | Plymouth | 0.45% | 1.17%(-0.721)#62 | 0.82%(-0.366)#13,942 |
| 63. | Bristol | 0.43% | 1.17%(-0.743)#63 | 0.82%(-0.388)#14,231 |
| 64. | Henniker | 0.40% | 1.17%(-0.771)#64 | 0.82%(-0.417)#14,551 |
| 65. | Berlin | 0.38% | 1.17%(-0.793)#65 | 0.82%(-0.438)#14,836 |
| 66. | Lancaster | 0.35% | 1.17%(-0.819)#66 | 0.82%(-0.464)#15,141 |
| 67. | Hudson | 0.27% | 1.17%(-0.901)#67 | 0.82%(-0.547)#16,201 |
| 68. | Somersworth | 0.25% | 1.17%(-0.923)#68 | 0.82%(-0.568)#16,480 |
1
Common Questions
What are the Top 10 Cities with the Highest Percentage of Scotch-Irish Population in New Hampshire?
Top 10 Cities with the Highest Percentage of Scotch-Irish Population in New Hampshire are:
#1
16.82%
#2
10.65%
#3
7.33%
#4
6.93%
#5
6.32%
#6
6.16%
#7
5.83%
#8
5.81%
#9
4.64%
#10
3.73%
What city has the Highest Percentage of Scotch-Irish Population in New Hampshire?
Bethlehem has the Highest Percentage of Scotch-Irish Population in New Hampshire with 16.82%.
What is the Percentage of Scotch-Irish Population in the State of New Hampshire?
Percentage of Scotch-Irish Population in New Hampshire is 1.17%.
What is the Percentage of Scotch-Irish Population in the United States?
Percentage of Scotch-Irish Population in the United States is 0.82%.