States with the Highest Percentage of Scotch-Irish Population
RELATED REPORTS & OPTIONS
Scotch-Irish
United States
Compare States
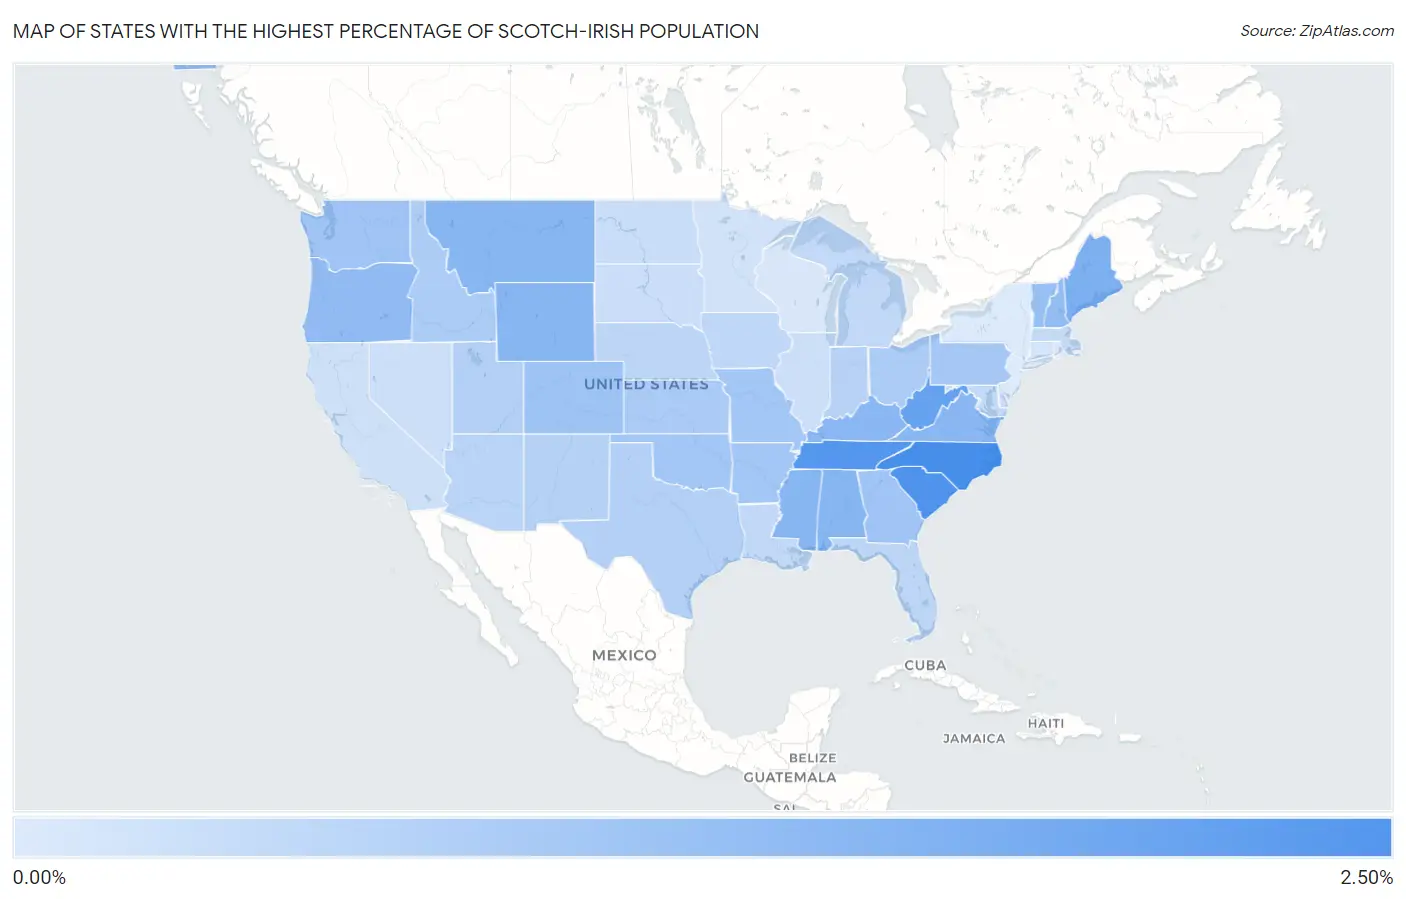
Map of States with the Highest Percentage of Scotch-Irish Population
0.00%
2.50%
States with the Highest Percentage of Scotch-Irish Population in the United States
| State | Scotch-Irish | vs State Median | vs National | |
| 1. | North Carolina | 2.04% | 0.83% (+1.21) | 0.82%(+1.22) |
| 2. | South Carolina | 1.93% | 0.83% (+1.10) | 0.82%(+1.11) |
| 3. | Tennessee | 1.89% | 0.83% (+1.06) | 0.82%(+1.07) |
| 4. | West Virginia | 1.69% | 0.83% (+0.858) | 0.82%(+0.874) |
| 5. | Maine | 1.43% | 0.83% (+0.600) | 0.82%(+0.615) |
| 6. | Wyoming | 1.31% | 0.83% (+0.475) | 0.82%(+0.491) |
| 7. | Montana | 1.29% | 0.83% (+0.460) | 0.82%(+0.476) |
| 8. | Mississippi | 1.29% | 0.83% (+0.458) | 0.82%(+0.474) |
| 9. | Alabama | 1.29% | 0.83% (+0.453) | 0.82%(+0.469) |
| 10. | Virginia | 1.28% | 0.83% (+0.445) | 0.82%(+0.460) |
| 11. | Kentucky | 1.27% | 0.83% (+0.440) | 0.82%(+0.455) |
| 12. | Oregon | 1.18% | 0.83% (+0.349) | 0.82%(+0.365) |
| 13. | New Hampshire | 1.17% | 0.83% (+0.339) | 0.82%(+0.355) |
| 14. | Vermont | 1.13% | 0.83% (+0.295) | 0.82%(+0.311) |
| 15. | Alaska | 1.10% | 0.83% (+0.268) | 0.82%(+0.283) |
| 16. | Colorado | 1.04% | 0.83% (+0.204) | 0.82%(+0.220) |
| 17. | Georgia | 1.02% | 0.83% (+0.185) | 0.82%(+0.201) |
| 18. | Washington | 1.02% | 0.83% (+0.183) | 0.82%(+0.198) |
| 19. | Missouri | 0.98% | 0.83% (+0.147) | 0.82%(+0.163) |
| 20. | Oklahoma | 0.97% | 0.83% (+0.140) | 0.82%(+0.156) |
| 21. | Arkansas | 0.97% | 0.83% (+0.137) | 0.82%(+0.152) |
| 22. | Pennsylvania | 0.97% | 0.83% (+0.132) | 0.82%(+0.148) |
| 23. | Kansas | 0.90% | 0.83% (+0.066) | 0.82%(+0.081) |
| 24. | Idaho | 0.88% | 0.83% (+0.050) | 0.82%(+0.065) |
| 25. | Ohio | 0.87% | 0.83% (+0.039) | 0.82%(+0.055) |
| 26. | Utah | 0.79% | 0.83% (-0.039) | 0.82%(-0.023) |
| 27. | Texas | 0.79% | 0.83% (-0.048) | 0.82%(-0.032) |
| 28. | New Mexico | 0.78% | 0.83% (-0.050) | 0.82%(-0.034) |
| 29. | Indiana | 0.73% | 0.83% (-0.101) | 0.82%(-0.085) |
| 30. | Arizona | 0.73% | 0.83% (-0.107) | 0.82%(-0.092) |
| 31. | Florida | 0.70% | 0.83% (-0.138) | 0.82%(-0.122) |
| 32. | Nebraska | 0.68% | 0.83% (-0.150) | 0.82%(-0.134) |
| 33. | Iowa | 0.66% | 0.83% (-0.176) | 0.82%(-0.161) |
| 34. | Michigan | 0.65% | 0.83% (-0.186) | 0.82%(-0.170) |
| 35. | Louisiana | 0.64% | 0.83% (-0.198) | 0.82%(-0.183) |
| 36. | Maryland | 0.62% | 0.83% (-0.211) | 0.82%(-0.195) |
| 37. | Delaware | 0.58% | 0.83% (-0.252) | 0.82%(-0.236) |
| 38. | Massachusetts | 0.58% | 0.83% (-0.253) | 0.82%(-0.237) |
| 39. | North Dakota | 0.55% | 0.83% (-0.283) | 0.82%(-0.267) |
| 40. | South Dakota | 0.54% | 0.83% (-0.294) | 0.82%(-0.278) |
| 41. | Illinois | 0.52% | 0.83% (-0.313) | 0.82%(-0.298) |
| 42. | Nevada | 0.50% | 0.83% (-0.332) | 0.82%(-0.316) |
| 43. | California | 0.48% | 0.83% (-0.351) | 0.82%(-0.335) |
| 44. | Minnesota | 0.46% | 0.83% (-0.377) | 0.82%(-0.362) |
| 45. | Connecticut | 0.44% | 0.83% (-0.392) | 0.82%(-0.376) |
| 46. | Hawaii | 0.41% | 0.83% (-0.421) | 0.82%(-0.405) |
| 47. | Rhode Island | 0.41% | 0.83% (-0.422) | 0.82%(-0.406) |
| 48. | Wisconsin | 0.37% | 0.83% (-0.461) | 0.82%(-0.445) |
| 49. | New Jersey | 0.33% | 0.83% (-0.506) | 0.82%(-0.490) |
| 50. | New York | 0.33% | 0.83% (-0.507) | 0.82%(-0.492) |
1
Common Questions
What are the Top 10 States with the Highest Percentage of Scotch-Irish Population in the United States?
Top 10 States with the Highest Percentage of Scotch-Irish Population in the United States are:
#1
2.04%
#2
1.93%
#3
1.89%
#4
1.69%
#5
1.43%
#6
1.31%
#7
1.29%
#8
1.29%
#9
1.29%
#10
1.28%
What state has the Highest Percentage of Scotch-Irish Population in the United States?
North Carolina has the Highest Percentage of Scotch-Irish Population in the United States with 2.04%.
What is the Percentage of Scotch-Irish Population in the United States?
Percentage of Scotch-Irish Population in the United States is 0.82%.