Cities with the Most Births per 1,000 Women Over the Age of 35 in Minnesota
RELATED REPORTS & OPTIONS
Highest Birth Rate | Women 35+
Minnesota
Compare Cities
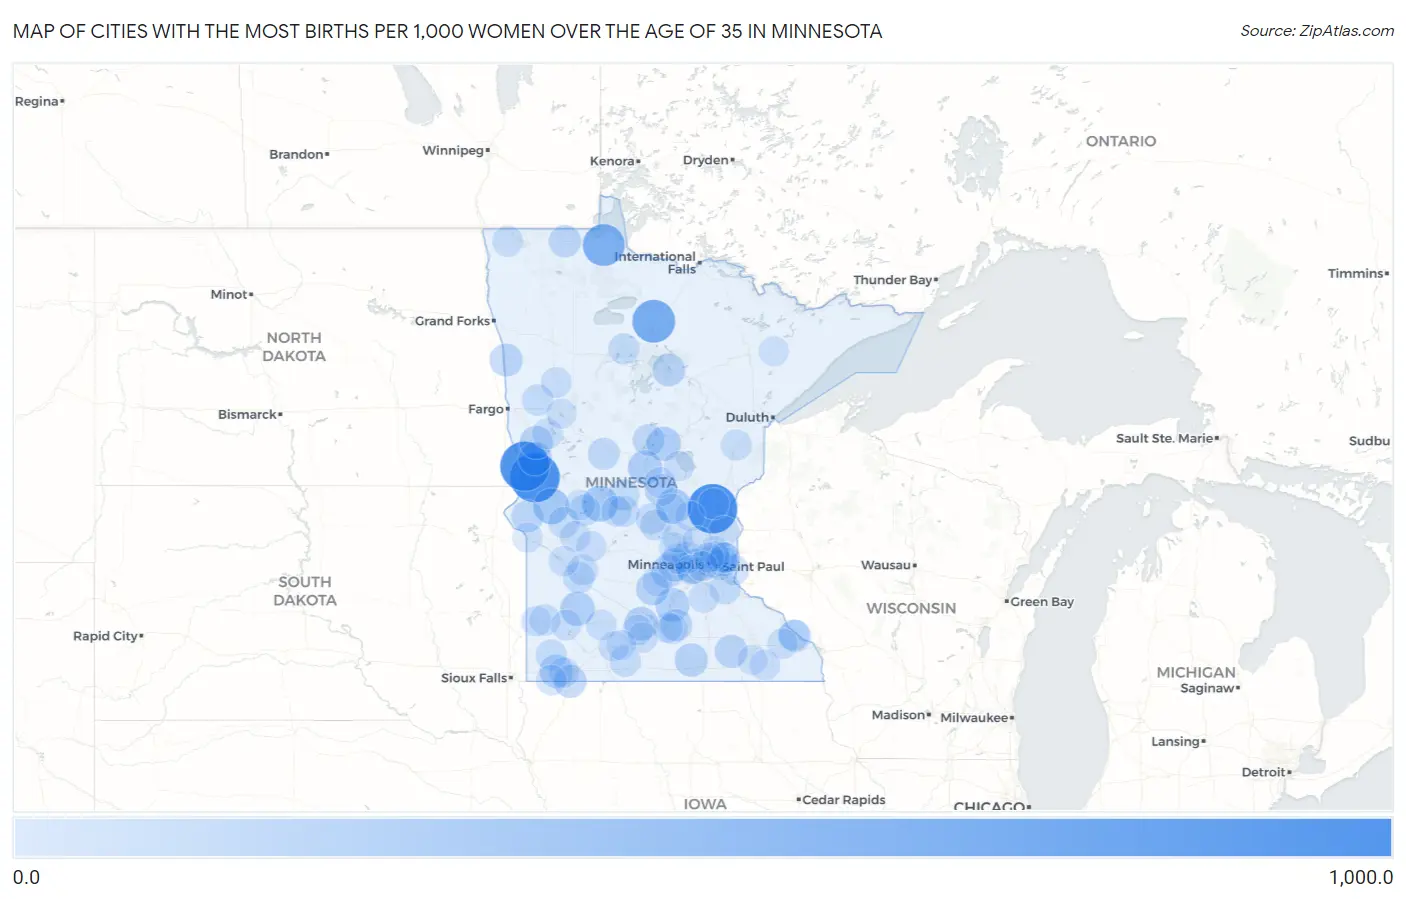
Map of Cities with the Most Births per 1,000 Women Over the Age of 35 in Minnesota
0.0
1,000.0
Cities with the Most Births per 1,000 Women Over the Age of 35 in Minnesota
| City | Births / 1,000 Women | vs State | vs National | |
| 1. | Stanchfield | 1,000.0 | 35.0(+965)#1 | 32.0(+968)#40 |
| 2. | Essig | 1,000.0 | 35.0(+965)#2 | 32.0(+968)#47 |
| 3. | Nashua | 1,000.0 | 35.0(+965)#3 | 32.0(+968)#50 |
| 4. | Doran | 1,000.0 | 35.0(+965)#4 | 32.0(+968)#54 |
| 5. | Mizpah | 667.0 | 35.0(+632)#5 | 32.0(+635)#80 |
| 6. | Roosevelt | 625.0 | 35.0(+590)#6 | 32.0(+593)#94 |
| 7. | Donnelly | 333.0 | 35.0(+298)#7 | 32.0(+301)#288 |
| 8. | Westport | 333.0 | 35.0(+298)#8 | 32.0(+301)#304 |
| 9. | Ronneby | 300.0 | 35.0(+265)#9 | 32.0(+268)#345 |
| 10. | Woodland | 283.0 | 35.0(+248)#10 | 32.0(+251)#377 |
| 11. | Milroy | 261.0 | 35.0(+226)#11 | 32.0(+229)#440 |
| 12. | Riverton | 250.0 | 35.0(+215)#12 | 32.0(+218)#482 |
| 13. | Fort Ripley | 250.0 | 35.0(+215)#13 | 32.0(+218)#484 |
| 14. | Le Sueur | 245.0 | 35.0(+210)#14 | 32.0(+213)#497 |
| 15. | Searles | 222.0 | 35.0(+187)#15 | 32.0(+190)#581 |
| 16. | Foxhome | 222.0 | 35.0(+187)#16 | 32.0(+190)#588 |
| 17. | New Germany | 214.0 | 35.0(+179)#17 | 32.0(+182)#617 |
| 18. | Rothsay | 212.0 | 35.0(+177)#18 | 32.0(+180)#630 |
| 19. | Freeborn | 211.0 | 35.0(+176)#19 | 32.0(+179)#640 |
| 20. | Adrian | 207.0 | 35.0(+172)#20 | 32.0(+175)#657 |
| 21. | Watertown | 204.0 | 35.0(+169)#21 | 32.0(+172)#670 |
| 22. | New Auburn | 204.0 | 35.0(+169)#22 | 32.0(+172)#674 |
| 23. | Bigelow | 200.0 | 35.0(+165)#23 | 32.0(+168)#707 |
| 24. | Hayfield | 192.0 | 35.0(+157)#24 | 32.0(+160)#753 |
| 25. | Shelly | 192.0 | 35.0(+157)#25 | 32.0(+160)#755 |
| 26. | Marion | 188.0 | 35.0(+153)#26 | 32.0(+156)#777 |
| 27. | Ball Club | 188.0 | 35.0(+153)#27 | 32.0(+156)#780 |
| 28. | Roseau | 170.0 | 35.0(+135)#28 | 32.0(+138)#886 |
| 29. | Buckman | 161.0 | 35.0(+126)#29 | 32.0(+129)#966 |
| 30. | Graceville | 158.0 | 35.0(+123)#30 | 32.0(+126)#993 |
| 31. | Madison Lake | 156.0 | 35.0(+121)#31 | 32.0(+124)#1,007 |
| 32. | Nisswa | 153.0 | 35.0(+118)#32 | 32.0(+121)#1,033 |
| 33. | Goodview | 148.0 | 35.0(+113)#33 | 32.0(+116)#1,089 |
| 34. | Hewitt | 143.0 | 35.0(+108)#34 | 32.0(+111)#1,157 |
| 35. | Grey Eagle | 130.0 | 35.0(+95.0)#35 | 32.0(+98.0)#1,344 |
| 36. | Loretto | 125.0 | 35.0(+90.0)#36 | 32.0(+93.0)#1,406 |
| 37. | Hitterdal | 125.0 | 35.0(+90.0)#37 | 32.0(+93.0)#1,418 |
| 38. | Long Beach | 125.0 | 35.0(+90.0)#38 | 32.0(+93.0)#1,419 |
| 39. | Granite Falls | 124.0 | 35.0(+89.0)#39 | 32.0(+92.0)#1,442 |
| 40. | Vermillion | 118.0 | 35.0(+83.0)#40 | 32.0(+86.0)#1,533 |
| 41. | Lauderdale | 117.0 | 35.0(+82.0)#41 | 32.0(+85.0)#1,552 |
| 42. | Braham | 115.0 | 35.0(+80.0)#42 | 32.0(+83.0)#1,591 |
| 43. | Tyler | 113.0 | 35.0(+78.0)#43 | 32.0(+81.0)#1,634 |
| 44. | Hancock | 113.0 | 35.0(+78.0)#44 | 32.0(+81.0)#1,638 |
| 45. | New Munich | 111.0 | 35.0(+76.0)#45 | 32.0(+79.0)#1,693 |
| 46. | Minnesota City | 111.0 | 35.0(+76.0)#46 | 32.0(+79.0)#1,697 |
| 47. | Leota | 111.0 | 35.0(+76.0)#47 | 32.0(+79.0)#1,700 |
| 48. | Turtle River | 111.0 | 35.0(+76.0)#48 | 32.0(+79.0)#1,706 |
| 49. | Waite Park | 110.0 | 35.0(+75.0)#49 | 32.0(+78.0)#1,710 |
| 50. | Trimont | 108.0 | 35.0(+73.0)#50 | 32.0(+76.0)#1,769 |
| 51. | Moose Lake | 106.0 | 35.0(+71.0)#51 | 32.0(+74.0)#1,807 |
| 52. | Maynard | 105.0 | 35.0(+70.0)#52 | 32.0(+73.0)#1,841 |
| 53. | Gem Lake | 102.0 | 35.0(+67.0)#53 | 32.0(+70.0)#1,909 |
| 54. | St Augusta | 101.0 | 35.0(+66.0)#54 | 32.0(+69.0)#1,921 |
| 55. | Lancaster | 100.0 | 35.0(+65.0)#55 | 32.0(+68.0)#1,961 |
| 56. | Afton | 99.0 | 35.0(+64.0)#56 | 32.0(+67.0)#1,983 |
| 57. | Pelican Rapids | 99.0 | 35.0(+64.0)#57 | 32.0(+67.0)#1,985 |
| 58. | Stacy | 99.0 | 35.0(+64.0)#58 | 32.0(+67.0)#1,989 |
| 59. | Birchwood Village | 99.0 | 35.0(+64.0)#59 | 32.0(+67.0)#1,996 |
| 60. | Waubun | 95.0 | 35.0(+60.0)#60 | 32.0(+63.0)#2,089 |
| 61. | Sanborn | 95.0 | 35.0(+60.0)#61 | 32.0(+63.0)#2,090 |
| 62. | Benson | 92.0 | 35.0(+57.0)#62 | 32.0(+60.0)#2,177 |
| 63. | Rushmore | 91.0 | 35.0(+56.0)#63 | 32.0(+59.0)#2,219 |
| 64. | Meire Grove | 91.0 | 35.0(+56.0)#64 | 32.0(+59.0)#2,225 |
| 65. | Garvin | 91.0 | 35.0(+56.0)#65 | 32.0(+59.0)#2,226 |
| 66. | Monticello | 88.0 | 35.0(+53.0)#66 | 32.0(+56.0)#2,274 |
| 67. | Pierz | 88.0 | 35.0(+53.0)#67 | 32.0(+56.0)#2,295 |
| 68. | Eagle Lake | 87.0 | 35.0(+52.0)#68 | 32.0(+55.0)#2,325 |
| 69. | Mankato | 85.0 | 35.0(+50.0)#69 | 32.0(+53.0)#2,373 |
| 70. | Elko New Market | 84.0 | 35.0(+49.0)#70 | 32.0(+52.0)#2,411 |
| 71. | Vineland | 83.0 | 35.0(+48.0)#71 | 32.0(+51.0)#2,451 |
| 72. | Ellsworth | 83.0 | 35.0(+48.0)#72 | 32.0(+51.0)#2,459 |
| 73. | Wykoff | 83.0 | 35.0(+48.0)#73 | 32.0(+51.0)#2,463 |
| 74. | Hanska | 83.0 | 35.0(+48.0)#74 | 32.0(+51.0)#2,464 |
| 75. | Watson | 83.0 | 35.0(+48.0)#75 | 32.0(+51.0)#2,479 |
| 76. | Kerkhoven | 82.0 | 35.0(+47.0)#76 | 32.0(+50.0)#2,509 |
| 77. | Maplewood | 80.0 | 35.0(+45.0)#77 | 32.0(+48.0)#2,545 |
| 78. | Madelia | 79.0 | 35.0(+44.0)#78 | 32.0(+47.0)#2,604 |
| 79. | Lake Benton | 78.0 | 35.0(+43.0)#79 | 32.0(+46.0)#2,648 |
| 80. | Delano | 77.0 | 35.0(+42.0)#80 | 32.0(+45.0)#2,667 |
| 81. | Princeton | 77.0 | 35.0(+42.0)#81 | 32.0(+45.0)#2,668 |
| 82. | Utica | 77.0 | 35.0(+42.0)#82 | 32.0(+45.0)#2,702 |
| 83. | Mountain Lake | 76.0 | 35.0(+41.0)#83 | 32.0(+44.0)#2,733 |
| 84. | North St Paul | 75.0 | 35.0(+40.0)#84 | 32.0(+43.0)#2,755 |
| 85. | Glencoe | 75.0 | 35.0(+40.0)#85 | 32.0(+43.0)#2,769 |
| 86. | Racine | 75.0 | 35.0(+40.0)#86 | 32.0(+43.0)#2,791 |
| 87. | Buffalo | 74.0 | 35.0(+39.0)#87 | 32.0(+42.0)#2,794 |
| 88. | Circle Pines | 74.0 | 35.0(+39.0)#88 | 32.0(+42.0)#2,807 |
| 89. | Foley | 74.0 | 35.0(+39.0)#89 | 32.0(+42.0)#2,815 |
| 90. | Lowry | 74.0 | 35.0(+39.0)#90 | 32.0(+42.0)#2,839 |
| 91. | Ramsey | 72.0 | 35.0(+37.0)#91 | 32.0(+40.0)#2,898 |
| 92. | Shoreview | 72.0 | 35.0(+37.0)#92 | 32.0(+40.0)#2,899 |
| 93. | Mahtomedi | 72.0 | 35.0(+37.0)#93 | 32.0(+40.0)#2,908 |
| 94. | Excelsior | 71.0 | 35.0(+36.0)#94 | 32.0(+39.0)#2,968 |
| 95. | Ortonville | 71.0 | 35.0(+36.0)#95 | 32.0(+39.0)#2,969 |
| 96. | Hoyt Lakes | 70.0 | 35.0(+35.0)#96 | 32.0(+38.0)#3,033 |
| 97. | Detroit Lakes | 69.0 | 35.0(+34.0)#97 | 32.0(+37.0)#3,054 |
| 98. | Hilltop | 69.0 | 35.0(+34.0)#98 | 32.0(+37.0)#3,080 |
| 99. | Butterfield | 69.0 | 35.0(+34.0)#99 | 32.0(+37.0)#3,088 |
| 100. | St Louis Park | 68.0 | 35.0(+33.0)#100 | 32.0(+36.0)#3,097 |
Common Questions
What are the Top 10 Cities with the Most Births per 1,000 Women Over the Age of 35 in Minnesota?
Top 10 Cities with the Most Births per 1,000 Women Over the Age of 35 in Minnesota are:
What city has the Most Births per 1,000 Women Over the Age of 35 in Minnesota?
Stanchfield has the Most Births per 1,000 Women Over the Age of 35 in Minnesota with 1,000.0.
What is the Number of Births per 1,000 Women Over the Age of 35 in the State of Minnesota?
Number of Births per 1,000 Women Over the Age of 35 in Minnesota is 35.0.
What is the Number of Births per 1,000 Women Over the Age of 35 in the United States?
Number of Births per 1,000 Women Over the Age of 35 in the United States is 32.0.