Cities with the Most Births per 1,000 Women Over the Age of 35 in Indiana
RELATED REPORTS & OPTIONS
Highest Birth Rate | Women 35+
Indiana
Compare Cities
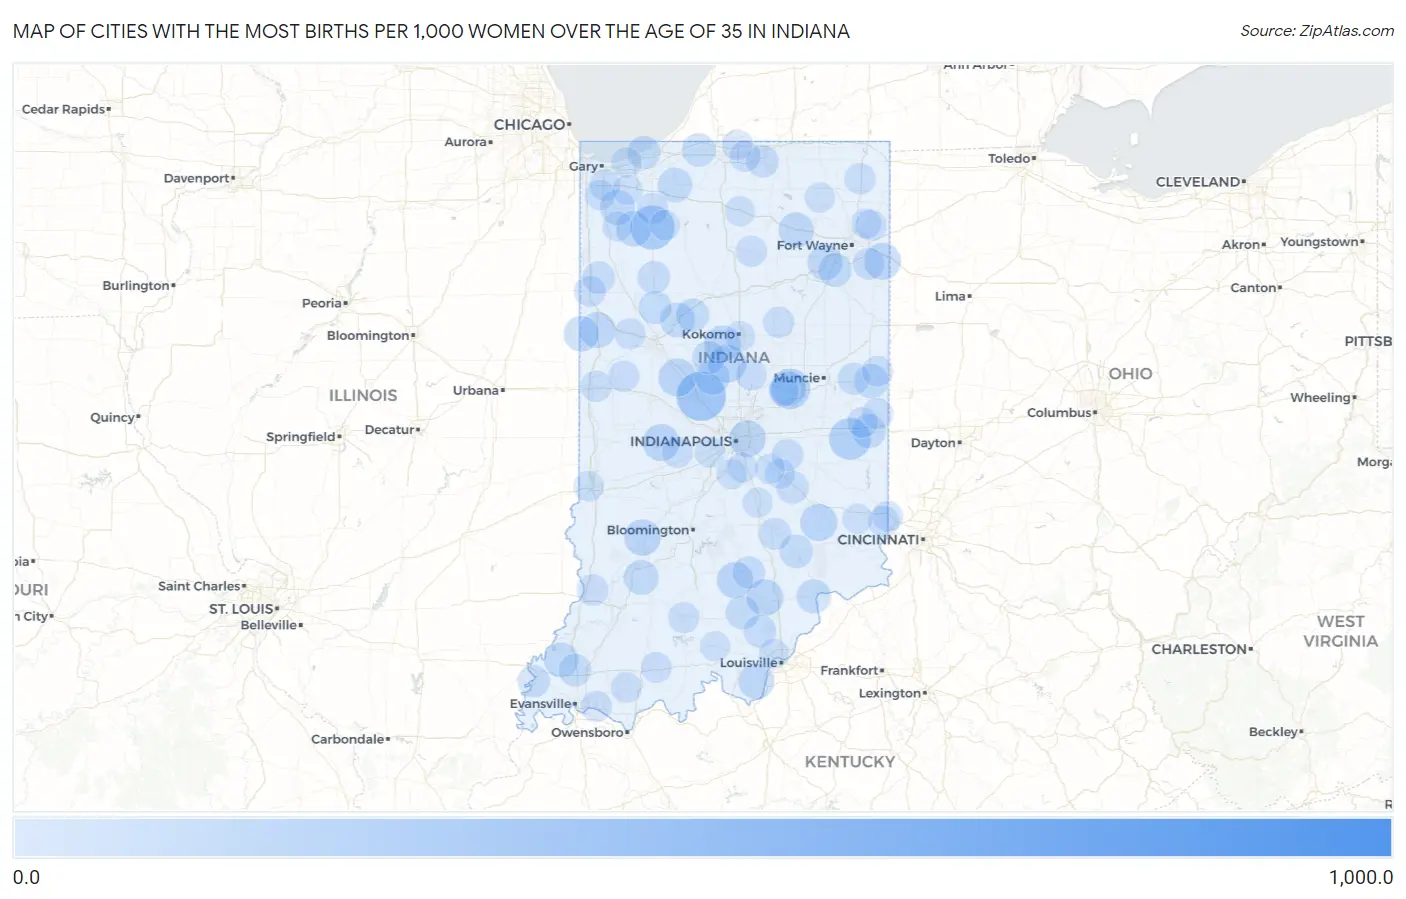
Map of Cities with the Most Births per 1,000 Women Over the Age of 35 in Indiana
0.0
1,000.0
Cities with the Most Births per 1,000 Women Over the Age of 35 in Indiana
| City | Births / 1,000 Women | vs State | vs National | |
| 1. | Pierceville | 1,000.0 | 25.0(+975)#1 | 32.0(+968)#30 |
| 2. | Spencerville | 797.0 | 25.0(+772)#2 | 32.0(+765)#65 |
| 3. | Enchanted Hills | 484.0 | 25.0(+459)#3 | 32.0(+452)#155 |
| 4. | Wyatt | 429.0 | 25.0(+404)#4 | 32.0(+397)#192 |
| 5. | Ulen | 333.0 | 25.0(+308)#5 | 32.0(+301)#294 |
| 6. | San Pierre | 256.0 | 25.0(+231)#6 | 32.0(+224)#451 |
| 7. | Lake Eliza | 239.0 | 25.0(+214)#7 | 32.0(+207)#518 |
| 8. | Milton | 219.0 | 25.0(+194)#8 | 32.0(+187)#601 |
| 9. | Country Club Heights | 200.0 | 25.0(+175)#9 | 32.0(+168)#716 |
| 10. | Colfax | 165.0 | 25.0(+140)#10 | 32.0(+133)#936 |
| 11. | Kempton | 161.0 | 25.0(+136)#11 | 32.0(+129)#967 |
| 12. | Millhousen | 152.0 | 25.0(+127)#12 | 32.0(+120)#1,047 |
| 13. | Bainbridge | 148.0 | 25.0(+123)#13 | 32.0(+116)#1,098 |
| 14. | Monroeville | 145.0 | 25.0(+120)#14 | 32.0(+113)#1,127 |
| 15. | Warren Park | 144.0 | 25.0(+119)#15 | 32.0(+112)#1,130 |
| 16. | Little York | 143.0 | 25.0(+118)#16 | 32.0(+111)#1,160 |
| 17. | Rockford | 141.0 | 25.0(+116)#17 | 32.0(+109)#1,179 |
| 18. | Worthington | 139.0 | 25.0(+114)#18 | 32.0(+107)#1,199 |
| 19. | Russiaville | 138.0 | 25.0(+113)#19 | 32.0(+106)#1,214 |
| 20. | Medora | 138.0 | 25.0(+113)#20 | 32.0(+106)#1,216 |
| 21. | Boswell | 135.0 | 25.0(+110)#21 | 32.0(+103)#1,252 |
| 22. | Elizabeth | 133.0 | 25.0(+108)#22 | 32.0(+101)#1,301 |
| 23. | Larwill | 125.0 | 25.0(+100.0)#23 | 32.0(+93.0)#1,413 |
| 24. | Ambia | 125.0 | 25.0(+100.0)#24 | 32.0(+93.0)#1,426 |
| 25. | Wheatfield | 124.0 | 25.0(+99.0)#25 | 32.0(+92.0)#1,447 |
| 26. | Roanoke | 122.0 | 25.0(+97.0)#26 | 32.0(+90.0)#1,470 |
| 27. | Hebron | 121.0 | 25.0(+96.0)#27 | 32.0(+89.0)#1,477 |
| 28. | Delphi | 118.0 | 25.0(+93.0)#28 | 32.0(+86.0)#1,521 |
| 29. | Odon | 118.0 | 25.0(+93.0)#29 | 32.0(+86.0)#1,526 |
| 30. | Woodlawn Heights | 118.0 | 25.0(+93.0)#30 | 32.0(+86.0)#1,543 |
| 31. | Kingsford Heights | 116.0 | 25.0(+91.0)#31 | 32.0(+84.0)#1,573 |
| 32. | Owensville | 116.0 | 25.0(+91.0)#32 | 32.0(+84.0)#1,574 |
| 33. | Kirklin | 114.0 | 25.0(+89.0)#33 | 32.0(+82.0)#1,612 |
| 34. | Winchester | 109.0 | 25.0(+84.0)#34 | 32.0(+77.0)#1,735 |
| 35. | Hanover | 107.0 | 25.0(+82.0)#35 | 32.0(+75.0)#1,781 |
| 36. | Centerville | 105.0 | 25.0(+80.0)#36 | 32.0(+73.0)#1,826 |
| 37. | Zanesville | 100.0 | 25.0(+75.0)#37 | 32.0(+68.0)#1,954 |
| 38. | North Vernon | 99.0 | 25.0(+74.0)#38 | 32.0(+67.0)#1,975 |
| 39. | Salem | 98.0 | 25.0(+73.0)#39 | 32.0(+66.0)#2,002 |
| 40. | New Carlisle | 97.0 | 25.0(+72.0)#40 | 32.0(+65.0)#2,033 |
| 41. | Beverly Shores | 94.0 | 25.0(+69.0)#41 | 32.0(+62.0)#2,125 |
| 42. | Michigantown | 93.0 | 25.0(+68.0)#42 | 32.0(+61.0)#2,155 |
| 43. | Chalmers | 93.0 | 25.0(+68.0)#43 | 32.0(+61.0)#2,159 |
| 44. | Camden | 91.0 | 25.0(+66.0)#44 | 32.0(+59.0)#2,212 |
| 45. | Haubstadt | 87.0 | 25.0(+62.0)#45 | 32.0(+55.0)#2,330 |
| 46. | Monon | 86.0 | 25.0(+61.0)#46 | 32.0(+54.0)#2,367 |
| 47. | Waldron | 84.0 | 25.0(+59.0)#47 | 32.0(+52.0)#2,425 |
| 48. | Brownstown | 83.0 | 25.0(+58.0)#48 | 32.0(+51.0)#2,438 |
| 49. | Borden | 83.0 | 25.0(+58.0)#49 | 32.0(+51.0)#2,448 |
| 50. | Brook | 82.0 | 25.0(+57.0)#50 | 32.0(+50.0)#2,508 |
| 51. | Dunlap | 81.0 | 25.0(+56.0)#51 | 32.0(+49.0)#2,529 |
| 52. | New Harmony | 80.0 | 25.0(+55.0)#52 | 32.0(+48.0)#2,571 |
| 53. | Farmland | 77.0 | 25.0(+52.0)#53 | 32.0(+45.0)#2,680 |
| 54. | Elizabethtown | 77.0 | 25.0(+52.0)#54 | 32.0(+45.0)#2,696 |
| 55. | Morristown | 74.0 | 25.0(+49.0)#55 | 32.0(+42.0)#2,824 |
| 56. | Hoagland | 73.0 | 25.0(+48.0)#56 | 32.0(+41.0)#2,889 |
| 57. | Bruceville | 71.0 | 25.0(+46.0)#57 | 32.0(+39.0)#2,996 |
| 58. | Kentland | 67.0 | 25.0(+42.0)#58 | 32.0(+35.0)#3,170 |
| 59. | La Crosse | 67.0 | 25.0(+42.0)#59 | 32.0(+35.0)#3,189 |
| 60. | Sweetser | 66.0 | 25.0(+41.0)#60 | 32.0(+34.0)#3,244 |
| 61. | Bright | 65.0 | 25.0(+40.0)#61 | 32.0(+33.0)#3,272 |
| 62. | Otterbein | 65.0 | 25.0(+40.0)#62 | 32.0(+33.0)#3,298 |
| 63. | Akron | 65.0 | 25.0(+40.0)#63 | 32.0(+33.0)#3,299 |
| 64. | West Baden Springs | 65.0 | 25.0(+40.0)#64 | 32.0(+33.0)#3,308 |
| 65. | Newburgh | 64.0 | 25.0(+39.0)#65 | 32.0(+32.0)#3,342 |
| 66. | Covington | 64.0 | 25.0(+39.0)#66 | 32.0(+32.0)#3,346 |
| 67. | Ashley | 64.0 | 25.0(+39.0)#67 | 32.0(+32.0)#3,359 |
| 68. | Fountain City | 64.0 | 25.0(+39.0)#68 | 32.0(+32.0)#3,363 |
| 69. | Merrillville | 63.0 | 25.0(+38.0)#69 | 32.0(+31.0)#3,370 |
| 70. | Osceola | 63.0 | 25.0(+38.0)#70 | 32.0(+31.0)#3,409 |
| 71. | Atlanta | 63.0 | 25.0(+38.0)#71 | 32.0(+31.0)#3,436 |
| 72. | Ferdinand | 61.0 | 25.0(+36.0)#72 | 32.0(+29.0)#3,538 |
| 73. | Grabill | 61.0 | 25.0(+36.0)#73 | 32.0(+29.0)#3,551 |
| 74. | Coatesville | 61.0 | 25.0(+36.0)#74 | 32.0(+29.0)#3,570 |
| 75. | Newtown | 61.0 | 25.0(+36.0)#75 | 32.0(+29.0)#3,577 |
| 76. | Saratoga | 59.0 | 25.0(+34.0)#76 | 32.0(+27.0)#3,717 |
| 77. | Tennyson | 59.0 | 25.0(+34.0)#77 | 32.0(+27.0)#3,721 |
| 78. | Greens Fork | 57.0 | 25.0(+32.0)#78 | 32.0(+25.0)#3,843 |
| 79. | West Harrison | 56.0 | 25.0(+31.0)#79 | 32.0(+24.0)#3,922 |
| 80. | Granger | 55.0 | 25.0(+30.0)#80 | 32.0(+23.0)#3,950 |
| 81. | Plainfield | 53.0 | 25.0(+28.0)#81 | 32.0(+21.0)#4,123 |
| 82. | Kokomo | 52.0 | 25.0(+27.0)#82 | 32.0(+20.0)#4,229 |
| 83. | New Albany | 52.0 | 25.0(+27.0)#83 | 32.0(+20.0)#4,237 |
| 84. | North Judson | 52.0 | 25.0(+27.0)#84 | 32.0(+20.0)#4,291 |
| 85. | West Terre Haute | 52.0 | 25.0(+27.0)#85 | 32.0(+20.0)#4,294 |
| 86. | Crown Point | 51.0 | 25.0(+26.0)#86 | 32.0(+19.0)#4,322 |
| 87. | Bargersville | 51.0 | 25.0(+26.0)#87 | 32.0(+19.0)#4,342 |
| 88. | Bourbon | 51.0 | 25.0(+26.0)#88 | 32.0(+19.0)#4,375 |
| 89. | De Motte | 50.0 | 25.0(+25.0)#89 | 32.0(+18.0)#4,470 |
| 90. | Edinburgh | 50.0 | 25.0(+25.0)#90 | 32.0(+18.0)#4,471 |
| 91. | Albion | 50.0 | 25.0(+25.0)#91 | 32.0(+18.0)#4,474 |
| 92. | Sunman | 50.0 | 25.0(+25.0)#92 | 32.0(+18.0)#4,480 |
| 93. | Marengo | 50.0 | 25.0(+25.0)#93 | 32.0(+18.0)#4,490 |
| 94. | Greenwood | 49.0 | 25.0(+24.0)#94 | 32.0(+17.0)#4,511 |
| 95. | Shelbyville | 49.0 | 25.0(+24.0)#95 | 32.0(+17.0)#4,522 |
| 96. | Leo Cedarville | 49.0 | 25.0(+24.0)#96 | 32.0(+17.0)#4,560 |
| 97. | Burns Harbor | 49.0 | 25.0(+24.0)#97 | 32.0(+17.0)#4,571 |
| 98. | Aberdeen | 49.0 | 25.0(+24.0)#98 | 32.0(+17.0)#4,580 |
| 99. | Fairland | 49.0 | 25.0(+24.0)#99 | 32.0(+17.0)#4,599 |
| 100. | Edgewood | 48.0 | 25.0(+23.0)#100 | 32.0(+16.0)#4,682 |
Common Questions
What are the Top 10 Cities with the Most Births per 1,000 Women Over the Age of 35 in Indiana?
Top 10 Cities with the Most Births per 1,000 Women Over the Age of 35 in Indiana are:
#1
333.0
#2
256.0
#3
219.0
#4
200.0
#5
165.0
#6
161.0
#7
152.0
#8
148.0
#9
145.0
#10
144.0
What city has the Most Births per 1,000 Women Over the Age of 35 in Indiana?
Ulen has the Most Births per 1,000 Women Over the Age of 35 in Indiana with 333.0.
What is the Number of Births per 1,000 Women Over the Age of 35 in the State of Indiana?
Number of Births per 1,000 Women Over the Age of 35 in Indiana is 25.0.
What is the Number of Births per 1,000 Women Over the Age of 35 in the United States?
Number of Births per 1,000 Women Over the Age of 35 in the United States is 32.0.