Cities with the Most Births per 1,000 Women Over the Age of 35 in Kentucky
RELATED REPORTS & OPTIONS
Highest Birth Rate | Women 35+
Kentucky
Compare Cities
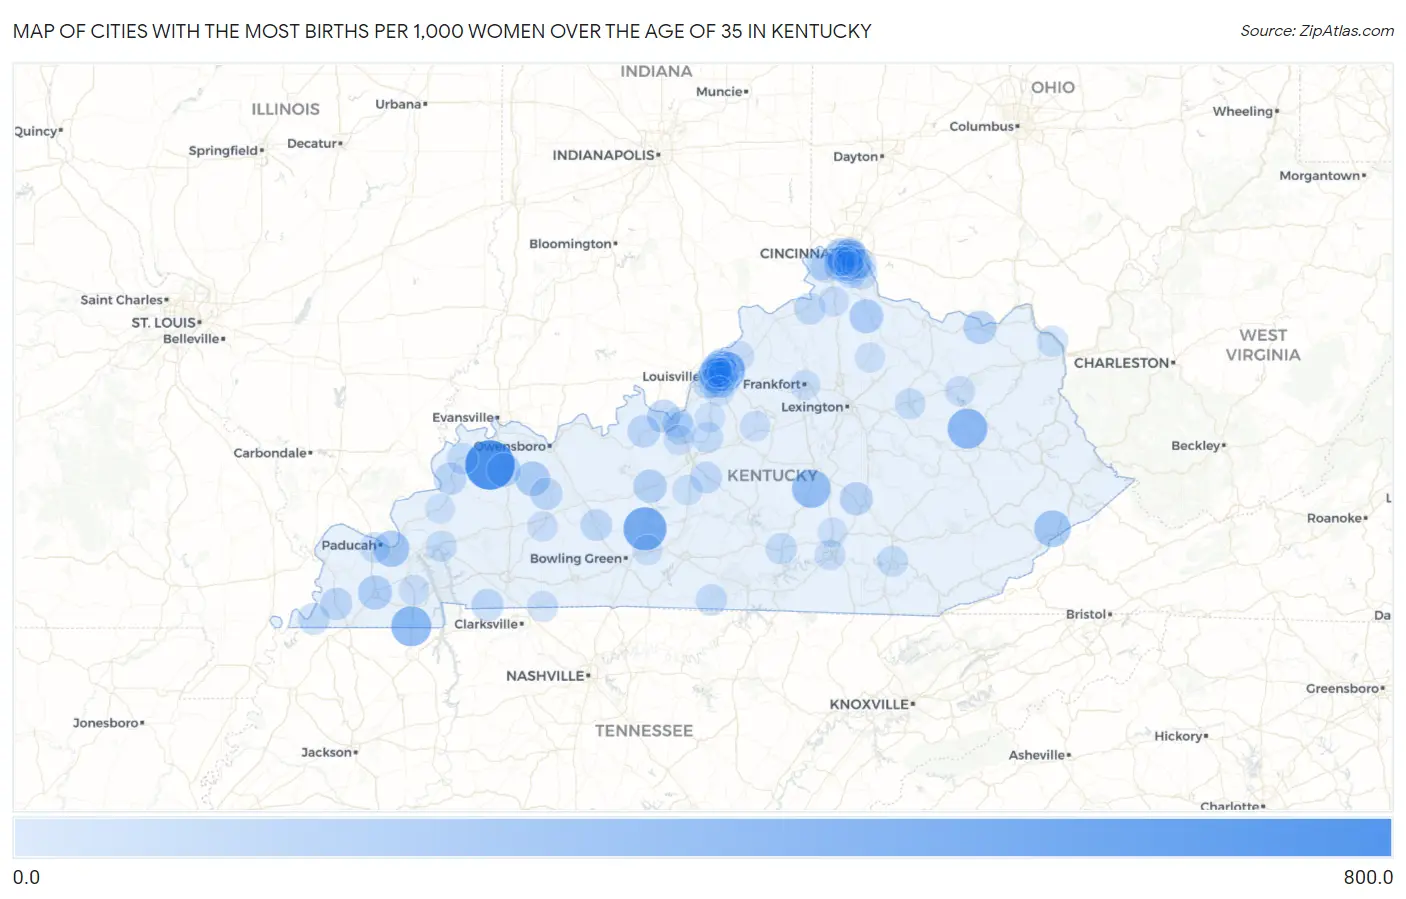
Map of Cities with the Most Births per 1,000 Women Over the Age of 35 in Kentucky
0.0
800.0
Cities with the Most Births per 1,000 Women Over the Age of 35 in Kentucky
| City | Births / 1,000 Women | vs State | vs National | |
| 1. | Poole | 647.0 | 22.0(+625)#1 | 32.0(+615)#85 |
| 2. | Brownsville | 440.0 | 22.0(+418)#2 | 32.0(+408)#183 |
| 3. | Hazel | 341.0 | 22.0(+319)#3 | 32.0(+309)#270 |
| 4. | Creekside | 333.0 | 22.0(+311)#4 | 32.0(+301)#280 |
| 5. | Ezel | 333.0 | 22.0(+311)#5 | 32.0(+301)#281 |
| 6. | Hustonville | 290.0 | 22.0(+268)#6 | 32.0(+258)#360 |
| 7. | Fleming Neon | 232.0 | 22.0(+210)#7 | 32.0(+200)#539 |
| 8. | Ledbetter | 222.0 | 22.0(+200)#8 | 32.0(+190)#574 |
| 9. | Plantation | 202.0 | 22.0(+180)#9 | 32.0(+170)#685 |
| 10. | Richlawn | 179.0 | 22.0(+157)#10 | 32.0(+147)#833 |
| 11. | Calhoun | 175.0 | 22.0(+153)#11 | 32.0(+143)#858 |
| 12. | Mayfield | 156.0 | 22.0(+134)#12 | 32.0(+124)#1,004 |
| 13. | Falmouth | 154.0 | 22.0(+132)#13 | 32.0(+122)#1,021 |
| 14. | Green Spring | 152.0 | 22.0(+130)#14 | 32.0(+120)#1,046 |
| 15. | Sebree | 151.0 | 22.0(+129)#15 | 32.0(+119)#1,052 |
| 16. | Ludlow | 136.0 | 22.0(+114)#16 | 32.0(+104)#1,230 |
| 17. | Vanceburg | 133.0 | 22.0(+111)#17 | 32.0(+101)#1,284 |
| 18. | Clarkson | 132.0 | 22.0(+110)#18 | 32.0(+100.0)#1,311 |
| 19. | Brodhead | 129.0 | 22.0(+107)#19 | 32.0(+97.0)#1,353 |
| 20. | Doe Valley | 128.0 | 22.0(+106)#20 | 32.0(+96.0)#1,365 |
| 21. | Cold Spring | 113.0 | 22.0(+91.0)#21 | 32.0(+81.0)#1,622 |
| 22. | Fairview | 111.0 | 22.0(+89.0)#22 | 32.0(+79.0)#1,699 |
| 23. | Kenton Vale | 111.0 | 22.0(+89.0)#23 | 32.0(+79.0)#1,701 |
| 24. | Irvington | 110.0 | 22.0(+88.0)#24 | 32.0(+78.0)#1,727 |
| 25. | Bellewood | 107.0 | 22.0(+85.0)#25 | 32.0(+75.0)#1,799 |
| 26. | Sturgis | 105.0 | 22.0(+83.0)#26 | 32.0(+73.0)#1,833 |
| 27. | Island | 100.0 | 22.0(+78.0)#27 | 32.0(+68.0)#1,950 |
| 28. | Lafayette | 100.0 | 22.0(+78.0)#28 | 32.0(+68.0)#1,964 |
| 29. | Rolling Hills | 99.0 | 22.0(+77.0)#29 | 32.0(+67.0)#1,997 |
| 30. | Crestview Hills | 96.0 | 22.0(+74.0)#30 | 32.0(+64.0)#2,055 |
| 31. | Clinton | 96.0 | 22.0(+74.0)#31 | 32.0(+64.0)#2,061 |
| 32. | Woodlawn | 95.0 | 22.0(+73.0)#32 | 32.0(+63.0)#2,098 |
| 33. | Druid Hills | 91.0 | 22.0(+69.0)#33 | 32.0(+59.0)#2,220 |
| 34. | Morgantown | 87.0 | 22.0(+65.0)#34 | 32.0(+55.0)#2,327 |
| 35. | Hickman | 85.0 | 22.0(+63.0)#35 | 32.0(+53.0)#2,395 |
| 36. | Norbourne Estates | 85.0 | 22.0(+63.0)#36 | 32.0(+53.0)#2,402 |
| 37. | Hodgenville | 84.0 | 22.0(+62.0)#37 | 32.0(+52.0)#2,415 |
| 38. | Glencoe | 83.0 | 22.0(+61.0)#38 | 32.0(+51.0)#2,466 |
| 39. | Spring Valley | 81.0 | 22.0(+59.0)#39 | 32.0(+49.0)#2,542 |
| 40. | Alexandria | 77.0 | 22.0(+55.0)#40 | 32.0(+45.0)#2,660 |
| 41. | Graymoor Devondale | 76.0 | 22.0(+54.0)#41 | 32.0(+44.0)#2,731 |
| 42. | Southgate | 75.0 | 22.0(+53.0)#42 | 32.0(+43.0)#2,772 |
| 43. | Ryland Heights | 75.0 | 22.0(+53.0)#43 | 32.0(+43.0)#2,786 |
| 44. | Fort Knox | 74.0 | 22.0(+52.0)#44 | 32.0(+42.0)#2,801 |
| 45. | Tompkinsville | 73.0 | 22.0(+51.0)#45 | 32.0(+41.0)#2,879 |
| 46. | Morganfield | 72.0 | 22.0(+50.0)#46 | 32.0(+40.0)#2,917 |
| 47. | Russell Springs | 71.0 | 22.0(+49.0)#47 | 32.0(+39.0)#2,964 |
| 48. | Bellefonte | 70.0 | 22.0(+48.0)#48 | 32.0(+38.0)#3,037 |
| 49. | Rolling Fields | 69.0 | 22.0(+47.0)#49 | 32.0(+37.0)#3,089 |
| 50. | Glenview Manor | 69.0 | 22.0(+47.0)#50 | 32.0(+37.0)#3,096 |
| 51. | Lebanon Junction | 68.0 | 22.0(+46.0)#51 | 32.0(+36.0)#3,121 |
| 52. | Indian Hills | 67.0 | 22.0(+45.0)#52 | 32.0(+35.0)#3,164 |
| 53. | North Corbin | 66.0 | 22.0(+44.0)#53 | 32.0(+34.0)#3,236 |
| 54. | Forest Hills | 65.0 | 22.0(+43.0)#54 | 32.0(+33.0)#3,311 |
| 55. | Newport | 64.0 | 22.0(+42.0)#55 | 32.0(+32.0)#3,331 |
| 56. | Eddyville | 64.0 | 22.0(+42.0)#56 | 32.0(+32.0)#3,347 |
| 57. | Mount Sterling | 63.0 | 22.0(+41.0)#57 | 32.0(+31.0)#3,388 |
| 58. | St Matthews | 61.0 | 22.0(+39.0)#58 | 32.0(+29.0)#3,509 |
| 59. | Bromley | 61.0 | 22.0(+39.0)#59 | 32.0(+29.0)#3,561 |
| 60. | Fort Thomas | 59.0 | 22.0(+37.0)#60 | 32.0(+27.0)#3,663 |
| 61. | Wellington | 59.0 | 22.0(+37.0)#61 | 32.0(+27.0)#3,712 |
| 62. | Edgewood | 58.0 | 22.0(+36.0)#62 | 32.0(+26.0)#3,746 |
| 63. | Guthrie | 58.0 | 22.0(+36.0)#63 | 32.0(+26.0)#3,772 |
| 64. | Buckner | 55.0 | 22.0(+33.0)#64 | 32.0(+23.0)#3,986 |
| 65. | Muldraugh | 55.0 | 22.0(+33.0)#65 | 32.0(+23.0)#4,005 |
| 66. | Paducah | 52.0 | 22.0(+30.0)#66 | 32.0(+20.0)#4,244 |
| 67. | Oakbrook | 52.0 | 22.0(+30.0)#67 | 32.0(+20.0)#4,263 |
| 68. | Hardin | 51.0 | 22.0(+29.0)#68 | 32.0(+19.0)#4,397 |
| 69. | Beechwood Village | 50.0 | 22.0(+28.0)#69 | 32.0(+18.0)#4,482 |
| 70. | Crestview | 50.0 | 22.0(+28.0)#70 | 32.0(+18.0)#4,495 |
| 71. | Burnside | 49.0 | 22.0(+27.0)#71 | 32.0(+17.0)#4,590 |
| 72. | Bellevue | 48.0 | 22.0(+26.0)#72 | 32.0(+16.0)#4,668 |
| 73. | Houston Acres | 48.0 | 22.0(+26.0)#73 | 32.0(+16.0)#4,699 |
| 74. | Greenville | 47.0 | 22.0(+25.0)#74 | 32.0(+15.0)#4,783 |
| 75. | Prospect | 45.0 | 22.0(+23.0)#75 | 32.0(+13.0)#4,983 |
| 76. | Upton | 45.0 | 22.0(+23.0)#76 | 32.0(+13.0)#5,027 |
| 77. | Oakland | 45.0 | 22.0(+23.0)#77 | 32.0(+13.0)#5,040 |
| 78. | Crittenden | 44.0 | 22.0(+22.0)#78 | 32.0(+12.0)#5,100 |
| 79. | Audubon Park | 43.0 | 22.0(+21.0)#79 | 32.0(+11.0)#5,243 |
| 80. | Bloomfield | 43.0 | 22.0(+21.0)#80 | 32.0(+11.0)#5,250 |
| 81. | Melbourne | 43.0 | 22.0(+21.0)#81 | 32.0(+11.0)#5,260 |
| 82. | Bancroft | 43.0 | 22.0(+21.0)#82 | 32.0(+11.0)#5,264 |
| 83. | Lakeview Heights | 43.0 | 22.0(+21.0)#83 | 32.0(+11.0)#5,268 |
| 84. | Frankfort | 41.0 | 22.0(+19.0)#84 | 32.0(+9.00)#5,413 |
| 85. | Burlington | 41.0 | 22.0(+19.0)#85 | 32.0(+9.00)#5,429 |
| 86. | Vine Grove | 41.0 | 22.0(+19.0)#86 | 32.0(+9.00)#5,459 |
| 87. | Coldstream | 41.0 | 22.0(+19.0)#87 | 32.0(+9.00)#5,492 |
| 88. | Fort Mitchell | 40.0 | 22.0(+18.0)#88 | 32.0(+8.00)#5,589 |
| 89. | Shepherdsville | 38.0 | 22.0(+16.0)#89 | 32.0(+6.00)#5,856 |
| 90. | Cynthiana | 38.0 | 22.0(+16.0)#90 | 32.0(+6.00)#5,894 |
| 91. | Bellemeade | 38.0 | 22.0(+16.0)#91 | 32.0(+6.00)#5,946 |
| 92. | Glenview | 38.0 | 22.0(+16.0)#92 | 32.0(+6.00)#5,958 |
| 93. | Westwood | 37.0 | 22.0(+15.0)#93 | 32.0(+5.00)#6,127 |
| 94. | Taylor Mill | 36.0 | 22.0(+14.0)#94 | 32.0(+4.00)#6,229 |
| 95. | Fort Wright | 36.0 | 22.0(+14.0)#95 | 32.0(+4.00)#6,234 |
| 96. | Wilder | 36.0 | 22.0(+14.0)#96 | 32.0(+4.00)#6,257 |
| 97. | Northfield | 36.0 | 22.0(+14.0)#97 | 32.0(+4.00)#6,289 |
| 98. | Science Hill | 36.0 | 22.0(+14.0)#98 | 32.0(+4.00)#6,295 |
| 99. | Hollow Creek | 36.0 | 22.0(+14.0)#99 | 32.0(+4.00)#6,296 |
| 100. | Marion | 35.0 | 22.0(+13.0)#100 | 32.0(+3.00)#6,407 |
Common Questions
What are the Top 10 Cities with the Most Births per 1,000 Women Over the Age of 35 in Kentucky?
Top 10 Cities with the Most Births per 1,000 Women Over the Age of 35 in Kentucky are:
#1
647.0
#2
440.0
#3
341.0
#4
333.0
#5
333.0
#6
290.0
#7
232.0
#8
222.0
#9
202.0
#10
179.0
What city has the Most Births per 1,000 Women Over the Age of 35 in Kentucky?
Poole has the Most Births per 1,000 Women Over the Age of 35 in Kentucky with 647.0.
What is the Number of Births per 1,000 Women Over the Age of 35 in the State of Kentucky?
Number of Births per 1,000 Women Over the Age of 35 in Kentucky is 22.0.
What is the Number of Births per 1,000 Women Over the Age of 35 in the United States?
Number of Births per 1,000 Women Over the Age of 35 in the United States is 32.0.