Cities with the Most Births per 1,000 Women Over the Age of 35 in Iowa
RELATED REPORTS & OPTIONS
Highest Birth Rate | Women 35+
Iowa
Compare Cities
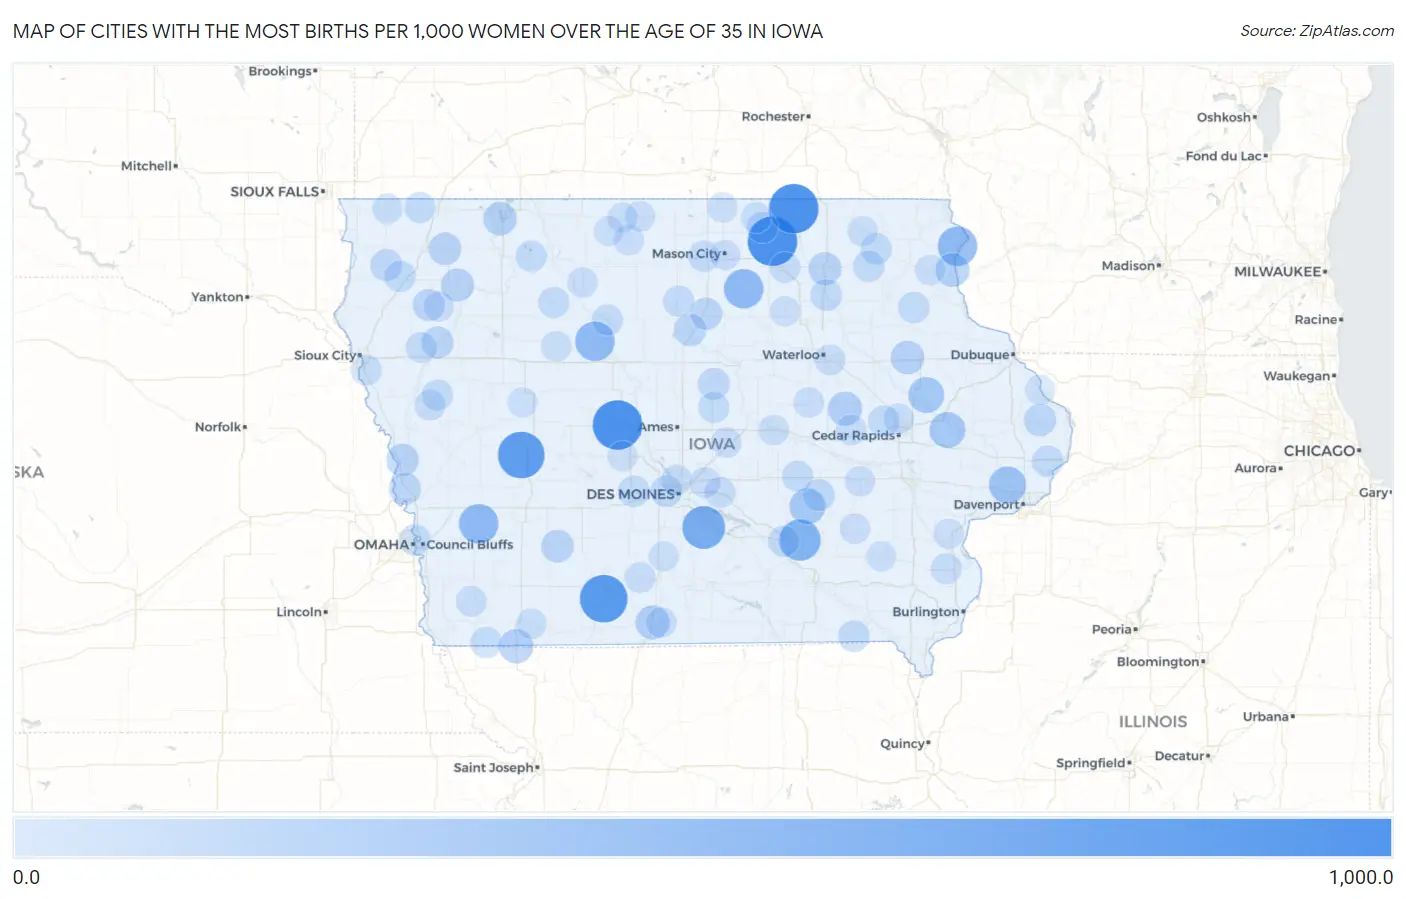
Map of Cities with the Most Births per 1,000 Women Over the Age of 35 in Iowa
0.0
1,000.0
Cities with the Most Births per 1,000 Women Over the Age of 35 in Iowa
| City | Births / 1,000 Women | vs State | vs National | |
| 1. | Swedesburg | 1,000.0 | 28.0(+972)#1 | 32.0(+968)#34 |
| 2. | Orchard | 1,000.0 | 28.0(+972)#2 | 32.0(+968)#39 |
| 3. | Mcintire | 1,000.0 | 28.0(+972)#3 | 32.0(+968)#41 |
| 4. | Beaver | 1,000.0 | 28.0(+972)#4 | 32.0(+968)#49 |
| 5. | Shannon City | 900.0 | 28.0(+872)#5 | 32.0(+868)#61 |
| 6. | Gray | 857.0 | 28.0(+829)#6 | 32.0(+825)#62 |
| 7. | Sandyville | 667.0 | 28.0(+639)#7 | 32.0(+635)#81 |
| 8. | Keomah Village | 600.0 | 28.0(+572)#8 | 32.0(+568)#101 |
| 9. | Hancock | 500.0 | 28.0(+472)#9 | 32.0(+468)#128 |
| 10. | Harpers Ferry | 500.0 | 28.0(+472)#10 | 32.0(+468)#130 |
| 11. | Clare | 500.0 | 28.0(+472)#11 | 32.0(+468)#137 |
| 12. | Dougherty | 500.0 | 28.0(+472)#12 | 32.0(+468)#147 |
| 13. | Maysville | 385.0 | 28.0(+357)#13 | 32.0(+353)#222 |
| 14. | Prairieburg | 333.0 | 28.0(+305)#14 | 32.0(+301)#290 |
| 15. | Barnes City | 333.0 | 28.0(+305)#15 | 32.0(+301)#297 |
| 16. | Morley | 333.0 | 28.0(+305)#16 | 32.0(+301)#303 |
| 17. | Garrison | 250.0 | 28.0(+222)#17 | 32.0(+218)#470 |
| 18. | Braddyville | 250.0 | 28.0(+222)#18 | 32.0(+218)#479 |
| 19. | Decatur City | 250.0 | 28.0(+222)#19 | 32.0(+218)#481 |
| 20. | Marquette | 241.0 | 28.0(+213)#20 | 32.0(+209)#508 |
| 21. | Masonville | 222.0 | 28.0(+194)#21 | 32.0(+190)#590 |
| 22. | Wahpeton | 217.0 | 28.0(+189)#22 | 32.0(+185)#605 |
| 23. | Calumet | 200.0 | 28.0(+172)#23 | 32.0(+168)#717 |
| 24. | New Hampton | 197.0 | 28.0(+169)#24 | 32.0(+165)#731 |
| 25. | Sanborn | 185.0 | 28.0(+157)#25 | 32.0(+153)#792 |
| 26. | Little Sioux | 182.0 | 28.0(+154)#26 | 32.0(+150)#818 |
| 27. | Bridgewater | 182.0 | 28.0(+154)#27 | 32.0(+150)#819 |
| 28. | Dows | 169.0 | 28.0(+141)#28 | 32.0(+137)#895 |
| 29. | Spragueville | 167.0 | 28.0(+139)#29 | 32.0(+135)#924 |
| 30. | Latimer | 161.0 | 28.0(+133)#30 | 32.0(+129)#964 |
| 31. | Modale | 154.0 | 28.0(+126)#31 | 32.0(+122)#1,029 |
| 32. | Washta | 154.0 | 28.0(+126)#32 | 32.0(+122)#1,032 |
| 33. | Marcus | 152.0 | 28.0(+124)#33 | 32.0(+120)#1,041 |
| 34. | Sioux Center | 147.0 | 28.0(+119)#34 | 32.0(+115)#1,103 |
| 35. | Deep River | 143.0 | 28.0(+115)#35 | 32.0(+111)#1,153 |
| 36. | Hubbard | 141.0 | 28.0(+113)#36 | 32.0(+109)#1,178 |
| 37. | Kent Estates | 138.0 | 28.0(+110)#37 | 32.0(+106)#1,211 |
| 38. | Frederika | 135.0 | 28.0(+107)#38 | 32.0(+103)#1,258 |
| 39. | Palo | 132.0 | 28.0(+104)#39 | 32.0(+100.0)#1,312 |
| 40. | Windsor Heights | 128.0 | 28.0(+100.0)#40 | 32.0(+96.0)#1,359 |
| 41. | Cantril | 125.0 | 28.0(+97.0)#41 | 32.0(+93.0)#1,424 |
| 42. | Low Moor | 125.0 | 28.0(+97.0)#42 | 32.0(+93.0)#1,425 |
| 43. | Orange City | 124.0 | 28.0(+96.0)#43 | 32.0(+92.0)#1,439 |
| 44. | Adel | 123.0 | 28.0(+95.0)#44 | 32.0(+91.0)#1,451 |
| 45. | Carter Lake | 121.0 | 28.0(+93.0)#45 | 32.0(+89.0)#1,476 |
| 46. | Beacon | 121.0 | 28.0(+93.0)#46 | 32.0(+89.0)#1,489 |
| 47. | Calmar | 120.0 | 28.0(+92.0)#47 | 32.0(+88.0)#1,501 |
| 48. | St Lucas | 120.0 | 28.0(+92.0)#48 | 32.0(+88.0)#1,505 |
| 49. | Ruthven | 118.0 | 28.0(+90.0)#49 | 32.0(+86.0)#1,529 |
| 50. | Volga | 118.0 | 28.0(+90.0)#50 | 32.0(+86.0)#1,537 |
| 51. | Northboro | 115.0 | 28.0(+87.0)#51 | 32.0(+83.0)#1,603 |
| 52. | Clear Lake | 112.0 | 28.0(+84.0)#52 | 32.0(+80.0)#1,648 |
| 53. | Little Rock | 111.0 | 28.0(+83.0)#53 | 32.0(+79.0)#1,682 |
| 54. | Havelock | 111.0 | 28.0(+83.0)#54 | 32.0(+79.0)#1,695 |
| 55. | Mitchell | 111.0 | 28.0(+83.0)#55 | 32.0(+79.0)#1,704 |
| 56. | Belmond | 108.0 | 28.0(+80.0)#56 | 32.0(+76.0)#1,752 |
| 57. | Pierson | 107.0 | 28.0(+79.0)#57 | 32.0(+75.0)#1,798 |
| 58. | Danbury | 105.0 | 28.0(+77.0)#58 | 32.0(+73.0)#1,839 |
| 59. | Malcom | 105.0 | 28.0(+77.0)#59 | 32.0(+73.0)#1,843 |
| 60. | Humboldt | 104.0 | 28.0(+76.0)#60 | 32.0(+72.0)#1,855 |
| 61. | Zearing | 104.0 | 28.0(+76.0)#61 | 32.0(+72.0)#1,867 |
| 62. | Charles City | 103.0 | 28.0(+75.0)#62 | 32.0(+71.0)#1,873 |
| 63. | Mapleton | 102.0 | 28.0(+74.0)#63 | 32.0(+70.0)#1,905 |
| 64. | Morning Sun | 101.0 | 28.0(+73.0)#64 | 32.0(+69.0)#1,929 |
| 65. | Saylorville | 98.0 | 28.0(+70.0)#65 | 32.0(+66.0)#2,009 |
| 66. | Sergeant Bluff | 97.0 | 28.0(+69.0)#66 | 32.0(+65.0)#2,023 |
| 67. | Prairie City | 97.0 | 28.0(+69.0)#67 | 32.0(+65.0)#2,036 |
| 68. | Murray | 96.0 | 28.0(+68.0)#68 | 32.0(+64.0)#2,067 |
| 69. | Evansdale | 94.0 | 28.0(+66.0)#69 | 32.0(+62.0)#2,108 |
| 70. | St Ansgar | 91.0 | 28.0(+63.0)#70 | 32.0(+59.0)#2,207 |
| 71. | Imogene | 91.0 | 28.0(+63.0)#71 | 32.0(+59.0)#2,227 |
| 72. | Van Horne | 90.0 | 28.0(+62.0)#72 | 32.0(+58.0)#2,244 |
| 73. | Titonka | 87.0 | 28.0(+59.0)#73 | 32.0(+55.0)#2,335 |
| 74. | Mitchellville | 86.0 | 28.0(+58.0)#74 | 32.0(+54.0)#2,365 |
| 75. | Leon | 86.0 | 28.0(+58.0)#75 | 32.0(+54.0)#2,368 |
| 76. | Monona | 84.0 | 28.0(+56.0)#76 | 32.0(+52.0)#2,421 |
| 77. | Cleghorn | 83.0 | 28.0(+55.0)#77 | 32.0(+51.0)#2,471 |
| 78. | Robins | 81.0 | 28.0(+53.0)#78 | 32.0(+49.0)#2,532 |
| 79. | Rhodes | 80.0 | 28.0(+52.0)#79 | 32.0(+48.0)#2,579 |
| 80. | Traer | 78.0 | 28.0(+50.0)#80 | 32.0(+46.0)#2,640 |
| 81. | Buffalo Center | 78.0 | 28.0(+50.0)#81 | 32.0(+46.0)#2,646 |
| 82. | Le Grand | 77.0 | 28.0(+49.0)#82 | 32.0(+45.0)#2,682 |
| 83. | Pomeroy | 77.0 | 28.0(+49.0)#83 | 32.0(+45.0)#2,688 |
| 84. | Harper | 77.0 | 28.0(+49.0)#84 | 32.0(+45.0)#2,703 |
| 85. | Mason City | 75.0 | 28.0(+47.0)#85 | 32.0(+43.0)#2,749 |
| 86. | West Bend | 74.0 | 28.0(+46.0)#86 | 32.0(+42.0)#2,827 |
| 87. | New Market | 74.0 | 28.0(+46.0)#87 | 32.0(+42.0)#2,836 |
| 88. | Ridgeway | 74.0 | 28.0(+46.0)#88 | 32.0(+42.0)#2,841 |
| 89. | Williamsburg | 73.0 | 28.0(+45.0)#89 | 32.0(+41.0)#2,875 |
| 90. | Rock Rapids | 73.0 | 28.0(+45.0)#90 | 32.0(+41.0)#2,880 |
| 91. | Perry | 71.0 | 28.0(+43.0)#91 | 32.0(+39.0)#2,945 |
| 92. | Letts | 71.0 | 28.0(+43.0)#92 | 32.0(+39.0)#2,999 |
| 93. | Lakota | 71.0 | 28.0(+43.0)#93 | 32.0(+39.0)#3,004 |
| 94. | Clarksville | 68.0 | 28.0(+40.0)#94 | 32.0(+36.0)#3,125 |
| 95. | Brighton | 67.0 | 28.0(+39.0)#95 | 32.0(+35.0)#3,184 |
| 96. | Bancroft | 67.0 | 28.0(+39.0)#96 | 32.0(+35.0)#3,187 |
| 97. | New Virginia | 67.0 | 28.0(+39.0)#97 | 32.0(+35.0)#3,191 |
| 98. | Breda | 67.0 | 28.0(+39.0)#98 | 32.0(+35.0)#3,194 |
| 99. | Northwood | 66.0 | 28.0(+38.0)#99 | 32.0(+34.0)#3,233 |
| 100. | Bellevue | 65.0 | 28.0(+37.0)#100 | 32.0(+33.0)#3,285 |
Common Questions
What are the Top 10 Cities with the Most Births per 1,000 Women Over the Age of 35 in Iowa?
Top 10 Cities with the Most Births per 1,000 Women Over the Age of 35 in Iowa are:
#1
1,000.0
#2
1,000.0
#3
1,000.0
#4
900.0
#5
857.0
#6
667.0
#7
600.0
#8
500.0
#9
500.0
#10
500.0
What city has the Most Births per 1,000 Women Over the Age of 35 in Iowa?
Orchard has the Most Births per 1,000 Women Over the Age of 35 in Iowa with 1,000.0.
What is the Number of Births per 1,000 Women Over the Age of 35 in the State of Iowa?
Number of Births per 1,000 Women Over the Age of 35 in Iowa is 28.0.
What is the Number of Births per 1,000 Women Over the Age of 35 in the United States?
Number of Births per 1,000 Women Over the Age of 35 in the United States is 32.0.