Cities with the Most Births per 1,000 Women Over the Age of 35 in Delaware

RELATED REPORTS & OPTIONS

Highest Birth Rate | Women 35+
Population
Families and Households
Female Fertility
Female Fertility (Unmarried)
Race (Community Size)
Race (Percentage)
Ancestry (Community Size)
AfghanAfricanAlaska NativeAlaskan AthabascanAlbanianAleutAlsatianAmericanApacheArabArapahoArgentineanArmenianAssyrian / Chaldean / SyriacAustralianAustrianBahamianBangladeshiBarbadianBasqueBelgianBelizeanBermudanBhutaneseBlackfeetBolivianBrazilianBritishBritish West IndianBulgarianBurmeseCajunCambodianCanadianCape VerdeanCarpatho RusynCelticCentral AmericanCentral American IndianCherokeeCheyenneChickasawChileanChineseChippewaChoctawColombianColvilleComancheCosta RicanCreeCreekCroatianCrowCubanCypriotCzechCzechoslovakianDanishDelawareDominicanDutchDutch West IndianEastern EuropeanEcuadorianEgyptianEnglishEstonianEthiopianEuropeanFijianFilipinoFinnishFrenchFrench American IndianFrench CanadianGermanGerman RussianGhanaianGreekGuamanian / ChamorroGuatemalanGuyaneseHaitianHmongHonduranHopiHoumaHungarianIcelanderIndian (Asian)IndonesianInupiatIranianIraqiIrishIroquoisIsraeliItalianJamaicanJapaneseJordanianKenyanKiowaKoreanLaotianLatvianLebaneseLiberianLithuanianLumbeeLuxembourgerMacedonianMalaysianMalteseMarshalleseMenomineeMexicanMexican American IndianMongolianMoroccanNative HawaiianNavajoNepaleseNew ZealanderNicaraguanNigerianNorthern EuropeanNorwegianOkinawanOsageOttawaPaiutePakistaniPalestinianPanamanianParaguayanPennsylvania GermanPeruvianPimaPolishPortuguesePotawatomiPuebloPuerto RicanPuget Sound SalishRomanianRussianSalvadoranSamoanScandinavianScotch-IrishScottishSeminoleSenegaleseSerbianShoshoneSierra LeoneanSiouxSlavicSlovakSloveneSomaliSouth AfricanSouth AmericanSouth American IndianSoviet UnionSpaniardSpanishSpanish AmericanSpanish American IndianSri LankanSubsaharan AfricanSudaneseSwedishSwissSyrianTaiwaneseThaiTlingit-HaidaTohono O'OdhamTonganTrinidadian and TobagonianTsimshianTurkishU.S. Virgin IslanderUgandanUkrainianUruguayanUteVenezuelanVietnameseWelshWest IndianYakamaYaquiYugoslavianYumanYup'ikZimbabwean
Ancestry (Percentage)
AfghanAfricanAlaska NativeAlaskan AthabascanAlbanianAleutAlsatianAmericanApacheArabArapahoArgentineanArmenianAssyrian / Chaldean / SyriacAustralianAustrianBahamianBangladeshiBarbadianBasqueBelgianBelizeanBermudanBhutaneseBlackfeetBolivianBrazilianBritishBritish West IndianBulgarianBurmeseCajunCambodianCanadianCape VerdeanCarpatho RusynCelticCentral AmericanCentral American IndianCherokeeCheyenneChickasawChileanChineseChippewaChoctawColombianColvilleComancheCosta RicanCreeCreekCroatianCrowCubanCypriotCzechCzechoslovakianDanishDelawareDominicanDutchDutch West IndianEastern EuropeanEcuadorianEgyptianEnglishEstonianEthiopianEuropeanFijianFilipinoFinnishFrenchFrench American IndianFrench CanadianGermanGerman RussianGhanaianGreekGuamanian / ChamorroGuatemalanGuyaneseHaitianHmongHonduranHopiHoumaHungarianIcelanderIndian (Asian)IndonesianInupiatIranianIraqiIrishIroquoisIsraeliItalianJamaicanJapaneseJordanianKenyanKiowaKoreanLaotianLatvianLebaneseLiberianLithuanianLumbeeLuxembourgerMacedonianMalaysianMalteseMarshalleseMenomineeMexicanMexican American IndianMongolianMoroccanNative HawaiianNavajoNepaleseNew ZealanderNicaraguanNigerianNorthern EuropeanNorwegianOkinawanOsageOttawaPaiutePakistaniPalestinianPanamanianParaguayanPennsylvania GermanPeruvianPimaPolishPortuguesePotawatomiPuebloPuerto RicanPuget Sound SalishRomanianRussianSalvadoranSamoanScandinavianScotch-IrishScottishSeminoleSenegaleseSerbianShoshoneSierra LeoneanSiouxSlavicSlovakSloveneSomaliSouth AfricanSouth AmericanSouth American IndianSoviet UnionSpaniardSpanishSpanish AmericanSpanish American IndianSri LankanSubsaharan AfricanSudaneseSwedishSwissSyrianTaiwaneseThaiTlingit-HaidaTohono O'OdhamTonganTrinidadian and TobagonianTsimshianTurkishU.S. Virgin IslanderUgandanUkrainianUruguayanUteVenezuelanVietnameseWelshWest IndianYakamaYaquiYugoslavianYumanYup'ikZimbabwean
Immigrant Origin (Total)
AfghanistanAfricaAlbaniaArgentinaArmeniaAsiaAustraliaAustriaAzoresBahamasBangladeshBarbadosBelarusBelgiumBelizeBoliviaBosnia and HerzegovinaBrazilBulgariaBurma / MyanmarCabo VerdeCambodiaCameroonCanadaCaribbeanCentral AmericaChileChinaColombiaCongoCosta RicaCroatiaCubaCzechoslovakiaDenmarkDominicaDominican RepublicEastern AfricaEastern AsiaEastern EuropeEcuadorEgyptEl SalvadorEnglandEritreaEthiopiaEuropeFijiFranceGermanyGhanaGreeceGrenadaGuatemalaGuyanaHaitiHondurasHong KongHungaryIndiaIndonesiaIranIraqIrelandIsraelItalyJamaicaJapanJordanKazakhstanKenyaKoreaKuwaitLaosLatin AmericaLatviaLebanonLiberiaLithuaniaMalaysiaMexicoMicronesiaMiddle AfricaMoldovaMoroccoNepalNetherlandsNicaraguaNigeriaNorth MacedoniaNorthern AfricaNorthern EuropeNorwayOceaniaPakistanPanamaPeruPhilippinesPolandPortugalRomaniaRussiaSaudi ArabiaScotlandSenegalSerbiaSierra LeoneSingaporeSomaliaSouth AfricaSouth AmericaSouth Central AsiaSouth Eastern AsiaSouthern EuropeSpainSri LankaSt. Vincent and the GrenadinesSudanSwedenSwitzerlandSyriaTaiwanThailandTrinidad and TobagoTurkeyUgandaUkraineUruguayUzbekistanVenezuelaVietnamWest IndiesWestern AfricaWestern AsiaWestern EuropeYemenZaireZimbabwe
Immigrant Origin (Percentage)
AfghanistanAfricaAlbaniaArgentinaArmeniaAsiaAustraliaAustriaAzoresBahamasBangladeshBarbadosBelarusBelgiumBelizeBoliviaBosnia and HerzegovinaBrazilBulgariaBurma / MyanmarCabo VerdeCambodiaCameroonCanadaCaribbeanCentral AmericaChileChinaColombiaCongoCosta RicaCroatiaCubaCzechoslovakiaDenmarkDominicaDominican RepublicEastern AfricaEastern AsiaEastern EuropeEcuadorEgyptEl SalvadorEnglandEritreaEthiopiaEuropeFijiFranceGermanyGhanaGreeceGrenadaGuatemalaGuyanaHaitiHondurasHong KongHungaryIndiaIndonesiaIranIraqIrelandIsraelItalyJamaicaJapanJordanKazakhstanKenyaKoreaKuwaitLaosLatin AmericaLatviaLebanonLiberiaLithuaniaMalaysiaMexicoMicronesiaMiddle AfricaMoldovaMoroccoNepalNetherlandsNicaraguaNigeriaNorth MacedoniaNorthern AfricaNorthern EuropeNorwayOceaniaPakistanPanamaPeruPhilippinesPolandPortugalRomaniaRussiaSaudi ArabiaScotlandSenegalSerbiaSierra LeoneSingaporeSomaliaSouth AfricaSouth AmericaSouth Central AsiaSouth Eastern AsiaSouthern EuropeSpainSri LankaSt. Vincent and the GrenadinesSudanSwedenSwitzerlandSyriaTaiwanThailandTrinidad and TobagoTurkeyUgandaUkraineUruguayUzbekistanVenezuelaVietnamWest IndiesWestern AfricaWestern AsiaWestern EuropeYemenZaireZimbabwe
Income
Income (Families)
Income (Households)
Poverty
Poverty (Families)
Unemployment
Employment Occupations
Employment Industries
Employer Class
Commute Time
Commute Means
School Enrollment
Education by Degree Field
Occupancy
Finances
Physical Characteristics
Delaware
Compare Cities
Comparison Subject

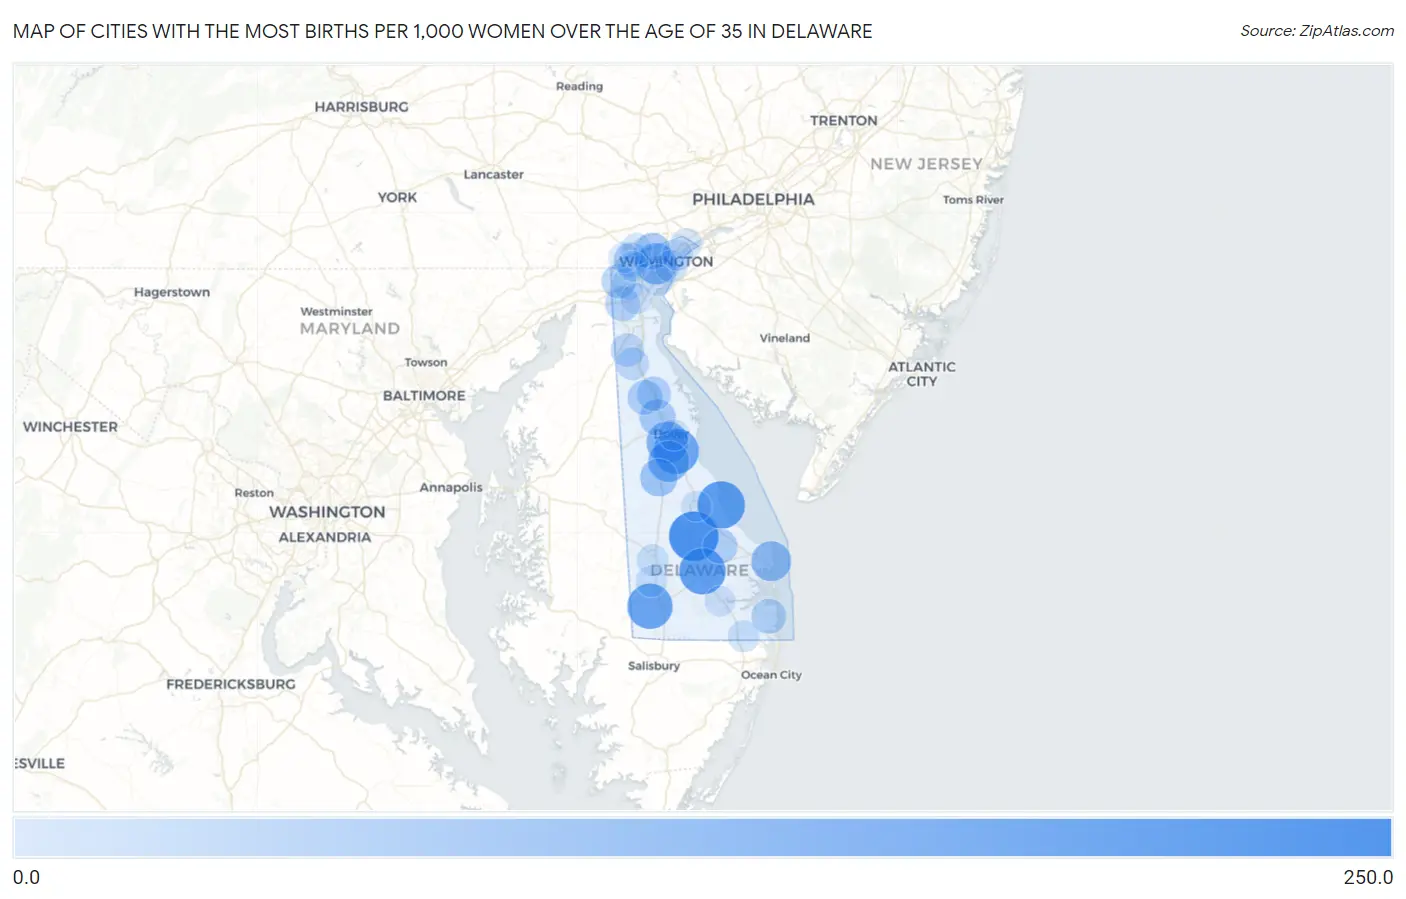
Map of Cities with the Most Births per 1,000 Women Over the Age of 35 in Delaware

0.0
250.0
Cities with the Most Births per 1,000 Women Over the Age of 35 in Delaware Map

Cities with the Most Births per 1,000 Women Over the Age of 35 in Delaware

City Births / 1,000 Women vs State vs National
1.Ellendale250.030.0(+220)#132.0(+218)#465
2.Slaughter Beach222.030.0(+192)#232.0(+190)#578
3.Georgetown208.030.0(+178)#332.0(+176)#653
4.Rising Sun Lebanon194.030.0(+164)#432.0(+162)#741
5.Bethel194.030.0(+164)#532.0(+162)#744
6.Rodney Village150.030.0(+120)#632.0(+118)#1,062
7.Elsmere143.030.0(+113)#732.0(+111)#1,134
8.Woodside East140.030.0(+110)#832.0(+108)#1,183
9.Henlopen Acres125.030.0(+95.0)#932.0(+93.0)#1,430
10.Felton96.030.0(+66.0)#1032.0(+64.0)#2,062
11.Greenville84.030.0(+54.0)#1132.0(+52.0)#2,417
12.Cheswold78.030.0(+48.0)#1232.0(+46.0)#2,638
13.Clayton62.030.0(+32.0)#1332.0(+30.0)#3,483
14.Pike Creek59.030.0(+29.0)#1432.0(+27.0)#3,675
15.Milton59.030.0(+29.0)#1532.0(+27.0)#3,692
16.Ocean View59.030.0(+29.0)#1632.0(+27.0)#3,695
17.Glasgow56.030.0(+26.0)#1732.0(+24.0)#3,863
18.Smyrna54.030.0(+24.0)#1832.0(+22.0)#4,039
19.Newark53.030.0(+23.0)#1932.0(+21.0)#4,125
20.Middletown41.030.0(+11.0)#2032.0(+9.00)#5,422
21.Townsend35.030.0(+5.00)#2132.0(+3.00)#6,410
22.Wilmington28.030.0(-2.00)#2232.0(-4.00)#7,535
23.Brookside22.030.0(-8.00)#2332.0(-10.00)#8,659
24.Selbyville20.030.0(-10.00)#2432.0(-12.0)#9,058
25.Bridgeville18.030.0(-12.0)#2532.0(-14.0)#9,405
26.Hockessin17.030.0(-13.0)#2632.0(-15.0)#9,507
27.Seaford17.030.0(-13.0)#2732.0(-15.0)#9,533
28.Wilmington Manor16.030.0(-14.0)#2832.0(-16.0)#9,688
29.Dover12.030.0(-18.0)#2932.0(-20.0)#10,178
30.Bear12.030.0(-18.0)#3032.0(-20.0)#10,201
31.Claymont12.030.0(-18.0)#3132.0(-20.0)#10,237
32.Bellefonte12.030.0(-18.0)#3232.0(-20.0)#10,282
33.Milford9.030.0(-21.0)#3332.0(-23.0)#10,602
34.Millsboro9.030.0(-21.0)#3432.0(-23.0)#10,625
35.North Star8.030.0(-22.0)#3532.0(-24.0)#10,714
36.Pike Creek Valley6.030.0(-24.0)#3632.0(-26.0)#10,876

Common Questions

What are the Top 10 Cities with the Most Births per 1,000 Women Over the Age of 35 in Delaware?
Top 10 Cities with the Most Births per 1,000 Women Over the Age of 35 in Delaware are:
What city has the Most Births per 1,000 Women Over the Age of 35 in Delaware?
Ellendale has the Most Births per 1,000 Women Over the Age of 35 in Delaware with 250.0.
What is the Number of Births per 1,000 Women Over the Age of 35 in the State of Delaware?
Number of Births per 1,000 Women Over the Age of 35 in Delaware is 30.0.
What is the Number of Births per 1,000 Women Over the Age of 35 in the United States?
Number of Births per 1,000 Women Over the Age of 35 in the United States is 32.0.