Cities with the Most Births per 1,000 Women Over the Age of 35 in New Mexico
RELATED REPORTS & OPTIONS
Highest Birth Rate | Women 35+
New Mexico
Compare Cities
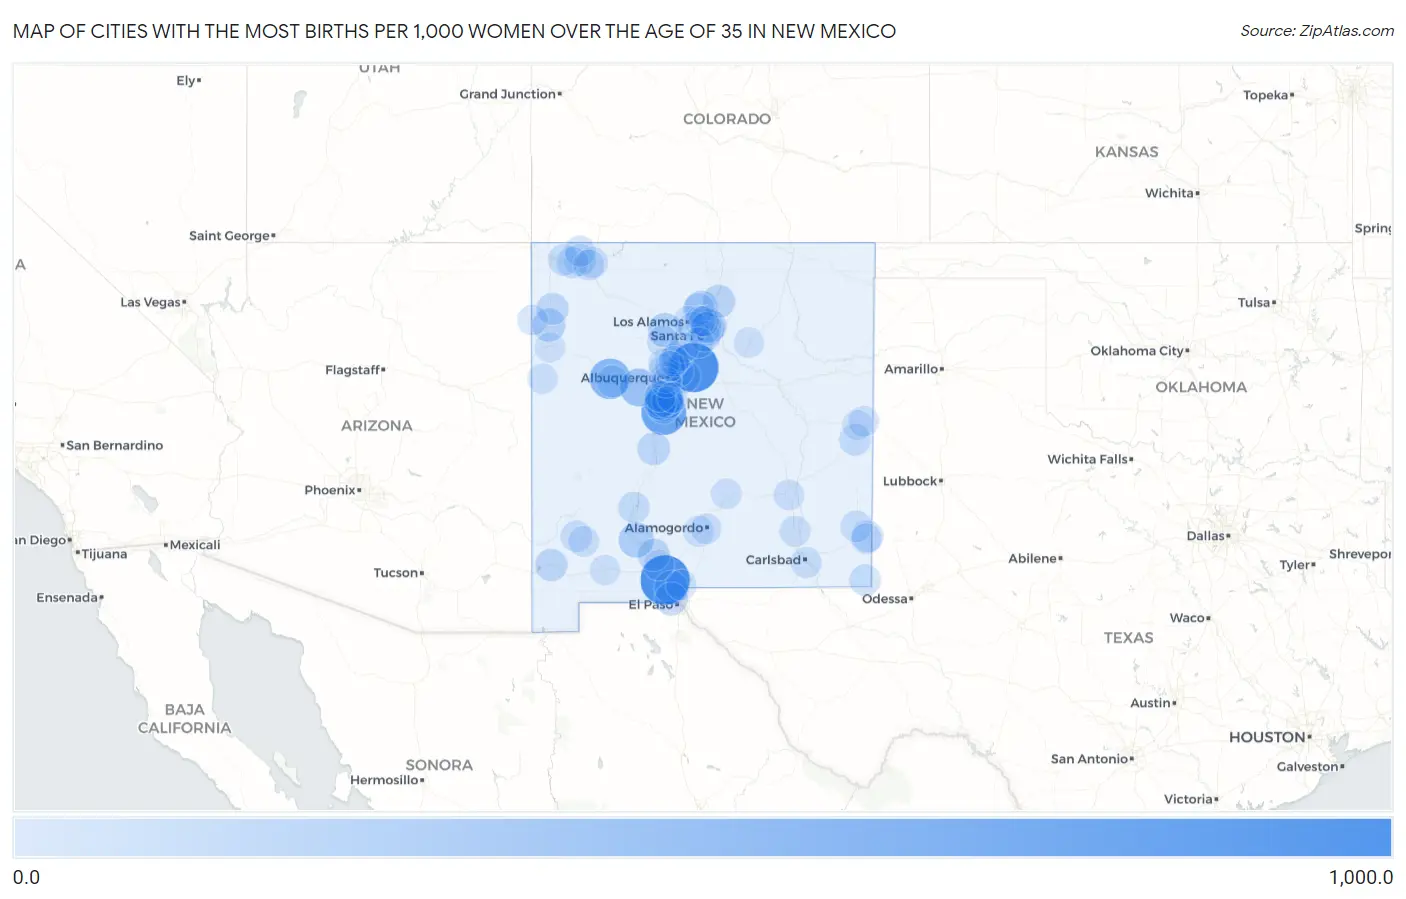
Map of Cities with the Most Births per 1,000 Women Over the Age of 35 in New Mexico
0.0
1,000.0
Cities with the Most Births per 1,000 Women Over the Age of 35 in New Mexico
| City | Births / 1,000 Women | vs State | vs National | |
| 1. | La Mesa | 1,000.0 | 31.0(+969)#1 | 32.0(+968)#3 |
| 2. | San Pedro | 1,000.0 | 31.0(+969)#2 | 32.0(+968)#17 |
| 3. | Madrone | 750.0 | 31.0(+719)#3 | 32.0(+718)#72 |
| 4. | Mccartys Village | 526.0 | 31.0(+495)#4 | 32.0(+494)#116 |
| 5. | Tome | 477.0 | 31.0(+446)#5 | 32.0(+445)#157 |
| 6. | Hyde Park | 418.0 | 31.0(+387)#6 | 32.0(+386)#206 |
| 7. | Highland Meadows | 375.0 | 31.0(+344)#7 | 32.0(+343)#228 |
| 8. | Rio Rancho Estates | 286.0 | 31.0(+255)#8 | 32.0(+254)#365 |
| 9. | San Jose Cdp Rio Arriba County | 263.0 | 31.0(+232)#9 | 32.0(+231)#431 |
| 10. | El Cerro | 249.0 | 31.0(+218)#10 | 32.0(+217)#490 |
| 11. | Crouch Mesa | 247.0 | 31.0(+216)#11 | 32.0(+215)#492 |
| 12. | Salem | 245.0 | 31.0(+214)#12 | 32.0(+213)#498 |
| 13. | Jemez Springs | 190.0 | 31.0(+159)#13 | 32.0(+158)#763 |
| 14. | Anthony | 182.0 | 31.0(+151)#14 | 32.0(+150)#805 |
| 15. | Peak Place | 171.0 | 31.0(+140)#15 | 32.0(+139)#883 |
| 16. | Alcalde | 160.0 | 31.0(+129)#16 | 32.0(+128)#979 |
| 17. | Chupadero | 156.0 | 31.0(+125)#17 | 32.0(+124)#1,008 |
| 18. | Cedar Crest | 150.0 | 31.0(+119)#18 | 32.0(+118)#1,063 |
| 19. | Tohatchi | 148.0 | 31.0(+117)#19 | 32.0(+116)#1,096 |
| 20. | Sunland Park | 146.0 | 31.0(+115)#20 | 32.0(+114)#1,113 |
| 21. | Chamisal | 138.0 | 31.0(+107)#21 | 32.0(+106)#1,218 |
| 22. | Socorro | 128.0 | 31.0(+97.0)#22 | 32.0(+96.0)#1,358 |
| 23. | El Cerro Mission | 115.0 | 31.0(+84.0)#23 | 32.0(+83.0)#1,585 |
| 24. | Rio Communities | 114.0 | 31.0(+83.0)#24 | 32.0(+82.0)#1,610 |
| 25. | Radium Springs | 108.0 | 31.0(+77.0)#25 | 32.0(+76.0)#1,758 |
| 26. | Lordsburg | 105.0 | 31.0(+74.0)#26 | 32.0(+73.0)#1,830 |
| 27. | Los Chaves | 103.0 | 31.0(+72.0)#27 | 32.0(+71.0)#1,876 |
| 28. | Sandia Heights | 94.0 | 31.0(+63.0)#28 | 32.0(+62.0)#2,114 |
| 29. | Naschitti | 94.0 | 31.0(+63.0)#29 | 32.0(+62.0)#2,127 |
| 30. | Skyline Ganipa | 89.0 | 31.0(+58.0)#30 | 32.0(+57.0)#2,261 |
| 31. | Paradise Hills | 85.0 | 31.0(+54.0)#31 | 32.0(+53.0)#2,384 |
| 32. | Las Maravillas | 81.0 | 31.0(+50.0)#32 | 32.0(+49.0)#2,535 |
| 33. | Sundance | 78.0 | 31.0(+47.0)#33 | 32.0(+46.0)#2,651 |
| 34. | Nambe | 75.0 | 31.0(+44.0)#34 | 32.0(+43.0)#2,777 |
| 35. | Belen | 73.0 | 31.0(+42.0)#35 | 32.0(+41.0)#2,862 |
| 36. | Portales | 67.0 | 31.0(+36.0)#36 | 32.0(+35.0)#3,148 |
| 37. | Truth Or Consequences | 66.0 | 31.0(+35.0)#37 | 32.0(+34.0)#3,224 |
| 38. | North Hobbs | 65.0 | 31.0(+34.0)#38 | 32.0(+33.0)#3,271 |
| 39. | Farmington | 63.0 | 31.0(+32.0)#39 | 32.0(+31.0)#3,369 |
| 40. | Lovington | 63.0 | 31.0(+32.0)#40 | 32.0(+31.0)#3,381 |
| 41. | Kirtland Afb | 63.0 | 31.0(+32.0)#41 | 32.0(+31.0)#3,403 |
| 42. | Jal | 58.0 | 31.0(+27.0)#42 | 32.0(+26.0)#3,766 |
| 43. | Placitas Cdp Sandoval County | 56.0 | 31.0(+25.0)#43 | 32.0(+24.0)#3,885 |
| 44. | Chamita | 55.0 | 31.0(+24.0)#44 | 32.0(+23.0)#4,011 |
| 45. | Upper Fruitland | 54.0 | 31.0(+23.0)#45 | 32.0(+22.0)#4,086 |
| 46. | Silver City | 53.0 | 31.0(+22.0)#46 | 32.0(+21.0)#4,153 |
| 47. | Waterflow | 51.0 | 31.0(+20.0)#47 | 32.0(+19.0)#4,383 |
| 48. | Los Lunas | 49.0 | 31.0(+18.0)#48 | 32.0(+17.0)#4,526 |
| 49. | Pena Blanca | 47.0 | 31.0(+16.0)#49 | 32.0(+15.0)#4,819 |
| 50. | Jemez Pueblo | 45.0 | 31.0(+14.0)#50 | 32.0(+13.0)#5,002 |
| 51. | Santa Ana Pueblo | 44.0 | 31.0(+13.0)#51 | 32.0(+12.0)#5,127 |
| 52. | White Rock | 41.0 | 31.0(+10.00)#52 | 32.0(+9.00)#5,461 |
| 53. | Bloomfield | 37.0 | 31.0(+6.00)#53 | 32.0(+5.00)#6,063 |
| 54. | La Plata | 37.0 | 31.0(+6.00)#54 | 32.0(+5.00)#6,098 |
| 55. | Ojo Encino | 37.0 | 31.0(+6.00)#55 | 32.0(+5.00)#6,129 |
| 56. | Albuquerque | 36.0 | 31.0(+5.00)#56 | 32.0(+4.00)#6,140 |
| 57. | West Hammond | 36.0 | 31.0(+5.00)#57 | 32.0(+4.00)#6,267 |
| 58. | Algodones | 34.0 | 31.0(+3.00)#58 | 32.0(+2.00)#6,593 |
| 59. | Santa Fe | 33.0 | 31.0(+2.00)#59 | 32.0(+1.000)#6,626 |
| 60. | Carlsbad | 33.0 | 31.0(+2.00)#60 | 32.0(+1.000)#6,651 |
| 61. | Artesia | 33.0 | 31.0(+2.00)#61 | 32.0(+1.000)#6,680 |
| 62. | Hurley | 30.0 | 31.0(-1.000)#62 | 32.0(-2.00)#7,305 |
| 63. | Las Cruces | 29.0 | 31.0(-2.00)#63 | 32.0(-3.00)#7,348 |
| 64. | Holloman Afb | 29.0 | 31.0(-2.00)#64 | 32.0(-3.00)#7,440 |
| 65. | Hobbs | 28.0 | 31.0(-3.00)#65 | 32.0(-4.00)#7,549 |
| 66. | Los Alamos | 28.0 | 31.0(-3.00)#66 | 32.0(-4.00)#7,598 |
| 67. | Rio Rancho | 26.0 | 31.0(-5.00)#67 | 32.0(-6.00)#7,893 |
| 68. | Tesuque Pueblo | 25.0 | 31.0(-6.00)#68 | 32.0(-7.00)#8,221 |
| 69. | Chaparral | 22.0 | 31.0(-9.00)#69 | 32.0(-10.00)#8,656 |
| 70. | Ruidoso | 21.0 | 31.0(-10.00)#70 | 32.0(-11.0)#8,864 |
| 71. | Santo Domingo Pueblo | 21.0 | 31.0(-10.00)#71 | 32.0(-11.0)#8,907 |
| 72. | Navajo | 20.0 | 31.0(-11.0)#72 | 32.0(-12.0)#9,071 |
| 73. | El Rancho | 19.0 | 31.0(-12.0)#73 | 32.0(-13.0)#9,252 |
| 74. | Alamogordo | 18.0 | 31.0(-13.0)#74 | 32.0(-14.0)#9,305 |
| 75. | Clovis | 17.0 | 31.0(-14.0)#75 | 32.0(-15.0)#9,469 |
| 76. | Roswell | 16.0 | 31.0(-15.0)#76 | 32.0(-16.0)#9,633 |
| 77. | South Valley | 16.0 | 31.0(-15.0)#77 | 32.0(-16.0)#9,636 |
| 78. | Espanola | 15.0 | 31.0(-16.0)#78 | 32.0(-17.0)#9,818 |
| 79. | Meadow Lake | 15.0 | 31.0(-16.0)#79 | 32.0(-17.0)#9,850 |
| 80. | Las Vegas | 14.0 | 31.0(-17.0)#80 | 32.0(-18.0)#9,947 |
| 81. | Zuni Pueblo | 14.0 | 31.0(-17.0)#81 | 32.0(-18.0)#9,977 |
| 82. | Cannon Afb | 13.0 | 31.0(-18.0)#82 | 32.0(-19.0)#10,141 |
| 83. | La Cienega | 12.0 | 31.0(-19.0)#83 | 32.0(-20.0)#10,266 |
| 84. | Bernalillo | 11.0 | 31.0(-20.0)#84 | 32.0(-21.0)#10,356 |
| 85. | Deming | 10.0 | 31.0(-21.0)#85 | 32.0(-22.0)#10,470 |
| 86. | Corrales | 10.0 | 31.0(-21.0)#86 | 32.0(-22.0)#10,510 |
| 87. | Pojoaque | 8.0 | 31.0(-23.0)#87 | 32.0(-24.0)#10,734 |
| 88. | Gallup | 6.0 | 31.0(-25.0)#88 | 32.0(-26.0)#10,849 |
1
2Common Questions
What are the Top 10 Cities with the Most Births per 1,000 Women Over the Age of 35 in New Mexico?
Top 10 Cities with the Most Births per 1,000 Women Over the Age of 35 in New Mexico are:
#1
1,000.0
#2
1,000.0
#3
750.0
#4
526.0
#5
477.0
#6
375.0
#7
249.0
#8
245.0
#9
190.0
#10
182.0
What city has the Most Births per 1,000 Women Over the Age of 35 in New Mexico?
La Mesa has the Most Births per 1,000 Women Over the Age of 35 in New Mexico with 1,000.0.
What is the Number of Births per 1,000 Women Over the Age of 35 in the State of New Mexico?
Number of Births per 1,000 Women Over the Age of 35 in New Mexico is 31.0.
What is the Number of Births per 1,000 Women Over the Age of 35 in the United States?
Number of Births per 1,000 Women Over the Age of 35 in the United States is 32.0.