Cities with the Most Births per 1,000 Women Over the Age of 35 in Wyoming

RELATED REPORTS & OPTIONS

Highest Birth Rate | Women 35+
Population
Families and Households
Female Fertility
Female Fertility (Unmarried)
Race (Community Size)
Race (Percentage)
Ancestry (Community Size)
AfghanAfricanAlaska NativeAlaskan AthabascanAlbanianAleutAlsatianAmericanApacheArabArapahoArgentineanArmenianAssyrian / Chaldean / SyriacAustralianAustrianBahamianBangladeshiBarbadianBasqueBelgianBelizeanBermudanBhutaneseBlackfeetBolivianBrazilianBritishBritish West IndianBulgarianBurmeseCajunCambodianCanadianCape VerdeanCarpatho RusynCelticCentral AmericanCentral American IndianCherokeeCheyenneChickasawChileanChineseChippewaChoctawColombianColvilleComancheCosta RicanCreeCreekCroatianCrowCubanCypriotCzechCzechoslovakianDanishDelawareDominicanDutchDutch West IndianEastern EuropeanEcuadorianEgyptianEnglishEstonianEthiopianEuropeanFijianFilipinoFinnishFrenchFrench American IndianFrench CanadianGermanGerman RussianGhanaianGreekGuamanian / ChamorroGuatemalanGuyaneseHaitianHmongHonduranHopiHoumaHungarianIcelanderIndian (Asian)IndonesianInupiatIranianIraqiIrishIroquoisIsraeliItalianJamaicanJapaneseJordanianKenyanKiowaKoreanLaotianLatvianLebaneseLiberianLithuanianLumbeeLuxembourgerMacedonianMalaysianMalteseMarshalleseMenomineeMexicanMexican American IndianMongolianMoroccanNative HawaiianNavajoNepaleseNew ZealanderNicaraguanNigerianNorthern EuropeanNorwegianOkinawanOsageOttawaPaiutePakistaniPalestinianPanamanianParaguayanPennsylvania GermanPeruvianPimaPolishPortuguesePotawatomiPuebloPuerto RicanPuget Sound SalishRomanianRussianSalvadoranSamoanScandinavianScotch-IrishScottishSeminoleSenegaleseSerbianShoshoneSierra LeoneanSiouxSlavicSlovakSloveneSomaliSouth AfricanSouth AmericanSouth American IndianSoviet UnionSpaniardSpanishSpanish AmericanSpanish American IndianSri LankanSubsaharan AfricanSudaneseSwedishSwissSyrianTaiwaneseThaiTlingit-HaidaTohono O'OdhamTonganTrinidadian and TobagonianTsimshianTurkishU.S. Virgin IslanderUgandanUkrainianUruguayanUteVenezuelanVietnameseWelshWest IndianYakamaYaquiYugoslavianYumanYup'ikZimbabwean
Ancestry (Percentage)
AfghanAfricanAlaska NativeAlaskan AthabascanAlbanianAleutAlsatianAmericanApacheArabArapahoArgentineanArmenianAssyrian / Chaldean / SyriacAustralianAustrianBahamianBangladeshiBarbadianBasqueBelgianBelizeanBermudanBhutaneseBlackfeetBolivianBrazilianBritishBritish West IndianBulgarianBurmeseCajunCambodianCanadianCape VerdeanCarpatho RusynCelticCentral AmericanCentral American IndianCherokeeCheyenneChickasawChileanChineseChippewaChoctawColombianColvilleComancheCosta RicanCreeCreekCroatianCrowCubanCypriotCzechCzechoslovakianDanishDelawareDominicanDutchDutch West IndianEastern EuropeanEcuadorianEgyptianEnglishEstonianEthiopianEuropeanFijianFilipinoFinnishFrenchFrench American IndianFrench CanadianGermanGerman RussianGhanaianGreekGuamanian / ChamorroGuatemalanGuyaneseHaitianHmongHonduranHopiHoumaHungarianIcelanderIndian (Asian)IndonesianInupiatIranianIraqiIrishIroquoisIsraeliItalianJamaicanJapaneseJordanianKenyanKiowaKoreanLaotianLatvianLebaneseLiberianLithuanianLumbeeLuxembourgerMacedonianMalaysianMalteseMarshalleseMenomineeMexicanMexican American IndianMongolianMoroccanNative HawaiianNavajoNepaleseNew ZealanderNicaraguanNigerianNorthern EuropeanNorwegianOkinawanOsageOttawaPaiutePakistaniPalestinianPanamanianParaguayanPennsylvania GermanPeruvianPimaPolishPortuguesePotawatomiPuebloPuerto RicanPuget Sound SalishRomanianRussianSalvadoranSamoanScandinavianScotch-IrishScottishSeminoleSenegaleseSerbianShoshoneSierra LeoneanSiouxSlavicSlovakSloveneSomaliSouth AfricanSouth AmericanSouth American IndianSoviet UnionSpaniardSpanishSpanish AmericanSpanish American IndianSri LankanSubsaharan AfricanSudaneseSwedishSwissSyrianTaiwaneseThaiTlingit-HaidaTohono O'OdhamTonganTrinidadian and TobagonianTsimshianTurkishU.S. Virgin IslanderUgandanUkrainianUruguayanUteVenezuelanVietnameseWelshWest IndianYakamaYaquiYugoslavianYumanYup'ikZimbabwean
Immigrant Origin (Total)
AfghanistanAfricaAlbaniaArgentinaArmeniaAsiaAustraliaAustriaAzoresBahamasBangladeshBarbadosBelarusBelgiumBelizeBoliviaBosnia and HerzegovinaBrazilBulgariaBurma / MyanmarCabo VerdeCambodiaCameroonCanadaCaribbeanCentral AmericaChileChinaColombiaCongoCosta RicaCroatiaCubaCzechoslovakiaDenmarkDominicaDominican RepublicEastern AfricaEastern AsiaEastern EuropeEcuadorEgyptEl SalvadorEnglandEritreaEthiopiaEuropeFijiFranceGermanyGhanaGreeceGrenadaGuatemalaGuyanaHaitiHondurasHong KongHungaryIndiaIndonesiaIranIraqIrelandIsraelItalyJamaicaJapanJordanKazakhstanKenyaKoreaKuwaitLaosLatin AmericaLatviaLebanonLiberiaLithuaniaMalaysiaMexicoMicronesiaMiddle AfricaMoldovaMoroccoNepalNetherlandsNicaraguaNigeriaNorth MacedoniaNorthern AfricaNorthern EuropeNorwayOceaniaPakistanPanamaPeruPhilippinesPolandPortugalRomaniaRussiaSaudi ArabiaScotlandSenegalSerbiaSierra LeoneSingaporeSomaliaSouth AfricaSouth AmericaSouth Central AsiaSouth Eastern AsiaSouthern EuropeSpainSri LankaSt. Vincent and the GrenadinesSudanSwedenSwitzerlandSyriaTaiwanThailandTrinidad and TobagoTurkeyUgandaUkraineUruguayUzbekistanVenezuelaVietnamWest IndiesWestern AfricaWestern AsiaWestern EuropeYemenZaireZimbabwe
Immigrant Origin (Percentage)
AfghanistanAfricaAlbaniaArgentinaArmeniaAsiaAustraliaAustriaAzoresBahamasBangladeshBarbadosBelarusBelgiumBelizeBoliviaBosnia and HerzegovinaBrazilBulgariaBurma / MyanmarCabo VerdeCambodiaCameroonCanadaCaribbeanCentral AmericaChileChinaColombiaCongoCosta RicaCroatiaCubaCzechoslovakiaDenmarkDominicaDominican RepublicEastern AfricaEastern AsiaEastern EuropeEcuadorEgyptEl SalvadorEnglandEritreaEthiopiaEuropeFijiFranceGermanyGhanaGreeceGrenadaGuatemalaGuyanaHaitiHondurasHong KongHungaryIndiaIndonesiaIranIraqIrelandIsraelItalyJamaicaJapanJordanKazakhstanKenyaKoreaKuwaitLaosLatin AmericaLatviaLebanonLiberiaLithuaniaMalaysiaMexicoMicronesiaMiddle AfricaMoldovaMoroccoNepalNetherlandsNicaraguaNigeriaNorth MacedoniaNorthern AfricaNorthern EuropeNorwayOceaniaPakistanPanamaPeruPhilippinesPolandPortugalRomaniaRussiaSaudi ArabiaScotlandSenegalSerbiaSierra LeoneSingaporeSomaliaSouth AfricaSouth AmericaSouth Central AsiaSouth Eastern AsiaSouthern EuropeSpainSri LankaSt. Vincent and the GrenadinesSudanSwedenSwitzerlandSyriaTaiwanThailandTrinidad and TobagoTurkeyUgandaUkraineUruguayUzbekistanVenezuelaVietnamWest IndiesWestern AfricaWestern AsiaWestern EuropeYemenZaireZimbabwe
Income
Income (Families)
Income (Households)
Poverty
Poverty (Families)
Unemployment
Employment Occupations
Employment Industries
Employer Class
Commute Time
Commute Means
School Enrollment
Education by Degree Field
Occupancy
Finances
Physical Characteristics
Wyoming
Compare Cities
Comparison Subject

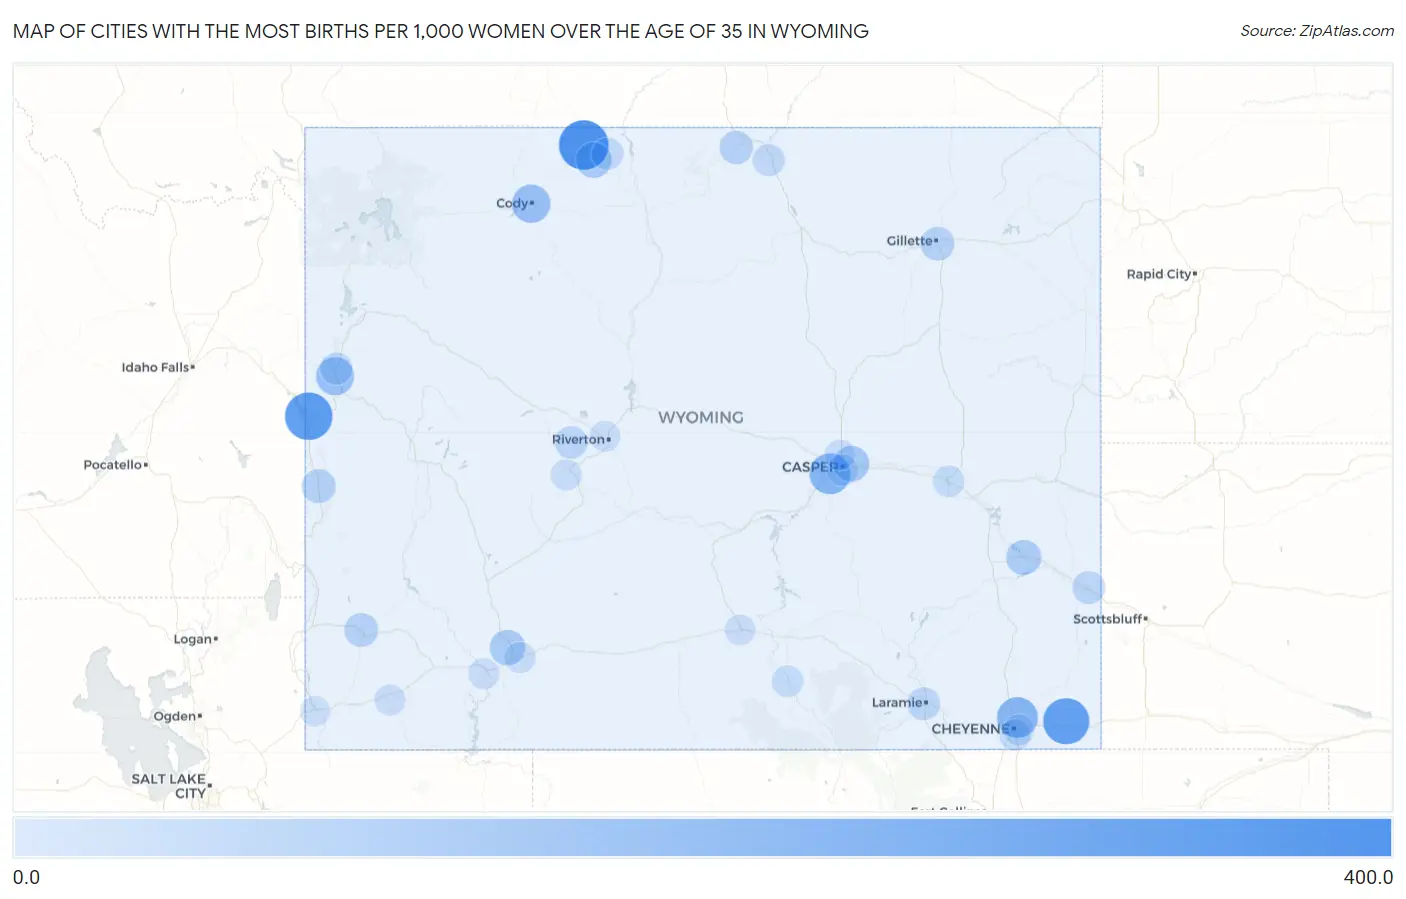
Map of Cities with the Most Births per 1,000 Women Over the Age of 35 in Wyoming

0.0
400.0
Cities with the Most Births per 1,000 Women Over the Age of 35 in Wyoming Map

Cities with the Most Births per 1,000 Women Over the Age of 35 in Wyoming

City Births / 1,000 Women vs State vs National
1.Deaver333.027.0(+306)#132.0(+301)#292
2.Alpine296.027.0(+269)#232.0(+264)#348
3.La Grange278.027.0(+251)#332.0(+246)#383
4.Burns273.027.0(+246)#432.0(+241)#398
5.Red Butte182.027.0(+155)#532.0(+150)#809
6.Ranchettes179.027.0(+152)#632.0(+147)#828
7.Cody137.027.0(+110)#732.0(+105)#1,220
8.Rafter J Ranch133.027.0(+106)#832.0(+101)#1,285
9.Evansville96.027.0(+69.0)#932.0(+64.0)#2,057
10.Byron93.027.0(+66.0)#1032.0(+61.0)#2,157
11.North Rock Springs88.027.0(+61.0)#1132.0(+56.0)#2,292
12.Guernsey82.027.0(+55.0)#1232.0(+50.0)#2,507
13.Afton62.027.0(+35.0)#1332.0(+30.0)#3,490
14.Gillette59.027.0(+32.0)#1432.0(+27.0)#3,655
15.Kemmerer59.027.0(+32.0)#1532.0(+27.0)#3,696
16.Dayton55.027.0(+28.0)#1632.0(+23.0)#4,009
17.Torrington44.027.0(+17.0)#1732.0(+12.0)#5,093
18.Laramie43.027.0(+16.0)#1832.0(+11.0)#5,169
19.Ethete38.027.0(+11.0)#1932.0(+6.00)#5,932
20.Jackson36.027.0(+9.00)#2032.0(+4.00)#6,215
21.Sheridan33.027.0(+6.00)#2132.0(+1.000)#6,671
22.Lovell32.027.0(+5.00)#2232.0(=0.000)#6,933
23.Douglas23.027.0(-4.00)#2332.0(-9.00)#8,504
24.South Greeley22.027.0(-5.00)#2432.0(-10.00)#8,704
25.Saratoga22.027.0(-5.00)#2532.0(-10.00)#8,736
26.Casper21.027.0(-6.00)#2632.0(-11.0)#8,784
27.Cheyenne14.027.0(-13.0)#2732.0(-18.0)#9,900
28.Rock Springs14.027.0(-13.0)#2832.0(-18.0)#9,924
29.Lander14.027.0(-13.0)#2932.0(-18.0)#9,973
30.Lyman13.027.0(-14.0)#3032.0(-19.0)#10,151
31.Green River11.027.0(-16.0)#3132.0(-21.0)#10,337
32.Bar Nunn10.027.0(-17.0)#3232.0(-22.0)#10,538
33.Riverton9.027.0(-18.0)#3332.0(-23.0)#10,605
34.Rawlins8.027.0(-19.0)#3432.0(-24.0)#10,715
35.Evanston5.027.0(-22.0)#3532.0(-27.0)#10,936

Common Questions

What are the Top 10 Cities with the Most Births per 1,000 Women Over the Age of 35 in Wyoming?
Top 10 Cities with the Most Births per 1,000 Women Over the Age of 35 in Wyoming are:
#1
333.0
#2
296.0
#3
273.0
#4
182.0
#5
179.0
#6
137.0
#7
133.0
#8
96.0
#9
93.0
#10
88.0
What city has the Most Births per 1,000 Women Over the Age of 35 in Wyoming?
Deaver has the Most Births per 1,000 Women Over the Age of 35 in Wyoming with 333.0.
What is the Number of Births per 1,000 Women Over the Age of 35 in the State of Wyoming?
Number of Births per 1,000 Women Over the Age of 35 in Wyoming is 27.0.
What is the Number of Births per 1,000 Women Over the Age of 35 in the United States?
Number of Births per 1,000 Women Over the Age of 35 in the United States is 32.0.