Cities with the Most Births per 1,000 Women Over the Age of 35 in Louisiana
RELATED REPORTS & OPTIONS
Highest Birth Rate | Women 35+
Louisiana
Compare Cities
Map of Cities with the Most Births per 1,000 Women Over the Age of 35 in Louisiana
0.0
1,000.0
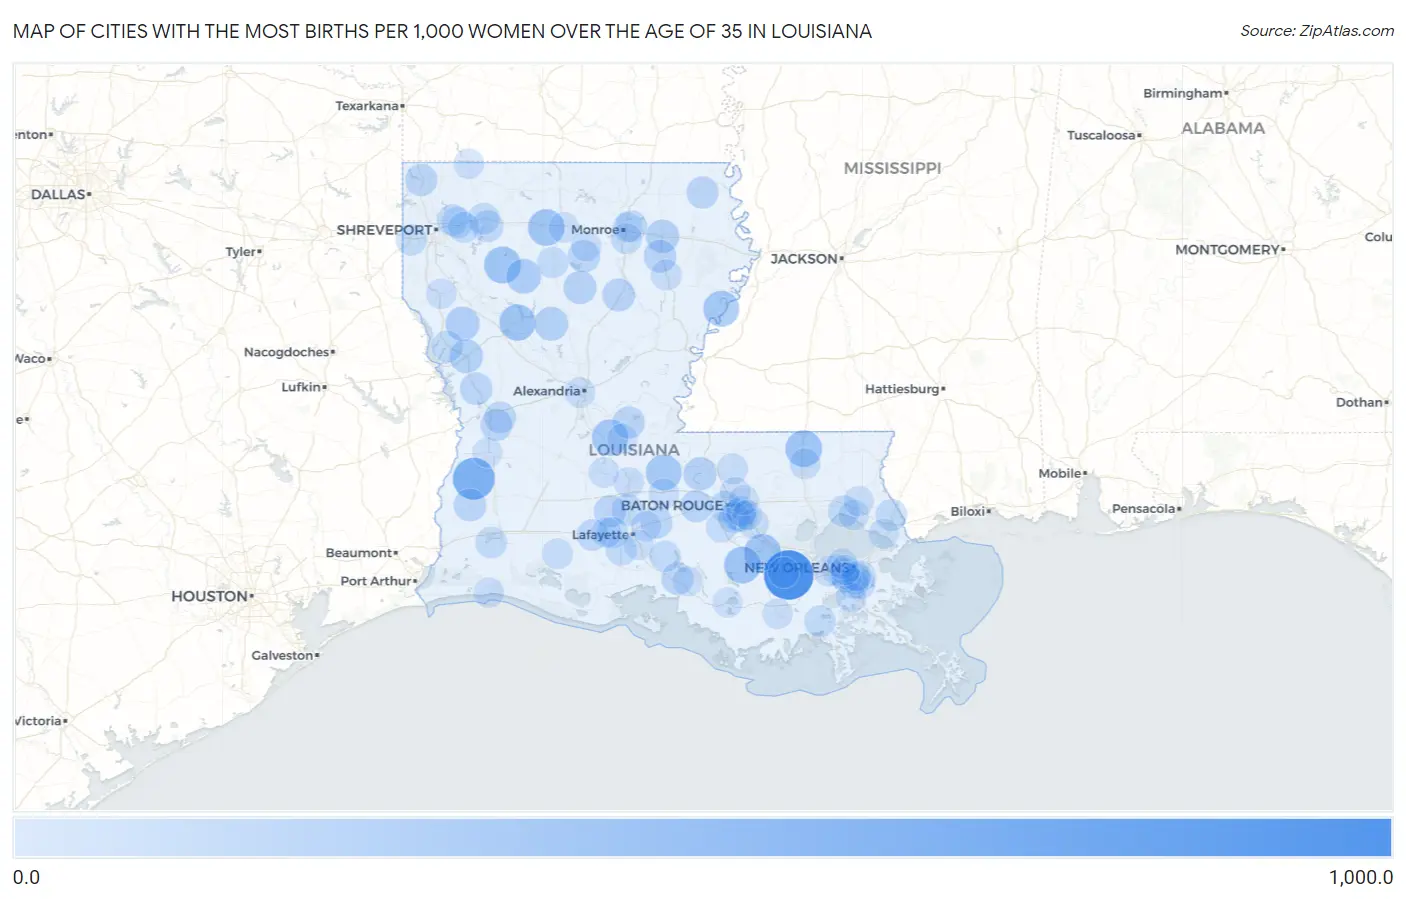
Cities with the Most Births per 1,000 Women Over the Age of 35 in Louisiana
| City | Births / 1,000 Women | vs State | vs National | |
| 1. | Pleasure Bend | 1,000.0 | 27.0(+973)#1 | 32.0(+968)#11 |
| 2. | Singer | 607.0 | 27.0(+580)#2 | 32.0(+575)#98 |
| 3. | Union | 364.0 | 27.0(+337)#3 | 32.0(+332)#243 |
| 4. | Castor | 364.0 | 27.0(+337)#4 | 32.0(+332)#244 |
| 5. | Paincourtville | 358.0 | 27.0(+331)#5 | 32.0(+326)#253 |
| 6. | Tangipahoa | 356.0 | 27.0(+329)#6 | 32.0(+324)#257 |
| 7. | Simsboro | 342.0 | 27.0(+315)#7 | 32.0(+310)#267 |
| 8. | Clarence | 333.0 | 27.0(+306)#8 | 32.0(+301)#277 |
| 9. | Bunkie | 330.0 | 27.0(+303)#9 | 32.0(+298)#307 |
| 10. | St Joseph | 313.0 | 27.0(+286)#10 | 32.0(+281)#328 |
| 11. | Melville | 307.0 | 27.0(+280)#11 | 32.0(+275)#336 |
| 12. | Saline | 250.0 | 27.0(+223)#12 | 32.0(+218)#474 |
| 13. | Pleasant Hill | 231.0 | 27.0(+204)#13 | 32.0(+199)#543 |
| 14. | Atlanta | 211.0 | 27.0(+184)#14 | 32.0(+179)#643 |
| 15. | Many | 205.0 | 27.0(+178)#15 | 32.0(+173)#665 |
| 16. | Rayville | 193.0 | 27.0(+166)#16 | 32.0(+161)#746 |
| 17. | Ventress | 185.0 | 27.0(+158)#17 | 32.0(+153)#794 |
| 18. | Sikes | 182.0 | 27.0(+155)#18 | 32.0(+150)#813 |
| 19. | Clarks | 167.0 | 27.0(+140)#19 | 32.0(+135)#906 |
| 20. | Mangham | 163.0 | 27.0(+136)#20 | 32.0(+131)#945 |
| 21. | Dequincy | 155.0 | 27.0(+128)#21 | 32.0(+123)#1,013 |
| 22. | Hornbeck | 151.0 | 27.0(+124)#22 | 32.0(+119)#1,055 |
| 23. | Henderson | 147.0 | 27.0(+120)#23 | 32.0(+115)#1,109 |
| 24. | Chatham | 146.0 | 27.0(+119)#24 | 32.0(+114)#1,119 |
| 25. | Rosedale | 140.0 | 27.0(+113)#25 | 32.0(+108)#1,186 |
| 26. | Hosston | 138.0 | 27.0(+111)#26 | 32.0(+106)#1,219 |
| 27. | Mansura | 136.0 | 27.0(+109)#27 | 32.0(+104)#1,235 |
| 28. | Oak Hills Place | 134.0 | 27.0(+107)#28 | 32.0(+102)#1,261 |
| 29. | Sorrel | 133.0 | 27.0(+106)#29 | 32.0(+101)#1,291 |
| 30. | Forest | 132.0 | 27.0(+105)#30 | 32.0(+100.0)#1,316 |
| 31. | Fort Polk South | 126.0 | 27.0(+99.0)#31 | 32.0(+94.0)#1,386 |
| 32. | Church Point | 124.0 | 27.0(+97.0)#32 | 32.0(+92.0)#1,440 |
| 33. | Fort Polk North | 122.0 | 27.0(+95.0)#33 | 32.0(+90.0)#1,467 |
| 34. | Sunset | 113.0 | 27.0(+86.0)#34 | 32.0(+81.0)#1,626 |
| 35. | Sibley | 112.0 | 27.0(+85.0)#35 | 32.0(+80.0)#1,656 |
| 36. | Crowley | 110.0 | 27.0(+83.0)#36 | 32.0(+78.0)#1,708 |
| 37. | Lakeshore | 110.0 | 27.0(+83.0)#37 | 32.0(+78.0)#1,716 |
| 38. | Pearl River | 105.0 | 27.0(+78.0)#38 | 32.0(+73.0)#1,827 |
| 39. | Madisonville | 105.0 | 27.0(+78.0)#39 | 32.0(+73.0)#1,834 |
| 40. | Dixie Inn | 105.0 | 27.0(+78.0)#40 | 32.0(+73.0)#1,842 |
| 41. | Terrytown | 102.0 | 27.0(+75.0)#41 | 32.0(+70.0)#1,894 |
| 42. | Prien | 102.0 | 27.0(+75.0)#42 | 32.0(+70.0)#1,896 |
| 43. | Zwolle | 102.0 | 27.0(+75.0)#43 | 32.0(+70.0)#1,903 |
| 44. | Larose | 97.0 | 27.0(+70.0)#44 | 32.0(+65.0)#2,020 |
| 45. | Duson | 97.0 | 27.0(+70.0)#45 | 32.0(+65.0)#2,039 |
| 46. | Eastwood | 96.0 | 27.0(+69.0)#46 | 32.0(+64.0)#2,052 |
| 47. | Red Chute | 95.0 | 27.0(+68.0)#47 | 32.0(+63.0)#2,072 |
| 48. | Maurice | 93.0 | 27.0(+66.0)#48 | 32.0(+61.0)#2,142 |
| 49. | Haughton | 89.0 | 27.0(+62.0)#49 | 32.0(+57.0)#2,252 |
| 50. | Loreauville | 88.0 | 27.0(+61.0)#50 | 32.0(+56.0)#2,301 |
| 51. | Village St George | 87.0 | 27.0(+60.0)#51 | 32.0(+55.0)#2,316 |
| 52. | Hodge | 87.0 | 27.0(+60.0)#52 | 32.0(+55.0)#2,334 |
| 53. | Port Allen | 86.0 | 27.0(+59.0)#53 | 32.0(+54.0)#2,356 |
| 54. | Greenwood | 82.0 | 27.0(+55.0)#54 | 32.0(+50.0)#2,499 |
| 55. | Gardere | 81.0 | 27.0(+54.0)#55 | 32.0(+49.0)#2,522 |
| 56. | River Ridge | 71.0 | 27.0(+44.0)#56 | 32.0(+39.0)#2,940 |
| 57. | Winnsboro | 71.0 | 27.0(+44.0)#57 | 32.0(+39.0)#2,953 |
| 58. | South Vacherie | 71.0 | 27.0(+44.0)#58 | 32.0(+39.0)#2,961 |
| 59. | Lake Arthur | 71.0 | 27.0(+44.0)#59 | 32.0(+39.0)#2,965 |
| 60. | Richwood | 69.0 | 27.0(+42.0)#60 | 32.0(+37.0)#3,067 |
| 61. | Slaughter | 69.0 | 27.0(+42.0)#61 | 32.0(+37.0)#3,078 |
| 62. | Belle Chasse | 67.0 | 27.0(+40.0)#62 | 32.0(+35.0)#3,149 |
| 63. | Roseland | 66.0 | 27.0(+39.0)#63 | 32.0(+34.0)#3,240 |
| 64. | Harvey | 65.0 | 27.0(+38.0)#64 | 32.0(+33.0)#3,257 |
| 65. | Plaquemine | 60.0 | 27.0(+33.0)#65 | 32.0(+28.0)#3,610 |
| 66. | Ruston | 59.0 | 27.0(+32.0)#66 | 32.0(+27.0)#3,660 |
| 67. | Alexandria | 58.0 | 27.0(+31.0)#67 | 32.0(+26.0)#3,731 |
| 68. | Bridge City | 58.0 | 27.0(+31.0)#68 | 32.0(+26.0)#3,748 |
| 69. | Brownfields | 54.0 | 27.0(+27.0)#69 | 32.0(+22.0)#4,062 |
| 70. | Ama | 54.0 | 27.0(+27.0)#70 | 32.0(+22.0)#4,090 |
| 71. | Mandeville | 53.0 | 27.0(+26.0)#71 | 32.0(+21.0)#4,145 |
| 72. | Krotz Springs | 53.0 | 27.0(+26.0)#72 | 32.0(+21.0)#4,201 |
| 73. | Washington | 53.0 | 27.0(+26.0)#73 | 32.0(+21.0)#4,205 |
| 74. | Evergreen | 53.0 | 27.0(+26.0)#74 | 32.0(+21.0)#4,215 |
| 75. | Cameron | 53.0 | 27.0(+26.0)#75 | 32.0(+21.0)#4,222 |
| 76. | Woodmere | 50.0 | 27.0(+23.0)#76 | 32.0(+18.0)#4,443 |
| 77. | Mansfield | 50.0 | 27.0(+23.0)#77 | 32.0(+18.0)#4,467 |
| 78. | Breaux Bridge | 49.0 | 27.0(+22.0)#78 | 32.0(+17.0)#4,543 |
| 79. | Ville Platte | 49.0 | 27.0(+22.0)#79 | 32.0(+17.0)#4,547 |
| 80. | Inniswold | 49.0 | 27.0(+22.0)#80 | 32.0(+17.0)#4,548 |
| 81. | Springhill | 49.0 | 27.0(+22.0)#81 | 32.0(+17.0)#4,554 |
| 82. | Eros | 49.0 | 27.0(+22.0)#82 | 32.0(+17.0)#4,605 |
| 83. | Westwego | 48.0 | 27.0(+21.0)#83 | 32.0(+16.0)#4,656 |
| 84. | Prairieville | 47.0 | 27.0(+20.0)#84 | 32.0(+15.0)#4,737 |
| 85. | Rayne | 47.0 | 27.0(+20.0)#85 | 32.0(+15.0)#4,775 |
| 86. | Abita Springs | 47.0 | 27.0(+20.0)#86 | 32.0(+15.0)#4,794 |
| 87. | Metairie | 46.0 | 27.0(+19.0)#87 | 32.0(+14.0)#4,831 |
| 88. | Bayou Cane | 46.0 | 27.0(+19.0)#88 | 32.0(+14.0)#4,852 |
| 89. | Eden Isle | 45.0 | 27.0(+18.0)#89 | 32.0(+13.0)#4,965 |
| 90. | Jean Lafitte | 44.0 | 27.0(+17.0)#90 | 32.0(+12.0)#5,111 |
| 91. | Monticello | 43.0 | 27.0(+16.0)#91 | 32.0(+11.0)#5,210 |
| 92. | Monroe | 39.0 | 27.0(+12.0)#92 | 32.0(+7.00)#5,685 |
| 93. | New Orleans Station | 39.0 | 27.0(+12.0)#93 | 32.0(+7.00)#5,759 |
| 94. | Broussard | 38.0 | 27.0(+11.0)#94 | 32.0(+6.00)#5,863 |
| 95. | Morgan City | 38.0 | 27.0(+11.0)#95 | 32.0(+6.00)#5,868 |
| 96. | Deridder | 38.0 | 27.0(+11.0)#96 | 32.0(+6.00)#5,877 |
| 97. | Old Jefferson | 38.0 | 27.0(+11.0)#97 | 32.0(+6.00)#5,885 |
| 98. | Gretna | 36.0 | 27.0(+9.00)#98 | 32.0(+4.00)#6,197 |
| 99. | Jefferson | 35.0 | 27.0(+8.00)#99 | 32.0(+3.00)#6,375 |
| 100. | Charenton | 35.0 | 27.0(+8.00)#100 | 32.0(+3.00)#6,433 |
Common Questions
What are the Top 10 Cities with the Most Births per 1,000 Women Over the Age of 35 in Louisiana?
Top 10 Cities with the Most Births per 1,000 Women Over the Age of 35 in Louisiana are:
#1
1,000.0
#2
607.0
#3
364.0
#4
364.0
#5
358.0
#6
356.0
#7
342.0
#8
333.0
#9
330.0
#10
313.0
What city has the Most Births per 1,000 Women Over the Age of 35 in Louisiana?
Pleasure Bend has the Most Births per 1,000 Women Over the Age of 35 in Louisiana with 1,000.0.
What is the Number of Births per 1,000 Women Over the Age of 35 in the State of Louisiana?
Number of Births per 1,000 Women Over the Age of 35 in Louisiana is 27.0.
What is the Number of Births per 1,000 Women Over the Age of 35 in the United States?
Number of Births per 1,000 Women Over the Age of 35 in the United States is 32.0.