Cities with the Most Births per 1,000 Women Over the Age of 35 in Maine

RELATED REPORTS & OPTIONS

Highest Birth Rate | Women 35+
Population
Families and Households
Female Fertility
Female Fertility (Unmarried)
Race (Community Size)
Race (Percentage)
Ancestry (Community Size)
AfghanAfricanAlaska NativeAlaskan AthabascanAlbanianAleutAlsatianAmericanApacheArabArapahoArgentineanArmenianAssyrian / Chaldean / SyriacAustralianAustrianBahamianBangladeshiBarbadianBasqueBelgianBelizeanBermudanBhutaneseBlackfeetBolivianBrazilianBritishBritish West IndianBulgarianBurmeseCajunCambodianCanadianCape VerdeanCarpatho RusynCelticCentral AmericanCentral American IndianCherokeeCheyenneChickasawChileanChineseChippewaChoctawColombianColvilleComancheCosta RicanCreeCreekCroatianCrowCubanCypriotCzechCzechoslovakianDanishDelawareDominicanDutchDutch West IndianEastern EuropeanEcuadorianEgyptianEnglishEstonianEthiopianEuropeanFijianFilipinoFinnishFrenchFrench American IndianFrench CanadianGermanGerman RussianGhanaianGreekGuamanian / ChamorroGuatemalanGuyaneseHaitianHmongHonduranHopiHoumaHungarianIcelanderIndian (Asian)IndonesianInupiatIranianIraqiIrishIroquoisIsraeliItalianJamaicanJapaneseJordanianKenyanKiowaKoreanLaotianLatvianLebaneseLiberianLithuanianLumbeeLuxembourgerMacedonianMalaysianMalteseMarshalleseMenomineeMexicanMexican American IndianMongolianMoroccanNative HawaiianNavajoNepaleseNew ZealanderNicaraguanNigerianNorthern EuropeanNorwegianOkinawanOsageOttawaPaiutePakistaniPalestinianPanamanianParaguayanPennsylvania GermanPeruvianPimaPolishPortuguesePotawatomiPuebloPuerto RicanPuget Sound SalishRomanianRussianSalvadoranSamoanScandinavianScotch-IrishScottishSeminoleSenegaleseSerbianShoshoneSierra LeoneanSiouxSlavicSlovakSloveneSomaliSouth AfricanSouth AmericanSouth American IndianSoviet UnionSpaniardSpanishSpanish AmericanSpanish American IndianSri LankanSubsaharan AfricanSudaneseSwedishSwissSyrianTaiwaneseThaiTlingit-HaidaTohono O'OdhamTonganTrinidadian and TobagonianTsimshianTurkishU.S. Virgin IslanderUgandanUkrainianUruguayanUteVenezuelanVietnameseWelshWest IndianYakamaYaquiYugoslavianYumanYup'ikZimbabwean
Ancestry (Percentage)
AfghanAfricanAlaska NativeAlaskan AthabascanAlbanianAleutAlsatianAmericanApacheArabArapahoArgentineanArmenianAssyrian / Chaldean / SyriacAustralianAustrianBahamianBangladeshiBarbadianBasqueBelgianBelizeanBermudanBhutaneseBlackfeetBolivianBrazilianBritishBritish West IndianBulgarianBurmeseCajunCambodianCanadianCape VerdeanCarpatho RusynCelticCentral AmericanCentral American IndianCherokeeCheyenneChickasawChileanChineseChippewaChoctawColombianColvilleComancheCosta RicanCreeCreekCroatianCrowCubanCypriotCzechCzechoslovakianDanishDelawareDominicanDutchDutch West IndianEastern EuropeanEcuadorianEgyptianEnglishEstonianEthiopianEuropeanFijianFilipinoFinnishFrenchFrench American IndianFrench CanadianGermanGerman RussianGhanaianGreekGuamanian / ChamorroGuatemalanGuyaneseHaitianHmongHonduranHopiHoumaHungarianIcelanderIndian (Asian)IndonesianInupiatIranianIraqiIrishIroquoisIsraeliItalianJamaicanJapaneseJordanianKenyanKiowaKoreanLaotianLatvianLebaneseLiberianLithuanianLumbeeLuxembourgerMacedonianMalaysianMalteseMarshalleseMenomineeMexicanMexican American IndianMongolianMoroccanNative HawaiianNavajoNepaleseNew ZealanderNicaraguanNigerianNorthern EuropeanNorwegianOkinawanOsageOttawaPaiutePakistaniPalestinianPanamanianParaguayanPennsylvania GermanPeruvianPimaPolishPortuguesePotawatomiPuebloPuerto RicanPuget Sound SalishRomanianRussianSalvadoranSamoanScandinavianScotch-IrishScottishSeminoleSenegaleseSerbianShoshoneSierra LeoneanSiouxSlavicSlovakSloveneSomaliSouth AfricanSouth AmericanSouth American IndianSoviet UnionSpaniardSpanishSpanish AmericanSpanish American IndianSri LankanSubsaharan AfricanSudaneseSwedishSwissSyrianTaiwaneseThaiTlingit-HaidaTohono O'OdhamTonganTrinidadian and TobagonianTsimshianTurkishU.S. Virgin IslanderUgandanUkrainianUruguayanUteVenezuelanVietnameseWelshWest IndianYakamaYaquiYugoslavianYumanYup'ikZimbabwean
Immigrant Origin (Total)
AfghanistanAfricaAlbaniaArgentinaArmeniaAsiaAustraliaAustriaAzoresBahamasBangladeshBarbadosBelarusBelgiumBelizeBoliviaBosnia and HerzegovinaBrazilBulgariaBurma / MyanmarCabo VerdeCambodiaCameroonCanadaCaribbeanCentral AmericaChileChinaColombiaCongoCosta RicaCroatiaCubaCzechoslovakiaDenmarkDominicaDominican RepublicEastern AfricaEastern AsiaEastern EuropeEcuadorEgyptEl SalvadorEnglandEritreaEthiopiaEuropeFijiFranceGermanyGhanaGreeceGrenadaGuatemalaGuyanaHaitiHondurasHong KongHungaryIndiaIndonesiaIranIraqIrelandIsraelItalyJamaicaJapanJordanKazakhstanKenyaKoreaKuwaitLaosLatin AmericaLatviaLebanonLiberiaLithuaniaMalaysiaMexicoMicronesiaMiddle AfricaMoldovaMoroccoNepalNetherlandsNicaraguaNigeriaNorth MacedoniaNorthern AfricaNorthern EuropeNorwayOceaniaPakistanPanamaPeruPhilippinesPolandPortugalRomaniaRussiaSaudi ArabiaScotlandSenegalSerbiaSierra LeoneSingaporeSomaliaSouth AfricaSouth AmericaSouth Central AsiaSouth Eastern AsiaSouthern EuropeSpainSri LankaSt. Vincent and the GrenadinesSudanSwedenSwitzerlandSyriaTaiwanThailandTrinidad and TobagoTurkeyUgandaUkraineUruguayUzbekistanVenezuelaVietnamWest IndiesWestern AfricaWestern AsiaWestern EuropeYemenZaireZimbabwe
Immigrant Origin (Percentage)
AfghanistanAfricaAlbaniaArgentinaArmeniaAsiaAustraliaAustriaAzoresBahamasBangladeshBarbadosBelarusBelgiumBelizeBoliviaBosnia and HerzegovinaBrazilBulgariaBurma / MyanmarCabo VerdeCambodiaCameroonCanadaCaribbeanCentral AmericaChileChinaColombiaCongoCosta RicaCroatiaCubaCzechoslovakiaDenmarkDominicaDominican RepublicEastern AfricaEastern AsiaEastern EuropeEcuadorEgyptEl SalvadorEnglandEritreaEthiopiaEuropeFijiFranceGermanyGhanaGreeceGrenadaGuatemalaGuyanaHaitiHondurasHong KongHungaryIndiaIndonesiaIranIraqIrelandIsraelItalyJamaicaJapanJordanKazakhstanKenyaKoreaKuwaitLaosLatin AmericaLatviaLebanonLiberiaLithuaniaMalaysiaMexicoMicronesiaMiddle AfricaMoldovaMoroccoNepalNetherlandsNicaraguaNigeriaNorth MacedoniaNorthern AfricaNorthern EuropeNorwayOceaniaPakistanPanamaPeruPhilippinesPolandPortugalRomaniaRussiaSaudi ArabiaScotlandSenegalSerbiaSierra LeoneSingaporeSomaliaSouth AfricaSouth AmericaSouth Central AsiaSouth Eastern AsiaSouthern EuropeSpainSri LankaSt. Vincent and the GrenadinesSudanSwedenSwitzerlandSyriaTaiwanThailandTrinidad and TobagoTurkeyUgandaUkraineUruguayUzbekistanVenezuelaVietnamWest IndiesWestern AfricaWestern AsiaWestern EuropeYemenZaireZimbabwe
Income
Income (Families)
Income (Households)
Poverty
Poverty (Families)
Unemployment
Employment Occupations
Employment Industries
Employer Class
Commute Time
Commute Means
School Enrollment
Education by Degree Field
Occupancy
Finances
Physical Characteristics
Maine
Compare Cities
Comparison Subject

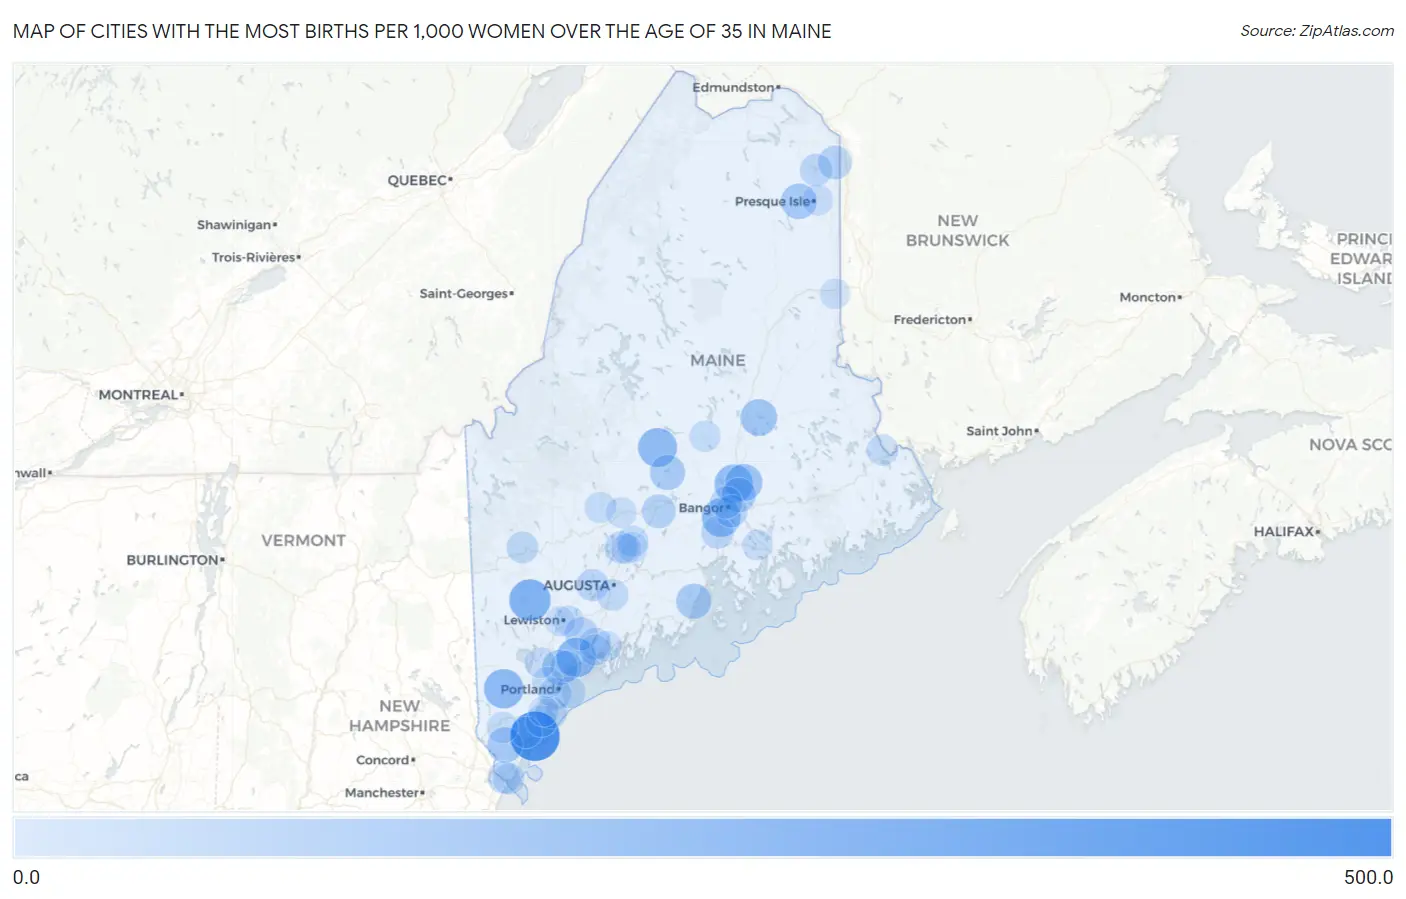
Map of Cities with the Most Births per 1,000 Women Over the Age of 35 in Maine

0.0
500.0
Cities with the Most Births per 1,000 Women Over the Age of 35 in Maine Map

Cities with the Most Births per 1,000 Women Over the Age of 35 in Maine

City Births / 1,000 Women vs State vs National
1.Kennebunkport459.030.0(+429)#132.0(+427)#170
2.South Paris264.030.0(+234)#232.0(+232)#424
3.Lake Arrowhead216.030.0(+186)#332.0(+184)#608
4.Freeport216.030.0(+186)#432.0(+184)#610
5.Guilford205.030.0(+175)#532.0(+173)#668
6.Hampden199.030.0(+169)#632.0(+167)#723
7.Old Town189.030.0(+159)#732.0(+157)#765
8.Milford159.030.0(+129)#832.0(+127)#982
9.Bradley154.030.0(+124)#932.0(+122)#1,023
10.Lincoln149.030.0(+119)#1032.0(+117)#1,078
11.Mapleton127.030.0(+97.0)#1132.0(+95.0)#1,382
12.Cumberland Center123.030.0(+93.0)#1232.0(+91.0)#1,453
13.North Berwick122.030.0(+92.0)#1332.0(+90.0)#1,471
14.Camden116.030.0(+86.0)#1432.0(+84.0)#1,569
15.Dexter113.030.0(+83.0)#1532.0(+81.0)#1,628
16.Orono99.030.0(+69.0)#1632.0(+67.0)#1,973
17.Pittsfield82.030.0(+52.0)#1732.0(+50.0)#2,500
18.Limestone81.030.0(+51.0)#1832.0(+49.0)#2,540
19.Lisbon Falls69.030.0(+39.0)#1932.0(+37.0)#3,066
20.Winterport56.030.0(+26.0)#2032.0(+24.0)#3,909
21.Caribou53.030.0(+23.0)#2132.0(+21.0)#4,163
22.Brewer52.030.0(+22.0)#2232.0(+20.0)#4,265
23.Bangor50.030.0(+20.0)#2332.0(+18.0)#4,419
24.South Portland50.030.0(+20.0)#2432.0(+18.0)#4,424
25.Kittery49.030.0(+19.0)#2532.0(+17.0)#4,552
26.Oakland49.030.0(+19.0)#2632.0(+17.0)#4,569
27.Winthrop48.030.0(+18.0)#2732.0(+16.0)#4,678
28.Old Orchard Beach41.030.0(+11.0)#2832.0(+9.00)#5,448
29.Topsham37.030.0(+7.00)#2932.0(+5.00)#6,069
30.Rumford37.030.0(+7.00)#3032.0(+5.00)#6,084
31.Oak Hill36.030.0(+6.00)#3132.0(+4.00)#6,240
32.Farmingdale34.030.0(+4.00)#3232.0(+2.00)#6,570
33.Portland31.030.0(+1.000)#3332.0(-1.000)#6,990
34.Fairfield31.030.0(+1.000)#3432.0(-1.000)#7,084
35.Kittery Point31.030.0(+1.000)#3532.0(-1.000)#7,126
36.Kennebunk29.030.0(-1.000)#3632.0(-3.00)#7,431
37.Veazie29.030.0(-1.000)#3732.0(-3.00)#7,466
38.Sanford28.030.0(-2.00)#3832.0(-4.00)#7,571
39.Woodland28.030.0(-2.00)#3932.0(-4.00)#7,671
40.Anson28.030.0(-2.00)#4032.0(-4.00)#7,682
41.Biddeford27.030.0(-3.00)#4132.0(-5.00)#7,745
42.Yarmouth27.030.0(-3.00)#4232.0(-5.00)#7,806
43.Milo26.030.0(-4.00)#4332.0(-6.00)#8,023
44.Lisbon23.030.0(-7.00)#4432.0(-9.00)#8,517
45.Westbrook22.030.0(-8.00)#4532.0(-10.00)#8,647
46.Lewiston20.030.0(-10.00)#4632.0(-12.0)#8,963
47.Presque Isle20.030.0(-10.00)#4732.0(-12.0)#9,020
48.Winslow20.030.0(-10.00)#4832.0(-12.0)#9,040
49.Brunswick18.030.0(-12.0)#4932.0(-14.0)#9,328
50.North Windham18.030.0(-12.0)#5032.0(-14.0)#9,378
51.Ellsworth14.030.0(-16.0)#5132.0(-18.0)#9,964
52.Skowhegan13.030.0(-17.0)#5232.0(-19.0)#10,124
53.Bath12.030.0(-18.0)#5332.0(-20.0)#10,241
54.Saco11.030.0(-19.0)#5432.0(-21.0)#10,313
55.Houlton7.030.0(-23.0)#5532.0(-25.0)#10,811
56.Waterville6.030.0(-24.0)#5632.0(-26.0)#10,861
57.Auburn2.030.0(-28.0)#5732.0(-30.0)#11,051

Common Questions

What are the Top 10 Cities with the Most Births per 1,000 Women Over the Age of 35 in Maine?
Top 10 Cities with the Most Births per 1,000 Women Over the Age of 35 in Maine are:
#1
459.0
#2
264.0
#3
216.0
#4
216.0
#5
205.0
#6
199.0
#7
189.0
#8
159.0
#9
149.0
#10
127.0
What city has the Most Births per 1,000 Women Over the Age of 35 in Maine?
Kennebunkport has the Most Births per 1,000 Women Over the Age of 35 in Maine with 459.0.
What is the Number of Births per 1,000 Women Over the Age of 35 in the State of Maine?
Number of Births per 1,000 Women Over the Age of 35 in Maine is 30.0.
What is the Number of Births per 1,000 Women Over the Age of 35 in the United States?
Number of Births per 1,000 Women Over the Age of 35 in the United States is 32.0.