Cities with the Most Births per 1,000 Women Over the Age of 35 in Utah
RELATED REPORTS & OPTIONS
Highest Birth Rate | Women 35+
Utah
Compare Cities
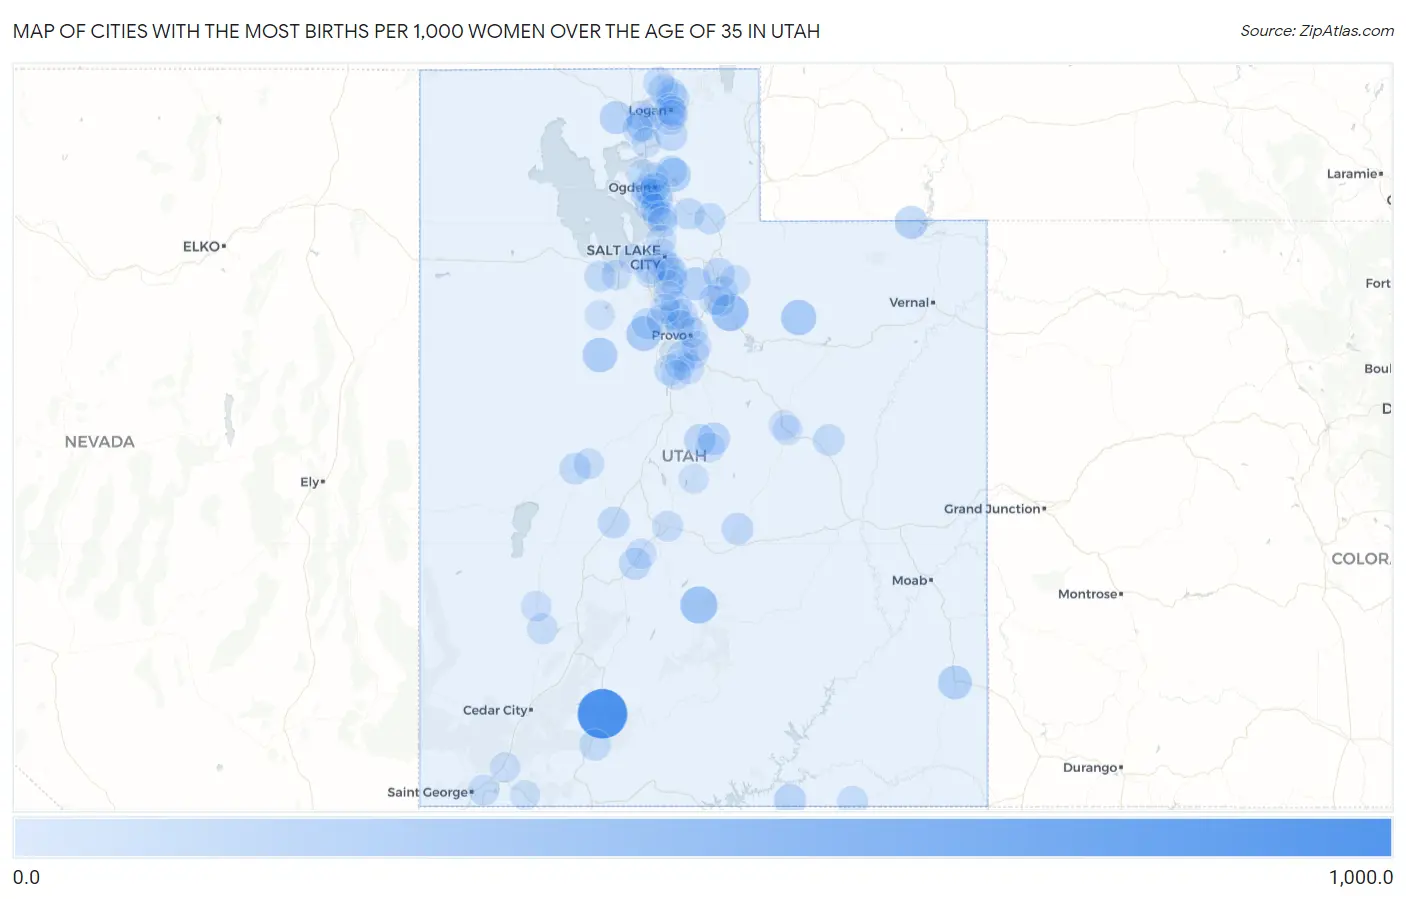
Map of Cities with the Most Births per 1,000 Women Over the Age of 35 in Utah
0.0
1,000.0
Cities with the Most Births per 1,000 Women Over the Age of 35 in Utah
| City | Births / 1,000 Women | vs State | vs National | |
| 1. | Hatch | 1,000.0 | 29.0(+971)#1 | 32.0(+968)#28 |
| 2. | Independence | 364.0 | 29.0(+335)#2 | 32.0(+332)#247 |
| 3. | Lyman | 357.0 | 29.0(+328)#3 | 32.0(+325)#256 |
| 4. | Tabiona | 273.0 | 29.0(+244)#4 | 32.0(+241)#405 |
| 5. | Fairfield | 250.0 | 29.0(+221)#5 | 32.0(+218)#486 |
| 6. | Vernon | 235.0 | 29.0(+206)#6 | 32.0(+203)#532 |
| 7. | Eden | 206.0 | 29.0(+177)#7 | 32.0(+174)#660 |
| 8. | Monticello | 202.0 | 29.0(+173)#8 | 32.0(+170)#683 |
| 9. | Hobble Creek | 200.0 | 29.0(+171)#9 | 32.0(+168)#713 |
| 10. | Alta | 167.0 | 29.0(+138)#10 | 32.0(+135)#911 |
| 11. | Manila | 167.0 | 29.0(+138)#11 | 32.0(+135)#913 |
| 12. | Thatcher | 164.0 | 29.0(+135)#12 | 32.0(+132)#939 |
| 13. | Navajo Mountain | 136.0 | 29.0(+107)#13 | 32.0(+104)#1,239 |
| 14. | Mount Pleasant | 134.0 | 29.0(+105)#14 | 32.0(+102)#1,265 |
| 15. | Honeyville | 131.0 | 29.0(+102)#15 | 32.0(+99.0)#1,327 |
| 16. | Elsinore | 113.0 | 29.0(+84.0)#16 | 32.0(+81.0)#1,637 |
| 17. | Moroni | 112.0 | 29.0(+83.0)#17 | 32.0(+80.0)#1,657 |
| 18. | Paradise | 110.0 | 29.0(+81.0)#18 | 32.0(+78.0)#1,730 |
| 19. | Emery | 109.0 | 29.0(+80.0)#19 | 32.0(+77.0)#1,742 |
| 20. | Hideout | 103.0 | 29.0(+74.0)#20 | 32.0(+71.0)#1,886 |
| 21. | Fillmore | 100.0 | 29.0(+71.0)#21 | 32.0(+68.0)#1,940 |
| 22. | East Carbon | 94.0 | 29.0(+65.0)#22 | 32.0(+62.0)#2,121 |
| 23. | Hinckley | 94.0 | 29.0(+65.0)#23 | 32.0(+62.0)#2,122 |
| 24. | Wolf Creek | 89.0 | 29.0(+60.0)#24 | 32.0(+57.0)#2,258 |
| 25. | Alton | 87.0 | 29.0(+58.0)#25 | 32.0(+55.0)#2,336 |
| 26. | Roy | 85.0 | 29.0(+56.0)#26 | 32.0(+53.0)#2,376 |
| 27. | Morgan | 85.0 | 29.0(+56.0)#27 | 32.0(+53.0)#2,386 |
| 28. | Hyde Park | 83.0 | 29.0(+54.0)#28 | 32.0(+51.0)#2,436 |
| 29. | Eagle Mountain | 82.0 | 29.0(+53.0)#29 | 32.0(+50.0)#2,484 |
| 30. | South Weber | 82.0 | 29.0(+53.0)#30 | 32.0(+50.0)#2,490 |
| 31. | Plain City | 77.0 | 29.0(+48.0)#31 | 32.0(+45.0)#2,665 |
| 32. | Genola | 76.0 | 29.0(+47.0)#32 | 32.0(+44.0)#2,734 |
| 33. | Benjamin | 75.0 | 29.0(+46.0)#33 | 32.0(+43.0)#2,787 |
| 34. | Washington | 68.0 | 29.0(+39.0)#34 | 32.0(+36.0)#3,099 |
| 35. | Henefer | 68.0 | 29.0(+39.0)#35 | 32.0(+36.0)#3,133 |
| 36. | Grantsville | 66.0 | 29.0(+37.0)#36 | 32.0(+34.0)#3,216 |
| 37. | Smithfield | 65.0 | 29.0(+36.0)#37 | 32.0(+33.0)#3,261 |
| 38. | South Salt Lake | 63.0 | 29.0(+34.0)#38 | 32.0(+31.0)#3,374 |
| 39. | Amalga | 63.0 | 29.0(+34.0)#39 | 32.0(+31.0)#3,441 |
| 40. | Daniel | 61.0 | 29.0(+32.0)#40 | 32.0(+29.0)#3,558 |
| 41. | Trenton | 61.0 | 29.0(+32.0)#41 | 32.0(+29.0)#3,569 |
| 42. | Delta | 59.0 | 29.0(+30.0)#42 | 32.0(+27.0)#3,691 |
| 43. | Salina | 58.0 | 29.0(+29.0)#43 | 32.0(+26.0)#3,763 |
| 44. | Cottonwood Heights | 55.0 | 29.0(+26.0)#44 | 32.0(+23.0)#3,948 |
| 45. | Mendon | 54.0 | 29.0(+25.0)#45 | 32.0(+22.0)#4,089 |
| 46. | Minersville | 53.0 | 29.0(+24.0)#46 | 32.0(+21.0)#4,200 |
| 47. | Oljato Monument Valley | 53.0 | 29.0(+24.0)#47 | 32.0(+21.0)#4,207 |
| 48. | Logan | 50.0 | 29.0(+21.0)#48 | 32.0(+18.0)#4,411 |
| 49. | Milford | 49.0 | 29.0(+20.0)#49 | 32.0(+17.0)#4,578 |
| 50. | Spanish Fork | 48.0 | 29.0(+19.0)#50 | 32.0(+16.0)#4,624 |
| 51. | Deweyville | 48.0 | 29.0(+19.0)#51 | 32.0(+16.0)#4,716 |
| 52. | Richfield | 47.0 | 29.0(+18.0)#52 | 32.0(+15.0)#4,772 |
| 53. | Brighton | 47.0 | 29.0(+18.0)#53 | 32.0(+15.0)#4,826 |
| 54. | Orem | 46.0 | 29.0(+17.0)#54 | 32.0(+14.0)#4,834 |
| 55. | Highland | 46.0 | 29.0(+17.0)#55 | 32.0(+14.0)#4,854 |
| 56. | South Ogden | 44.0 | 29.0(+15.0)#56 | 32.0(+12.0)#5,071 |
| 57. | American Fork | 43.0 | 29.0(+14.0)#57 | 32.0(+11.0)#5,166 |
| 58. | Elk Ridge | 43.0 | 29.0(+14.0)#58 | 32.0(+11.0)#5,211 |
| 59. | Nibley | 41.0 | 29.0(+12.0)#59 | 32.0(+9.00)#5,455 |
| 60. | River Heights | 41.0 | 29.0(+12.0)#60 | 32.0(+9.00)#5,484 |
| 61. | Clearfield | 39.0 | 29.0(+10.00)#61 | 32.0(+7.00)#5,693 |
| 62. | Payson | 39.0 | 29.0(+10.00)#62 | 32.0(+7.00)#5,703 |
| 63. | Millcreek | 38.0 | 29.0(+9.00)#63 | 32.0(+6.00)#5,818 |
| 64. | Springville | 38.0 | 29.0(+9.00)#64 | 32.0(+6.00)#5,828 |
| 65. | Saratoga Springs | 37.0 | 29.0(+8.00)#65 | 32.0(+5.00)#6,005 |
| 66. | West Haven | 37.0 | 29.0(+8.00)#66 | 32.0(+5.00)#6,035 |
| 67. | Stansbury Park | 37.0 | 29.0(+8.00)#67 | 32.0(+5.00)#6,051 |
| 68. | Toquerville | 37.0 | 29.0(+8.00)#68 | 32.0(+5.00)#6,099 |
| 69. | Bear River City | 37.0 | 29.0(+8.00)#69 | 32.0(+5.00)#6,116 |
| 70. | Heber | 36.0 | 29.0(+7.00)#70 | 32.0(+4.00)#6,199 |
| 71. | Kearns | 35.0 | 29.0(+6.00)#71 | 32.0(+3.00)#6,343 |
| 72. | Riverdale | 35.0 | 29.0(+6.00)#72 | 32.0(+3.00)#6,377 |
| 73. | Provo | 34.0 | 29.0(+5.00)#73 | 32.0(+2.00)#6,455 |
| 74. | Francis | 34.0 | 29.0(+5.00)#74 | 32.0(+2.00)#6,579 |
| 75. | Kaysville | 33.0 | 29.0(+4.00)#75 | 32.0(+1.000)#6,650 |
| 76. | Magna | 33.0 | 29.0(+4.00)#76 | 32.0(+1.000)#6,655 |
| 77. | Carbonville | 33.0 | 29.0(+4.00)#77 | 32.0(+1.000)#6,770 |
| 78. | Santaquin | 32.0 | 29.0(+3.00)#78 | 32.0(=0.000)#6,868 |
| 79. | Salt Lake City | 30.0 | 29.0(+1.000)#79 | 32.0(-2.00)#7,149 |
| 80. | Layton | 30.0 | 29.0(+1.000)#80 | 32.0(-2.00)#7,161 |
| 81. | Pleasant Grove | 30.0 | 29.0(+1.000)#81 | 32.0(-2.00)#7,182 |
| 82. | Charleston | 30.0 | 29.0(+1.000)#82 | 32.0(-2.00)#7,332 |
| 83. | Sandy | 29.0 | 29.0(=0.000)#83 | 32.0(-3.00)#7,350 |
| 84. | Brigham City | 29.0 | 29.0(=0.000)#84 | 32.0(-3.00)#7,388 |
| 85. | Manti | 29.0 | 29.0(=0.000)#85 | 32.0(-3.00)#7,446 |
| 86. | Holladay | 28.0 | 29.0(-1.000)#86 | 32.0(-4.00)#7,555 |
| 87. | Apple Valley | 28.0 | 29.0(-1.000)#87 | 32.0(-4.00)#7,670 |
| 88. | Rush Valley | 28.0 | 29.0(-1.000)#88 | 32.0(-4.00)#7,690 |
| 89. | Draper | 27.0 | 29.0(-2.00)#89 | 32.0(-5.00)#7,712 |
| 90. | Vineyard | 27.0 | 29.0(-2.00)#90 | 32.0(-5.00)#7,771 |
| 91. | Providence | 27.0 | 29.0(-2.00)#91 | 32.0(-5.00)#7,788 |
| 92. | Harrisville | 27.0 | 29.0(-2.00)#92 | 32.0(-5.00)#7,799 |
| 93. | Fruit Heights | 27.0 | 29.0(-2.00)#93 | 32.0(-5.00)#7,805 |
| 94. | West Valley City | 26.0 | 29.0(-3.00)#94 | 32.0(-6.00)#7,887 |
| 95. | Farmington | 26.0 | 29.0(-3.00)#95 | 32.0(-6.00)#7,918 |
| 96. | Woods Cross | 26.0 | 29.0(-3.00)#96 | 32.0(-6.00)#7,944 |
| 97. | Price | 26.0 | 29.0(-3.00)#97 | 32.0(-6.00)#7,958 |
| 98. | Spring City | 26.0 | 29.0(-3.00)#98 | 32.0(-6.00)#8,029 |
| 99. | Ogden | 25.0 | 29.0(-4.00)#99 | 32.0(-7.00)#8,064 |
| 100. | Lehi | 25.0 | 29.0(-4.00)#100 | 32.0(-7.00)#8,069 |
Common Questions
What are the Top 10 Cities with the Most Births per 1,000 Women Over the Age of 35 in Utah?
Top 10 Cities with the Most Births per 1,000 Women Over the Age of 35 in Utah are:
#1
1,000.0
#2
364.0
#3
357.0
#4
273.0
#5
250.0
#6
235.0
#7
206.0
#8
202.0
#9
167.0
#10
167.0
What city has the Most Births per 1,000 Women Over the Age of 35 in Utah?
Hatch has the Most Births per 1,000 Women Over the Age of 35 in Utah with 1,000.0.
What is the Number of Births per 1,000 Women Over the Age of 35 in the State of Utah?
Number of Births per 1,000 Women Over the Age of 35 in Utah is 29.0.
What is the Number of Births per 1,000 Women Over the Age of 35 in the United States?
Number of Births per 1,000 Women Over the Age of 35 in the United States is 32.0.