Cities with the Most Births per 1,000 Women Over the Age of 35 in Georgia
RELATED REPORTS & OPTIONS
Highest Birth Rate | Women 35+
Georgia
Compare Cities
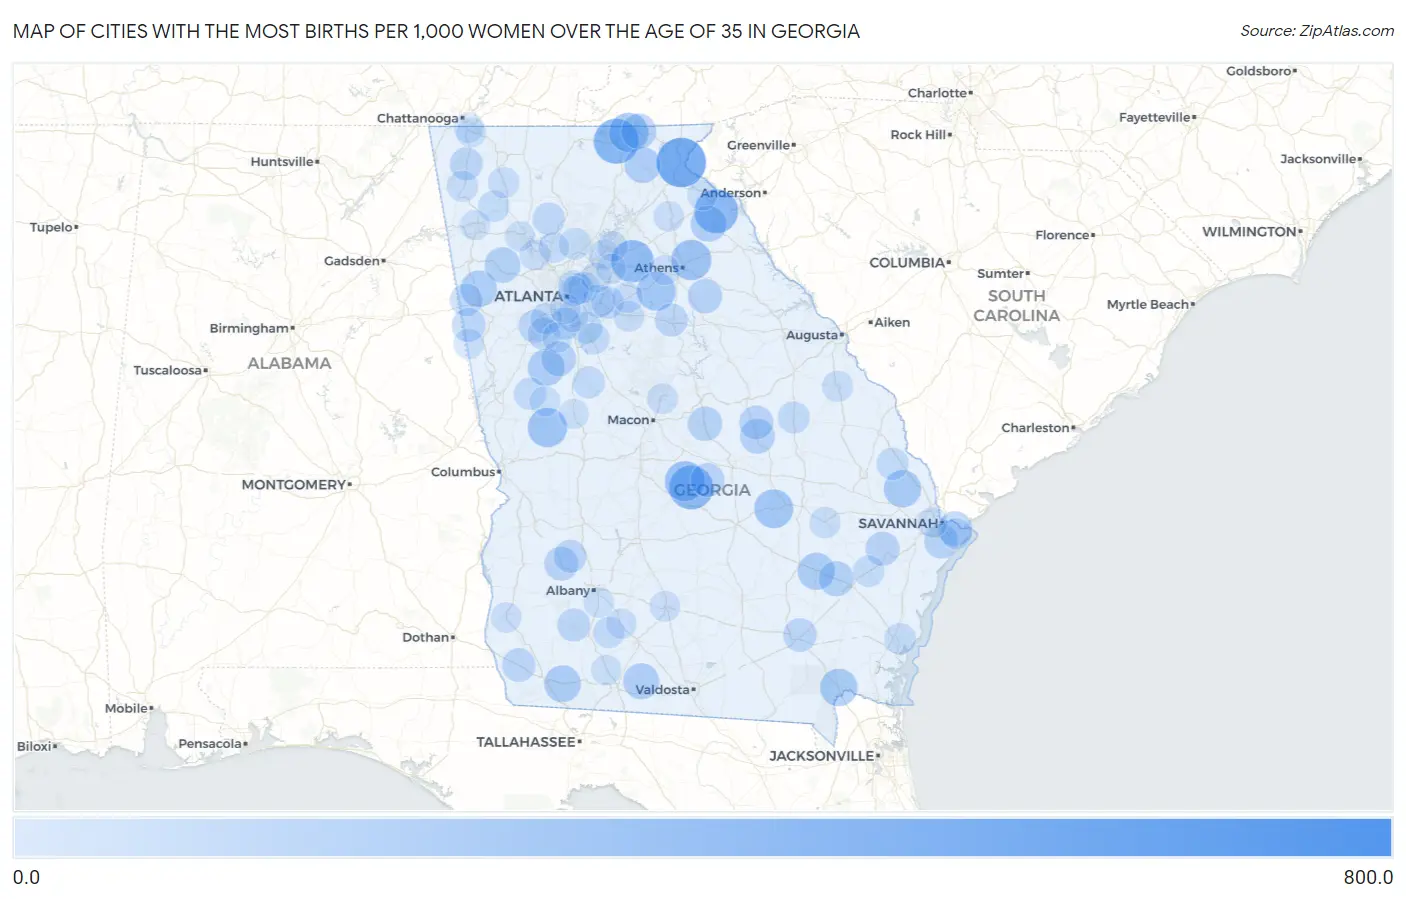
Map of Cities with the Most Births per 1,000 Women Over the Age of 35 in Georgia
0.0
800.0
Cities with the Most Births per 1,000 Women Over the Age of 35 in Georgia
| City | Births / 1,000 Women | vs State | vs National | |
| 1. | Sterling | 707.0 | 30.0(+677)#1 | 32.0(+675)#75 |
| 2. | Tallulah Falls | 500.0 | 30.0(+470)#2 | 32.0(+468)#131 |
| 3. | Blairsville | 393.0 | 30.0(+363)#3 | 32.0(+361)#217 |
| 4. | Empire | 370.0 | 30.0(+340)#4 | 32.0(+338)#236 |
| 5. | Bowersville | 362.0 | 30.0(+332)#5 | 32.0(+330)#249 |
| 6. | Carl | 333.0 | 30.0(+303)#6 | 32.0(+301)#284 |
| 7. | Cochran | 280.0 | 30.0(+250)#7 | 32.0(+248)#381 |
| 8. | Hull | 278.0 | 30.0(+248)#8 | 32.0(+246)#385 |
| 9. | Young Harris | 261.0 | 30.0(+231)#9 | 32.0(+229)#436 |
| 10. | Woodland | 261.0 | 30.0(+231)#10 | 32.0(+229)#439 |
| 11. | Ailey | 250.0 | 30.0(+220)#11 | 32.0(+218)#466 |
| 12. | Good Hope | 250.0 | 30.0(+220)#12 | 32.0(+218)#468 |
| 13. | Folkston | 214.0 | 30.0(+184)#13 | 32.0(+182)#614 |
| 14. | Guyton | 211.0 | 30.0(+181)#14 | 32.0(+179)#634 |
| 15. | Surrency | 206.0 | 30.0(+176)#15 | 32.0(+174)#661 |
| 16. | Haralson | 200.0 | 30.0(+170)#16 | 32.0(+168)#711 |
| 17. | Climax | 200.0 | 30.0(+170)#17 | 32.0(+168)#715 |
| 18. | Buchanan | 193.0 | 30.0(+163)#18 | 32.0(+161)#749 |
| 19. | Franklin Springs | 182.0 | 30.0(+152)#19 | 32.0(+150)#808 |
| 20. | Helen | 182.0 | 30.0(+152)#20 | 32.0(+150)#810 |
| 21. | Barwick | 182.0 | 30.0(+152)#21 | 32.0(+150)#812 |
| 22. | Braswell | 171.0 | 30.0(+141)#22 | 32.0(+139)#885 |
| 23. | Hiawassee | 162.0 | 30.0(+132)#23 | 32.0(+130)#951 |
| 24. | Odum | 162.0 | 30.0(+132)#24 | 32.0(+130)#954 |
| 25. | Wrightsville | 156.0 | 30.0(+126)#25 | 32.0(+124)#1,005 |
| 26. | Talahi Island | 153.0 | 30.0(+123)#26 | 32.0(+121)#1,034 |
| 27. | Brooks | 148.0 | 30.0(+118)#27 | 32.0(+116)#1,095 |
| 28. | Irwinton | 146.0 | 30.0(+116)#28 | 32.0(+114)#1,120 |
| 29. | Maxeys | 146.0 | 30.0(+116)#29 | 32.0(+114)#1,121 |
| 30. | Montgomery | 143.0 | 30.0(+113)#30 | 32.0(+111)#1,136 |
| 31. | Harrison | 136.0 | 30.0(+106)#31 | 32.0(+104)#1,240 |
| 32. | Fort Stewart | 135.0 | 30.0(+105)#32 | 32.0(+103)#1,243 |
| 33. | Chester | 135.0 | 30.0(+105)#33 | 32.0(+103)#1,248 |
| 34. | Dawson | 133.0 | 30.0(+103)#34 | 32.0(+101)#1,275 |
| 35. | Bowdon | 126.0 | 30.0(+96.0)#35 | 32.0(+94.0)#1,393 |
| 36. | Iron City | 125.0 | 30.0(+95.0)#36 | 32.0(+93.0)#1,416 |
| 37. | Sunnyside | 124.0 | 30.0(+94.0)#37 | 32.0(+92.0)#1,445 |
| 38. | Palmetto | 113.0 | 30.0(+83.0)#38 | 32.0(+81.0)#1,623 |
| 39. | Madison | 112.0 | 30.0(+82.0)#39 | 32.0(+80.0)#1,650 |
| 40. | Newton | 111.0 | 30.0(+81.0)#40 | 32.0(+79.0)#1,678 |
| 41. | Bronwood | 111.0 | 30.0(+81.0)#41 | 32.0(+79.0)#1,691 |
| 42. | Lafayette | 110.0 | 30.0(+80.0)#42 | 32.0(+78.0)#1,711 |
| 43. | Echols County Consolidated Government | 109.0 | 30.0(+79.0)#43 | 32.0(+77.0)#1,736 |
| 44. | Tallapoosa | 106.0 | 30.0(+76.0)#44 | 32.0(+74.0)#1,808 |
| 45. | Lithonia | 106.0 | 30.0(+76.0)#45 | 32.0(+74.0)#1,809 |
| 46. | Lakeview Estates | 103.0 | 30.0(+73.0)#46 | 32.0(+71.0)#1,880 |
| 47. | Waleska | 100.0 | 30.0(+70.0)#47 | 32.0(+68.0)#1,945 |
| 48. | Tyrone | 99.0 | 30.0(+69.0)#48 | 32.0(+67.0)#1,974 |
| 49. | Greenville | 96.0 | 30.0(+66.0)#49 | 32.0(+64.0)#2,063 |
| 50. | Oliver | 95.0 | 30.0(+65.0)#50 | 32.0(+63.0)#2,092 |
| 51. | Milner | 94.0 | 30.0(+64.0)#51 | 32.0(+62.0)#2,124 |
| 52. | Wadley | 91.0 | 30.0(+61.0)#52 | 32.0(+59.0)#2,205 |
| 53. | Stockbridge | 88.0 | 30.0(+58.0)#53 | 32.0(+56.0)#2,268 |
| 54. | North Druid Hills | 87.0 | 30.0(+57.0)#54 | 32.0(+55.0)#2,312 |
| 55. | Milton | 85.0 | 30.0(+55.0)#55 | 32.0(+53.0)#2,375 |
| 56. | Ludowici | 80.0 | 30.0(+50.0)#56 | 32.0(+48.0)#2,563 |
| 57. | Riverdale | 79.0 | 30.0(+49.0)#57 | 32.0(+47.0)#2,586 |
| 58. | Mcdonough | 78.0 | 30.0(+48.0)#58 | 32.0(+46.0)#2,614 |
| 59. | Union City | 77.0 | 30.0(+47.0)#59 | 32.0(+45.0)#2,655 |
| 60. | Sale City | 77.0 | 30.0(+47.0)#60 | 32.0(+45.0)#2,691 |
| 61. | Plainville | 77.0 | 30.0(+47.0)#61 | 32.0(+45.0)#2,695 |
| 62. | Clarkston | 76.0 | 30.0(+46.0)#62 | 32.0(+44.0)#2,711 |
| 63. | Country Club Estates | 75.0 | 30.0(+45.0)#63 | 32.0(+43.0)#2,759 |
| 64. | Lake City | 74.0 | 30.0(+44.0)#64 | 32.0(+42.0)#2,813 |
| 65. | Trion | 73.0 | 30.0(+43.0)#65 | 32.0(+41.0)#2,881 |
| 66. | Resaca | 72.0 | 30.0(+42.0)#66 | 32.0(+40.0)#2,929 |
| 67. | Reidsville | 71.0 | 30.0(+41.0)#67 | 32.0(+39.0)#2,966 |
| 68. | Bemiss | 70.0 | 30.0(+40.0)#68 | 32.0(+38.0)#3,017 |
| 69. | Wilmington Island | 69.0 | 30.0(+39.0)#69 | 32.0(+37.0)#3,050 |
| 70. | North Decatur | 67.0 | 30.0(+37.0)#70 | 32.0(+35.0)#3,145 |
| 71. | Waynesboro | 66.0 | 30.0(+36.0)#71 | 32.0(+34.0)#3,225 |
| 72. | Covington | 64.0 | 30.0(+34.0)#72 | 32.0(+32.0)#3,330 |
| 73. | Tifton | 61.0 | 30.0(+31.0)#73 | 32.0(+29.0)#3,512 |
| 74. | Acworth | 60.0 | 30.0(+30.0)#74 | 32.0(+28.0)#3,586 |
| 75. | Hapeville | 60.0 | 30.0(+30.0)#75 | 32.0(+28.0)#3,608 |
| 76. | Walnut Grove | 60.0 | 30.0(+30.0)#76 | 32.0(+28.0)#3,631 |
| 77. | Martin | 59.0 | 30.0(+29.0)#77 | 32.0(+27.0)#3,715 |
| 78. | Woodstock | 58.0 | 30.0(+28.0)#78 | 32.0(+26.0)#3,732 |
| 79. | Gray | 56.0 | 30.0(+26.0)#79 | 32.0(+24.0)#3,890 |
| 80. | Doerun | 56.0 | 30.0(+26.0)#80 | 32.0(+24.0)#3,913 |
| 81. | Suwanee | 55.0 | 30.0(+25.0)#81 | 32.0(+23.0)#3,954 |
| 82. | Blakely | 55.0 | 30.0(+25.0)#82 | 32.0(+23.0)#3,980 |
| 83. | Homer | 55.0 | 30.0(+25.0)#83 | 32.0(+23.0)#3,999 |
| 84. | Buford | 54.0 | 30.0(+24.0)#84 | 32.0(+22.0)#4,033 |
| 85. | Ephesus | 54.0 | 30.0(+24.0)#85 | 32.0(+22.0)#4,104 |
| 86. | Ochlocknee | 53.0 | 30.0(+23.0)#86 | 32.0(+21.0)#4,209 |
| 87. | Garden City | 52.0 | 30.0(+22.0)#87 | 32.0(+20.0)#4,262 |
| 88. | Fairfield Plantation | 52.0 | 30.0(+22.0)#88 | 32.0(+20.0)#4,272 |
| 89. | Putney | 52.0 | 30.0(+22.0)#89 | 32.0(+20.0)#4,285 |
| 90. | Rome | 50.0 | 30.0(+20.0)#90 | 32.0(+18.0)#4,415 |
| 91. | Lilburn | 50.0 | 30.0(+20.0)#91 | 32.0(+18.0)#4,438 |
| 92. | Bogart | 50.0 | 30.0(+20.0)#92 | 32.0(+18.0)#4,483 |
| 93. | Woodbury | 50.0 | 30.0(+20.0)#93 | 32.0(+18.0)#4,487 |
| 94. | Fayetteville | 49.0 | 30.0(+19.0)#94 | 32.0(+17.0)#4,523 |
| 95. | Lakeview | 49.0 | 30.0(+19.0)#95 | 32.0(+17.0)#4,555 |
| 96. | Lawrenceville | 47.0 | 30.0(+17.0)#96 | 32.0(+15.0)#4,741 |
| 97. | Cartersville | 47.0 | 30.0(+17.0)#97 | 32.0(+15.0)#4,746 |
| 98. | Fort Oglethorpe | 47.0 | 30.0(+17.0)#98 | 32.0(+15.0)#4,762 |
| 99. | Thomaston | 47.0 | 30.0(+17.0)#99 | 32.0(+15.0)#4,764 |
| 100. | Druid Hills | 47.0 | 30.0(+17.0)#100 | 32.0(+15.0)#4,767 |
Common Questions
What are the Top 10 Cities with the Most Births per 1,000 Women Over the Age of 35 in Georgia?
Top 10 Cities with the Most Births per 1,000 Women Over the Age of 35 in Georgia are:
#1
500.0
#2
393.0
#3
370.0
#4
362.0
#5
333.0
#6
280.0
#7
278.0
#8
261.0
#9
261.0
#10
250.0
What city has the Most Births per 1,000 Women Over the Age of 35 in Georgia?
Tallulah Falls has the Most Births per 1,000 Women Over the Age of 35 in Georgia with 500.0.
What is the Number of Births per 1,000 Women Over the Age of 35 in the State of Georgia?
Number of Births per 1,000 Women Over the Age of 35 in Georgia is 30.0.
What is the Number of Births per 1,000 Women Over the Age of 35 in the United States?
Number of Births per 1,000 Women Over the Age of 35 in the United States is 32.0.